1. Introduction
Hydropower is recognized as an environmentally friendly, renewable, and green energy source. It has experienced great development in recent years [
1,
2]. Hydropower stations often undertake the burden of frequency regulation and power regulation in a power system [
3]. The stable operation of hydropower units is essential to the power system. However, stable operation and good regulation performance have become challenges for hydropower stations with a long-distance headrace tunnel and high water head [
4]. Faults occur at a higher frequency when the multi-turbine hydraulic coupled division system with a common penstock is adopted [
5].
The long-distance headrace tunnel has been adopted widely to obtain a high working water head in hydropower stations [
6]. However, it also leads to an extremely large flow inertia in the tunnel [
4]. In addition, the water hammer, a kind of typical pressure fluctuation phenomenon, has become more serious than before. The water hammer often occurs in the transition process and leads to the deterioration of the regulating quality of the units [
7]. The pressure fluctuation phenomenon results in input power fluctuations in the hydro turbine, which finally leads to fluctuations in the unit’s output power [
8]. The most commonly used pressure reduction facility for hydropower stations is the surge tank [
9]. However, it only reduces the pressure fluctuations rather than eliminating the fluctuation. Water level oscillations in the surge tank also lead to power oscillations [
10,
11].
To limit the engineering costs or geological conditions, division systems with a common penstock are widely used in hydropower stations with a long-distance headrace tunnel and pumped-storage power stations [
6,
12]. This kind of diversion system is composed of a common penstock and several bifurcated pipes. The hydraulic coupling effect of multiple units is a new challenge which only occurs in multi-turbine division system [
13]. The hydraulic coupling effect leads to inherence between the hydro turbines which share the common upstream penstock. When the regulation system of one unit moves, a pressure wave is generated in the common penstock and then spreads to the branch pipes through bifurcation or trifurcation. The disturbance is transferred to the neighboring hydro turbines and destroys the stable operation of other units [
13]. The hydraulic coupled transient process is a complex and nonlinear process. High-precision modeling is required to describe the dynamic characteristics of the hydraulic coupled system [
14,
15]. Several new modeling methods, such as Hamiltonian modeling, have received much interest in recent studies [
16,
17]. The hydraulic coupling effect makes it necessary to regard the units as a whole in the regulation of any single unit [
18]. The improvement of control is desperately needed to ensure the stability of the units within a hydraulic coupled division system. There has been some research on the control methods of multi-turbines to restrain the negative effects of the hydraulic coupling phenomenon [
13]. The above-mentioned research has had little focus on the flow of the hydraulic coupled division system in a hydropower station.
As the essential part of the hydraulic coupled division system, the structure of bifurcation or trifurcation has a great influence on the stability of the flow pattern in a division system. While previous studies often focused on the hydraulic loss in bifurcation or trifurcation [
12], there have been few studies on the impact of the structure of the bifurcation or trifurcation on the dynamic stability of the flow pattern in a pipe system.
This paper is focused on the power fluctuations in the P Hydropower Station, which has applied the multi-turbine hydraulic coupled division system. Fluctuations are induced by defects in the structure of the trifurcation. Several measures of increasing the inlet diameter, modifying the trifurcation, and decreasing the velocity are proposed to improve the flow pattern in the trifurcation and are proved to be effective. Some rules are summarized from the case study and are able to play roles in the design of trifurcation in the division system.
The paper is composed of six sections. In
Section 2, a mathematical analysis is conducted to analyze the reason for power fluctuations. In
Section 3, the results of the flow calculation prove that the vortex in trifurcation leads to pressure fluctuations. Three cases based on three improving measures are studied in
Section 4. In
Section 5, after practical modification, the field data are given, and some guidelines are summarized.
Section 6 outlines the conclusions of this study.
2. Analysis of the Power Fluctuations
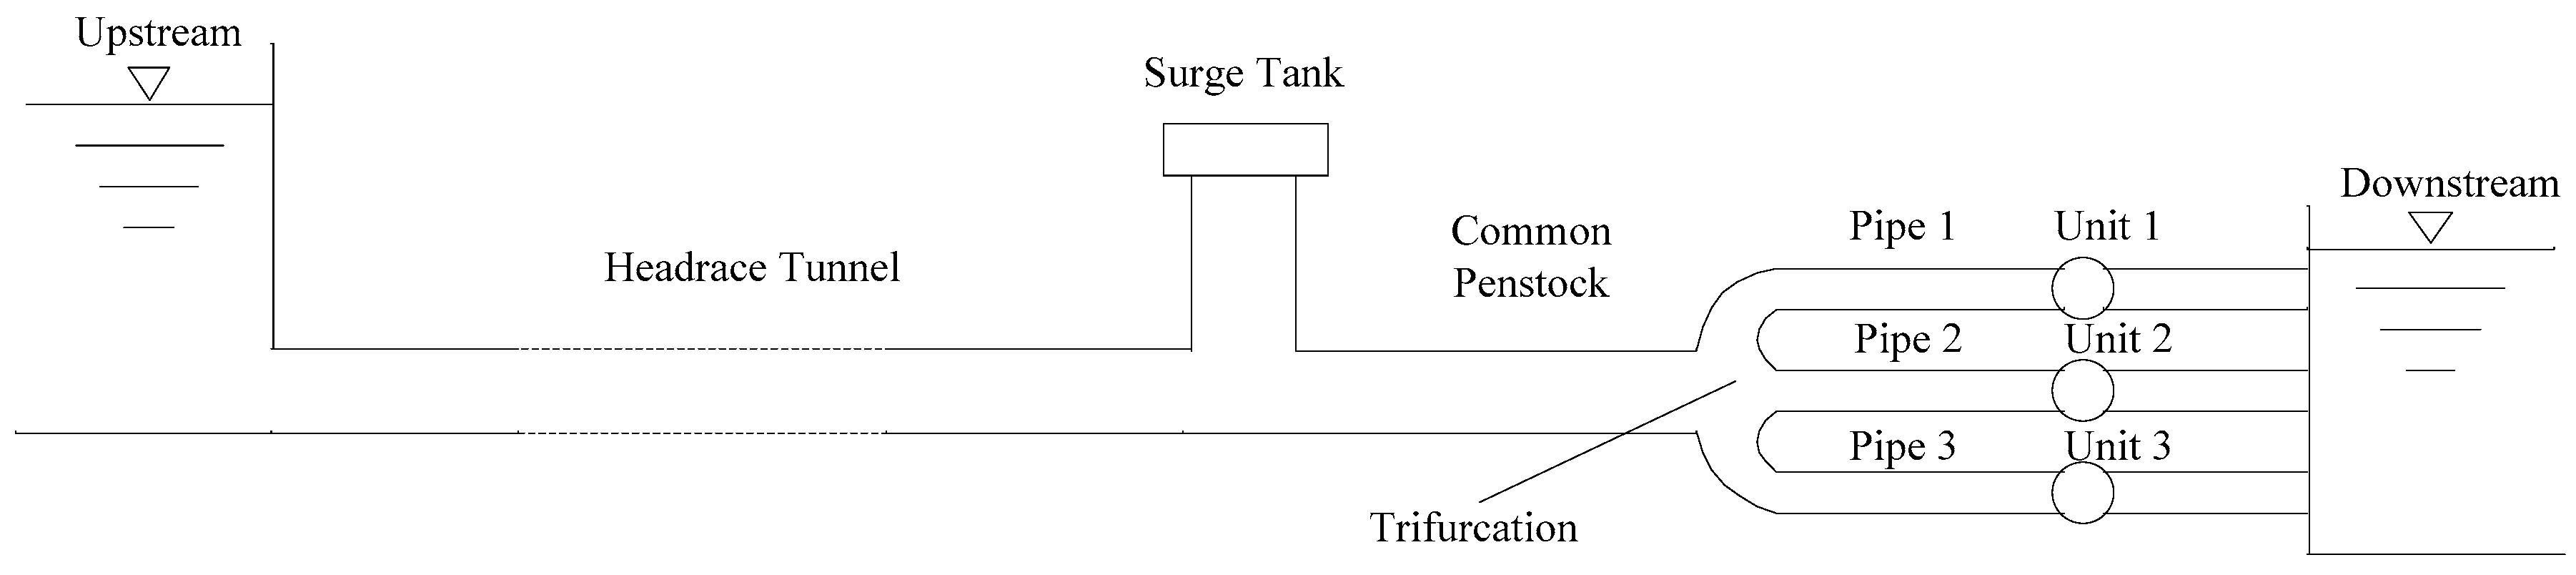
The P Hydropower Station is located in Pakistan and is composed of three similar Francis hydro turbine units. The rated power of the hydropower units is 51 MW, and the rated head is 107.3 m. The hydropower station adopts the multi-turbine division system with a common penstock. The general layout of the station is shown in
Figure 1. A long and straight headrace tunnel and a surge tank are adopted to obtain high water head. The common penstock downstream the surge tank is shared by three units and divides into three branches of the same diameter through the trifurcation. Units 1 and 3 are on the two sides, and unit 2 is in the middle.
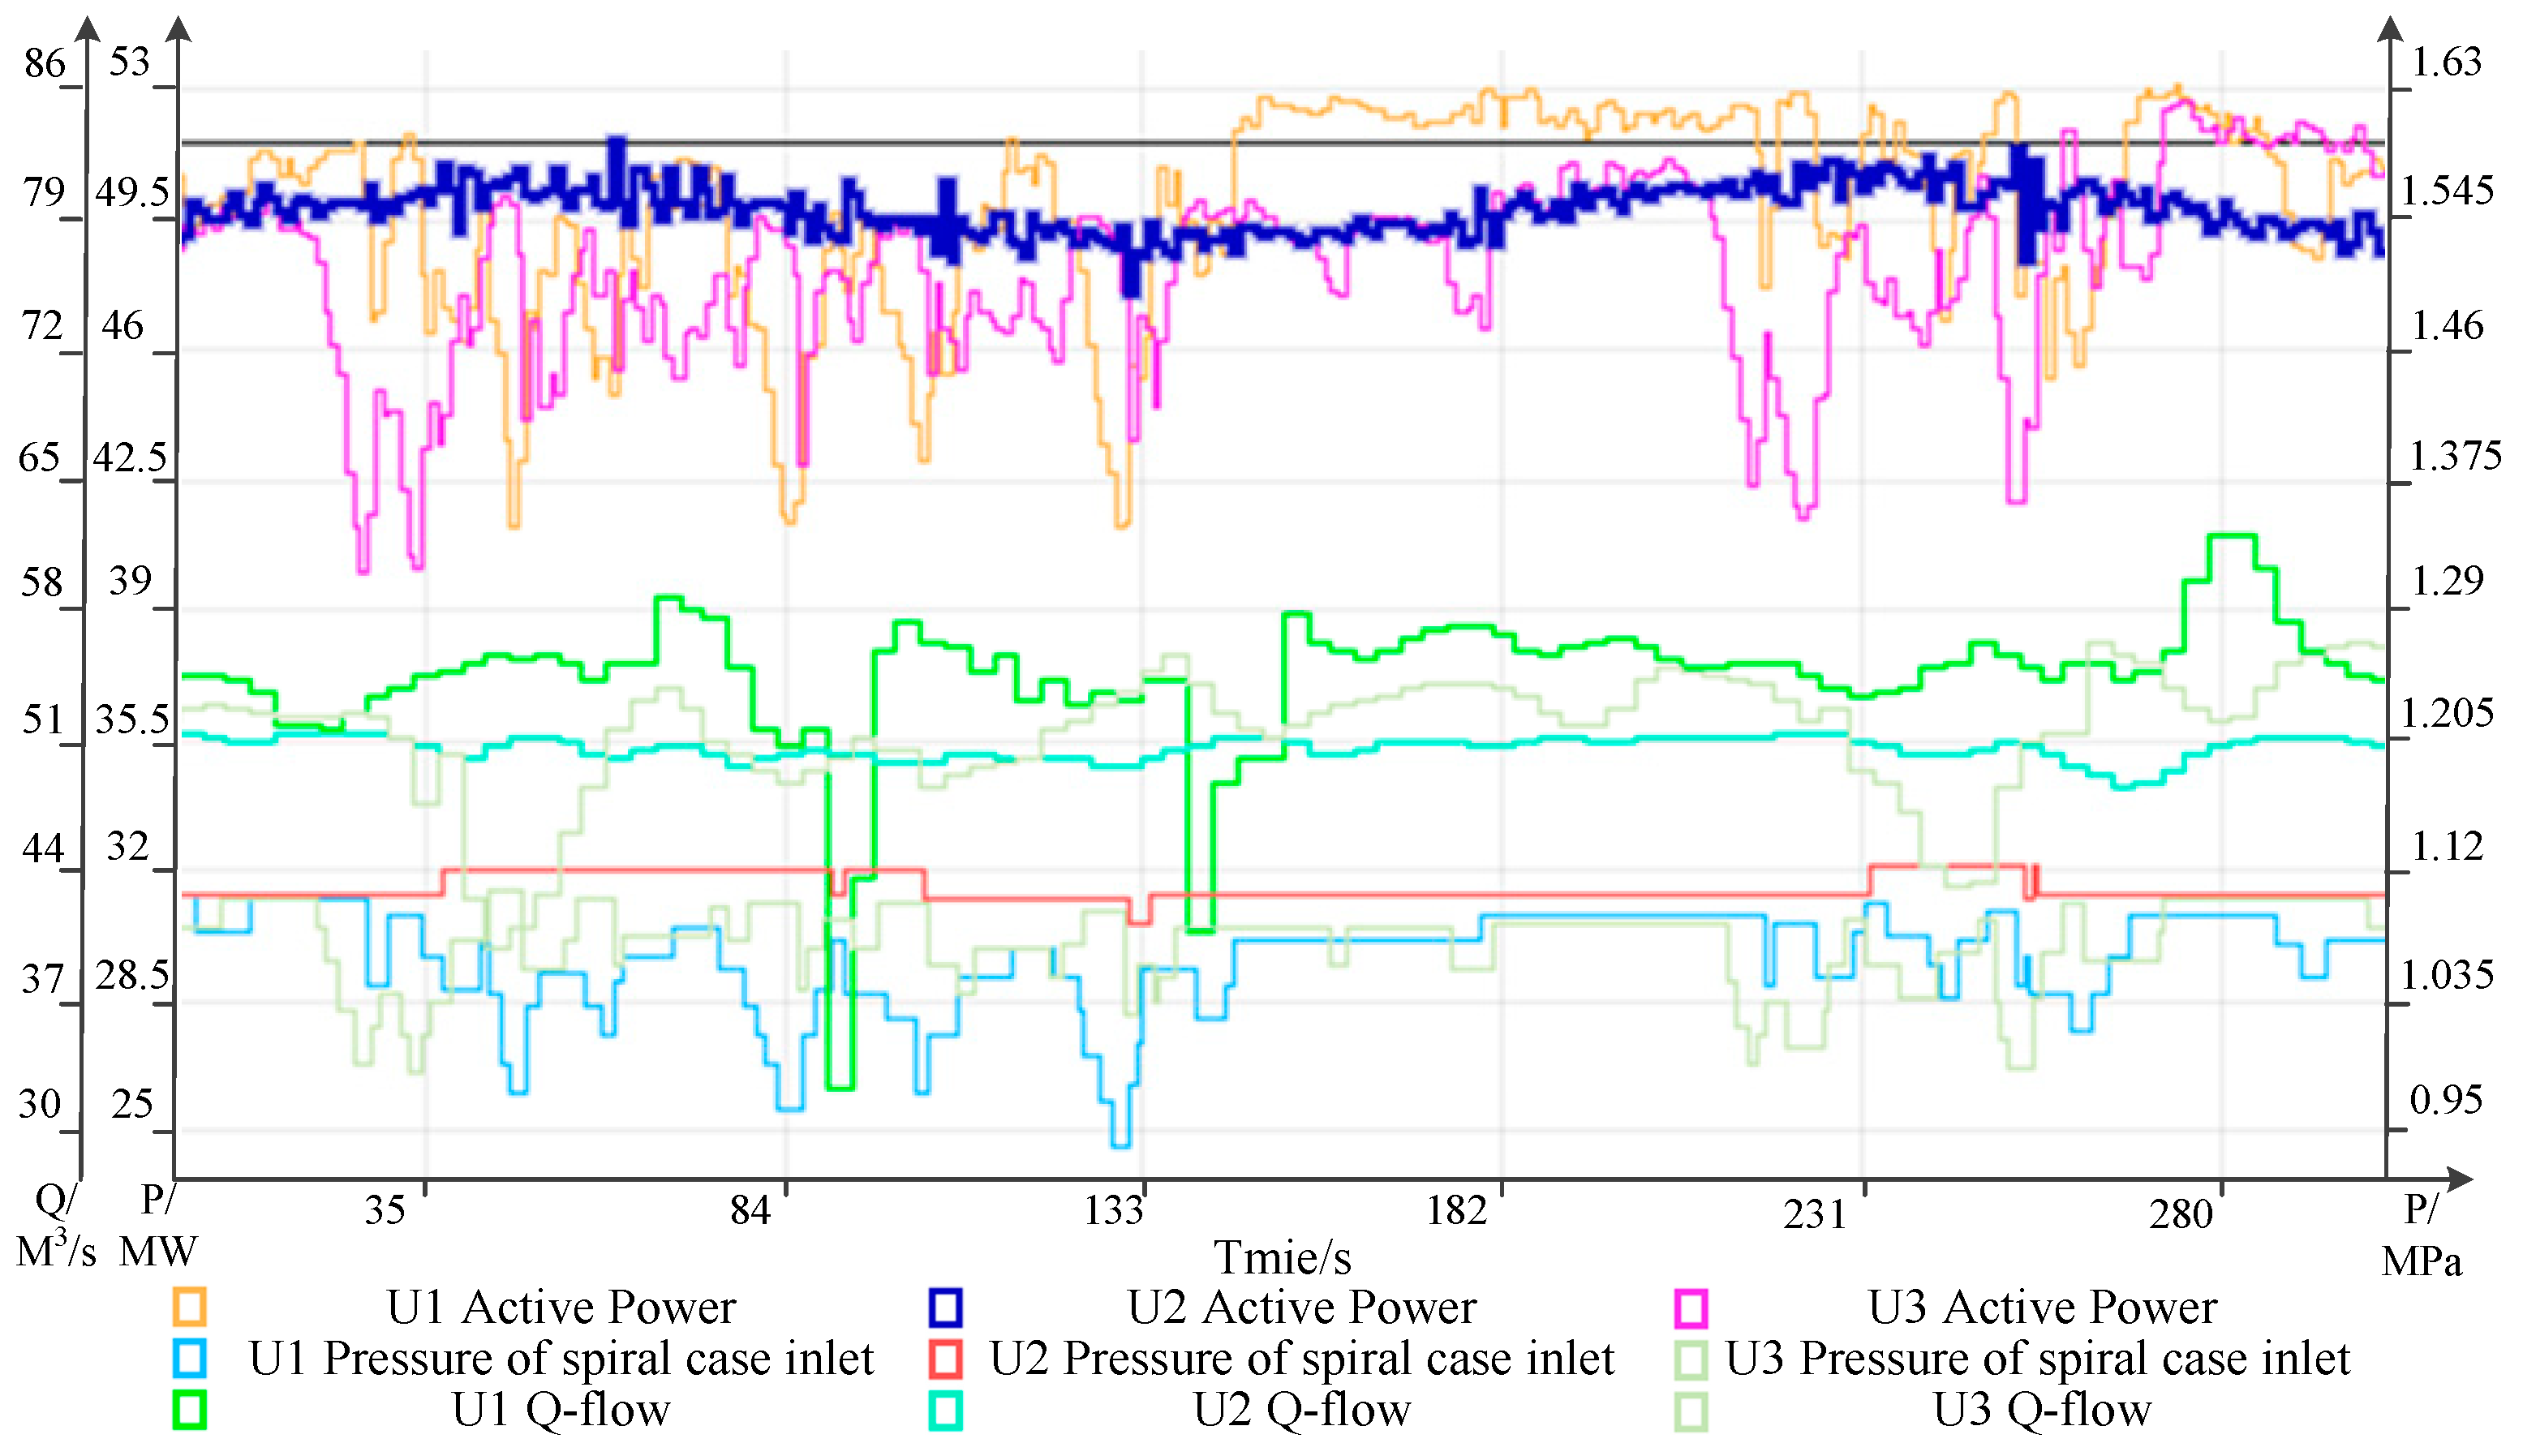
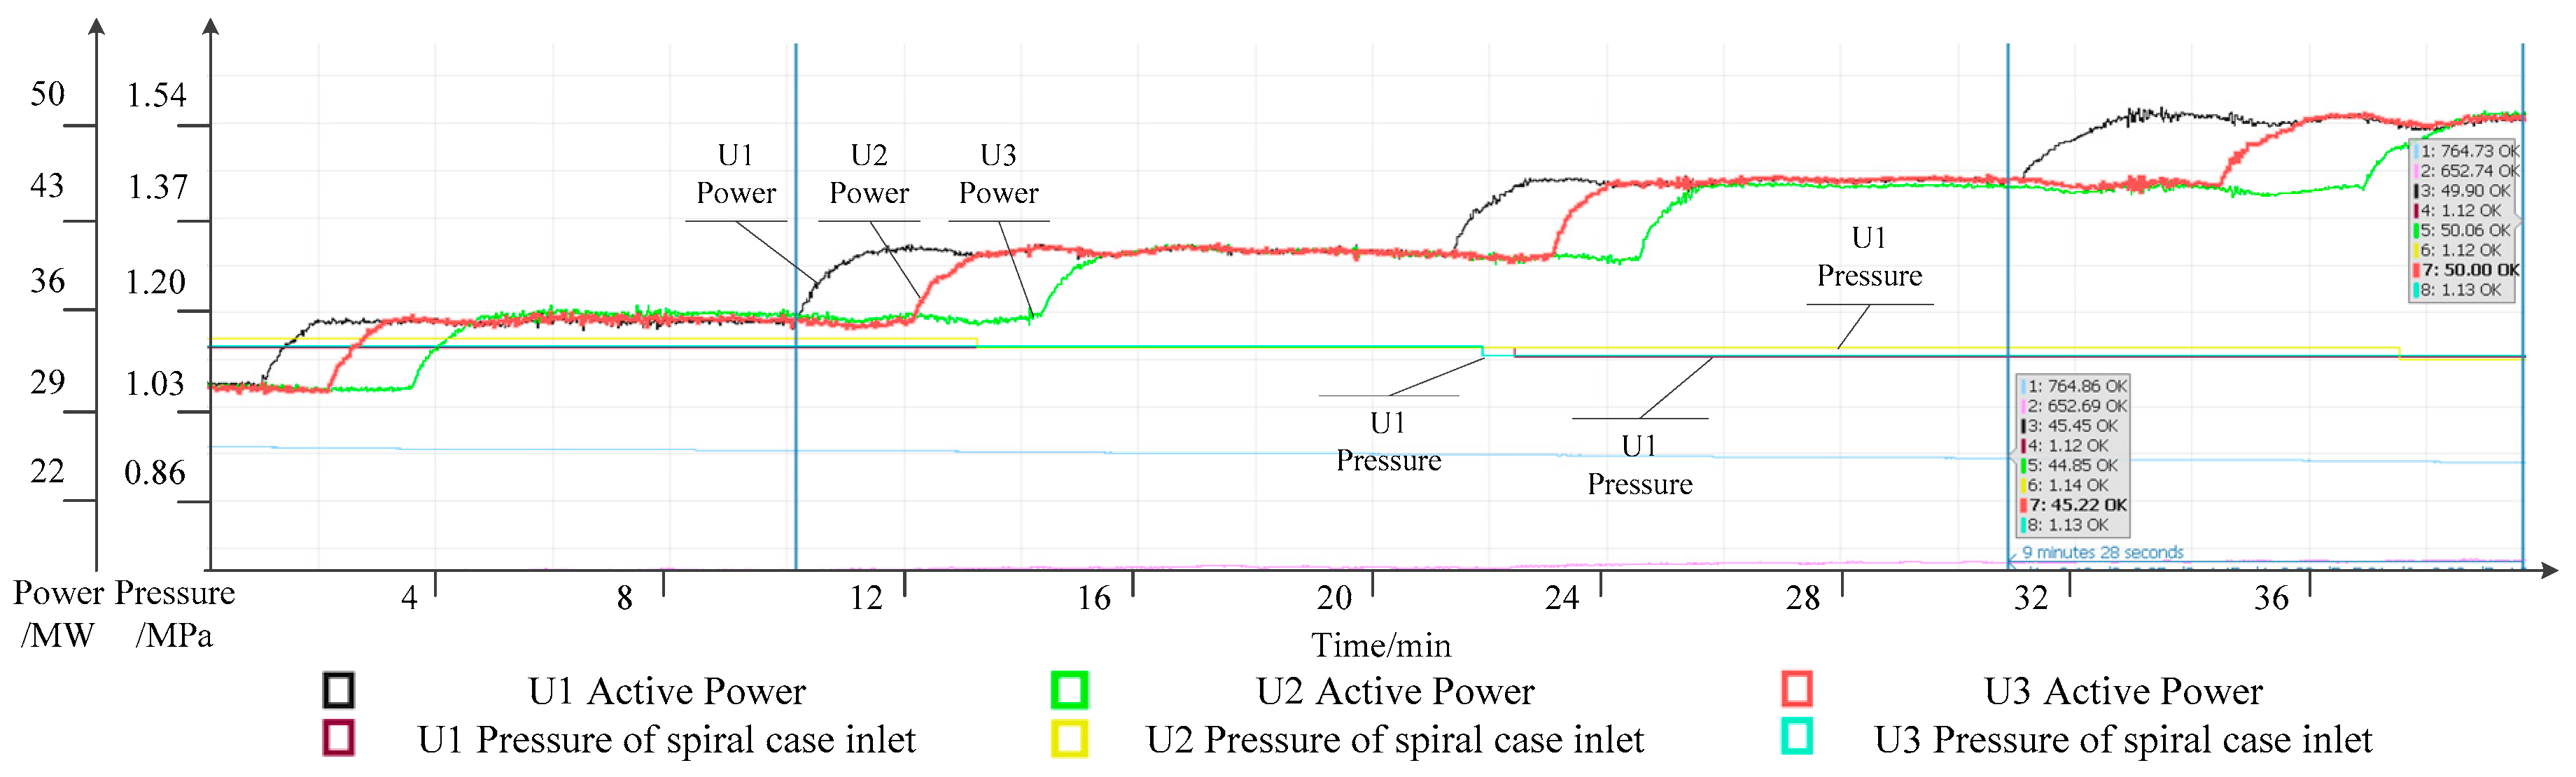
In the first operation of the station, obvious output power fluctuations were observed in units 1 and 3. A typical sample of the field data recorded under the designed conditions is shown in
Figure 2 and
Table 1. The data were selected randomly from the recorded data with serious fluctuations.
Power fluctuations exist under many conditions. The data presented in
Figure 2 were recorded under the designed conditions. Under these conditions, the water head and guide vane opening were kept at the rated values. The regulation system did not move when power fluctuations occurred. Thus, some usual reasons for power fluctuations, such as the water hammer caused by guide vane regulation, can be eliminated. The power fluctuations are more likely to be due to inherent faults of the unit.
As shown in
Figure 2, the power fluctuations in unit 1 and unit 3 were serious and showed no periodicity. The pressure of the spiral case and Q-flow also fluctuated with no periodicity, while the power output, the pressure of spiral case and the flow rate of unit 2 remained almost stable.
The electric and machinery facilities of the three units were the same. The difference between the three units was the division system. In the division system, the inlets of unit 1 and unit 3 were the same, and they were different from the inlet of unit 2. In outlet 1 and 3, the flow pattern was the same and was different from that in outlet 2. The hydraulic factors are regarded as the main reason for this. The irregular fluctuations of the pressure and flow indicated an unstable flow pattern in the conduit penstock. To study the connection between output power and pressure fluctuations, the monitored data were mathematically analyzed.
According to the law of energy conservation, the power output can be written as
where
P is the output power of the turbine,
Q is the flow rate,
H is the water head,
η is the efficiency, and
g is the gravitational acceleration.
It is well known that the measured data of
Q is not accurate when the flow is unsteady due to the drawbacks of the measurement technology. The data of
Q were not available for mathematical analysis. To get the value of output power,
Q was replaced by the unit flow
Q11 which can be obtained from the characteristic curve, according to similarity principle.
Q11 can be described as
where
Dr is the diameter of the runner.
Then, Equation (1) can be written as
To obtain
Q11 and
η, the comprehensive characteristic curve should be provided. Knowing the values of the guide vane opening
α and
n11, the operating point can be found in the comprehensive characteristic curve. Then, the corresponding value of η and
Q11 can be obtained. The unit rotor speed
n11 can be obtained by
where
n is the rotor speed.
For example, the guide vane opening
α of unit 1 is 19.3 mm, and the maximum value of
n11, which is 70.96 r/min, can be calculated by Equation (4). With the values of
α and
n11 known, the values of
Q11 and
η, which are 820 L/s and 93.3%, can be obtained using the comprehensive characteristic curve chart. Then, a new value of
P can be obtained using Equation (3). In this way, the maximum value and minimum value of
P of the three units can be calculated. The data are shown in
Table 2.
The calculation results of the output power are similar to the measured data. The reasonable agreement suggests that the main reason for the power output fluctuations is the pressure fluctuations.
In the operating period, the water level in reservoir was unchanged and the regulation system did not move. The pressure fluctuations were induced by the unsteady flow pattern in the division system. Considering that the pressure in the spiral case of unit 2 is stable, the trifurcation is the source of the fluctuations. The surge tank was eliminated as a cause because it is shared by the three units. To clarify this hypothesis, a computational fluid dynamics (CFD) simulation calculation was undertaken to further study the flow pattern in the diversion system.
3. Modeling and Calculation of the Hydraulic Coupled Pipe System
3.1. The Model of the Pipe System
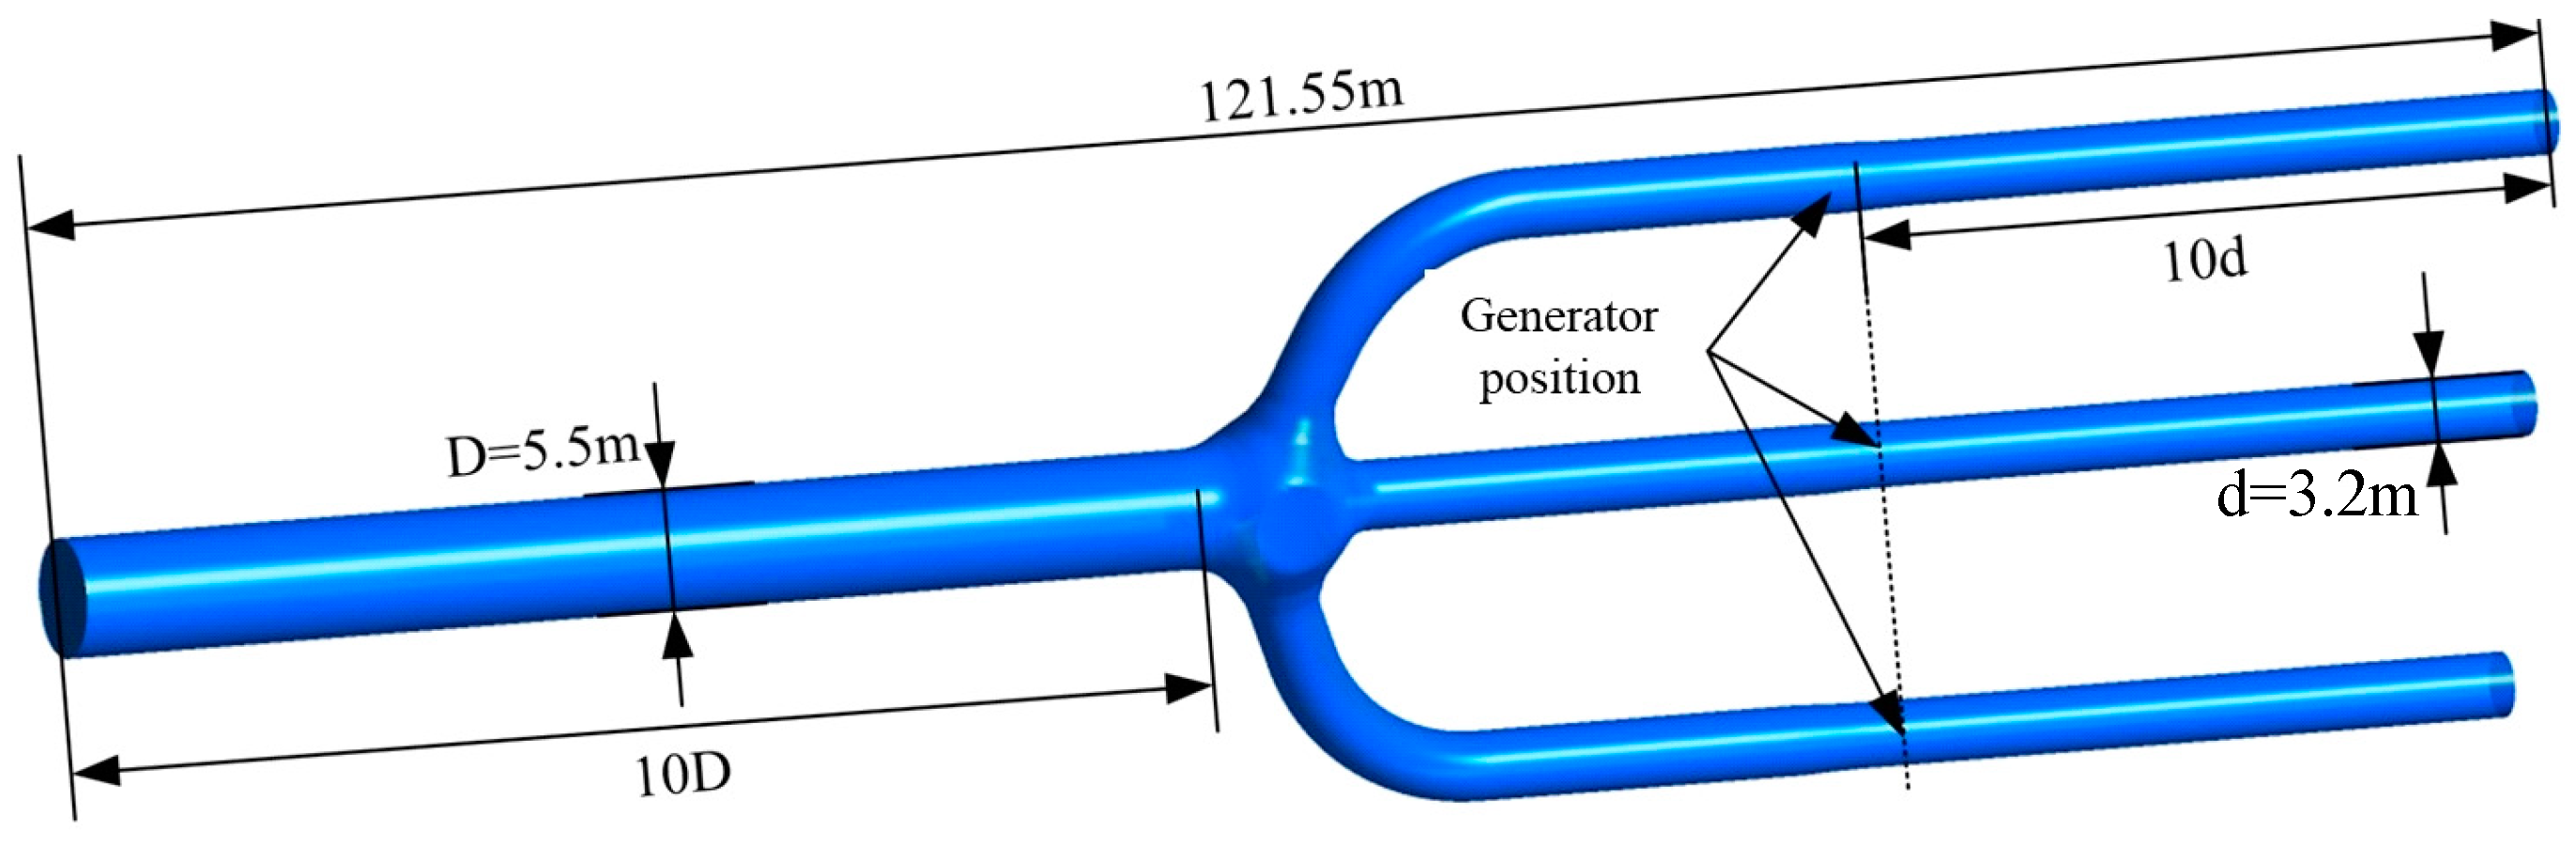
In order to verify the analysis in
Section 2, the flow pattern in the penstock was studied with CFD. The original model was a pipe system consisting of a trifurcation, an inlet pipe, and three outlet pipes, as shown in
Figure 3. There is no elbow part upstream from the common penstock so the flow in inlet is stable. The diameter of the inlet was 5.5 m and that of the outlet pipes was 3.2 m. The length of the inlet pipe in the computational domain was 10 times its diameter to eliminate the effects of the boundary conditions on the inner flow pattern. For the same reason, the outlet pipes also extended downstream to the generators. The length of the whole computational domain was 121.55 m. The lengths of the inlet and outlets were verified enough to eliminate the effects of the boundary condition according to the further expansion tests.
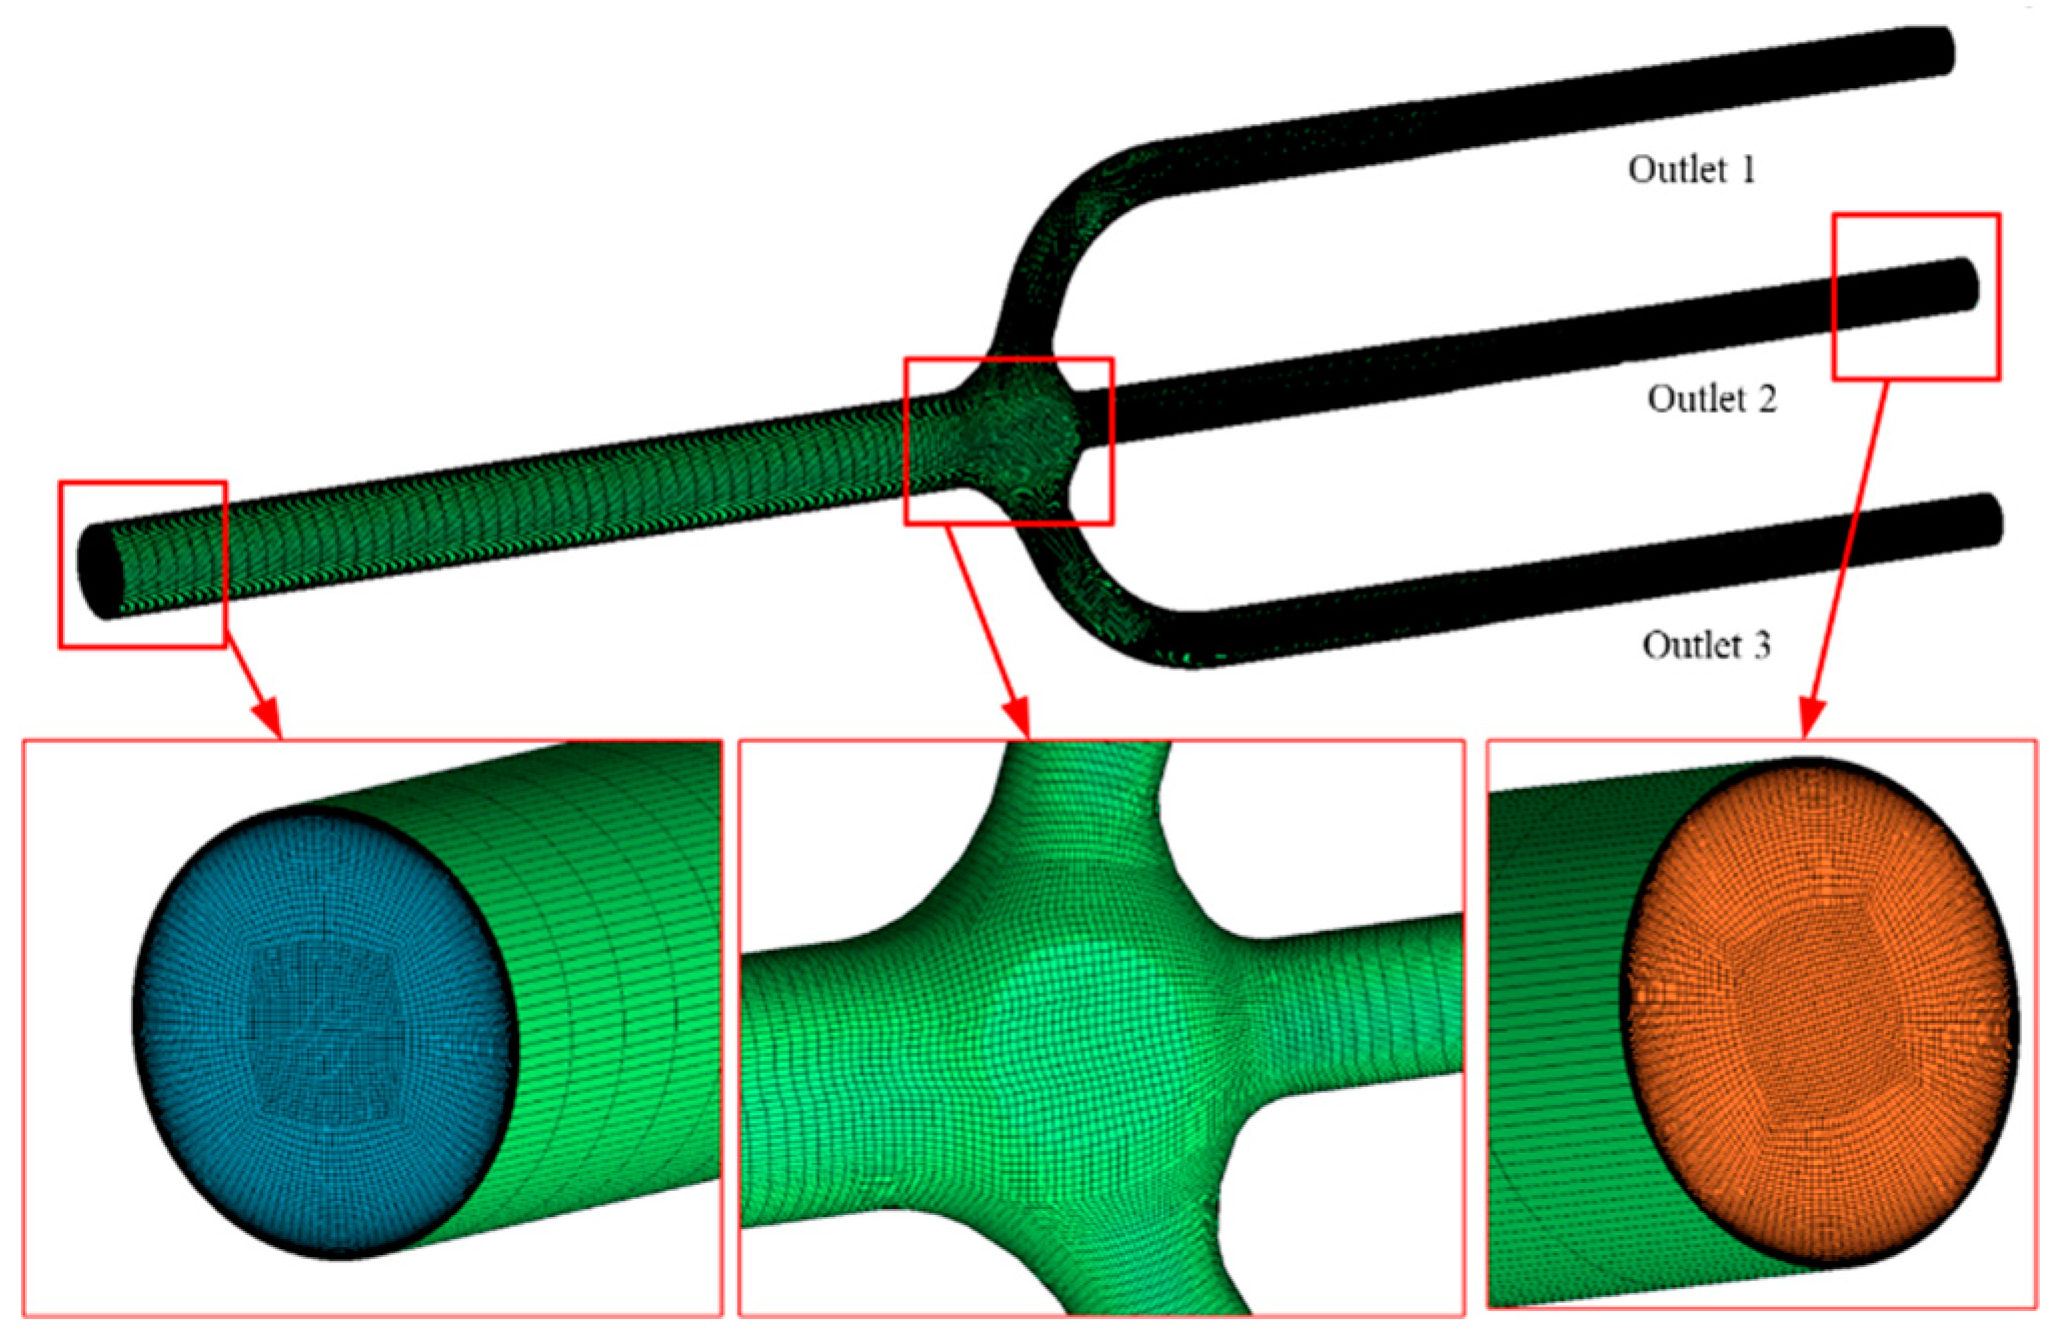
The grid generated for model is shown in
Figure 4, as an example. The meshes near the wall are refined to capture the influence of the boundary layer. Based on the results of the mesh independence tests, the total node number was determined to be about 3,000,000, which was sufficient for the simulations. The maximum y+ for the mesh was about 5, and for most of wall, y+ was less than 1.
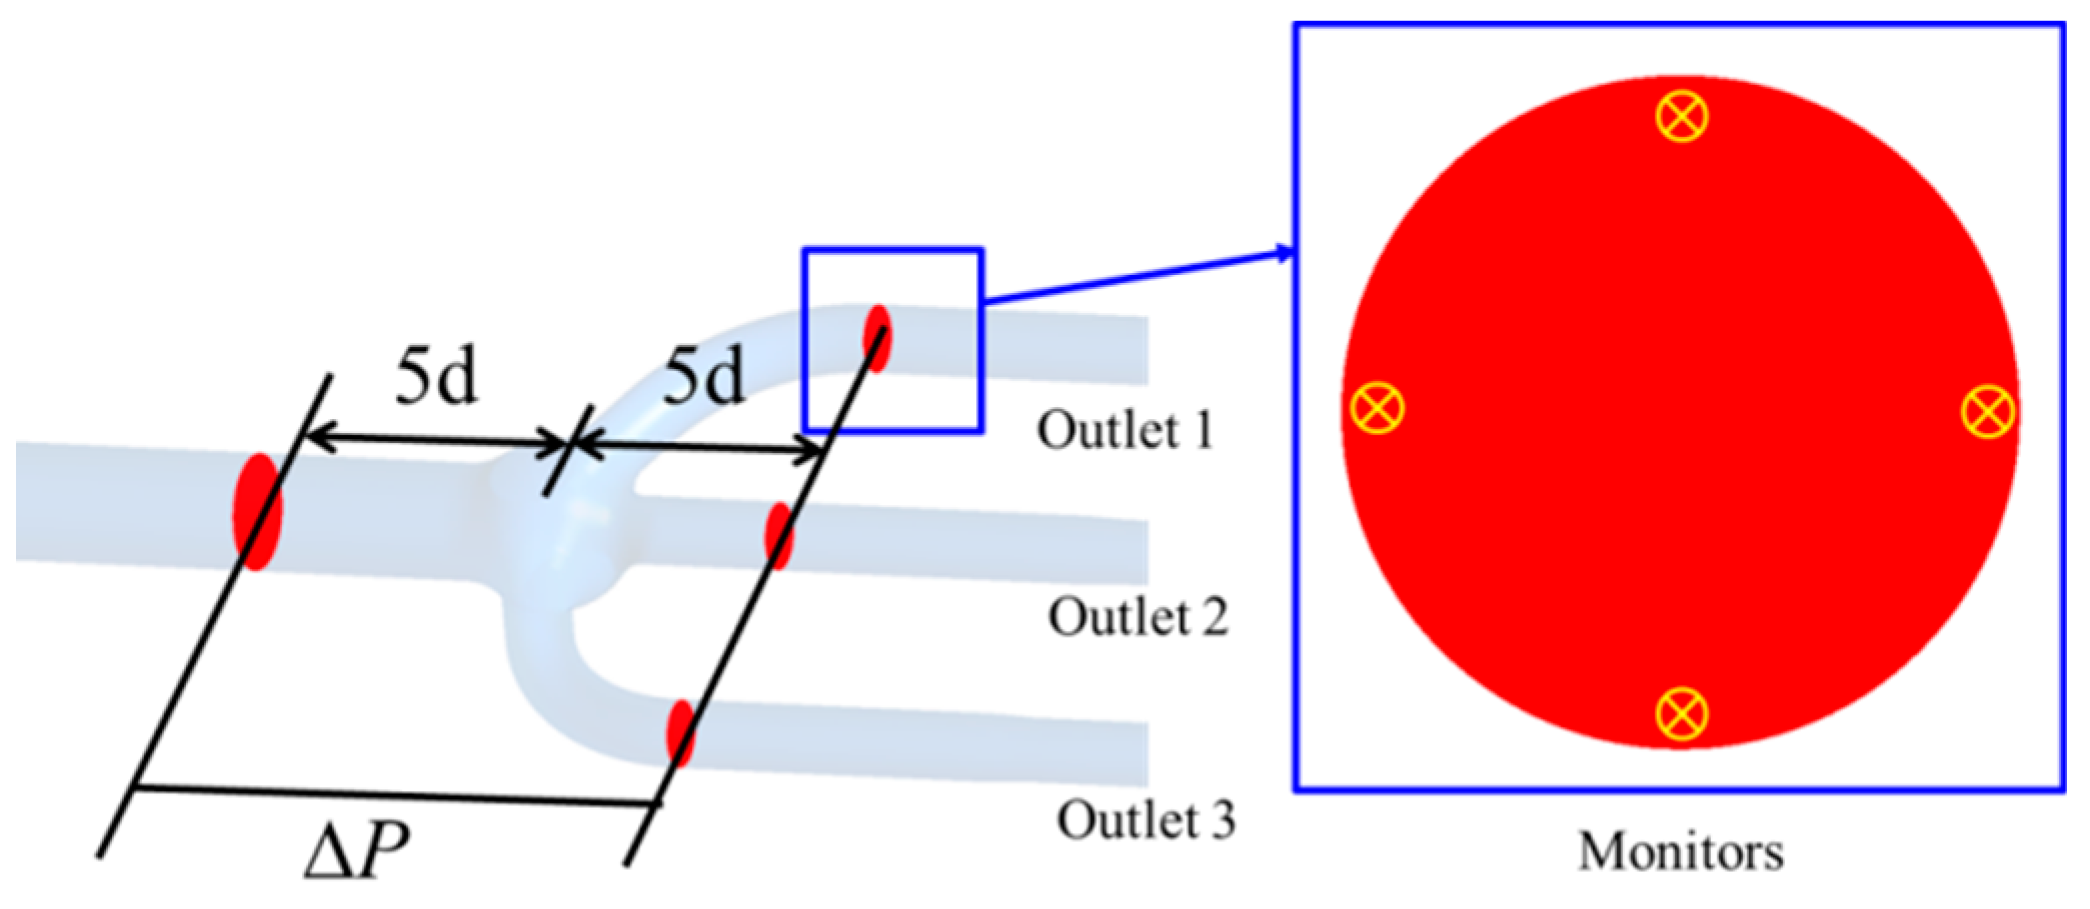
In this paper, the variations in the total pressure difference induced by the trifurcation were used to denote the pressure fluctuations in each case. As shown in
Figure 5, there was one cross section along the inlet pipe and three cross sections along the outlet pipes The distances between each cross section and the center of trifurcation in the stream direction were all 5 times the outlet pipe diameter. On each cross section, there were four total pressure monitors. The average value of the total pressure at four monitors was considered the local total pressure, namely
P0 (inlet),
P1 (outlet 1),
P2 (outlet 2), and
P3 (outlet 3), respectively. Then, the total pressure differences for outlet pipes were defined as
3.2. Governing Equations and the Large Eddy Simulation (LES) Approach
The Large Eddy Simulation (LES) was adopted in the simulation of the model with ANSYS Fluent as the solver. LES was firstly proposed by Smagorinsky in the simulation of atmospheric air currents [
19]. The ample range of the time and length scales is responsible for the huge computation cost in the numerically solving of the Navier–Stokes equations with Direct Numerical Simulation (DNS) [
20]. Based on this understanding, the main idea behind LES is to reduce the range of the time and length scales by a low-pass filtering of the Navier–Stokes equations with the reduction of the requirement in computational resources as the consequence. In LES, only large-scale turbulence is solved directly and the small scale one, which is filtered by the low-pass filter, is modeled by a sub-grid scale (SGS) model [
21]. The Wall-Adopting Large Eddy (WALE) model was adopted as the SGS model. Compared to the Smagorinsky–Lilly model, the WALE model performs better in reproducing the laminar to turbulence transition, since it follows the near-wall distance y3 law [
20,
22].
The basic governing equations consisting of the conservation of mass and momentum are as follows:
where
p is the pressure,
ui is the velocity component in direction i, and
ρm and
μm are the density and laminar viscosity, respectively.
One can obtain LES equations by applying a Favre-filtering operation to Equations (8) and (9):
where the over-bars denote the filtered quantities. The last term in Equation (11) is SGS stresses, which result from the filtering operation and are unknown and require modeling. They are defined as
To model the SGS stresses, the Boussinesq hypothesis is commonly used, as in the Reynolds-Averaged Navier–Stokes (RANS) models:
where
τkk is the isotropic part of the SGS stresses, and
μt is the SGS turbulence viscosity.
is the rate-of-strain tensor for the resolved scale, which is defined by
In the WALE model,
μt is modeled by
where
κ is the von Karman’s constant, d is the distance to the closest wall,
Cw is the WALE constant with a value of 0.325, and
V is the local cell volume.
3.3. Simulation Setup
In this paper, the full load operation conditions where the pressure fluctuations are the most obvious were simulated. The volumetric flow rates at the inlets and outlets are listed in
Table 3. The inlet was set as the velocity inlet. The velocity was calculated to be 6.465 m/s according to the corresponding volumetric flow rate. The nonslip wall was adopted for the pipe wall, and the time step size was 10
−3 s. The gravity effect was neglected in the simulation.
Another key point of the simulation calculation was how to deal with the hydro turbine. In a hydraulic system, the turbine can be regarded as a porous medium which provides a large hydraulic loss. Porous media are modeled by the addition of a momentum source term to the standard fluid flow equations. The momentum term is described as
where the
Si is the source term;
vi is the velocity;
α and
C are the described matrices.
By setting the resistance coefficients (α and C), the pressure drop is determined.
To simulate the behavior of the hydro turbine, a porous medium was applied in the generator position in order to keep the discharge and damping of three outlets in the same range.
The unsteady LES simulations were initialized from steady state results with the k-ω shear-stress transport (SST) turbulence model. Then, the unsteady LES solver was turned on for the unsteady flow simulations.
3.4. Simulation Results and Analysis
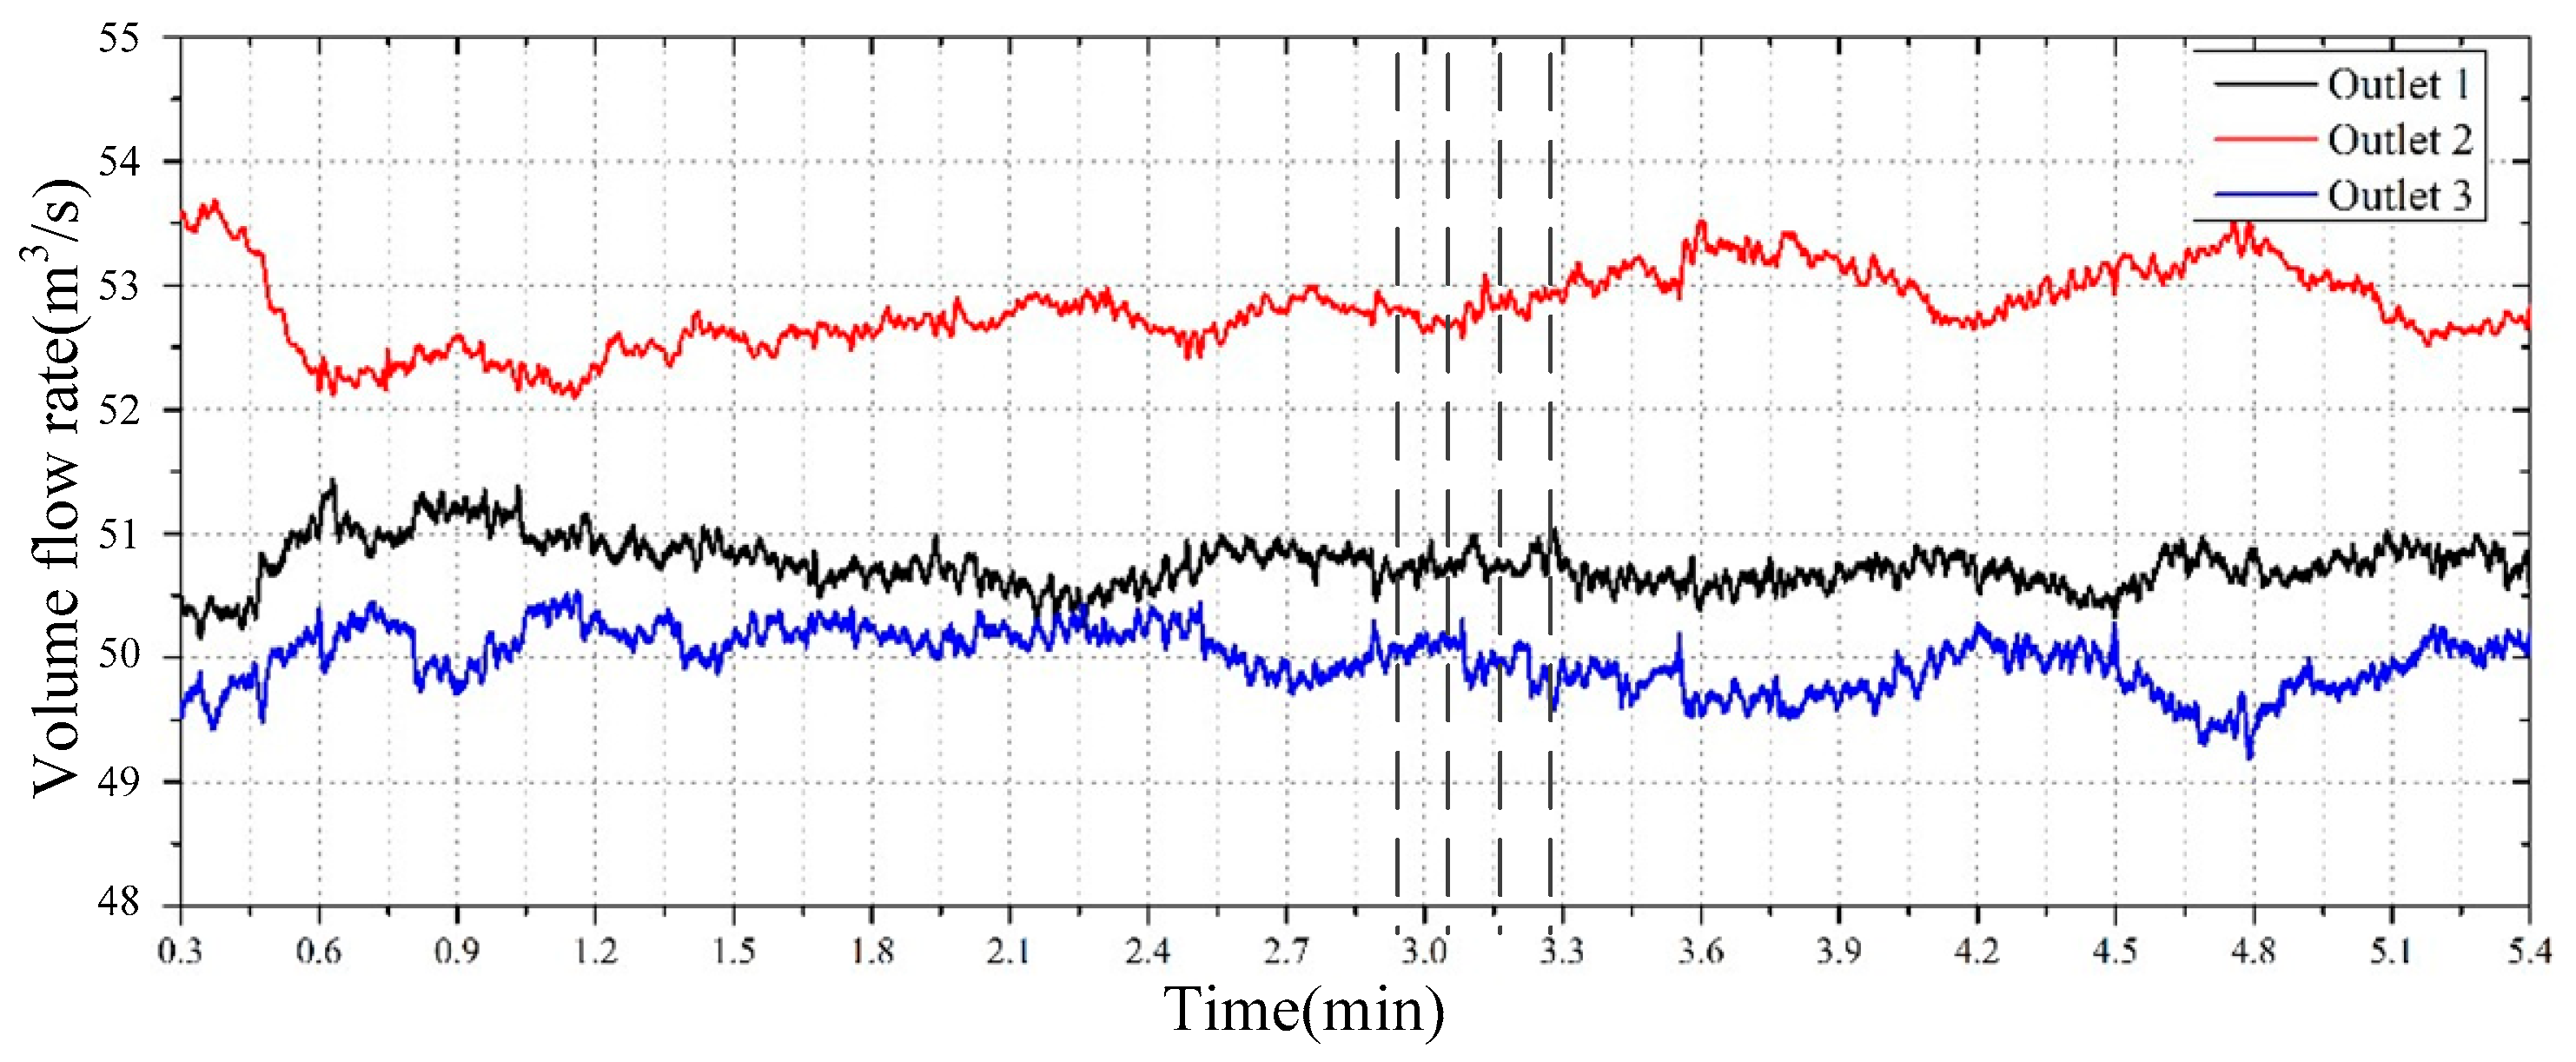
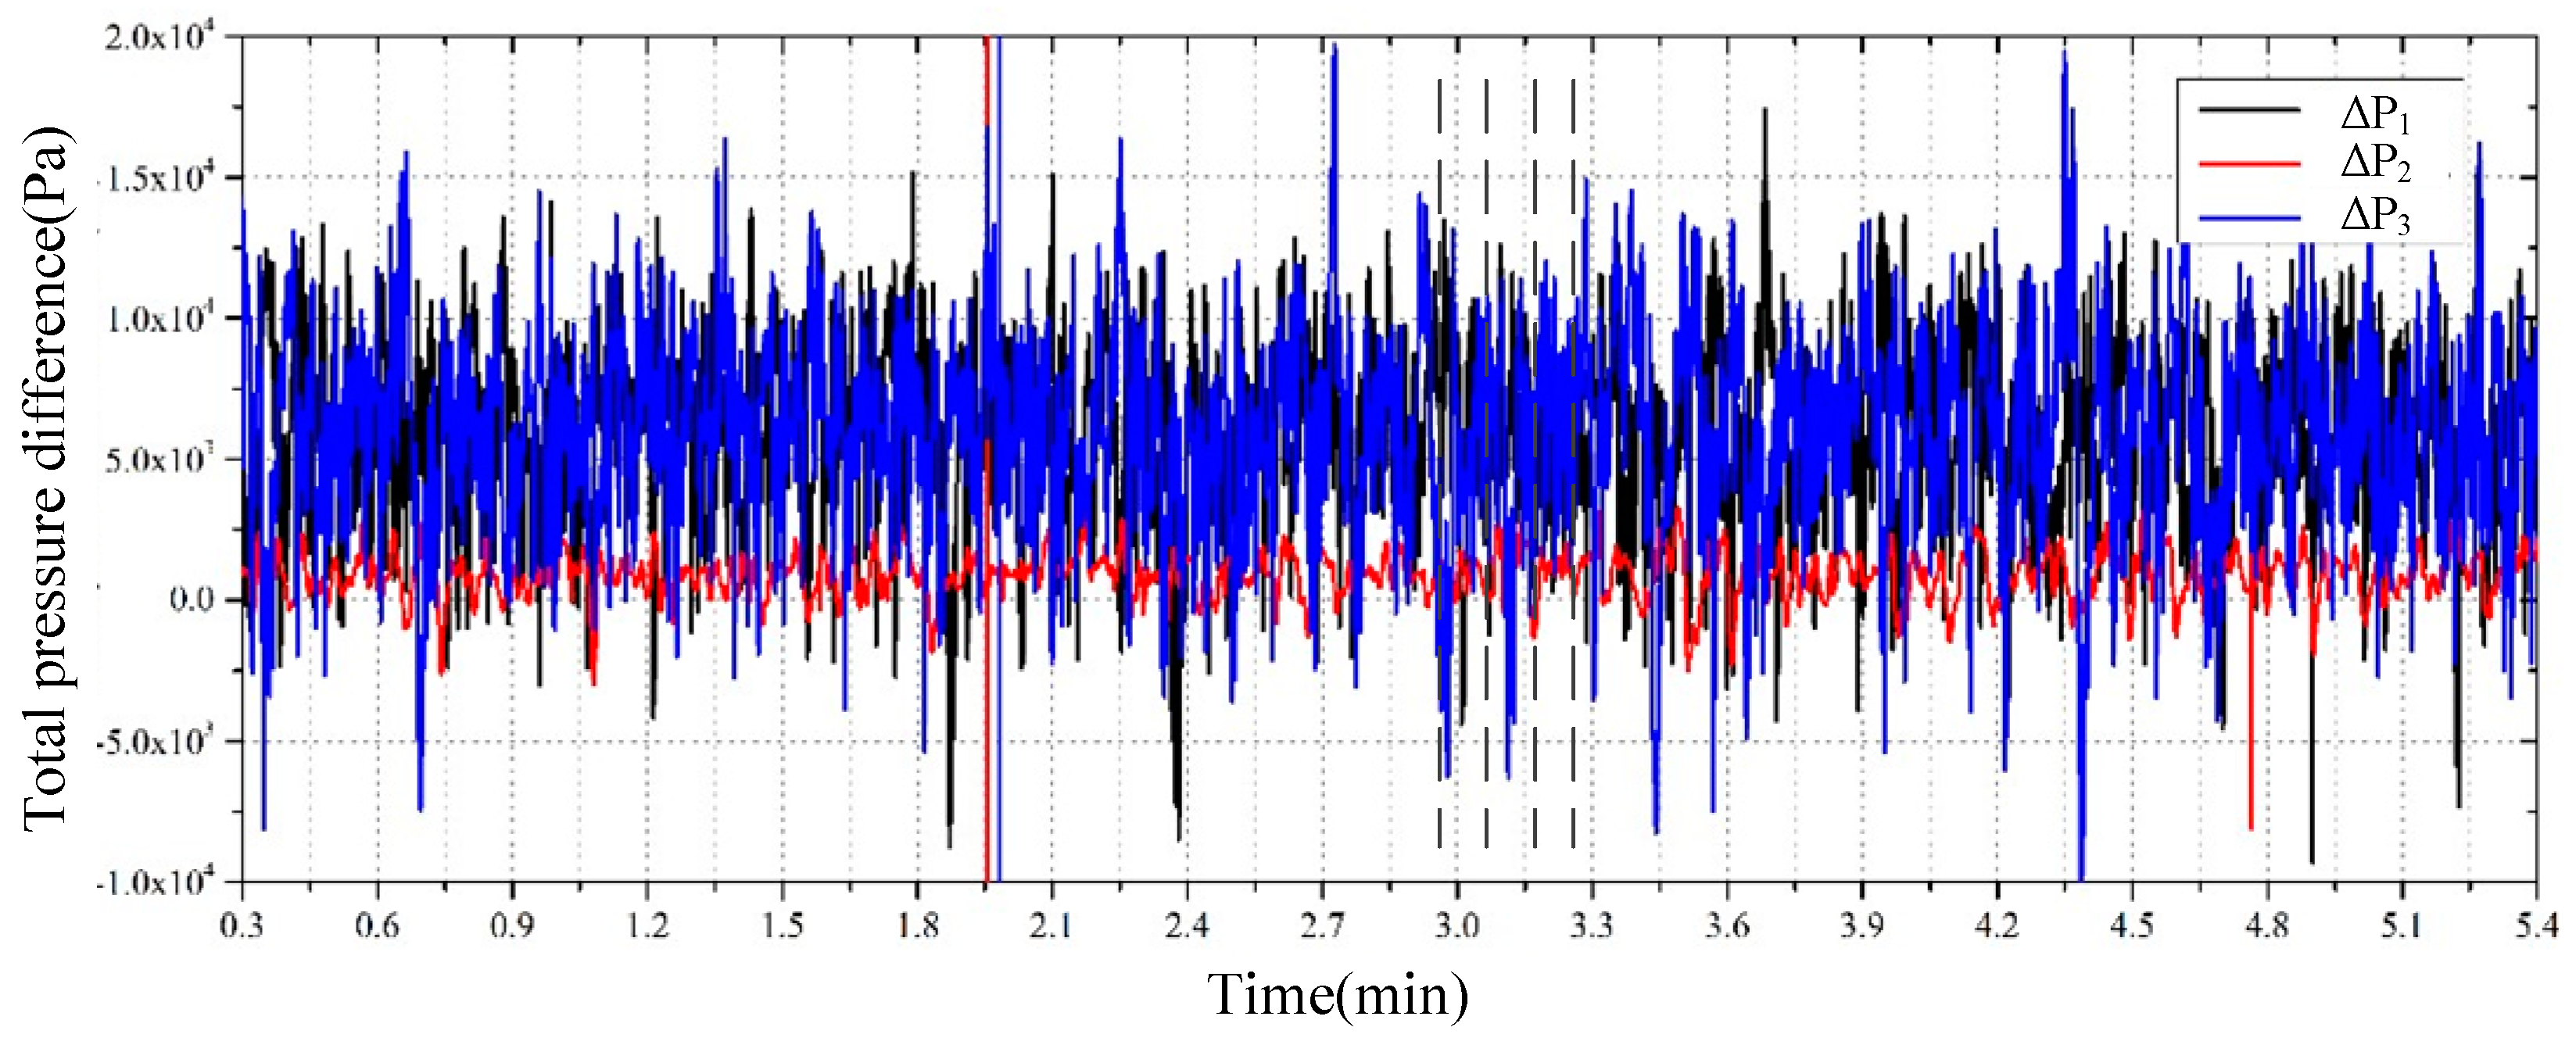
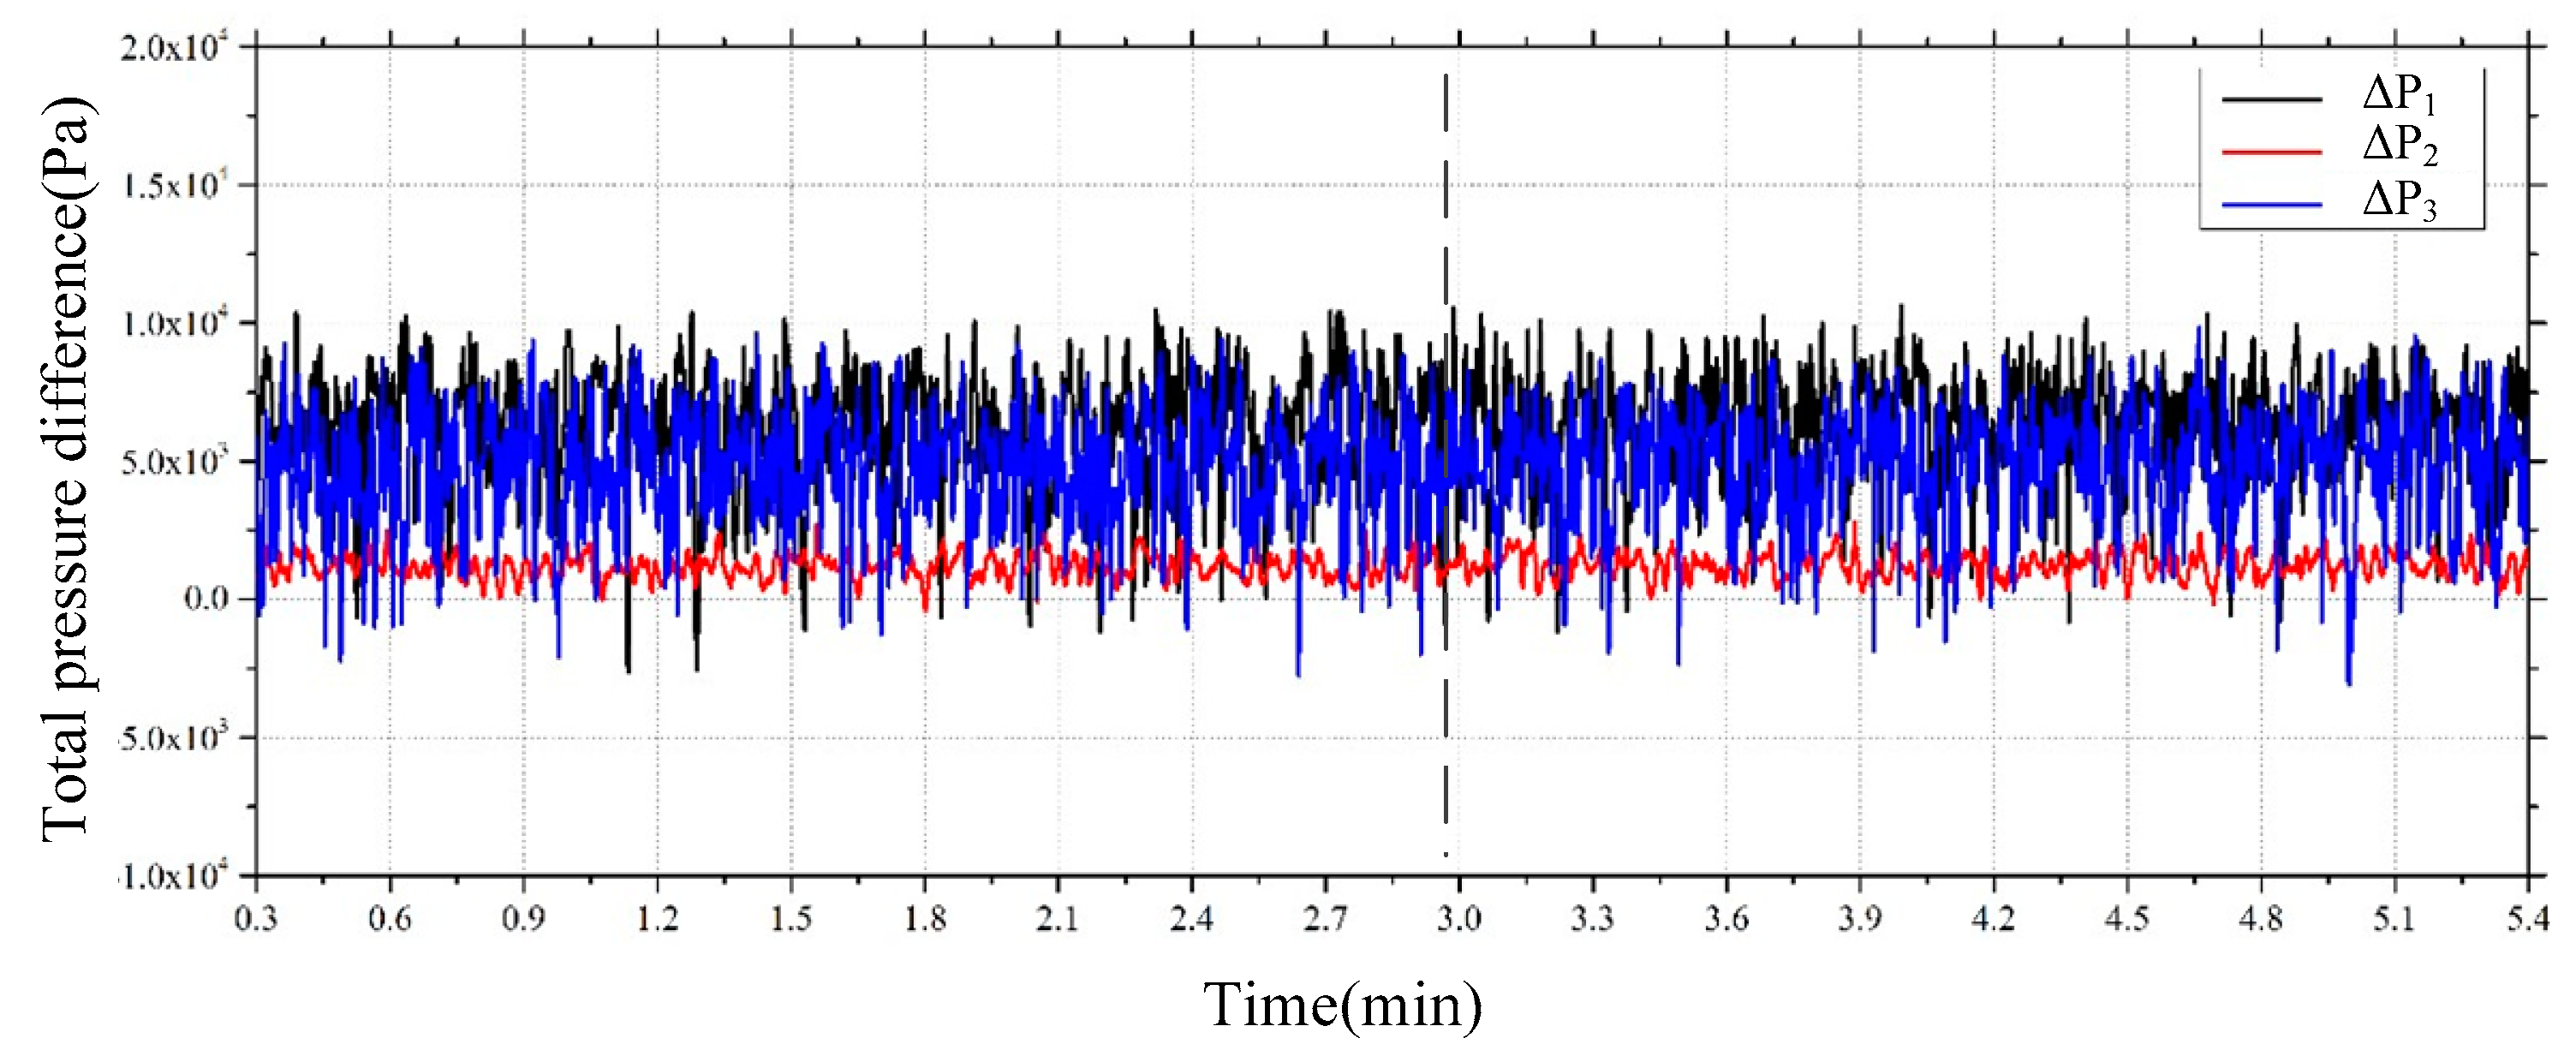
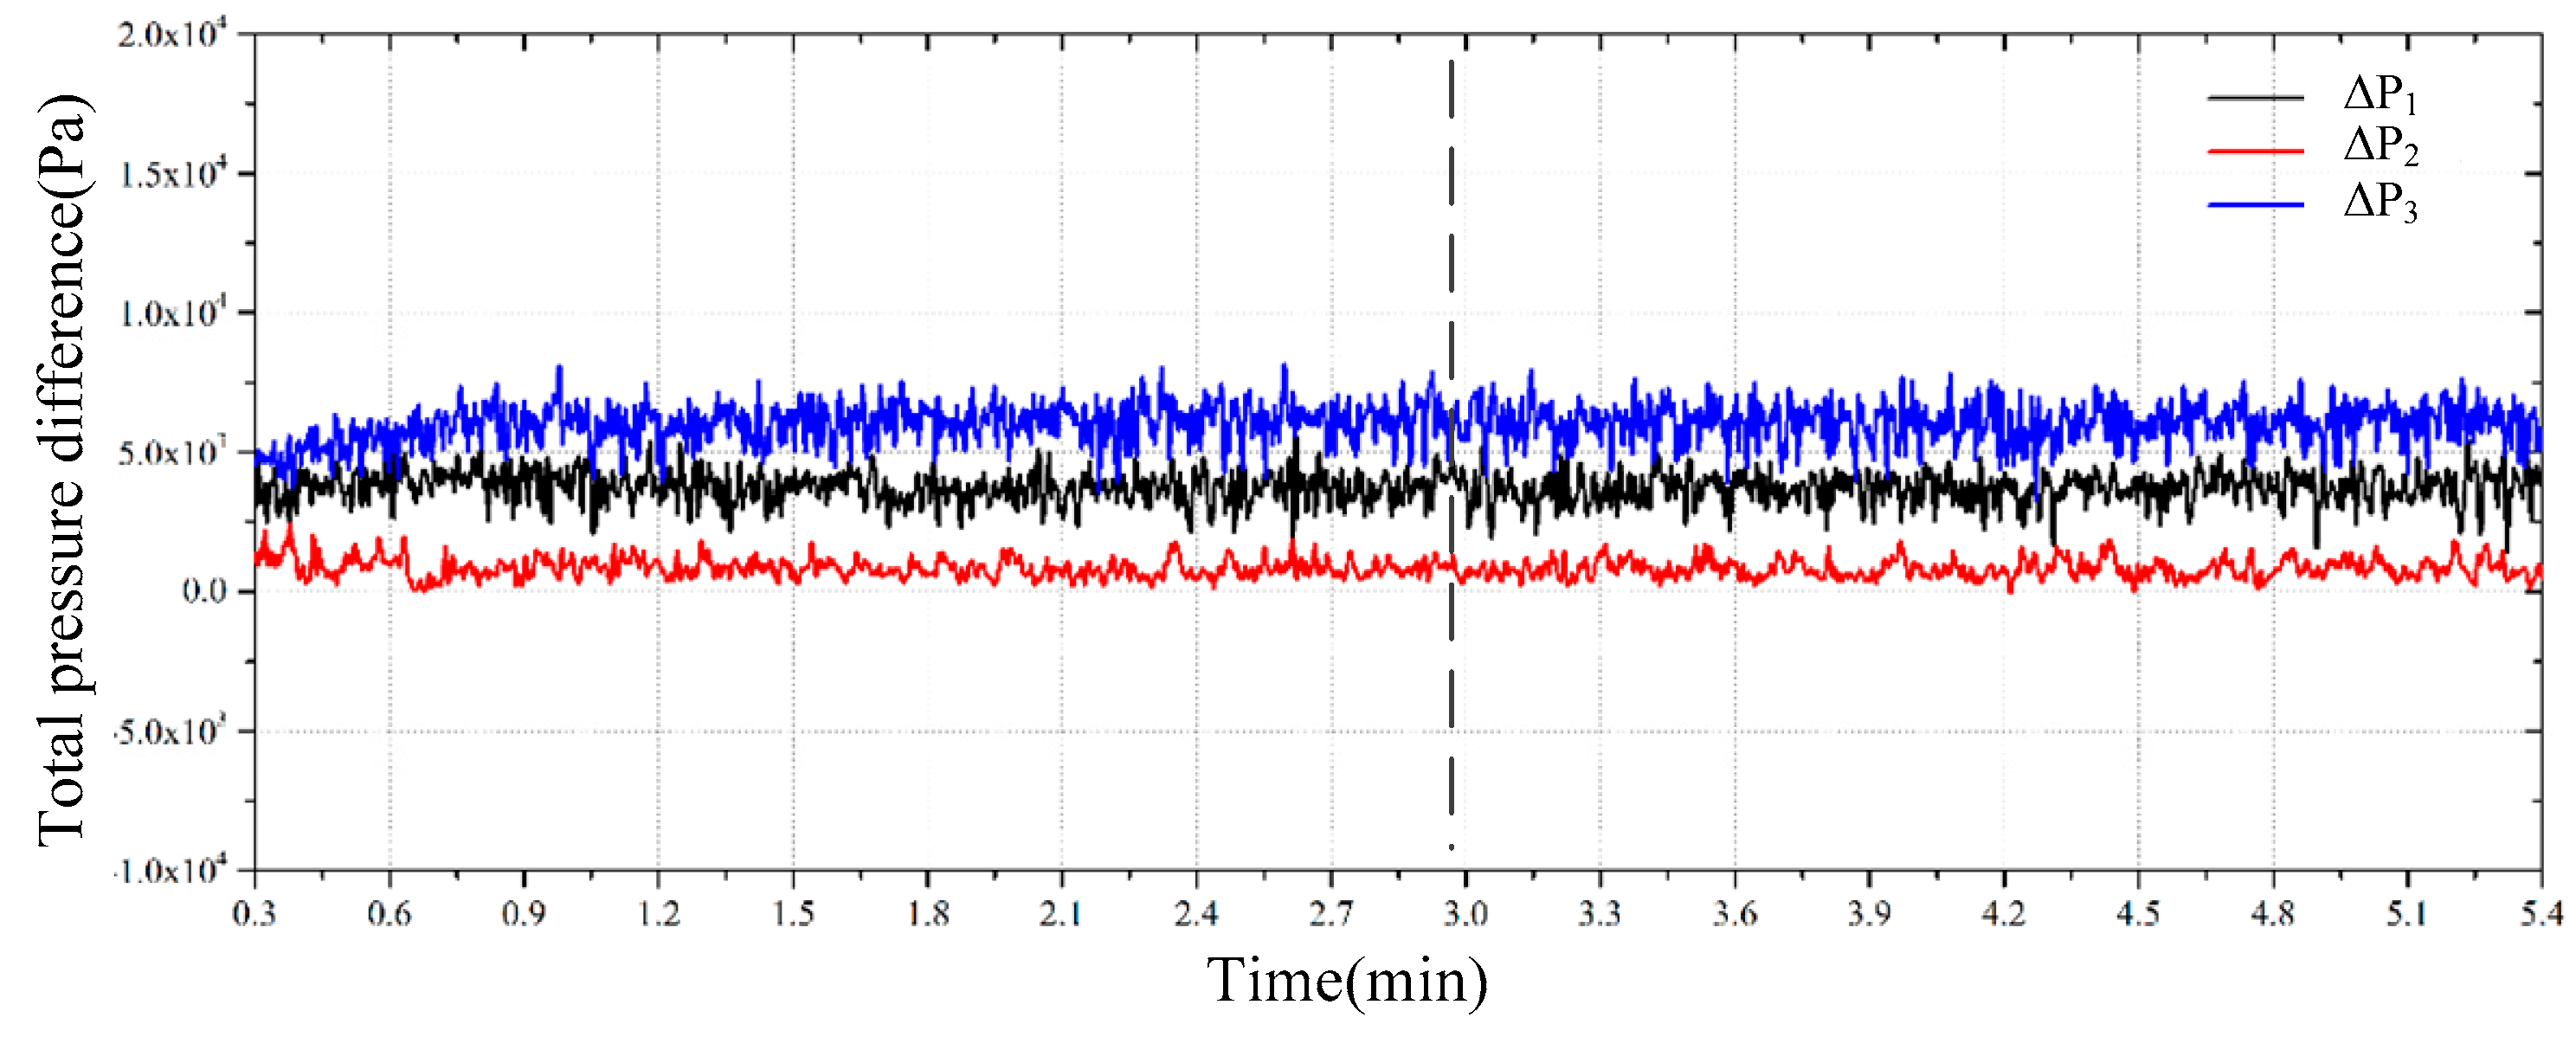
The variations in the outlet flow rates and total pressure differences are shown in
Figure 6 and
Figure 7. The volume rates and pressure showed same order of magnitude to the field data.
Severe fluctuations in the total pressure differences were observed in outlets 1 and 3, as shown in
Figure 7. Comparatively, the amplitude of the pressure fluctuation in outlet 2 was about one-eighth of that in outlets 1 and 3. The quasi-periodical behaviors of the pressure fluctuations were clearly captured.
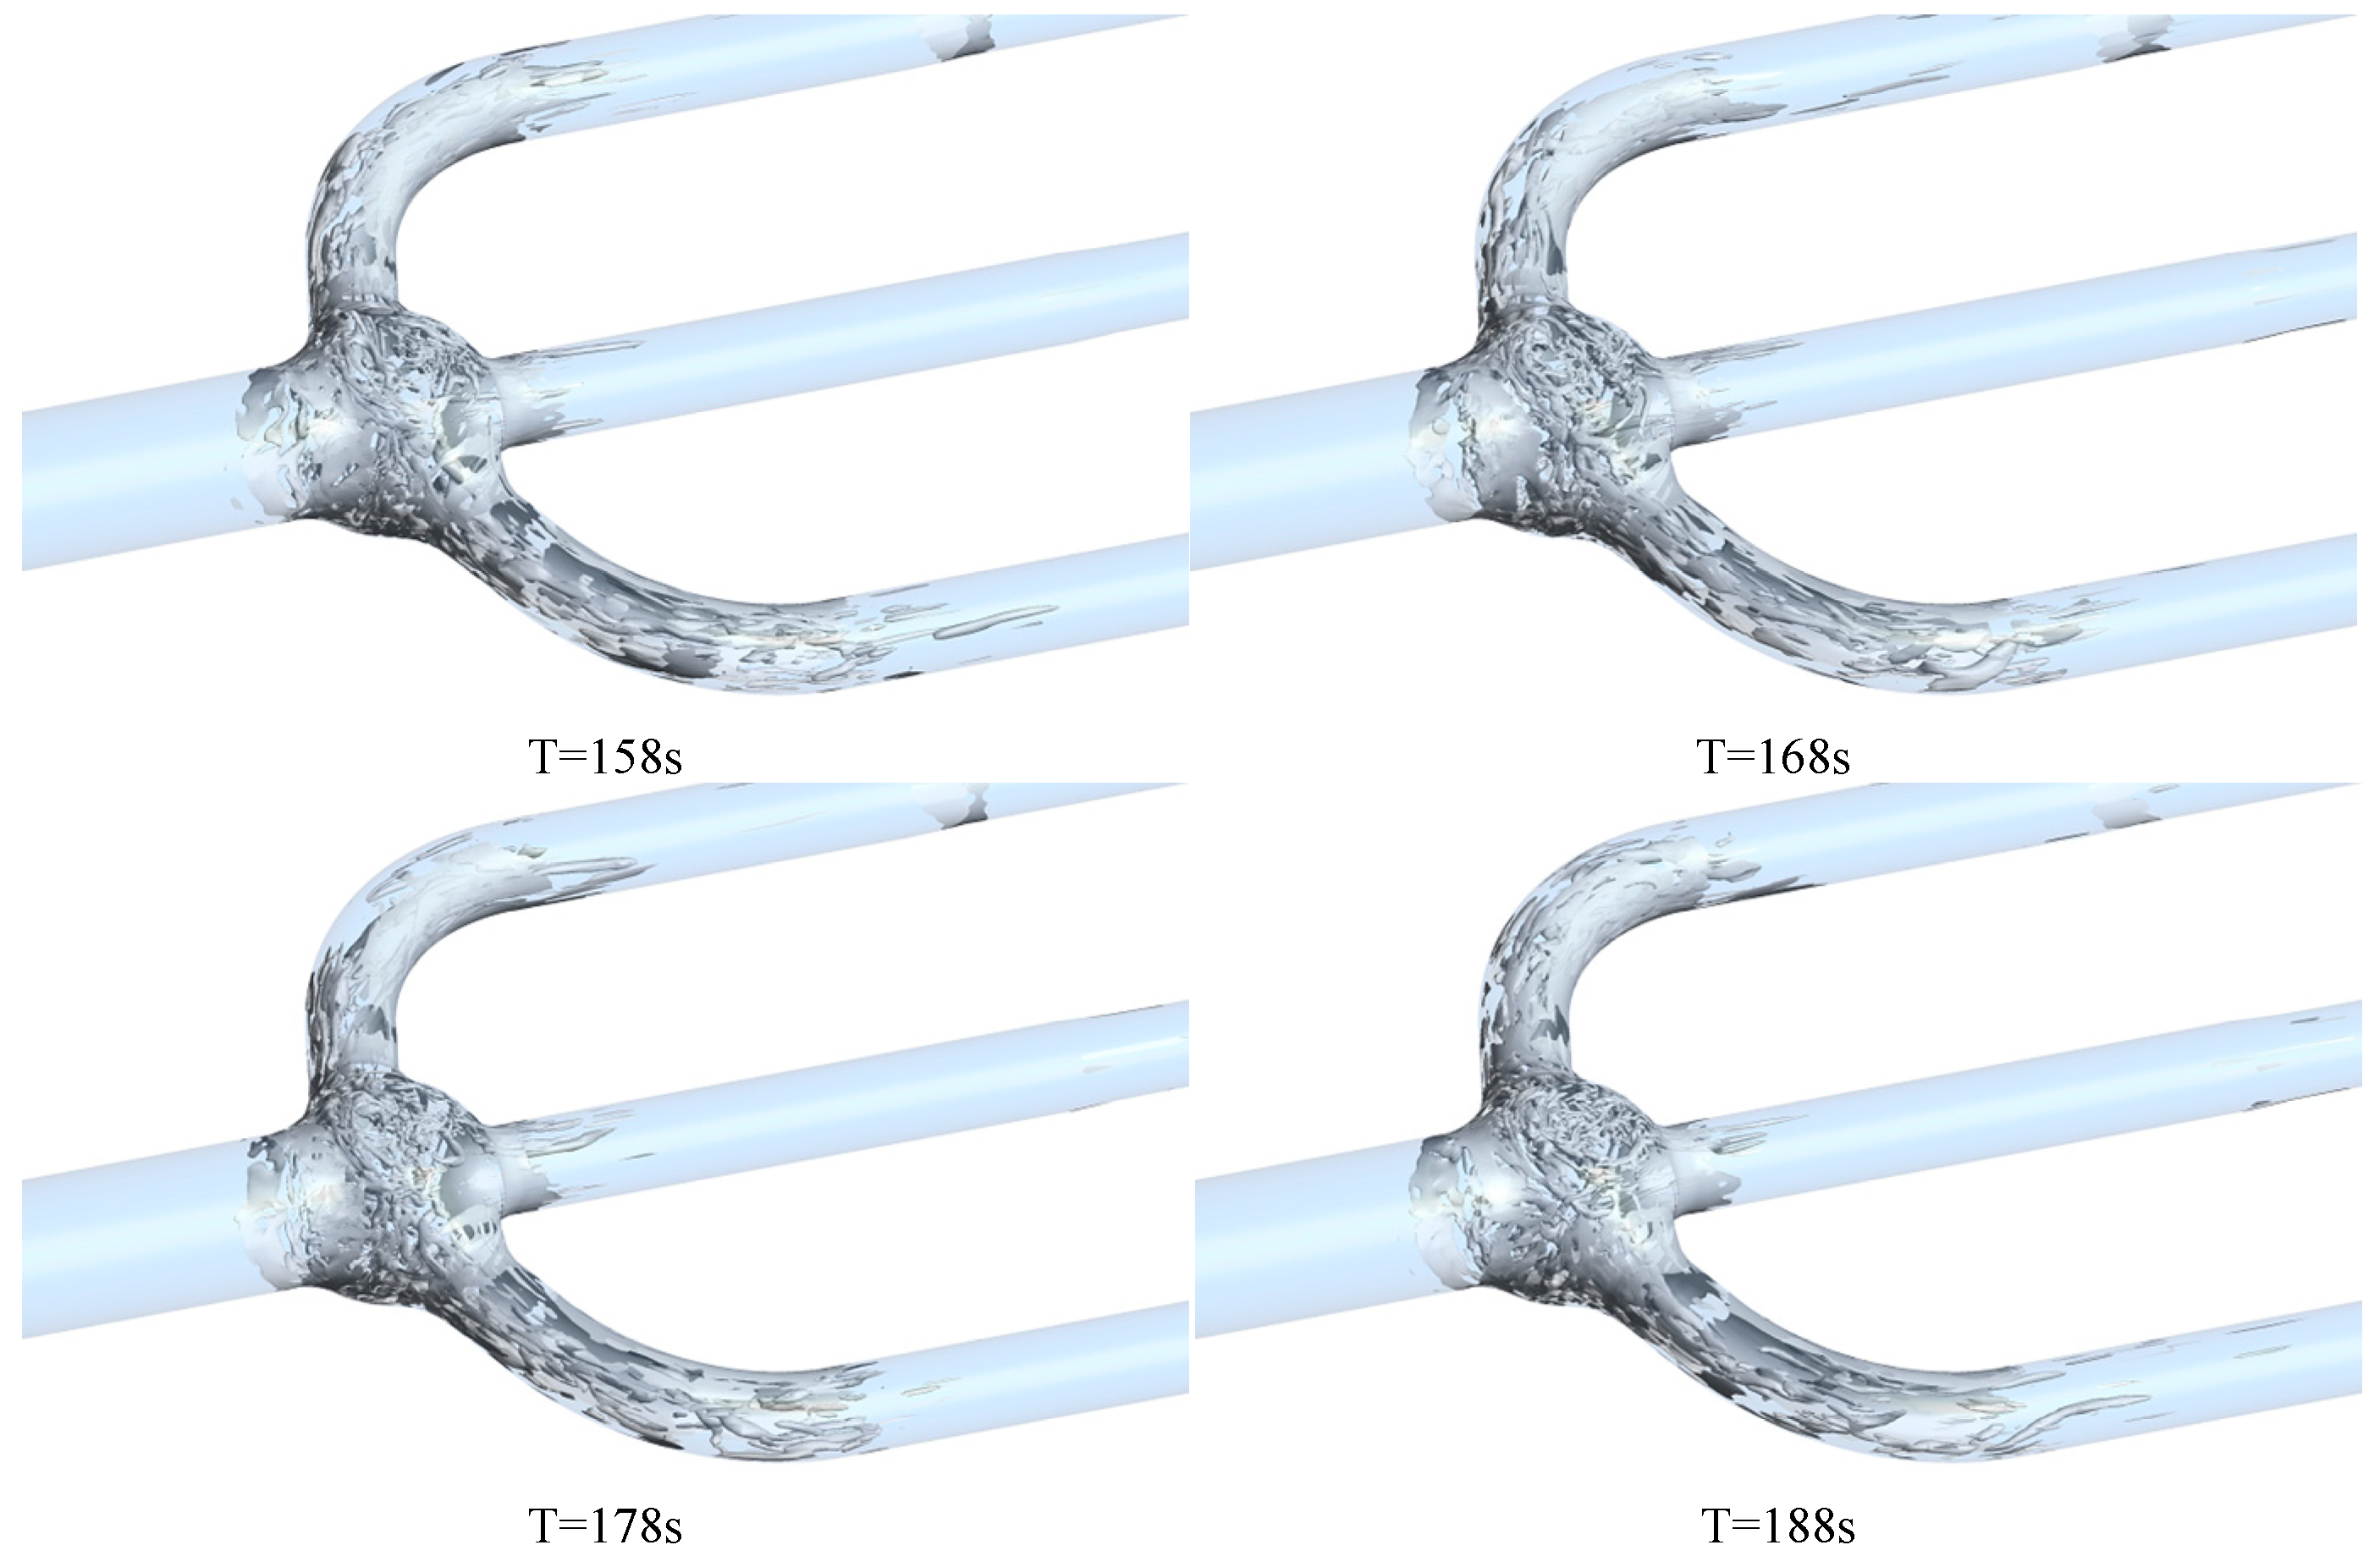
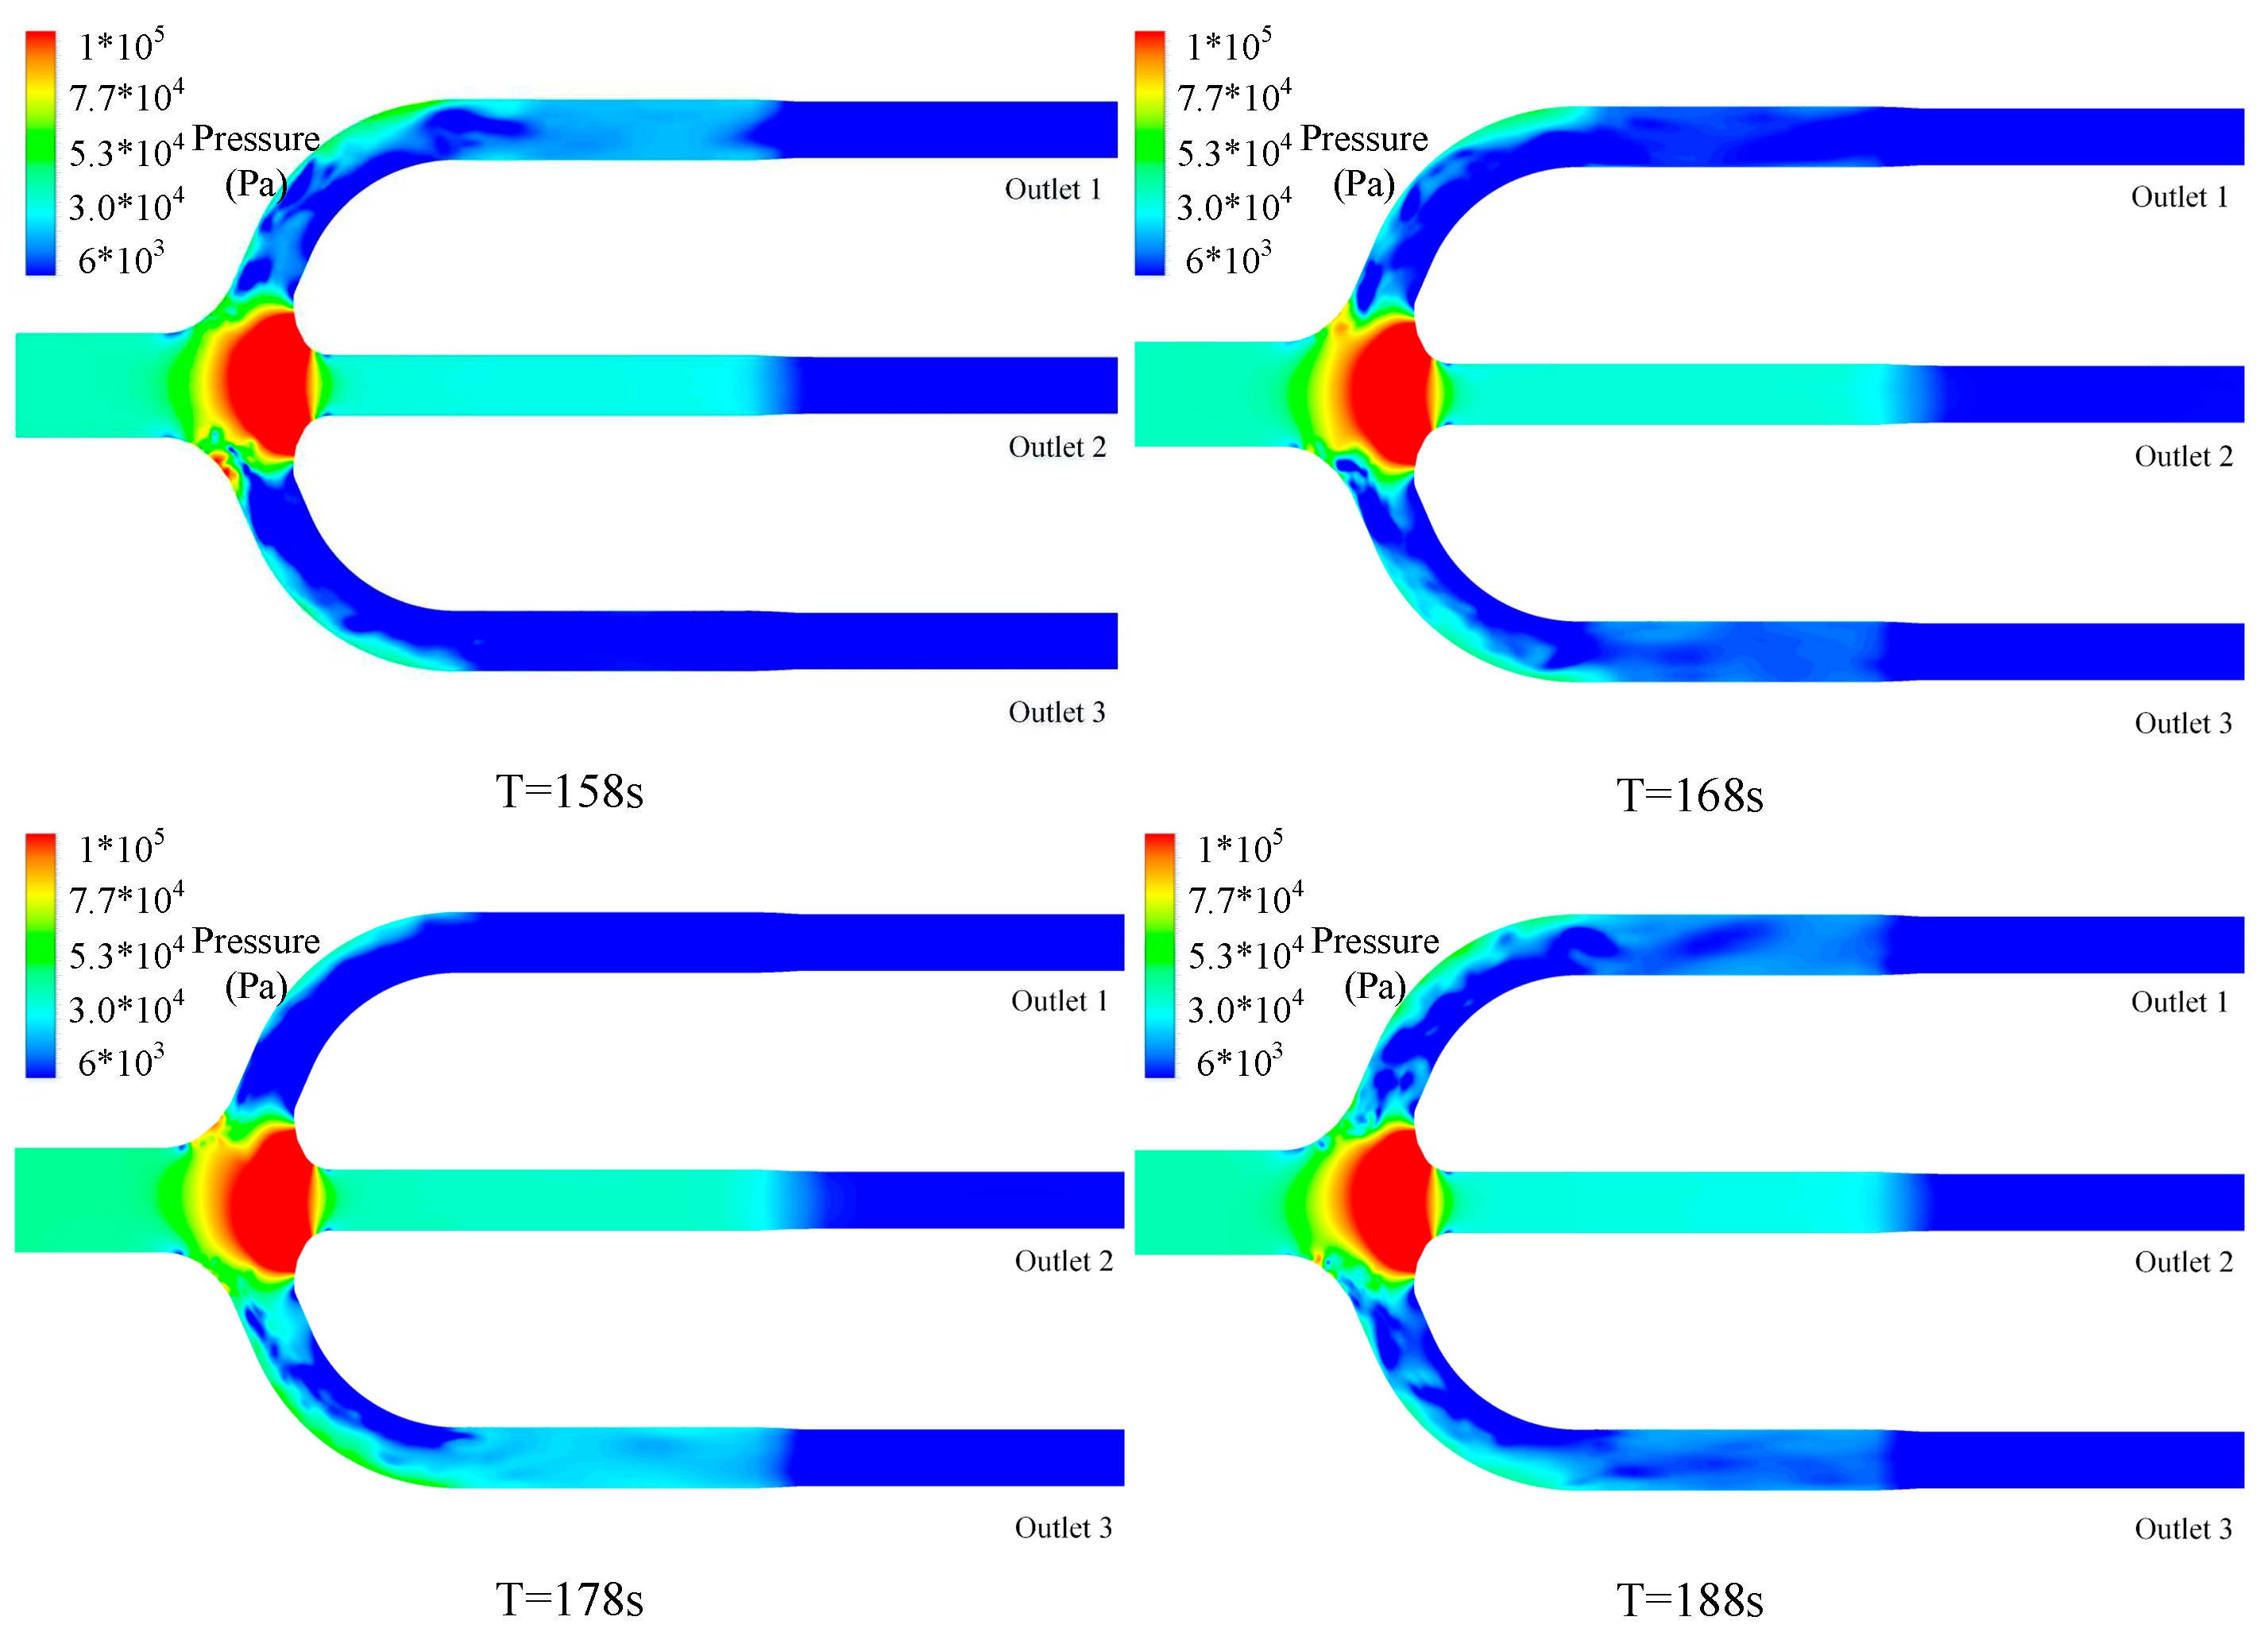
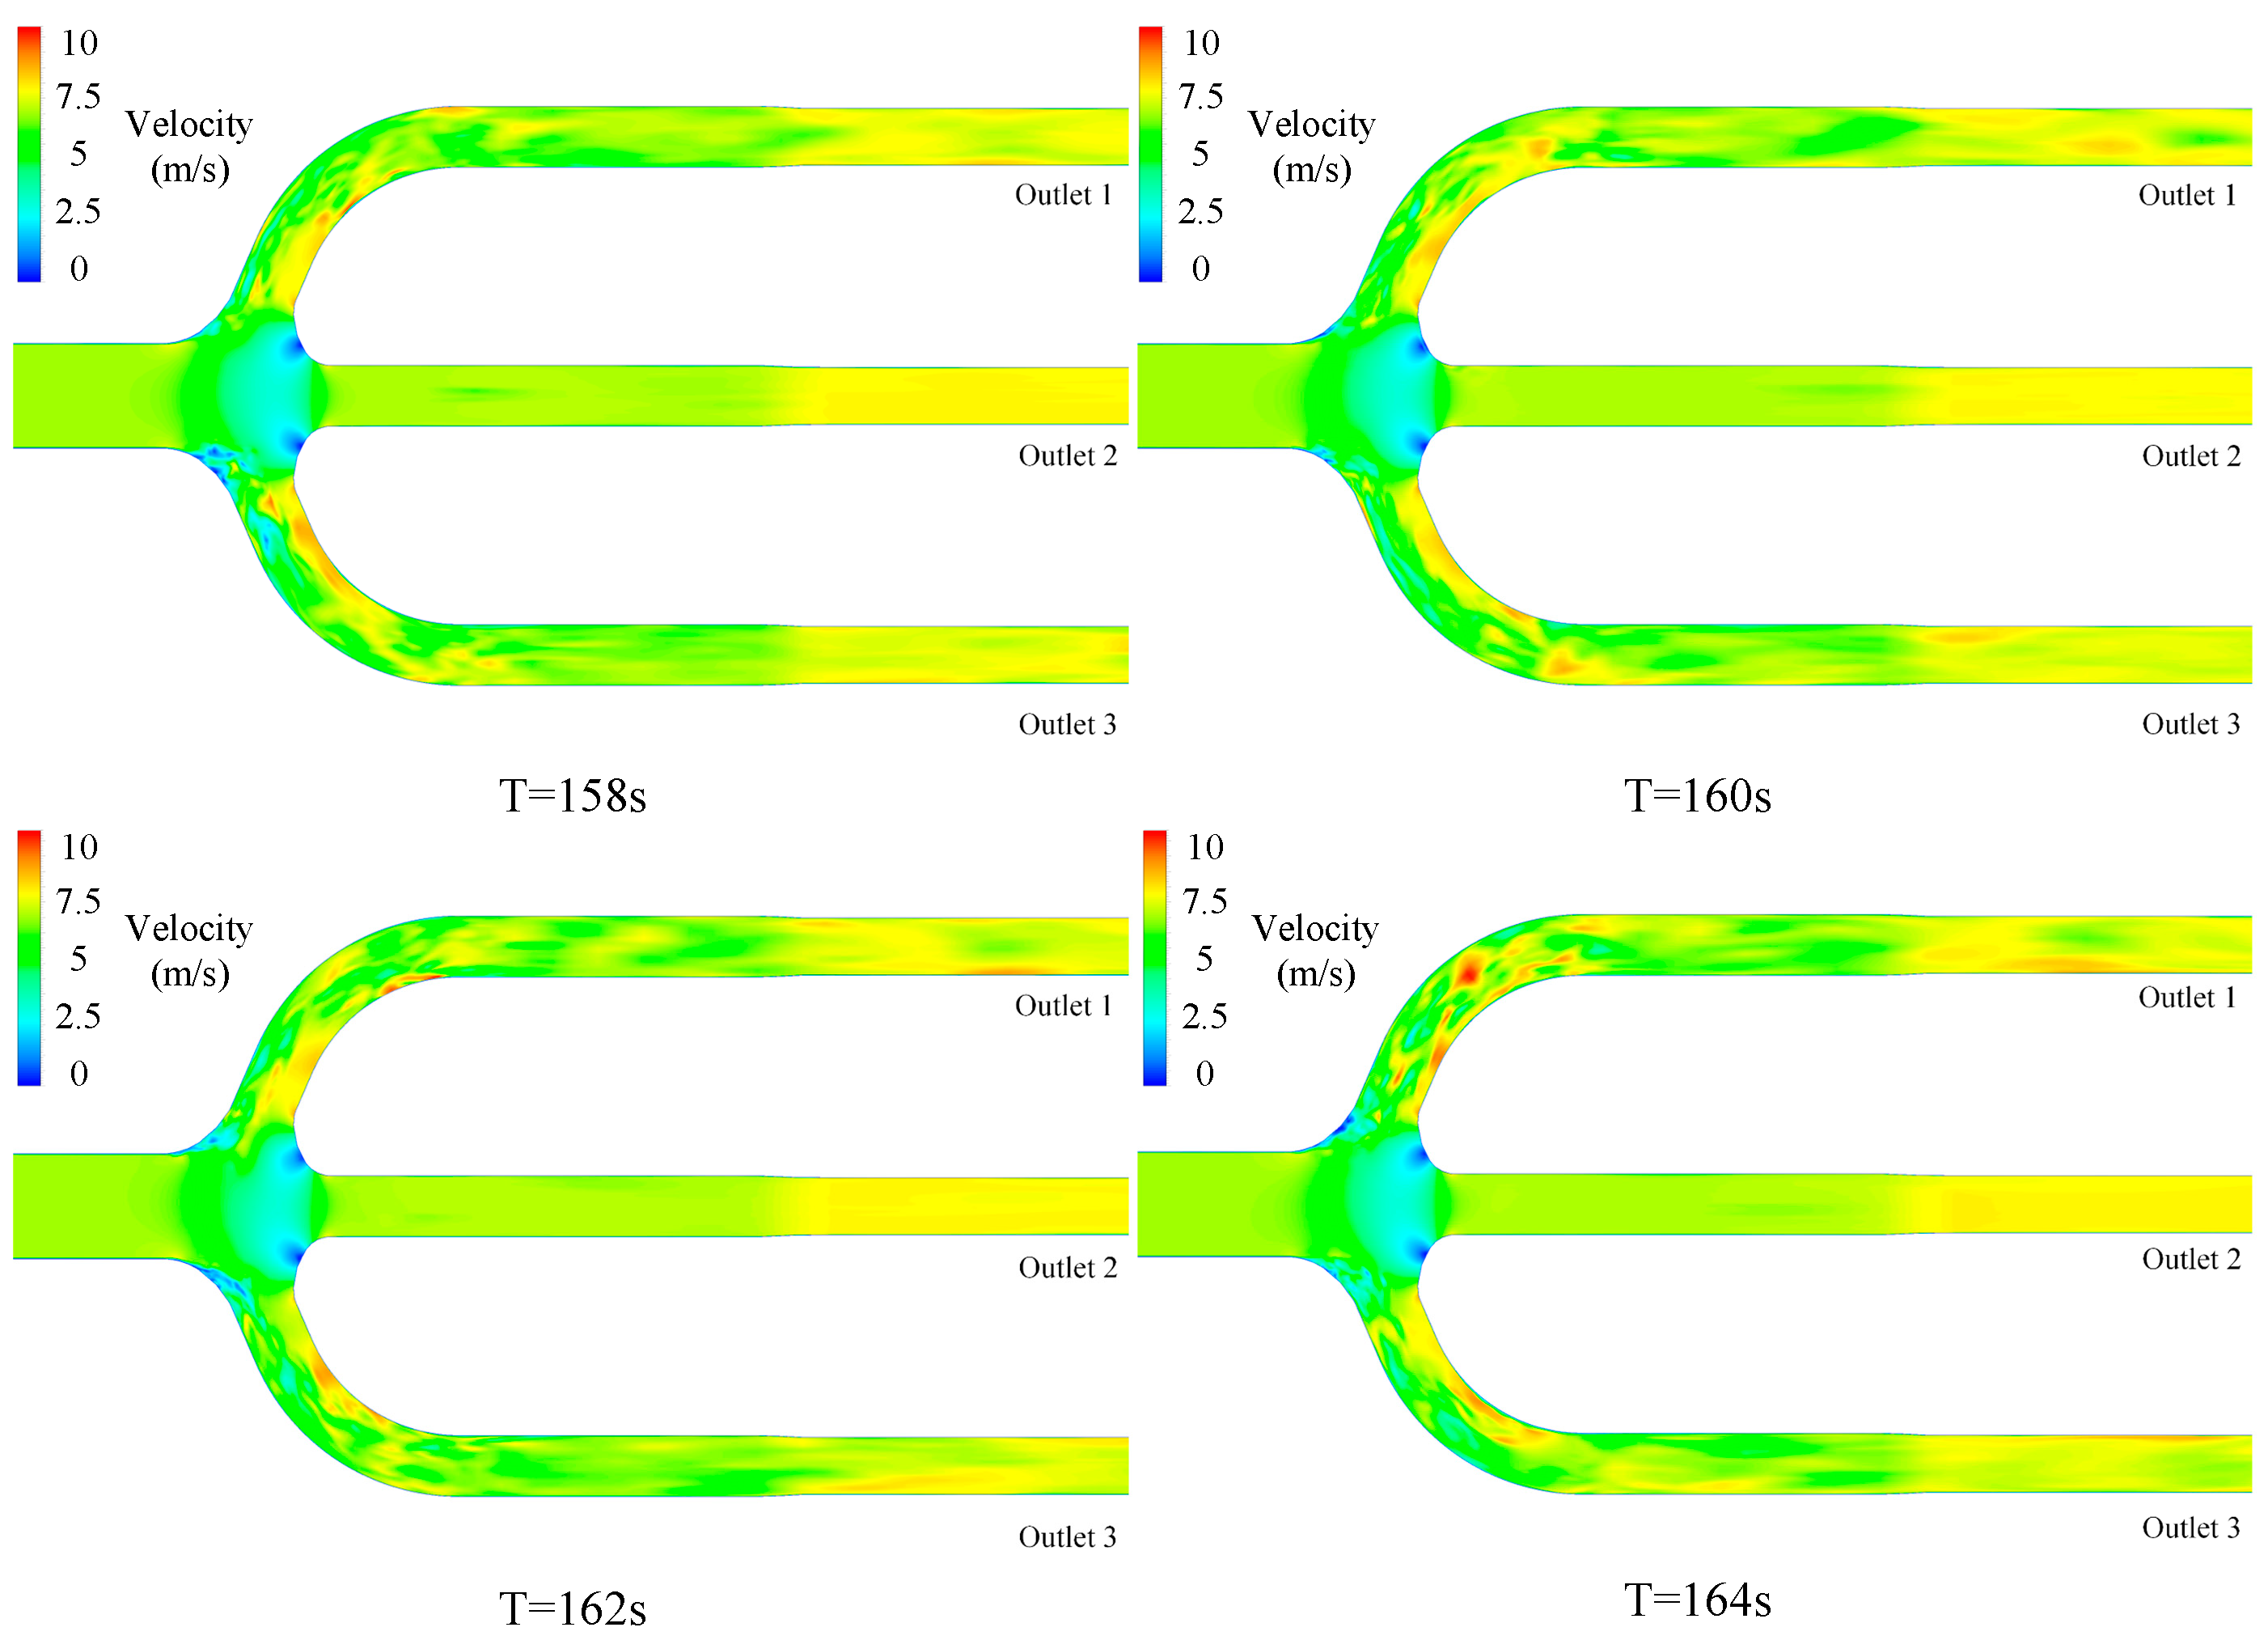
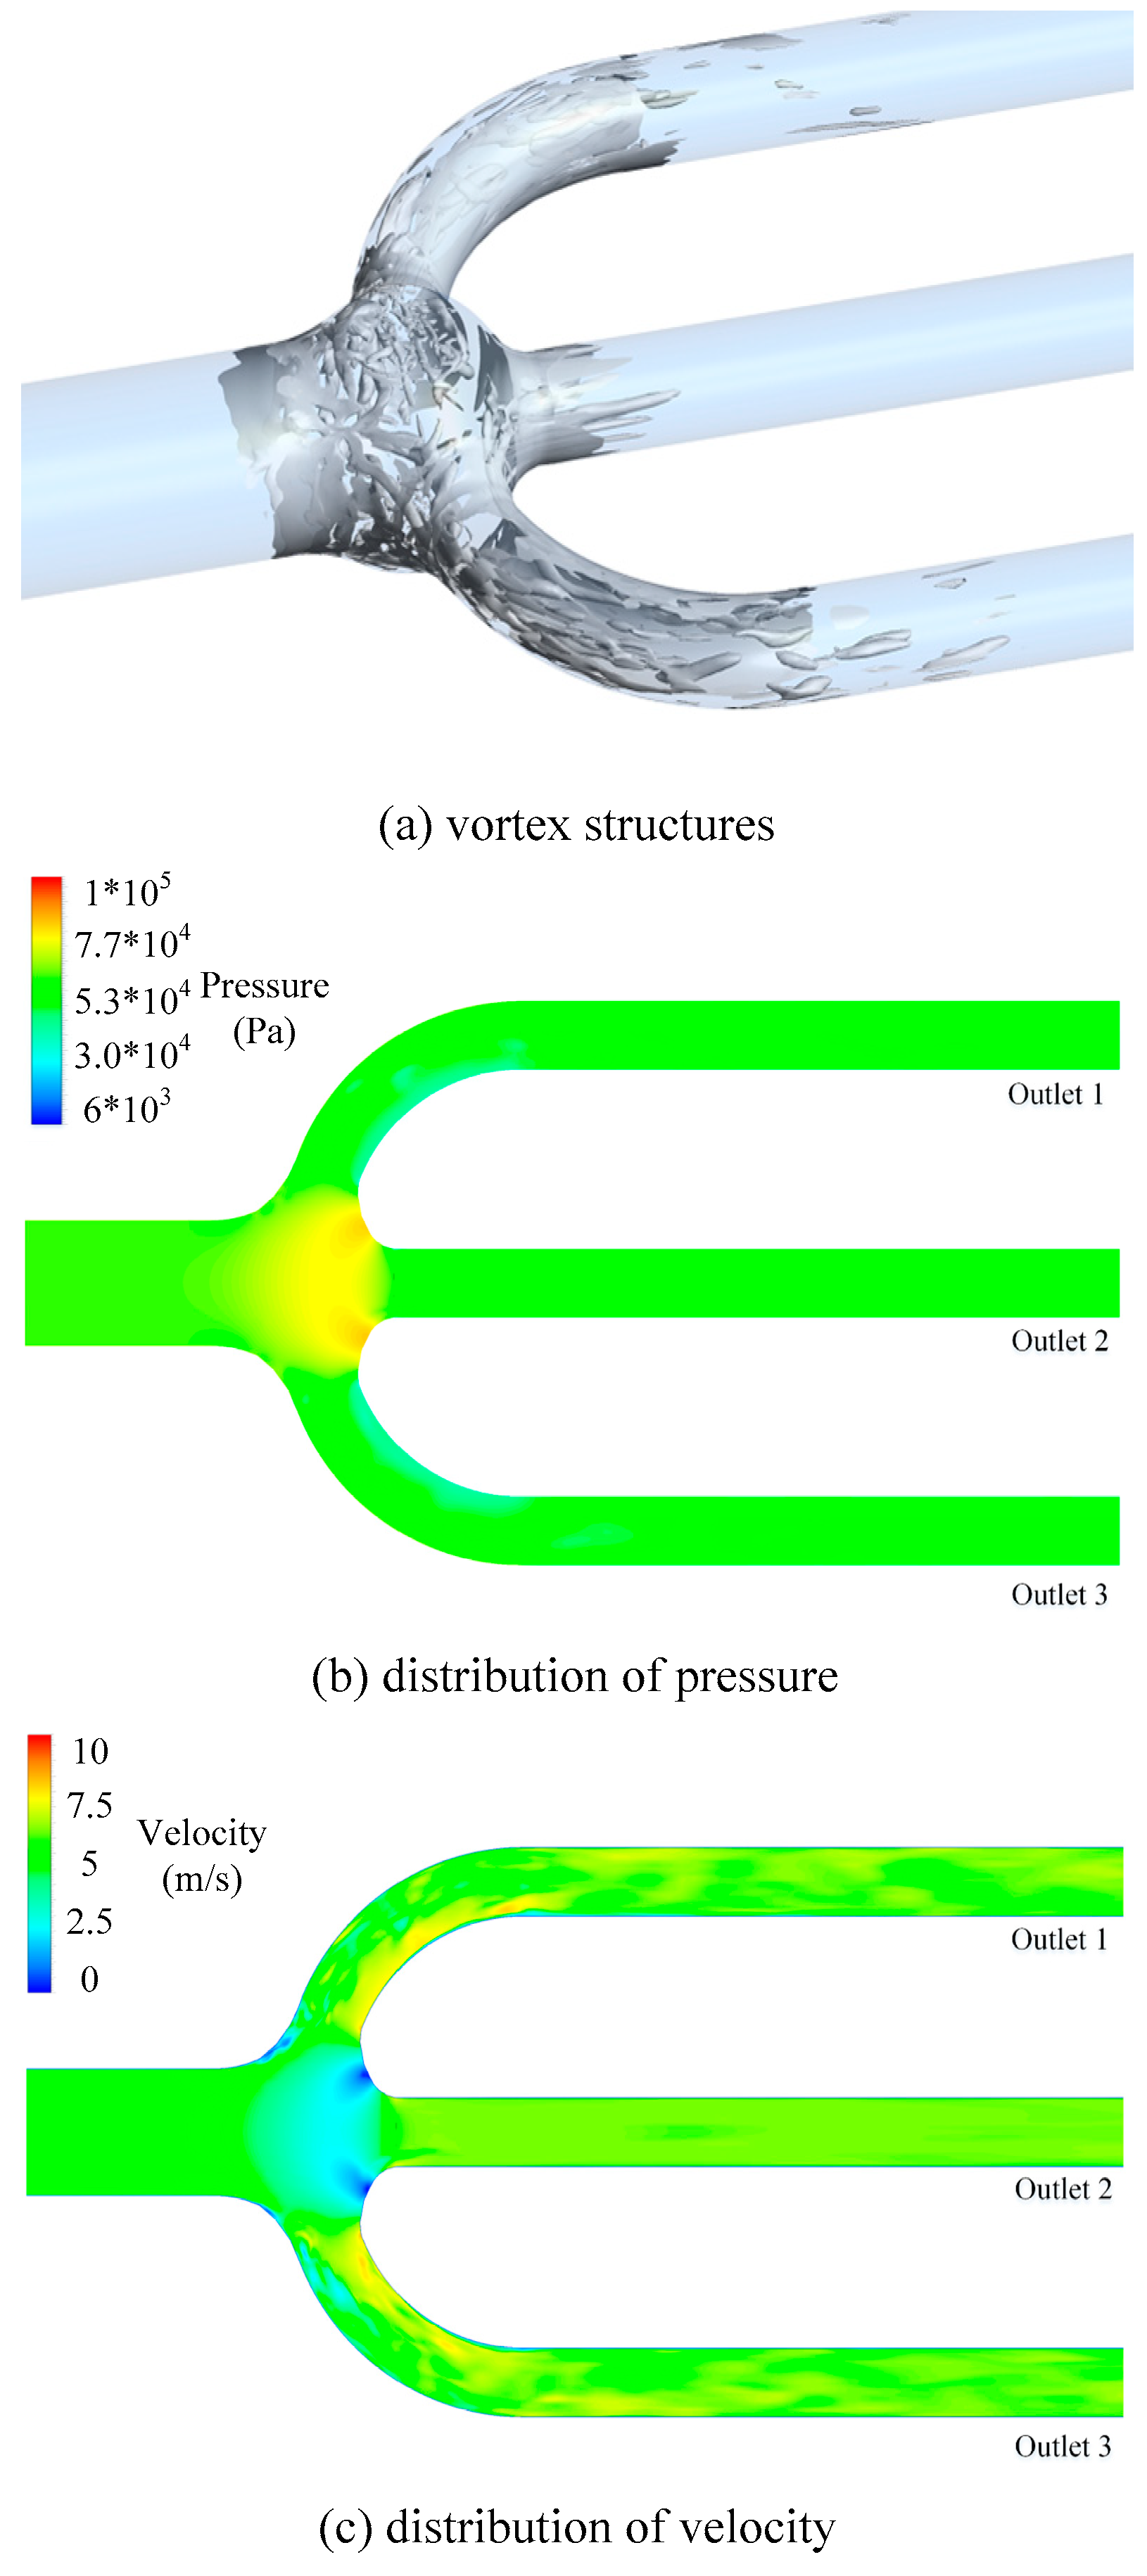
To describe the inner flow patterns, more details of the flow pattern in the pipe system as a whole are shown in
Figure 8,
Figure 9 and
Figure 10. In each subfigure, the time is indicated in
Figure 6 and
Figure 7 with vertical lines.
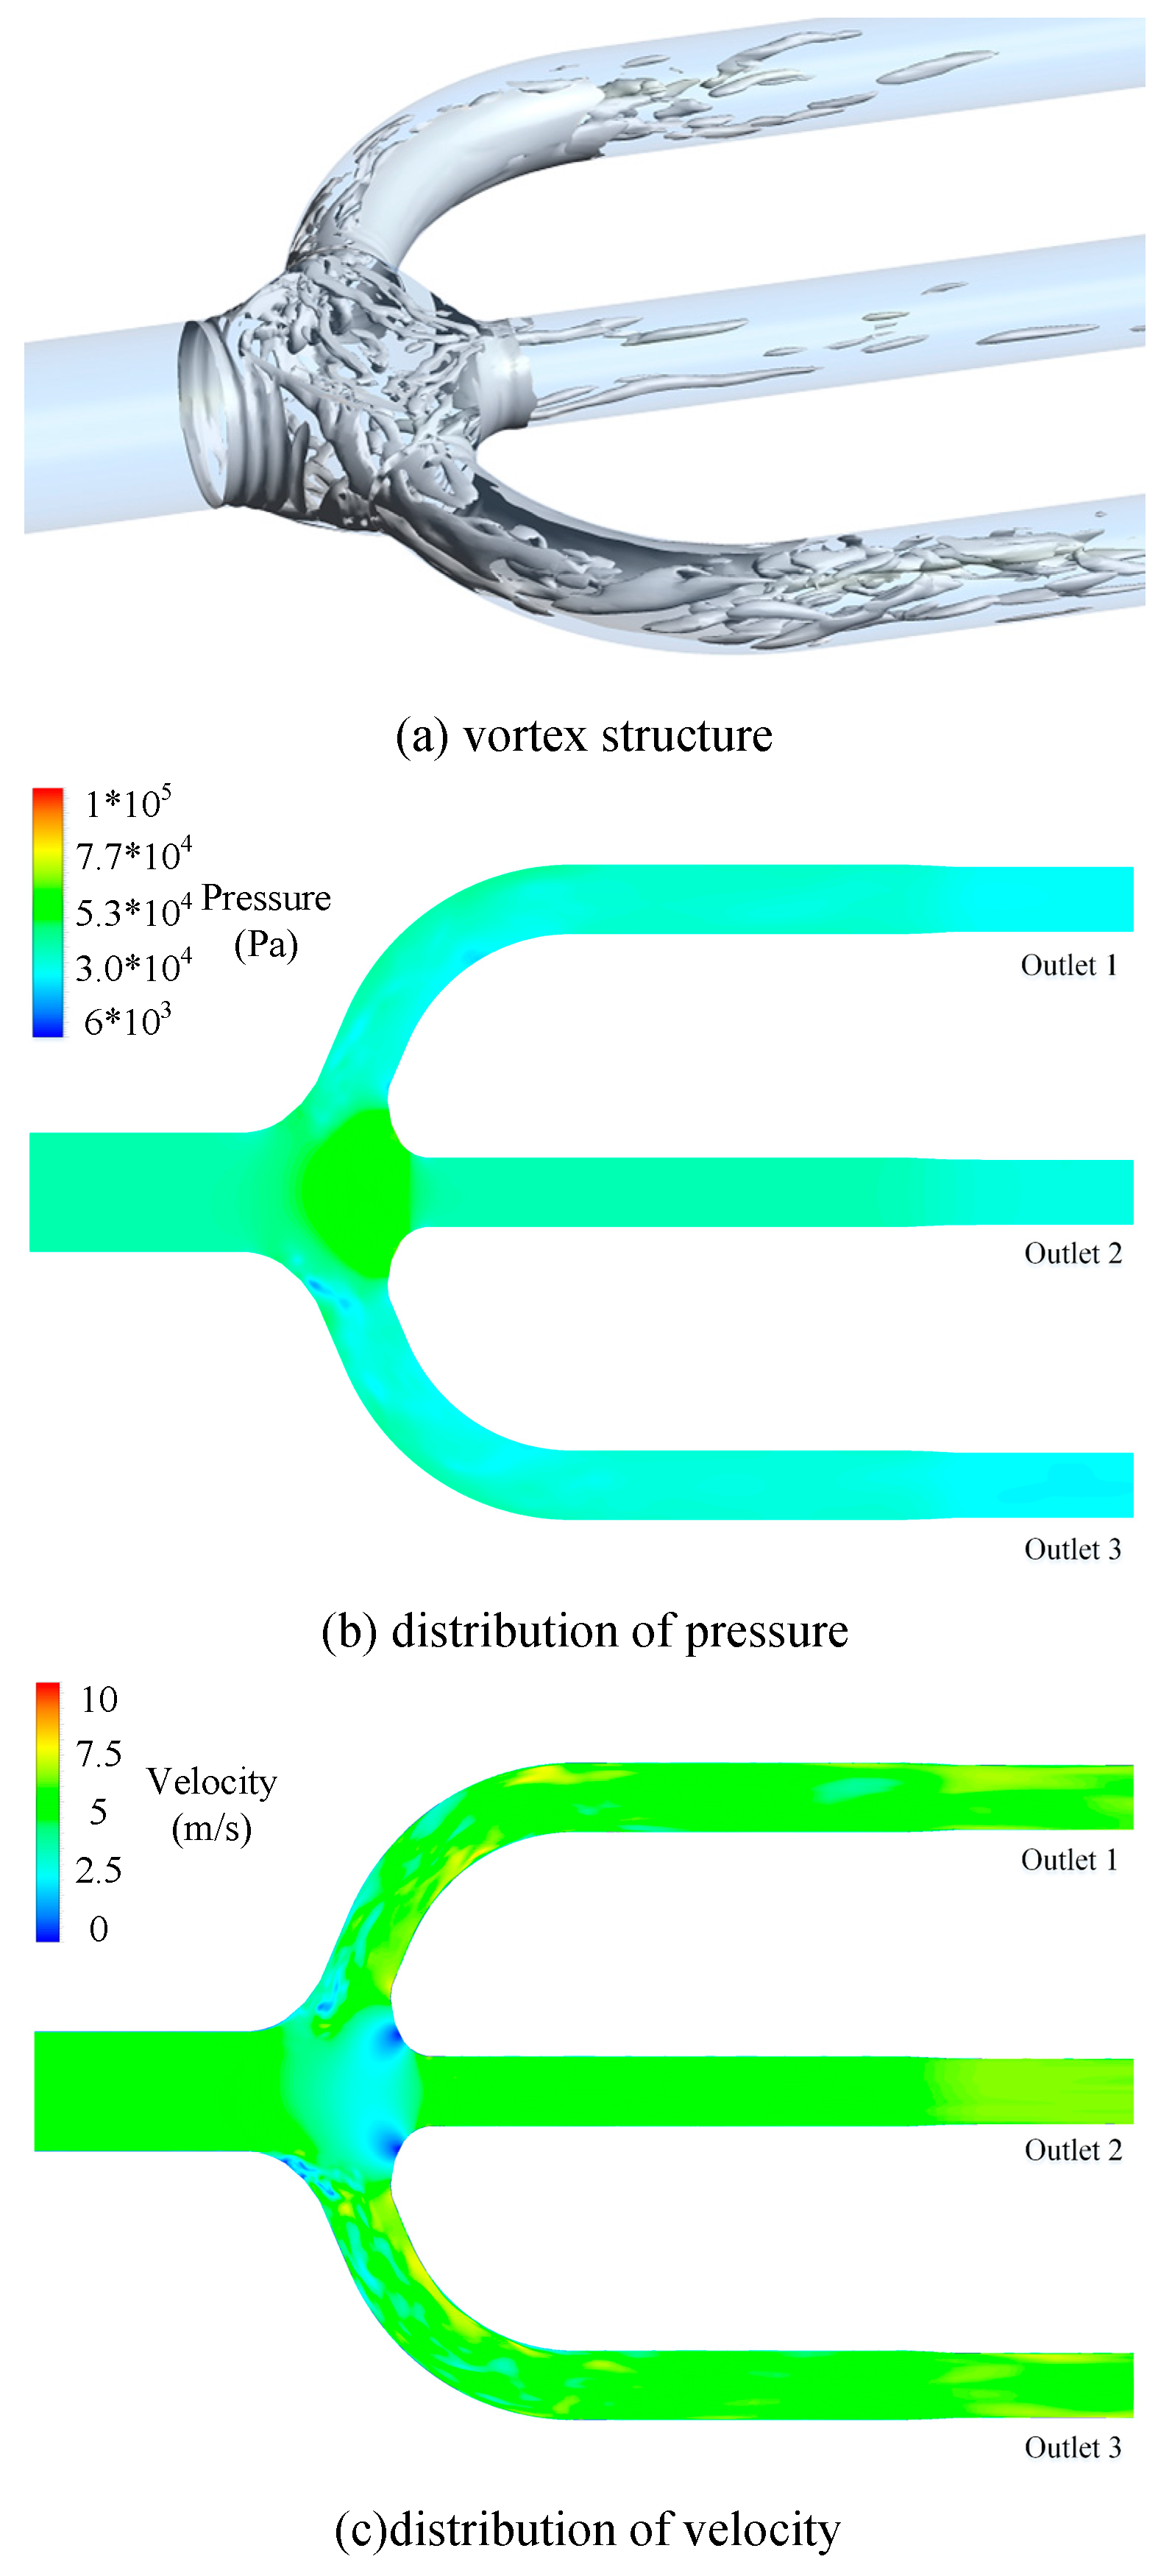
Figure 8 shows vortex structures in the penstock at different times. The surface is the spatial iso-surface of vorticity based on Q criterion.
Figure 9 and
Figure 10 show the distributions of pressure and velocity in the penstock at different times.
Figure 8 is an intuitive demonstration of the flow pattern. In
Figure 8, an obvious vortex structure can be observed in the trifurcation and the elbow parts of outlets 1 and 3. As shown in
Figure 9, the pressure in the trifurcation was much higher than in the other parts. Additionally, the pressure distribution in the trifurcation and elbow parts of outlet 1 and 3 was uneven and changed significantly with time, while the pressure in outlet 2 remained almost steady. Moreover, the pressure in the three outlets was much lower than that in the inlet, and the pressure was lower in outlets 1 and 3 than in outlet 2. This means that a considerable part of the water energy was lost due to turbulent flow and the waste was serious in outlets 1 and 3.
According to the mathematical analysis and simulation calculation, it can be concluded that the power fluctuations were induced by the complex vortex structures around the trifurcation. The vortex was induced by the unreasonable structure of the trifurcation.
The irrationality is that the diameter of the trifurcation is much bigger than the inlet. When water flows to the trifurcation, the flow space suddenly increases. Then, the water spreads to the whole trifurcation. The steady flow pattern turns to turbulence. At the entrance of the outlet, the collisions of water flow are significant. Thus, serious vortex phenomena appear.
The aim of the design is to slow down the water flow so that the hydraulic loss in the trifurcation reduces greatly. However, the actual situation showed the opposite. The vortex not only led to power fluctuations, but also substantially decreased the efficiency of units.
4. Optimizing Measures and Simulation Results
To suppress the pressure fluctuations, improvement of the flow pattern in the trifurcation is necessary. Two methods are proposed in this paper to achieve this goal.
4.1. Optimizing Measures
The first method involves decreasing the ratio between the inlet diameter and trifurcation diameter. The second method decreases the velocity of the water flow in the inlet and trifurcation. Both methods aim to reduce collisions in the trifurcation.
Three cases with different specific optimization measures based on the two methods were studied. In cases 1 and 2, the inlet diameter was increased. The velocity in the inlet was decreased at the same time when the volume flow rate was unchanged. Case 3 was used to set a new guide plate to narrow the trifurcation space. This means a decrease in the diameter of the trifurcation. The grid of models in case 1 to 3 was similar to the original model. The LES approach was adopted in the simulation, and the boundary conditions were also the same.
4.2. Simulation Cases
- (1)
Case 1 (modified model 1)
In case 1, the modified model 1 was adopted, where the inlet diameter was increased to 6 m and the length of inlet pipe was also lengthened correspondingly. The other sizes were the same as the original model. The calculation conditions were also the full load operation conditions.
- (2)
Case 2 (modified model 2)
In case 2, the inlet diameter of the modified model 2 was further increased to 7 m. The length of the inlet pipe was lengthened correspondingly. The other sizes were the same as the original model, and the calculation setup was the same as case 1.
- (3)
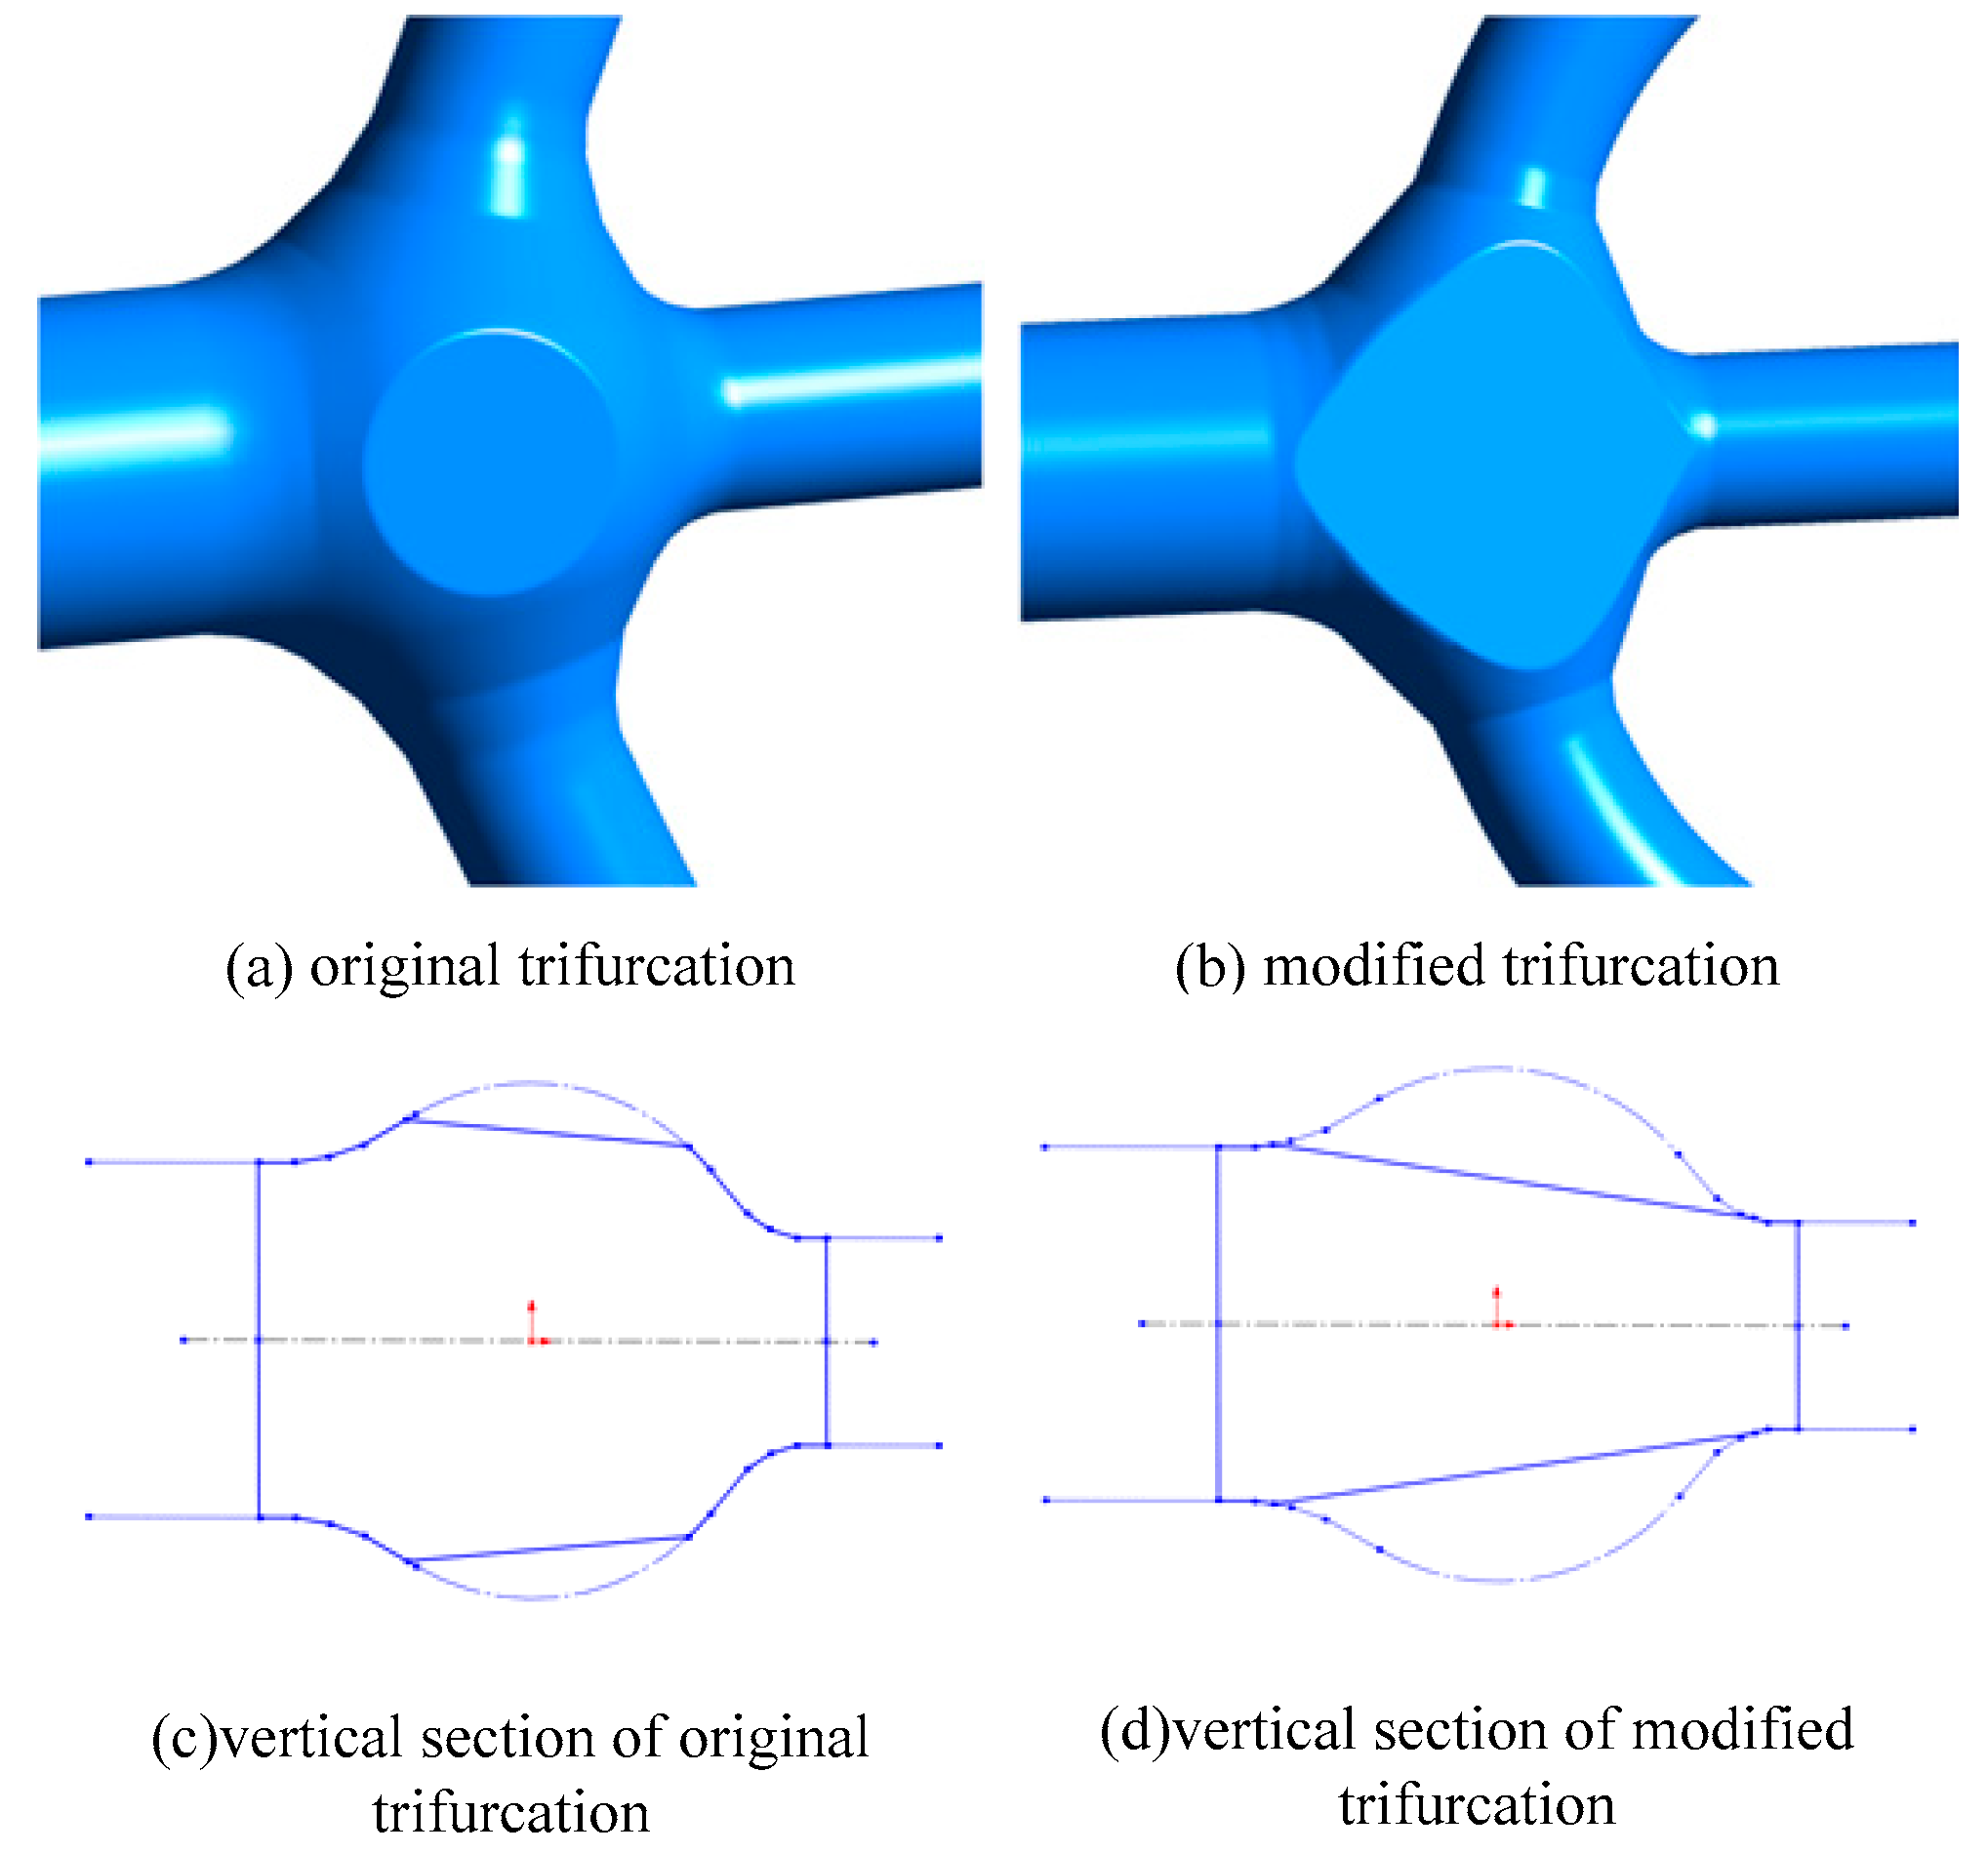
Case 3 (modified model 3)
In modified model 3, the structure of the trifurcation was modified. As shown in
Figure 11, a new guide plate was set to narrow the trifurcation space. The other sizes were unchanged.
4.3. Simulation Results
- (1)
Case 1
Figure 12 shows the variations in the total pressure difference in case 1. With a thicker inlet pipe, the pressure fluctuations induced by trifurcation in modified model 1 decreased when compared with the original model. Moreover, thanks to the decrease in the velocity of the incoming flow, the time-averaged pressure drop also decreased, which should have a positive influence on the operation of the hydraulic units. A more detailed description is given in
Figure 13, which also indicates that a thicker inlet pipe is an effective method to reduce pressure fluctuations. In addition, the vortex structures in the current case were much weaker than those of the original model.
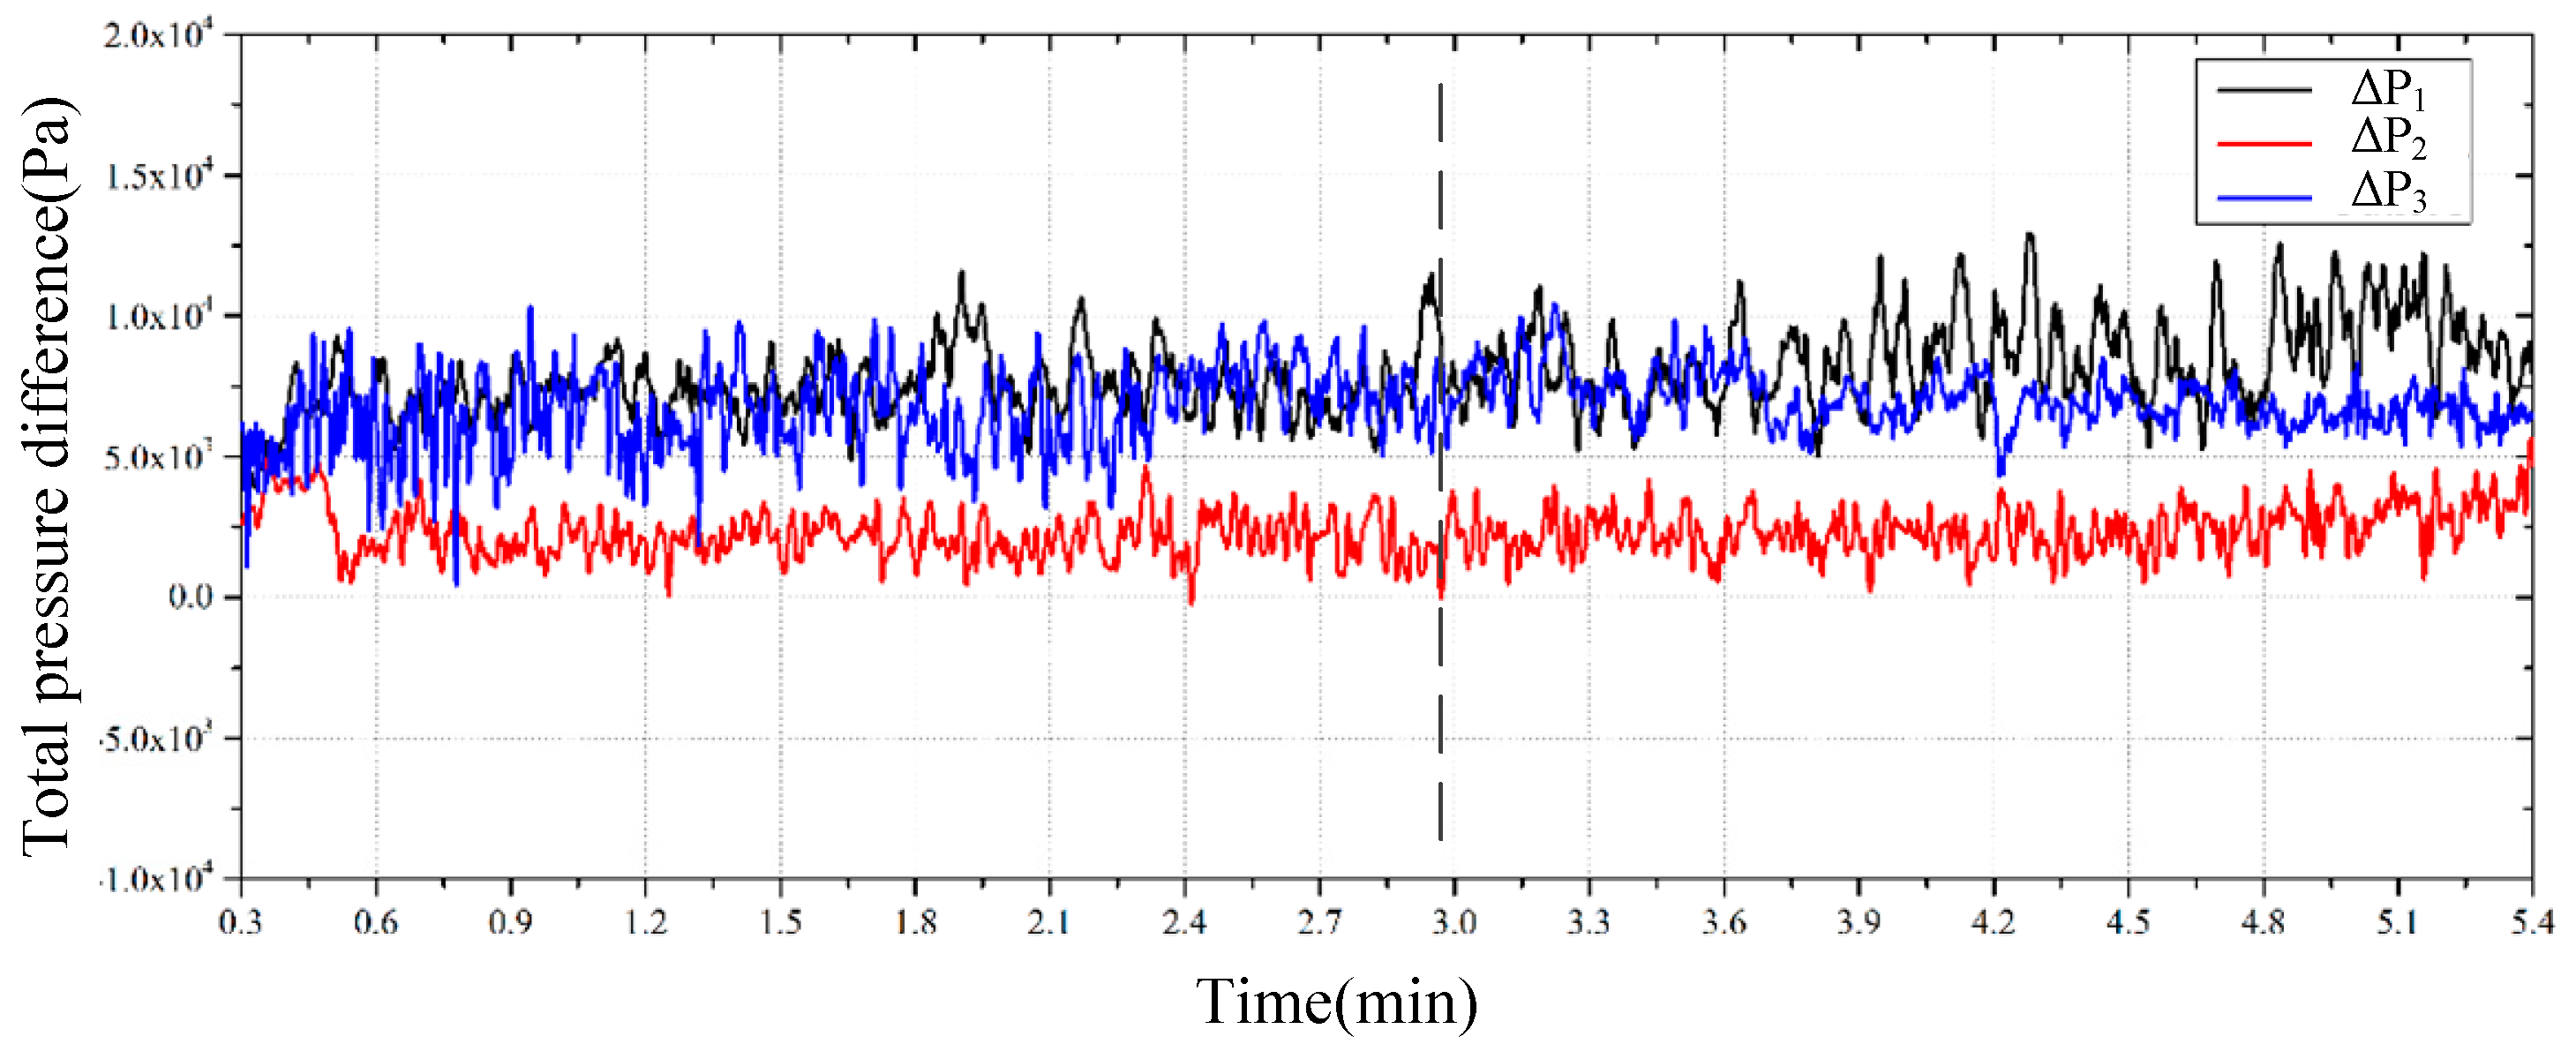
Figure 14 shows the variations in the total pressure difference in case 2. A similar trend to case 1 was observed. With a thicker inlet pipe, the total pressure difference decreased significantly, which is very positive for the efficiency promotion of the power plant.
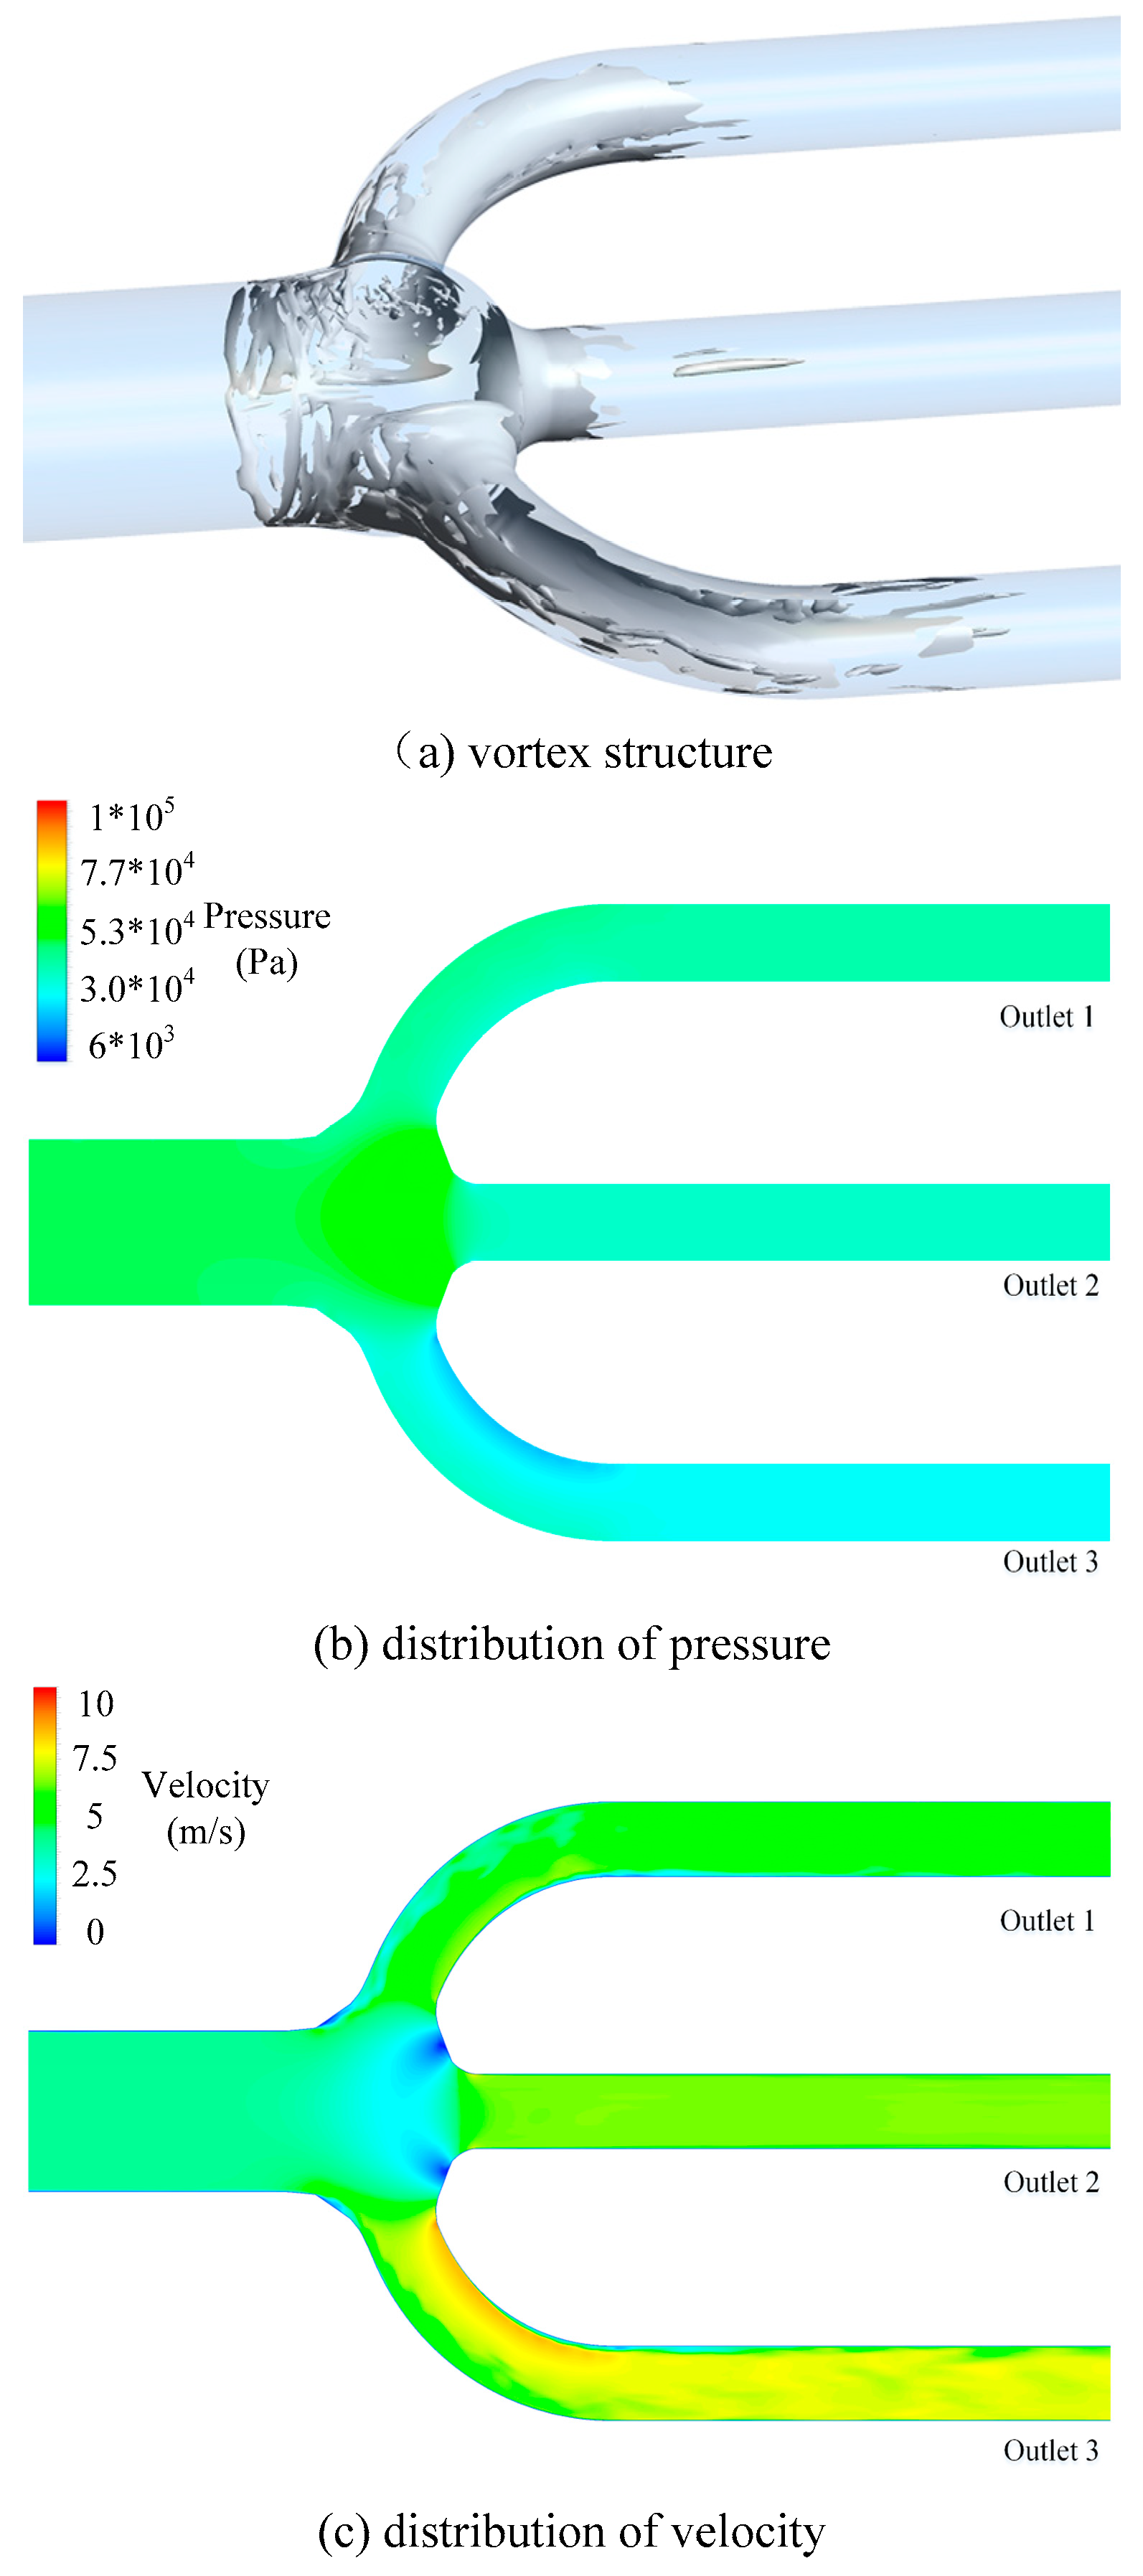
Figure 15 gives the vortex structures and the distributions of pressure and velocity. Compared with case 1, the flow pattern was further improved.
The variations in the total pressure differences in case 3 are shown in
Figure 16. The trifurcation with modification also significantly improved the pressure fluctuations when compared with the original model.
Figure 17 gives a description of the flow pattern in the penstock.
4.4. Analysis of the Cases
Compared with the original model, the pressure fluctuations were restrained in all cases. This means that the basic idea to restrain the divergent flow in the trifurcation is correct. All the measures improved the flow stability.
According to the simulation results, the effectiveness of the cases can be analyzed preliminarily. The pressure fluctuations in all cases showed no-periodicity. Therefore, the comparison of the 3 cases and the original model (named as case 0) is the amplitude of the pressure. The amplitudes of pressure fluctuation in all cases are given in
Table 4. The pressure fluctuations in outlet 2 were neglected due to their tiny amplitudes. The amplitudes of pressure fluctuation in cases 0–3 are shown in
Table 4. When extended to long time simulation results, the amplitudes of pressure in outlets 1 and 3 tended to be the same in each case.
In these cases, the stability of the flow pattern in the penstock was evaluated by the amplitude of the pressure fluctuations. The rank of the flow stability in all cases is given in
Table 4.
5. Results after Reconstruction and Summary of the Measures
5.1. Field Data after Reconstruction
The measurement method from case 3 was finally adopted, because the measures in other cases are not suitable for practical engineering. The measures to increase the diameter of the inlet in cases 1 and 2 require complete placement of the inlet, which results in large engineering and cost requirements. Under comprehensive consideration, setting a new guide plate is the only acceptable choice.
The operation state was observed after the modification, and the operating data were recorded. The data of the typical power regulating process are shown in
Figure 18. In the regulating process, the output power of each unit changed over time. The data show that there were no obvious fluctuations, even in the regulation process.
The generation unit operated stably for a long time after modification. It can be concluded that the power output fluctuation problem has been solved.
5.2. Summary of the Measures
Although only the measure to set a new guide plate was conducted, the simulation results of other cases are also helpful in the design of the division system with a common penstock. It can be summarized from these cases that there are two parameters that have great influences on the flow stability in a division system with a trifurcation: (1) the ratio between the inlet diameter and the trifurcation diameter and (2) the difference between the velocity in the inlet and outlet.
- (1)
The ratio between the inlet diameter and the trifurcation diameter.
The measures in cases 1, 2 and 3 aimed to decrease the ratio value. The results prove that the smaller ratio led to a more stable flow pattern. This measure controls the expansion of the flow in the connection of inlet and trifurcation. The results demonstrate that, in the design of division system with trifurcation, it is important to choose a reasonable ratio value.
- (2)
The difference between the velocity in the inlet and outlet.
In cases 1 and 2, the flow velocity in inlet decreased. The velocity in case 3 was the same as in case 0, while the geometry of the models was different. The flow was stable when the velocity in the inlet was smaller than in the outlets. The values of velocity in the inlet and outlet in these cases are shown in
Table 5.
The rank of stability is the same as the rank of velocity difference. When the velocity in the outlet is bigger than the inlet, the water flow will accelerate through the trifurcation into the outlets. With little water staying in the trifurcation, the collisions will be reduced and lead to stable operation.
6. Conclusions
In this paper, pressure fluctuations were found to be caused by design defects in the division system. Several optimizing measures were proposed and proved to be effective by CFD. The measure to set a new guide plate was put into practice, and after modification, the power station was able to operate steadily and economically.
The power output fluctuation problem illustrates that the irrational structure of conduit system has a negative effect on the steady operation of the unit. Further study on the dynamic stability of the flow pattern in the diversion system is necessary in the design stage, instead of only concentrating on the hydraulic loss in trifurcation.
Some rules are summarized from the simulation results and can be referenced in the design of the division system with trifurcation. The small ratio between the inlet diameter and trifurcation diameter is favorable for the steady flow in a pipe system. Additionally, the collisions in trifurcation are restrained when the flow velocity in outlets is greater than that in the inlets.


