1. Introduction
With an increasing number of electric vehicles (EVs), an improved charging infrastructure is required in order to deliver the necessary energy for mobility while at the same time reducing the costs of operating said infrastructure. For the development of such charging systems, developers have to optimize a number of system parameters like the number, location, and type of charging stations (CSs). A key factor in this analysis is an accurate representation of customers and their charging requirements. In the majority of prior literature (for example [
1,
2], see also [
3,
4]), customers were modeled passively via their charging process with an arrival and departure time of the car plus an energy requirement. These values are typically described as a Gaussian probability distribution with a defined mean and variance. An example customer could be described as arriving at the charging station at 9:00 h
min, leaving at 17:30 h
min, and requesting
kWh energy. For example, the work in [
5] studied the psychological aspects concerning the charging behavior of electric vehicle drivers. During a six-month study with 79 EV users, charging data were collected. Typically, users drove almost 40 km per day and recharged three times weekly, with a high remaining battery energy level at the time of charging.
This approach has a number of benefits. It requires limited information about customers, can easily be scaled, has a low computational expense (data tables can be computed upfront) and is easy to investigate. The drawback is that with increasing numbers of customers, normal distributed variations level out, thus only covering average conditions, potentially overlooking rare, but serious extreme conditions. In addition, as we will show in this work, there are individual effects that cannot be accurately modeled with the conventional approach. In order to show this, we extend the standard approach for modeling EV customers in two separate steps. In a first step, we introduce an EV sensitivity to the current weather conditions. We assume that under very cold or hot conditions, EVs have an increased energy demand, requiring more energy than usual (e.g., due to air conditioning, heating, or battery properties). The quality of the charging process is evaluated using a customer satisfaction indicator (CSI) that compares the result of the charging process (the reached SoC) with the customer requirements. We hypothesize that depending on the increase in energy demand, the mean CSI degrades on certain days. We call this the Temp scenario. The second studied extension (CSI sensitive) is that we assume that customers have a memory of past charging sessions, in the form of CSI values. If CSI values degrade below a threshold, customers will stop using the charging station, and the system will be used by fewer EVs.
The study system used in this work is a charging infrastructure of a medium-sized company. We assume that some of the employees are using EVs to commute and use the low-cost electricity at the company for most of their charging demands. In order to minimize CO emissions, the company uses a large-scale PV system to generate inexpensive, CO -free energy for the charging station, supported by a low level of grid power. The drawback of the approach is that during days without sunshine, only a small level of extra charging power from the grid is available. This approach minimizes CO emissions and energy costs (especially peak load costs), but is sometimes not able to satisfy all customer (EV user) demands.
The practical implementation of customer models that respond to external conditions and historical data is done via a multi-agent system (MAS) approach, where each customer, electric vehicle (EV), and charging station (CS) is represented as a computer program that can respond to current and past conditions. Using this approach, it is possible to replicate the conventional approach with normal randomly-distributed requests, but also to investigate other more realistic scenarios. In our study, we employ the NetLOGO framework.
Using the baseline and the two extended scenarios, we show how the characterized modeling framework can lead to new perspectives and insights on the more complex interactions between charging infrastructure systems and their customers.
1.1. Related Work
Multi-agent systems have been used intensively in recent year in the energy sector. In [
4], the impact of the variation of charging prices on the behavior of electric vehicle users was investigated, comparing benefits when using variable and fixed charging prices. With the goal of generating a realistic population of customers, an EV usage simulator was developed that models the effects of city size. Offering variable prices showed good results and could be a promising approach where EV users have different prices when deciding the location of their next charging spot.
Xydas et al. [
6] built a MAS for charging controllers and EVs. The objective of the controller was to operate the CS in order to perform peak shaving, valley filling, maximizing income, and for the EV to minimize costs in two different scenarios, one where the agent is reacting to variations of electricity prices, and one for charging processes irrespective of price signals. The aim of the research presented in [
7] was to measure user satisfaction and their adaptability to new vehicle technologies (specifically, full electric vehicles). The work in [
8] presented a simulation framework for electric vehicles in terms of energy consumption. In [
9], vehicle behavior was simulated by an agent-based transportation simulation tool with detailed routes on a map of Zurich for the simulation of vehicle behavior with realistic vehicle energy consumption profiles. The approach uses multi-agent transportation simulation (MATSim). Sweda et al. [
10] looked at the strategic investment in new charging infrastructure considering private EV usage and driving patterns. The study was done using an MAS to simulate user behaviors.
1.2. Multi-Agent Simulation Systems
In the literature, different MAS frameworks have been employed. In [
11], the authors used an MAS for investigating the issue of avoiding grid congestion in scenarios with a large number of EVs. The simulation was based on the JACK framework in conjunction with MATLAB/Simulink.
In [
12], the authors briefly summarized multi-agent simulation tools and specifically evaluated MASON and NetLOGO via a test implementation for human modeling (We briefly cite one of their main conclusions: “NetLOGO has proved its reputation as an ABS platform where the simulation models can be implemented quickly and straightforwardly. …Had we simply looked for a handy standalone agent-based simulation tool for a limited number of agents, NetLOGO easily could have been our choice…”). NetLOGO was also employed in [
13] to simulate human behavior.
Another comparison study on MAS tools as [
14]. They also came to the conclusion that NetLOGO was surprisingly efficient for the task (“Perhaps because NetLOGO is clearly designed for one type of model (
Section 3.1) and uses a simplified language, scientists tend to assume it is too limited for serious ABMs. We originally intended to exclude NetLOGO as too limited for full treatment in this paper, but found we could implement all our test models (
Section 2.1) in NetLOGO, with far less effort than for other platforms.”).
2. Methods
In this section, we outline the relevant components of the tool chain, the first being the simulation environment for the energy system, which employs a commercial tool (SimulationX [
15]) based on the Modelica [
16] standard. The simulation communicates via a functional mockup interface (FMI) [
17] with two external programs, the charging controller implemented in Python and the multi-agent simulation tool NetLOGO.
2.1. Modelica Simulation Environment
SimulationX is a multi-physics program package for modeling, calculation, simulation, optimization, and reliability analysis of technical components and systems. It is based on the object-oriented programming language Modelica and supports the standardized interface FMI for communication between SimulationX and external programs. We also employed the GreenCity extension library that contains components for the simulation of a complete energy system with a focus on renewables. The main benefit of this simulation approach is that the engineering know-how implemented in the library can easily be accessed so that developers can directly focus on their key research areas (for example, controller development). Simulations of a complete year run on time-scales of seconds to minutes and can be parallelized for parameter optimization [
18].
2.2. Functional Mockup Interface
FMI is a software standard to facilitate co-simulation approaches in complex simulation tasks involving several domains. The basic idea of FMI within a co-simulation is to integrate two or more simulation tools into a common simulation environment. The data exchange takes place at defined communication times. In the time between the communication points, the tools simulate their models independently of each other. A component that has implemented the FMI standard is called an FMU. The FMU is a compressed archive file (*.fmu) containing a model description and the corresponding libraries (*.dll). For more information, see [
17,
19] or
www.fmi.org.
2.3. Charging Controller
The charging controller is a tool written in Python. It contains all the parameters of the charging processes and is responsible for controlling the charging processes according to predefined algorithms The controller thus receives information on the physical conditions of the charging stations, the physical parameters of the arriving vehicles, and information on the usage of the charging station.
3. Multi-Agent Simulator
This section briefly describes the basics of multi-agent simulation (MAS). NetLOGO was chosen as the tool for the implementation of the MAS, which will be explained further below. In
Section 3.3, the most important elements of the programmed MAS are presented concisely.
3.1. Basic MAS Philosophy
Multi-agent systems are comprised of autonomously-operating agents and the environment in which they are located. The goal of the systems is to solve complex problems through specializations and division of labor. Well-known examples from biology are bee swarms and ant colonies. In these collectives, a clear differentiation takes place between the individual member groups. In the MAS, an agent can be defined as a “[…] separable and definable software unit, that interacts flexibly and autonomously with its environment and other agents, so as to achieve the predefined goals of the user or developer, ultimately adhering to his interests.” (translated from [
20], see also [
21]).
3.2. NetLOGO
NetLOGO is an independent programming language, which includes a programming environment that is, however, fundamentally based on JAVA. This tool offers the possibility to be accessed by superordinate JAVA programs. We integrated it into co-simulation by creating a wrapper software which accesses the NetLOGO API and wraps it into an FMU (functional mock-up unit). A main disadvantage is the limited visual representation of the simulation. Methods need to be programmed independently; however, the programming language can be quickly learned by novices. This tool has gained popularity in the fields of teaching and research. NetLOGO contains a large library of complete exemplary models that can be used and expanded (the download of the software and further information can be found on the following website:
http://ccl.northwestern.edu/netlogo/index.shtml).
3.3. Key Features of Our Implementation
The model contains three different agent types and a model environment. All agent types differentiate themselves in their fundamental characteristics, features, actions, and their communication. Of each agent type, multiple individual agents can exist. In this specific model example, 30 agents of the type “e-vehicle”, 21 agents of the type “charging point”, and 30 of the “driver” agent type were implemented. The model additionally contains the “environment”. This encapsulates all actions and parameters that are agent independent or not agent specific (e.g., time of day).
The agent “driver”, largely simplified, represents the human driver. He/she uses his/her vehicle and the appropriate charging infrastructure to accomplish his/her daily routine. The daily routine is based on statistical and normal distributed random numbers. The emphasis is on getting from A to B with sufficient battery capacity. This means that a vehicle does not charge at every opportunity, but only when the driver considers it necessary. In concrete terms, this is implemented in that a charging decision is made when the SoC falls below an individual threshold value . This threshold value depends on where the vehicle is located, meaning whether it charges at the company ( = 75%) or at an external charging infrastructure ( = 20%). The agent “e-vehicle” (EV) is a digital representation of a real electric vehicle. These agents have a reduced pool of parameters, which are necessary for the simulation. These include information on charging infrastructure, consumption, and charging status. The vehicles have rudimentary functions such as “driving”, “parking”, and “loading”. Within these methods, the vehicle’s batteries are emptied or charged accordingly. Furthermore, simulation-relevant information such as ambient temperature or charging power is transmitted to the agent via the FMU. The agents of the type “charging point” (CP) each represent a single charging point in the real charging infrastructure. These agents have individual charging parameters, allowing the “driver” agents to charge the “e-vehicle” agents if the parameters match between EV and CP. Particularly important is the role of the CP agent as the model interface enabling the saving and export of all the charging process information from the model.
4. Scenarios
In this work, we shall compare three different scenarios, based on different customer behavior. The first scenario represents conventional static usage profiles based on normal distributed charging demands. This type of customer modeling could be implemented without an MAS approach; however, we decided to also employ our MAS framework for better comparability. The second scenario is a minor extension of the basic scenario where the energy demand on hot or cold days is increased. We assume that for technical reasons, the energy demand of the EV increases due to the battery chemistry or additional A/C and heating demand. In the third scenario, the customer shall stop using our charging infrastructure if past charging processes were not to the customer’s liking. This is modeled by a customer satisfaction indicator that is computed based on the difference of targeted and actual reached SoC for past charging sessions. The assumption is that if the charging infrastructure repeatedly failed to charge the EV to the requested level, the customer would switch to a different charging operator. More details on the three scenarios are given below.
4.1. Building Scenario
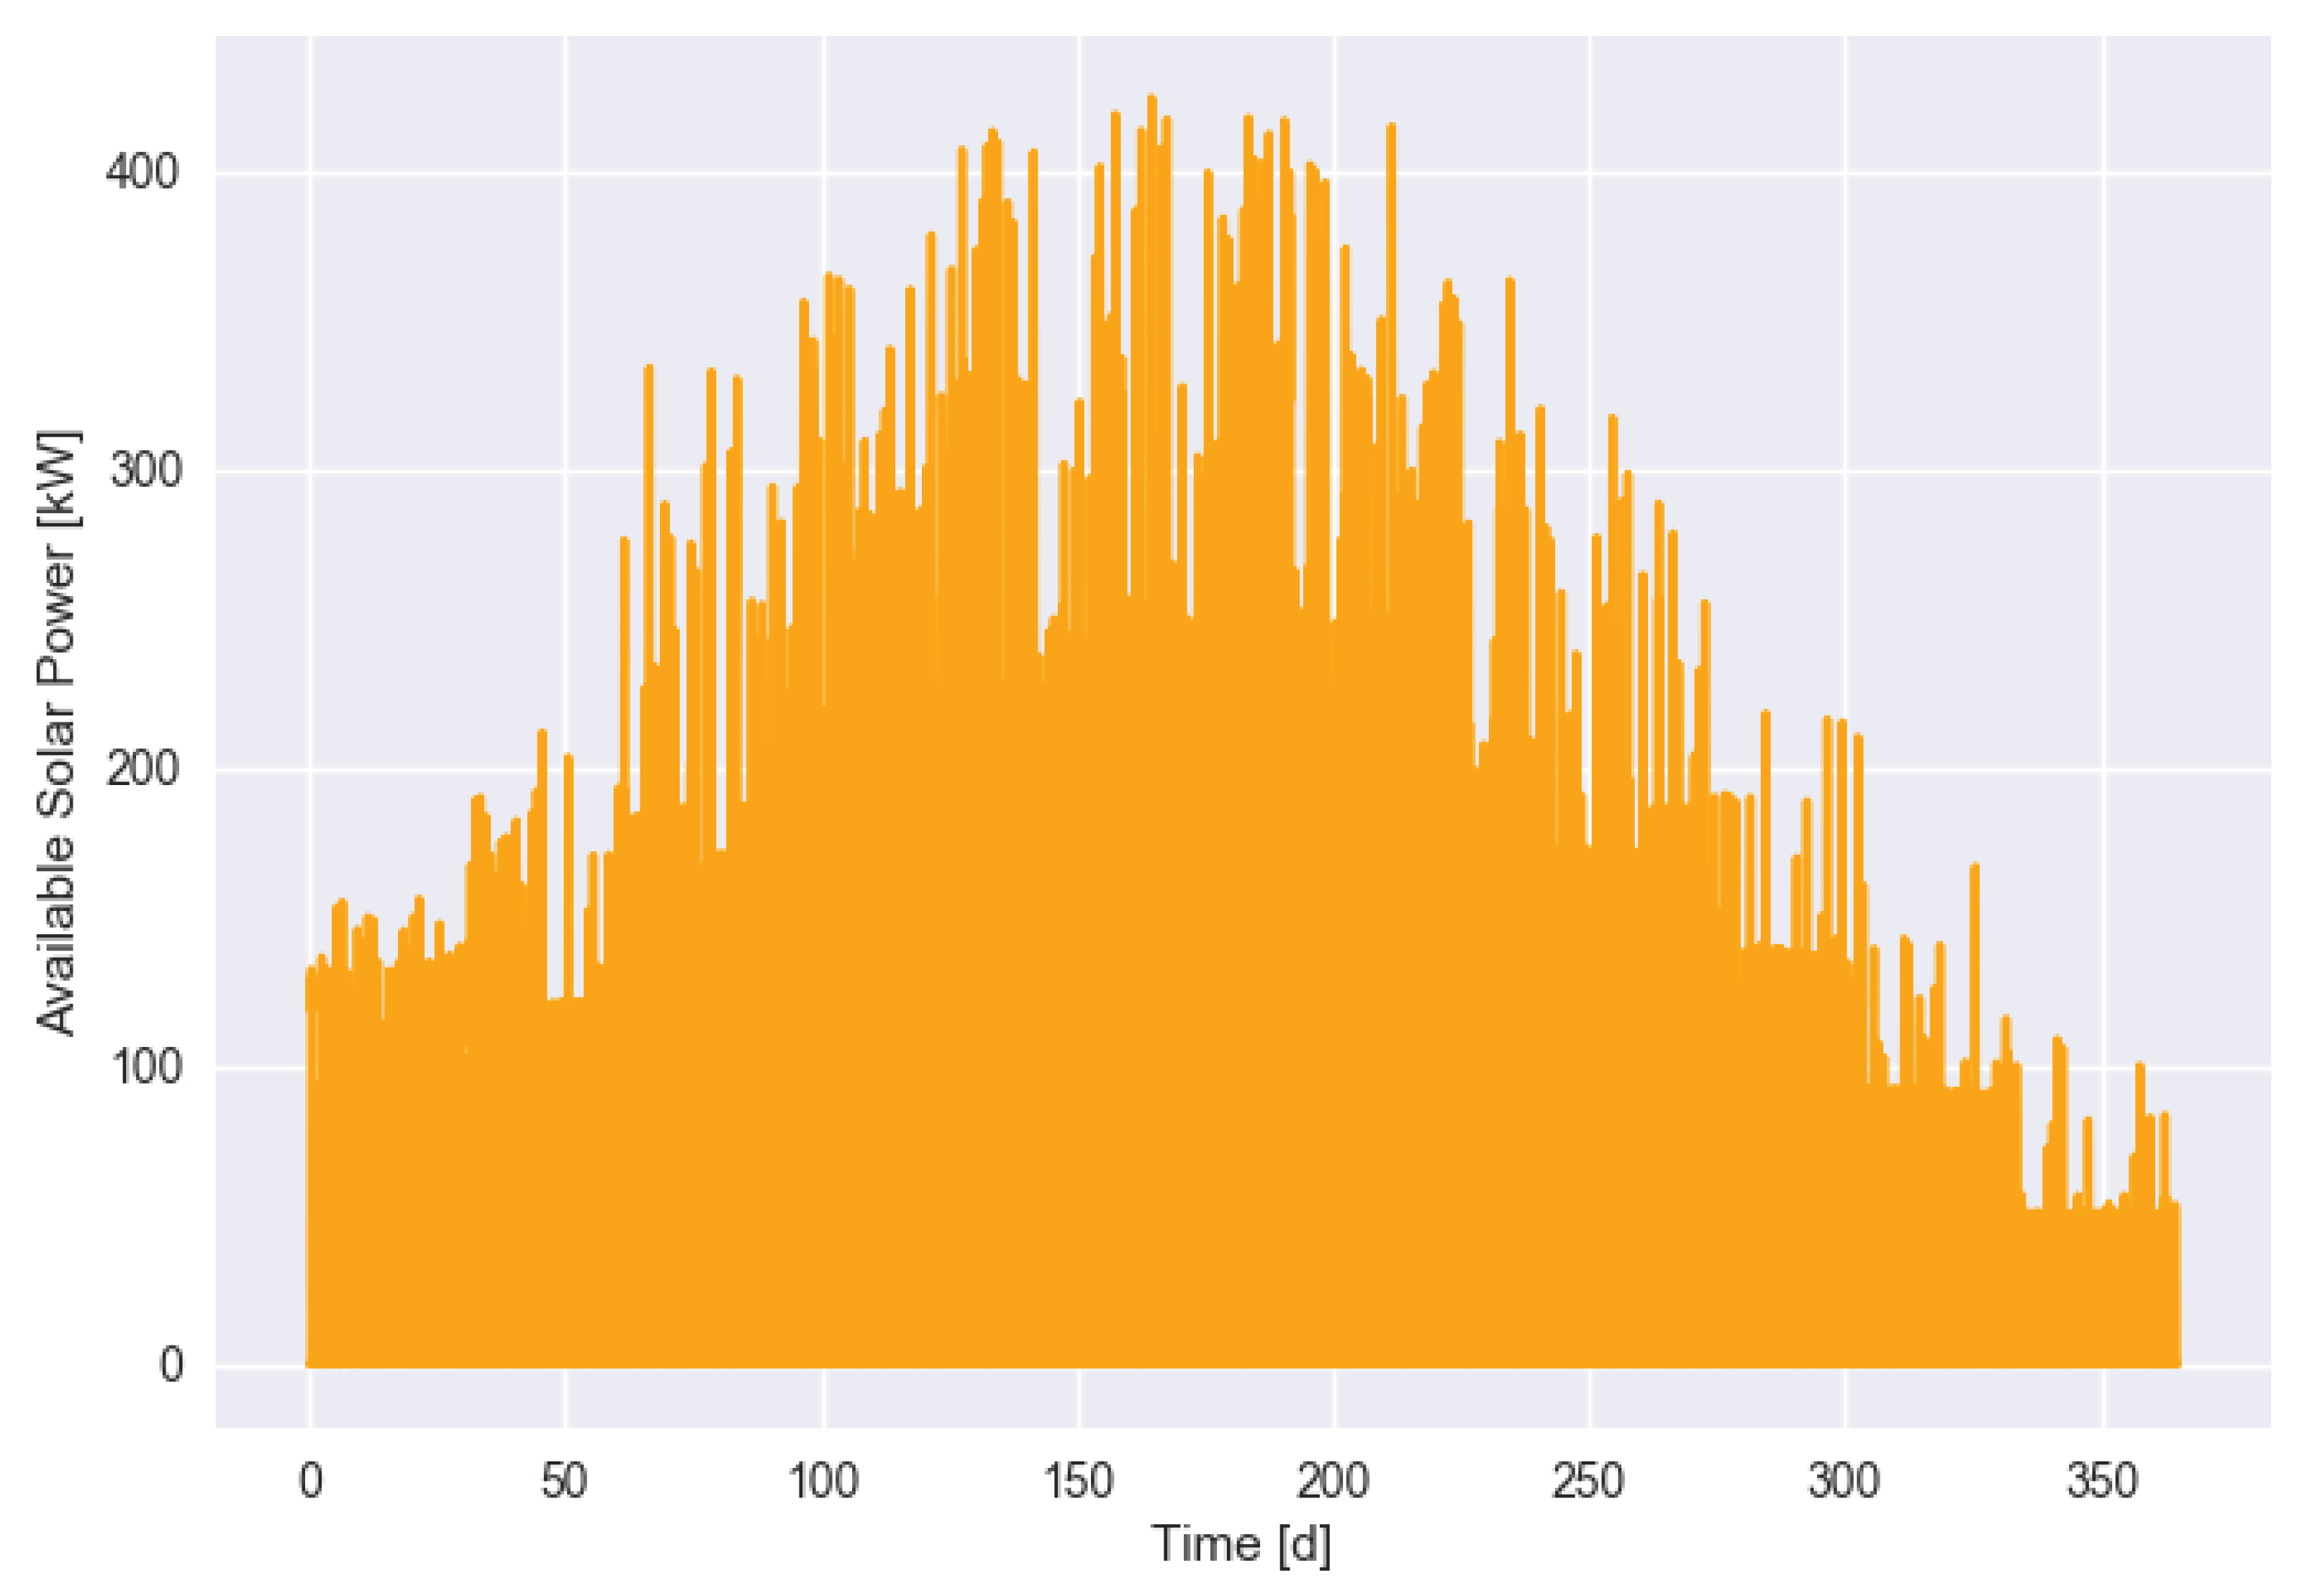
Our test system was a medium-sized company with
EVs,
charging stations, and a photovoltaic (PV) system with a peak power of
kW (for the output of the PV system over a year, see
Figure 1). The rest of the facility was not modeled in detail. Charging stations and EVs have different maximum charging power between 10 kW and 150 kW.
4.2. Charging Controller
We used a simple charging controller in this project. The controller first computes the currently available charging power:
:
where
is the current power production from the PV system and
additional power taken from the grid. In order to minimize peak loads and to reduce costs and CO
emissions, one would try to minimize
. Here, we have chosen
kW, but also consider two extreme scenarios with
kW and
MW (MAX scenario). These values were chosen to cover three interesting conditions: one where only PV power is available (
kW), which means 100% green energy, the additional availability of on average 1 kW per EV (
kW), and finally, a setting for virtually unlimited grid power (
MW). These values both span a wide range, but also appear realistic under different ecological or economic constraints.
As an example, we note that at our facility, peak costs of approximately 100 Euros/kW occur, so that should be kept as low as possible.
In the next step, the available power was evenly distributed between all EVs until they reached their target SoC. If an EV was provided with more charging power than what was technically feasible, this surplus power was returned to the system and made available for vehicles with higher potential charging power. Only when all EVs reached their target SoC values, then all vehicles were charged from the target SoC to 100%, again evenly distributed.
Note that our simple controller did not consider the current SoC in the EV to prioritize EVs with low SoC levels, since this would increase the complexity of the controller and also raise issues of fairness. We also neglected the impact of the charging strategy on the battery state of health (SOH). While the simulator performed a basic SOH modeling depending on cyclic and calendaric aging, these effects were not considered in the controller and our analysis.
4.3. Customer Satisfaction Indicator
In contrast to prior work [
22], we only employed a single function for computing the CSI value of a charging process. Based on the desired SoC given by the user (
), the SoC at the arrival (
), and the achieved SoC at the customer’s departure (
), the CSI is computed as:
4.4. Modeling Customer Behavior
In our basic scenario, we modeled EV users via their arrival time and departure time at the charging station, plus their average energy demand (specifically, the SoC at arrival ). We also assumed a fixed target SoC of 80%. For each user, the specific values for , , and were drawn from a normal distribution with mean 9:00 for arrival time, 17:00 for departure time, and for initial state of charge at arrival. The standard deviations were selected as follows: 60 min for and and 10% for .
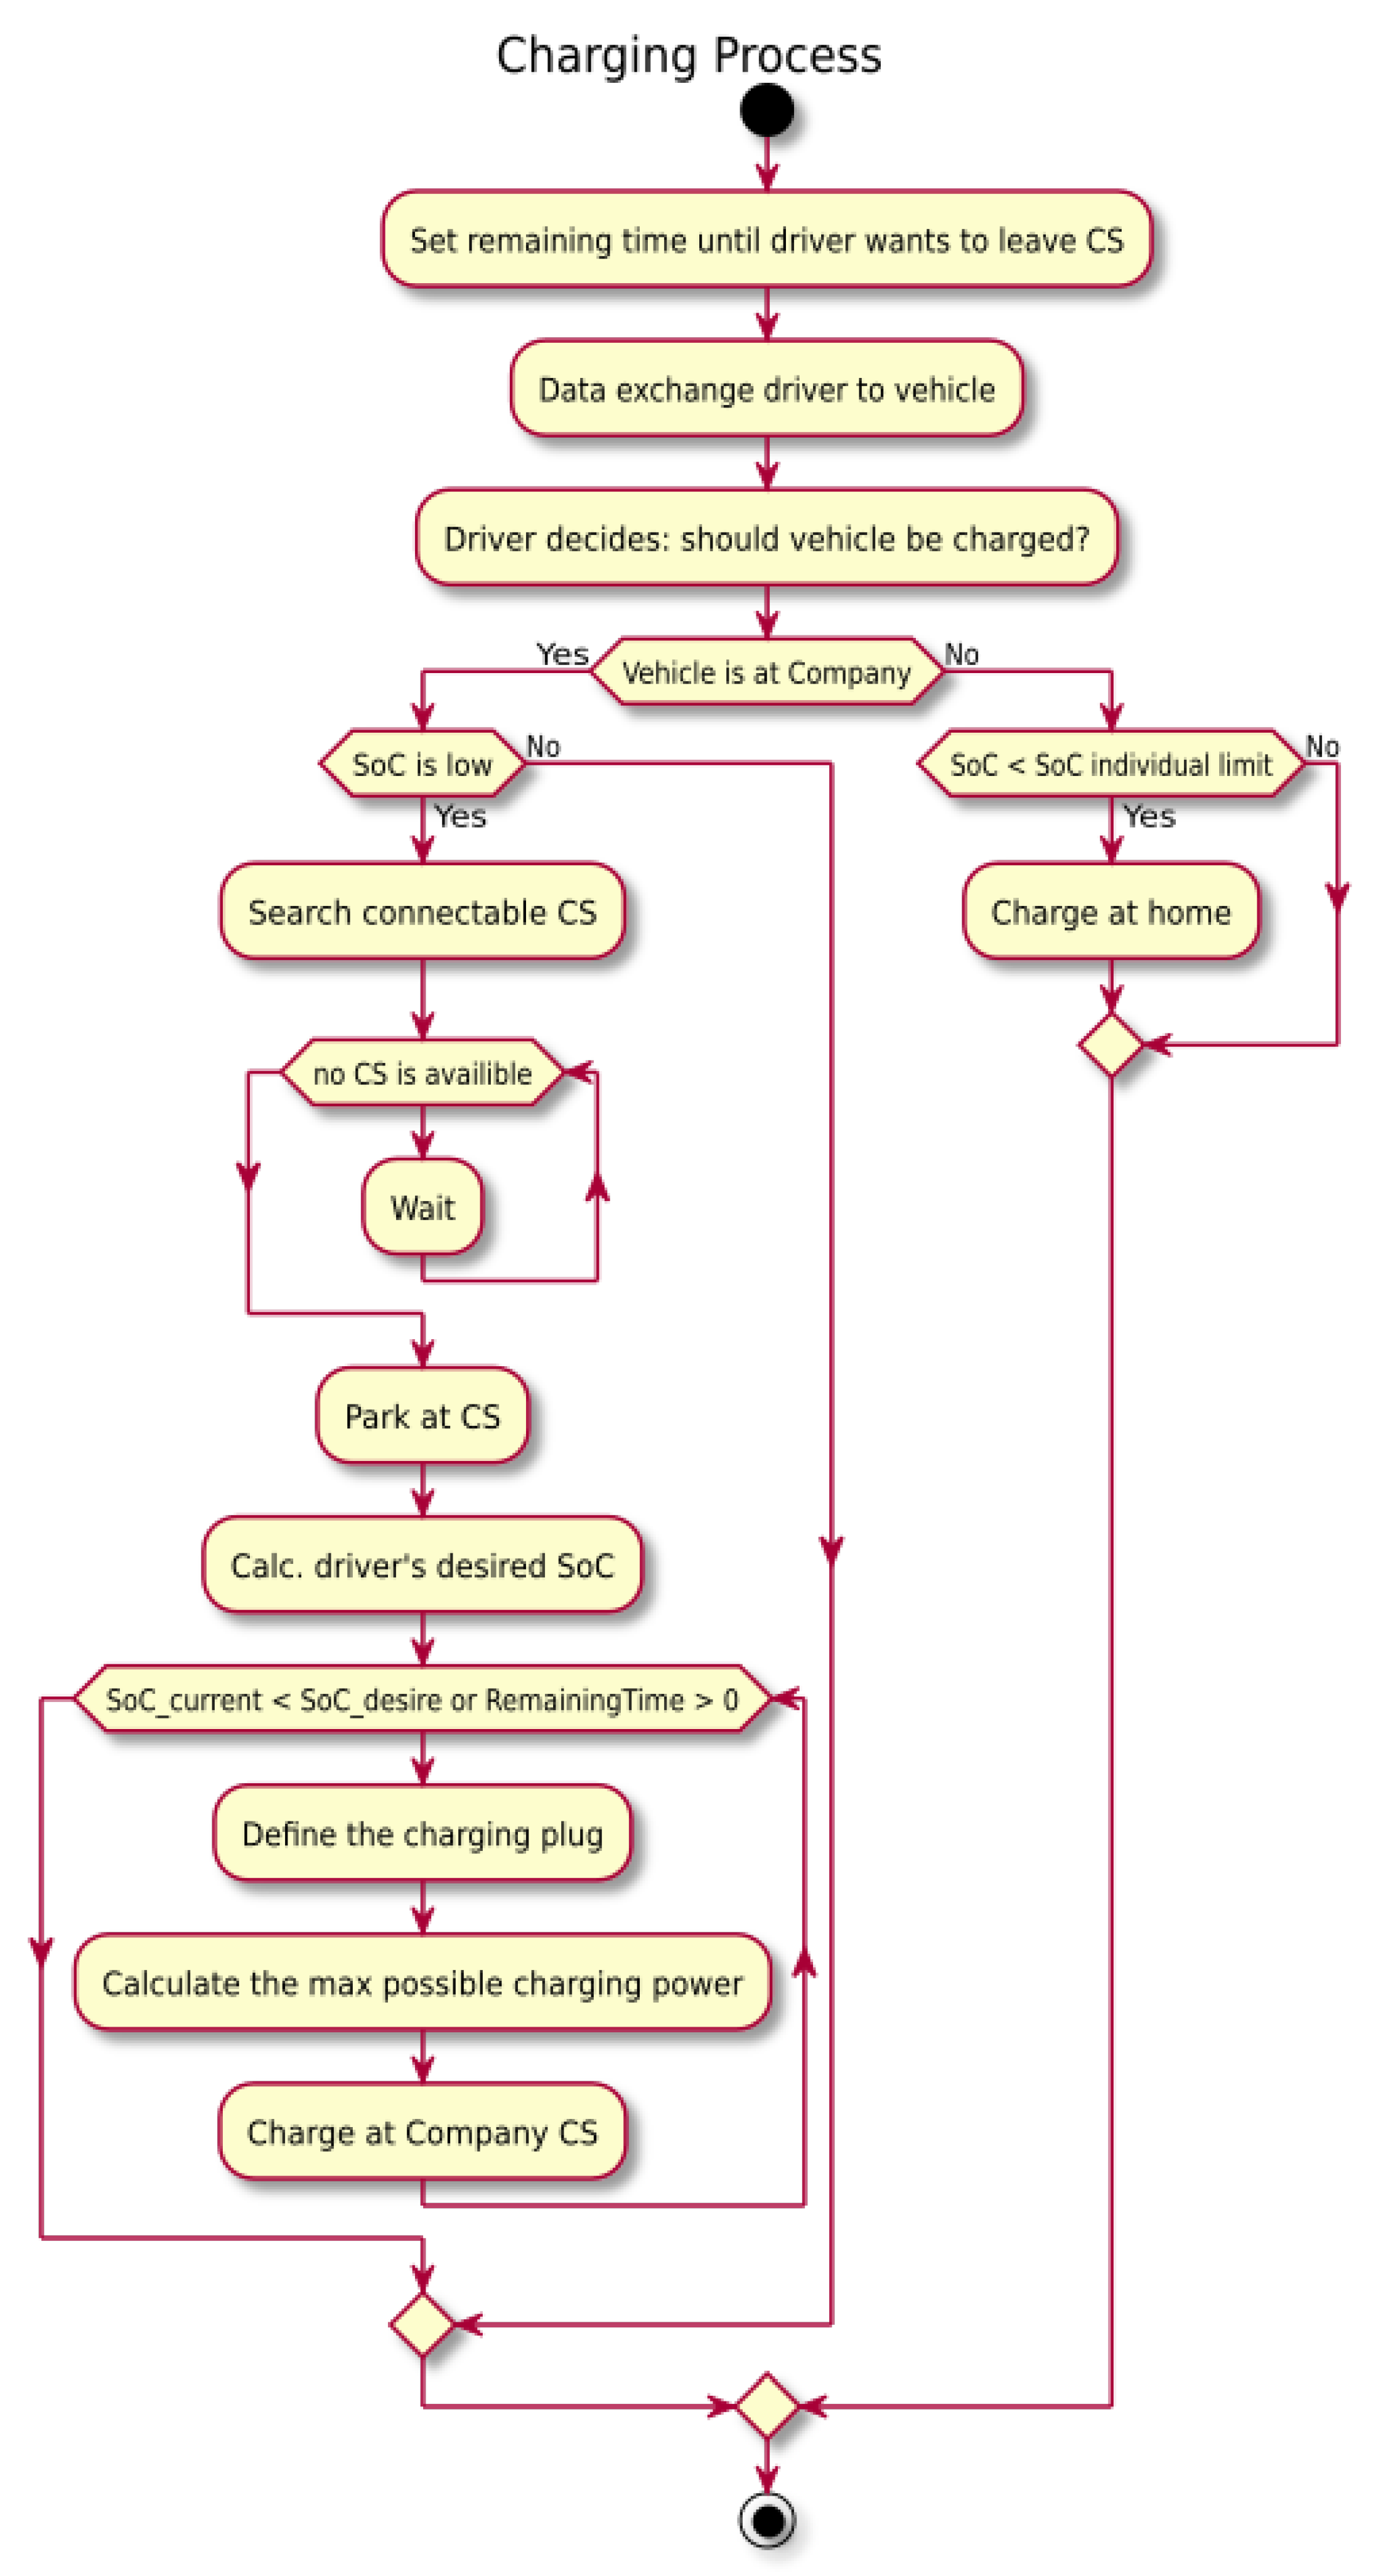
Before the start of the simulation, we first generated a set of users with the above given statistics, so that user (EV) u had an individual value , and so on. Based on these data, we calculated the charging demands for each EV and each day by determining arrival time, departure time, and initial SoC, again from a Gaussian distribution. The mean of the distribution was taken from the user characterization for each u, e.g., , with a variance that was half the inter-user variances (i.e., 30 min for and and and 5% for ).
This means that there were both variations in the average values between users, as well as daily variations. Note that in addition to charging demands, weather conditions will differ, so that typical CSI values will vary over different days. The process for computing the daily charging demands is depicted in
Figure 2. As one can see, it is also part of the user behavior that the vehicle can also be loaded externally to the company and that the user has to wait when there are not enough free charging stations. This also has an effect on
and the CSI calculation.
4.5. Extension to Weather Dependency
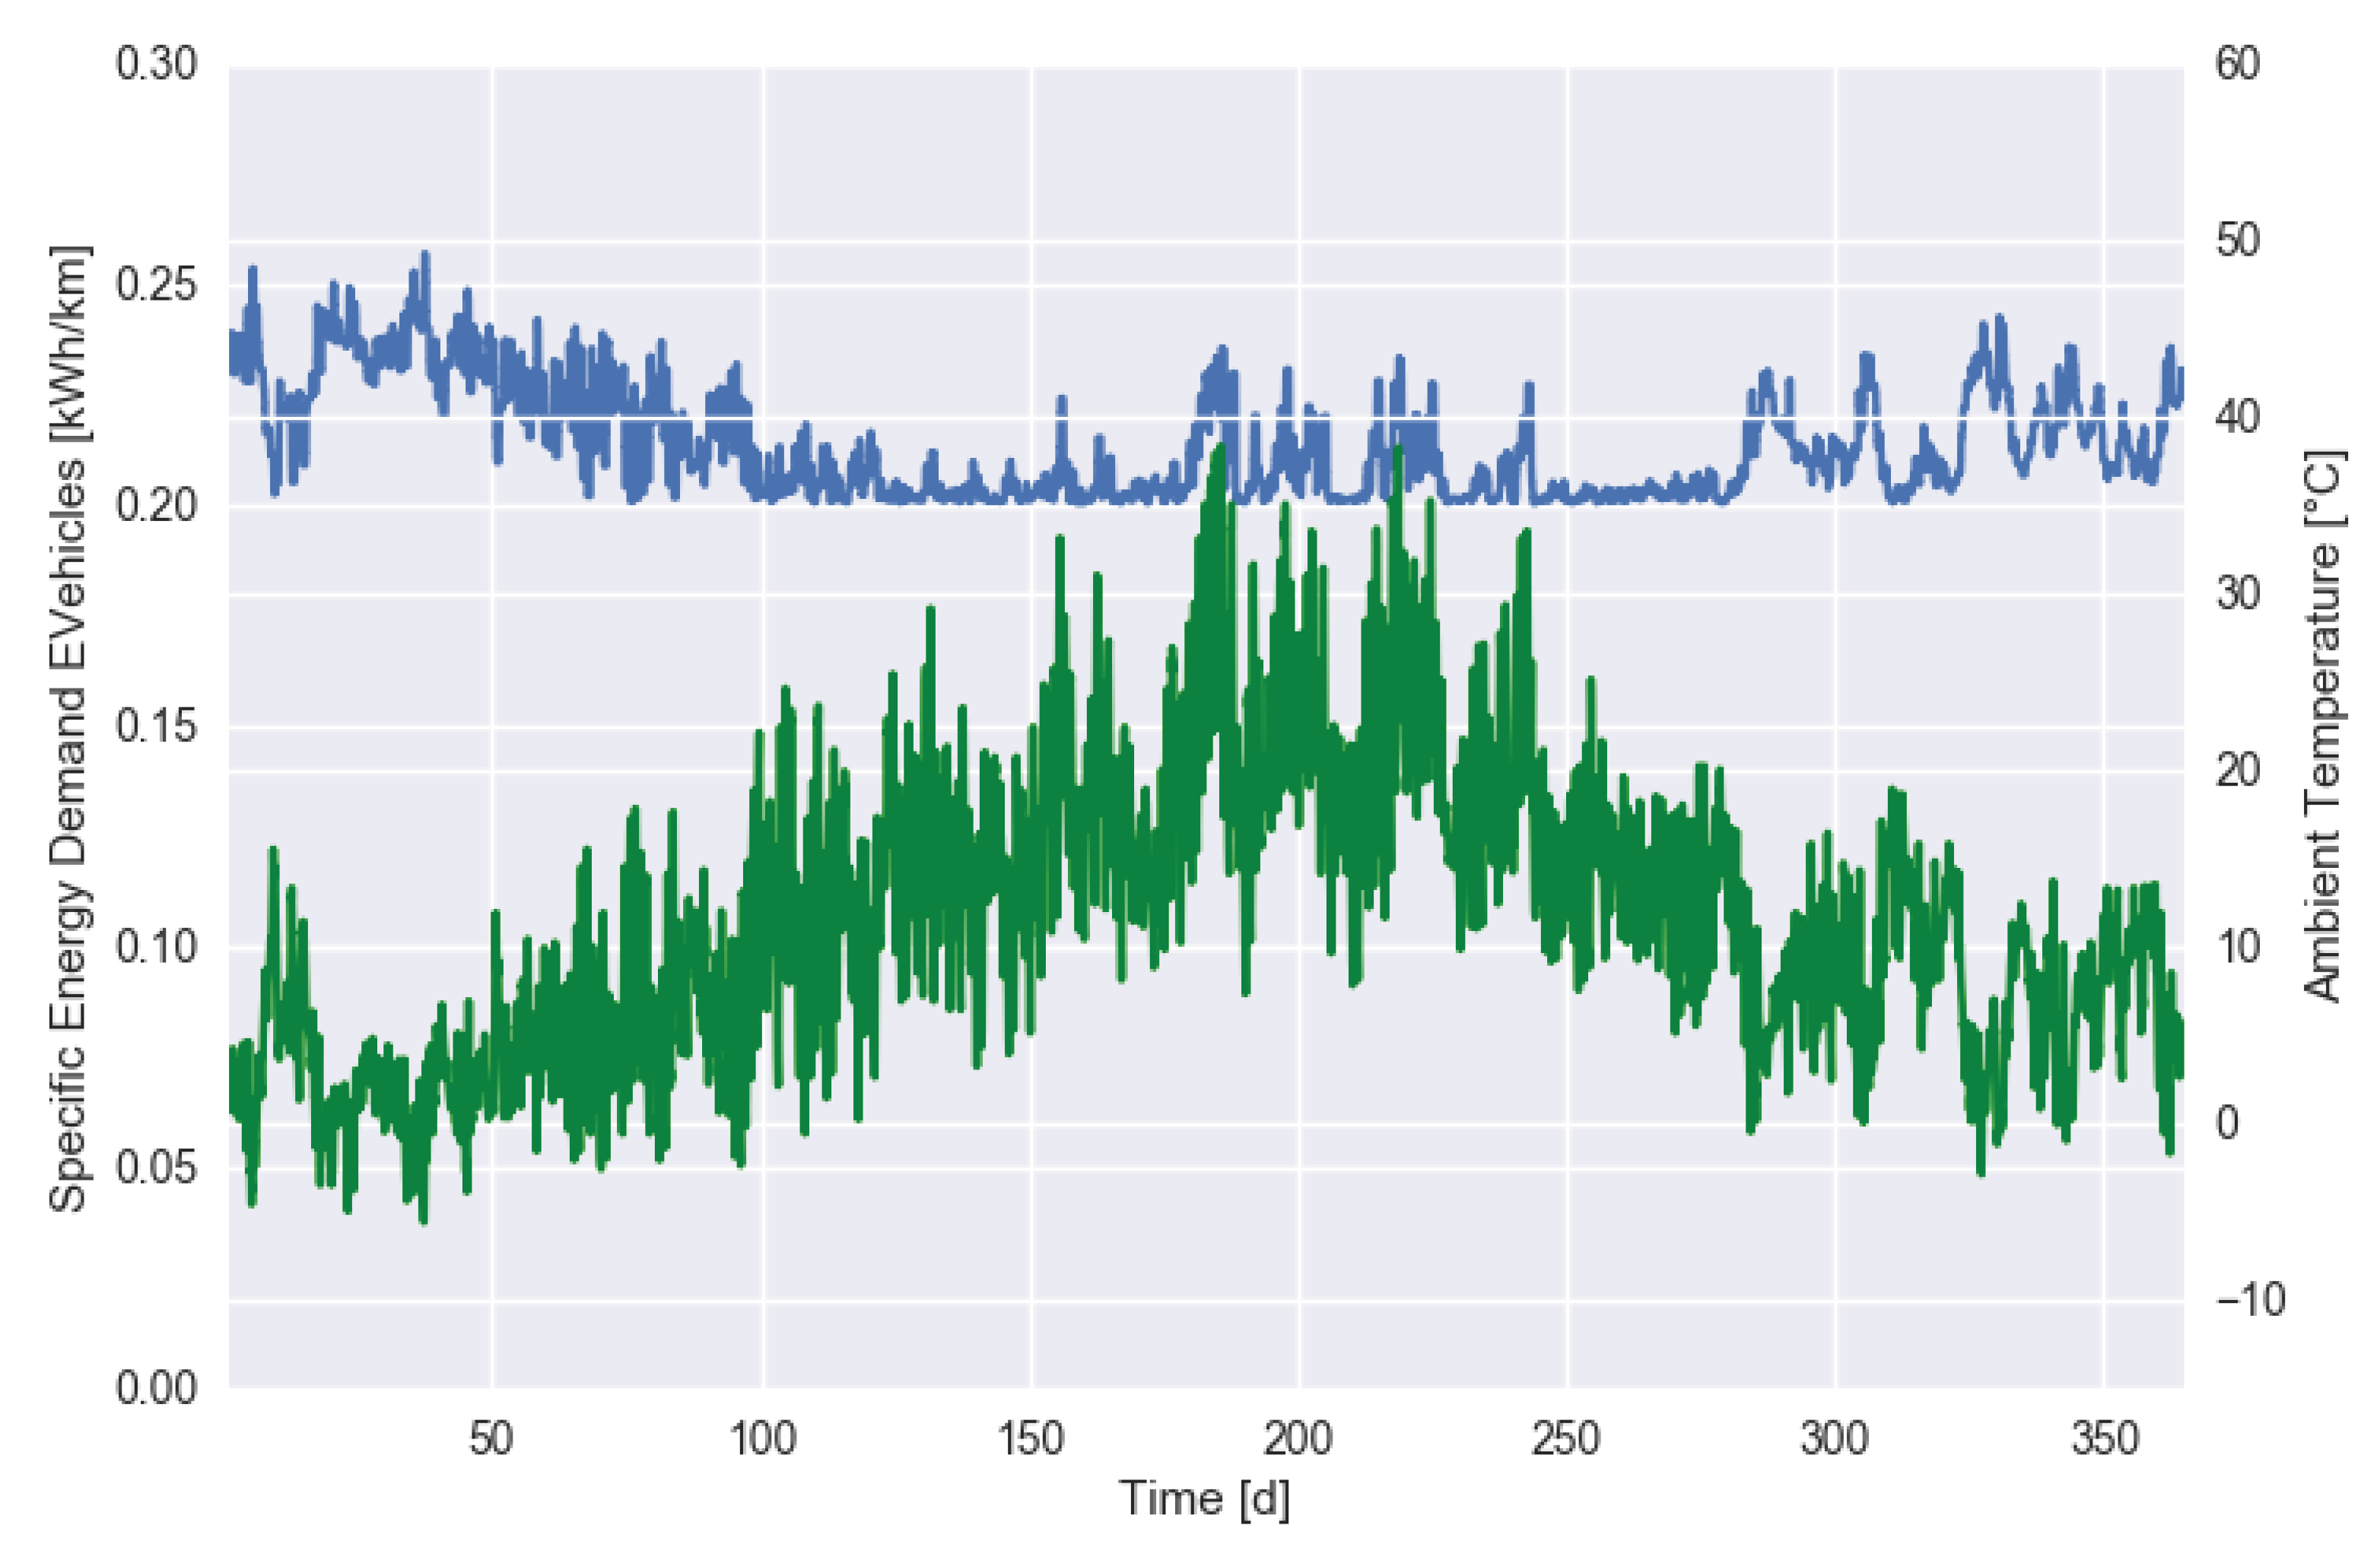
As a first extension of the basic scenario, we added a sensitivity in the charging demands to external conditions, which become visible at run-time. Specifically, we added a change in electrical energy demand of the vehicles dependent on the ambient temperature
T. For simplicity, a simple relationship between outside temperature
T and the additional vehicle energy consumption
due to air conditioning, heating, and battery behavior was assumed (see [
23,
24] for more information):
This means that vehicles with a lower SoC arrive at the charging point and more energy is needed to fully charge the battery. The relation between energy demand and outside temperature is shown in
Figure 3.
4.6. CSI Response Scenario
In the third scenario, we modeled a CSI sensitivity for all agents. After every charging process, the MAS computes the CSI value for the last charging session of each user. If for EV u, this values is under 80%, more than times, the agent u will not use the charging system anymore due to frustration. Obviously, this is a very simple scenario, but visualizes the potential impact of adaptive customer behavior.
5. Results
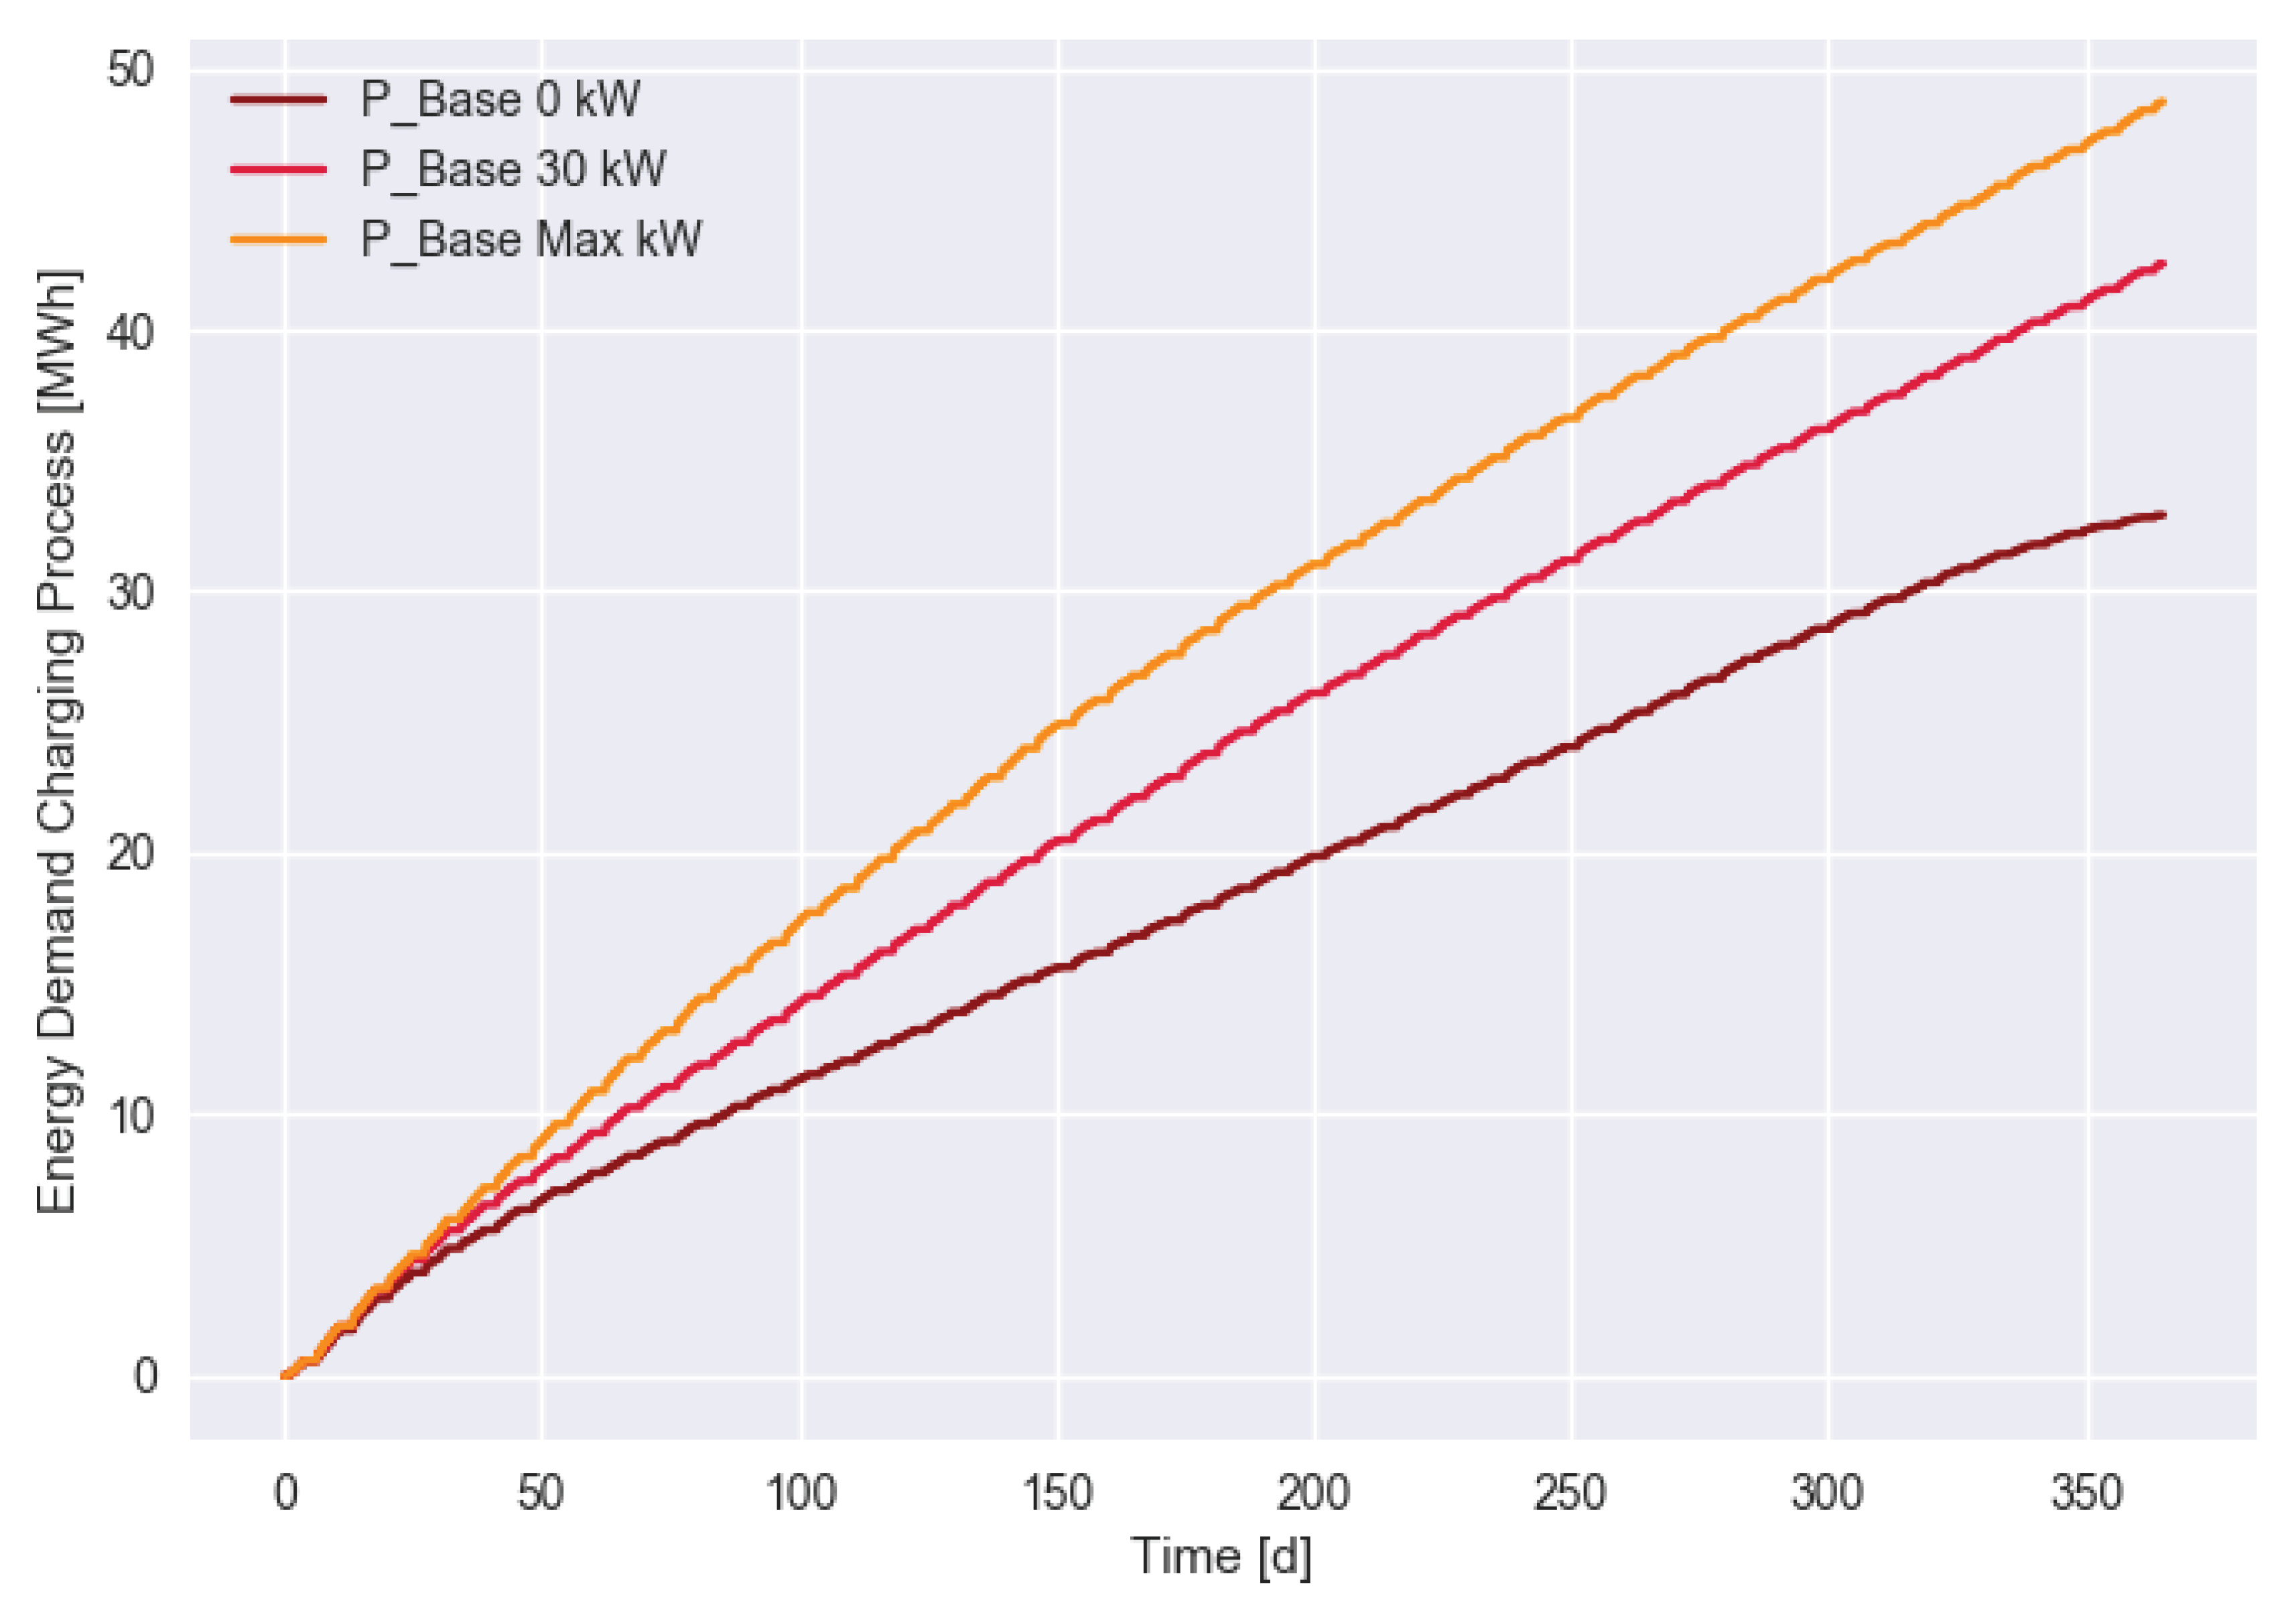
We simulated the three scenarios defined above for a complete year using weather data for a city in Germany. Now, we want to take a look at the total charged energy in the CSI scenario for different values of
in
Figure 4. We see that PV power on its own was not sufficient since the transferred energy increased substantially when
was increased. However, the selected value of
kW covered 87% of the maximum charging energy amount.
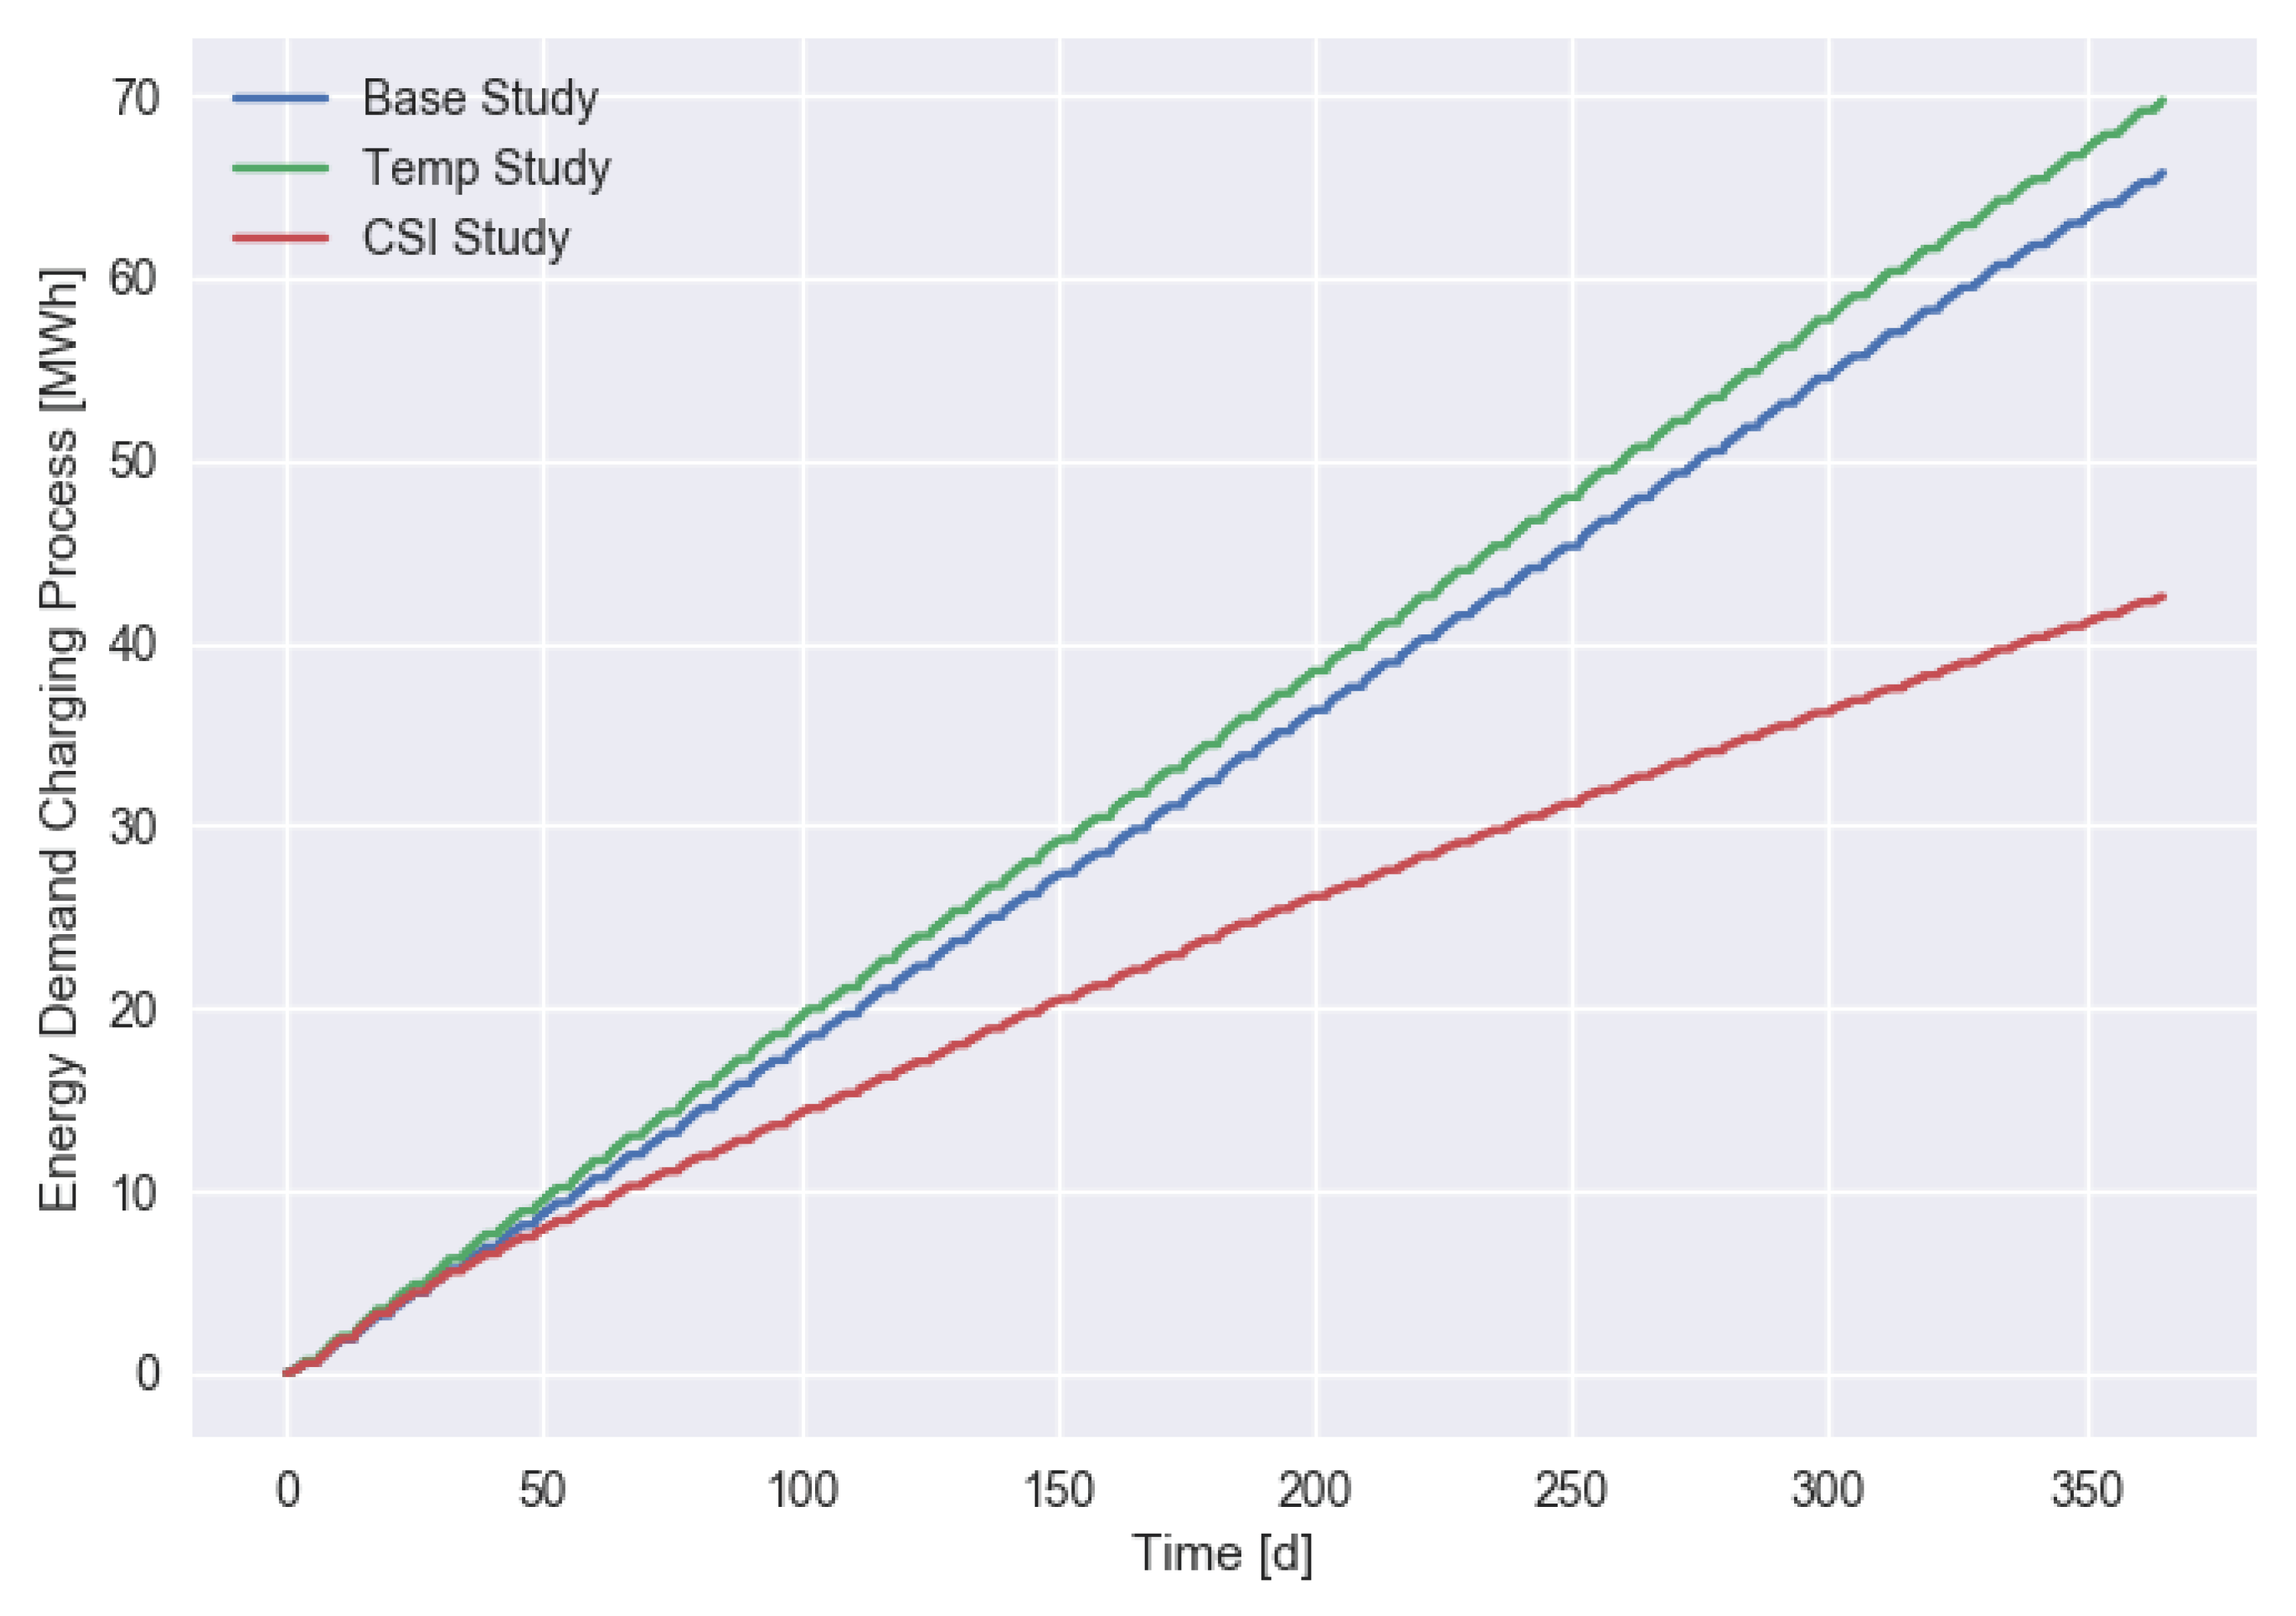
Looking at the impact of different scenarios on the total charged energy in
Figure 5, we observed a small increase in the temperature-dependent usage scenario and a strong decline to about 65% of the base demand for the CSI scenario.
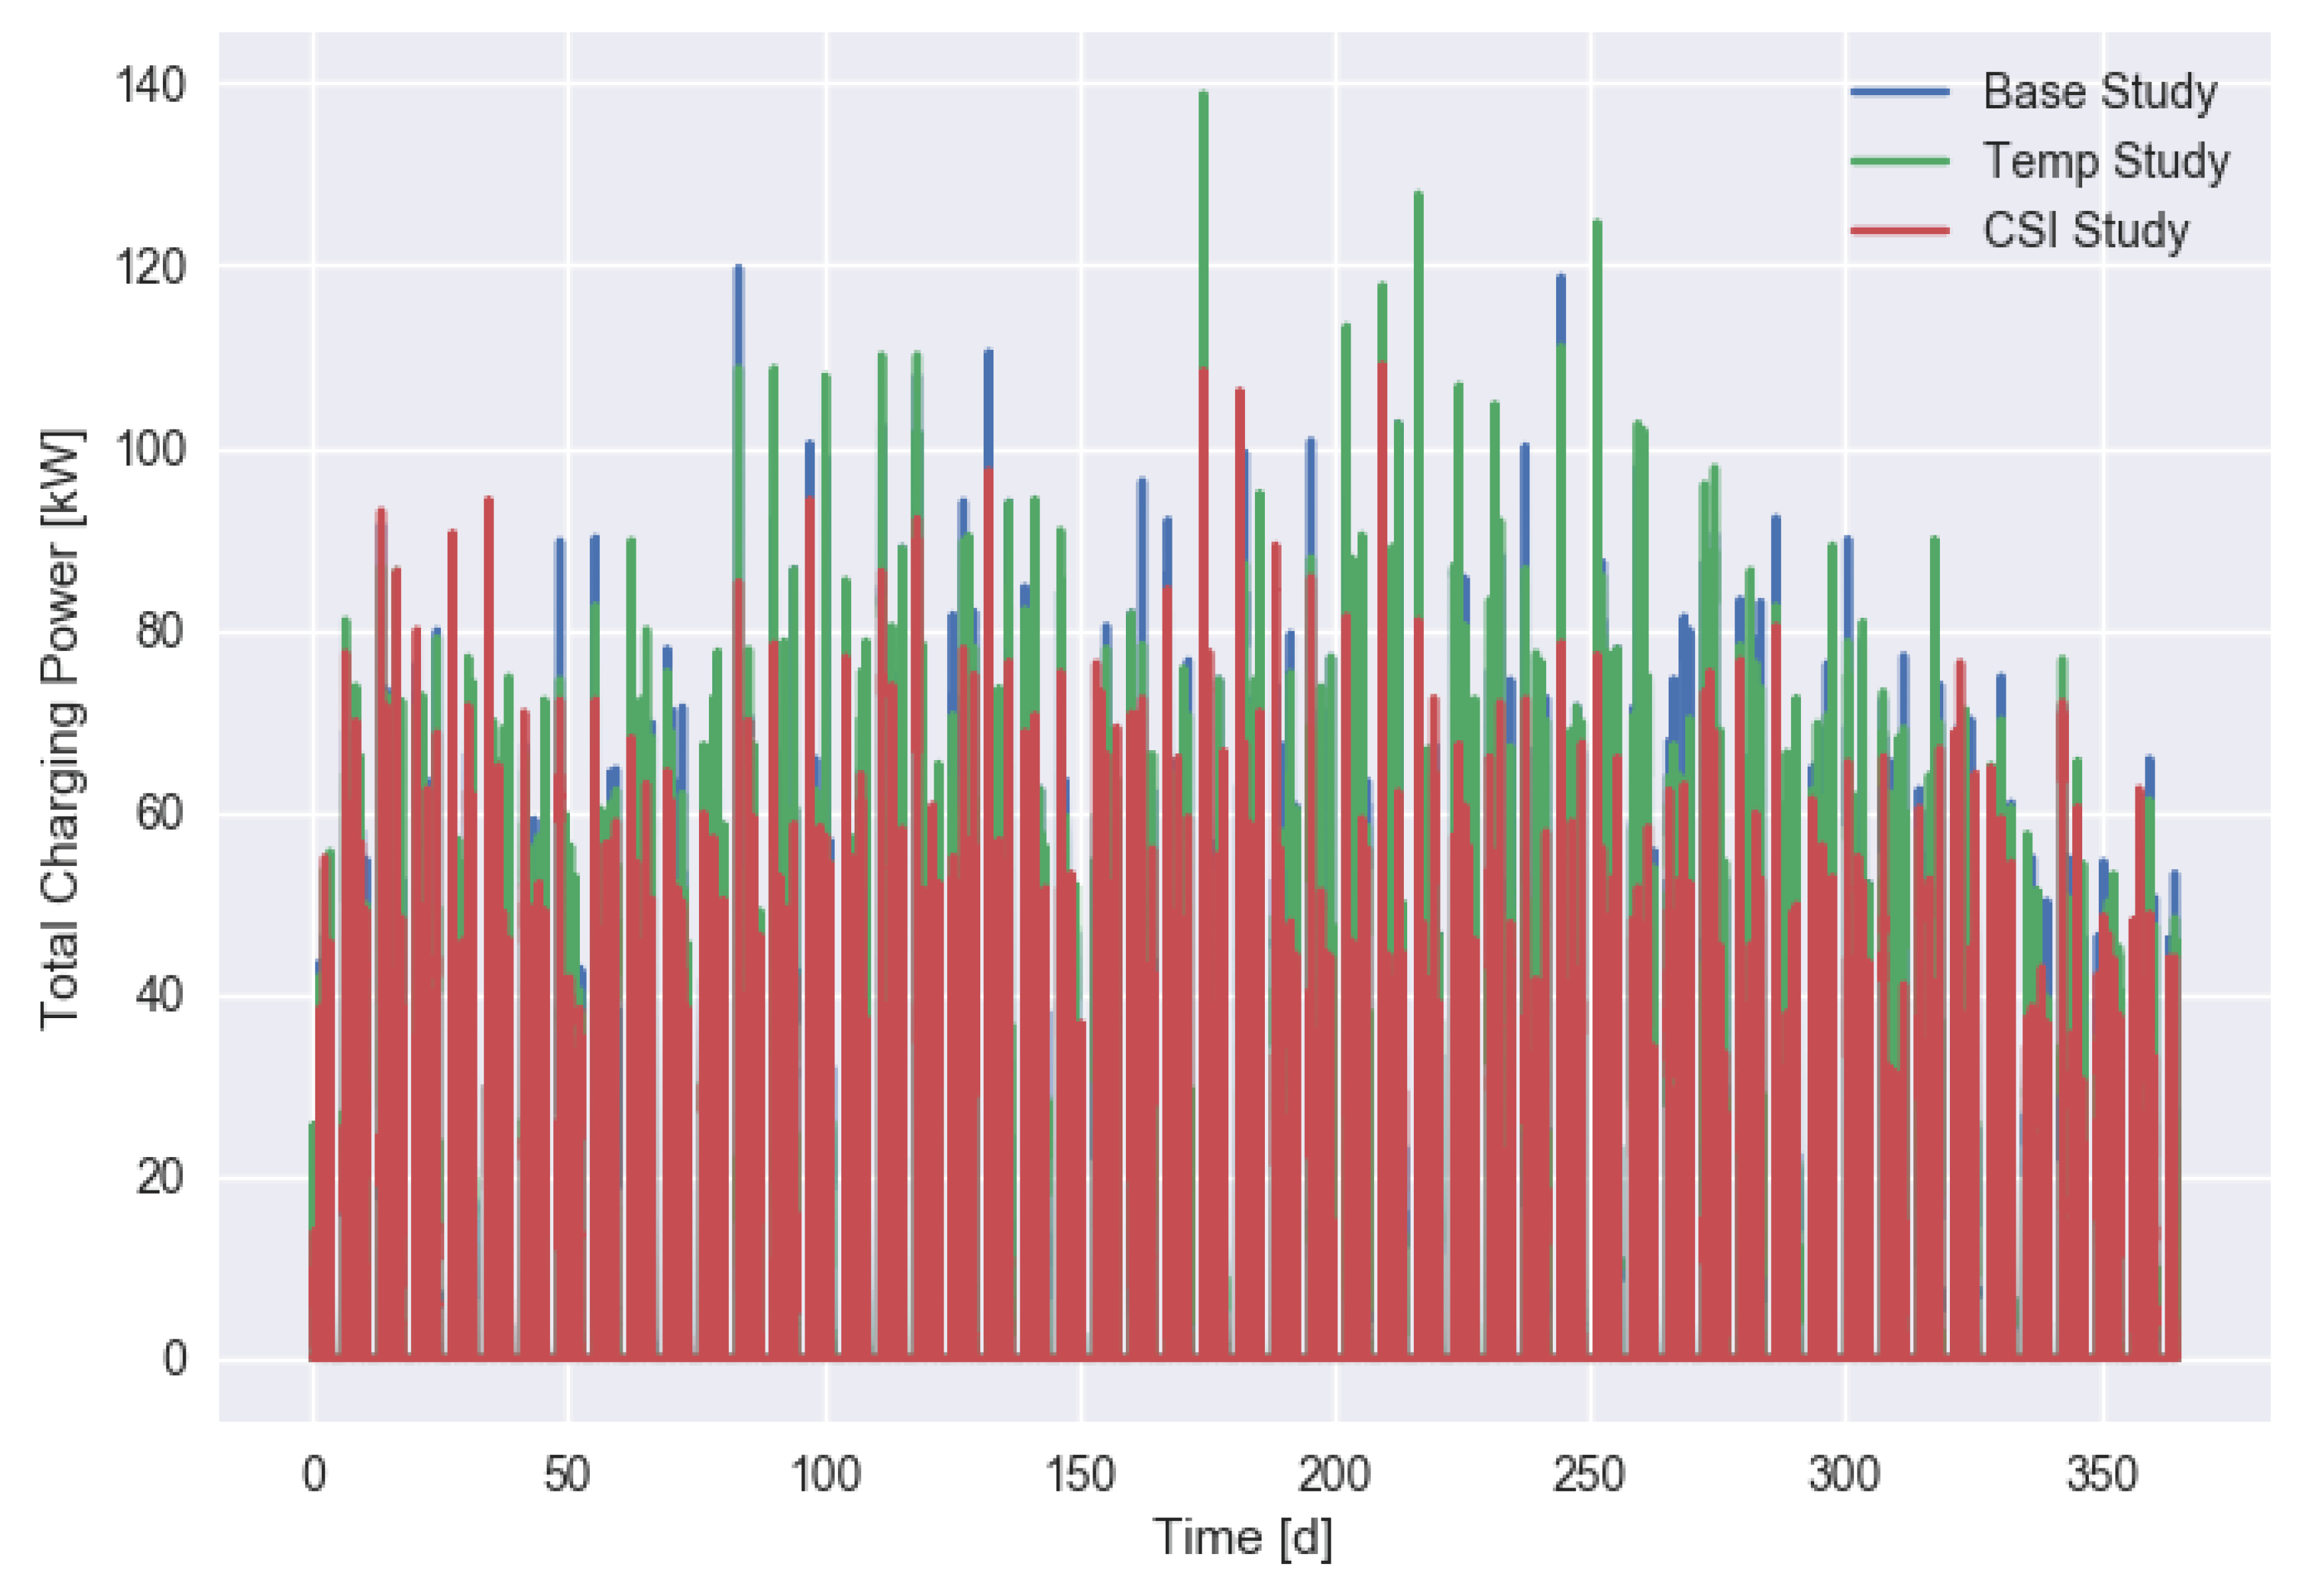
The daily charging power for the three different scenarios is shown in
Figure 6.
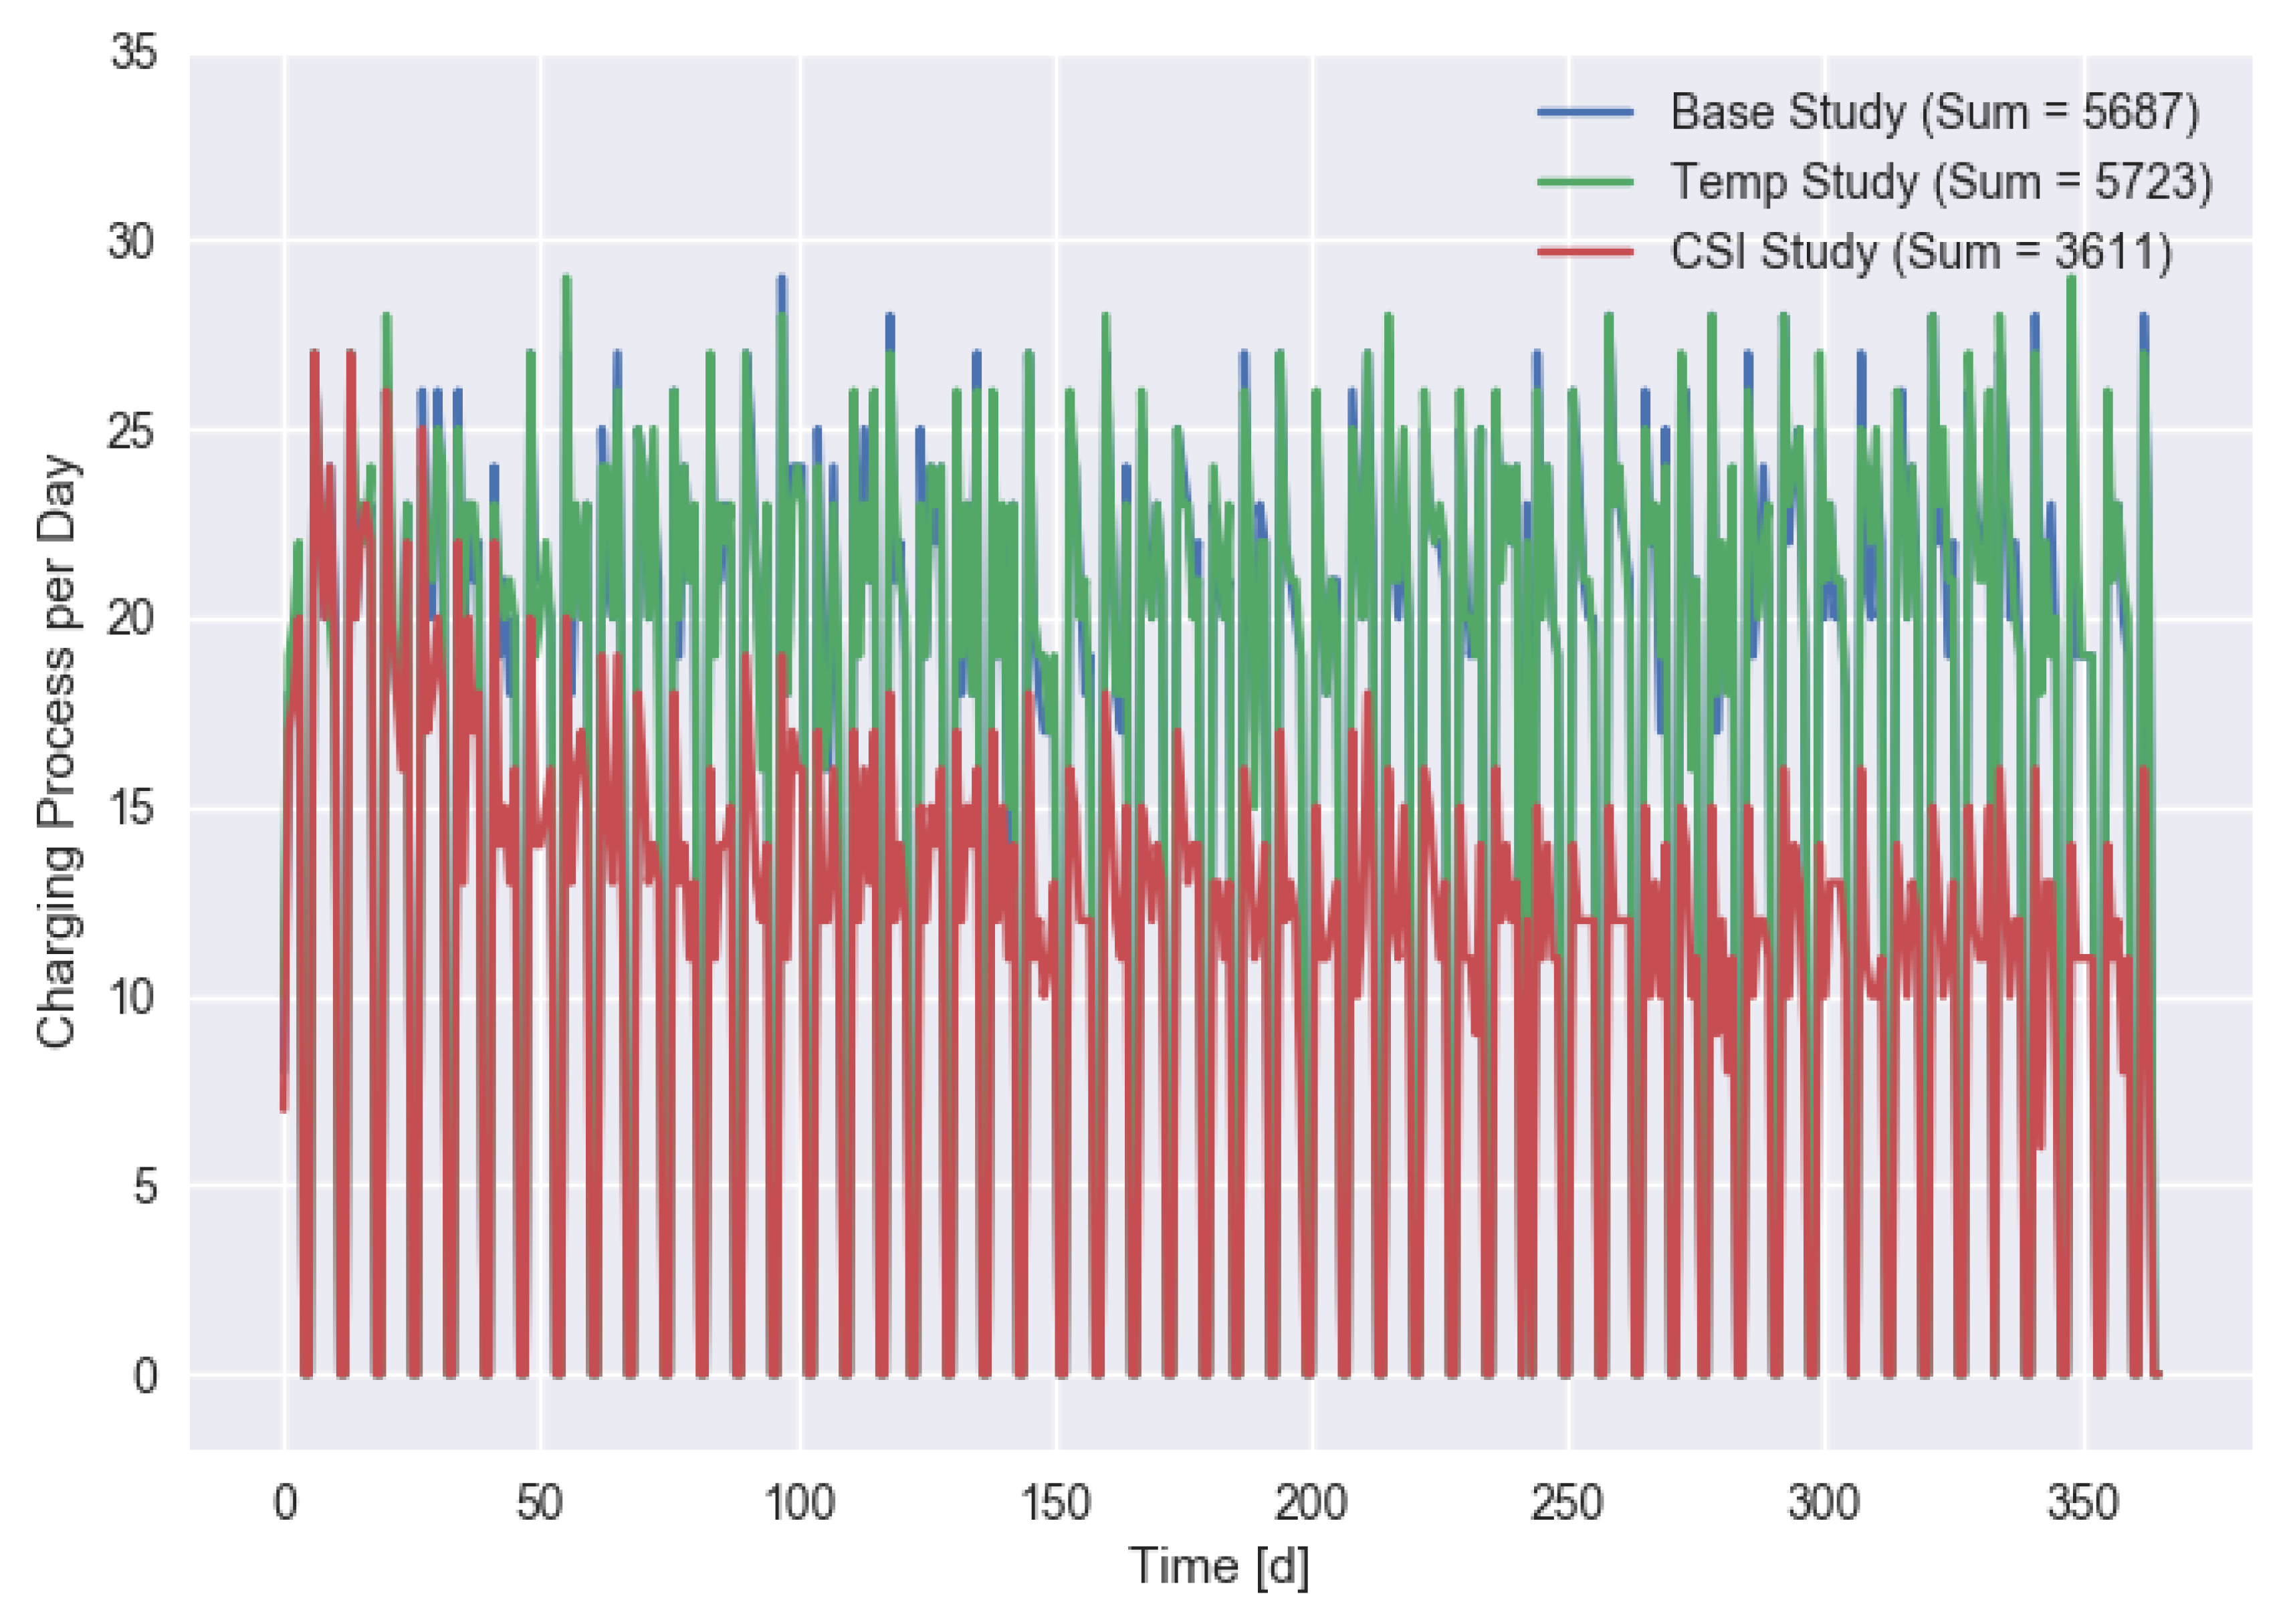
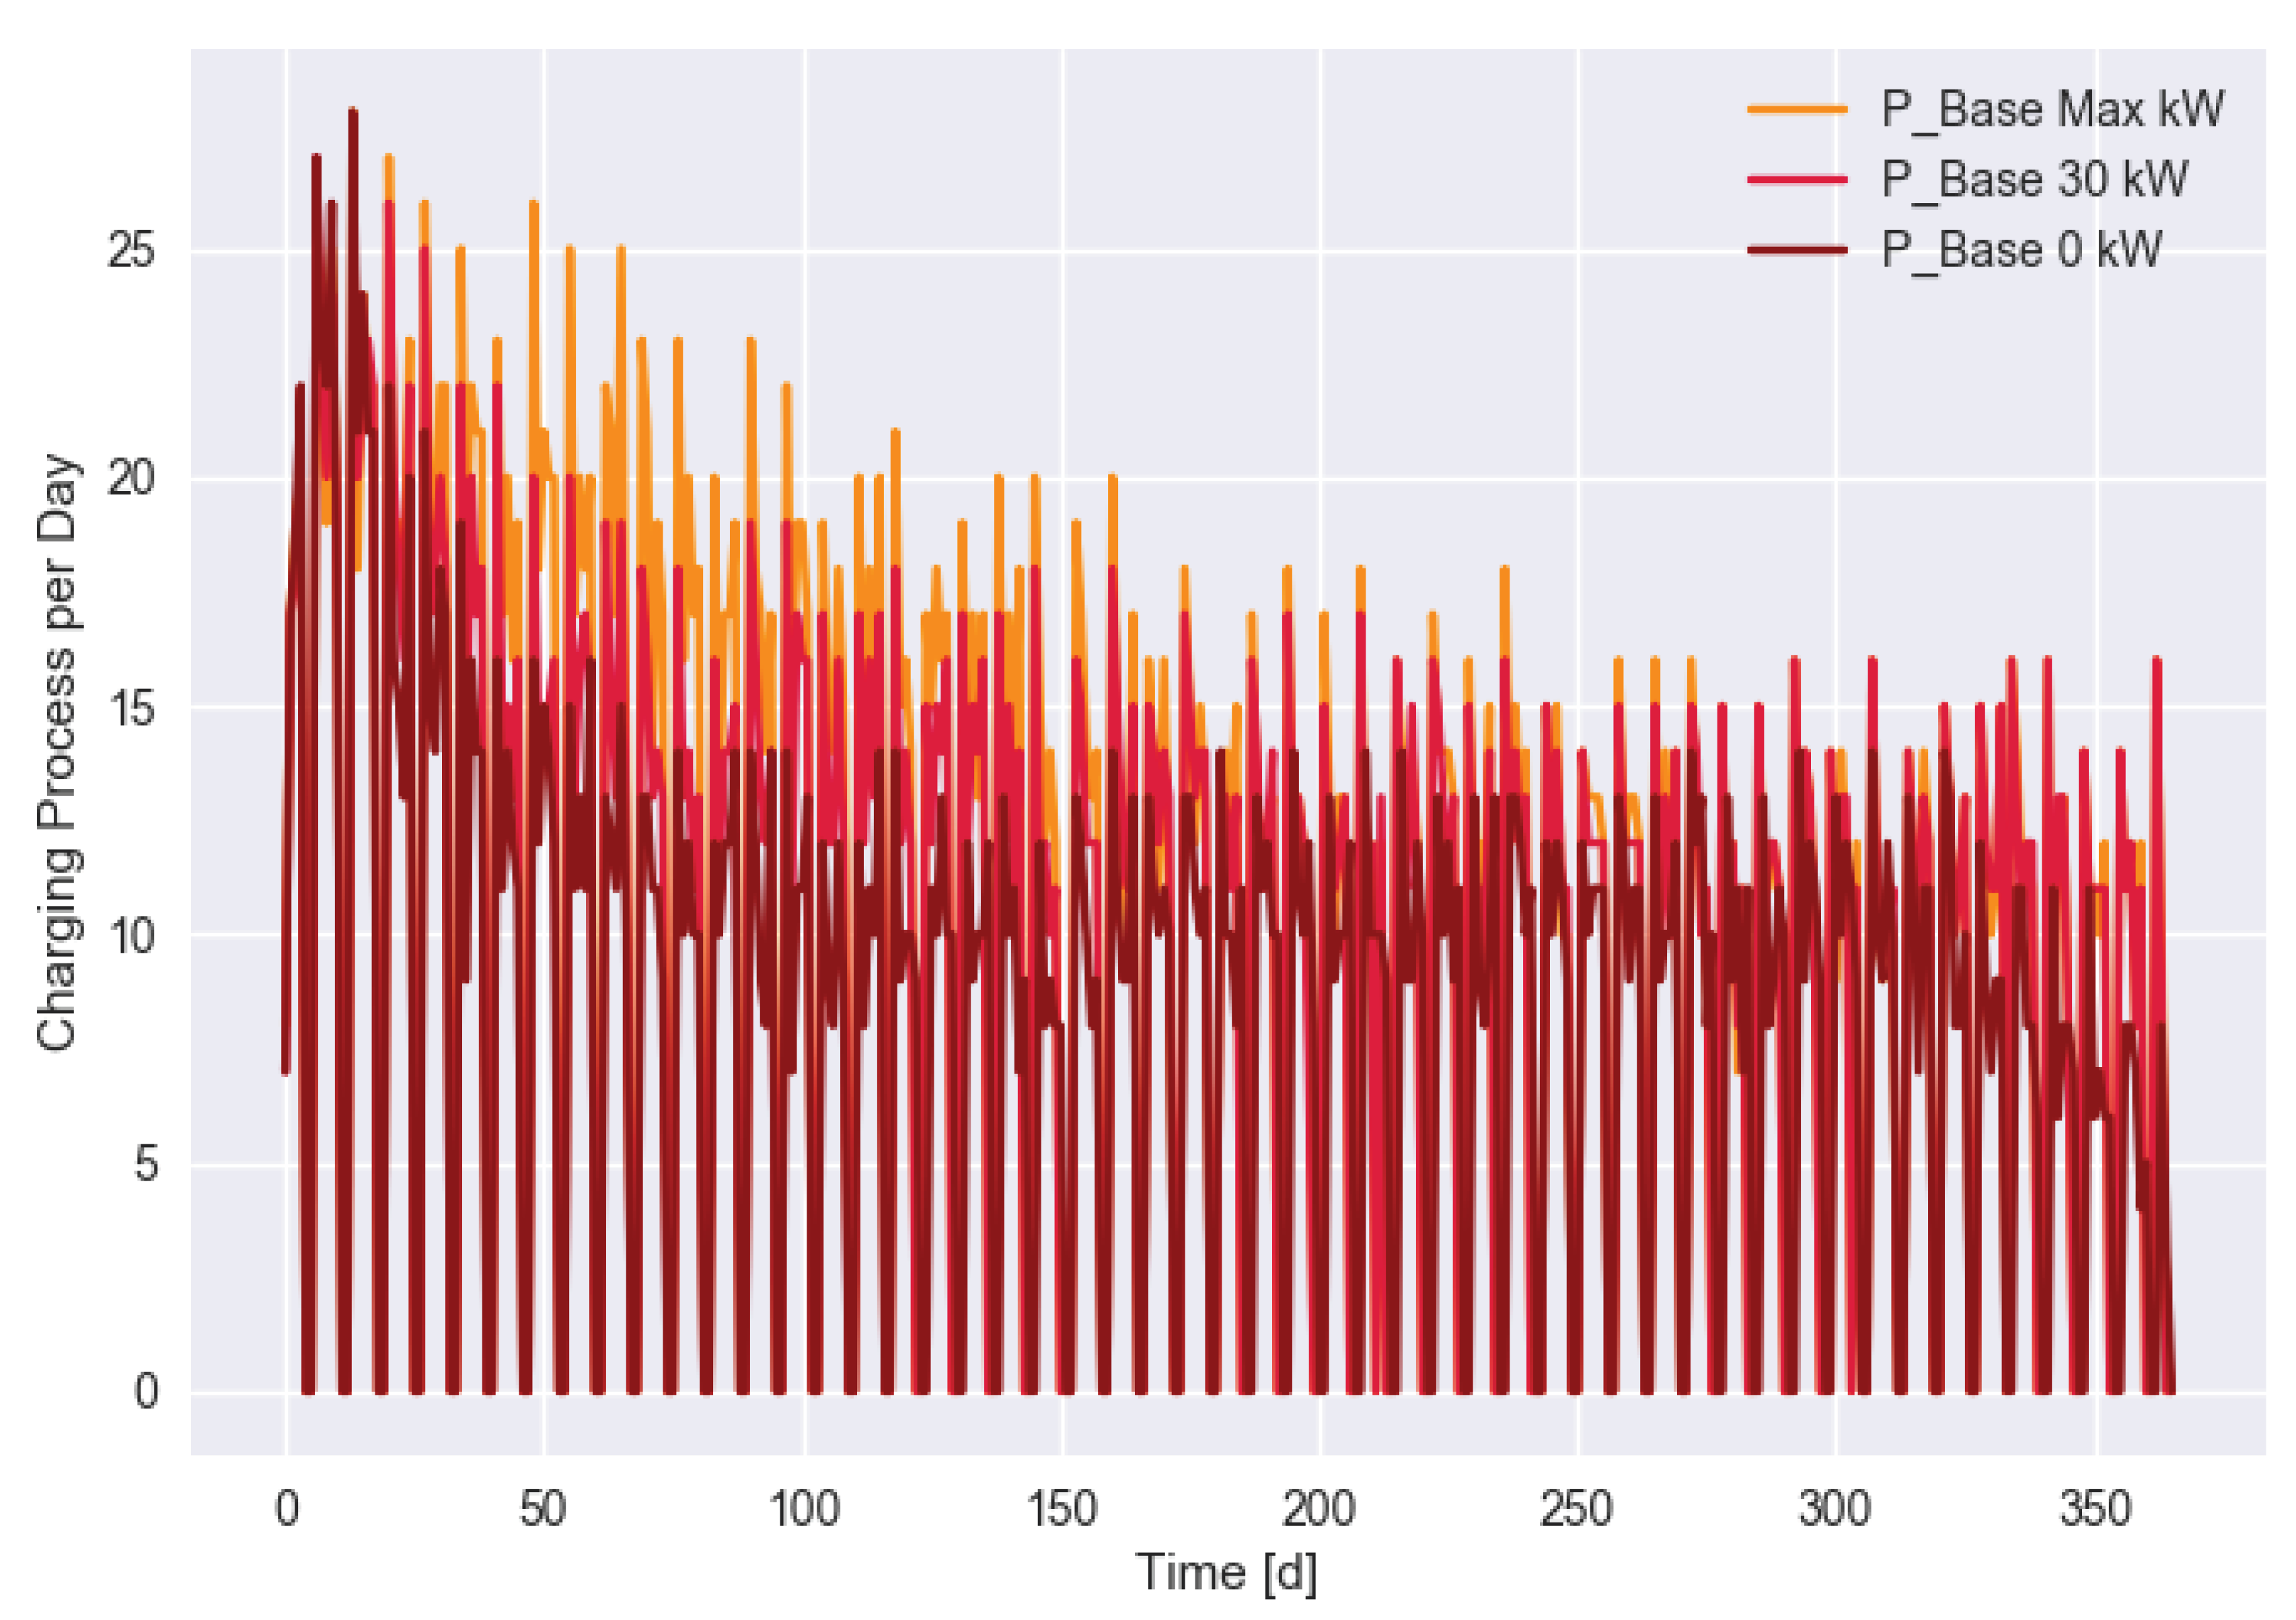
The dependency of the number of daily charging processes is shown in
Figure 7 for different scenarios and in
Figure 8 for different values of
. We see that in the CSI scenario, the number of charging processes fell strongly in the first few months. In the final month (December), the mean number of charging processes for the CSI scenario was 47% lower than for the base scenario. An increasing grid energy supply (
Figure 8) increased the number of long-term charging processes (customers), but even unlimited charging power did not avoid the effect of disappointed customers. This was due to charging requirements that were sometimes too demanding given the limited charging power of the CS or their EVs.
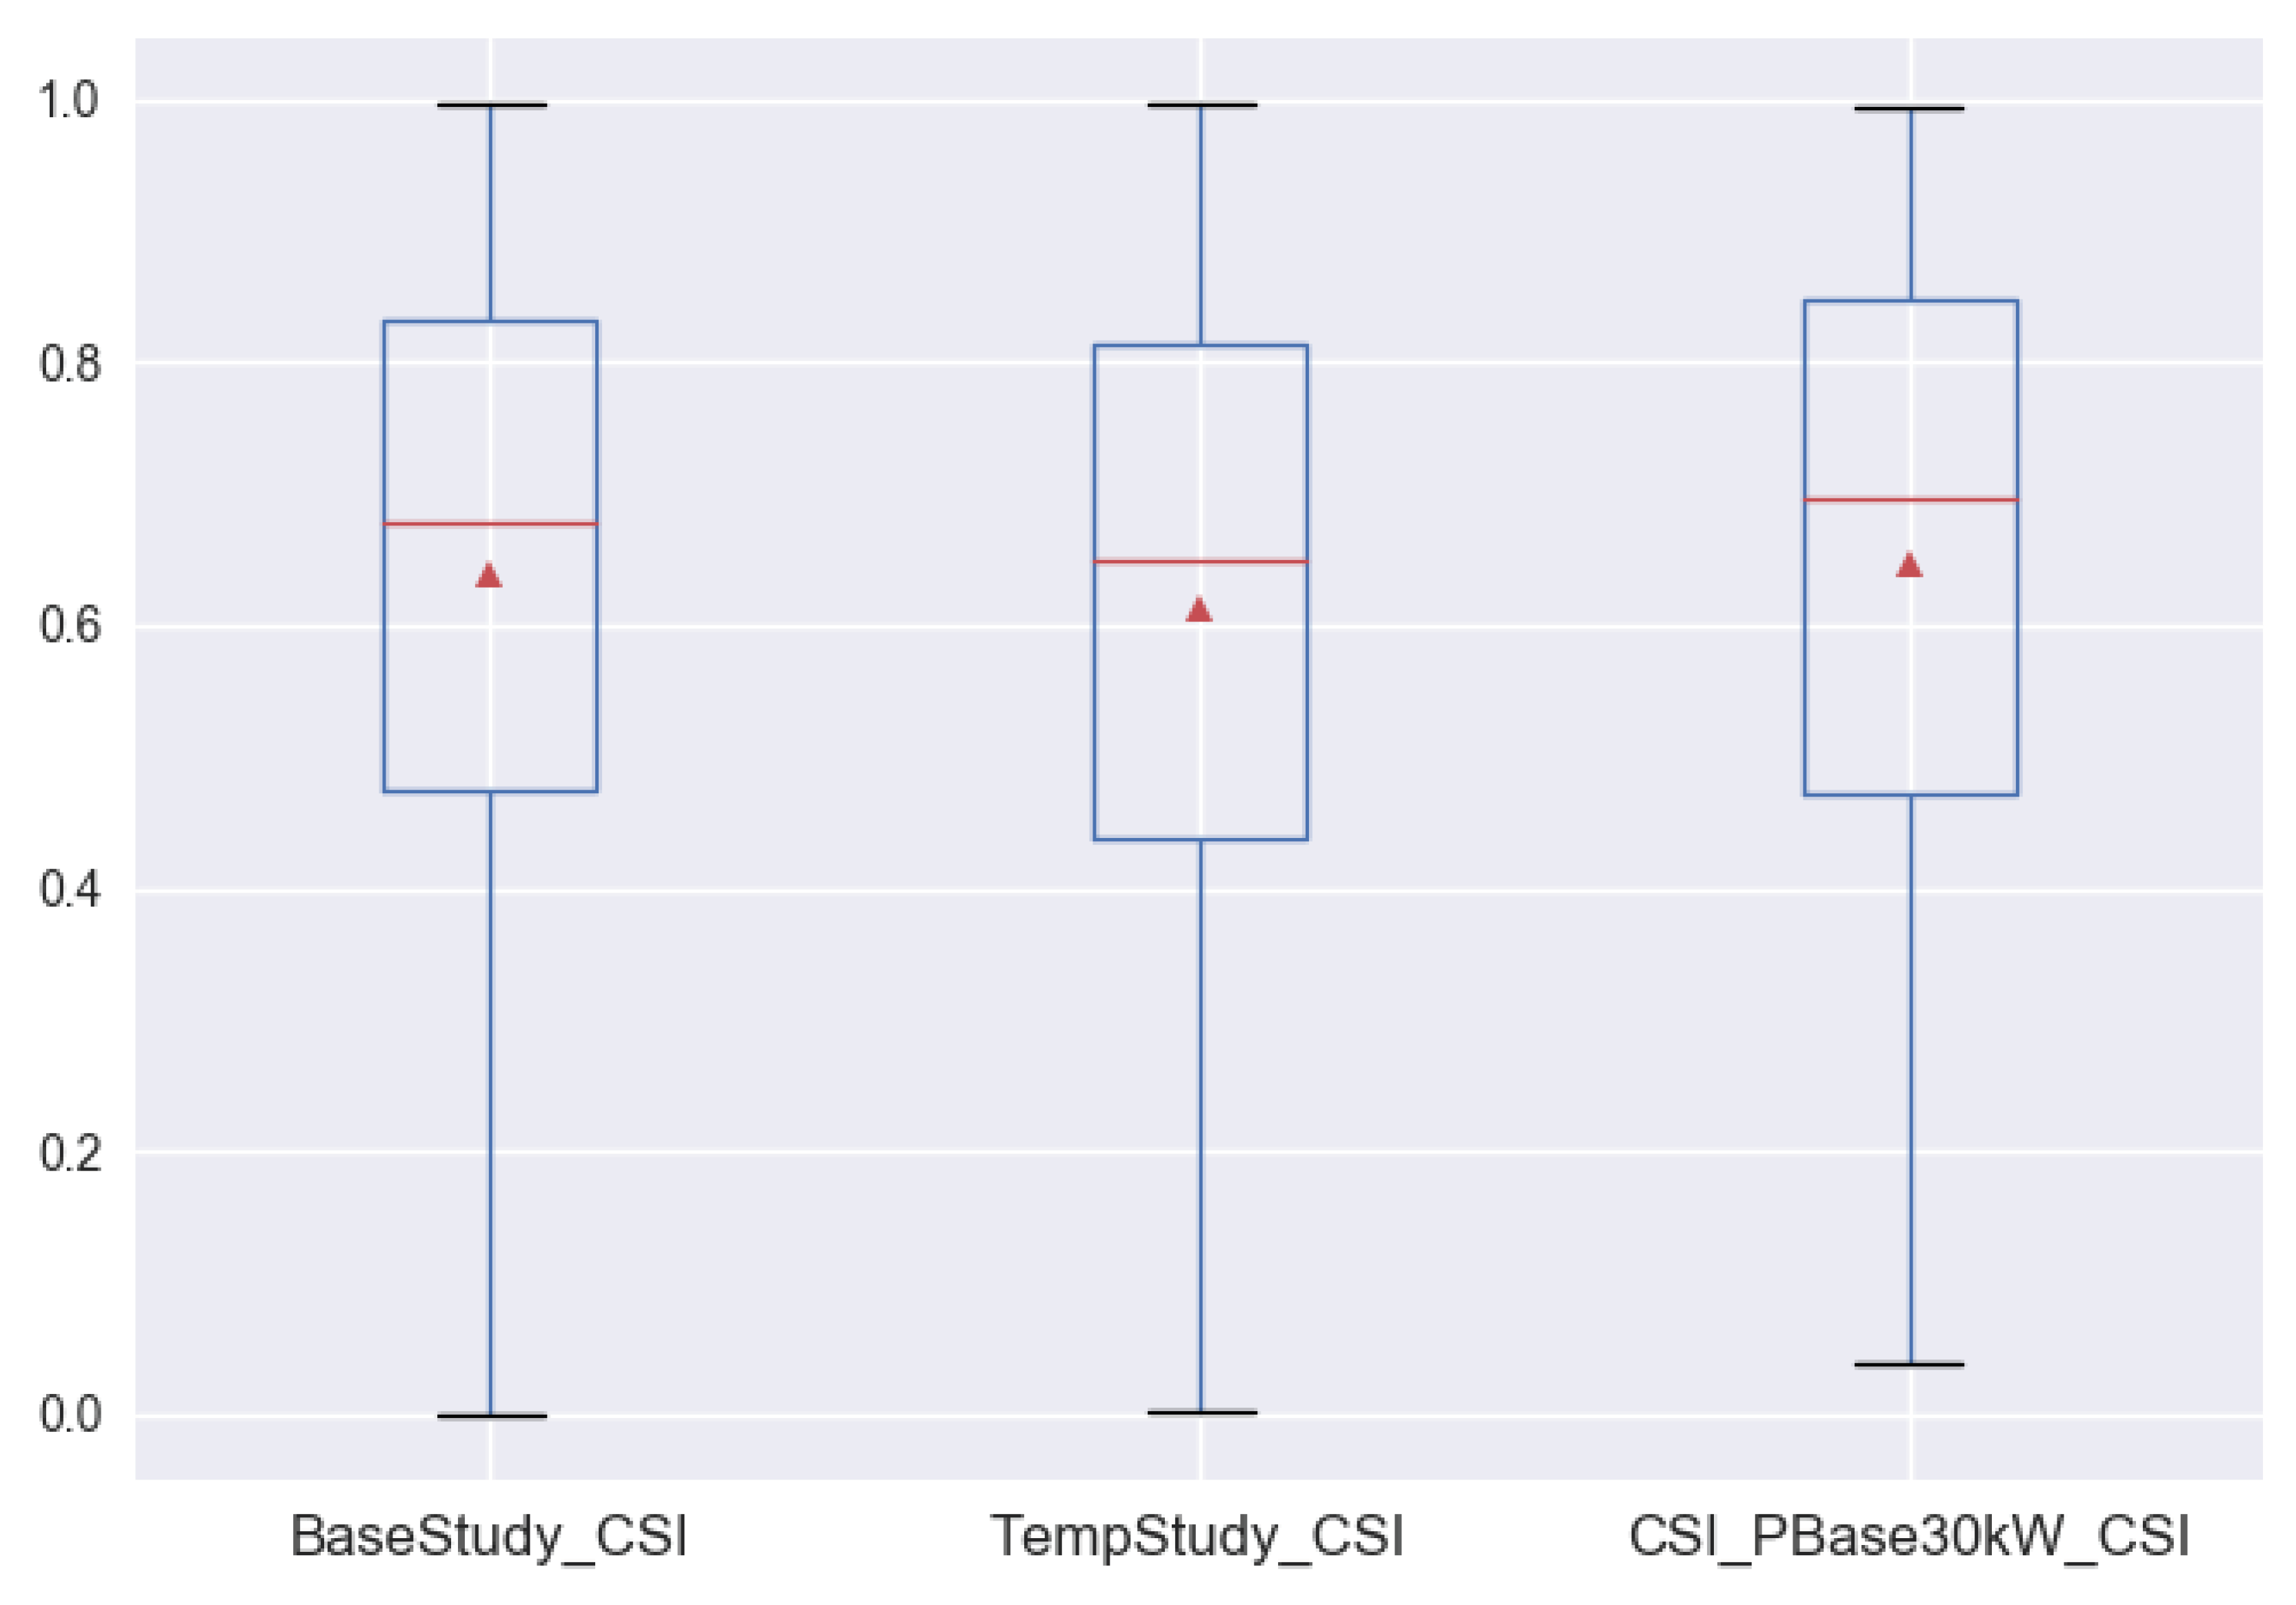
A boxplot of CSI values for all three scenarios is shown in
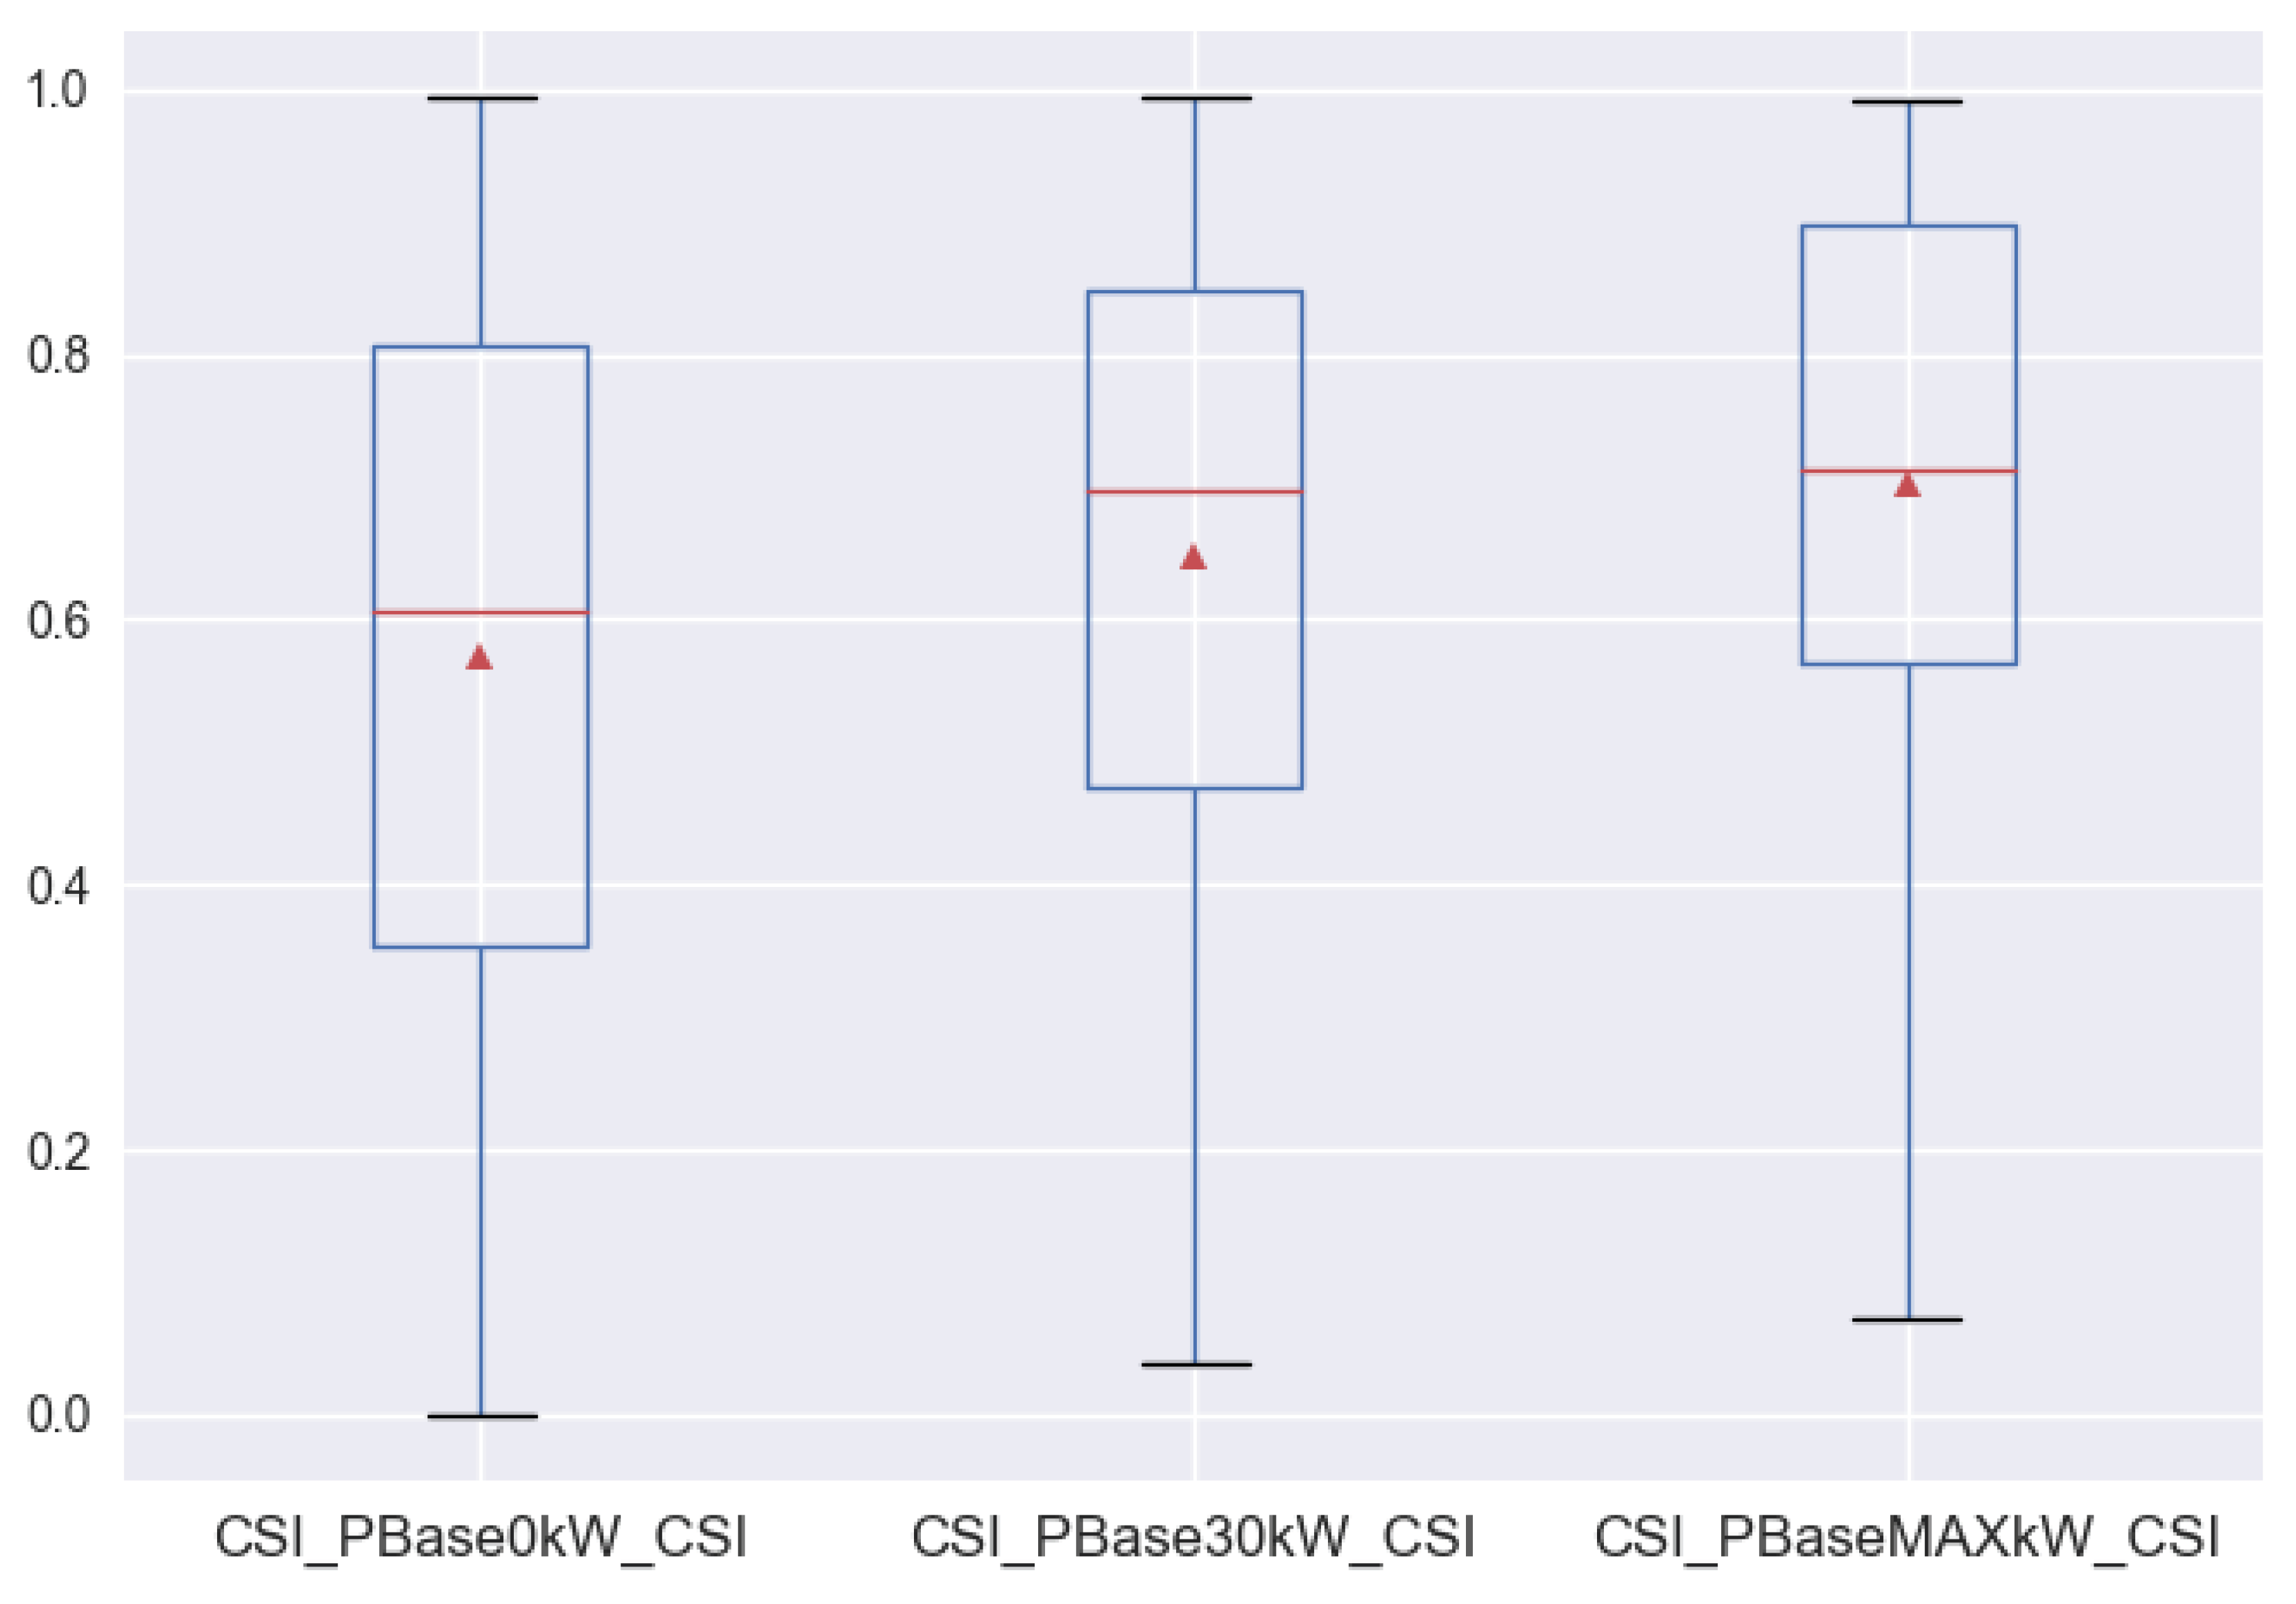
Figure 9. Note that this plot only shows charging processes with a CSI of <1.0. In fact, 93–98% (depending on scenario) of all charging processes provide full customer satisfaction. Differences for the three scenarios were very small, with the CSI scenario even having the best average values and the Temp scenario the worst values. The changes for the CSI scenario when adapting
are shown in
Figure 10. We note an increase in CSI values with more base charging power (taken from the grid). However, due to limited charging power, customer satisfaction might still be suboptimal even when a very large grid supply is available.
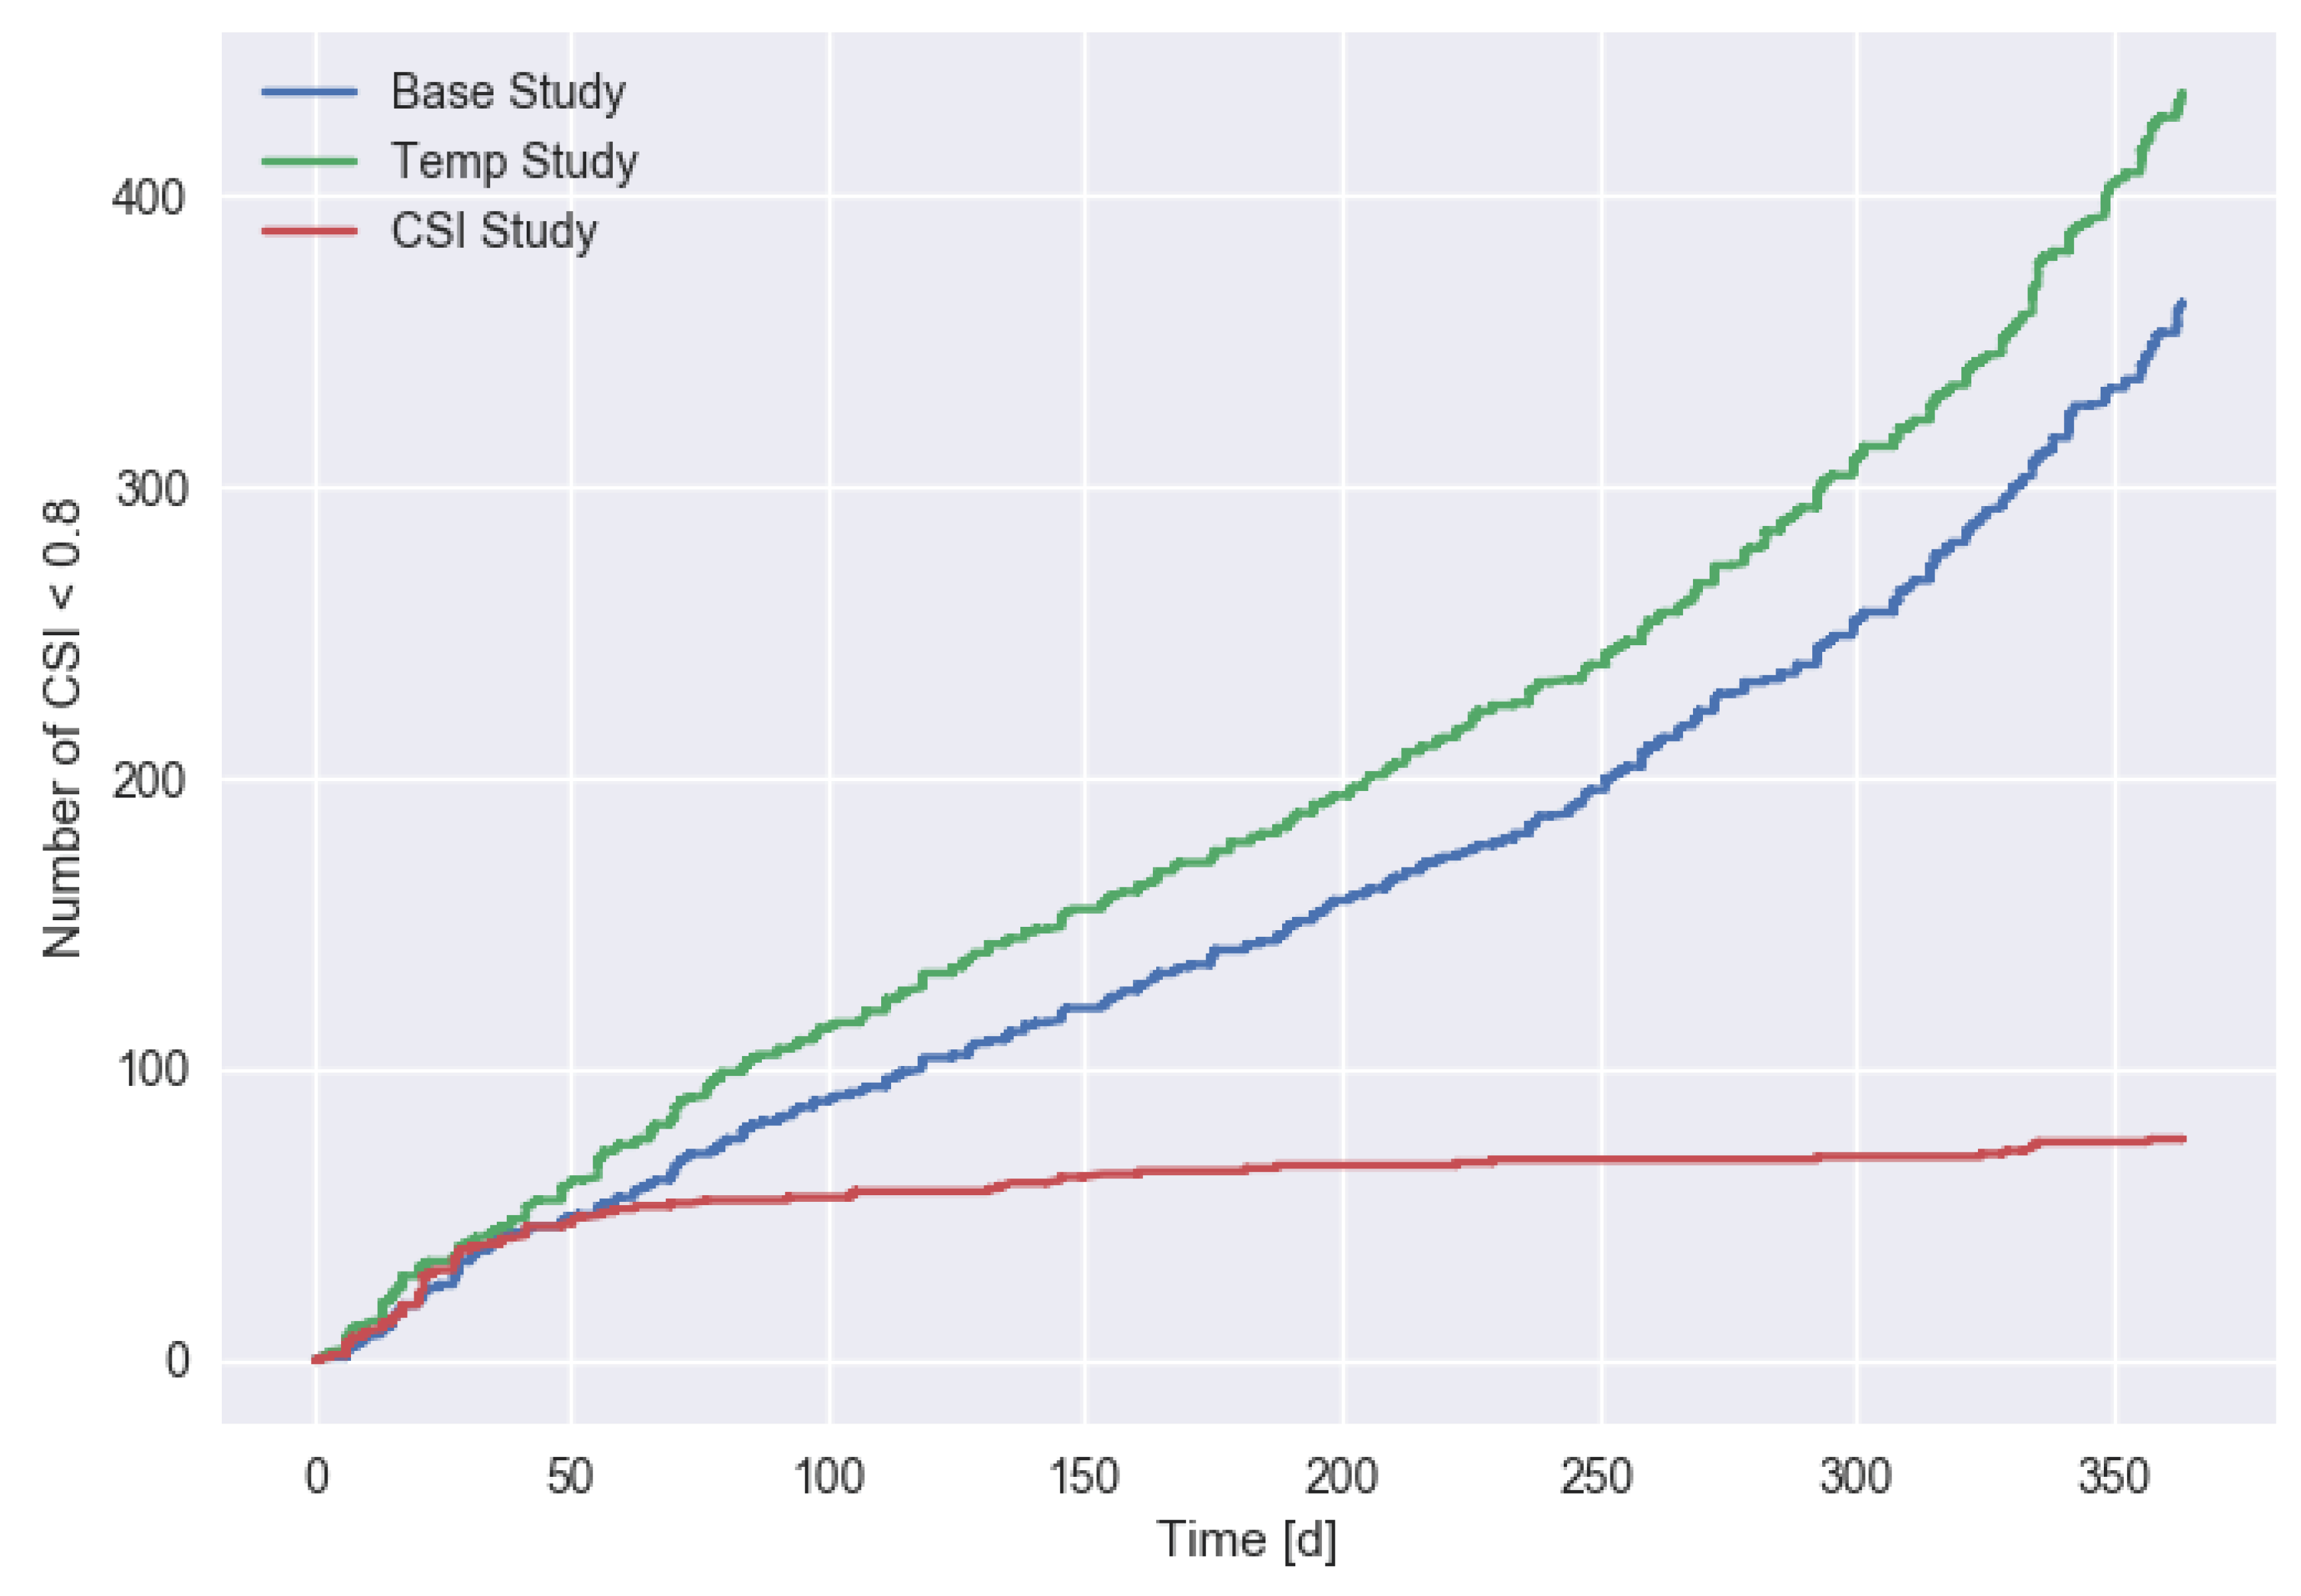
Finally, we study the total number of unsatisfying (CSI < 0.8) charging sessions.
Figure 11 shows variations for different scenarios and
Figure 12 the impact of
in the CSI scenario. Assuming that a CSI level below a threshold (0.8 in our simulations) indicates that the corresponding charging session led to customer frustration, these plots show the development in the number of weak charging sessions. These numbers might for example in real usage be related to the number of customer complaints. It is interesting to observe that in the CSI scenario, the number of low CSI charging sessions increased much slower than in the other two scenarios (
Figure 11). After about two months, there was only a moderate increase in the total number, while in the Base and Temp scenario, those numbers increased much faster. This was due users with more difficult charging requirements switching to a different charging location, leaving the remaining users with a more suitable solution. A possible implication of CSI-sensitive behavior compared to the other scenarios is that a charging operator might substantially overestimate the required effort for handling customer complaints.
As expected, the temperature-dependent charging demand also increased the number of low CSI sessions relative to the baseline. A quite surprising finding in
Figure 12 was the low difference in the number of final low-quality charging sessions at the end of the year for different
values (101 for 0 kW, 76 for 30 kW, and 68 for Max power (1 MW)). In terms of service efficiency (providing high CSI level charging sessions), even large variations in
had a rather small impact. In contrast, the response of the customers seemed to add actually some self-regulating feature to the overall system.
6. Discussion
In this work, we used a multi-agent system approach for the assessment of the performance of a charging system. EV users were modeled at different levels of detail. In contrast to standard pre-calculated, table-based approaches, an MAS can allow agents (users) to respond to external factors like weather conditions, but also to the results of previous charging sessions.
In an example study, we investigated two different effects: an outside temperature-dependent charging energy demand and a customer satisfaction- sensitive charging behavior. The temperature-sensitive scenario was selected as an example of a technical dependency of the charging demands on external (environmental) conditions, while the CSI-sensitive scenario was considered as a very basic human response pattern that has been often ignored in the analysis of charging systems. The two scenarios led to substantial differences in the key performance values of the system (charged energy, number of daily charging sessions). The CSI-sensitive customer scenario even led to qualitatively different results, although low quality charging processes were very rare. It also turned out that increasing the base power from the grid had a positive influence on the charging performance, but did not generally avoid the issues with unsatisfied customers. It might therefore be better to accept a certain number of discontented customers to provide a better and less expensive service to the others.
In prior work [
25,
26], we proposed a dynamic pricing scheme, where charging station operators offer different prices to customers depending on the customers’ flexibility. The framework proposed in this paper could be used to better understand the impact of different pricing schemes on user behavior. This is especially relevant if additional constraints like fairness need to be accurately modeled [
27].
Another interesting venue is to analyze the resulting real-world multi-agent system consisting of grid operators, aggregators, EVs, customers, and other agents, from a more fundamental system level along the lines of [
28].
We conclude that a more complex user modeling, as facilitated by MAS, is an essential component in any simulation-based development and testing environment for smart charging systems. A key issue that needs to be solved is how to obtain the necessary user data to feed the agent models in the MAS. This is a specifically difficult topic for the energy domain, where due to rapidly changing structures, customer behavior is likely to change over time. Furthermore, not much data on general users of EVs (in contrast to early adopters and members of research institutions) is available.
7. Materials and Methods
Due to technical, license, and IP-property-related issues, we are unable to provide the underlying simulation framework. However, we are happy to share simulation output data on demand.


