1. Introduction
The roof design is a decisive factor in conserving the energy of the building because the roof surface is directly exposed to solar radiation and is a pathway to transfer ambient solar heat inside the building. There is a previous research categorizing 10 roofs according to various energy conservation criteria such as heat gain reduction, heat flux reduction, lighting energy conservation, and internal temperature maintenance as shown below: (1) concrete roof (heat gain reductions: 40%) [
1]; (2) cool roof (Heat gain reductions: 33%) [
2]; (3) insulated roof(Heat flux reductions: 75%) [
3]; (4) roof garden or Green roof (heat flux reductions: 31–37%) [
4]; (5) photovoltaic panel roof (heat flux reductions: 60–63%) [
5]; (6) biosolar (heat flux reductions: 50%) [
6]; (7) double-skin roof (heat gain reductions: 71%) [
7]; (8) roof ponds (keep the internal temperature as 24–28 °C) [
8]; (9) sky catcher (lighting energy conservation: Loads 20%); (10) wind catcher (energy consumption savings: 16–27%) [
9]. Among the researches related to the roof designs in conserving the energy, roof gardens (green roof) and cool roof accounts about 50% of articles registered in the Web of Science database until 2018 [
10]. It means that rooftop greening and cool roof are attracting attention from many researchers all over the world as the roofing designs requiring an in-depth study to mitigate the heating/cooling loads by handling heat conduction into the buildings. When designing the roof for energy conservation, cost–benefit ratio and the flexibility of the target building are very important variables. Compared to the roof garden, a cool roof is more effective in cost and heat convection. Cool roof reduces more heat conduction into buildings (0.14 KWh/m
2; 8%) than the roof garden (0.008 KWh/m
2; 0.4% [
4]). The installation cost of cool roof is 4.7 times cheaper than the green roof during the entire life cycle (initial investment cost, maintenance cost, dismantling, and waste disposal expense [
11]). The green roof can mostly be installed only in new buildings since it has the structural problem of supporting increased load caused by trees, grass, soil, waterproofing, and watering system, etc. and requires considerable additional investment for maintenance after installation. However, a cool roof can be installed in any building without any difficulty and has advantages of low initial investment and maintenance cost.
Cool roof is a technology that reflects solar radiation (visible, infrared, and ultraviolet light, etc.) absorbed on a building roof using a highly reflective coating material. It is regarded as an environmentally friendly technology that decreases the cooling load by reducing solar absorption from a building roof [
12,
13]. According to previous research, a cool roof can be installed to decrease energy consumed in buildings by approximately 30% [
14,
15,
16,
17]. There are two different ways to evaluate the performance of a cool roof, focusing on field surveys for individual buildings. They are divided into a method of evaluating with a focus on rooftop conditions and the room temperature inside the building. SRI (Solar Reflectance Index) is the most widely used index to evaluate cool roof performance in terms of rooftop conditions and was developed at the Lawrence Berkeley Laboratory in the United States. Various prior studies have been reported to evaluate the performance of a cool roof using SRI [
18,
19,
20]. The method of evaluating the room temperature was based on various variables influencing the indoor condition such as roofing material, outer wall thickness, window insulation, etc. For instance, Akbari et al. [
21] used various collected data for cool roofing performance evaluation (indoor and outdoor temperatures and humidity, roof and ceiling surface temperatures, inside and outside wall temperatures, air-conditioning electricity use, insolation, and wind speed and direction). However, because the variables influencing the heating and cooling load are very diverse and complicated in various building types [
10], there is a serious constraint in evaluating the performance of cool roofing considering all of these detailed factors. Evaluating cool roofing performance based on individual buildings has many limitations in terms of a wide-area thermal load observation. The subjective judgment of the investigator has great influence because the survey method is confined to a range that can be seen by the human eye. A field survey collects data from a horizontal perspective because of the limited accessibility of survey points. It does not present quantitative verification from an area-wide visual point of view by providing objective evidence. Field survey cannot simultaneously investigate the building roofs distributed over a wide area because the thermal environment of the roof significantly changes with time and space in accordance with the solar radiation [
22].
It is quite difficult to obtain the spatial resolution required to evaluate cool roofing performance of individual buildings occupying approximately 5 to 10 square meters by utilizing traditional satellite images (e.g., LANDSAT and MODIS) taken at an altitude of 700 km or more [
23] and the authors had written extensively about these elsewhere [
24,
25,
26,
27,
28,
29,
30,
31]. In the case of buildings in urban areas, using aerial photography to investigate cool roofing performance is virtually impossible because of the densely populated area, where there is legal regulation prohibiting low-altitude flight of manned aircraft. Unmanned aerial vehicles (UAVs) can acquire super-high precision images with a ground sample distance (GSD) at a cm level because they can legally fly at low altitudes in a densely populated area. In this regard, UAVs are considered a feasible alternative to overcome the limitations of field surveys, manned aerial photographs, and existing satellite images.
Similar to the principle that a white shirt lowers the body’s heat load, rooftop color is among the most important variables in evaluating the performance of a cool roof. The light reflectance value (LRV) is a concept to quantify the amount of visible light that a specific target will reflect. Black has 0% LRV and can be very hot because the dark rooftop surface absorbs all light within the entire range of the visible spectrum. If a rooftop coating appears as black (LRV: 0%), the solar energy absorbed is completely converted to heat, resulting in a rapid increase in the surface temperature. In contrast, white has a 100% LRV and maintains the rooftop surface bright and cool. All colors can be expressed by LRV values of from 0% to 100%.
Because the energy consumption to maintain a proper room temperature depends on the LRV of a building’s roof, roof LRV can be used as the most direct and key parameter to evaluate the cooling and heating load resulting from a cooling roof. LRV can be measured with a UAV image without directly contacting the roof. LRV can be investigated over a short time for area-wide targets. Today, LRV is established as a standardized approach to extract basic information to decrease energy consumption in various fields such as interior design [
32]. When LRV distribution derived in pixel units is utilized for the performance evaluation of cool roofing, it is believed that it can overcome many limitations faced in previous research such as personal subjectivity and a lack of area-wide information among others. LRV derived from UAV remote sensing enables a cool-roofing performance assessment from an area-wide perspective and quantitative analysis of individual buildings.
LRV is a key parameter that can clearly quantify the solar reflectance and serve as a single indicator representing various variables involved during each stage of a cool roofing performance evaluation. However, there has been limited research regarding the feasibility of introducing a cool roof through an accurate diagnosis of the thermal load using LRV. Furthermore, methodological studies to compare LRV and thermal imaging have not been observed during the performance verification process of the cool roof. The aim of this study was to propose an alternative performance evaluation approach for the cool roof using LRV derived from UAV imagery to overcome limitations in previous research based on the indoor temperature of individual buildings.
2. Method
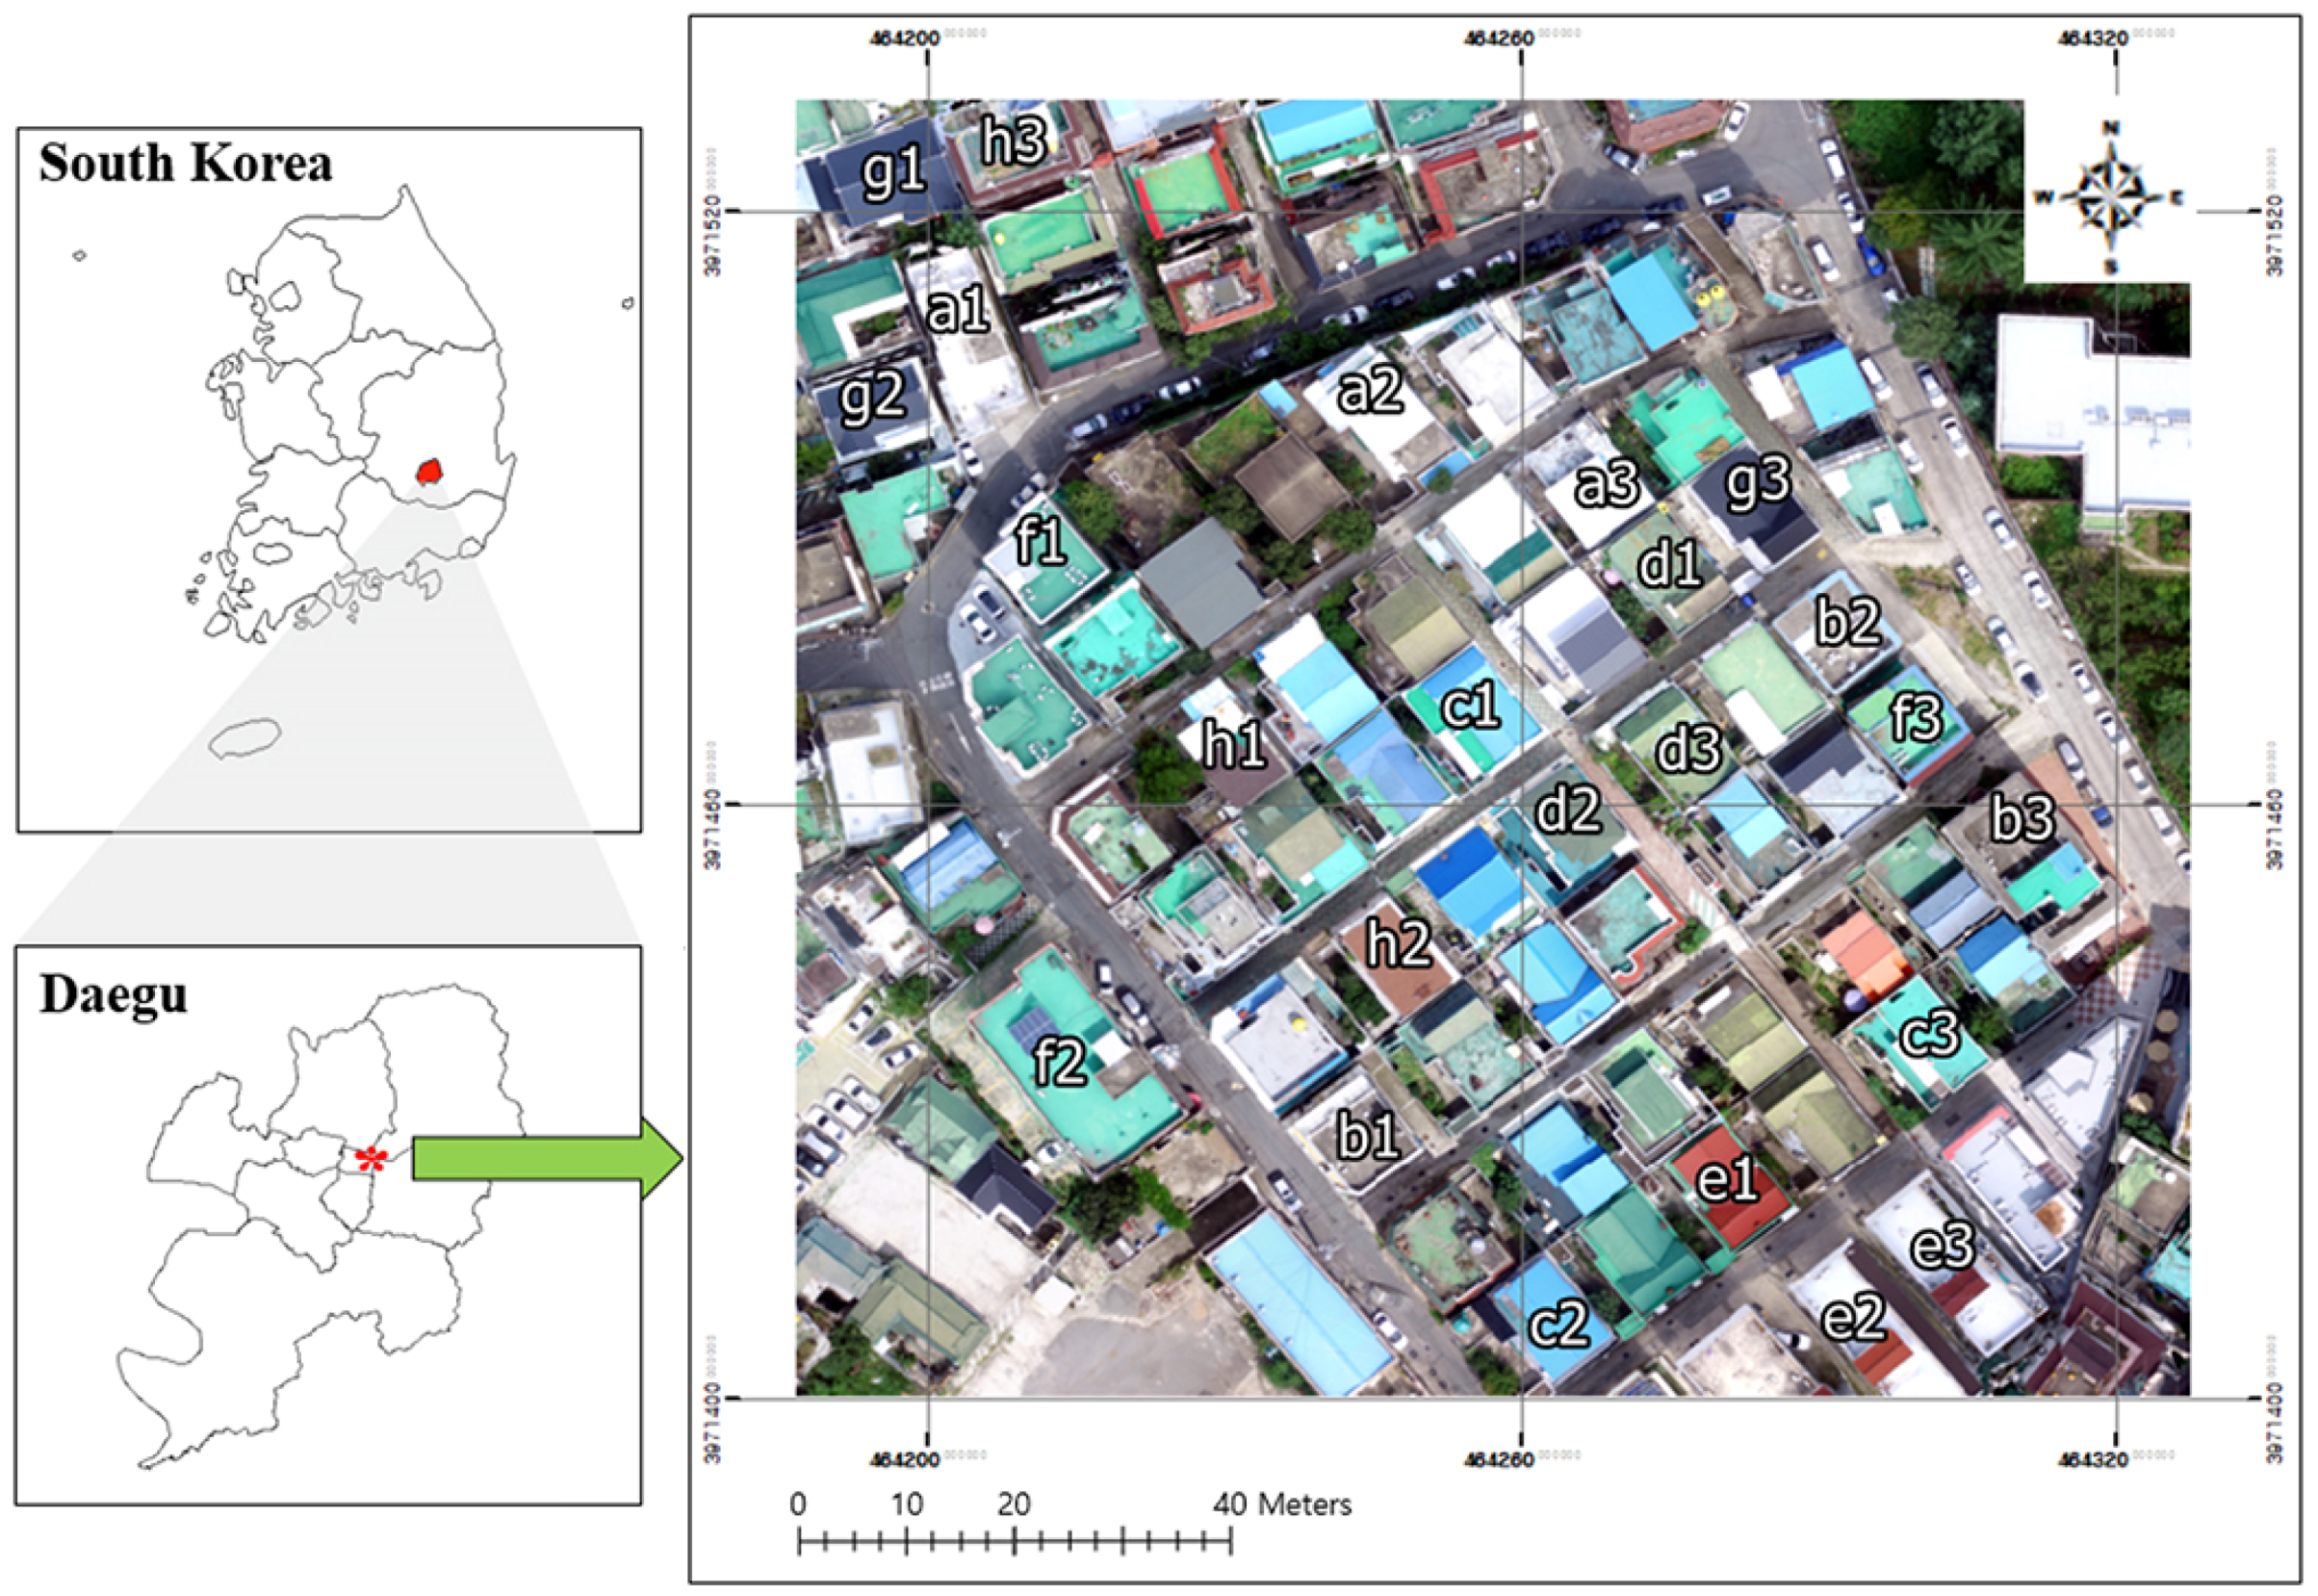
The study area is in the southeastern part of South Korea between latitude 35°53′16.66″ N and 09.62″ N and longitude 128°3′11.25″ E and 17.16″ E. It is in the North administrative district of the metropolitan city Daegu, the third most populous city in South Korea (
Figure 1). The study area, the Daehyun-dong residential area, is near Kyungpook National University (KNU) covering approximately 17.3 km
2. Daegu has low rainfall and abundant sunshine compared to Korea’s other cities. The experimental target is in a student residence-building complex around the university campus where energy consumption is relatively high because of air conditioning operation during the hot weather season. It is a residential complex where old single-story buildings and newly constructed low-rise multi-story buildings are mixed together. In recent years, there has been a tendency of increased building density because of soaring land prices. Therefore, it is an area that has an adequate land mosaic for cool roof performance evaluation because various types of buildings are concentrated in a smaller area, such as single-family housing within low-rise multistory buildings, multifamily housing in old single-story buildings, quasi- or semi-detached or attached houses, etc. In South Korea, the rooftop color of single or low-rise multistory buildings is generally green. However, in this study area, rooftops of various colors are concentrated, including white, black, reddish, greenish, and blue-colored rooftops, ultimately affecting the absolute amount of solar incident energy absorbed in the rooftops (
Figure 1). In this respect, it is a suitable location to evaluate the performance of a cool roof using LRV derived from UAV imagery.
The UAV image was acquired at 13:00 during early autumn (4 September 2017) when the solar altitude and irradiance was the highest of the year [
33]. There is a difference in solar energy transmitted to the surface depending on the sun’s altitude. Solar altitude is also an important factor to be considered in UAV remote sensing because it affects image quality such as shadows. Because wind speed cools the surface heat, the images were acquired at a constant wind speed to minimize data noise (outdoor temperature: 27.2 °C, wind speed: 3.3 m/s). In addition, the UAV imagery was collected under the atmospheric state of a clear blue sky to minimize differences in solar thermal intensity caused by cloud cover. UAV images were acquired using a DJI Inspire 1 that has a maximum flight altitude of 4500 m and can fly for up to 18 min (
Table 1). Visible imagery to derive the LRV was collected using a Zenmuse X3 (450–750 nm). Pix4D Capture, a UAV flight planning software linked to Google Earth, was used to maintain a constant flight altitude (70 m) and overlapping percentage (80%) along the pre-defined flight route during the data acquisition.
The UAV imagery was processed using Agisoft Photoscan to produce an ortho-image utilizing the structure from the motion (SfM) algorithm. SfM is a photogrammetric technique for restoring a three-dimensional structure using corresponding points in two or more overlapping images from a two-dimensional image captured with a certain degree of overlap percentage [
31,
34,
35,
36]. The position and posture of the camera required to produce ortho-imagery were estimated utilizing information (focal length, flight altitude, image size, etc.) acquired from the tag stored in the photograph without entering the actual ground control point (GCP) obtained in the field.
A total of 24 sample rooftops (three samples per color) were selected for representative colors such as white, black, gray, blue, green, and red (
Figure 1). The LRV was extracted utilizing the CIELAB (International Commission on Illumination (CIE)) international color standard (also known as CIE L*a*b*). The fundamental concepts of color are described by three basic criteria: Hue (shade), lightness (brightness or luminance), and saturation (intensity). Lightness of color is quantified as a percentage from darkness to maximum lightness (diffuse white) to describe its relative brightness (luminous intensity), e.g., light blue compared to dark blue. CIELAB was designed to represent uniform color vision perceived visually by humans, rather than the RGB color space simulating the output of physical devices such as computer displays and printers. CIELAB has become the internationally accepted colorimetric reference system for quantifying the thermal characteristic of targets [
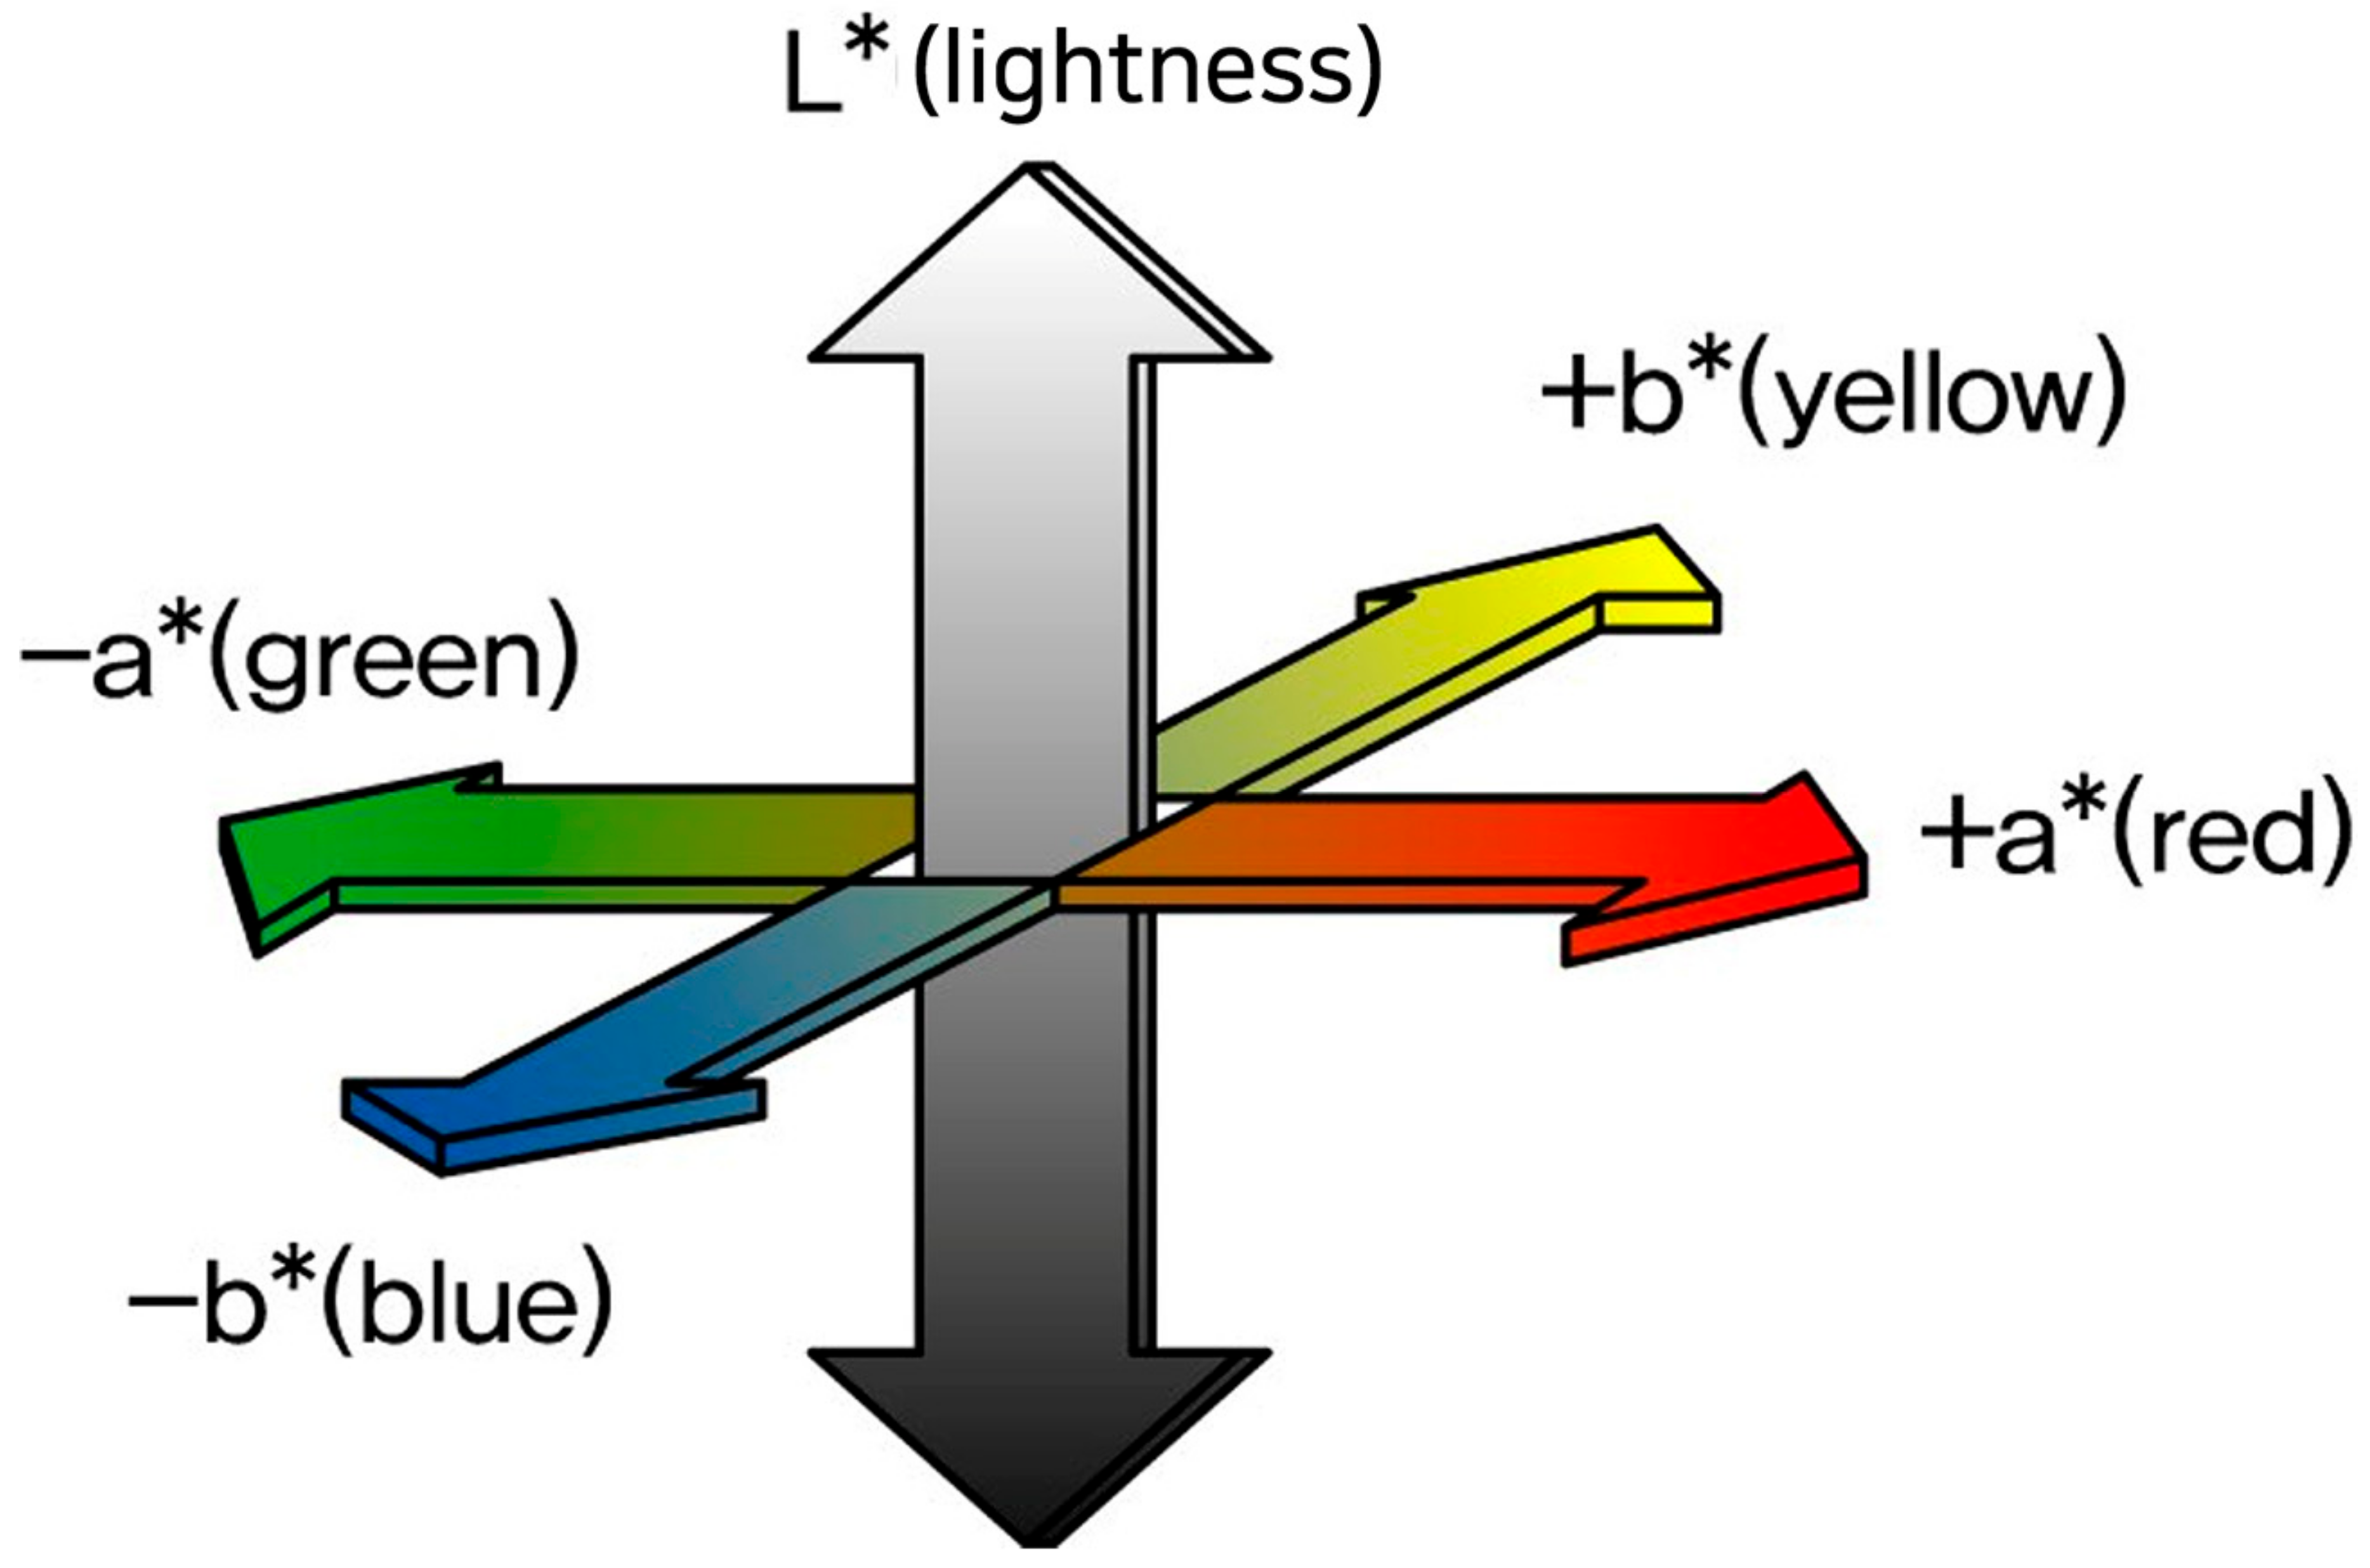
37]. The CIELAB system expresses color using three different numerical values: Lightness (L*) and the green–red and blue–yellow color components (a* and b*) as shown in
Figure 2. L* is the typical pixel value used in remotely sensed imagery. The a* axis ranges from green (−a*) to red (+a*), while the b* axis from blue (−b*) to yellow (+b*). The pixel value changes depending on the radiometric resolution of the remotely sensed imagery such as 6, 8, or 16 bit. LRV (
) is calculated by measuring it under daylight conditions, based on the strong correlation assumption between the color and reflectivity, ranging from 0 (pure black, all absorption) to 100 (diffuse white). Pure black has an LRV of zero and absorbs all light while pure white has an LRV of 100 and can reflect all incident light.
In this study, the LRV was calculated for sample roofs of various colors (
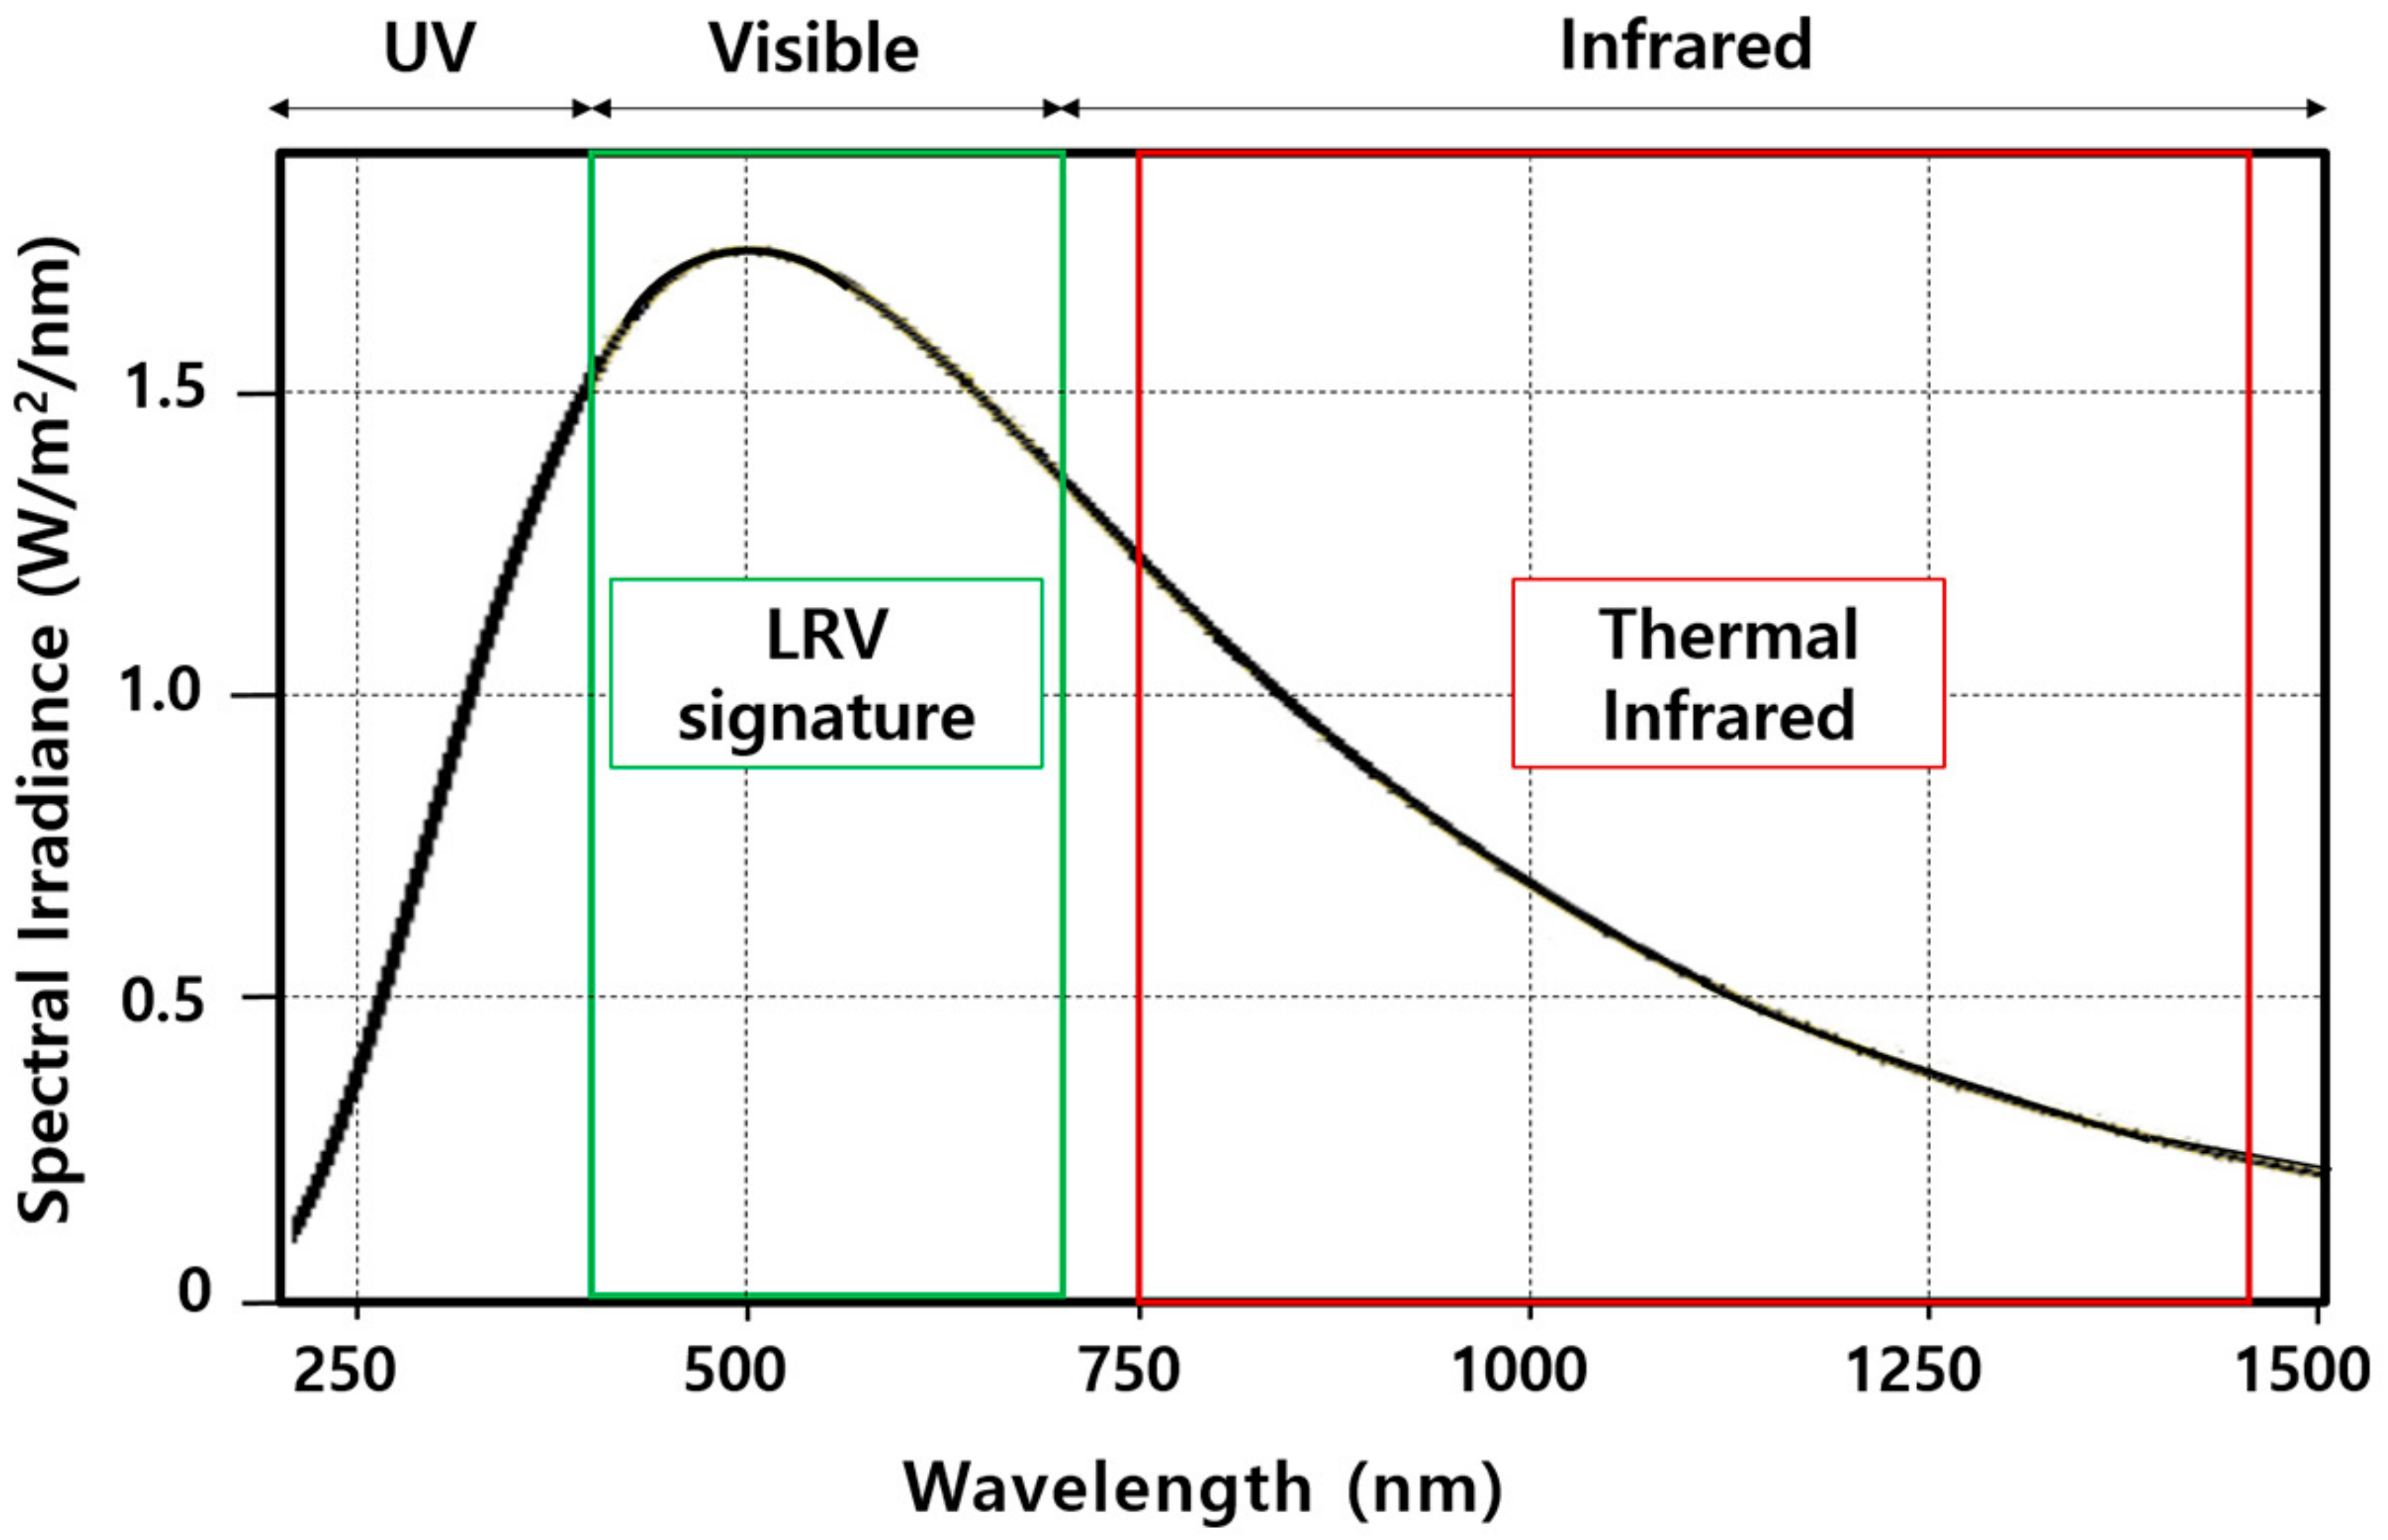
Table 2) to acquire uniform numerical values through the combined definition for both illuminant and color components. It was expected that the LRV could standardize the solar reflectance representing the principle that a white shirt lowers the body’s heat load because the red–green and yellow–blue mixed bands are calculated as lightness differences. LRV detects approximately 43% of the solar energy occurring in the visible wavelength of the electromagnetic spectrum. The remaining 52% of the total solar energy felt as heat in the infrared region (IR, wavelength range: 700 to 2500 nm) is not detected by the LRV [
38]. LRV theoretically does not govern the heating effect occurring because of the near infrared radiation (NIR) in sunlight, as shown in
Figure 3 modified from Iqbal (2012) and ASTM Standard (2007) [
39,
40].
Although solar reflectance is the most important property in determining cool roofing performance, the roof thermal performance is related to the thermal emissivity of the rooftop coating materials, which are responsible for their radioactive cooling [
41]. As the surface temperature of the roof is high and low, an air conditioner is operated to maintain proper indoor temperature, thereby causing energy consumption. In this regard, the surface temperature of a rooftop is a direct variable to evaluate the cooling load of a building. Evaluating the thermal load using the surface temperature of a roof is considered an objective measure to verify the validity of the cool roof installment. In this regard, the roof surface temperature imagery obtained using the UAV was utilized to quantitatively verify the performance of LRV in evaluating the cooling load based on the thermal pixel value. The thermal infrared camera (Zenmuse XT manufactured by FLIR) used in this study has a wavelength of 7.5–13.5 µm and is compatible with DJI Inspire 1 (
Table 2). Raw data appears as a gray-scale based on the digital number (DN) value. Images collected using the FLIR thermal infrared sensor were processed to restore the temperature value using FLIR Report Studio (an image processing software).
3. Results and Discussion
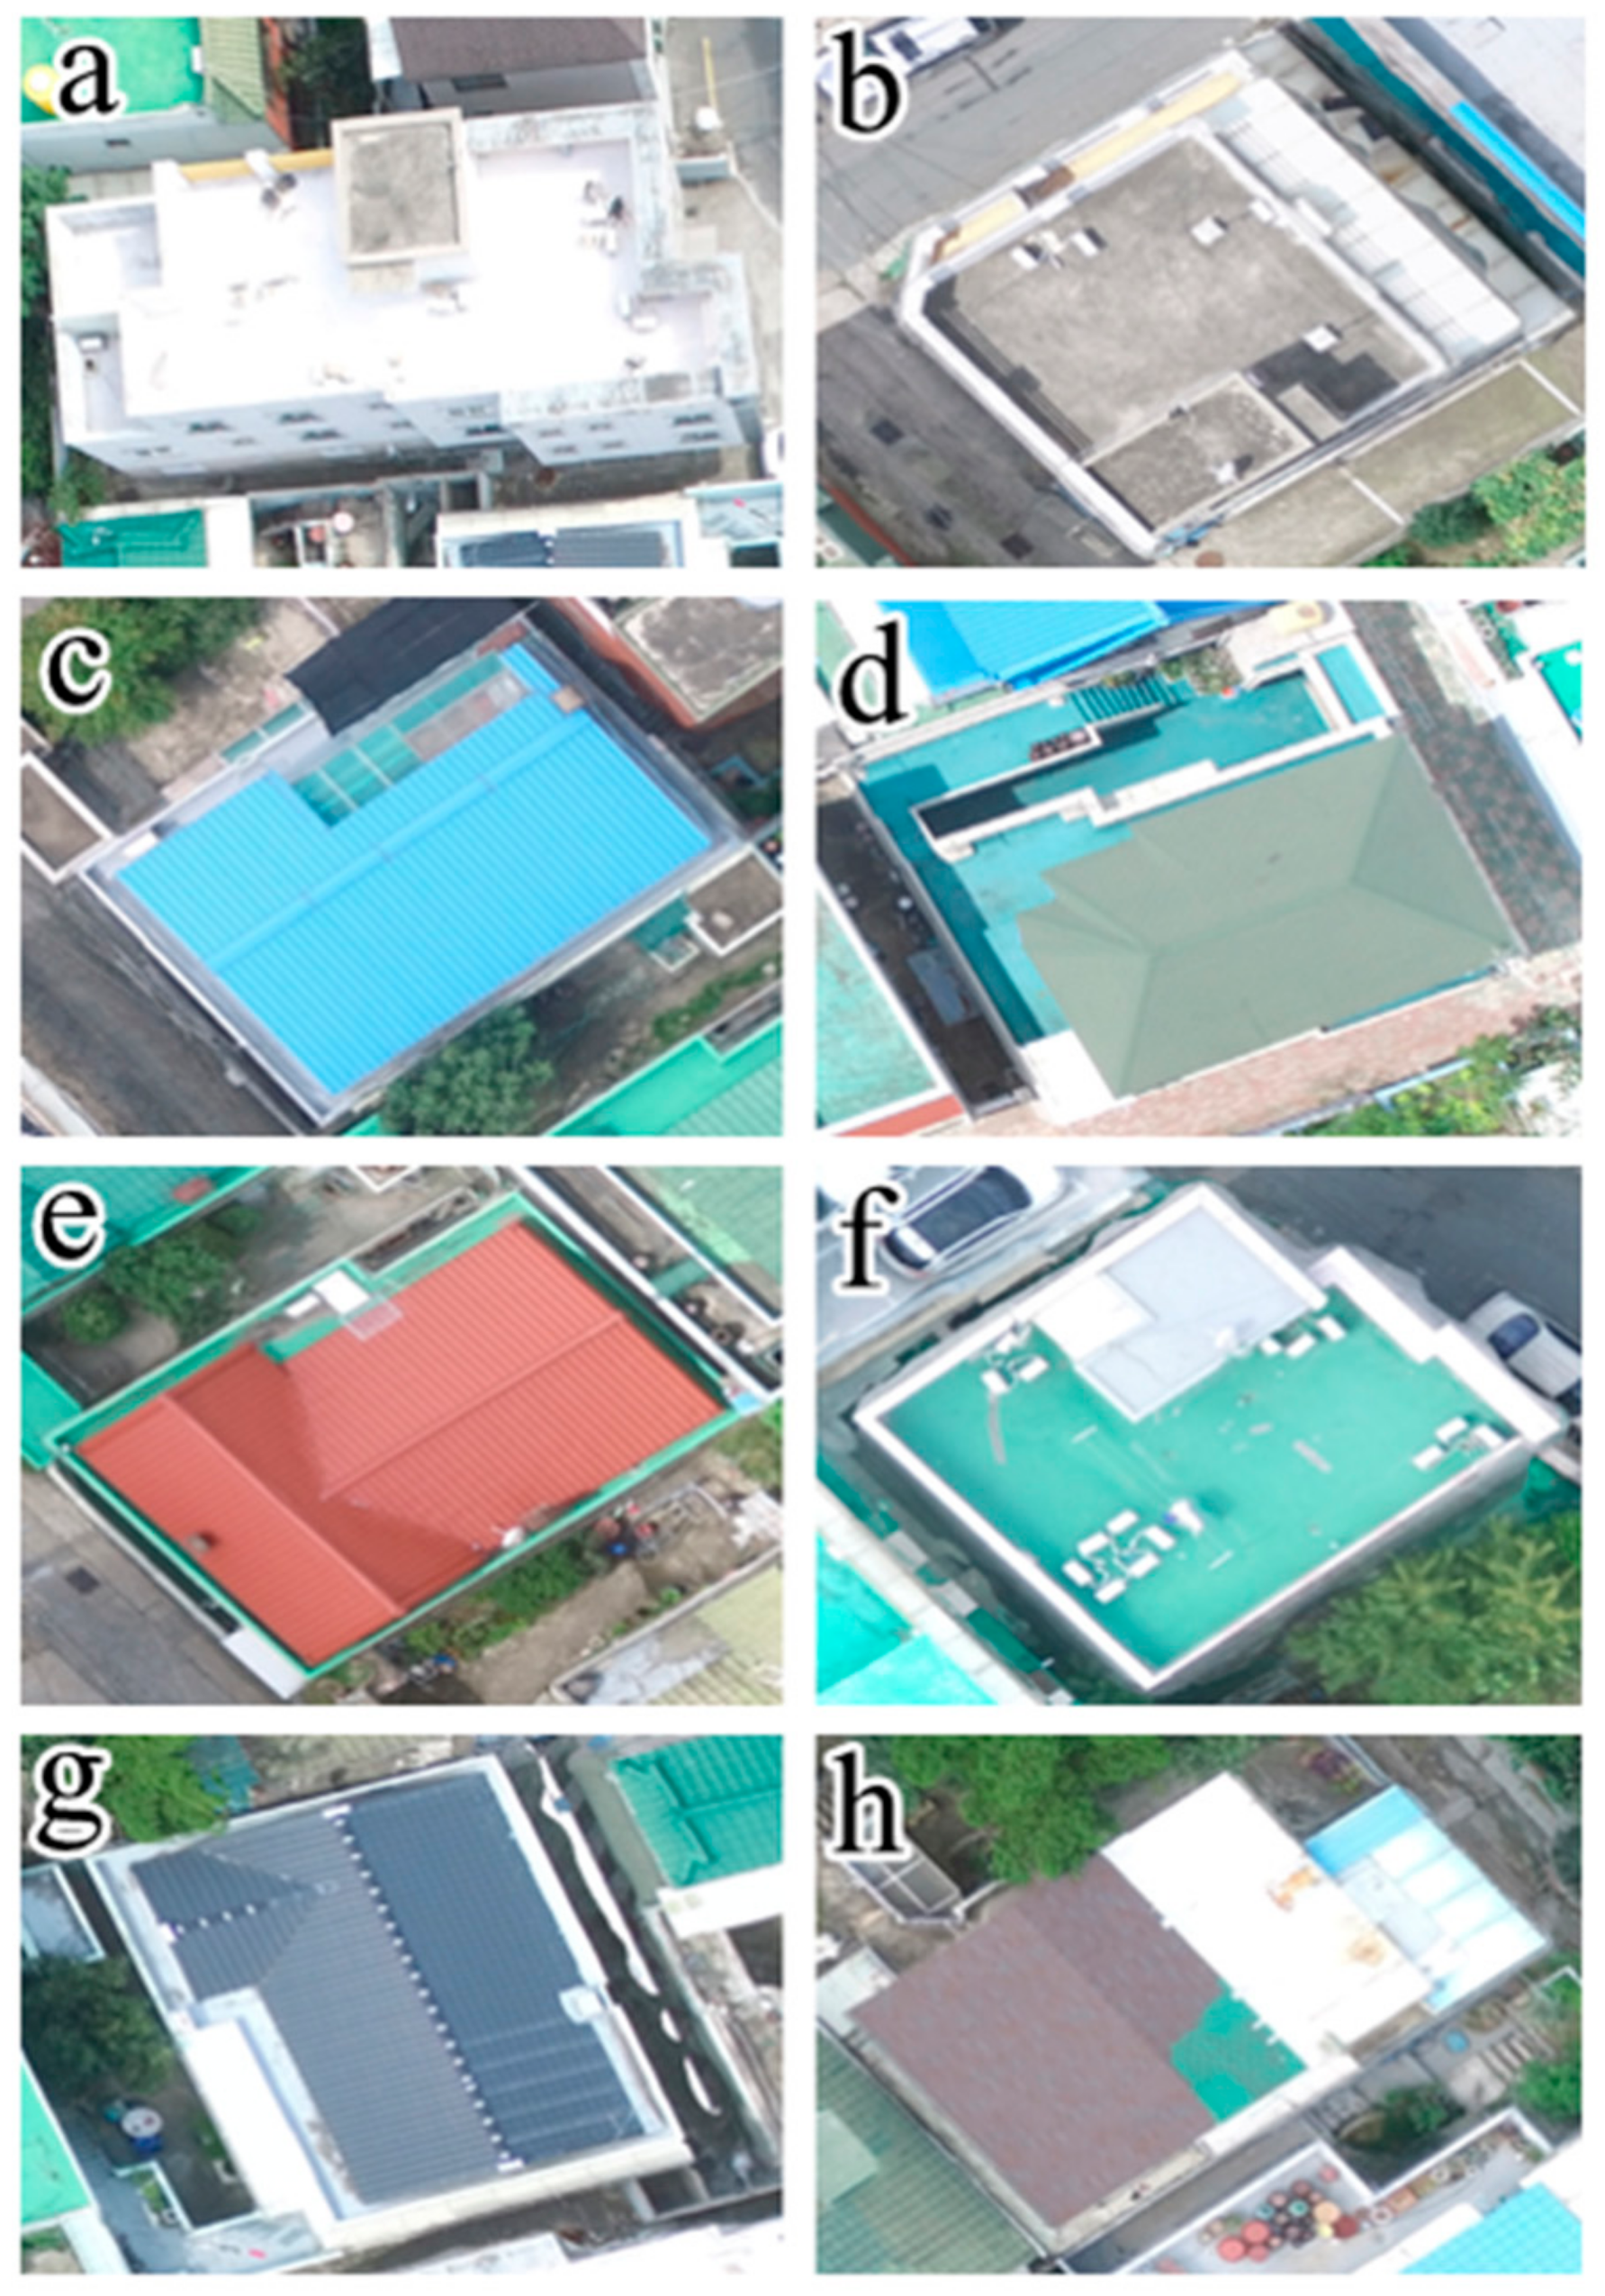
The highest LRV was observed in the whitish color rooftop (
Figure 4a, LRV: 91.4,
Table 3) while the lowest LRV index appeared in the black color (
Figure 4g, LRV: 18.1). The dark gray color showed an LRV index nearer the black rather than the white roof (
Figure 2b, LRV: 37.4). Because the surface of the flat roof in the experimental area is mostly covered by cement, it was initially light gray at the time of building construction. However, because it was left untreated for a long time without proper maintenance, the original surface of the rooftop has been disturbed by various air pollutants, such as particulate matter, dust, and soot. Therefore, the LRV for the dark gray color tends to be low as it approaches that of the black color. The blue roof showed the highest LRV (
Figure 4c, LRV: 65.4) in two channels of the CIELAB system expressed as the green–red and blue–yellow color components, while the lowest LRV in the two channels was observed in the reddish colored roof (
Figure 4e, LRV: 25.3). There was a large difference in the LRV (red: 25.3, blue: 65.4) within the two channels. The dark brown color roof (
Figure 4h, LRV: 27.8) shows similar distribution patterns to those of the black roof (
Figure 4g, LRV: 18.1). A relatively low LRV was observed in the rooftop painted by urethane for waterproofing (green,
Figure 4f, LRV: 54.4), indicating that the paint is the cause increasing cooling load during summer.
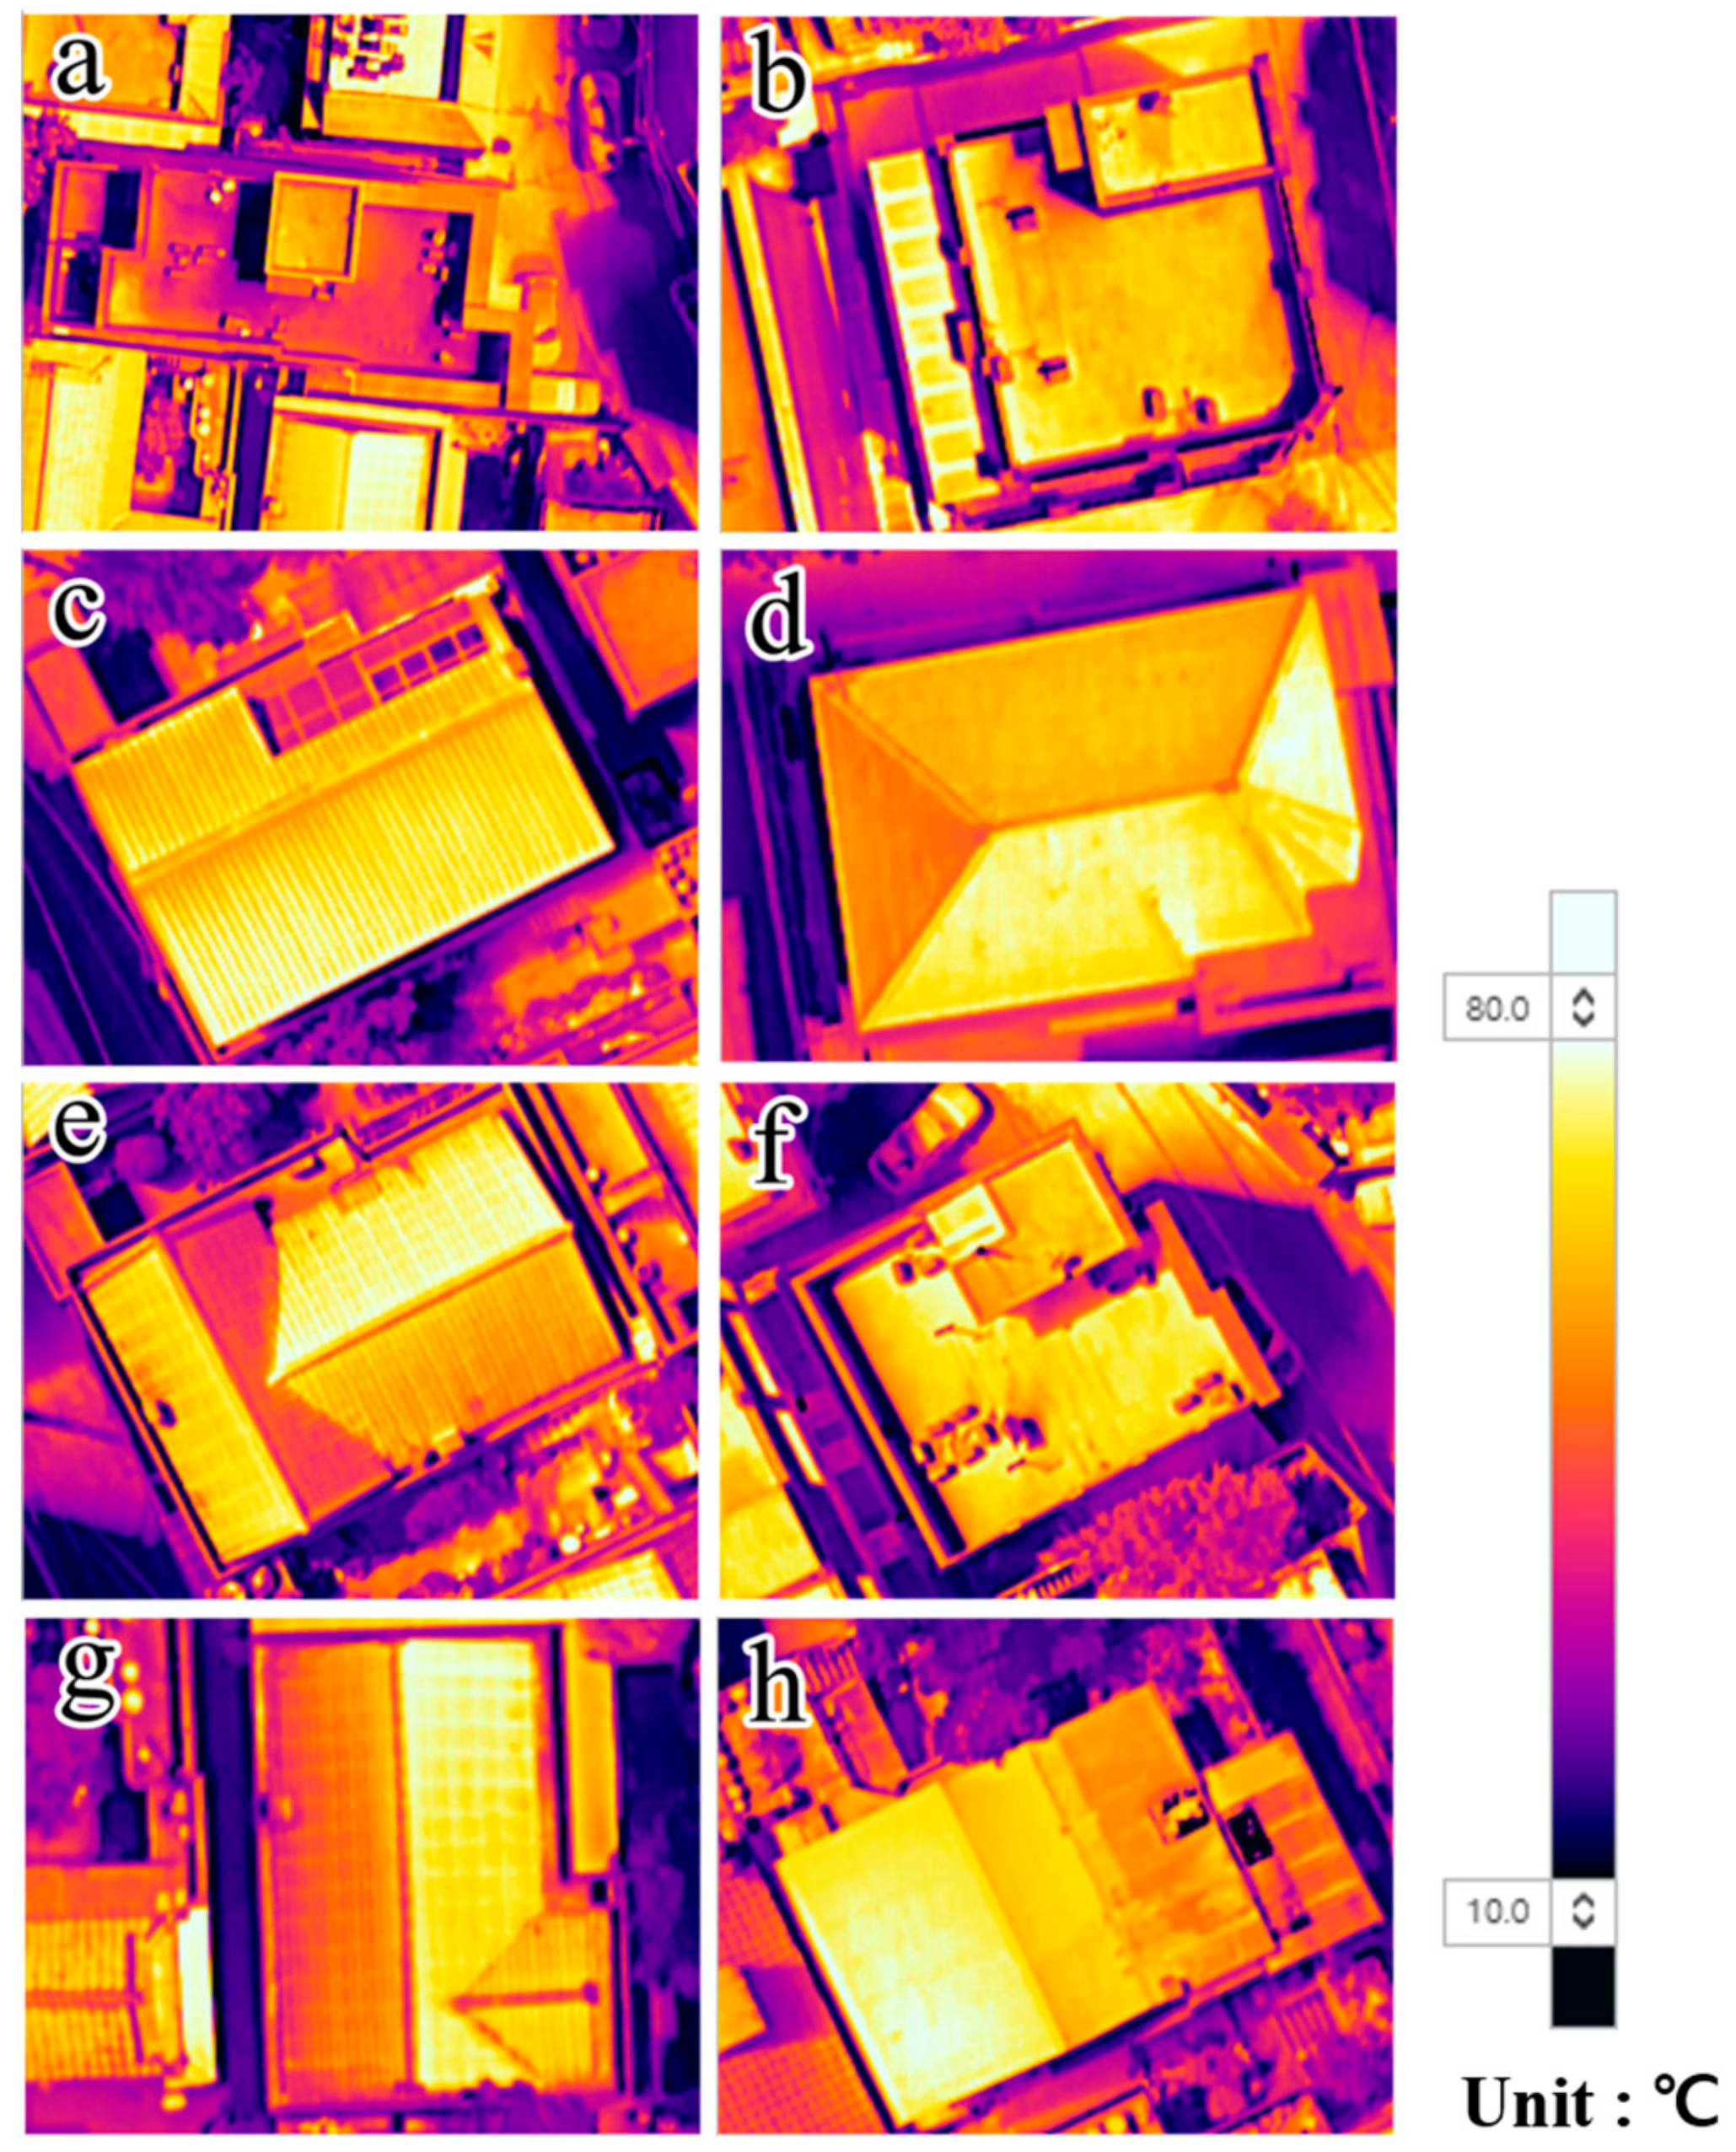
The thermal image used to verify the LRV reflectivity shows a bright yellow color as the rooftop surface temperature increases while it is observed as a darker color at a lower temperature (
Figure 5). Although the ambient temperature was constant (27.2 °C), it was confirmed that the surface temperature varied depending on the rooftop color. The high LRV white roof (LRV: 91.4) showed the lowest average surface temperature of 39.0 °C (
Figure 5a). In the case of the black roof corresponding to the low LRV (LRV: 18.1), a considerably high surface temperature (65.0 °C) was observed as shown in
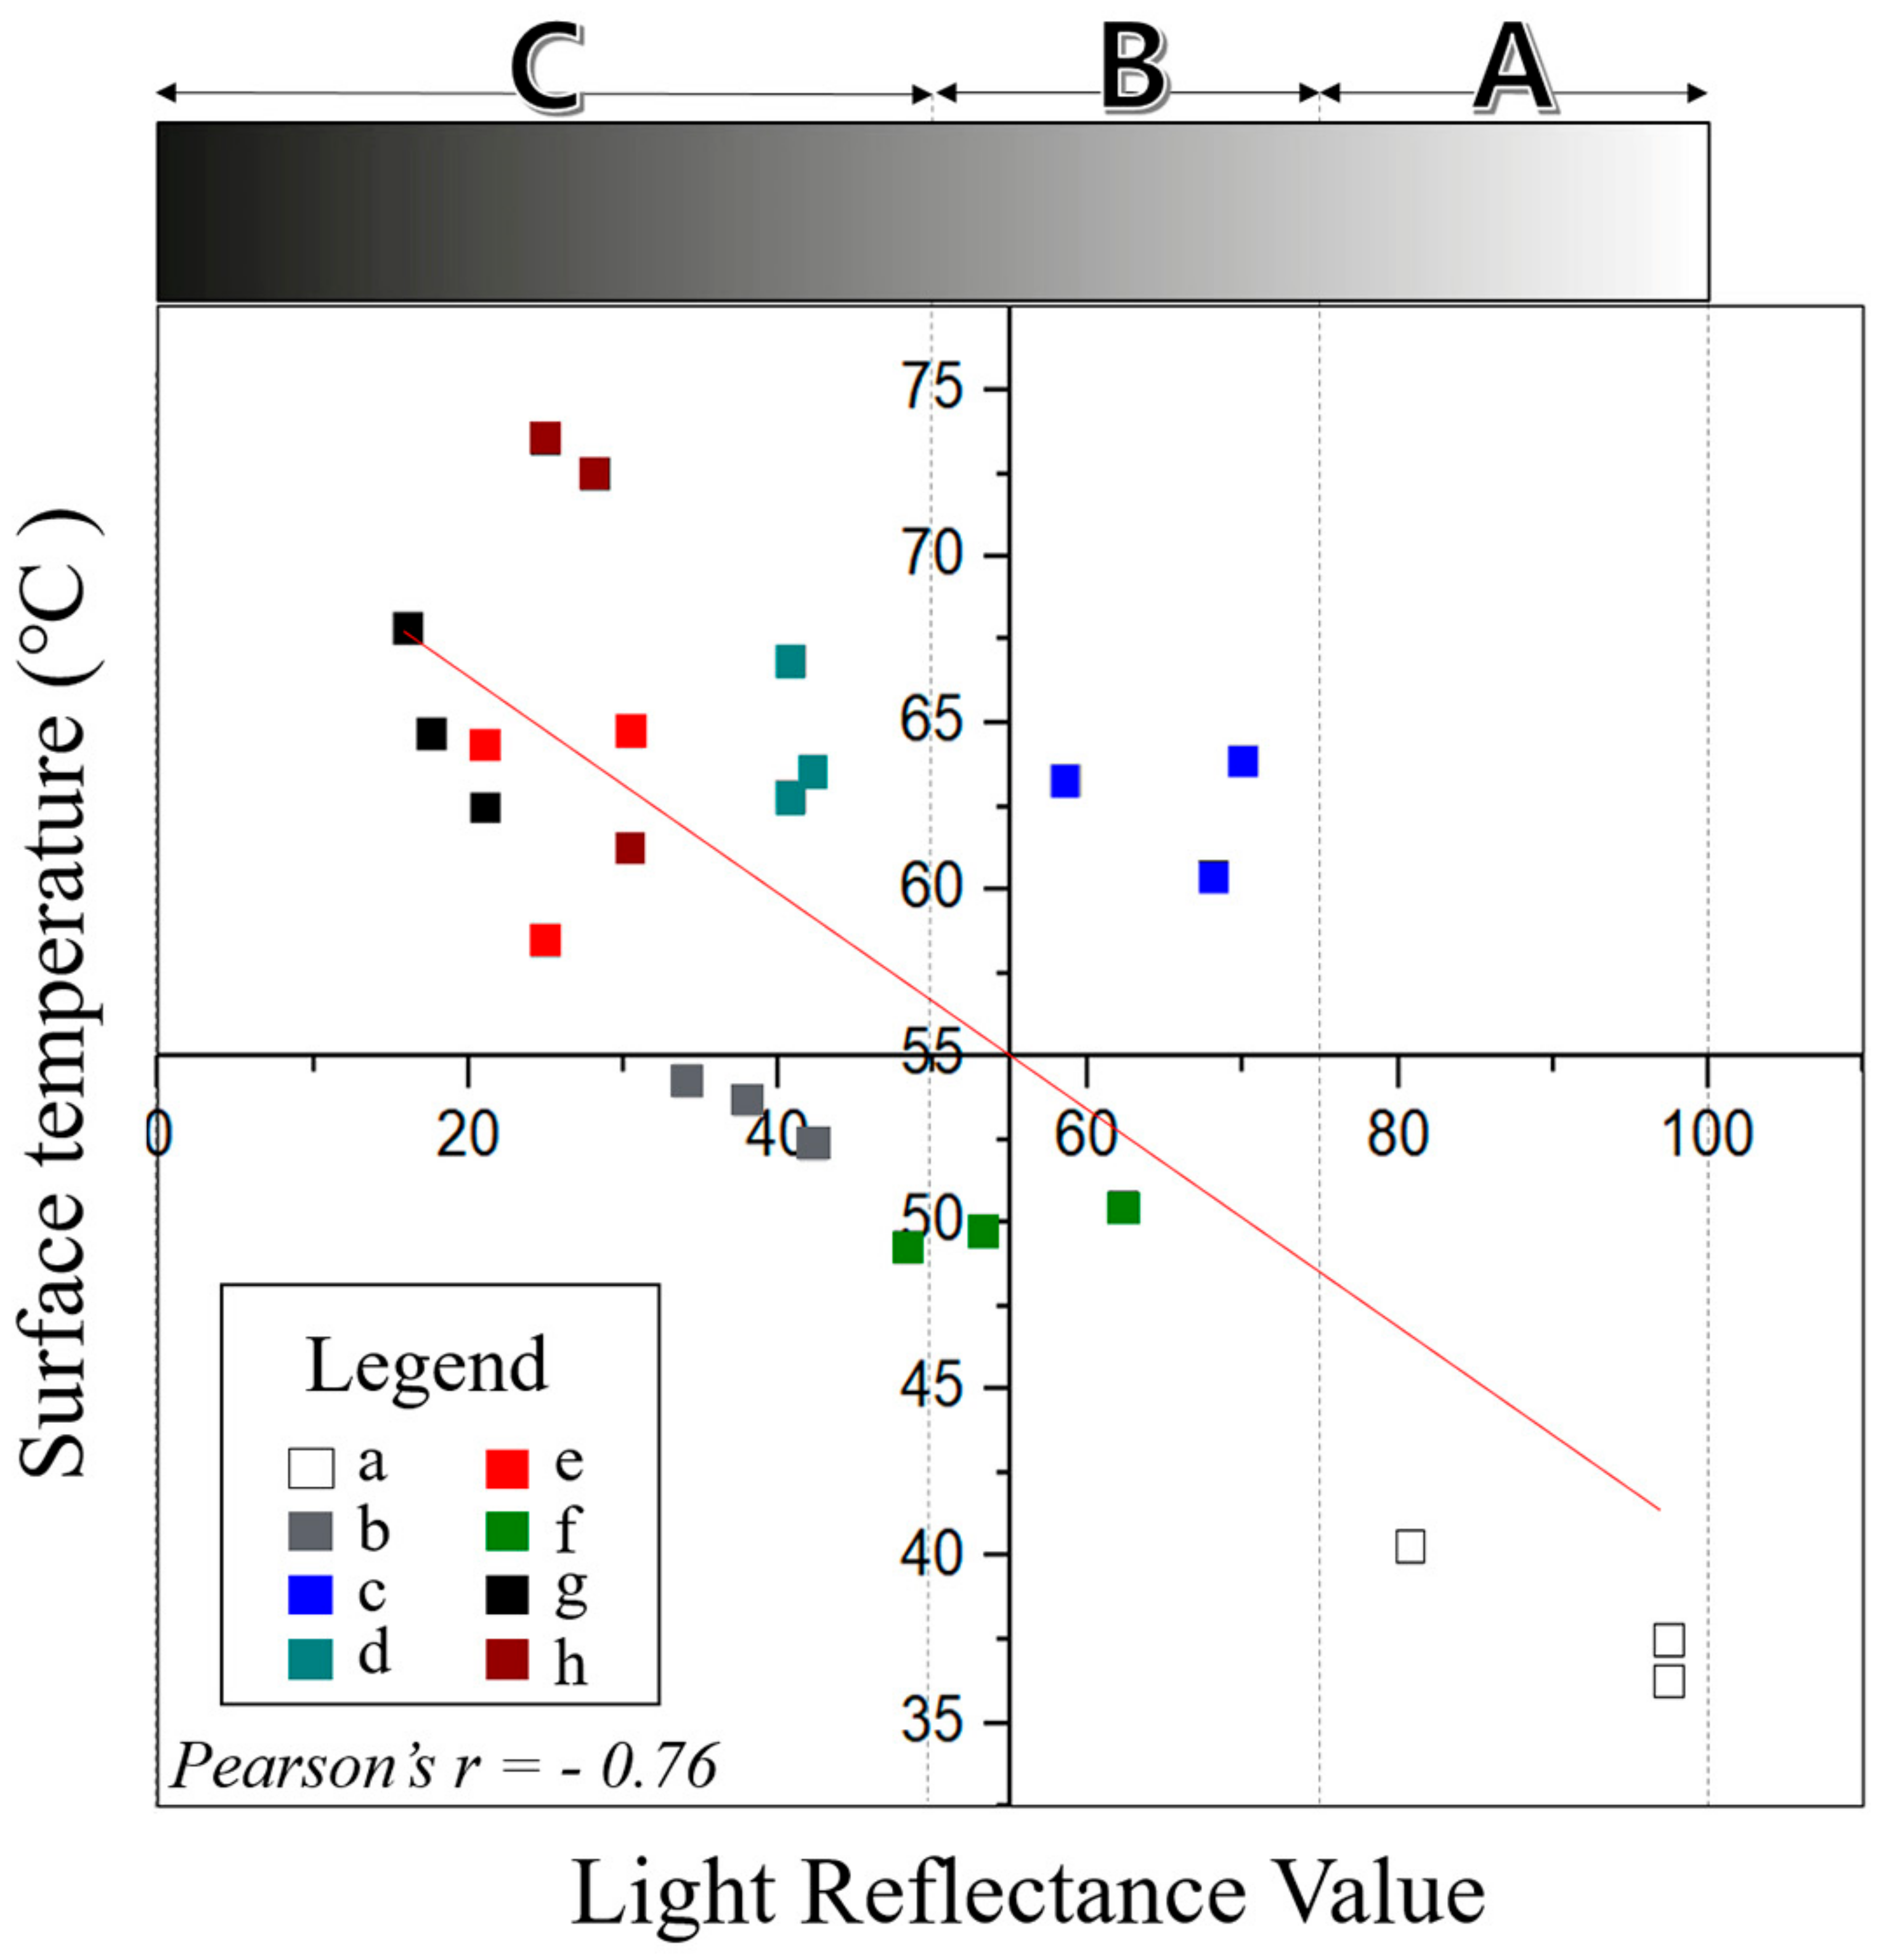
Figure 5g. There was a significant negative correlation between LRV and surface temperature (Pearson correlation coefficient, r = −0.76) as shown in
Figure 6. The correlation analysis provides a quantitative overview of the rooftop surface temperature changing according to the various colors such as black, white, blue, etc. Notably, there is a systematic LRV distribution pattern (
Figure 6 A: whitish, B: intermediate, C: blackish) according to rooftop surface temperature. An implication of these LRV signature ranges is that there is the potential to evaluate cool roofing performance using the distribution pattern (A–C) of the LRV signatures.
It is known that cool roofs reflect as much as 75% or more of incoming solar energy [
42]. The LRV range shown in
Figure 6A (75 or above) reflects most of the solar energy back into the atmosphere. It satisfies the requirement of a cool roof because of the reasonably high reflectance (whitish roof, LRV: 91.4). The intermediate section (LRV: 50–75) shown in
Figure 6B significantly decreases the solar reflectance. In this section, the efficiency as a cool surface is degraded as the thermal transmittance increases. The blue (LRV: 65.5) and green color roofs (LRV: 54.36) are included in this section. In the case of the LRV range shown in
Figure 6B, it is not easy to increase the solar reflectance to meet the threshold value as a cool roof (75% or more reflectance of incoming solar energy). The cooling load in the rooftop occurs via the interaction between solar reflectance and thermal emissivity. Rooftop surfaces coated by high emissive materials show low temperatures while releasing less heat to the atmosphere when exposed to the sun [
41]. Therefore, in this case of the LRV range shown in
Figure 6B, it is suggested that a surface treatment or coating increasing the solar emissivity can be considered as an alternative to meet the performance standard of a cool roof. The blackish section shown in
Figure 6C is considered to have a larger amount of thermal transmittance than reflected heat. Most of the rooftop samples collected in this study area are in this section. Because the solar intensity in this section cannot be efficiently controlled through reflection, it is difficult to alleviate the cooling and heating load via rooftop color.
Typically, costly thermal cameras are always recommended as a traditional practice of remote sensing in the literature for detecting the thermal condition for an area-wide target. This study offers an attractive solution of an inexpensive alternative via LRV by demonstrating tangible evidence for various rooftop colors (
Table 4). The results of this study can be converted into a practical tool to counteract the typical thermal sensor option in a cool roofing application. This will allow a reduction in the remote sensing costs to some extent for cool roof testing. Introducing LRV in cool roof testing positively works as the general public perceives the camera with visible sensitivity as even friendlier than a thermal infrared camera. Thermal UAV imagery is not yet established as a common instrument in cool roof testing because the camera purchase cost exacerbates the situation. Too much theoretical culture amid the remote sensing literature tends to reject the demand for a UAV camera with the common visible sensor in environmental monitoring and assessment. This unnecessarily increases the remote sensing cost in cool roof testing where rooftops of various colors are commonly distributed. Introducing an inexpensive and user-friendly alternative to cool roof testing will promote discouragement of hot roofing practices.
SRI is measured by the field survey with the portable solar reflectance and infrared emissivity meter on the installed cool roof or to indirectly verify the certificated cool roof coating materials according to ASTM E1980 (ASTM International, formerly known as American Society for Testing and Materials, is an international standards organization that develops and publishes voluntary consensus technical standards for a wide range of materials, products, systems, and services). The SRI measurement process requires a minimum of 10 × 10 (ft) of packaging space and uses fairly expensive equipment [
43]. Various previous studies have been reported to evaluate the cool roof performance using SRI [
18,
19,
20,
44,
45]. Measuring SRI on the specific packaging space of the surveyed roof is a traditionally used method. The investigator should measure the solar reflectance when the sun angle from a surface is less than 45 degrees at a minimum of three measurement points separated by more than 10 times the height of the sensor above the surface being measured. The obtained solar reflectance and emissivity data by field survey have the possibility to be fluctuated by various noise factors (the measurement points, measurement periods/frequency, and the sensitivity of sensors in portable meters, etc.). It is impossible for these field-based SIR to assess the area-wide performance of cool roof and energy savings because the surveying instrument can measure a rooftop target at packaging space limited to a fairly narrow range.
The roof coating material measured by SRI has a significant impact on the color, which is the basis for the LRV [
46]. Theoretically, the thermal emissivity measured by SRI is highly correlated with the color, which is the basis for this LRV. It has been widely reported that a white roof has a temperature of about 20–30 °C lower than that of a dark roof [
16]. Many previous studies have also confirmed that the various colors expose different surface temperatures [
47]. The pixel value of the UAV imagery is a key parameter that can be clearly quantified at each stage of the cool roof performance evaluation (before and after installment). It can be a single indicator that can represent the two variables (solar reflectance and infrared emissivity) measured by SRI. A clear verification from this study has been made for the hidden potential of non-typical UAV imagery in performance evaluation of cool roof that single approach utilizing area-wide reliable LRV is found to be more appropriate in measuring objective rooftop conditions, rather than in situ dual approach (SRI) targeting solar reflectance and coating materials for an individual building.
In the winter, the amount of solar radiation incident on the roof surface is absolutely less than that of the summer season since hours of bright sunshine is short. In summer, the amount of solar radiation incident on the roof surface is absolutely greater than in winter since the hours of bright sunshine are very long. Therefore, summer is the best season for analyzing the surface characteristics of individual roofs in terms of cool roof performance. However, the cooling load reduced by the cool roof in summer can increase the heating load in winter since the cool roof strongly reflects the incident sunlight. In the following study, it is necessary to evaluate the performance of a cool roof in terms of energy savings by utilizing more data with a longer period acquired during different times and months.


