Article

Carbon Emission Evaluation Based on Multi-Objective Balance of Sewing Assembly Line in Apparel Industry

College of Textile and Clothing Engineering, Soochow University, Suzhou 215021, China
*
Author to whom correspondence should be addressed.
Energies 2019, 12(14), 2783; https://doi.org/10.3390/en12142783
Submission received: 17 June 2019 / Revised: 12 July 2019 / Accepted: 12 July 2019 / Published: 19 July 2019

Abstract

:
Apparel manufacturing is an industry with high energy consumption and carbon emissions. With the development of the low-carbon economy, low-carbon production in the apparel manufacturing industry become more and more imperative. The apparel industry is encountering great challenges in reducing carbon emissions. Garment sewing comprises a large number of processes, machines and operators. However, the existing studies lack quantitative analysis of carbon sources in the sewing process. This study analyzed the carbon emission characteristics in garment sewing production. Evaluation models of carbon emission were established for the sewing process in this research and the factors of fabrics, accessories, sewing machines and operators were included in the models. The results showed that fabrics and accessories were the main sources of carbon emissions in garment sewing production. The second largest carbon emission source was sewing machines, followed by operators. According to the evaluation models, the number of machines, operators and the utilization rate of the machines were related to the balance of the assembly line. A multi-objective optimization model aimed at minimizing the time loss rate and smoothness index of the assembly line was established, and a fast and elitist multi-objective genetic algorithm was used to obtain the solution for carbon emission reduction. The men’s shirt assembly lines, based on three types of workstation layouts (the order of processes, the type of machines and the components of the garment), were applied to verify the effectiveness of the model and algorithm. The results indicated that the total carbon emissions of the three assembly lines based on balance optimization were less than that of the normal assembly line. The assembly line of the workstations arranged in the order of processes was the best assembly line since it had the highest efficiency and the lowest carbon emissions.

Graphical Abstract

1. Introduction

Global warming poses a threat to the natural environment and human economic development [1,2]. Many studies have shown that global warming is mainly due to the increasing emissions of greenhouse gases (GHGs) caused by human activities, prompting companies to focus on carbon emission from production [3,4,5]. Human impact on the environment is estimated by the carbon emissions generated during a products life. The assessment of carbon emissions can help companies provide more green products and services.
With the development of society and the increasing population, the consumption of garments is increasing year by year, thus, the carbon emissions of garment production cannot be ignored. In particular, the apparel industry is an important energy consumer and leads to environmental and health-related risks [6]. According to reports, the apparel industry accounts for 10% of global carbon emissions, it is becoming the second largest industrial pollution source following the oil industry [7]. However, the pollution caused by the garment industry has not been fully discussed in the literature, which is probably due to the environmental impact of the oil and gas industry. Sewing is one of the key processes in garment production and involves many operations [8,9]. As shown in Figure 1, the carbon emission sources of sewing process include fabrics, accessories, sewing machines and operators. At present, there are some obstacles in the evaluation methods of garment sewing production, such as the difficulty of tracking and monitoring the detailed production processes. So, there are few studies on carbon emissions in the textile and garment field [10]. Nowadays, most research on carbon emission reduction focuses on spinning, weaving and materials. For example, in [11], it was found that 1 kg of fabric emitted 12.5 kg of CO2 from the spinning, weaving, dyeing, cutting, sewing, finishing to transportation. The carbon emissions of the T-shirt production process were 12 times more than their own weight. In [12], it was found that a cotton T-shirt weighing about 250 g emitted about 7 kg of CO2 during its service life, which was 28 times more than its own weight. For a pair of trousers with a service life of about 2 years and 10% polyester in composition, the total carbon emissions of the production and consumption were about 47 kg, which was 117 times more than its own weight. In [13], it was found that the carbon emissions of the production process of apparel products could account for 70% of the total carbon emissions of the product. In [14], carbon emissions for cotton and wool fabric products were evaluated. The results pointed out that the industrial carbon emission of wool fabrics was almost three times that of cotton fabrics. The industrial carbon emissions of yarn-dyed fabric was higher than that of dyed fabric, and the industrial carbon emissions of plain weave fabric was higher than that of rib fabric. The consumption of energy, for instance electricity, steam and coal, was the main source of industrial carbon emissions. In [15], the energy consumption of the plants in the entire knitted garment production chain was investigated. Specific energy consumption and carbon emission for producing one piece of knitted garment from dyed to finished fabric was found as 0.78–1.44 MJ/piece and 0.09–0.17 kgCO2/piece, respectively. The steam production, compressors and lighting equipment had a considerable share in total energy consumption and cost. Application of energy efficient lighting equipment was found to have the highest energy saving potential. In [16], the ecological footprint of a garment factory was studied. The evolution of environmental impacts caused by equipment performance was evaluated and the environmental performance of different manufacturing processes was compared. The results indicated that the value of the carbon footprint was influenced by the type of fabric used in the manufacturing process. In [17], the carbon footprint of an apparel plant producing jackets was studied. The cutting process was the most energy intensive stage. Other apparel companies [18] also reduced carbon emissions of organic cotton T-shirts by actively implementing measures.
In terms of textile and garment production, many companies have a large space for carbon emission reduction, but there is no convincing calculation model to guide them. Therefore, it is very necessary to establish an evaluation model for greenhouse gas emissions from garment sewing production and seek potential energy conservation measures.
The balanced assembly line can not only improve the production efficiency, but also can ensure the effective timing of the machines [19,20] and reduce the carbon emission in the production process. The balance study of garment sewing assembly lines is mainly a single model [21,22]. Most research mainly focuses on the mechanical and electronic field, while little research focuses on the balance optimization of the sewing line [23]. In [24], a genetic algorithm was applied to optimize operator assignment and minimize maximum completion time for apparel assembly lines. In [25], a universal mathematical model of the job shop scheduling for the apparel assembly process was constructed. A genetic optimization process was presented to solve this model. In [26], a genetic algorithm was applied to solve operator assignment in predefined workstations of an assembly line. In [27], a grouping genetic algorithm was developed for sewing lines with different labor skill levels in the garment industry.
In the real world of assembly lines, it is highly desirable to achieve two or more objectives simultaneously. In most cases, these objectives may conflict with each other, and the performance of each objective may be not improved without sacrificing the performance of at least one objective. Therefore, most solutions of multi-objective problems are to find the trade-offs between objectives. In the Pareto set, many solutions give different values for multiple objectives in each solution. From these solutions, a solution that gives the most optimistic objective value for all objectives is considered a better solution. In other manufacturing industries, [28] considered simultaneously minimizing the separation time, workload changes and worker costs. A multi-objective genetic algorithm was proposed to obtain the solution. In [29], multi-objective optimization of random disassembly lines was proposed. The aim was to minimize the number of workstations and minimize the design costs associated with labor and equipment. In addition, a new multi-objective genetic algorithm was proposed to obtain the solution. In [30], a multi-objective genetic algorithm was proposed to solve a U-shaped assembly line balance problem. A two-stage genetic algorithm was derived by [31] to solve the mixed model U-shaped assembly line. In [32], a hybrid genetic algorithm was proposed to solve a mixed model assembly line balance problem. There were three objectives to be achieved: minimize the number of workstations, maximize the workload smoothness between workstations and maximize the workload smoothness within workstations.
Several multi-objective optimization studies on the assembly line problem consider minimizing pitch time as one of their objectives. In the assembly line, the minimization of pitch time may not be enough, and all tasks assigned to different workstations may not be completed in the expected pitch time. Therefore, smooth workload allocation in the assembly line is very important to reduce workload changes in workstations. In this research, the minimum pitch time and smoothness index of the assembly line are studied.
Generally, the assembly line is arranged by three types of workstation layouts, as shown in Figure 2. The order of processes is where the workstations are arranged according to the processing order. The type of machine workstation layout is where machines required for the same processing content are arranged in the same workstation. The components of the garment workstation layout is where each workstation is arranged so it can produce each garment component.
The purpose of this research was to establish carbon emission evaluation models for garment materials, sewing machines and operators. The assembly line balance results were obtained by the NSGA-II (fast and elitist multi-objective genetic algorithm) algorithm. The effect of different garment sewing assembly lines on carbon emissions was studied. This paper is organized as follows: the carbon emission evaluation models for fabrics, accessories, sewing machines and operators are established in Section 2; the assumptions, constraints and objective function of the sewing assembly line balance model are described in Section 3; the NSGA-II algorithm design is specifically described in Section 4; men’s shirt sewing lines are used for application analysis in Section 5; the study is discussed in Section 6; in Section 7, several conclusions are summarized.

2. Construction of Carbon Emission Evaluation Models

In this research, the sources of carbon emissions in garment production are considered to be from three parts: material consumption, energy consumption of machines and labor consumption. Calculation models of carbon emissions are established by converting energy consumption into a carbon dioxide equivalent.

2.1. Carbon Emission of Fabric Consumption

The fabrics of different garments are different to each other. The fabric of men’s shirts is mostly cotton or polyester-cotton blends. Different types of fabrics have different carbon emission coefficients. The calculation formula for the carbon emissions from fabric consumption is shown in Equation (1).
C F f a b r i c = b = 1 B S b K b
where C F f a b r i c is the total carbon emissions of fabric consumption, unit: kgCO2e; b is the index of fabric types, b = 1, 2, …, B; B is the total number of fabric types; S b is the consumption of the fabric b, unit: kg; K b   is the carbon emission coefficient of fabric b, unit: kgCO2e/kg.

2.2. Carbon Emission of Accessory Consumption

In the sewing process, the processing of each garment component requires different accessories, such as sewing threads, adhesive linings, buttons, zippers and so on. The calculation formula for the carbon emissions from accessory consumption is shown in Equation (2).
C F a c c e s s o r y = r = 1 R S r K r
where C F a c c e s s o r y is the total carbon emissions of accessory consumption, unit: kgCO2e; r is the index of accessory types, r = 1, 2, …, R; R is the total number of accessory types; S r is the consumption of the accessory r, unit: kg; K r   is the carbon emission coefficient of accessory r, unit: kgCO2e/kg.

2.3. Energy Consumption of Discontinuous Sewing Machines

In the sewing process, most machines only work when some semi-finished productions need to be processed. These machines have two different states: full-load and no-load. The discontinuous sewing machines include sewing, overlock, buttonholing, button, etc. The electrical energy consumed per unit output of discontinuous machines is the sum of consumption of full-load and no-load working time. The calculation formula is shown in Equation (3).
E m = m = 1 M [ P m y × i = 1 I j = 1 J t i j m + P m k × i = 1 I j = 1 J t i j m + P m k × ( m a x T R j i = 1 I j = 1 J t i j m ) ]
where E m is the total electrical energy consumption of discontinuous sewing machines per unit production, unit: kW·h; P m y is the full-load power of discontinuous sewing machines, unit: W; P m k is the no-load power of discontinuous sewing machines, unit: W; m is the index of continuous sewing machine types, m = 1, 2, …, M; M is the total number of continuous sewing machines; t i j m   is the operating time of process i using machine m at the workstation j, unit: s.

2.4. Energy Consumption of Continuous Sewing Machines

Some machines are always in s working state in the sewing process, such as electric steam iron, ironing, gluing, etc. The electrical energy consumption of continuous sewing machines can be calculated by Equation (4).
E n = n = 1 N [ P n × i = 1 I t i j n ]
where E n is the total electrical energy consumption of continuous sewing machines per unit production, unit: kW·h; P n is the power of continuous sewing machines, unit: W; P m k is the no-load power of discontinuous sewing machines, unit: W; n is the index of the continuous sewing machine types, n = 1, 2, …, N; N is the total number of continuous sewing machines; i is the index of processes, i = 1, 2, ..., I; I is the total number of processes; j is the index of workstations, j = 1, 2, ..., J; J is the total number of workstations; t i j n   is the operating time of process i using machine n at the workstation j, unit: s.

2.5. Carbon Emission of Sewing Machines

The calculation formula for the carbon emissions of sewing machines is as shown in Equation (5).
C F m a c h i n e s = [ m = 1 M [ P m y × i = 1 I j = 1 J t i j m + P m k × i = 1 I j = 1 J t i j m + P m k × ( m a x T R j i = 1 I j = 1 J t i j m ) ] + n = 1 N [ P n × i = 1 I t i j n ] ] × K e × Q
where C F m a c h i n e s is the total carbon emissions of the machines’ energy consumption, unit: kgCO2e; K e is the carbon emission coefficient of electric energy, unit: kgCO2e/kW·h; Q is the planned production output per day, unit: pieces.

2.6. Carbon Emission of Operators

The operators’ breathing is also important factor affecting the carbon emissions of garment production. In addition to the operators required for sewing production, there are also inspectors of the finished product. The carbon emissions of operators can be calculated by Equation (6).
C F o p e r a t o r = i = 1 I t i × Q × K p d × ( W + W )
where C F o p e r a t o r is the total carbon emissions of operators’ breathing, unit: kgCO2e; t i is the operating time of process i, unit: s; W is the number of the operators; W is the number of the inspectors; K p d is the carbon emission coefficient of operators’ breathing, unit: kgCO2e/s.

3. Multi-Objective Balance Model of Garment Sewing Assembly Line

In practice, companies hope to reduce production costs, increase production and pursue the highest production efficiency. A multi-objective model with the objectives of minimizing balance loss and minimizing smoothness index is constructed. The balanced assembly line can reduce inefficient operating time and energy consumption. Therefore, it is necessary to establish an assembly line balance optimization model. The assumptions of the model are described in Section 3.1 The constraints of the model are introduced in Section 3.2 The objective functions of the model are presented in Section 3.3

3.1. Assumptions

In order to keep the hypothesis reasonable and scientific, the mathematical models in this study are supported by literature references [33,34,35]. The assumptions for the establishment of the assembly line balance model are listed as follows:
  • The total production of garment products, operating time of each process and process order are known.
  • The types and quantities of sewing machines used in each process are known.
  • Each operator uses only one type of sewing machine.
  • Each operator only works on one process at a time.
  • Operators have similar operation proficiency in each process.
  • Some processes can be operated at different workstations.

3.2. Constraints

According to the assumptions and the requirements to establish the model, constraints are proposed as follows. Equation (7) ensures that process i should be operated at one workstation.
j = 1 J X i , j = 1
where i is the index of the processes, i = 1, 2, …, I; j is the index of workstations, j = 1, 2, …, J; X i , j = 1 , if process i is operated at a workstation j; X i , j = 0 , otherwise.
Equation (8) guarantees that the operating time of each process in any workstation should not exceed the assembly line pitch time.
T R j C T
where T R j is the operating time of each workstation; CT is the theoretical pitch time of the assembly line.
The processes operated at all the workstations should be organized according to the sequences of the priority relationship.

3.3. Objective Function

Although the number of machines and the operators are basically confirmed after the assembly line is arranged, the actual pitch time of the assembly line could be optimized. It could be illustrated as minimizing the time loss rate (E).
E m i n = J × m a x T R j j = 1 J i R j t i J × m a x T R j × 100 %
where t i is the operating time of process i, unit: s; R j is the set of processes assigned in the j th workstation.
The pitch time and the minimum number of workstations in the assembly line are known, the workload of each workstation should be balanced. It could be illustrated as minimizing the smoothness index (SI) of the assembly line.
S I m i n = j = 1 J ( C T   T R j ) 2 J
where C T is the actual pitch time of the assembly line,   C T = m a x T R j .

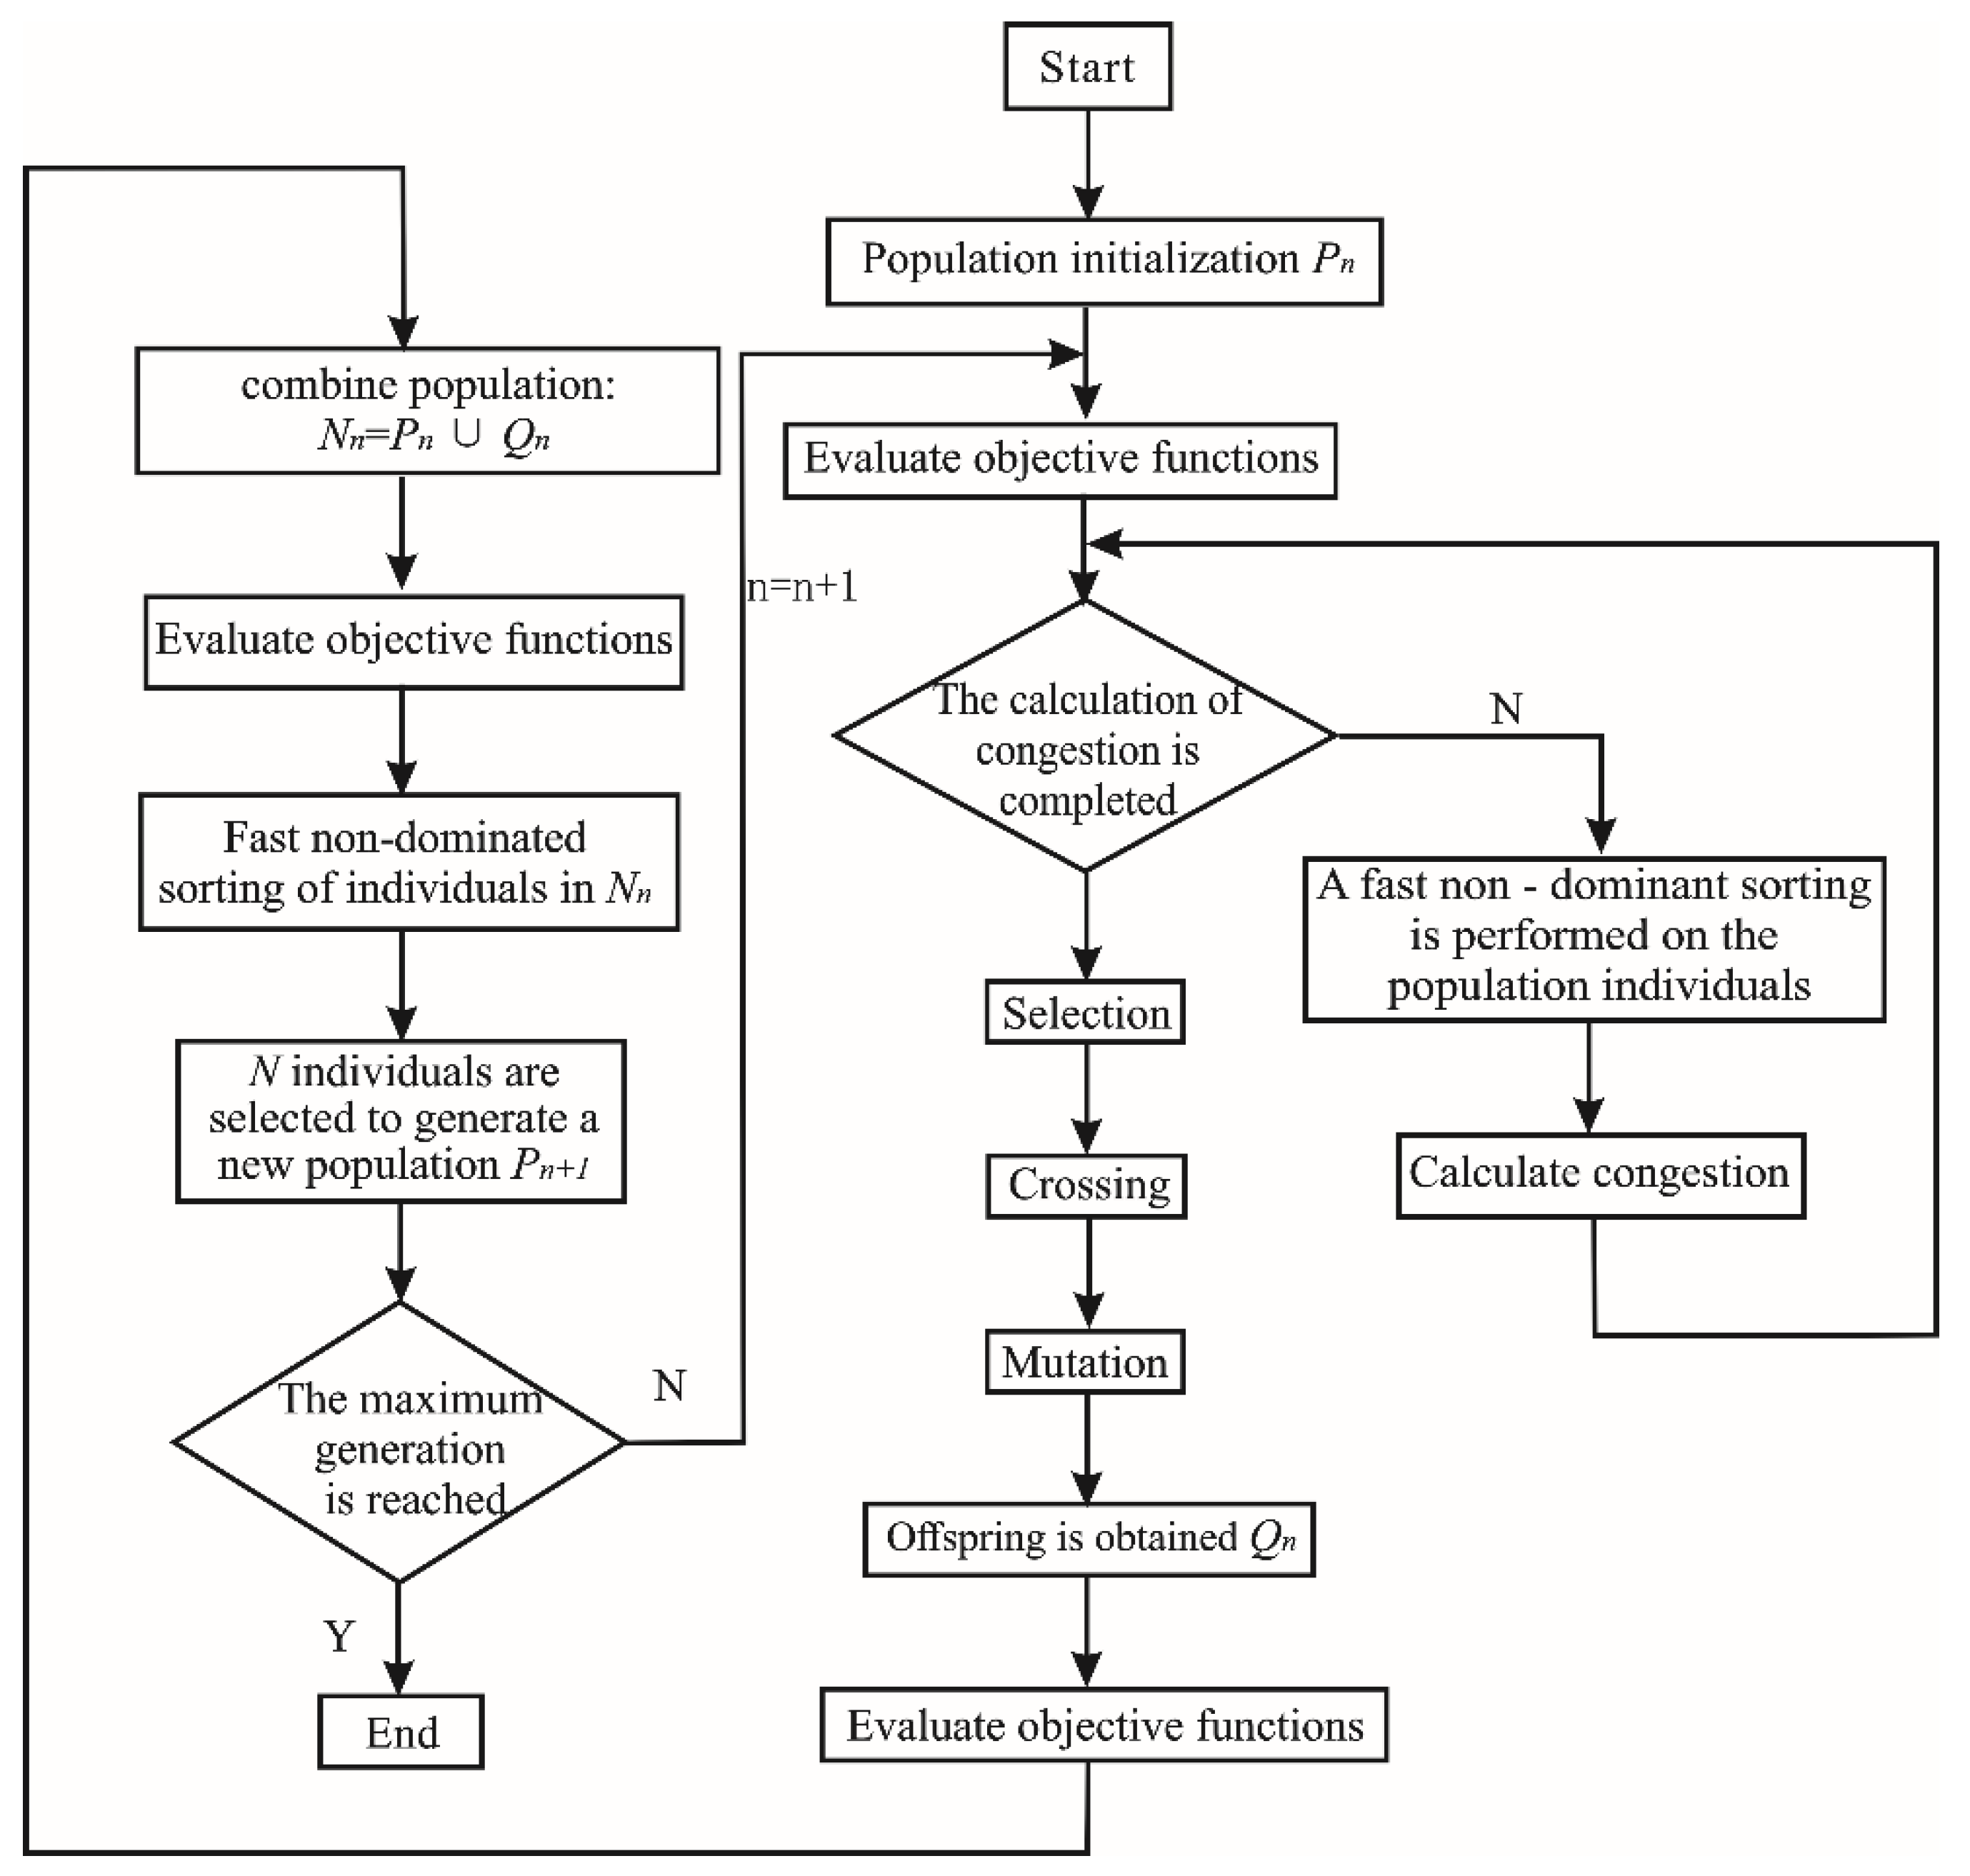
4. Multi-Objective Balance Optimization Method

In this paper, the NSGA-II algorithm is used to calculate the multi-objective balance model of the assembly line. The optimization procedure using NSGA-II is summarized in Figure 3, following that the steps of the genetic algorithm are shown as words.
Step 1
Workstations are coded by a real number (Section 4.1).
Step 2
The overall size is set, and the initial population is generated based on the constraints (Section 4.2).
Step 3
According to the objective function value of each individual, the fast-non-dominant sorting of the contemporary population (Section 4.3) and the congestion distance (Section 4.3) are calculated.
Step 4
Based on the results of the ranking and congestion distance calculations, the tournament mechanism is adopted for selection (Section 4.4), then two individuals are randomly selected for crossing (Section 4.5) and mutation (Section 4.6).
Step 5
Elite retention strategy is adopted (Section 4.4). The father and the subpopulation are combined. A new generation of populations is generated by combining the populations by rapid non-dominant sequencing and virtual congestion distances.
Step 6
The number of iterations is increased by 1, and the operation returns to step 3. This loop will continue until the maximum number of iterations is reached.
The NSGA-II algorithm can be simply divided into six steps: (1) Coding, (2) Population Initialization and Decoding, (3) Fast-non-dominated sorting and Calculating congestion (4) Selecting operation, (5) Crossing operation (6) Mutation operation.

4.1. Coding

In this research, real numbers are used for coding. The processes are arranged in a row according to the priority relationship, and each process corresponds to a gene position in the chromosome. As shown in Figure 4, the largest number of processes is set as the backbone, while the other tributary processes are set as branches. If there is no priority relationship between the branch (process 6 and 7) and backbone (process 1–5), the order of branch (process 6 and 7) can be arbitrarily arranged.

4.2. Population Initialization and Decoding

In this research, the initial population is generated randomly. Before the fitness value of the chromosome is calculated, chromosome coding needs to be segmented according to the requirements of the optimization objective, and the allocation of processes in each workstation is obtained. The decoding method can be illustrated as following steps:
Step 1
The minimum theoretical production pitch time, the value range of the pitch time, and the minimum number of workstations are calculated.
Step 2
The processes are assigned to the workstations according to the sequence of processes in the chromosome. If the operating time of each workstation is less than the theoretical pitch time, the pitch time is the smallest in the chromosome arrangement, the iteration is stopped. Otherwise, the next step is taken.
Step 3
when the ith process is assigned to the jth workstation, the operating time is less than the minimum pitch time, the (i+1)th process is added to the jth workstation. Then it is judged whether operation time of the jth workstation meets the pitch time limit after the (i+1)th process is added.
Step 4
If the operating time of the jth workstation is greater than the maximum pitch time, the ith process is assigned into the (j+1)th workstation.
Step 5
The above allocation processes are repeated until all the processes in the chromosome have been assigned.

4.3. Fast Non-Dominated Sorting and Calculating Congestion

The fast-non-dominated sorting solution is found and classified into the first-level non-dominated solution. After that, a new non-dominated solution is found in the remaining solutions and classified into the second-level non-dominated solution. The operation is repeated until all solutions are assigned.
If the ranks of the non-dominated solutions are the same, it is necessary to distinguish the advantages and disadvantages according to the congestion distance of the non-dominated solutions. And the evenly distributed solution is preferentially selected because of the relatively large crowding distance. The solutions with a large congestion distance and uniform distribution are preferentially selected.

4.4. Operation Selection

In order to ensure the average dispersion of the non-dominated solution frontier, the population evolution is chosen to be close to the position of the non-dominated optimal solution. The principle of binary tournament selection is to arbitrarily select two non-dominated solutions (i and j) into the mating pool. The individual i is better than j when the non-dominated level r a n k i < r a n k j ; if r a n k i = r a n k j , the congestion distance is d ( i ) d i s t a n c e > d ( j ) d i s t a n c e .
Elite retention strategies are adopted to accelerate the rate of convergence.

4.5. Crossing Operation

In this research, a PMX-like (Like Partial-Mapped Crossover) approach is used to deal with real-coded problems. The specific operations are as follows:
Step 1
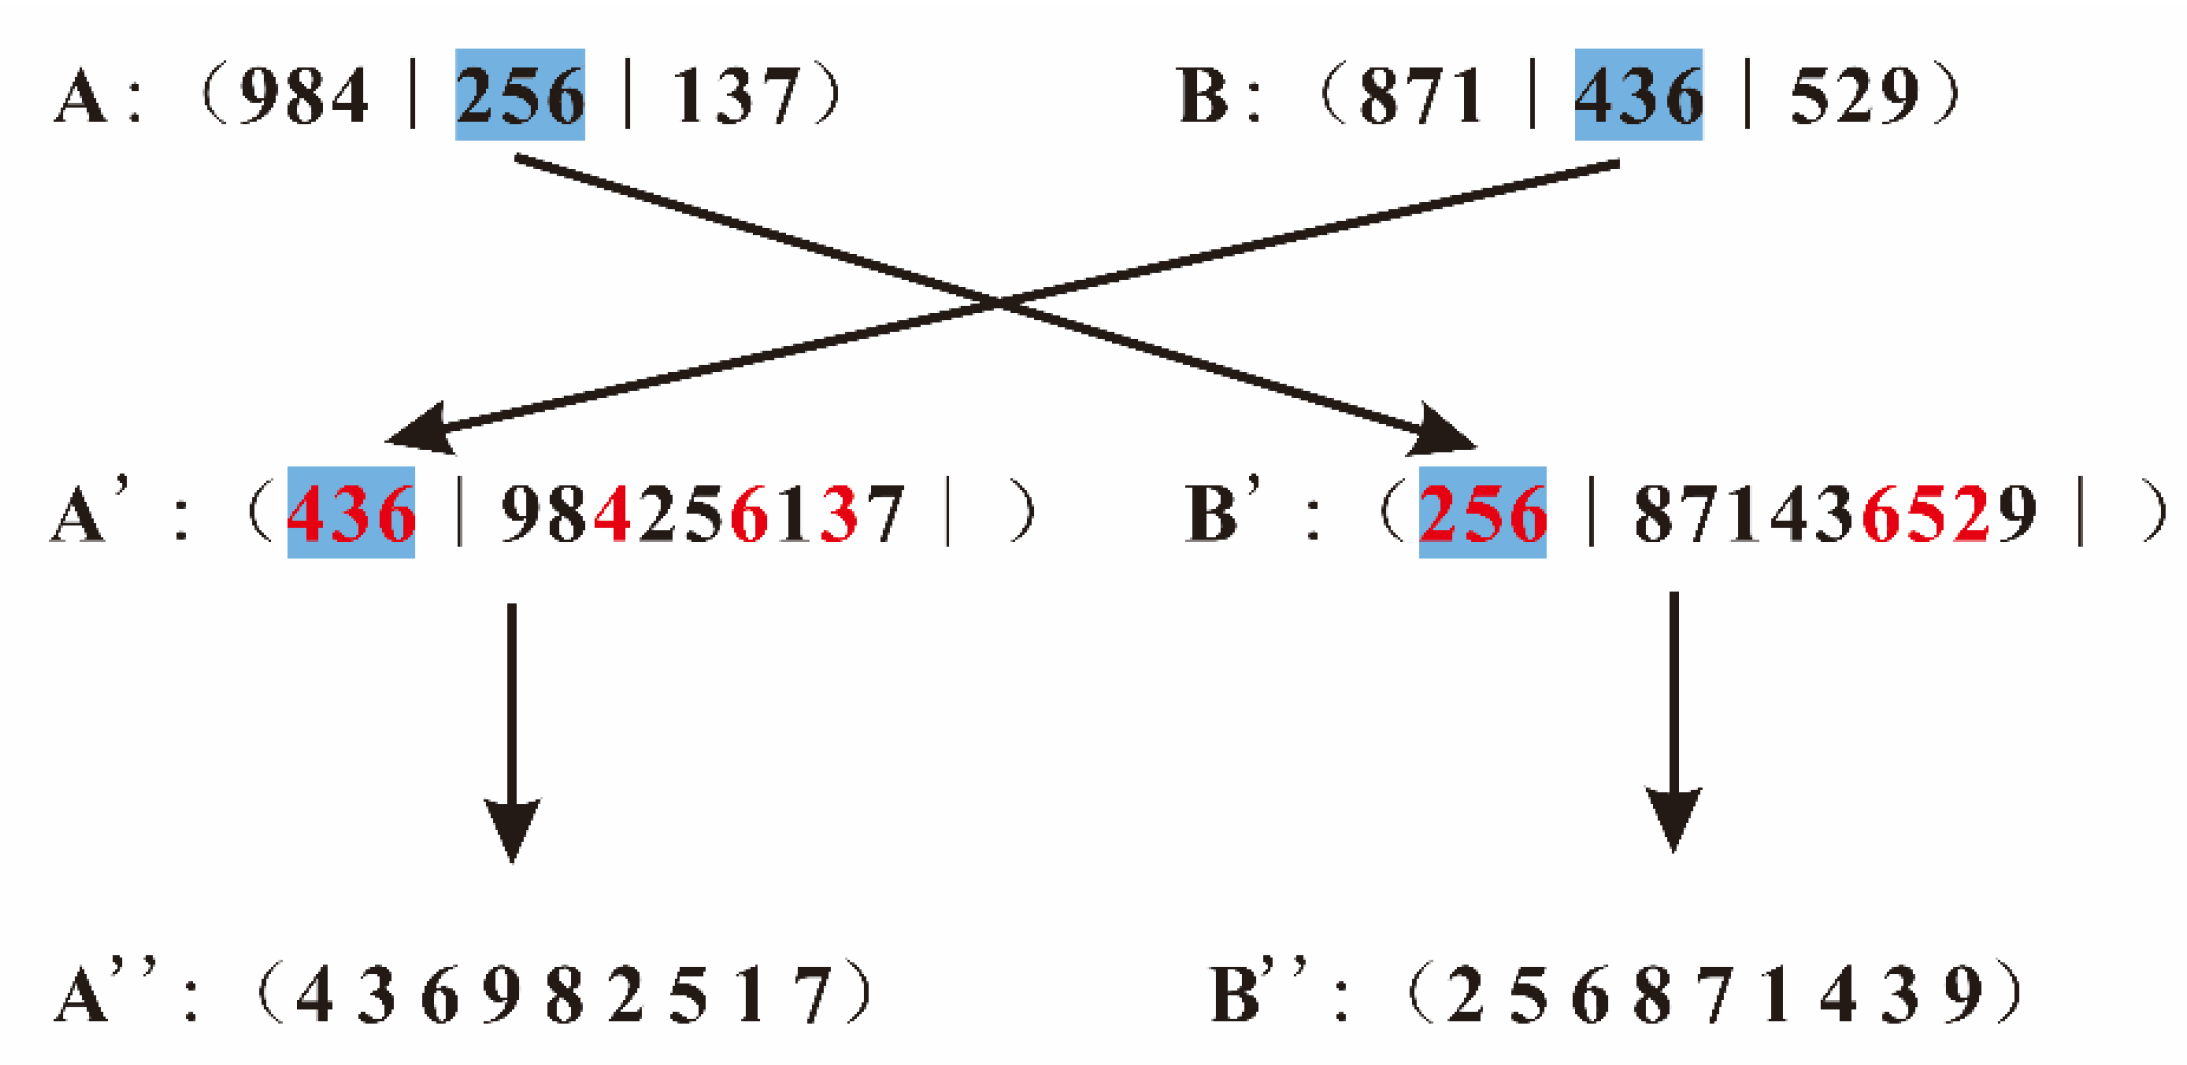
A crossover region is randomly selected in the parent chromosome. It is assumed that the intersection of two parental chromosomes is: A = 984 ∣ 256 ∣ 137; B = 871 ∣ 436 ∣ 529, where “|” represents the intersection area.
Step 2
The intersection region of the A chromosome is inserted in front of the B chromosome. The intersection region of the B chromosome is inserted in front of the A chromosome. Two intermediate individuals A’ and B’ are obtained.
Step 3
The same genes in A’ and B’ are deleted, and the two new chromosomes A’’ and B’’ are obtained. Figure 5 shows the crossing operation.

4.6. Mutation Operation.
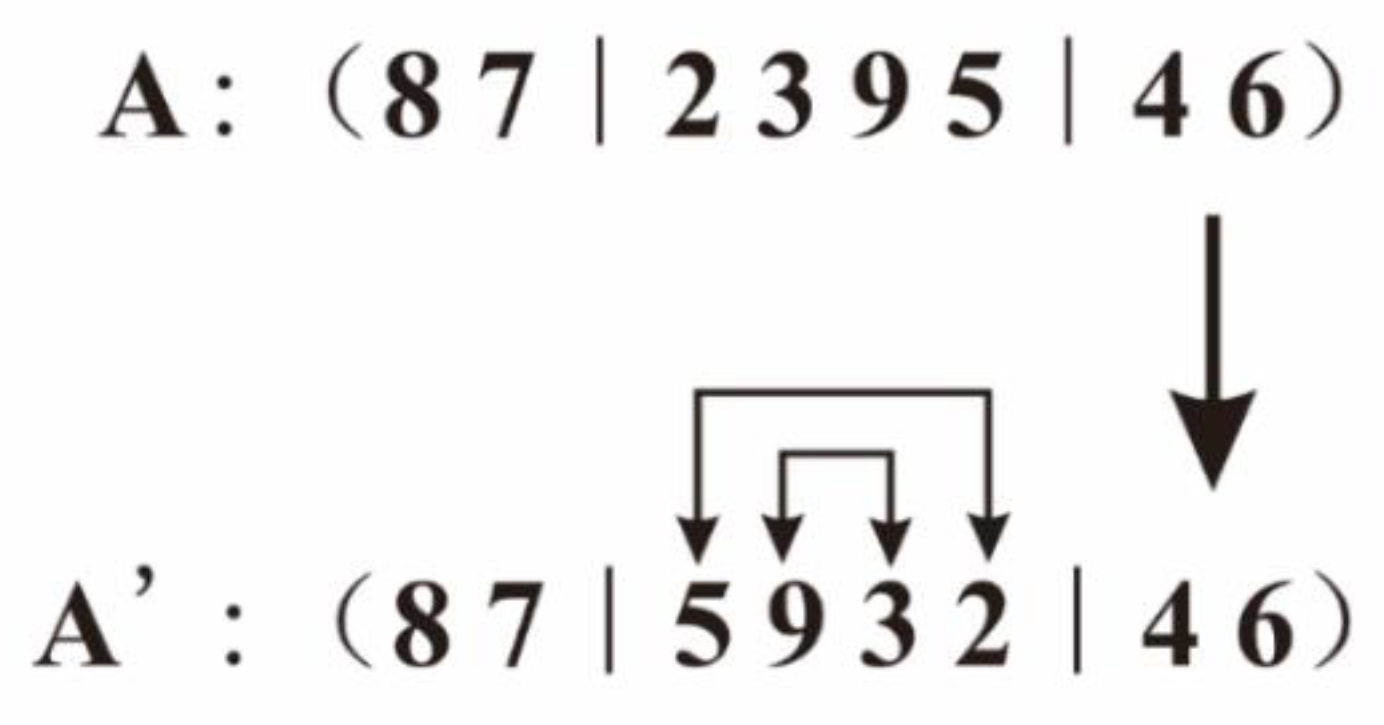
In this research, the inversion mutation operator is used. The specific operations are as follows:
Step 1
Two mutation points are randomly selected on the chromosome. It is assumed that chromosome A = 87239546, and 2 and 5 are selected as mutation points, namely: A = 87 ∣ 2359 ∣ 46, where “|” represents the intersection area.
Step 2
The gene of the variant region is inserted into the original gene position in reverse order to obtain a new chromosome A’. The mutation operation is shown in Figure 6.
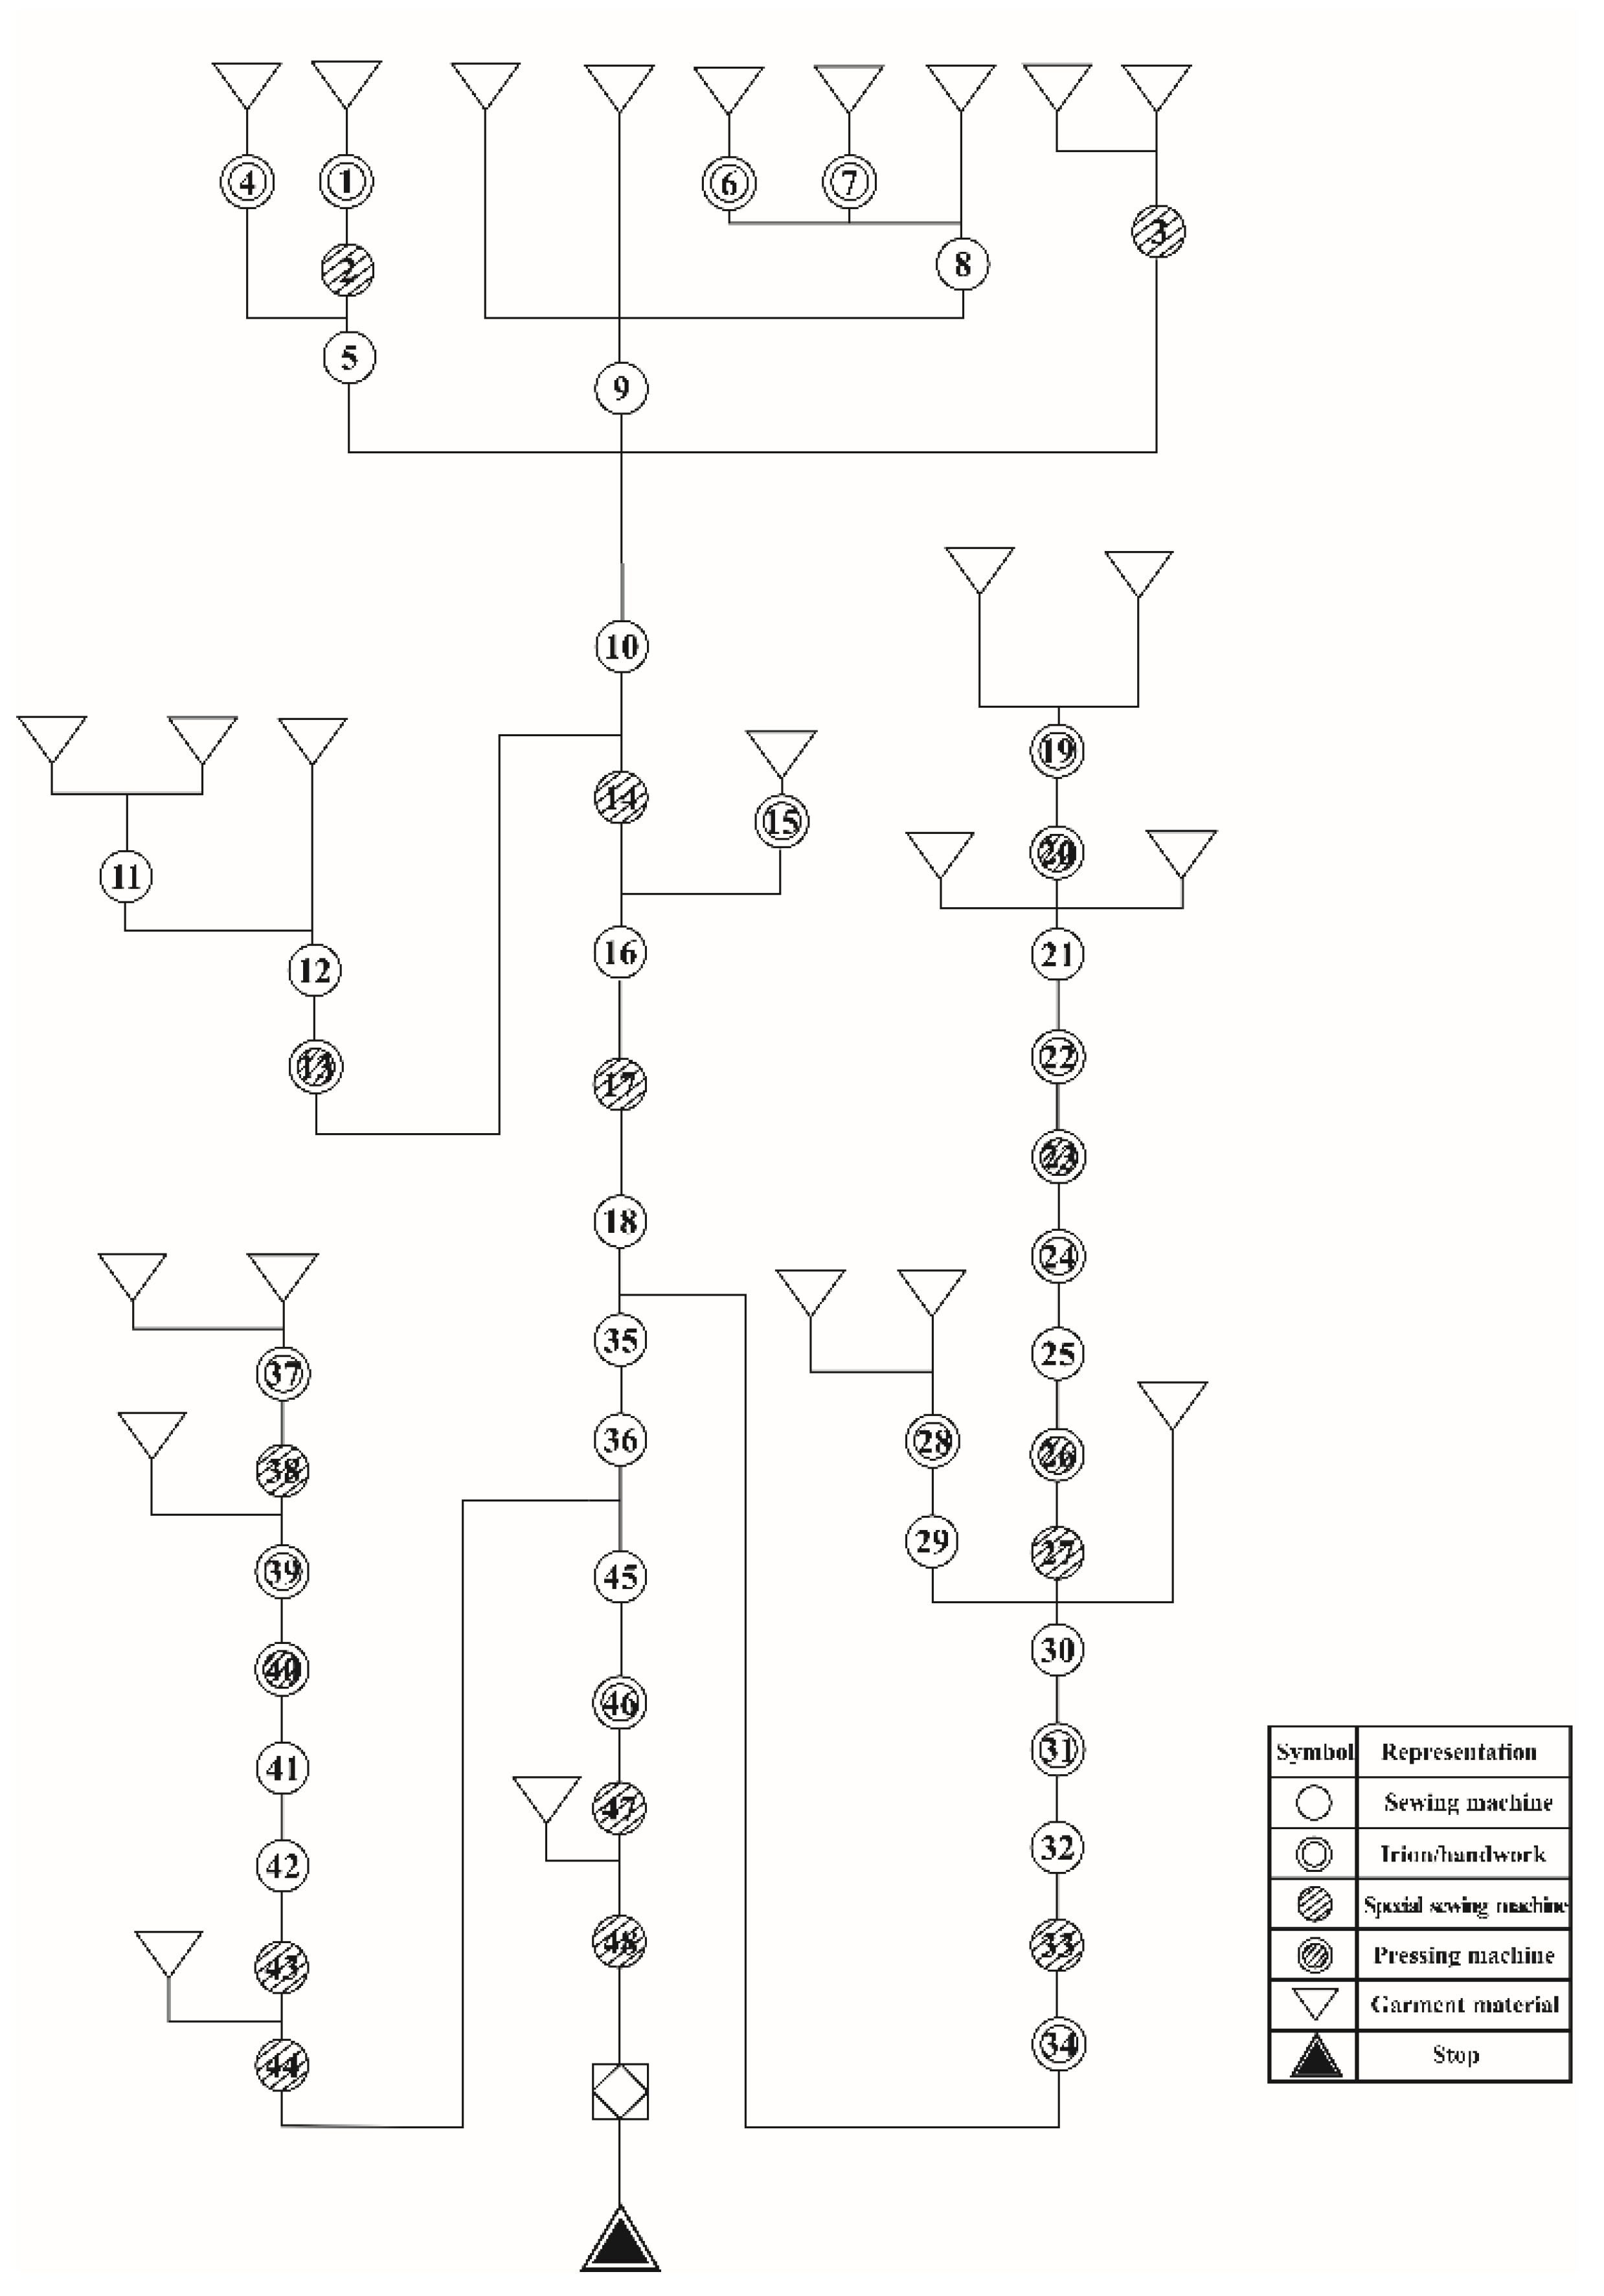
5. Case Study

The assembly lines based on three workstation layouts (the order of processes, the type of machines and the components of the garment) of the men’s shirt were optimized by the model. The carbon emissions of each scheme were calculated based on the carbon emission evaluation models. The carbon emissions of the assembly line balance schemes of each workstation layout are compared and analyzed, and the assembly line balance schemes with the lowest carbon emissions were obtained. Section 5.1 describes the parameters of the model and algorithm. The experimental results are analyzed in Section 5.2 and Section 5.3.

5.1. Experimental Data and Parameter Setting

As shown in Figure 7, there are 48 processes in the production of the men’s shirt.
According to the production process of the men’s shirt in Table 1, the total standard processing time can be calculated as 741 s.
The output of the assembly line was 600 pieces per day, and the working time was 10 h/day. The theoretical pitch time of the assembly line was 60 s. The maximum value of pitch time was 80 s, while the minimum value of pitch time was 40 s. The initial population size was 200, the genetic algebra was 500. The crossing probability was 0.8, and the mutation probability was 0.2.

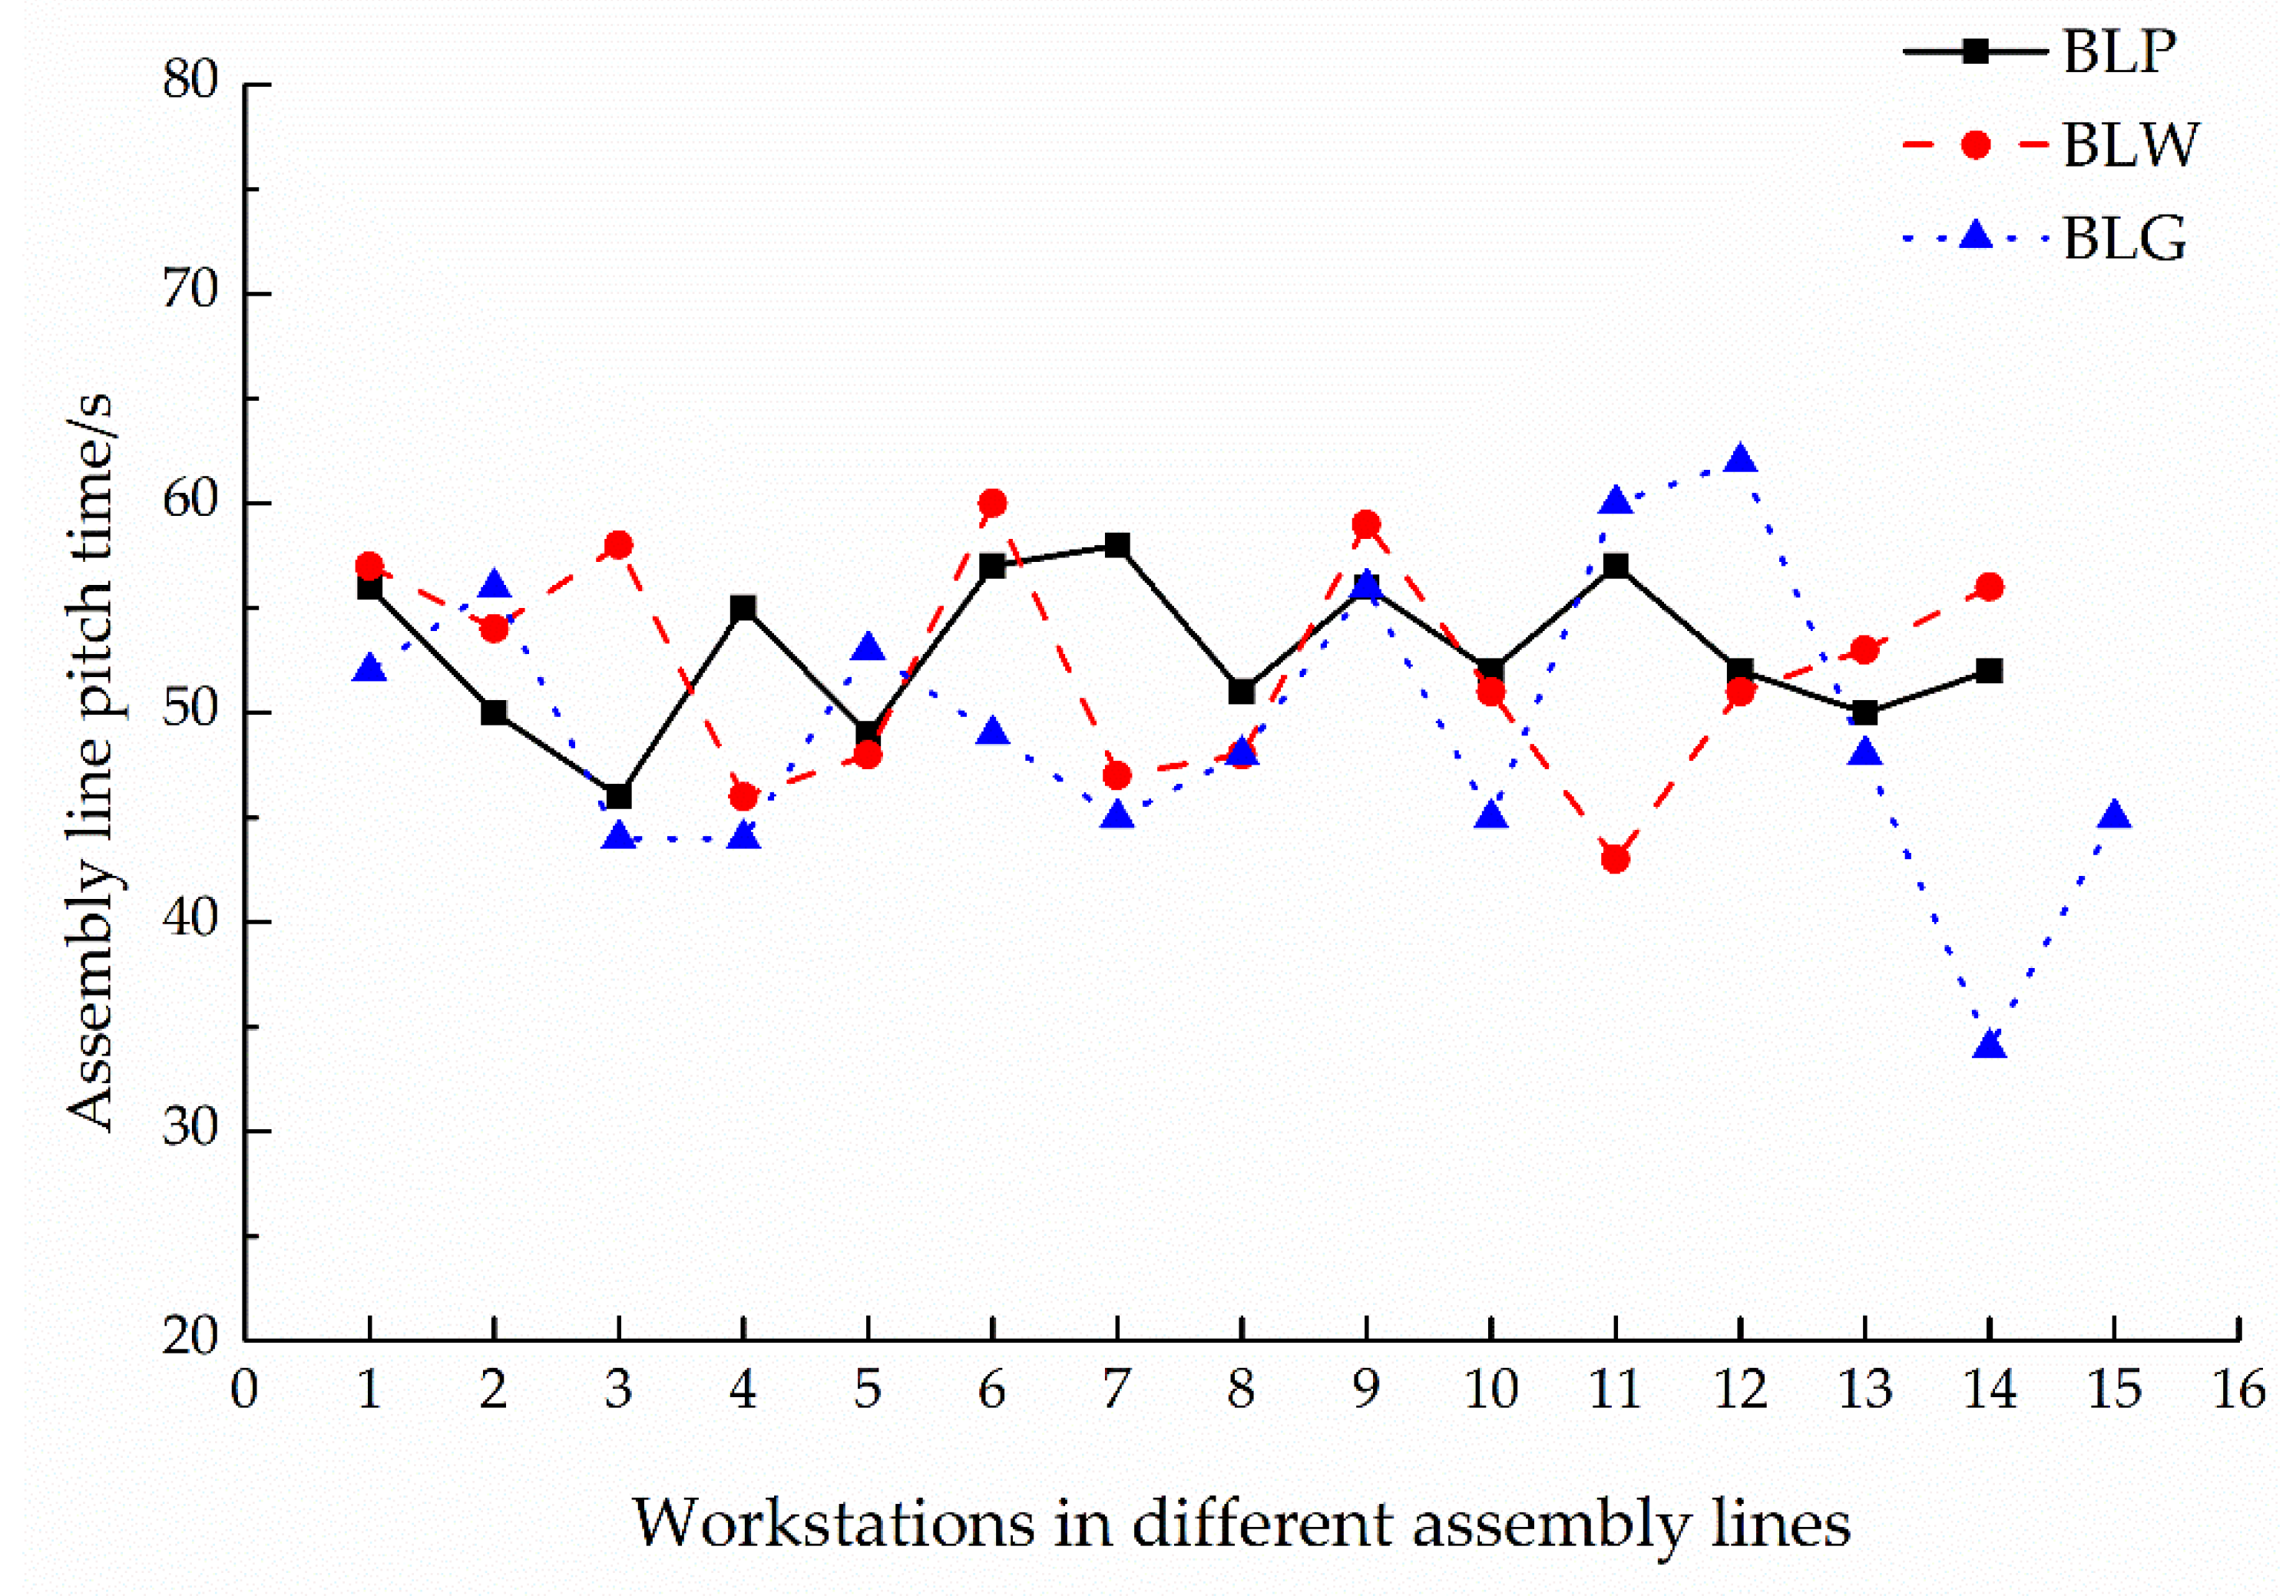
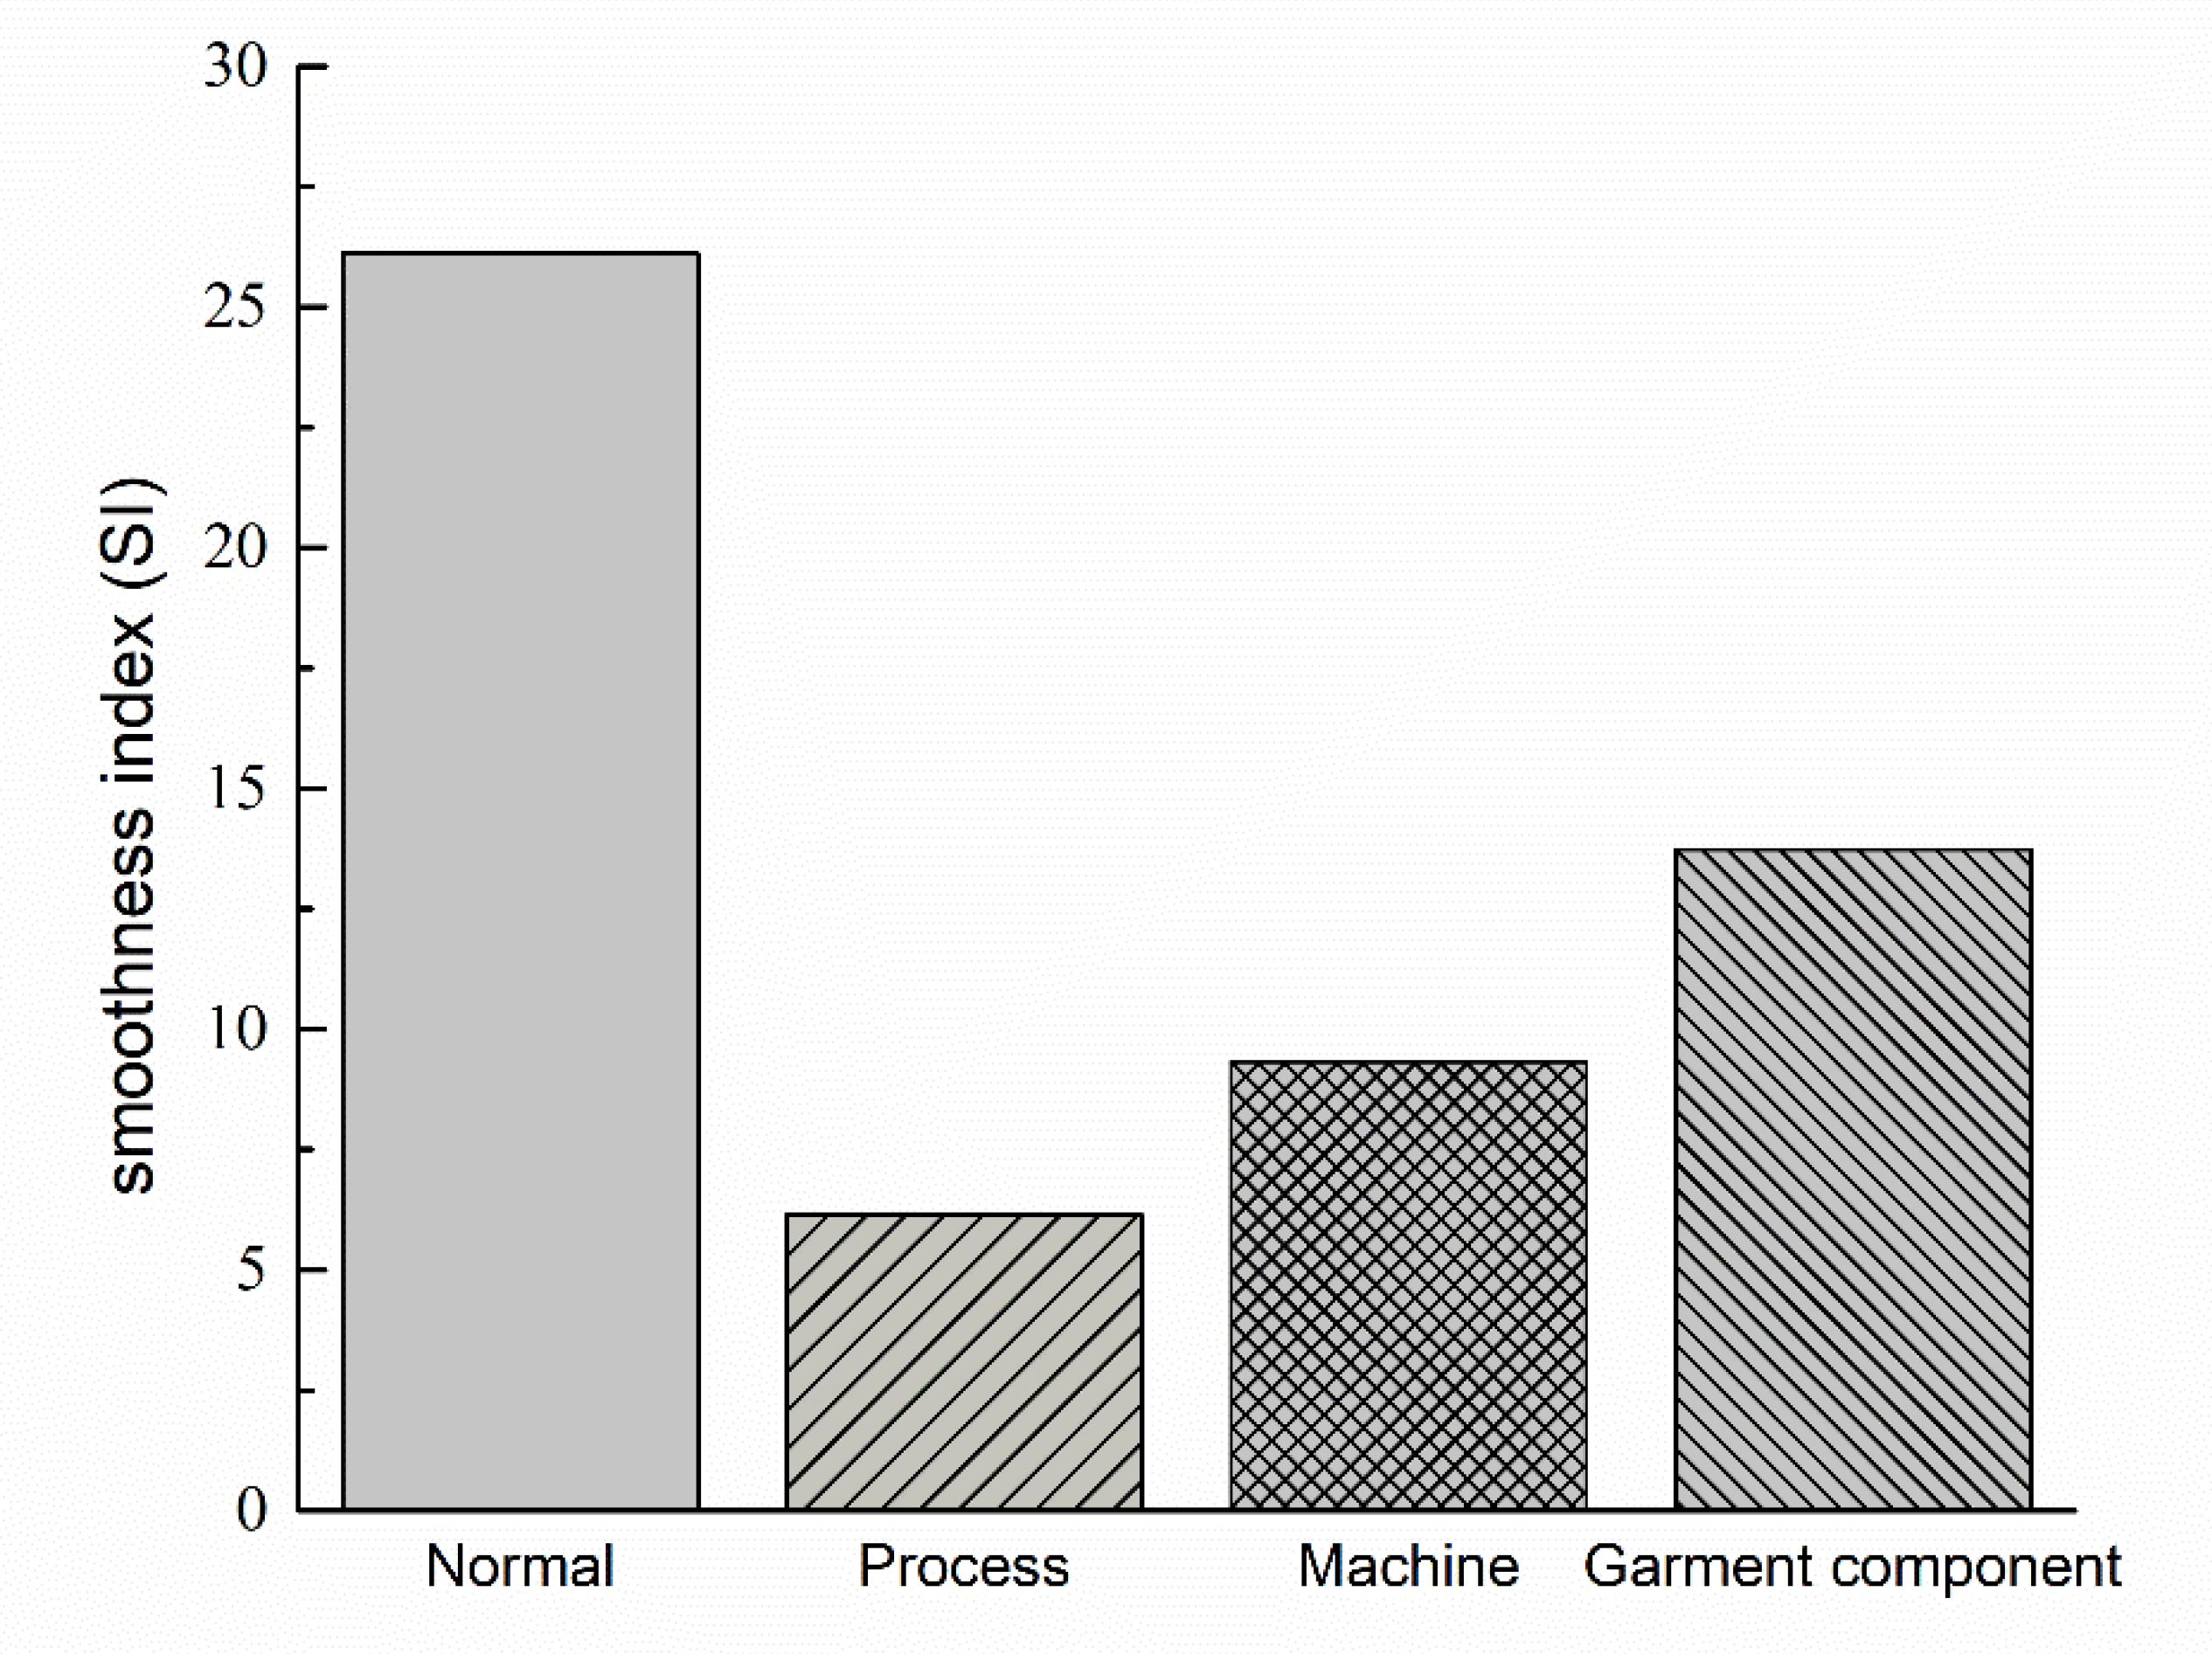
5.2. Analysis of Balancing the Assembly Line of the Men’s Shirt

The results of balancing the assembly line based on the order of processes (BLP), balancing the assembly line based on the type of machine workstation layout (BLW) and balancing the assembly line based on the components of the garment workstation layout (BLG) were shown in Table 2 and Figure 8, Figure 9 and Figure 10.
As shown in Table 2, it is easy to see that BLP and BLM have the same results, each assembly line comprises 14 workstations, 26 machines and 26 operators. While the BLG comprises 15 workstations, 41 machines and 41 operators. The number of workstations, operators and machines in BLG are more than that in BLP and BLM.
As shown in Figure 8, in BLP, the operation time of each workstation is similar. The longest operation time of a workstation (workstation 7) is 58 s, and the shortest operation time of a workstation (workstation 3) is 46 s. In BLM, the difference of operation time between workstations is slightly larger than that of BLP. The longest operation time of a workstation (workstation 6) is 60 s, and the shortest operation time of a workstation (workstation 11) is 43 s. In BLG, the difference of operation time between workstations is the largest. The longest operation time of a workstation (workstation 12) is 62 s, and the shortest operation time of a workstation (workstation 14) is 34 s.
As shown in Figure 9, for the normal assembly line, the rate of time loss is 74.27%, thus, the efficiency could be calculated as 25.73%. For BLP, the rate of time loss is 8.74%, and the efficiency is 91.26%. The efficiency of BLM (88.21%) is higher than that of BLG (79.68%), while the time loss rate of BLM (11.79%) is lower than that of BLG (20.32%). So, BLP is the highest efficiency assembly line.
As shown in Figure 10, for the normal assembly line, the smoothness index is 26.12. The smoothness index of BLP is 6.15. The smoothness index of BLM (9.33) is lower than that of BLG (13.73). Therefore, BLP is the best assembly line because it not only has the highest efficiency, but also has the lowest smoothness index.

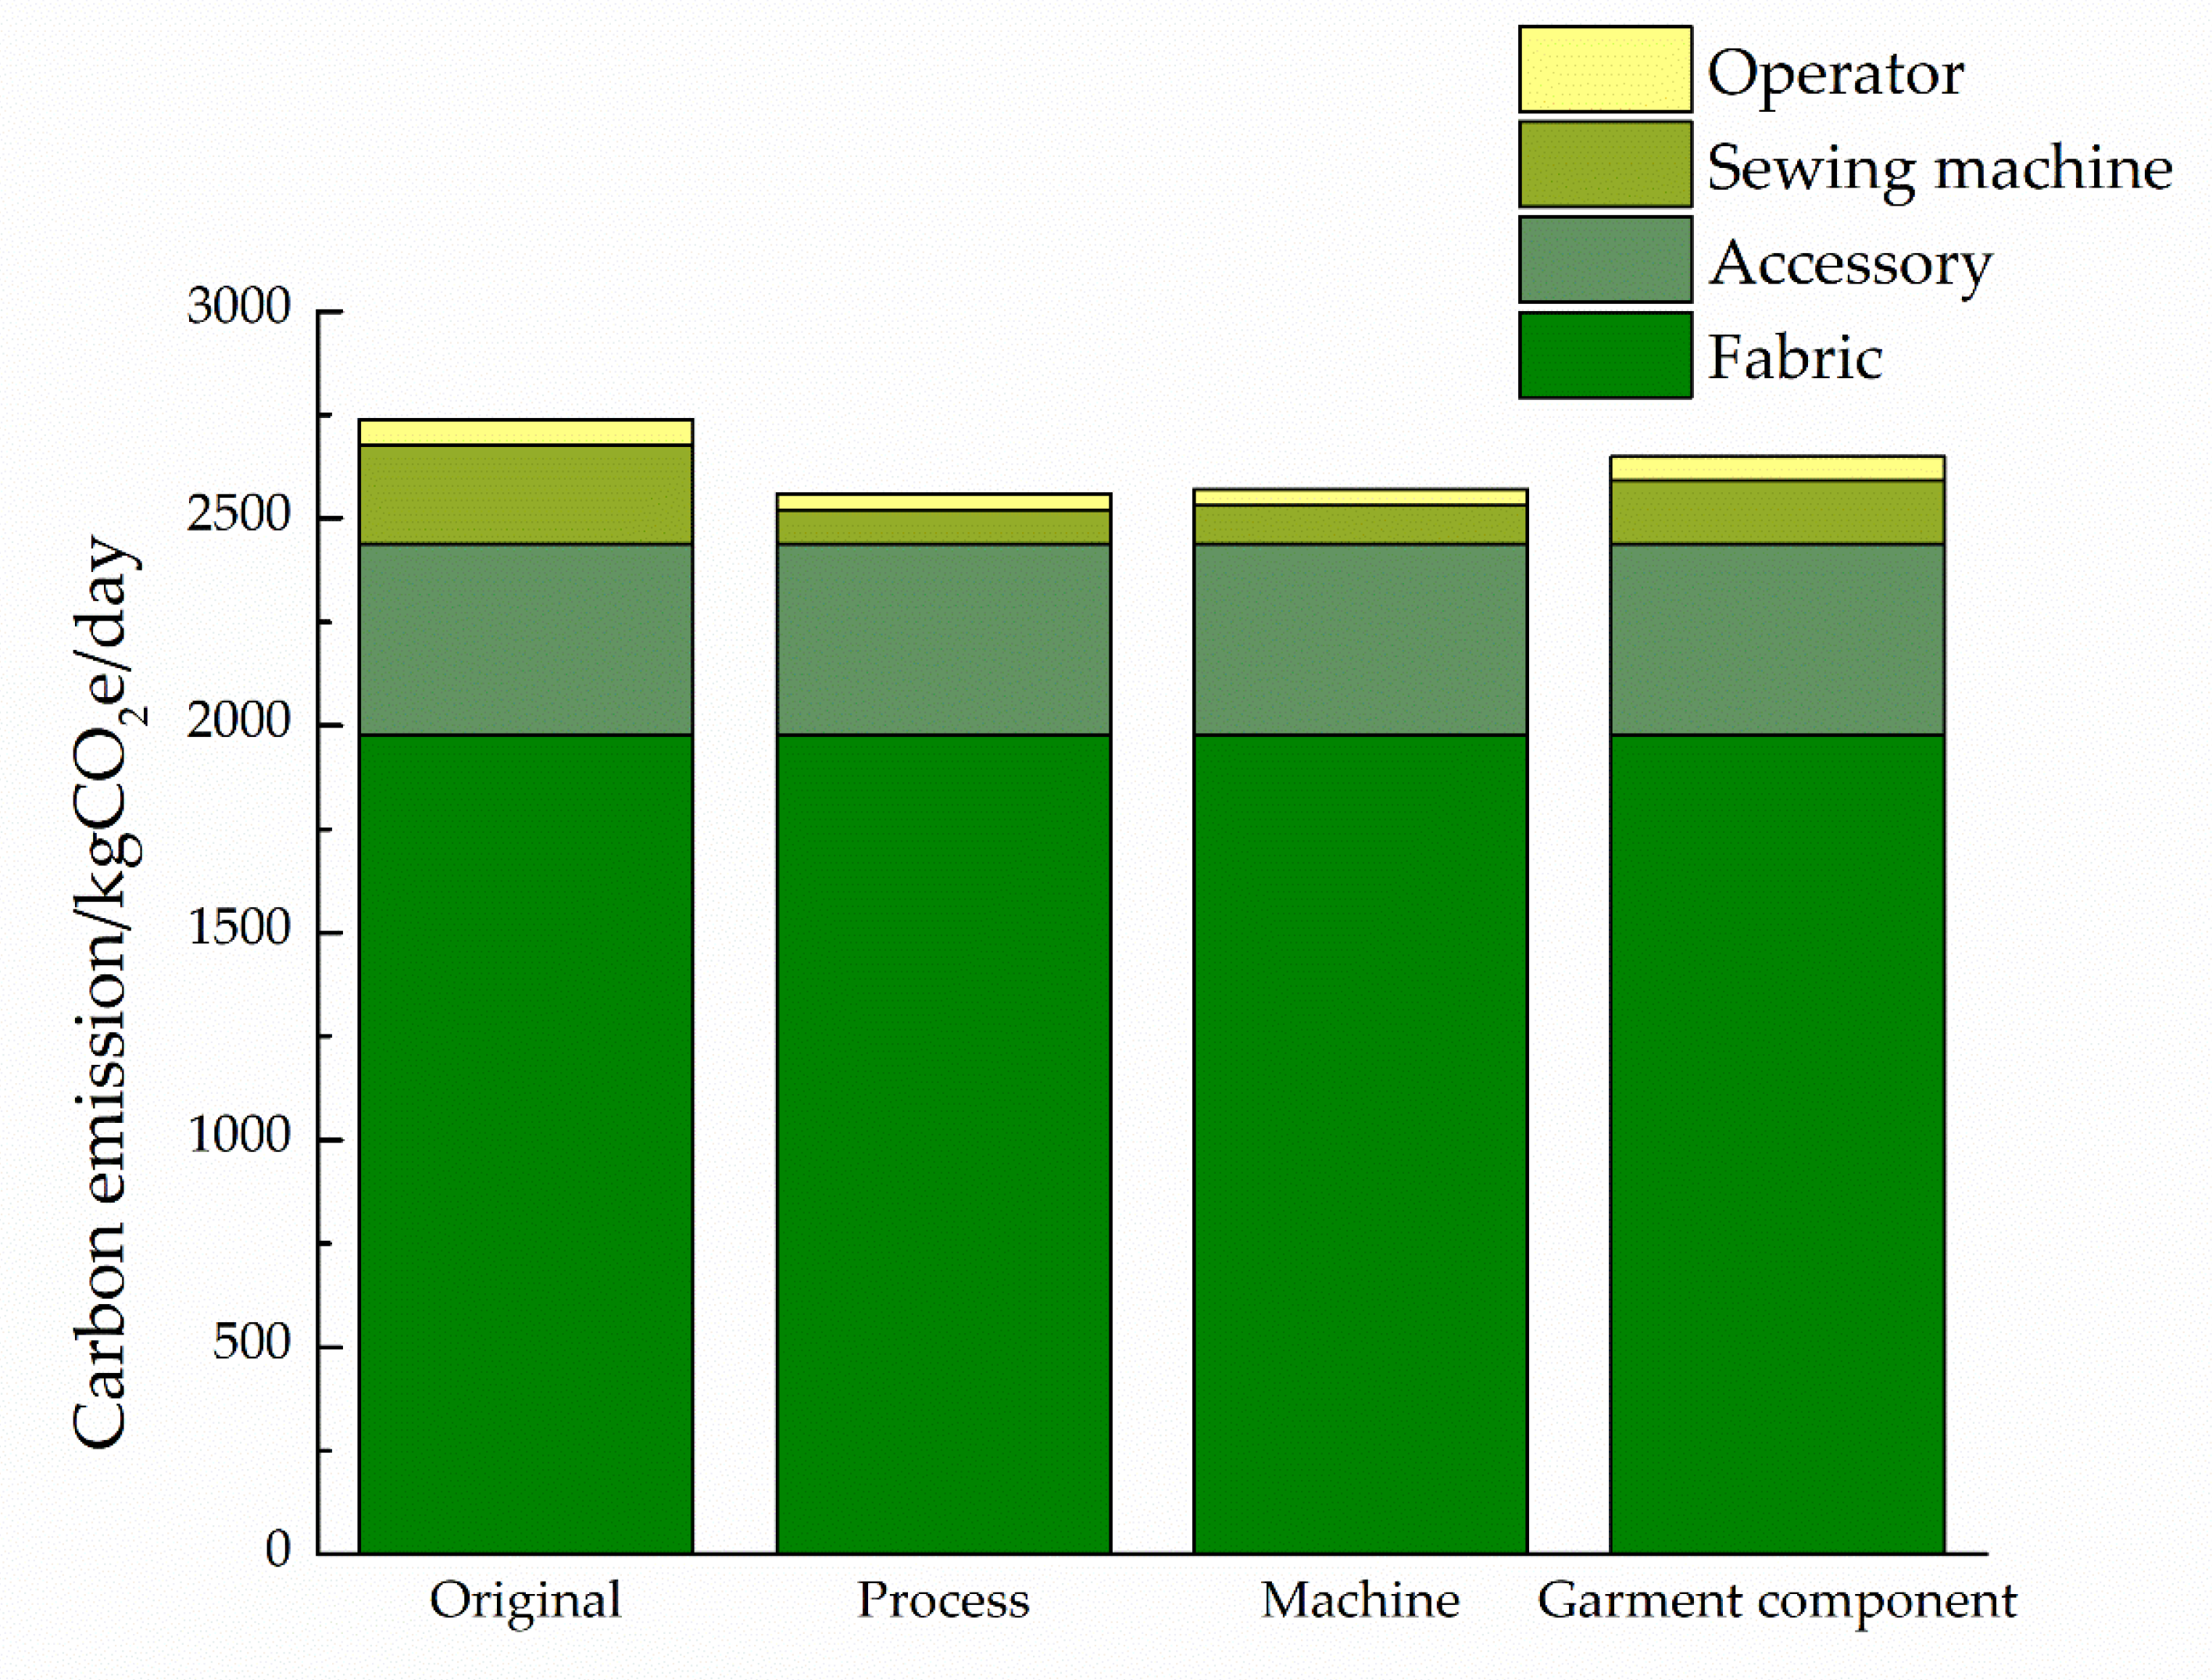
5.3. Analysis of Carbon Emissions in the Men’s Shirt Sewing Process

In the garment sewing production, some primary data are relatively easy to obtain, such as the power of the sewing machines, the process time, as shown in Table 2. However, some secondary data are more difficult to obtain, such as the carbon emission coefficients of different fabrics and the carbon emission coefficients of different accessories. Therefore, it is necessary to obtain data from the Ecoinvent database and other literature references [11,12,13]. The carbon emission coefficients of the sewing production related materials are shown in Table 3.
According to the literature [36], short-term respiration of humans is summarized, as shown in Table 4. The respiration of humans is different under different activities. According to the references [36,37], 0.03% of air inhaled by human body is CO2, while 4.4% of the exhaled air is CO2. Generally, the density of CO2 is 1.98 g/L. Thus, the carbon emission factor of human breathing is calculated by Equation (11).
K = 1.98 × 4.4 % × H m
Garment sewing and inspection are considered moderate labor here. The respiration of the operators is 24.4 L/min. Thus, the carbon emission coefficient of operators’ breathing is K = 0.35 × 10 4 kgCO2e/s.
Working time, daily output, the number of operators, fabrics, accessories and machines in the men’s shirt sewing assembly line are shown in Table 5.
As shown in Figure 11, the total carbon emissions of three optimized assembly lines are less than that of the normal assembly line. The carbon emissions of operators’ breathing (60.48 kgCO2e) and sewing machines (239.15 kgCO2e) of the normal assembly line are higher than that of the three optimized assembly lines. The carbon emissions of operators’ breathing for BLP and BLW are the same (39.06 kgCO2e), which is lower than that of BLG (57.96 kgCO2e). Sewing machines of BLP have the least carbon emissions (82.76 kgCO2e). BLP is the best assembly line with the least carbon emissions.

6. Discussion

Much literature only adopts one workstation layout to solve the balance optimization of the assembly line [38,39]. In this research, the workstations are arranged in three different ways: the order of processes, the type of machines and the components of the garment, which can provide various solutions for the assembly line layout of the enterprise.
After the assembly lines are optimized, the number of workstations, operators and sewing machines in three workstation layouts are reduced. The time loss rate of the three optimized assembly lines (the order of processes, the type of machines and the components of the garment) meets the requirements of the minimum production efficiency of the assembly line. Assembly line balance can improve production efficiency and reduce production costs. This is basically consistent with the conclusions of other research scholars on the optimization problem of assembly line balance [40,41].
When the workstations are arranged according to the order of processes and the type of machines, the numbers of workstations on the assembly line are same. However, the time loss rate and smoothness index of BLP is less than that of BLW. The transfer distance of the production materials in BLP is shorter than that of BLW, but the machines utilization rate of BLW is higher. There are seven workstations that need only one sewing machine and one workstation that needs five sewing machines in the BLP and BLW. However, there are only three workstations that need one sewing machine in BLG. The production of each garment component requires different sewing machines in the BLG [42]. And the assembly line has great flexibility to adapt to the change of the garment variety [43].
According to the carbon emission evaluation models, the types and quantities of fabrics and accessories are related to the garment production plan. The carbon emissions from the sewing machines consuming electricity are mainly related to the processing time and the time loss of the assembly line. The carbon emissions from the operators’ breathing are related to the number of operators and the operating time. The number of workstations, sewing machines and operators in the optimized assembly line are reduced. Therefore, the change in carbon emissions is mainly caused by the power consumption of the sewing machines and operator’s breathing. The number of workstations, sewing machines and operators are the same in BLP and BLW. However, the time loss rate and smoothness index of BLP are lower, and the sewing machines consume less energy and produce less carbon emissions. Therefore, the balance of the assembly line can reduce the carbon emission.

7. Conclusions

The apparel industry is the sixth largest energy consuming industry sector in China. Therefore, it is necessary to conduct a detailed analysis of garment sewing production to find relevant carbon emission characteristics for the purpose of the reduction of carbon emissions. In this research, carbon emission evaluation models for garment sewing production were established, while the carbon emissions of fabrics, accessories, sewing machines and operators in men’s shirt sewing assembly lines were calculated. A multi-objective assembly line balance optimization model was also constructed to reduce carbon emissions. The evaluation models and assembly line balance method could provide a basis for the quantification of carbon emissions of assembly lines and provide a reference for reducing carbon emissions of garment manufacturers. The main conclusions are listed as follows.
(1) According to the calculation results of the evaluation models, fabrics and accessories were the main sources of carbon emissions in garment sewing production, followed by sewing machines and operators.
(2) According to the evaluation models, the carbon emissions from fabrics and accessories were mainly related to the materials. The main factors affecting the carbon emissions generated by the sewing machines were the type of machines, the number of machines and the effective running time. The carbon emissions of operators were mainly related to the number of operators, labor intensity and working time. More importantly, the number of sewing machines and operators, and the working time were mainly affected by the balance of the assembly line.
(3) Compared to the normal assembly line, the number of workstations, sewing machines and operators of optimized assembly lines in the three workstation layouts (the order of processes, the type of machines and the components the of garment) were reduced, while the time loss rate of the optimized assembly lines was reduced. The BLP was the most effective assembly line with the shortest time loss.
(4) The quantities of carbon emissions in balancing and normal assembly line were calculated based on carbon evaluation models, they indicated that the total quantities of carbon emissions of the optimized assembly lines were lower than that of normal assembly line. Among the three optimized assembly lines, BLP has the lowest carbon emissions. Balancing the assembly line based on the order of process workstation layout was the best one since it was most effective assembly line with the lowest carbon emissions.
The carbon emission evaluation models of the garment sewing production provide a calculation basis for the quantitative study of carbon emissions in garment sewing production, while the multi-objective balance optimization model of garment sewing assembly lines provides a method for reducing carbon emissions in garment sewing production. In this study, the carbon emission evaluation models of sewing processes are established, but garment production also includes cutting and packaging processes. So, a more complete carbon emission model for garment production will be established in the future.

Author Contributions

X.Z. proposed the initial idea and carried out the modeling, calculations and experiments, and wrote the manuscript. Y.C. contributed to fine-tuning of the analysis and discussion.

Funding

This research received no external funding.

Conflicts of Interest

The authors declare no conflict of interest.

References

  1. Wang, N.; Chang, D.; Shi, X.; Yuan, J.; Gao, Y. Analysis and Design of Typical Automated Container Terminals Layout Considering Carbon Emissions. Sustainability 2019, 10, 2957. [Google Scholar] [CrossRef]
  2. Chau, C.K.; Leung, T.M.; Ng, W.Y. A review on life cycle evaluation, life cycle energy evaluation and life cycle carbon emissions evaluation on buildings. Appl. Energy 2015, 143, 395–413. [Google Scholar] [CrossRef]
  3. Liu, L.; Chen, C.; Zhao, Y.; Zhao, E. China’s carbon-emissions trading: Overview, challenges and future. Renew. Sustain. Energy Rev. 2015, 49, 254–266. [Google Scholar] [CrossRef]
  4. Narayan, P.K.; Saboori, B.; Soleymani, A. Economic growth and carbon emissions. Econ. Modell. 2015, 53, 388–397. [Google Scholar] [CrossRef]
  5. He, P.; Zhang, W.; Xu, X.; Bian, Y. Production lot-sizing and carbon emissions under cap-and-trade and carbon tax regulations. J. Clean. Prod. 2015, 103, 241–248. [Google Scholar] [CrossRef]
  6. Claudio, L. Waste couture: Environmental impact of the clothing industry. Environ. Health Perspect. 2007, 9, 449–454. [Google Scholar] [CrossRef]
  7. Islam, M.M.; Khan, A.M.; Khan, M.M.R. Minimization of reworks in quality and productivity improvement in the apparel industry. Int. J. Eng. 2013, 4, 2305–8269. [Google Scholar]
  8. Thompson, E.R. Clustering of foreign direct investment and enhanced technology transfer: Evidence from Hong Kong garment firms in China. World Dev. 2002, 5, 873–889. [Google Scholar] [CrossRef]
  9. Banister, J. Manufacturing earnings and compensation in China. Mon. Lab. Rev. 2015, 128, 22. [Google Scholar]
  10. Laurenti, R.; Redwood, M.; Puig, R.; Frostell, B. Measuring the environmental footprint of leather Processing technologies. J. Ind. Ecol. 2017, 5, 1180–1187. [Google Scholar] [CrossRef]
  11. Zaffalon, V. Climate change, carbon mitigation and textiles. Text.World. 2010, 160, 34–35. [Google Scholar]
  12. Wang, C.; Wang, L.; Liu, X.; Du, C.; Ding, D.; Jia, J.; Yan, Y.; Wu, G. Carbon footprint of textile throughout its life cycle: A case study of Chinese cotton shirts. J. Clean. Prod. 2015, 108, 464–475. [Google Scholar] [CrossRef]
  13. Zhang, Y.; Liu, X.; Xiao, R.; Yuan, Z. Life cycle evaluation of cotton T-shirts in China. Int. J. Life Cycle Eval. 2015, 7, 994–1004. [Google Scholar] [CrossRef]
  14. Yan, Y.; Wang, C.; Ding, D.; Zhang, Y.N.; Wu, G.; Wang, L.H.; Liu, X.L.; Du, C.; Zhang, Y.J.; Zhao, C.L. Industrial carbon footprint of several typical Chinese textile fabrics. Acta Ecol. Sin. 2016, 36, 119–125. [Google Scholar] [CrossRef]
  15. Çay, A. Energy consumption and energy saving potential in clothing industry. Energy 2018, 159, 74–85. [Google Scholar] [CrossRef]
  16. Butnariu, A.; Avasilcai, S. Research on the possibility to apply ecological footprint as environmental performance indicator for the textile industry. Procedia Soc. Behav. Sci. 2014, 124, 344–350. [Google Scholar] [CrossRef]
  17. Herva, M.; Álvarez, A.; Roca, E. Combined application of energy and material flow analysis and ecological footprint for the environmental evaluation of a tailoring factory. J. Hazard Mater. 2012, 237, 231–239. [Google Scholar] [CrossRef]
  18. Van Der Velden, N.M.; Vogtländer, J.G. Monetisation of external socio-economic costs of industrial production: A social-LCA-based case of clothing production. J. Clean. Prod. 2017, 153, 320–330. [Google Scholar] [CrossRef]
  19. Wong, W.K.; Leung, S.Y.S.; Au, K.F. Real-time GA-based rescheduling approach for the pre-sewing stage of an apparel manufacturing process. Int. J. Adv. Manuf. Technol. 2005, 25, 180–188. [Google Scholar] [CrossRef]
  20. Agpak, K.; Gökçen, H. Assembly line balancing: Two resource constrained cases. Int. J. Prod. Econ. 2005, 96, 129–140. [Google Scholar] [CrossRef]
  21. Pearce, B.W.; Antani, K.; Mears, L.; Funk, K.; Mayorga, M.E.; Kurz, M.E. An effective integer program for a general assembly line balancing problem with parallel workers and additional assignment restrictions. J. Manuf. Syst. 2019, 50, 180–192. [Google Scholar] [CrossRef]
  22. Akyol, S.D.; Baykasoğlu, A.; Ergo, A.L. WABP: A multiple rule based constructive randomized search algorithm for solving assembly line worker assignment and balancing problem under ergonomic risk factors. J. Intell. Manuf. 2019, 1, 291–302. [Google Scholar] [CrossRef]
  23. Song, B.L.; Wong, W.K.; Fan, J.T.; Chan, S.F. A recursive operator allocation approach for assembly line-balancing optimization problem with the consideration of operator efficiency. Comput. Ind. Eng. 2006, 51, 585–608. [Google Scholar] [CrossRef]
  24. Wong, W.K.; Mok, P.Y.; Leung, S.Y.S. Developing a genetic optimization approach to balance an apparel assembly line. Int. J. Adv. Manuf. Technol. 2006, 28, 387–394. [Google Scholar] [CrossRef]
  25. Guo, Z.X.; Wong, W.K.; Leung, S.Y.S.; Fan, J.T.; Chan, S.F. Mathematical model and genetic optimization for the job shop scheduling problem in a mixed-and multi-product assembly environment: A case study based on the apparel industry. Comput. Ind. Eng. 2006, 3, 202–219. [Google Scholar] [CrossRef]
  26. Zaman, T.; Paul, S.K.; Azeem, A. Sustainable operator assignment in an assembly line using genetic algorithm. Int. J. Prod. Res. 2012, 18, 5077–5084. [Google Scholar] [CrossRef]
  27. Chen, J.C.; Chen, C.C.; Lin, Y.J.; Lin, C.J.; Chen, T.Y. Assembly line balancing problem of sewing lines in garment industry. In Proceedings of the 2014 International Conference on Industrial Engineering and Operations Management, Bali, Indonesia, 7–9 January 2014. [Google Scholar]
  28. Zhang, W.; Gen, M. An efficient multi-objective genetic algorithm for mixed-model assembly line balancing problem considering demand ratio-based cycle time. J. Intell. Manuf. 2011, 3, 367–378. [Google Scholar] [CrossRef]
  29. Aydemir-Karadag, A.; Turkbey, O. Multi-objective optimization of stochastic disassembly line balancing with station paralleling. Comput. Ind. Eng. 2013, 3, 413–425. [Google Scholar] [CrossRef]
  30. Hwang, R.K.; Katayama, H.; Gen, M. U-shaped assembly line balancing problem with genetic algorithm. Int. J. Prod. Res. 2008, 16, 4637–4649. [Google Scholar] [CrossRef]
  31. Kazemi, S.M.; Ghodsi, R.; Rabbani, M.; Tavakkoli-Moghaddam, R. A novel two-stage genetic algorithm for a mixed-model U-line balancing problem with duplicated tasks. Int. J. Adv. Manuf. Technol. 2011, 55, 1111–1122. [Google Scholar] [CrossRef]
  32. Akpınar, S.; Bayhan, G.M. A hybrid genetic algorithm for mixed model assembly line balancing problem with parallel workstations and zoning constraints. Eng. Appl. Artif. Intell. 2011, 3, 449–457. [Google Scholar] [CrossRef]
  33. Bukchin, Y.; Raviv, T. Constraint programming for solving various assembly line balancing problems. Omega 2018, 78, 57–68. [Google Scholar] [CrossRef]
  34. Polat, O.; Mutlu, Ö.; Özgormus, E. A Mathematical Model for Assembly Line Balancing Problem Type 2 Under Ergonomic Workload Constraint. Ergon. Open J. 2018, 11, 1–10. [Google Scholar] [CrossRef]
  35. Borba, L.; Ritt, M.; Miralles, C. Exact and heuristic methods for solving the Robotic Assembly Line Balancing Problem. Eur. J. Op. Res. 2018, 1, 146–156. [Google Scholar] [CrossRef]
  36. Liu, P.; Wang, B.B.; Zhao, X.G.; Duan, X.L.; Huang, N.; Chen, Y.D.; Wang, L.M. Study on Adult Respiratory Rate in China. J. Environ. Health 2014, 31, 953–956. [Google Scholar]
  37. Radford, E.P., Jr. Ventilation standards for use in artificial respiration. J. Appl. Physiol. 1955, 7, 451–460. [Google Scholar]
  38. Rahman, M.M.; Nur, F.; Talapatra, S. An Integrated Framework of Applying Line Balancing in Apparel Manufacturing Organization: A Case Study. J. Mech. Eng. 2014, 2, 117–123. [Google Scholar] [CrossRef]
  39. Eryuruk, S.H.; Kalaoglu, F.; Baskak, M. Assembly line balancing in a clothing company. Fibres Text. East. Eur. 2008, 66, 93–98. [Google Scholar]
  40. Karabay, G. A Comparative Study on Designing of a Clothing Assembly Line. J. Tekst. Konfeks. 2014, 24, 124–134. [Google Scholar]
  41. Samouei, P.; Ashayeri, J. Developing optimization and robust models for a mixed-model assembly line balancing problem with semi-automated operations. Appl. Math. Model. 2019, 72, 259–275. [Google Scholar] [CrossRef]
  42. Baykasoglu, A. Multi-rule multi-objective simulated annealing algorithm for straight and U type assembly line balancing problems. J. Intell. Manuf. 2006, 2, 217–232. [Google Scholar] [CrossRef]
  43. Baykasoğlu, A.; Dereli, T. Simple and U-type assembly line balancing by using an ant colony based algorithm. Math. Comput. Appl. 2009, 1, 1–12. [Google Scholar] [CrossRef]
Figure 1. The Process of Garment Sewing.
Energies 12 02783 g001
Figure 2. Schematic diagram of three workstation layouts.
Energies 12 02783 g002
Figure 3. NSGA-II algorithm flow chart.
Energies 12 02783 g003
Figure 4. Example of coding operation.
Energies 12 02783 g004
Figure 5. Example of the crossing operation.
Energies 12 02783 g005
Figure 6. Example of mutation operation.
Energies 12 02783 g006
Figure 7. Process flow chart of the men’s shirt.
Energies 12 02783 g007
Figure 8. Operating time of workstations in different assembly lines.
Energies 12 02783 g008
Figure 9. Time loss rate of assembly lines under different workstation layouts.
Energies 12 02783 g009
Figure 10. Smoothness index of assembly lines under different workstation layouts.
Energies 12 02783 g010
Figure 11. The total carbon emissions of different workstation layouts for the men’s shirt assembly line.
Energies 12 02783 g011
Table 1. Sewing processes of the men’s shirt.
Process NumberSewing MachinesOperation Time/sPower/kW
1Electric steam iron201
2Buttonhole stitching 100.36
3Button attaching 140.25
4Pocket creasing 302
5Straight lock stitcher with automatic thread trimmer270.45
6Trademark shearing 22
7Trademark shearing 22
8Straight lock stitcher with automatic thread trimmer250.45
9Straight lock stitcher with automatic thread trimmer220.45
10Straight lock stitcher with automatic thread trimmer200.45
11Straight lock stitcher with automatic thread trimmer100.45
12Straight lock stitcher with automatic thread trimmer180.45
13Utility press102.2
14Five-thread overlock 210.37
15Trademark shearing 22
16Straight lock stitcher with automatic thread trimmer200.45
17Five-thread overlock 300.37
18Straight lock stitcher with automatic thread trimmer220.37
19Electric steam iron181
20Fusing press machine515
21High-speed straight lock stitcher with automatic thread trimmer200.45
22Collar turning 100.3
23Collar former200.5
24Electric steam iron121
25Straight lock stitcher with automatic thread trimmer180.45
26Shirt collar former60.4
27Upper and lower cutting 101.3
28Electric steam iron71
29Straight lock stitcher with automatic thread trimmer80.45
30Straight lock stitcher with automatic thread trimmer160.45
31Electric steam iron181
32Straight lock stitcher with automatic thread trimmer60.45
33Shearing collar70.25
34Manual operation10-
35Straight lock stitcher with automatic thread trimmer200.45
36Straight lock stitcher with automatic thread trimmer400.45
37Electric steam iron301
38Straight lock stitcher with automatic thread trimmer160.45
39Electric steam iron101
40Styling press 152.3
41Straight lock stitcher with automatic thread trimmer100.45
42Straight lock stitcher with automatic thread trimmer120.45
43Buttonhole stitching 80.36
44Button attaching100.25
45Straight lock stitcher with automatic thread trimmer400.45
46Manual operation7-
47Buttonhole stitching 150.36
48Button attaching120.25
Table 2. Balancing schemes of assembly lines with different workstation layouts. BLP: the order of processes layout; BLW: the type of machine layout; BLG: the components of the garment layout.
Workstation NumberBLPBLMBLG
Process NumberNumber of MachinesProcess NumberNumber of MachinesProcess NumberNumber of Machines
11, 6, 7, 15, 3725, 41, 2125, 81
22, 43, 47, 27, 33318,35, 4211, 3, 93
33, 44, 48, 22225, 3612, 4, 6, 73
44, 19, 46310, 11, 38123, 26, 27, 294
55, 9129, 45119, 31, 22, 333
68, 11, 1819, 12, 16121, 24, 28, 343
710, 12, 1618, 30, 32120, 25, 30, 322
814, 17119, 37, 34237, 41,433
913, 20, 23, 26, 4054, 24, 28, 39212, 38, 39, 422
1021, 30, 3821, 31, 6, 7, 15, 46311, 13, 40, 444
1124, 28, 31, 39, 3422, 43, 47, 22235, 361
1225, 29, 32, 35114, 17118, 451
1336, 4113, 44, 48, 27, 33314, 16, 463
1442, 45113, 20, 23, 26, 40510, 15, 483
15----17, 472
Table 3. Carbon emission coefficients of materials.
Material TypeCarbon Emission Coefficient
Electric0.824 kgCO2e/kW·h
Pure cotton fabric10.750 kgCO2e/kg
Polyester fabric25.701 kgCO2e/kg
Resin button23.806 kgCO2e/kg
Sewing thread46.287 kgCO2e/kg
Woven label45.863 kgCO2e/kg
Printed label45.860 kgCO2e/kg
Table 4. Short-term respiration of humans.
Activity LevelRestSitMinor ActivityModerate ActivityHeavy Physical ActivityExtreme Physical Activity
Respiratory volume/L/min6.17.39.124.436.660.9
Table 5. Men’s shirt sewing production data.
Number of Inspectors5Working Time10 h/dayDaily Output600 pieces
Fabric Width144 cmFabric Composition80% Cotton, 20% Polyester
Fabric consumption160 cm/productWeight150 g/mTotal960 m
Adhesive lining consumption16 cm/productWeight33 g/mTotal96 m
Sewing thread consumption110 m/productWeight0.0323 g/mTotal66,000 m
Button consumption10 capsules/productWeight1 g/capsuleTotal6000 capsules
Trademark consumption1 piece/productWeight3 g/pieceTotal600 pieces
Size label consumption1 piece/productWeight1 g/pieceTotal600 pieces
Washing label consumption1 piece/productWeight1 g/pieceTotal600 pieces
Sewing machinesThere are 26 sewing machines in BLP and BLW (seven sets of straight lock stitchers with automatic thread trimmer. One high-speed straight lock stitcher with automatic thread trimmer. Three sets of electric steam irons. Two sets of manually operated machines. One each of: buttonhole stitching machine, button attaching machine, five-thread overlock, trademark shearing, pocket creasing collar turning, upper and lower cutting, shearing collar machine, utility press, fusing press, collar former, shirt collar former, styling press).
There are 38 sewing machines in BLG (11 sets of straight lock stitchers with automatic thread trimmer. One high speed straight lock stitcher with automatic thread trimmer. Five sets of electric steam irons. Two sets of manually operated machines. Three sets of buttonhole stitching machines, three sets of button attaching machines. Two sets of five-thread overlock machines. One each of: trademark shearing, pocket creasing, collar turning, upper and lower cutting, shearing collar, utility press, fusing press, collar former, shirt collar former, styling press).

