You are currently viewing a new version of our website. To view the old version click .
Energies
  • Article
  • Open Access

19 July 2019

Evaluating the Impact of Fossil Fuel Vehicle Exit on the Oil Demand in China

,
,
,
and
1
School of Applied Economics, Renmin University of China, Beijing 100872, China
2
School of Economics, Jilin University, Changchun 130000, China
3
Economics and Technology Research Institute of State Grid Fujian Electric Power Company Limited, Fujian 350000, China
4
Institute of World Economics and Politics, Chinese Academy of Social Sciences, Beijing 100732, China
This article belongs to the Special Issue Selected Papers from the 8th Annual Conference of Energy Economics and Management

Abstract

Vehicle ownership is one of the most important factors affecting fuel demand. Based on the forecast of China’s vehicle ownership, this paper estimates China’s fuel demand in 2035 and explores the impact of new energy vehicles replacing fossil fuel vehicles. The paper contributes to the existing literature by taking into account the heterogeneity of provinces when using the Gompertz model to forecast future vehicle ownership. On that basis, the fuel demand of each province in 2035 is calculated. The results show that: (1) The vehicle ownership rate of each province conforms to the S-shape trend with the growth of real GDP per capita. At present, most provinces are at a stage of accelerating growth. However, the time for the vehicle ownership rate of each province to reach the inflection point is quite different. (2) Without considering the replacement of new energy vehicles, China’s auto fuel demand is expected to be 746.69 million tonnes (Mt) in 2035. Guangdong, Henan, and Shandong are the top three provinces with the highest fuel demand due to economic and demographic factors. The fuel demand is expected to be 76.76, 64.91, and 63.95 Mt, respectively. (3) Considering the replacement of new energy vehicles, China’s fuel demand in 2035 will be 709.35, 634.68, and 560.02 Mt, respectively, under the scenarios of slow, medium, and fast substitution—and the replacement levels are 37.34, 112.01, and 186.67 Mt, respectively. Under the scenario of rapid substitution, the reduction in fuel demand will reach 52.2% of China’s net oil imports in 2016. Therefore, the withdrawal of fuel vehicles will greatly reduce the oil demand and the dependence on foreign oil of China. Faced with the dual pressure of environmental crisis and energy crisis, the forecast results of this paper provide practical reference for policy makers to rationally design the future fuel vehicle exit plan and solve related environmental issues.

1. Introduction

China has become the world’s second-largest oil consumer after the United States. In 2016, China’s oil consumption was 579 Mt, accounting for 13.1% of the world’s total oil consumption [1]. In the same year, the net oil import of China was 358 Mt, and its foreign oil dependency rose to 61.8% [2]. The continued rising foreign oil dependency has seriously threatened China’s energy security [3]. The oil demand for road transportation is currently the largest oil consumer in China. In 2015, the proportion of oil consumption in the road transportation sector accounted for 48.4% of the total [4]. In the past three decades, with the sustained and rapid development of China’s economy, vehicle ownership keeps rising, while the proportion of new energy vehicles (NEVs) is still small, which has not only increased China’s oil demand, but also exacerbated related environmental problems—especially air pollution and climate change. To combat global climate change and to improve air quality, Norway, Netherlands, India, Germany, the United Kingdom, France, and other countries have proposed and later decided to ban vehicles powered by fossil fuels, and encourage the replacement of fuel vehicles with new energy vehicles. After that, in September 2017, the Vice Minister of the Ministry of Industry and Information Technology (MIIT) of China said that MIIT has started relevant research and will make such a timeline with relevant departments, at an auto industry event in Tianjin [5]. The timeline is expected to be officially launched in 2035.
The development of NEVs is becoming a strategic choice for many countries to deal with climate change and energy security, as well as to gain advantage in international competition. Thanks to the technological advances, government subsidies, and restrictions on purchases in some cities, sales of NEVs in China continue to rise rapidly, and the substitution effect of fossil fuel vehicles by NEVs cannot be ignored any more. Therefore, it is of practical significance to quantitatively evaluate the development trend of NEVs and their impact on China’s oil demand. Against the background of increasing vehicle ownership, the rising oil dependency, and the accelerating replacement of fuel vehicles with NEVs, this paper estimates China’s fuel demand in 2035 based on the prediction of future vehicle ownership in China, and the impact of NEVs substitution on oil demand under three scenarios of slow, medium, and fast substitution. The results may provide practical reference for policy makers to rationally design the future fuel vehicle exit plan and solve related environmental issues.
The structure of the paper is arranged as follows: Section 2 reviews researches on the forecast of vehicle ownership and fuel demand. Section 3 introduces the empirical model, parameter estimation, and the data acquisition process of the paper. Section 4 presents the results and discussions. Section 5 conducts a robustness test of different replacement speeds. Lastly, Section 6 covers conclusions and policy implications.

3. Methodology

The research purpose of this paper is to evaluate the impact of fossil fuel vehicle exit on China’s oil demand. For that, we predicted the fuel demand of China’s 31 provinces in 2035 in two steps (Figure 1): (1) We established the Gompertz model based on the S-shape curve relationship between vehicle ownership rate and GDP per capita to forecast the vehicle ownership rate of each province, and then we took into account the population growth to predict vehicle ownership in all provinces in 2035. In particular, we took account of the provincial heterogeneity in economic development, population density, and urbanization rate when determining the saturation level of vehicle ownership in each province. (2) Based on the forecast results of vehicle ownership of each province, with which we combined the annual average vehicle miles traveled and fuel consumption rate of different types of vehicles, we measured China’s fuel demand of each province in 2035 and the substitution effect of NEVs with three different substitution speeds on China’s oil demand.
Figure 1. Fuel demand forecasting framework.

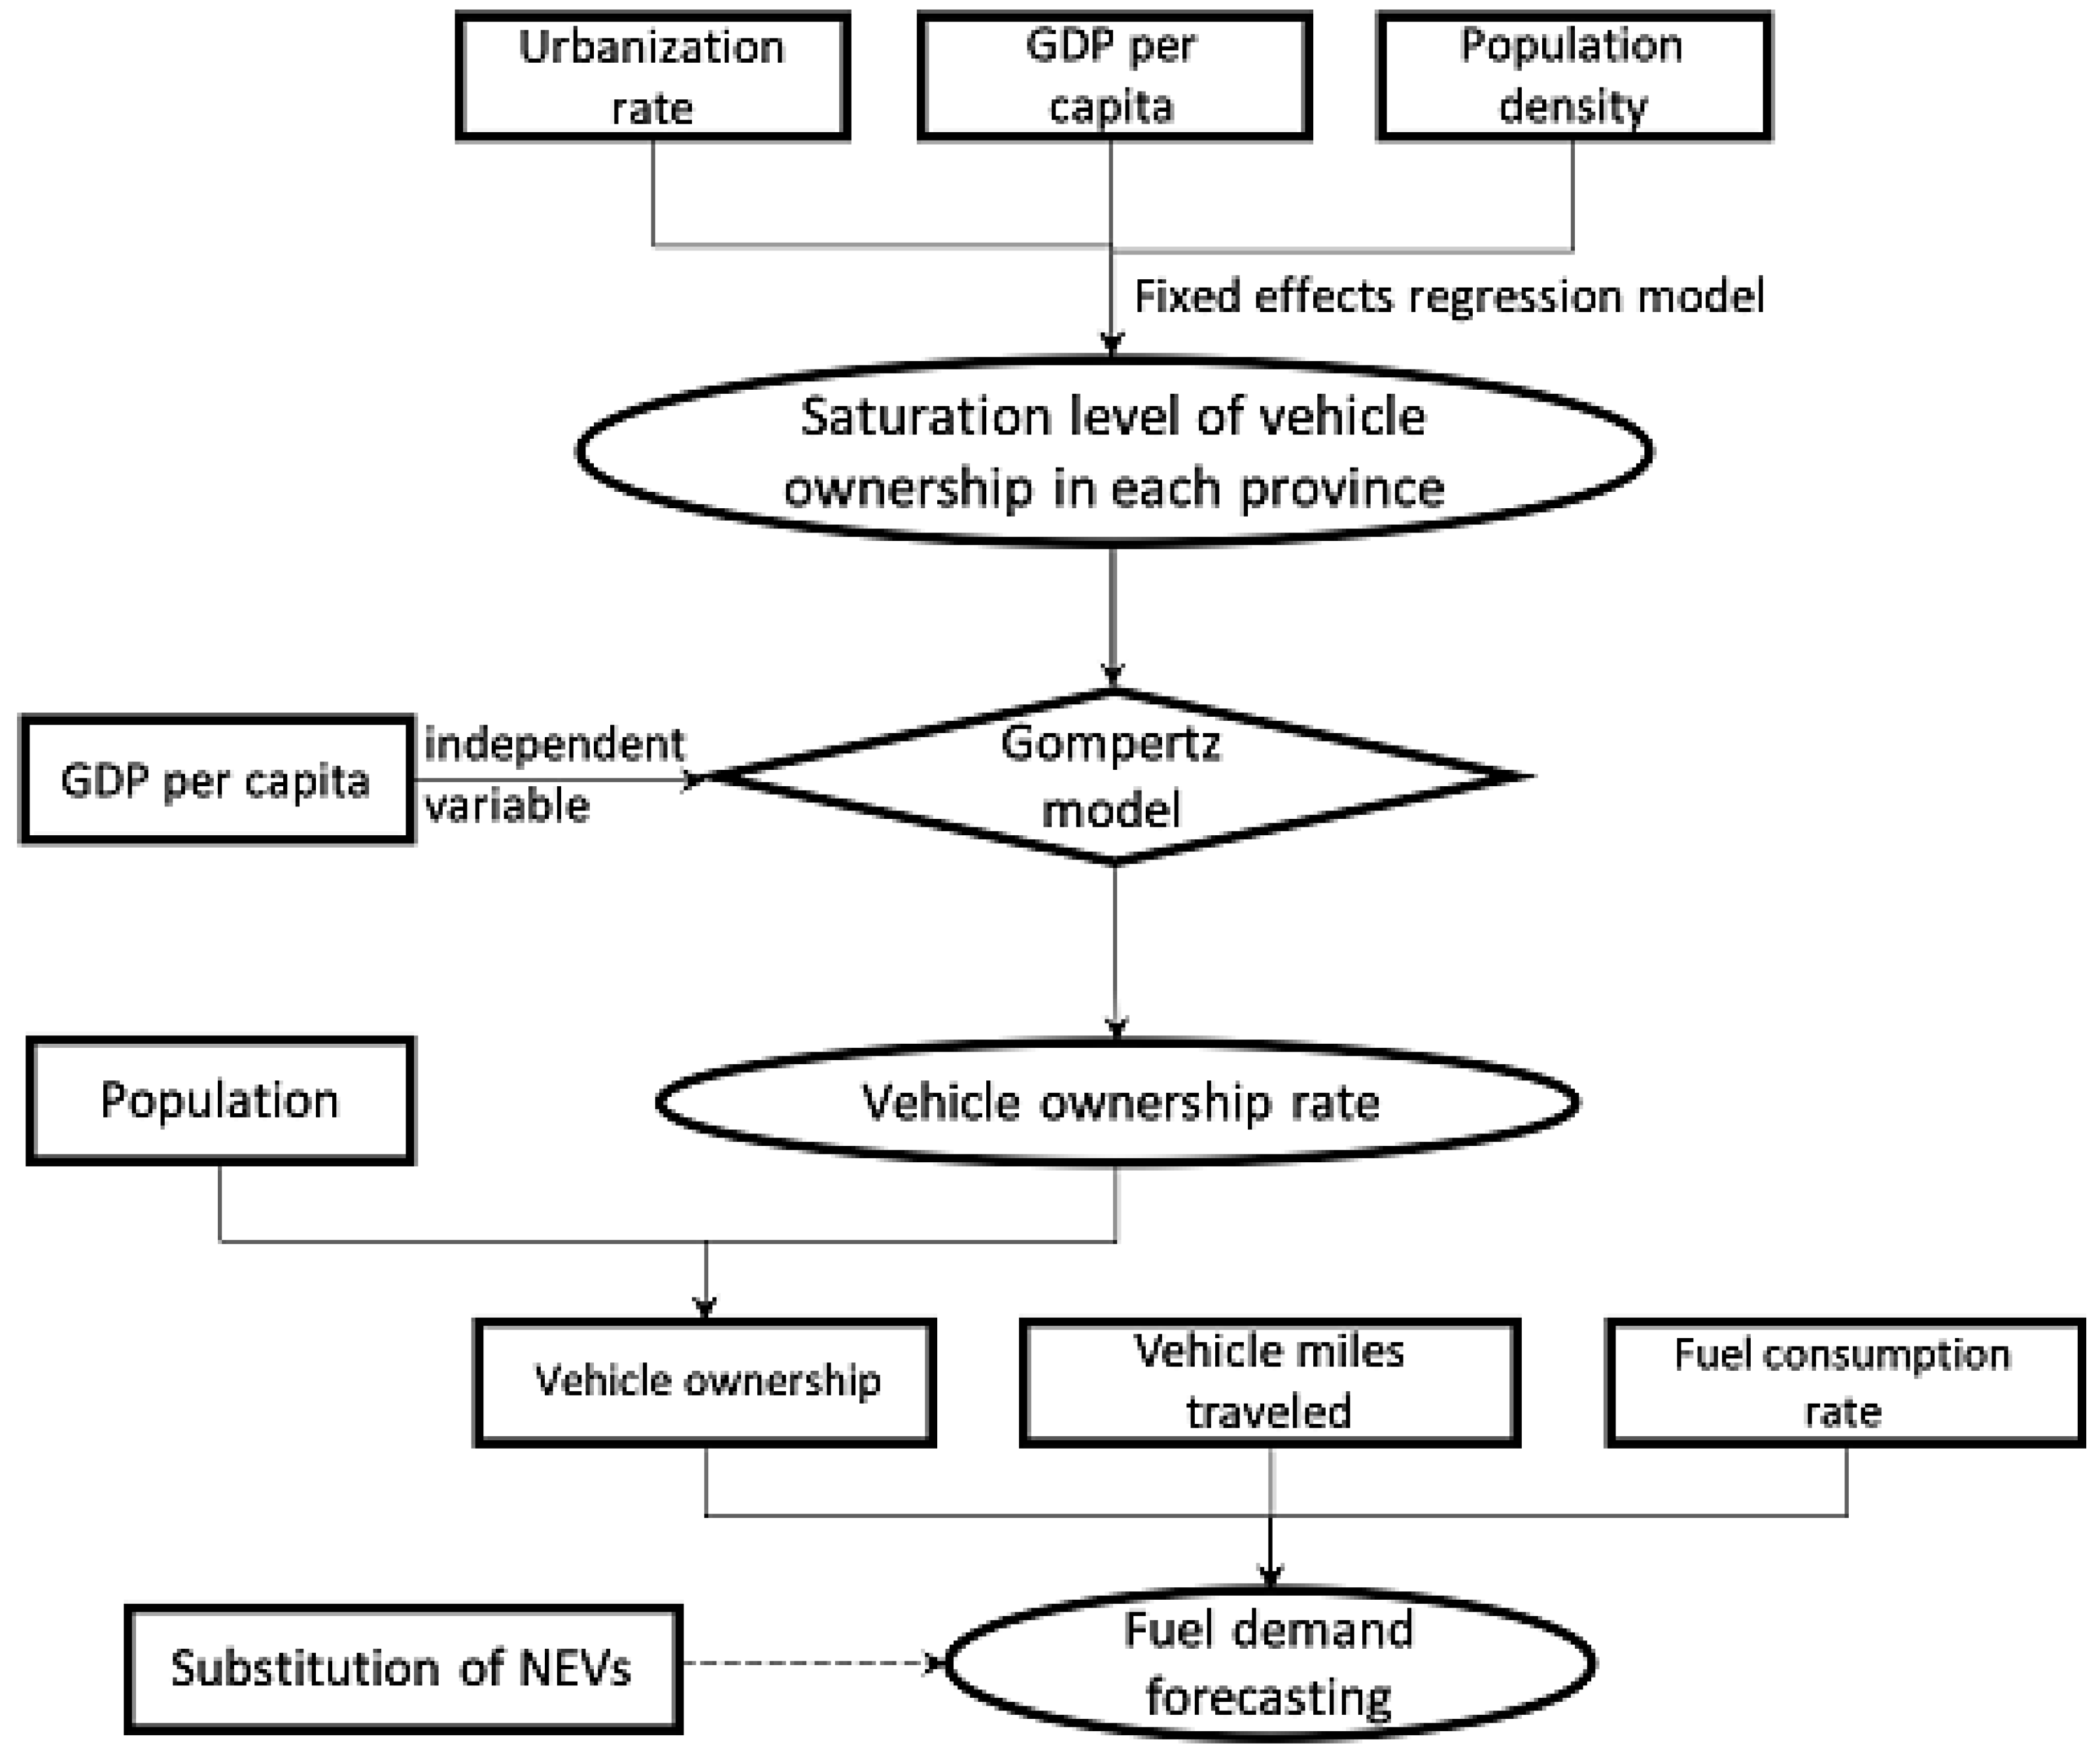
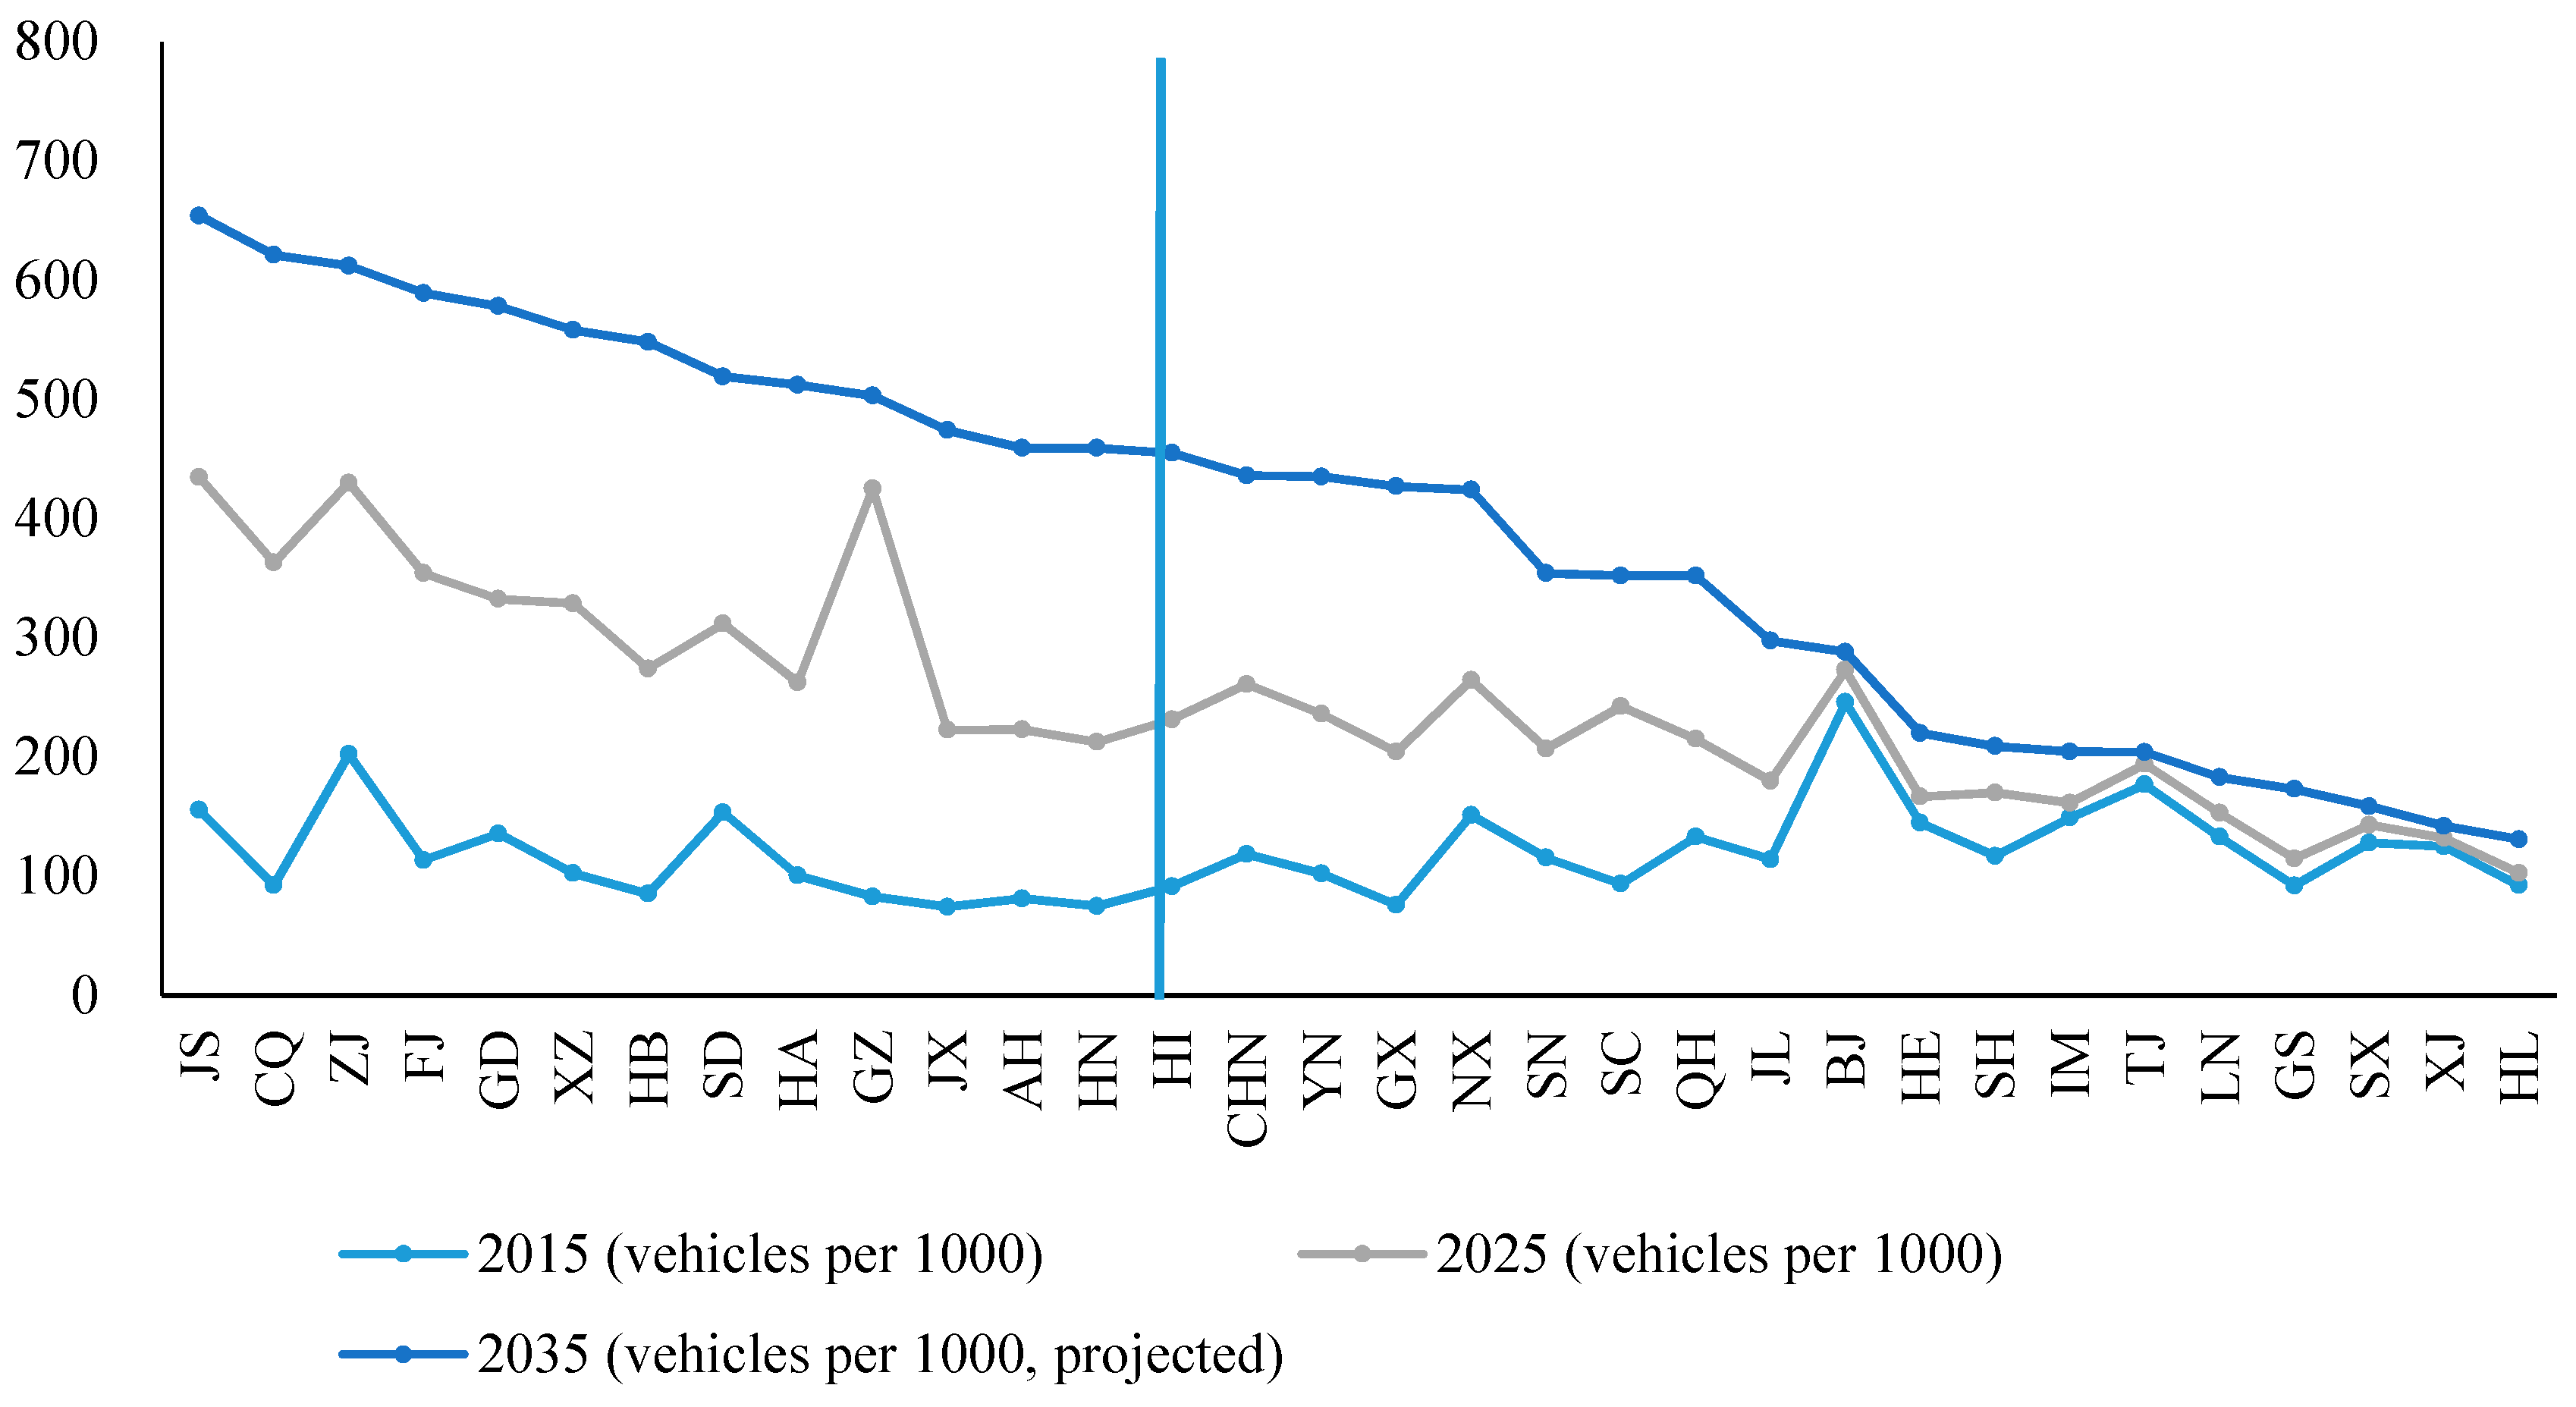
3.1. Vehicle Ownership Projection

Previous studies show that there is obvious positive correlation between vehicle ownership rate and GDP per capita, and the growth rate of vehicle ownership rate with GDP per capita growth is not stable, but follows an S-shape upward trend [12,13,14,15]. The internal logic is as follows: When the income level is very low, the increase in income for the residents will be preferentially spent on daily necessities. As resident income rises, together with the social transportation infrastructure improved, the demand for automobiles will rise rapidly because residents have extra money after solving the problem of food and clothing. Then, the growth of vehicle ownership rate will slow down and gradually approach saturation when resident income reaches a certain level and most residents have their traffic needs met. Finally, at an extremely high income level, residents will not have a larger number of cars, but replace the old cars with new ones when necessary.
The S-shape curves for demand forecasting can be fit using different models, such as the Bass model, the Logistic model, and the Gompertz model. All three curve models indicate that as the independent variable increases, the growth rate of the dependent variable first has an increasing growth, and then slows down, and finally approaches a saturation level. The Bass model is usually used to describe the diffusion trend of a technological innovation. The Logistic model is applicable to describe the life cycle of a consumer product, with a curve symmetrical about the inflexion point and time as the independent variable. The Gompertz model has similar features to the Logistic model, with excellent applicability and general characteristics of the growth curve. However, its corresponding S-shape curve is asymmetrical about the inflection point, and the independent variable may not be time. Compared with the Bass model and the Logistic model, the Gompertz model is more suitable for the prediction of vehicle ownership rate. The existing research also verifies that. Based on the historical data of vehicle ownership in the United Kingdom, Muraleedharakurup et al. [17] confirmed that the Gompertz model is better than the Logistic model and the Bass model in terms of forecasting future hybrid vehicle adaptation. Similarly, Huo and Wang [18] performed regression analysis using data of vehicle sales and stocks in China. The results also showed that the Gompertz model fit best among the three models.
We draw on and expand the Gompertz model established by Dargay and Gately [20] to forecast the vehicle ownership of the 31 provinces of China in 2035. We assume that the relationship between vehicle ownership rate and GDP per capita can be expressed as the following:
Y i t = M i t e a i e b i P G D P i t
where i and t denote province and time, respectively; Y i t is the vehicle ownership rate (measured in vehicles per 1000 people) of province i at time t; P G D P i t is the real GDP per capita (measured in GDP per 1000 people) of province i at time t; M i t     is the saturation level of the vehicle ownership rate (measured in vehicles per 1000 people) of province i at time t; a i and b i are two parameters to be estimated that determine the shape or curvature of the function. (Let the second derivative of Equation (1) be equal to 0, and we can get the per capita GDP and the exact year of each province at the inflexion point.) This model takes into account the provincial differences both in the saturation level of vehicle ownership and in the time required to reach the saturation level in China.
Equation (1) can be mathematically transformed as:
l n ( l n M i l n Y i t ) = ln a i b i P G D P i t
In order to predict the vehicle ownership rate of each province in 2035, we use the data of 31 provinces in the past 20 years to establish the regression model to estimate the parameters a i and b i   . The model is as follows:
y i t = α i + β i P G D P i t + ε i t
where y i t = l n ( l n M i l n Y i t )   , α i = l n a i   , β i = b i   , i = 1 , 2 , , 31   , t = 1 , 2 , , 20   . The random error term ε it 
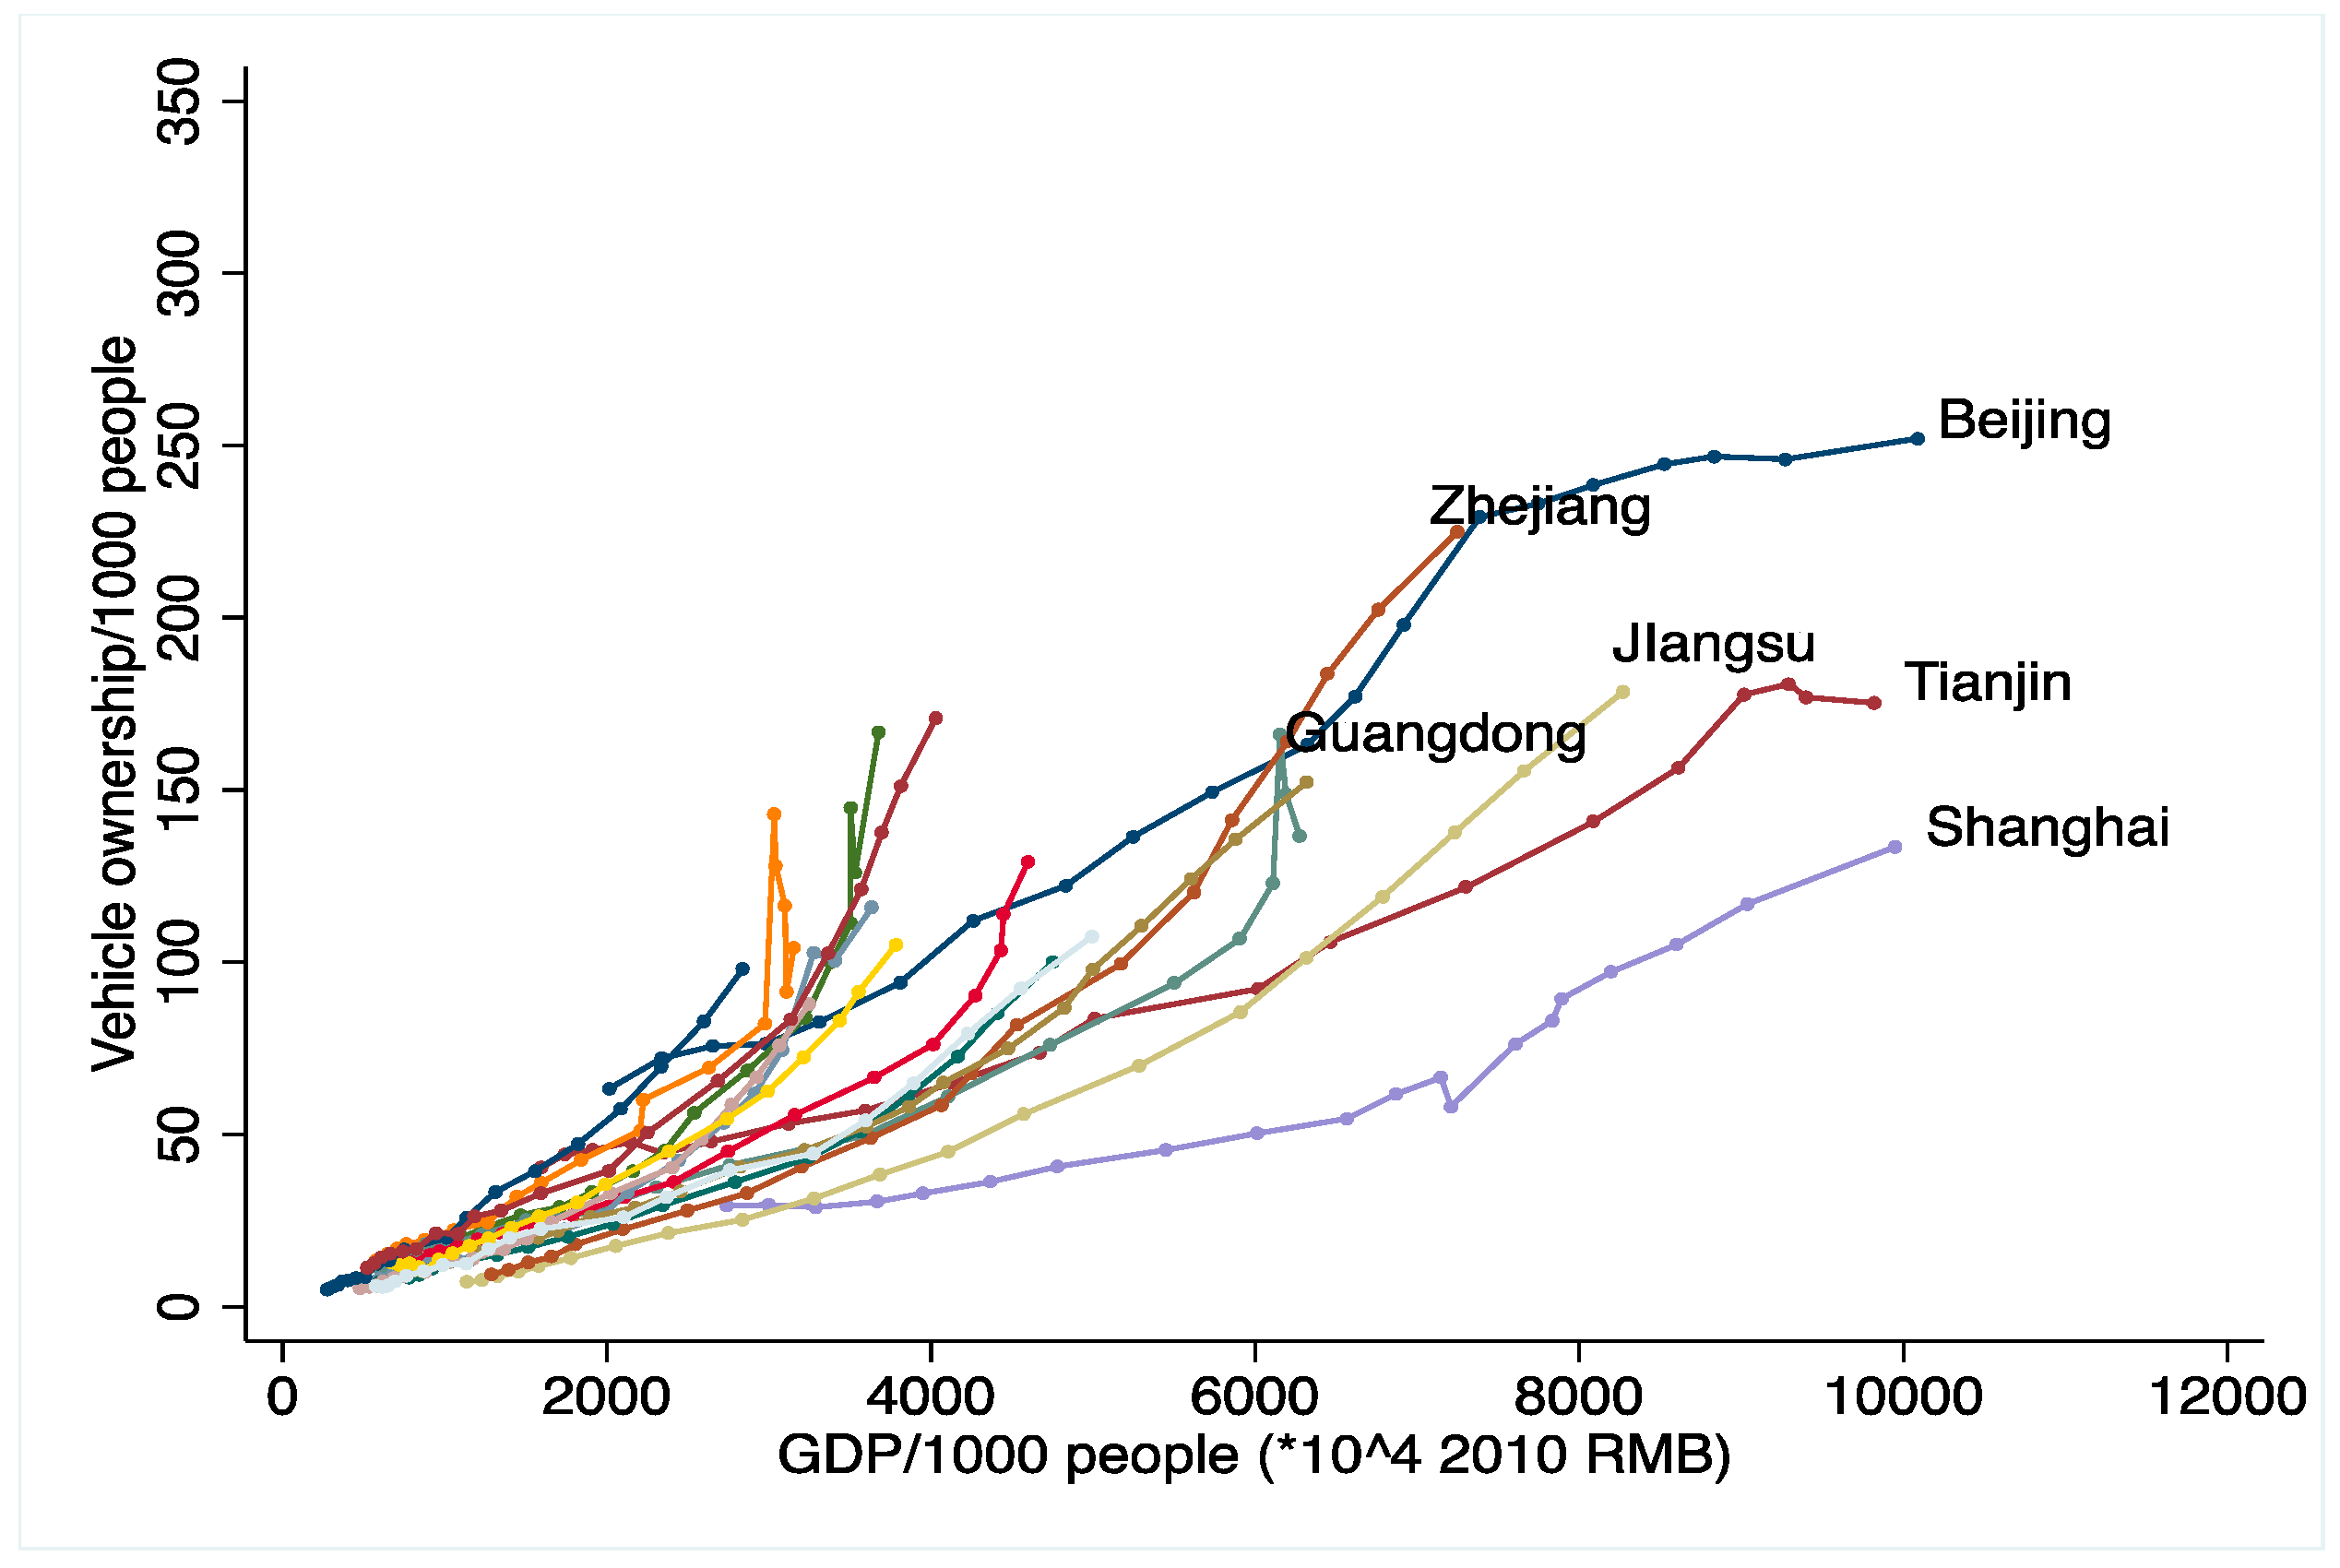
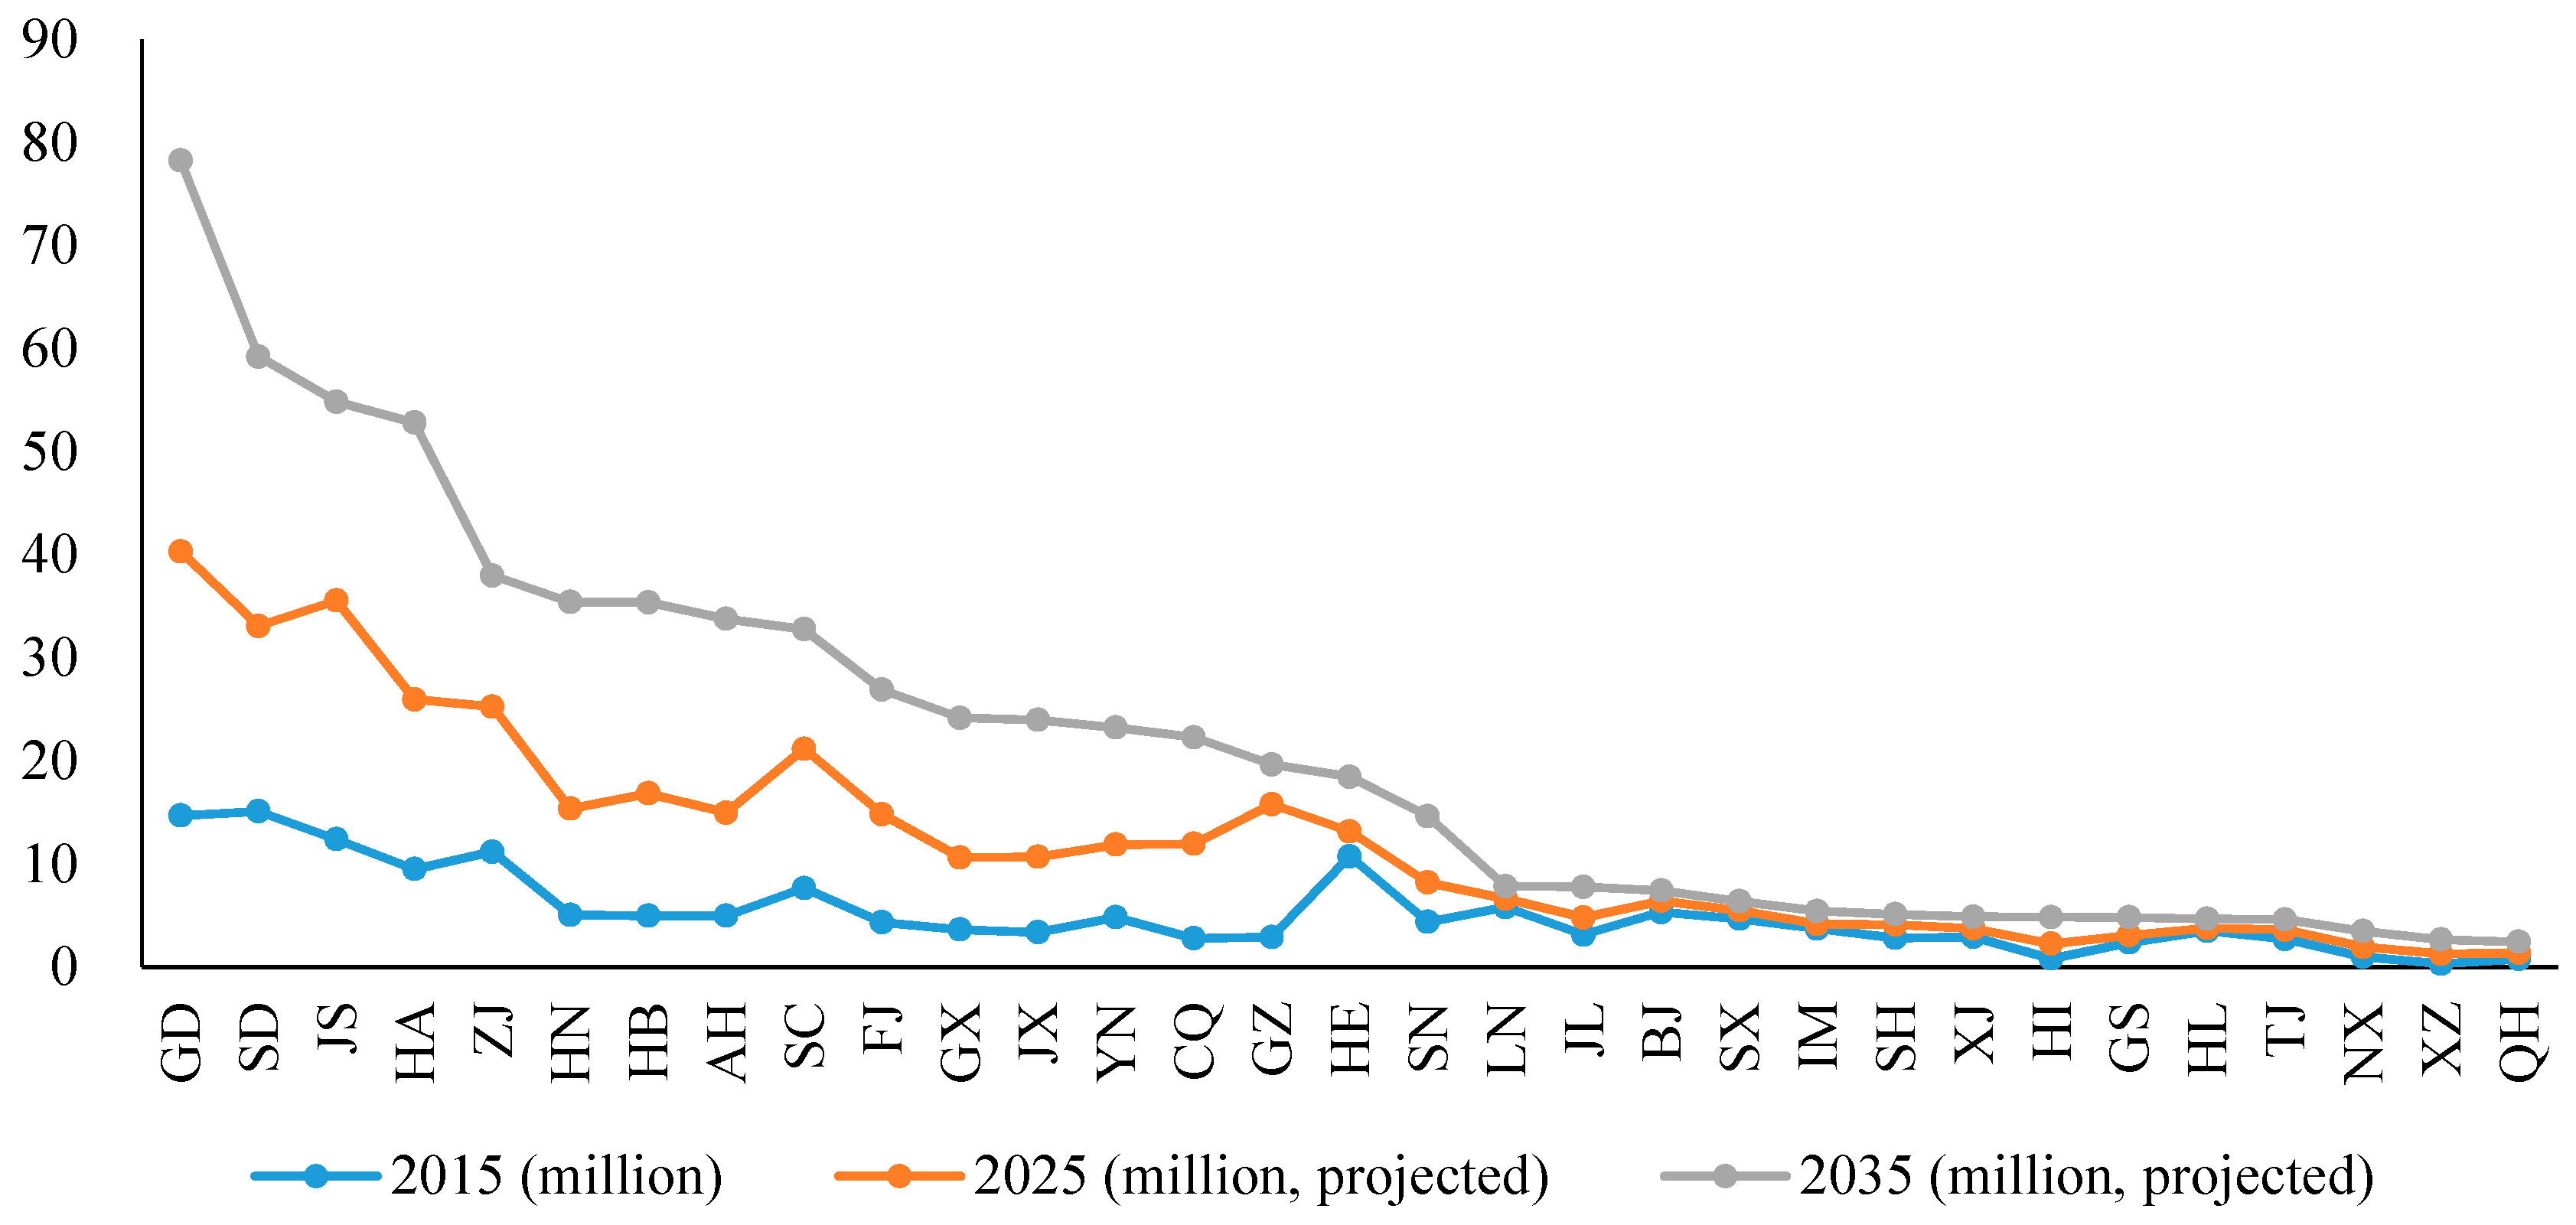
satisfies the assumption of independence, zero conditional mean, and homoscedasticity. As it can be seen from Figure 3, most provinces in China have not yet reached the level of vehicle saturation, so it is necessary to set M i t   , the saturation level of vehicle ownership rate in each province. Regarding the setting of M i t   , there is no unified and standard method for that by now. Gu et al. [21] divided China’s 31 provinces into three groups by their urbanization rate in 2007 and assigned different saturation levels to different groups in their prediction of China’s vehicle ownership. Based on the saturation level of the US vehicle ownership rate, Dargay et al. [22] used the data on urbanization rates and population densities to adjust the saturation levels of different countries when predicting the vehicle ownership in 45 countries around the world. According to the domestic and foreign research results, GDP per capita, urbanization rate, and population density are important factors affecting the growth of the vehicle ownership rate in a region [23,24]. Considering the heterogeneity of different provinces in China, we estimate the saturation levels of the vehicle ownership rate in different provinces separately. For province i   , the saturation level of its vehicle ownership rate at year t can be expressed as:
M i t = δ 0 + δ 1 P G D P i t + δ 2 U r b a n i t + δ 3 D e n s i t y i t + e i t
In Equation (4), P G D P i t represents the real GDP per 1000 people; U r b a n i t indicates the urbanization rate; D e n s i t y i t is the population density. Besides, δ 0   , δ 1   , δ 2 , and δ 3 are parameters of the model; e i t is the error term. As P G D P   , U r b a n   , and D e n s i t y change over time, the maximum potential value of the vehicle ownership rate in each province also changes with time. The descriptions of model parameters are shown in Table 1.
Table 1. Descriptions of model parameters.
It can be demonstrated from Equation (4) that the parameters ( δ 0   , δ 1   , δ 2   , δ 3   
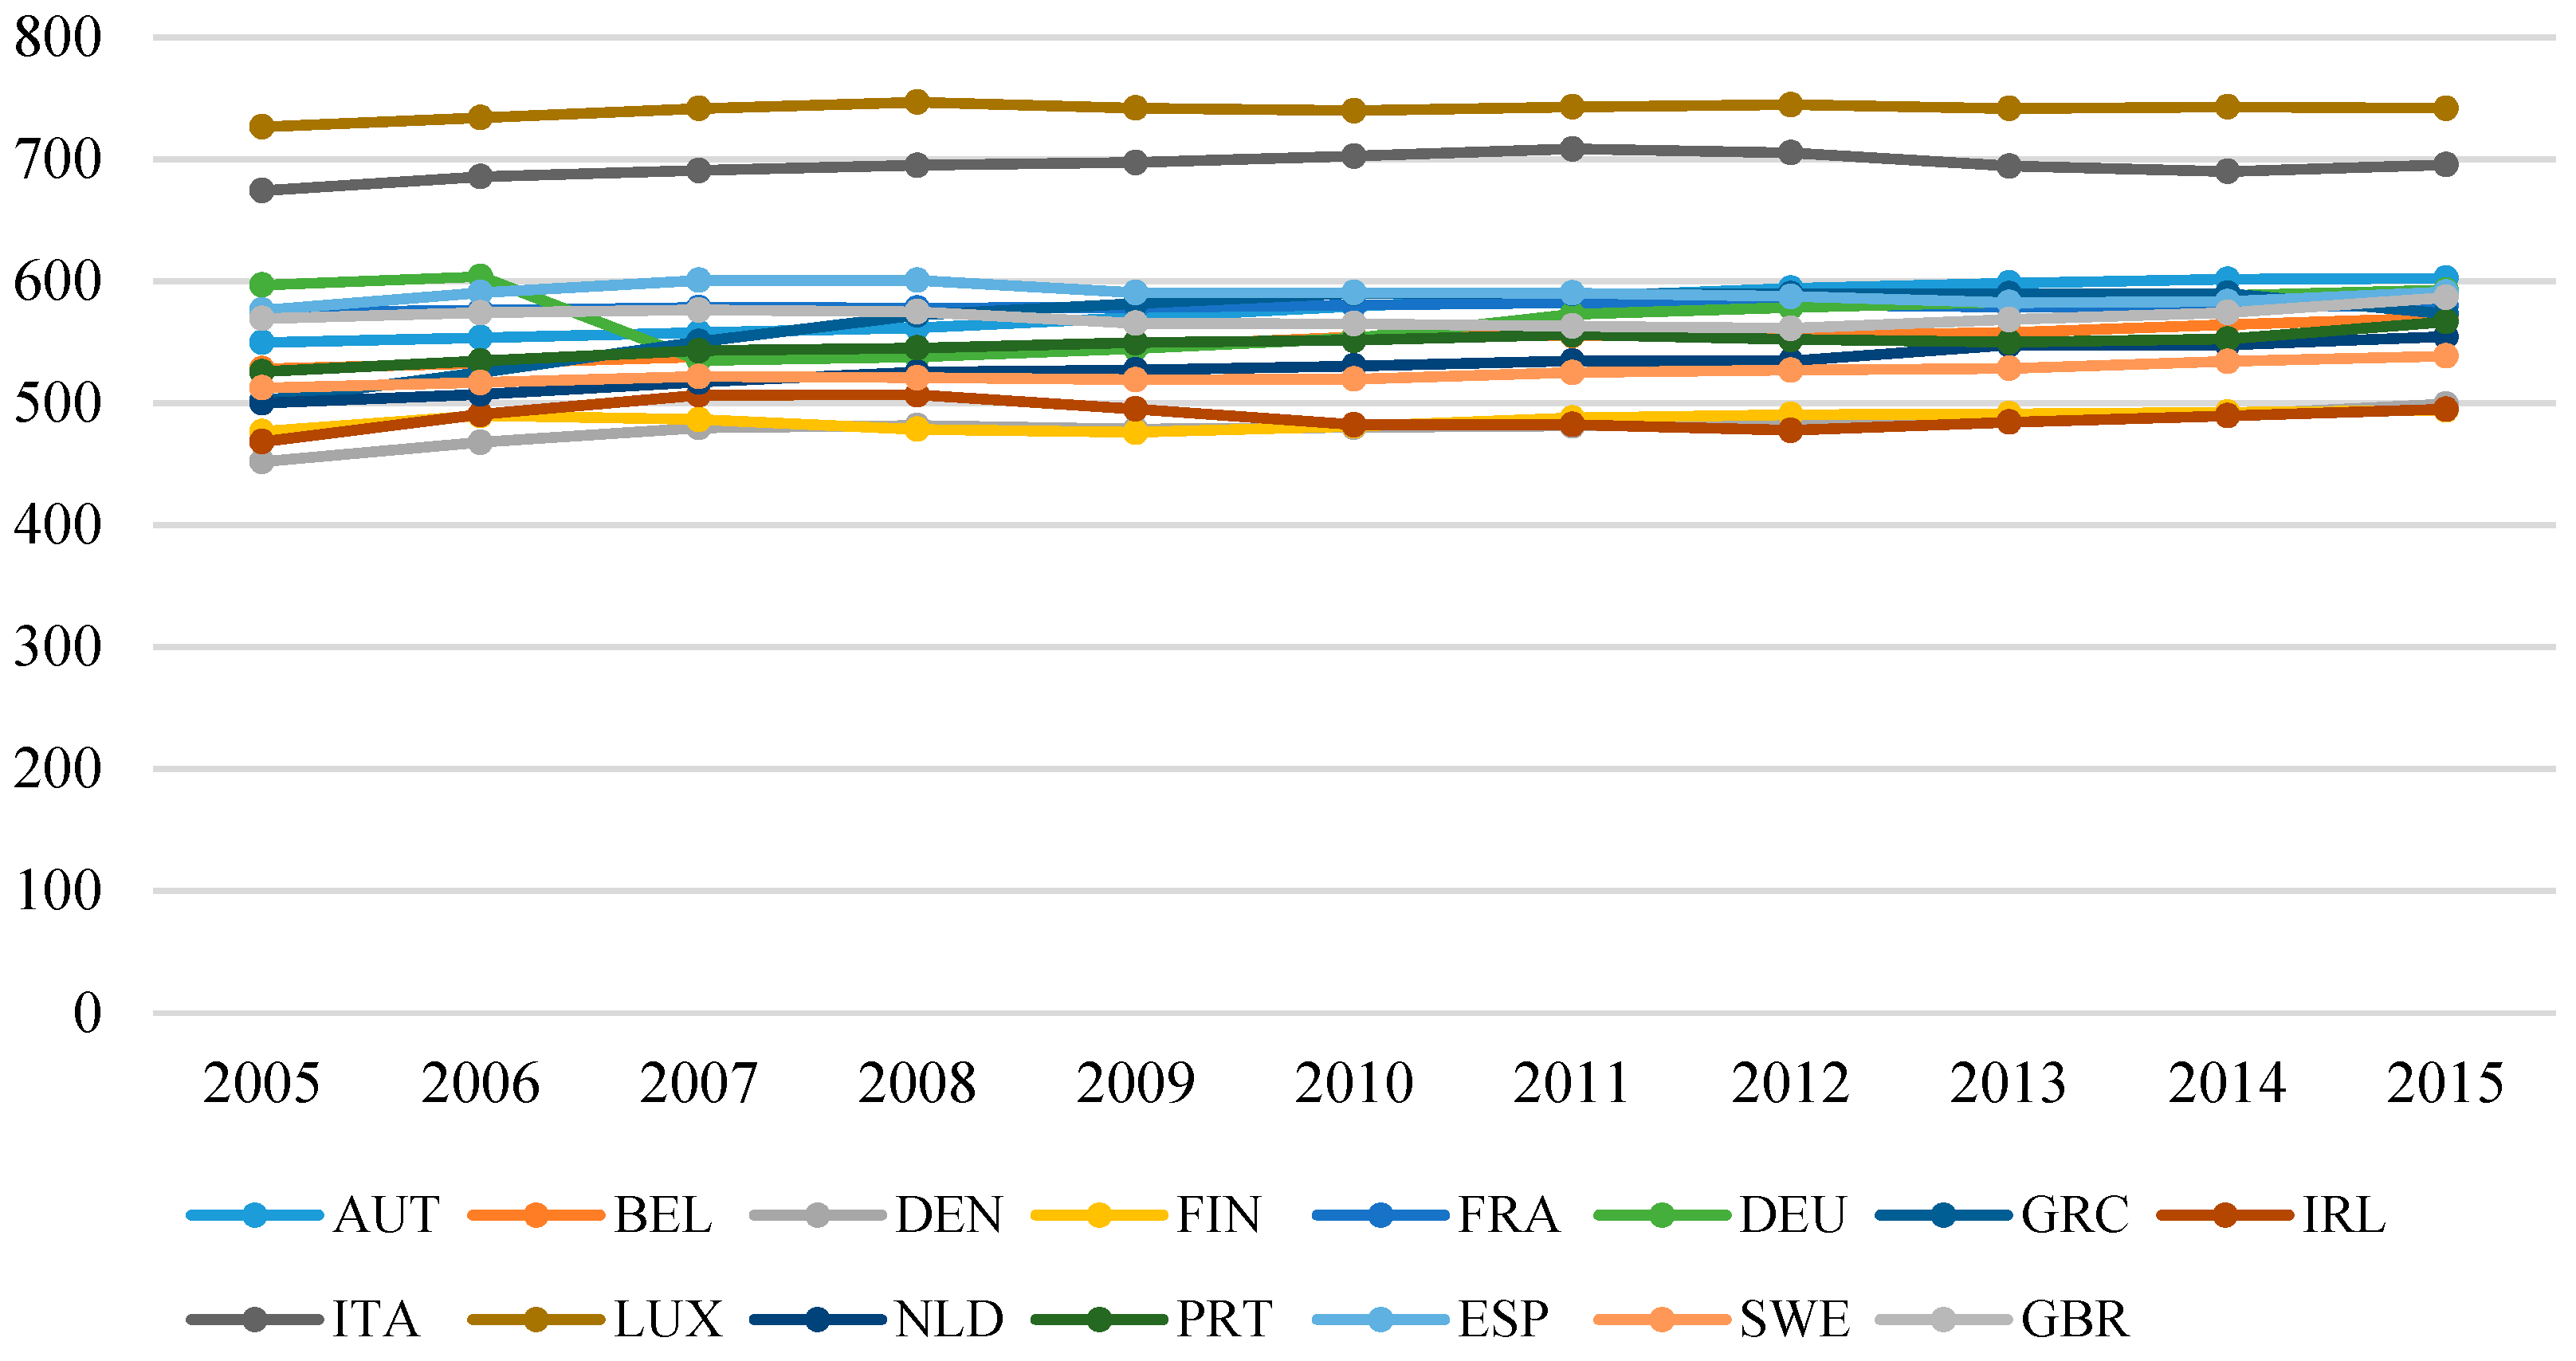
) in the above model must be obtained first to obtain the vehicle saturation level of each province in 2035. China’s vehicle ownership rate has not yet reached the saturation level, and it is impossible to use China’s historical data to estimate these parameters. This paper uses the historical data of EU15 to measure the parameters in the model. This is mainly for two reasons: Firstly, countries or regions to be chosen must have already reached or approached the saturation level of vehicle ownership rate in order to meet the requirements in Equation (4). Around the world, countries and regions with a high vehicle ownership rate include countries in North America and some other developed countries in Europe. As it can be seen from Figure 2, the vehicle ownership rate in EU15 is relatively stable between 2005 and 2015. Secondly, to more accurately estimate the saturation level of China’s vehicle ownership rate, it is necessary to select countries and regions with similar population distribution and geographical structure to China to minimize the error. The population density of the United States and Canada in North America is far less than China, while EU15 are more similar to China in terms of population distribution and regional structure. (In 2016, China, the United States, Canada, and EU15 had a population density of 143.1 peo./km2, 35.3 peo./km2, 4 peo./km2, and 125.6 peo./km2 respectively.) Therefore, we finally chose the historical data of EU15 to measure the parameters in Equation (4). After determining the parameters in Equation (4), the predicted real GDP per capita (2010 RMB), urbanization rate, and population density of each province in 2035 need to be estimated to obtain the saturation level of vehicle ownership rate. This paper assumes that the total population and GDP per capita of each province increases at the average annual growth rate between 2013 and 2016. The urban population grows linearly at the average number between 2013 and 2016. The land area of each province remains constant until 2035.
Figure 2. Annual vehicle ownership per 1000 people of EU15. Source: OICA.
After determining the saturation level of the vehicle ownership rate of each province, we can estimate the parameters a i and b i in the Gompertz model by the regression model, using the historical data of the vehicle ownership rate and real GDP per capita (2010 RMB) of the 31 provinces from 1997 to 2016. After that, we can get the forecast results of the vehicle ownership rate of each province in 2035. On the basis of the forecast vehicle ownership rate, this paper assumes that the total population of each province increases at the average growth rate between 2013 and 2016, and obtains the forecast results of vehicle ownership in each province in 2035.
In the vehicle ownership forecasting model, the data involved includes real GDP per capita of each province, the vehicle ownership rate of each province, and the saturation level of the vehicle ownership rate of each province. Among them, real GDP per capita of each province over the years comes from the China Statistical Yearbook from 1996 to 2017, deflated by the CPI, with 2010 as the base year. The vehicle ownership rate is the ratio of vehicle ownership to total population, from the China Automotive Market Yearbook and the China Statistical Yearbook over the years, respectively.
In the setting of the saturation level of the vehicle ownership rate, the data involved includes vehicle ownership, the real GDP per capita (2010 RMB), the urbanization rate, and the population density in EU15 and in the 31 provinces of China. Among them, the data of vehicle ownership in EU15 comes from the International Organization of Motor Vehicle Manufacturers (OICA). The real GDP per capita (2010 RMB), urbanization rate, and population density are from the World Bank database. The historical data of vehicle ownership, real GDP per capita (2010 RMB), urbanization rate, and population density of the 31 provinces over the years are from the provincial statistical yearbooks.

3.2. Fuel Demand Projection

Fuel demand is determined by vehicle population, average miles traveled, and fuel consumption rates [18]. Since the average mileage and fuel economy of different types of vehicles vary greatly, we further categorize them into eight types. Fuel demand of each type can be expressed as follows:
F C i t = j ( Y i j t × V M T i j t × F R i j t × F D )
where F C i t is the fuel consumption of province i in the year t   ; Y i j t denotes the vehicle type j ownership of province i in the year t   , and Y i t = j Y i j t   , in million; V M T i j t is the annual miles traveled by vehicle type j of province i in the year t   , in kilometers; F R i j t is the fuel consumption rate of vehicle type j of province i in the year t   , in L/100 km; F D indicates the density of the fossil fuel, and the unit is kg/L.
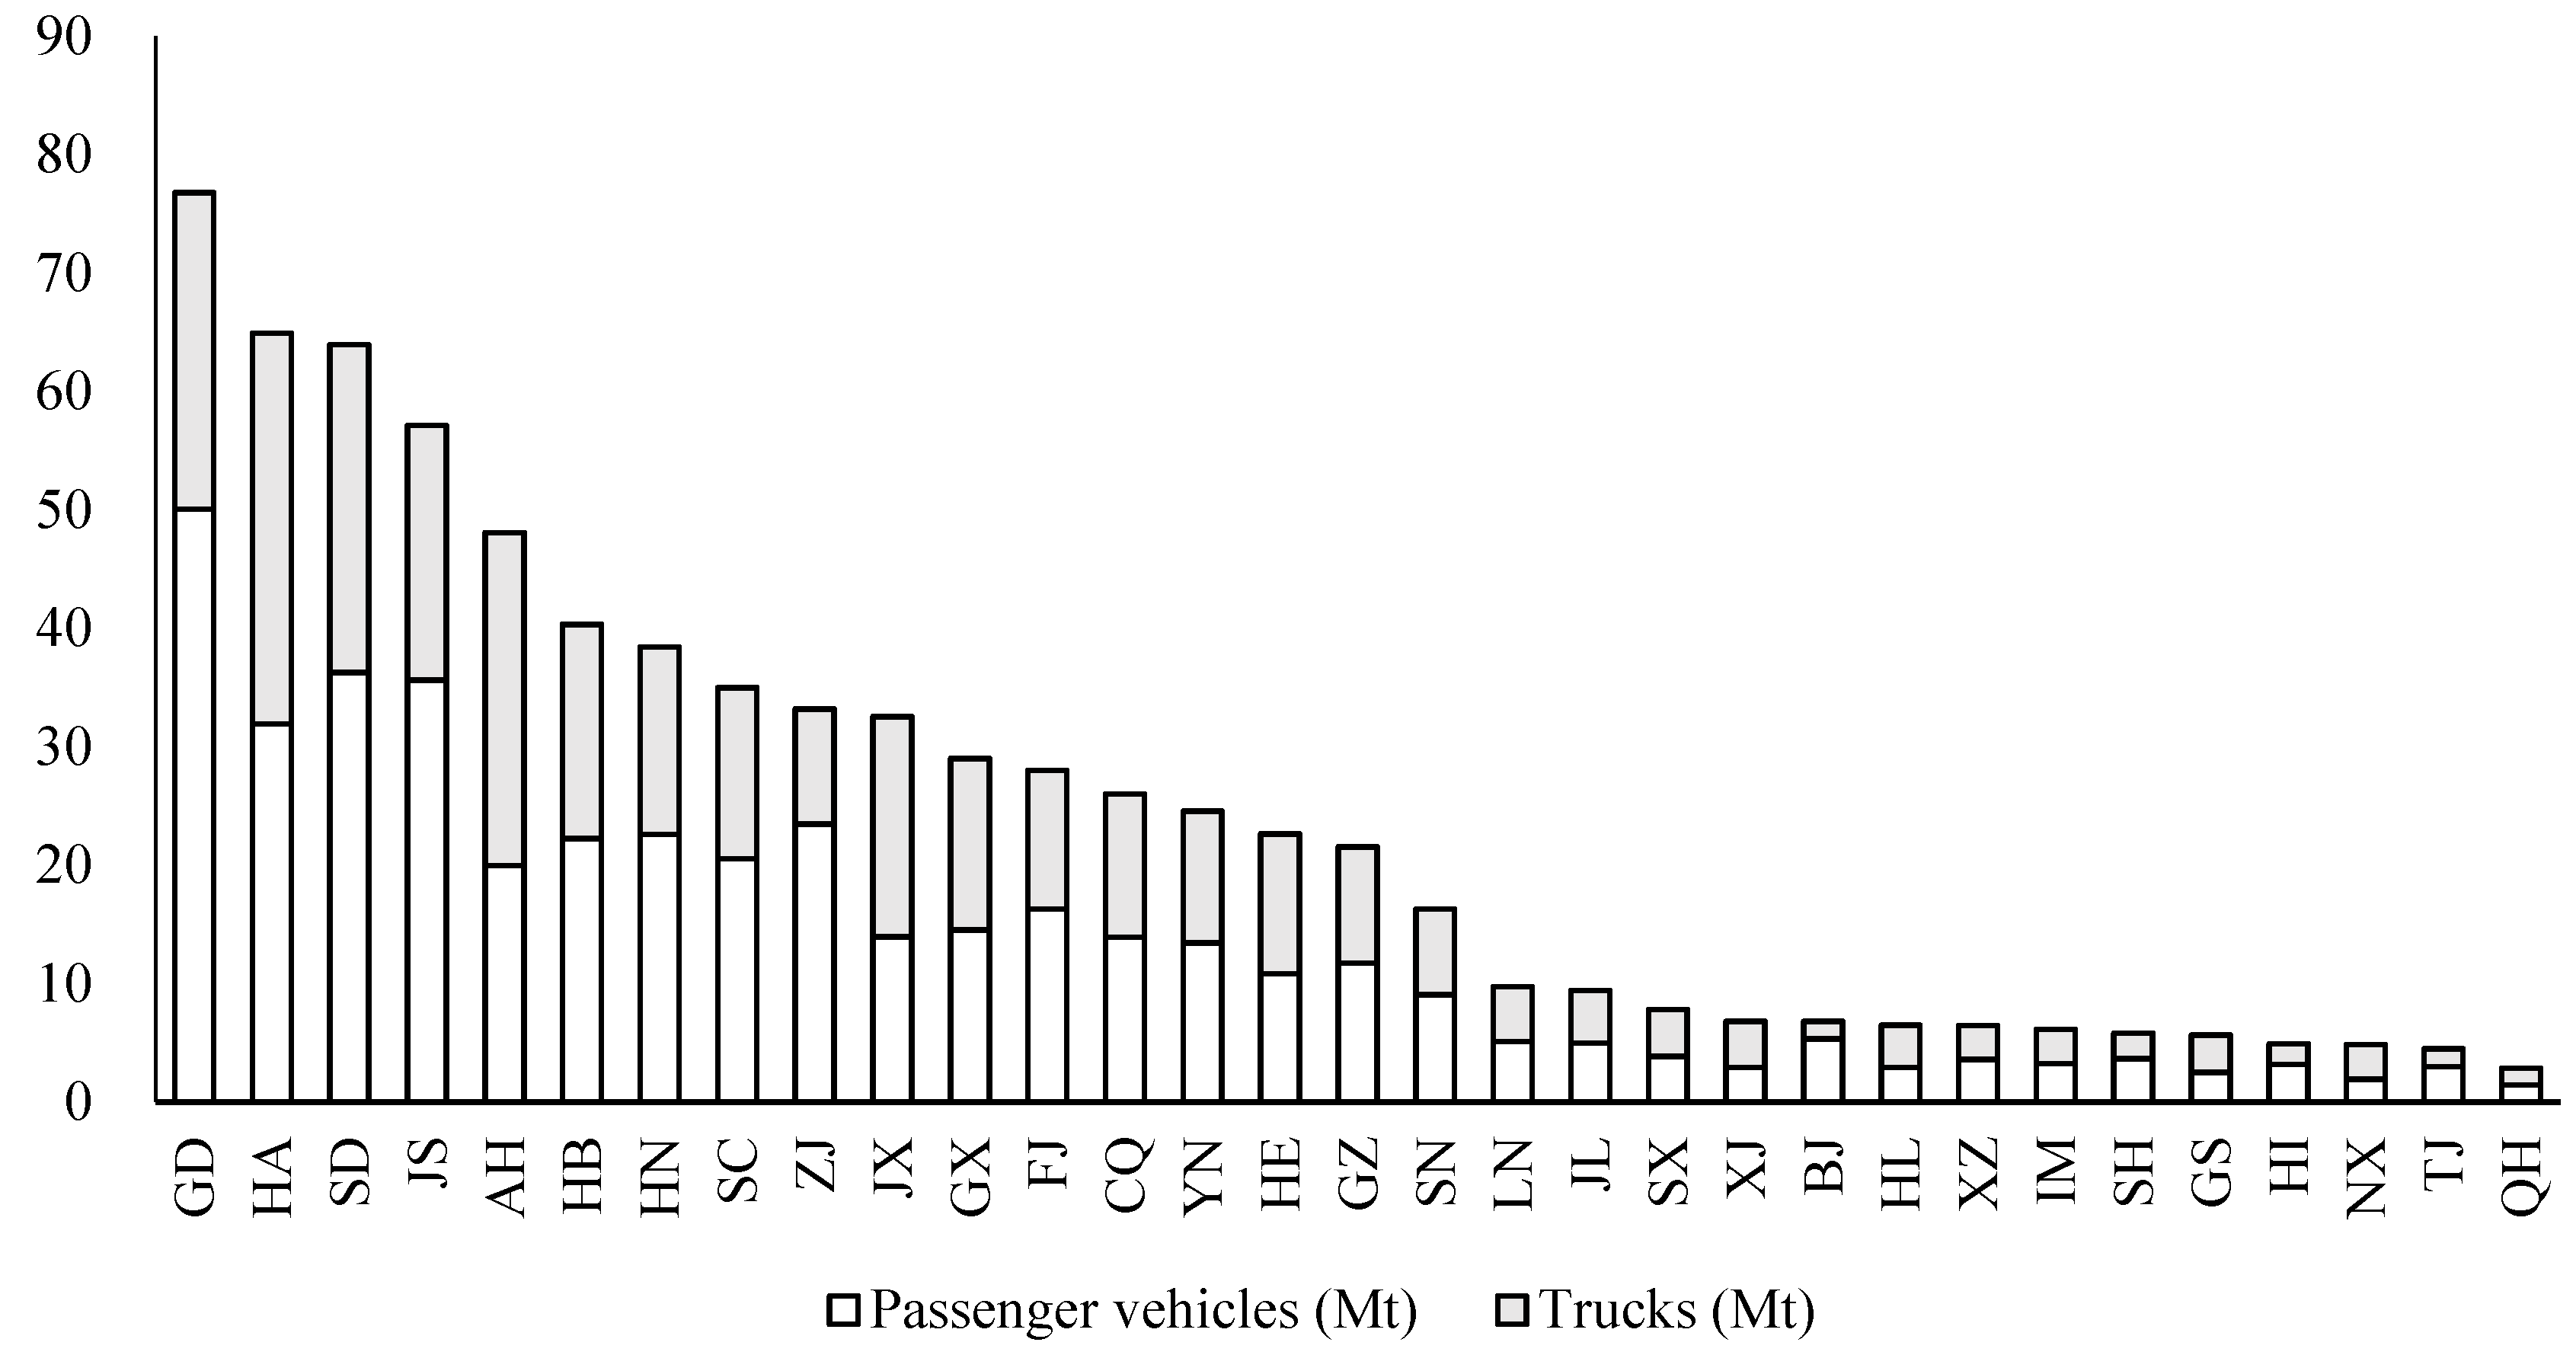
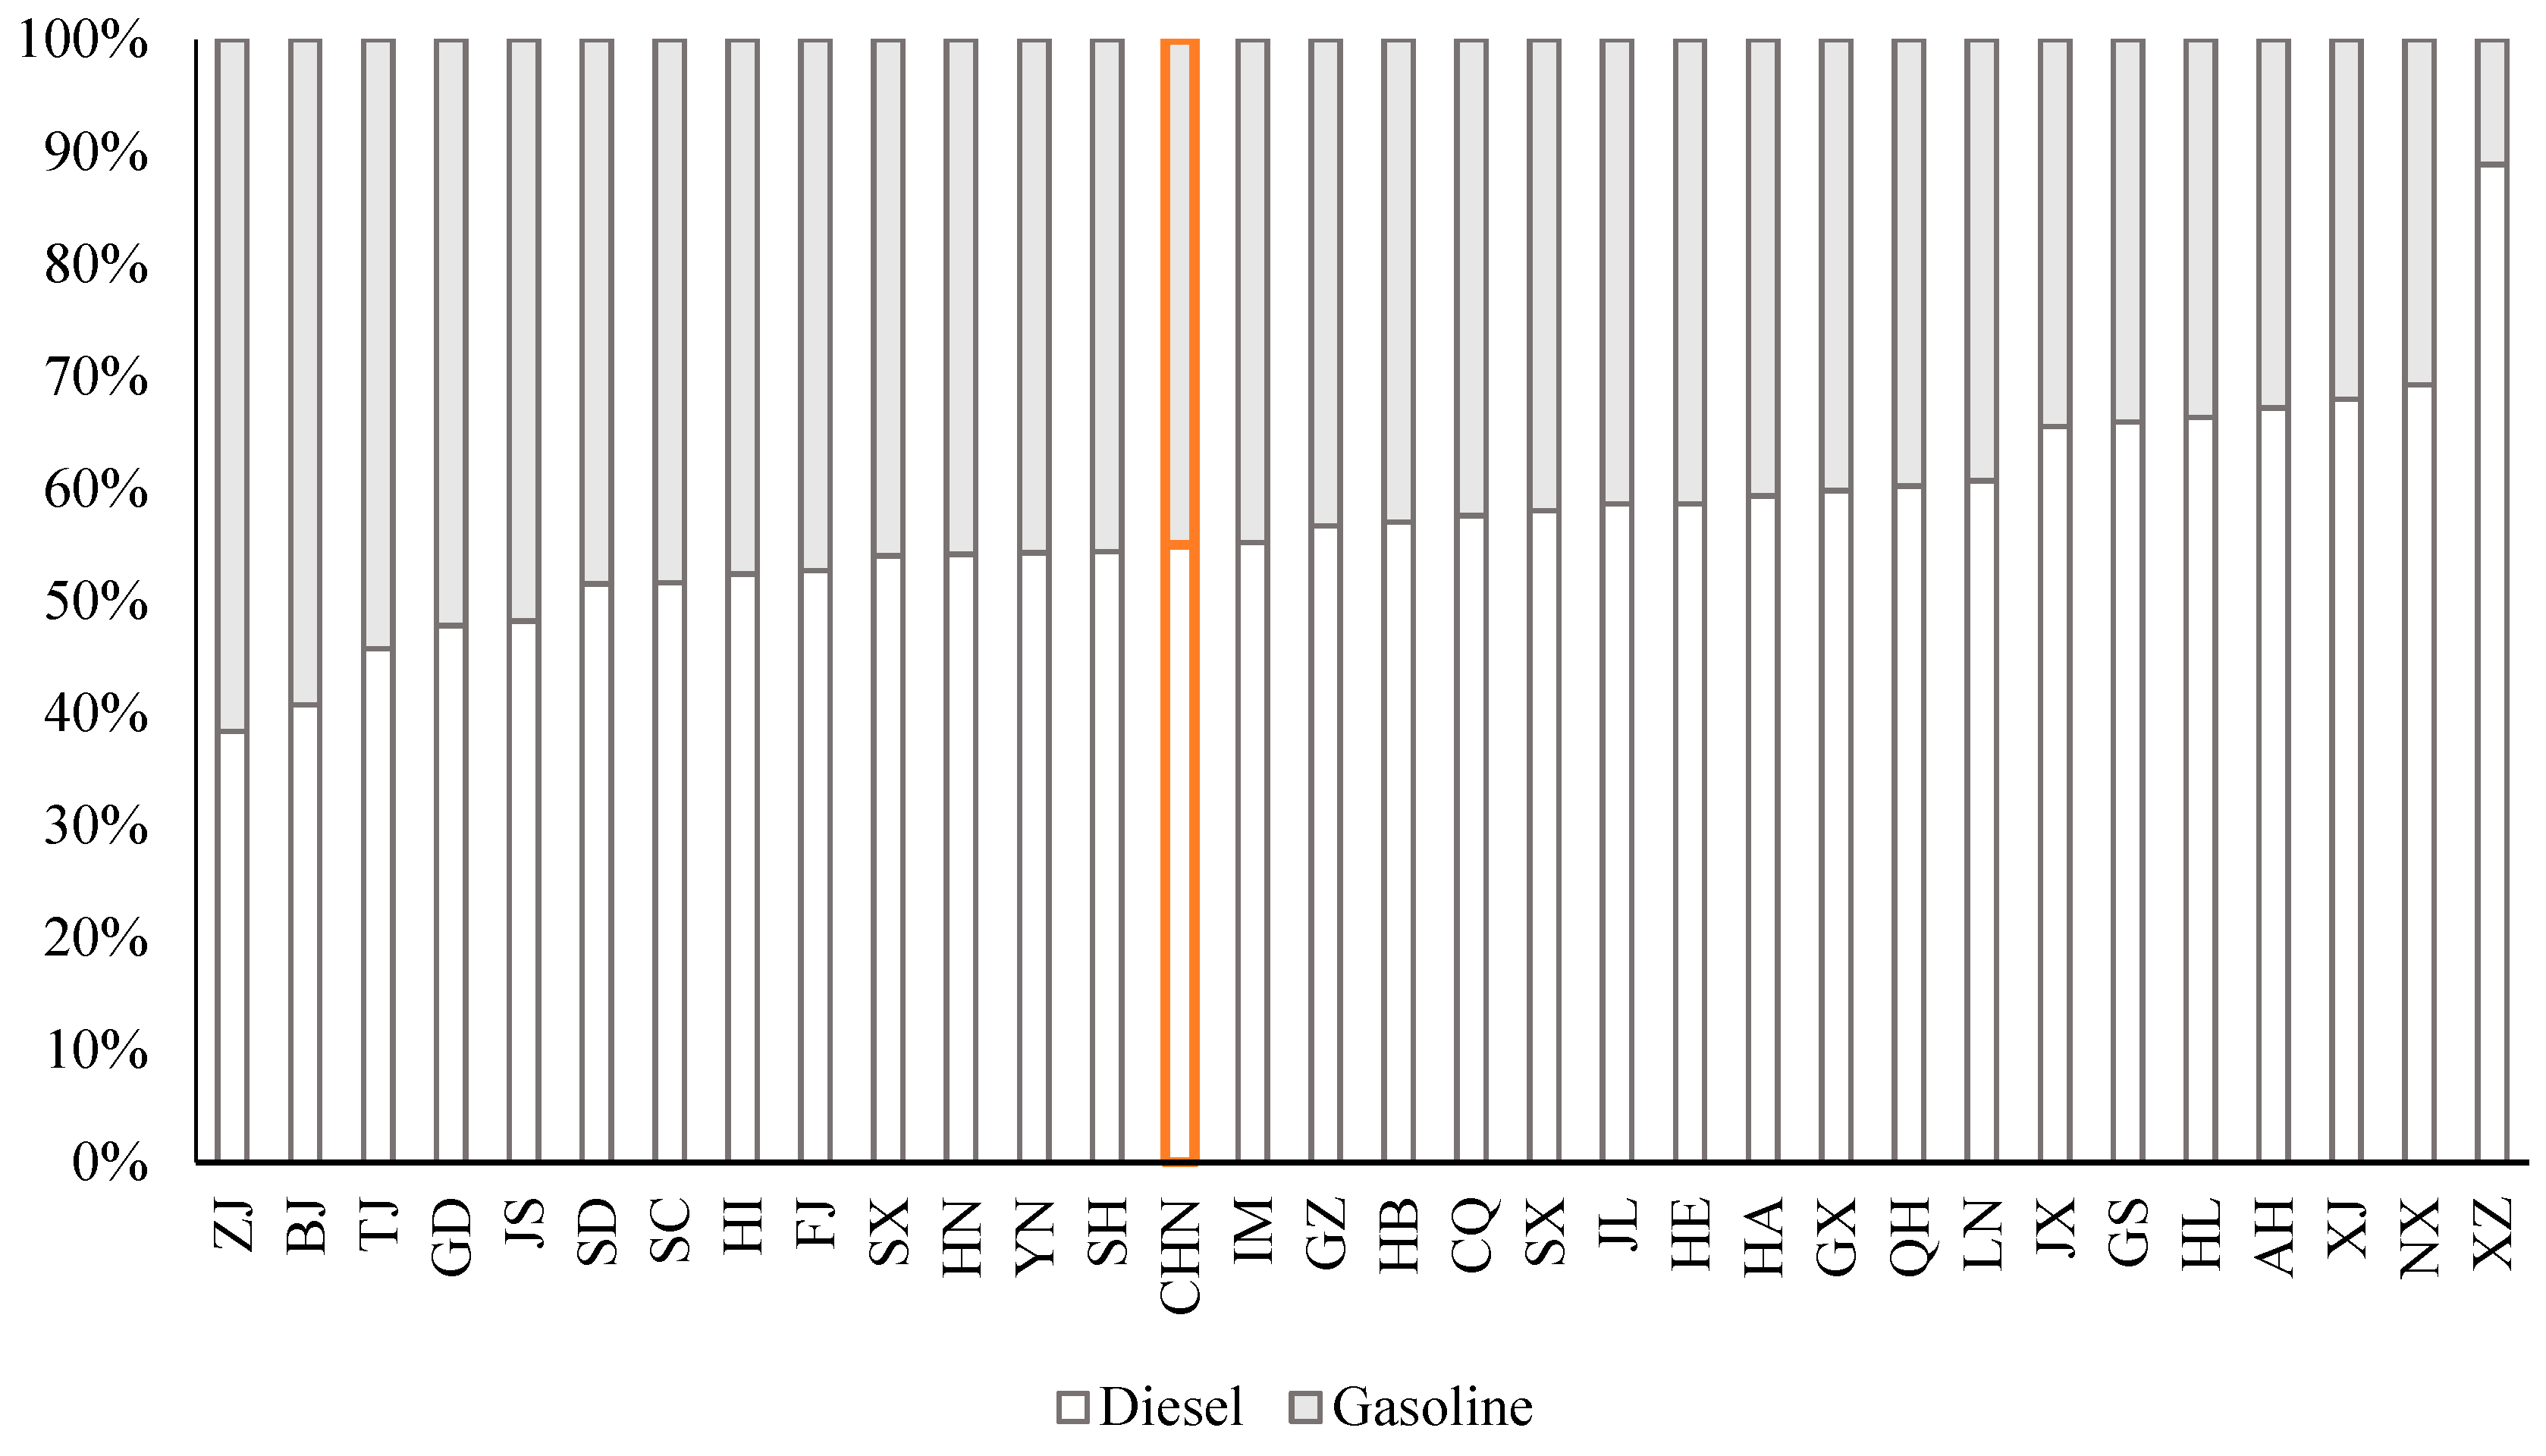
The National Bureau of Statistics divides vehicles into passenger vehicles and trucks. The passenger vehicles are further divided into large passenger vehicles (LPVs), medium passenger vehicles (MPVs), small passenger vehicles (SPVs), and mini cars (MCs). Trucks are further divided into heavy-duty trucks (HDTs), medium-duty trucks (MDTs), light-duty trucks (LDTs), and mini trucks (MTs). Based on the type of fuel consumed by vehicles, each type is subdivided into petrol ones and diesel ones. Since the population of diesel vehicles in MTs and MCs, and gasoline vehicles in LPVs and HDTs is extremely small, it is feasible in our calculation to assume that all mini vehicles consume gasoline and all heavy vehicles consume diesel.
The number of each vehicle type in each province is determined both by the total vehicle population in the province and by the proportion of the vehicle type. In the past three years, the proportion of each type of automobile in China has changed little [2]. Therefore, we assume that the proportion of each vehicle type in each province remains constant from 2015 to 2035. Y is predicted by the Gompertz model; V M T and F R come from the Annual Report on Automobile Energy-saving in China (2015). The statistics show that the average annual mileage of each type of vehicle changed little in recent years [25,26]. Hence we assume that V M T for each vehicle type is constant until 2035. F R reduces by the average speed between 2004 and 2014. F D is based on National VI Standard (the fifth phase of the national gasoline and diesel national standard). Involved parameters above are summarized in Table 2.
Table 2. Model parameters: Vehicle type, mileage, and fuel economy.

4. Results and Analysis

4.1. Vehicle Ownership

Figure 3 shows the changes in the vehicle ownership rate with GDP per capita in different provinces of China. It does not take much to see that the trend of each province basically conforms to our assumption of the S-shape curve, and most provinces in China have not met the inflexion points where the growth begins to slow. Most provinces are still in a period of accelerated growth.
Figure 3. Vehicle ownership per 1000 people versus GDP per 1000 people in China for 1997–2016. Note: GDP data of each province is deflated by the CPI, with 2010 as the base year. All the data here comes from the China Statistical Yearbook (1998–2017).
Then, using the panel data of EU15, we establish a fixed effect model to estimate the parameters in Equation (4). The regression results are displayed in Table 3. The t-value is in the parentheses. R2 is 0.846, and the model has a good fitting degree. The regression results show that GDP per capita and population density have significant positive correlations with the vehicle ownership rate. That is, the more developed the economy and the denser the population, the higher the saturation level of the vehicle ownership rate. The coefficient of urbanization rate δ 2 is significantly negative, which means that the higher the level of urbanization, the lower the saturation level of the vehicle ownership rate. That is probably because regions with higher urbanization levels are usually equipped with more developed public transportation and more improved traffic infrastructure.
Table 3. Regression results of Equation (4).
After determining the parameters of Equation (4), we can estimate the saturation level of the vehicle ownership rate   M i t in each province. The estimation results are shown in the sixth column of Table 4. On that basis, parameters in the Gompertz model (3) is estimated from the data of the provincial vehicle ownership rate and the real GDP per capita (2010 RMB) between 1997 and 2016. Then, we forecast the vehicle ownership rate of each province in 2035 based on the estimate results above. The regression results and forecast results are shown in Table 4 and Figure 4. Taking the population growth in to consideration, the projection results of vehicle ownership in each province in 2035 are shown in Figure 5. In particular, for the three municipalities Beijing, Shanghai, and Tianjin, the saturation level of the vehicle ownership rate is more affected by the government’s control policies. The automobile purchase restriction policies of the three cities have greatly limited the growth of vehicle ownership. It could be demonstrated in Figure 3 that the vehicle ownership rate of the three cities has already entered a stage of decelerating growth in recent years. Therefore, our study assumes that the annual increase of automobiles is equal to the number of new license plates. (In fact, the purchase restriction policy is only for passenger cars. However, for the three economically developed cities, more than 90% of the increase in vehicle ownership can be accounted for by the increase of passenger cars. Therefore, the annual increase of automobiles can be approximately seen as the number of new license plates.) According to the current purchase restriction policy, the total number of new license plates in Shanghai and Tianjin is maintained at around 100,000 per year, and the number of car license plates in Beijing has dropped from 150,000 to 100,000 per year since 2018. In our forecast, it is assumed that the number of new license plates will remain at this level in the three municipalities in the future.
Table 4. Provincial projections of saturation level and vehicle ownership per 1000 people in 2035.
Figure 4. Provincial projections of vehicle ownership per 1000 people in 2035.
Figure 5. Provincial projections of vehicle ownership in 2035.
According to the results of regression and prediction, we can find that: (i) The two parameters a and b in the Gompertz model are positive. Combined with Equations (2)–(4), it can be concluded that with the growth of GDP per capita, its positive marginal effect on vehicle ownership rate will increase first and then decrease. That is, as GDP per capita rises, the willingness of residents to increase the proportion of their income for automobile purchase will increase firstly and then gradually decrease, but it will still be positive. Besides, the larger b is, the smaller GDP per capita, corresponding to the saturation level. (ii) Overall, the growth rate of China’s vehicle ownership rate will arrive at the inflection point in 2023, which means that the growth of China’s vehicle ownership rate with GDP per capita will slow down after 2023. In addition, except a few provinces such as Xinjiang, most provinces in China will meet their inflexion points between 2020 and 2029. In other words, the vehicle ownership rate in most provinces will be growing at a slower pace in 2035. (iii) The average vehicle ownership rate of China in 2035 will be 436 vehicles per thousand people, which is nearly three times the number of 118 vehicles per thousand people in 2015, with an average annual growth rate of 6.7%. At the same time, the provincial differences in the vehicle ownership rate will continue to increase in the future. In 2035, Jiangsu, Chongqing, and Zhejiang will have the highest vehicle ownership rates, with 654, 621, and 612 vehicles per thousand people, respectively. Rapid growth is inseparable from the economic development and urban construction in these regions. While in Beijing and Shanghai, where the economy is also very developed, their vehicle ownership rates have gradually approached to saturation and grown with a narrow range due to the policy control. Heilongjiang, Xinjiang, and Shanxi, the three provinces with the lowest vehicle ownership rate, will have only 131, 142, and 159 vehicles per thousand people in 2035. The low growth in these regions is mainly affected by their geographical location and stagnant economic growth. (iv) Taking the total population into account, the total number of vehicle ownership in China will reach 667 million in 2035, which is about three times higher than the number of 163 million in 2015, with an average annual growth of 7.3%. Driven by population or economy, Guangdong, Shandong, and Jiangsu will become the three provinces with the highest vehicle ownership in China. Their vehicle ownership will reach 78.26, 59.23, and 48.84 million, respectively. While the least three provinces, Qinghai, Tibet, and Ningxia will have only 2.46, 2.68, and 3.49 million vehicles, respectively. At the same time, it can be easily found from Figure 5 that Guangdong, Shandong, and Jiangsu, which have great potential for development, will be the main driving forces for China’s automobile growth in the future. Part of that is because of the restriction policy over the extremely densely populated areas, especially in Beijing and Shanghai.

4.2. Fuel Demand

On the basis of the forecast results of vehicle ownership of each province, we take into account factors including the proportion of different vehicle types, annual average mileage, fuel consumption rate, etc., and we get the forecast results of fuel consumption in each province in 2035 (Table 5). It can be seen from the forecast results that: (1) The total national automobile fuel demand is estimated to be 746.69 Mt (gasoline and diesel) in 2035, which is two times higher than the number of 230 Mt in 2015, with an average annual growth of 5.7%. (2) Guangdong, Henan, and Shandong are the three provinces with the highest demand for automobile fuel, which are 76.76, 64.91, and 63.95 Mt respectively. Compared with the previous results of vehicle ownership in each province, we can find that the ranking of vehicle ownership among the provinces is not exactly the same as the ranking of fuel demand. This can be explained by the different structure of vehicle stock in each province. Take Henan Province as an example: Henan has a lower vehicle ownership than Jiangsu and Shandong, but it has a larger number of trucks than the other two provinces. The higher fuel consumption rate of trucks increases the demand for automobile fuel in Henan Province (Figure 6). (3) Examining the percentage of gasoline and diesel demand in different provinces (Figure 7), we can come to the conclusion that more-developed regions usually have a higher demand for gasoline, while diesel often accounts for a higher proportion in less-developed regions. In economically underdeveloped regions like Tibet, Ningxia, and Xinjiang, where industry has a greater role in driving regional economic development, residents have lower demand for passenger cars because of their lower incomes. Thus, there are more trucks usually fueled by diesel in these regions. While in those relatively developed provinces, such as Zhejiang, Beijing, and Guangdong, the regional economy is more driven by the service industry. Therefore, the demand for passenger vehicles—especially cars—is much higher and the demand for gasoline is greater in these regions.
Table 5. Provincial projections of fuel consumption structure in 2035.
Figure 6. Provincial projections of fuel consumption in 2035.
Figure 7. Provincial projections of gasoline and diesel consumption in 2035.
We compare the results of this paper with other research results, as shown in Table 6. The listed studies have predicted the future vehicle ownership and fuel consumption in China. By comparing the results, we can see that our forecast results are at the middle level. In particular, compared with the study by Wu et al. [12], which also used the Gompertz model to predict the number of vehicle ownership, the prediction result of this paper is higher than theirs, which may be due to fact that Wu et al. [12] set the saturation level of vehicle ownership rate for China directly in their study, while we set the saturation level of vehicle ownership rate in each province separately. In comparison with the study by Peng et al. [16], which also established a bottom-up model and forecast the vehicle ownership provincially, our prediction results are slightly higher. There could be two reasons: Firstly, in the setting of the saturation level of the vehicle ownership rate, Peng et al. [16] referred to the saturation level of France, and set the saturation level of the provinces unlimited to the purchase restriction policies to 376 vehicles per thousand people, while the limited provinces were uniformly set to 250 vehicles per thousand people. In our study, we comprehensively considered the provincial differences in economic status, population distribution, regional structure, and restriction policies, and then reasonably measured the saturation level of the vehicle ownership rate in each province. Secondly, Peng et al. [16] set the fuel consumption rate and the annual miles traveled by different vehicle types of each province separately when establishing the bottom-up model. The refinement of these indicators placed more emphasis on the influence of other factors, such as technological progress on fuel demand, thus leading to a lower forecast result.
Table 6. Comparisons of projections of the fuel demand in China.

4.3. Impact of Fossil Fuel Vehicle Exit on the Oil Demand

So far, we have not taken into account the substitution effects of NEVs, and we are going to consider that in this part. According to the statistics of the Ministry of Public Security, there were 1.53 million NEVs at the end of 2017, accounting for only 0.7% of the total number of vehicles.
However, with the continuous advancement of NEV technology, the percentage of NEVs represented by electric vehicles will continue growing before the exit timeline of fossil fuel vehicles is officially launched in China, thus making the total fuel demand lower than we predicted before [10].
Regarding the prediction of the percentage of NEVs, domestic and foreign researchers have not reached an agreement. Bloomberg [27] and ExxonMobil [28] predicted the proportion of NEVs worldwide in 2040, and their predictions were similar with 33% and 35%, respectively. As for the proportion of China’s NEVs, MIIT [29] proposed the goal that NEVs should make up 10% of all the automobiles in China by 2020. What is more, according to the International Energy Agency [30], China’s NEVs will account for 25% of total vehicles by 2035.
Based on the research above, this paper calculates provincial fuel demand of Chinese vehicles in 2035, considering the substitution of NEVs. The substitution speeds in different provinces may vary because of their different policy restrictions and state of supporting facilities. Taking these provincial differences into account, we made a hierarchical cluster analysis and divided the 31 provinces of China into three groups. In our study, four indicators were selected to reflect provincial differences in the two aspects we mentioned above (Table 7). For the hierarchical cluster analysis, the method of Ward [31] was selected because it outperforms other hierarchical cluster methods when outliers are absent. Some researches on regional cluster analysis also demonstrate that Ward’s method gives the best interpretative solution [32,33]. To eliminate the effects of different scales, we standardized the four variables when making the cluster analysis. The dendrogram shows that the 31 provinces can be grouped into three clusters. Related information of the three groups is summarized in Table 8. It shows the mean values of the indicators in each cluster. It does not take much to see that clusters 1 and 2 are more densely populated, more urbanized, and more economically developed provinces, which means the local government is more capable of providing supporting facilities of NEVs, thus promoting the growth of NEVs. Compared with cluster 2, cluster 1 includes regions with much more dense population, with an average projected population density of 1206.4 people per square kilometer in 2035, which is two times more than that of cluster 2. More dense population will surely boost the growth of NEVs.
Table 7. Indicators for cluster analysis.
Table 8. Summary of clusters.
Therefore, in our study, we assume three different substitution speeds for the three clusters. The percentage of NEVs in 2035 will account for 25%, 15%. and 5% for clusters 1, 2, and 3, respectively. The results are shown in Table 9. Under the substitution scenario, China’s automobile fuel demand in 2035 will be 652.58 Mt. The fuel demand for clusters 1, 2, and 3 will be 132.13, 183.10, and 337.35 respectively. Besides, it is also shown in Table 9 that the average fuel demand for each province in cluster 2 is much higher than two other clusters, which points out a feasible direction for future fuel demand control.
Table 9. Fuel demand with different substitution speeds.
Compared to that without substitution, the fuel demand in China in 2035 can be reduced by 94.11 Mt, which is equivalent to 26.3% of China’s net oil imports in 2016. This proportion will further expand as the speed of fuel vehicle exit increases. Therefore, the exit of fossil fuel vehicles will greatly reduce China’s foreign oil dependency and thus ensure China’s energy security.

5. Robustness Analysis of Different Substitution Speeds

We calculated automobile fuel demand in 2035 under three scenarios with slow, medium, and fast substitution speeds. Assuming that under the three scenarios, the proportion of NEVs for provinces in Cluster 1, 2, and 3 in 2035 is (25%, 15%, 5%), (30%, 20%, 10%), (35%, 25%, 15%), respectively. The results are shown in Table 10 and Figure 8. Under the three scenarios, China’s automobile fuel demand in 2035 will be 653, 615, and 576 million tons, respectively. Compared go the case without considering replacement, the total amount of gasoline and diesel can be reduced by 94, 132, and 169 million tons, respectively, which is equivalent to 118, 165, and 211 million tons of crude oil assuming 80% of the refined oil extraction ratio. The amount is about 32.9%, 46.1%, and 59.0% of China’s net crude oil imports in 2016, respectively. The robustness analysis shows that China’s fuel demand will decrease more under faster NEV substitution speeds, which is likely to happen when government implement more favorable policies for NEVs and stricter policies for fossil fuel vehicles.
Table 10. Fuel vehicles and fuel demand under different substitution scenarios.
Figure 8. Fuel demand under different substitution scenarios (hundred million tons).

6. Conclusions

Vehicle ownership is one of the most important factors in determining fuel demand. As China’s vehicle ownership is still in a period of rapid growth and has not reached saturation, detailed and appropriate forecast of China’s vehicle ownership is necessary for the accurate prediction of oil demand in China. Our analysis shows that the relationship between the vehicle ownership rate and real GDP per capita in China conforms to the S-shape trend. Currently, most provinces are at a stage of accelerated growth. According to our results, there are gaps between the saturation levels of vehicle ownership rate among provinces, but they are acceptable compared to the time difference among provinces to reach the inflexion points. In 2035, the predicted vehicle ownership rate of each province will also be quite different, among which the top three highest vehicle ownership rates will be 654, 621, and 612 vehicles per thousand in Jiangsu, Chongqing, and Zhejiang, respectively. Besides, the total vehicle ownership of China will reach 667 million in 2035. And the top three provinces with the most vehicle ownership will be Guangdong, Shandong, and Jiangsu, with 78.26, 59.23, and 51.84 million vehicles, respectively. Without considering the impact of NEVs substitution, the total fuel demand of China’s automobiles is expected to be 746.69 Mt in 2035. Guangdong, Henan, and Shandong will be the three provinces with the most demand for automobile fuel, which will be 76.76, 64.91, and 63.95 Mt respectively. Taking the substitution effects of NEVs into consideration, China’s automobile fuel demand in 2035 will be 652.58 Mt, and the amount replaced by NEVs will be 94.11 Mt, which is equivalent to 26.3% of China’s net oil imports in 2016.
The study contributes to the literature by using a detailed bottom-up prediction model with consideration of provincial heterogeneity in China, which helps generate more accurate forecast results. Different from previous studies which assume homogenous saturation levels of each province, we take into account the provincial differences and relate the growth pattern with provincial population density, urbanization rate, and economic development. For a country like China with vast regional disparity, this analysis can help policy makers formulate and implement more targeted and effective policies. Furthermore, the method can be applied to other countries or regions with dramatic heterogeneity.
The paper also has important policy implications. It can be inferred from our prediction results that the amount of oil saved by fossil fuel vehicle exit is huge. According to the forecast of IEA [30], China’s net crude oil imports will reach the peak in 2040, with the net import of 13 million barrels, about 678 Mt per day, which is equivalent to 542 Mt of refined oil, assuming 80% of the extraction ratio. (The refined oil is produced by an industrial process plant where crude oil is transformed and refined into more useful products such as gasoline, kerosene, diesel, and other alternative fuels, such as ethanol gasoline and biodiesel, that meet the national product quality standards and have the same use, according to Article 4 of the Refined Oil Measures (No. 23, 2006, Ministry of Commerce of the People’s Republic of China.)) Therefore, the exit of fossil fuel vehicles will greatly reduce China’s foreign oil dependency, thus ensuring China’s energy security.
It should be pointed out that we assume the future fuel economy in China will improve at the average rate between 2004 and 2014 in our study, which makes it possible that accelerated technological progress may result in a lower actual fuel demand than our forecast. In addition, this paper does not discuss the possible future changes in people’s vehicle purchase behavior. If great progress is made in the technology, price, and supporting facilities of NEVs, or if new restrictive policies of fossil fuel vehicles are introduced, such as car purchase restriction and subsidies for NEVs, the proportion of NEVs will not be negligible any more, and the growth of automobile fuel demand in the future will also be lower than our forecast results.
Based on our conclusions above, we propose the following two suggestions:
Firstly, according to the forecast results, China’s automobile fuel demand will continue growing at an accelerated speed in the future if there is no control, thus exacerbating China’s environmental problems and raising its dependency on foreign oil. In order to overcome such a situation, relevant policies can be introduced to address the petroleum safety problems that may arise from the excessive growth of vehicle ownership. Such policies may proceed from the perspective of promoting the adjustment of automobile stock and fuel structure, and the improvement of fuel economy.
Secondly, corresponding policies should be developed considering the provincial differences. As it has been demonstrated above, Guangdong, Henan, Shandong, and some other provinces will be the main driving forces for China’s automobile fuel demand growth in the future. These provinces are usually regions with rapid economic growth and large population base. Therefore, more focus ought to be put on these regions to effectively alleviate the rapid growth of automobile fuel demand in China.

Author Contributions

Conceptualization, L.H. and Z.F.; methodology, Z.F. and T.C.; formal analysis, Z.F. and T.C.; data curation, T.C.; writing—original draft preparation, Z.F.; writing—review and editing, C.X.; supervision, K.X.; project administration, K.X.; funding acquisition, K.X.

Funding

This research was funded by the State Grid Science and Technology Research Project (Grant number SGFJJY00GHJS1900003).

Conflicts of Interest

The authors declare no conflict of interest.

References

  1. BP (British Petroleum Public Limited Company). BP Statistical Review of World Energy; BP: London, UK, 2017. [Google Scholar]
  2. National Bureau of Statistics of China. China Statistical Yearbook (2017); China Statistics Press: Beijing, China, 2017.
  3. Shen, L.; Xue, J.J. Development path choice and strategy framework of China’s energy security. China Popul. Resour. Environ. 2011, 21, 49–54. [Google Scholar]
  4. National Bureau of Statistics of China. China Statistical Yearbook (2016); China Statistics Press: Beijing, China, 2016.
  5. Reuters. China Studying When to Ban Sales of Traditional Fuel Cars: Xinhua. 2017. Available online: https://www.reuters.com/article/us-china-autos/china-studying-when-to-ban-sales-of-traditional-fuel-cars-xinhua-idUSKCN1BL01U (accessed on 27 March 2019).
  6. Zhao, C.; Liu, G.Y.; Chen, B. Advances in theories and methods of energy forecasting and early warning. Acta Ecol. Sin. 2015, 35, 2399–2413. [Google Scholar]
  7. Johansson, O.; Schipper, L. Measuring the long-run fuel demand of cars: Separate estimations of vehicle stock, mean fuel intensity, and mean annual driving distance. J. Transp. Econ. Policy 1997, 31, 277–292. [Google Scholar]
  8. Palencia, J.C.; Otsuka, Y.; Araki, M.; Shiga, S. Scenario analysis of lightweight and electric-drive vehicle market penetration in the long-term and impact on the light-duty vehicle fleet. Appl. Energy 2017, 204, 1444–1462. [Google Scholar] [CrossRef]
  9. He, K.; Huo, H.; Zhang, Q.; He, D.; An, F.; Wang, M.; Walsh, M.P. Oil consumption and CO2 emissions in China’s road transport: Current status, future trends, and policy implications. Energy Policy 2005, 33, 1499–1507. [Google Scholar] [CrossRef]
  10. Zhang, Q.; Tian, W.; Zheng, Y.; Zhang, L. Fuel consumption from vehicles of China until 2030 in energy scenarios. Energy Policy 2010, 39, 6860–6867. [Google Scholar] [CrossRef]
  11. Wang, H.; Ou, X.; Zhang, X. Mode, technology, energy consumption, and resulting CO2 emissions in China’s transport sector up to 2050. Energy Policy 2017, 109, 719–733. [Google Scholar] [CrossRef]
  12. Wu, T.; Zhao, H.; Ou, X. Vehicle ownership analysis based on GDP per Capita in China: 1963–2050. Energies 2014, 7, 4877–4899. [Google Scholar] [CrossRef]
  13. Dargay, J.; Gately, D. Vehicle ownership to 2015: Implications for energy use and emissions. Energy Policy 1997, 25, 1121–1127. [Google Scholar] [CrossRef]
  14. Cherif, R.; Hasanov, F.; Pande, A. Riding the energy transition: Oil beyond 2040. Available online: https://www.imf.org/en/Publications/WP/Issues/2017/05/22/Riding-the-Energy-Transition-Oil-Beyond-2040-44932 (accessed on 19 July 2019).
  15. Qi, F.F. Forecasting Research on the Consumption Demand of Civilian Vehicle in China based on Panel Data Model; University of Science and Technology of China: Hefei, China, 2010. [Google Scholar]
  16. Peng, T.; Ou, X.; Yuan, Z.; Yan, X.; Zhang, X. Development and application of China provincial road transport energy demand and GHG emissions analysis model. Appl. Energy 2018, 222, 313–328. [Google Scholar] [CrossRef]
  17. Muraleedharakurup, G.; Mcgordon, A.; Poxon, J.; Jennings, P. Building a better business case: The use of non-linear growth models for predicting the market for hybrid vehicles in the UK. Ecol. Veh. Renew. Energies 2010. Available online: https://www.researchgate.net/publication/228998926 (accessed on 25 March 2019).
  18. Huo, H.; Wang, M.; Johnson, L.; He, D. Projection of Chinese motor vehicle growth, oil demand, and CO2 emissions through 2050. Transp. Res Record J. Transp. Res. Board 2007, 2038, 69–77. [Google Scholar] [CrossRef]
  19. Huo, H.; Zhang, Q.; He, K.; Yao, Z.; Wang, M. Vehicle-use intensity in China: Current status and future trend. Energy Policy 2007, 43, 6–16. [Google Scholar] [CrossRef]
  20. Gately, D.; Dargay, J. Incomes effect on car and vehicle ownership. Transp. Res. Part A Policy Pract. 1999, 33, 101–138. [Google Scholar]
  21. Gu, J.B.; Qi, F.F.; Wu, J.L. Forecasting on China’s civil automobile-owned based on Gompertz Model. Technol. Econ. 2010, 29, 57–62. [Google Scholar]
  22. Dargay, J.; Gately, D.; Sommer, M. Vehicle ownership and income growth, worldwide: 1960–2030. Energy J. 2007, 28, 143–170. [Google Scholar] [CrossRef]
  23. Auffhammer, M.; Wolfram, C.D. Powering up China: Income distributions and residential electricity consumption. Am. Econ. Rev. 2014, 104, 575–580. [Google Scholar] [CrossRef]
  24. Zhang, Q.; Zhao, S.C. Factors influencing private vehicle ownership in China. Transp. Res. 2016, 2, 1–5. [Google Scholar]
  25. CATARC (China Automotive Technology & Research Center). Annual Report on Automotive Energy-Saving in China (2015); Posts & Telecom Press: Beijing, China, 2015; pp. 15–19. [Google Scholar]
  26. Huo, H.; Wang, M. Modeling future vehicle sales and stock in China. Energy Policy 2012, 43, 17–29. [Google Scholar] [CrossRef]
  27. Bloomberg Forecasts EVs to be One Third of Global Vehicle Ownership by 2040. Available online: http://finance.sina.com.cn/roll/2017-07-10/doc-ifyhweua4640386.shtml (accessed on 21 March 2019).
  28. ExxonMobil. The Outlook for Energy: A View to 2040; ExxonMobil: Irving, TX, USA, 2016. [Google Scholar]
  29. Minister of MIIT: China’s New Energy Automobiles Are Expected to Account for 10% of the Total. Available online: http://www.itdcw.com/news/focus/0313Y5132018.html (accessed on 6 April 2019).
  30. IEA (International Energy Agency). Oil Market Report 2017; IEA: Paris, France, 2017. [Google Scholar]
  31. Ward, J.H. Hierarchical grouping to optimize an objective function. J. Am. Stat. Assoc. 1963, 58, 236–244. [Google Scholar] [CrossRef]
  32. Del Campo, C.; Monteiro, C.M.; Soares, J.O. The European regional policy and the socio-economic diversity of European regions: A multivariate analysis. Eur. J. Oper. Res. 2008, 187, 600–612. [Google Scholar] [CrossRef]
  33. Yuan, Y.; Cai, W.J.; Can, W.; Wang, S.Q. Regional allocation of CO2 intensity reduction targets based on cluster analysis. Adv. Clim. Chang. Res. 2012, 3, 220–228. [Google Scholar] [CrossRef]

Article Metrics

Citations

Article Access Statistics

Multiple requests from the same IP address are counted as one view.