Article

Public Awareness and Consumer Acceptance of Smart Meters among Polish Social Media Users

by
Yash Chawla
and
Anna Kowalska-Pyzalska
*
Department of Operations Research, Faculty of Computer Science and Management, Wroclaw University of Science and Technology, Wyb. Wyspianskiego 27, 50-370 Wroclaw, Poland
*
Author to whom correspondence should be addressed.
Energies 2019, 12(14), 2759; https://doi.org/10.3390/en12142759
Submission received: 17 May 2019 / Revised: 24 June 2019 / Accepted: 9 July 2019 / Published: 18 July 2019
(This article belongs to the Section A: Sustainable Energy)

Abstract

:
Both people and things are becoming smarter by the day. Industrial evolution at the peak of the 4.0 phase and indications of 5.0 phase are fascinating. In these circumstances, fulfilling the demand for energy is a challenge faced by countries all over the world. Upgrading the current energy distribution systems with smart grids and smart meters are steps towards facing this challenge, especially for Poland, which is primarily relying on conventional sources of energy. For any innovation or new technology, creating public awareness and consumer acceptance enhances the chance for a fruitful deployment. To achieve this, various communication channels are adopted and social media is found to be one of the most effective tools for it. This study discusses the awareness level and consumer acceptance of social media users in Poland. The source through which they receive information regarding electricity in general and smart meters (SM) in particular and their preferences and willingness about the installation of SM under various conditions are discussed in detail. Findings show that there is low level of public awareness among the respondents which causes them to develop myths, fears and doubts about SM installation in their households. More effort is required from the government as well as from the energy companies in order to increase the public awareness which will result in an increase in consumer acceptance. Based on the results, the article also contains recommendations that can be used by governments as well as energy companies to create a positive feeling about SM to affect consumer behavior.

1. Introduction

Energy markets are experiencing significant changes at various levels due to ecological, economic and technical challenges. Among them, the enrollment of smart meters, in many countries all over the world, opens new possibilities, not only to the energy suppliers, but also for the consumers. Energy smart meters (SM) are advanced electricity meters which can offer a range of intelligent functions and have intended benefits for energy consumers, suppliers and networks [1]. Consumers can benefit from smart meters because they provide more accurate bills, allow easier switching, enable clearer energy use through an in-home display, smart metering information systems, and have some potential for the reduction of utility costs based on reduced consumption. Smart meters would make it easier for the networks to balance the grid, as they could facilitate a smarter grid with real-time information of supply and usage. The suppliers also stand to be benefited by it, as it could reduce the customer service overhears through more accurate billing and avoiding site visits (for example to take meter readings) [1,2,3].
The Electricity Directive 2009/72/EC requires the EU Member States to roll out intelligent electricity smart meters to 80% of consumers by 2020. One of the main goals of this enrollment is to enable active participation of consumers in the electricity supply market. The implementation of those metering systems may be subject to cost-benefit analysis. The example of British cost-benefit analysis from 2016 suggests that the majority of the total benefits connected with SM enrollment would come from supplier cost savings (49% of all total benefits) and energy savings (32% of total benefits). Benefits will also be achieved in terms of carbon savings and air quality benefits (8%), peak load shifting (6%), and network-related benefits (5%) [1].
Poland, which is one of the largest countries in Europe, has prolonged the national enrollment of SM until the year 2026. So far, no more than 10% are equipped with the meters. In Poland, just as in many other countries, the obligation to roll-out smart meters is supplier-led. Due to this, the planning and execution is carried out by the energy suppliers, as per their will, in a way that best suits their business and based on the needs of their customers. They are only required to achieve the overarching obligation to complete the roll-out by the end of 2026. The cost of installation (which is assumed to be around 80–160 USD per SM unit) is or will be inevitably transferred on the customers, who pay for it in their electricity bills.
Although the concept of SM enrollment is fine, there are many doubts as to whether these new technologies and behavioral changes introduced by them will be widely adopted by the consumers in time to achieve the ambitious aims and targets. On the one hand, in Roger’s theory of innovation diffusion, the vital role of communication channels through social systems, such as word of mouth or recently also social media, in dissemination of information on innovations is emphasized [4]. On the other hand, according to the social capital theory, interpersonal communication is a significant way of attaining resources such as information on energy efficiency innovations for accomplishing certain objectives [5], which is also facilitated by social media. Communication channels have a huge role to play in shaping the message. Users on social media are exposed to content which is more personalized for them and more likely to be from people they have in the network. Studies have indicated that this has a great effect on the choices made by the users, their purchase intention, as well as their acceptance about new items [6].
There have already been several studies about the social acceptance and awareness of SM conducted by means of various tools (quantitative and qualitative methods; simulations; conceptual studies), paying attention to various aspects of this issue, such as: consumers’ expectations and perceptions about SM [7,8], consumers’ acceptance and engagement [9], effect of feedback by means of SM and smart metering information systems (SMP) on energy consumption [10,11,12,13,14,15,16,17], willingness to pay for SM [18], efficiency of education and training in SM and SMP adoption [19], or incentives and barriers of SM diffusion [19,20,21]. However, to the best of authors’ knowledge, the awareness and acceptance of SM among social media users have not yet been explored. Within our study, we seek to fill this gap. In our study, we assume that consumers, who possess common access to new, smart technologies, will have a higher acceptance level towards smart meters and will see more advantages to use them.
The general aim of this paper is to investigate the acceptance level of smart meters among social media users. In particular, the socio-economic factors, possession and usage of various smart devices, knowledge and preferences regarding SM, are assumed to be potential predictors of consumers’ acceptance of SM and their willingness to install it. We have formulated the following objectives of the study: (1) to explore the source of information social media users have regarding electricity in general and smart meters in particular, (2) to analyze the consumers’ preferences and fears regarding installation of SM at their household, and finally, (3) to investigate the willingness to install SM under various conditions (e.g., financial, regulative ones).
Although social acceptance towards SM has already been broadly investigated, we still see a gap in the literature. Namely, we believe that, presently, customers become “smart”, because of the access to various smart solutions in different markets. It is also true for the energy market. At the same time, smart customers are often present in social media, such as Facebook, Twitter or LinkedIn and are more aware regarding current and future technology trends. Hence, based on the literature review, we predict that social media users, who are usually in favor of new technologies, will be more aware and interested towards smart meters and especially SMP. They already have experience with modern communication technologies, such as mobile apps and internet web pages which are a communication channel between the smart meter and a user. We also believe that social media users can spread information about the innovation via their social network. However, at the same time, the literature shows the generally low interest levels among consumers towards issues connected with electricity and the energy market. By means of our survey, we seek to explore the awareness and acceptance level of SM among social media users and to verify our expectations. To the best of our knowledge, the awareness and acceptance of SM among social media users have not been checked yet. Therefore, within our study, we want to fill this gap in.
The structure of the article is as follows: First, in Section 2 we discuss the Polish power system, followed by the public awareness of smart technologies in the energy market in Section 3. In particular, we focus on the awareness and acceptance of market novelties among social media users. In Section 4 we present the methods used and the theoretical background of the study. Next, Section 5 describes the empirical setup of the survey, a statistical analysis of the results and discusses the main findings. Finally, in Section 6, conclusions together with some market and policy implications are provided.

2. The Challenges of the Polish Power System

Poland is currently facing a steep challenge related to infrastructure, economics and politics in the energy sector. One of the most severe problems is that over 80% dependence on fossil fuel-based energy generation (hard coal and lignite). The upward trend in energy consumption, weak transformation network, and limited generation capacity due to decommissioning of old generation units, fail to aid in this problem. To overcome this, the Polish energy sector needs to be revamped with increased efficiency of generation and transmission, while fulfilling its obligation to increase the share of RES in the total energy production (which was approx. 8% only in 2014) as well as limiting the CO 2 consumption due to the Climate Policy Agreements [22,23,24,25,26].
Polish people are in favor of an energy policy which develops RES in Poland. According to a survey conducted in 2014, a staggering 95% of Poles are in agreement with this and 78% wish to produce their own energy if it were possible [27]. The results of another study, conducted to understand the preferences of Poles regarding investment in RES, its knowledge, legal regulations and willingness to adopt it, showed that 50% of Poles were not interested in RES primarily because of the inability to install the panel (e.g., respondents who were living in a flat or renting a house). 21% of the respondents showed readiness to invest in PV panels if the period to get return on investment would not be longer than five years [28]. This suggests that it would take a while for the Polish energy sector to move from conventional sources of energy to RES, even though there is high consent among the citizens towards implementation. There is a need to explore other remedies, which could be viable and effective in terms of time as well as the cost.
Several proposals for remedies have been enlisted in the Polish Energy Policy 2050 (PEP 2050). Smart grids is one of the prominent elucidations listed among these remedies. There are several benefits of introducing smart grids and smart meter systems, while updating the current transmission and distribution systems or while constructing new ones [25]. Potential benefits of smart grids involves increased security and reduction in cost of exploitation through optimization of grid management and amplified potential of demand side management/demand response tools (DSM/DR) through the real time price signals and improved communication between the end-users and energy suppliers [25]. Concrete steps are already being taken towards upgrading the energy distribution system and establishing smart grids. In October 2017, the Polish energy distribution system operator Energa announced the signing of a deal with the Ministry of Energy to jointly fund the implementation of the smart grid program. This project to modernize the energy network was estimated to cost 65.2 million dollars, out of which the energy ministry had agreed to provide up to 45.1 million dollars in sources from the Operational Program Infrastructure and Environment (OPI&E) [29]. These are positive signs, but a question arises here on the readiness of the consumers to cope and accept these forthcoming changes. Previous studies, conducted for general users, show that there is a lack of awareness among the users regarding smart metering and smart grids. One of the reasons for this could be that the effectiveness of educational campaigns may not be percolating to enough users [19,30]. These studies however do not examine the communication channels through which the users receive their information, hence it would be interesting to examine the awareness level of people preferring communication channels, such as social media, which have been found to have higher diffusion effects. The lack of public awareness might also be due to the fact that the Polish government currently does not have any national roll-out plan for the smart-meters to all customers by 2020 [31].

3. Public Awareness of Smart Meters (SM)–Literature Review

3.1. Smart Grids, Smart Metering Systems, Smart Devices

Presently, many products and services, as well as, concepts and ideas, must be “smart” to catch consumers’ attention. It is also true in the energy market. The word “smart” means intelligent, user friendly, and that the product or service can be used automatically and remotely without the customers’ presence.
In the case of energy markets, a general concept of smart grids (SG) has been developed and implemented in various parts of the electricity network. This concept is based on the broad usage of modern communication technologies to exchange information between market participants, such as energy generators, energy suppliers and sellers, market operators, and end-users. It aims to increase the energy efficiency in production, transmission and consumption [2,9,10,30,32].
According to the experts, the transition of the power system into smart grids cannot be achieved without exchange of electricity meters at the customers’ level from traditional (analog) ones to smart meters [12,32]. One of the biggest advantages of SM is the access to the current data about electricity consumption for both sides: energy suppliers and customers. Consumers receive access mostly by means of smart metering information systems, which include internet platforms and mobile apps, and are often combined with other smart appliances, such as in-home displays, home area networks or smart plugs [7,10]. Various studies show that this access helps make informed decisions about electricity consumption, thus resulting in an average energy saving of between 2 to 4% [33,34]. Less energy consumption also results in fewer CO 2 emissions, which is highly desirable. The access to data about electricity consumption also enables the customers to learn about different electricity tariffs offered, depending on the time and the spot electricity price [1,12,35], hence this could result in the reduction of electricity bills [36]. SM also have a potential to facilitate the growth in use of new products and services such as smart appliances and home batteries. These can be operated remotely or automatically in response to energy tariff price information [1]. Consumers could become active in the network by providing energy or demand side response services to balance the grid by using such appliances. SM would also make it easier for the consumers to change between suppliers, creating a more competitive market with lower tariffs [37].
Suppliers would also be benefiting from the installations of smart meters. More accurate data should reduce inquiries and customer service overheads, reduce debt management needs and also site visits for collecting meter readings. Suppliers would also be able to remotely monitor the customers for actions switching to pre-payment meters, disconnecting customers and so on, though the customers will still have the existing protections which are in place. In a competitive market, the suppliers may transfer some margins of cost saving to the customer as well [1].
To have an increase in efficient energy consumption, companies and policy makers need to pitch in and do their part. This would not be possible without the acceptance, engagement and effort of the end users, i.e., the consumer. Their acceptance of SG products and services would be indispensable to successfully build SG, as mentioned by Ellabban and Abu-Rub [9]. Raising the cognizance of the consumers and actively involving them in the energy market is one of the major challenges that needs to be addressed, increasing the popularity of SG concept and broader possibility of implementing DSM/DR tools [9,38,39].

3.2. The Role of Social Media in Diffusion of Innovation

The first part of the 21st century has seen a rapid shift in information dissemination mediums, from conventional one-way communication methods such as newspaper, television, radio, etc. to two-way or multi-way communication methods such as social media [40,41]. Driven by innovation, the impact of information technology has influenced all walks of life, directly or indirectly [42]. One of the key factors that has facilitated this growth has been the ease, pace and cost efficient methods of reaching out to consumers through digital means, especially through social media. Studies show that, around the globe, social media campaigns have been deployed for sales, marketing, branding, political gain, social causes, etc. [43,44]. Businesses, as well as researchers, take to social media to seek out an understanding of the reactions, opinions or attitude of people towards new products, technologies, policies or any changes that might be forthcoming [45,46]. User sentiments, activity patterns, choices, interests, network connections, preferences etc., all play a major part in this process [47].
Prior to the launch of new technologies/products in the market that would bring about changes, users are primed for adopting them through stimulated dissemination of informative content. This dissemination is carried out through official social media handles and/or, now more so, through influencers with a larger number of followers on social media. The latter has proven to be more effective [48]. Further amplification of this takes place through propagation of word of mouth, via user activities, reaching out to an avalanche of audiences [49]. This indicates the vital role played by social media towards spreading public awareness of new technologies. There have been several studies which illustrate this important role of social media in energy as well as other sectors. To increase public awareness of the prominence of monitoring photovoltaic (PV) systems in the Netherlands, a social media campaign was organized, which proved to be highly useful [50]. Social media was found to be effective for strengthening public awareness about wildlife conservation [51]. Social media has been used extensively by emergency managers, particularly to warn people and help in the co-ordination of response and recovery, as well as for disaster and risk reduction [52]. It has also been used for enhancing public access to relevant medical information [53], exploring and enhancing public awareness regarding CO 2 emissions and climate change [54], marketing, spreading messages, engaging and raising public awareness towards culture [55], raising awareness among all stake holders in higher education regarding green infrastructure and green finance in the school/college curriculum [56], and stimulating public awareness about space exploration and human space flight [57]. For the energy sector, the potential role of online social networks in disseminating energy-related information is imperative, deserves greater attention, and will involve enhanced roles for both organizations and opinion leaders [58].
Literature supports the fact that, users who are active on digital platforms have far more information on current and upcoming trends as compared to users who prefer to remain offline [59]. Industry 4.0, the digital revolution, is inching towards the peak and dawn of industry 5.0 and is nearing reality, which calls for technologies to be more personalized for each user [60]. In such circumstances, social media is preordained to play a more influential role for public awareness and outreach.

3.3. Public Awareness and Acceptance
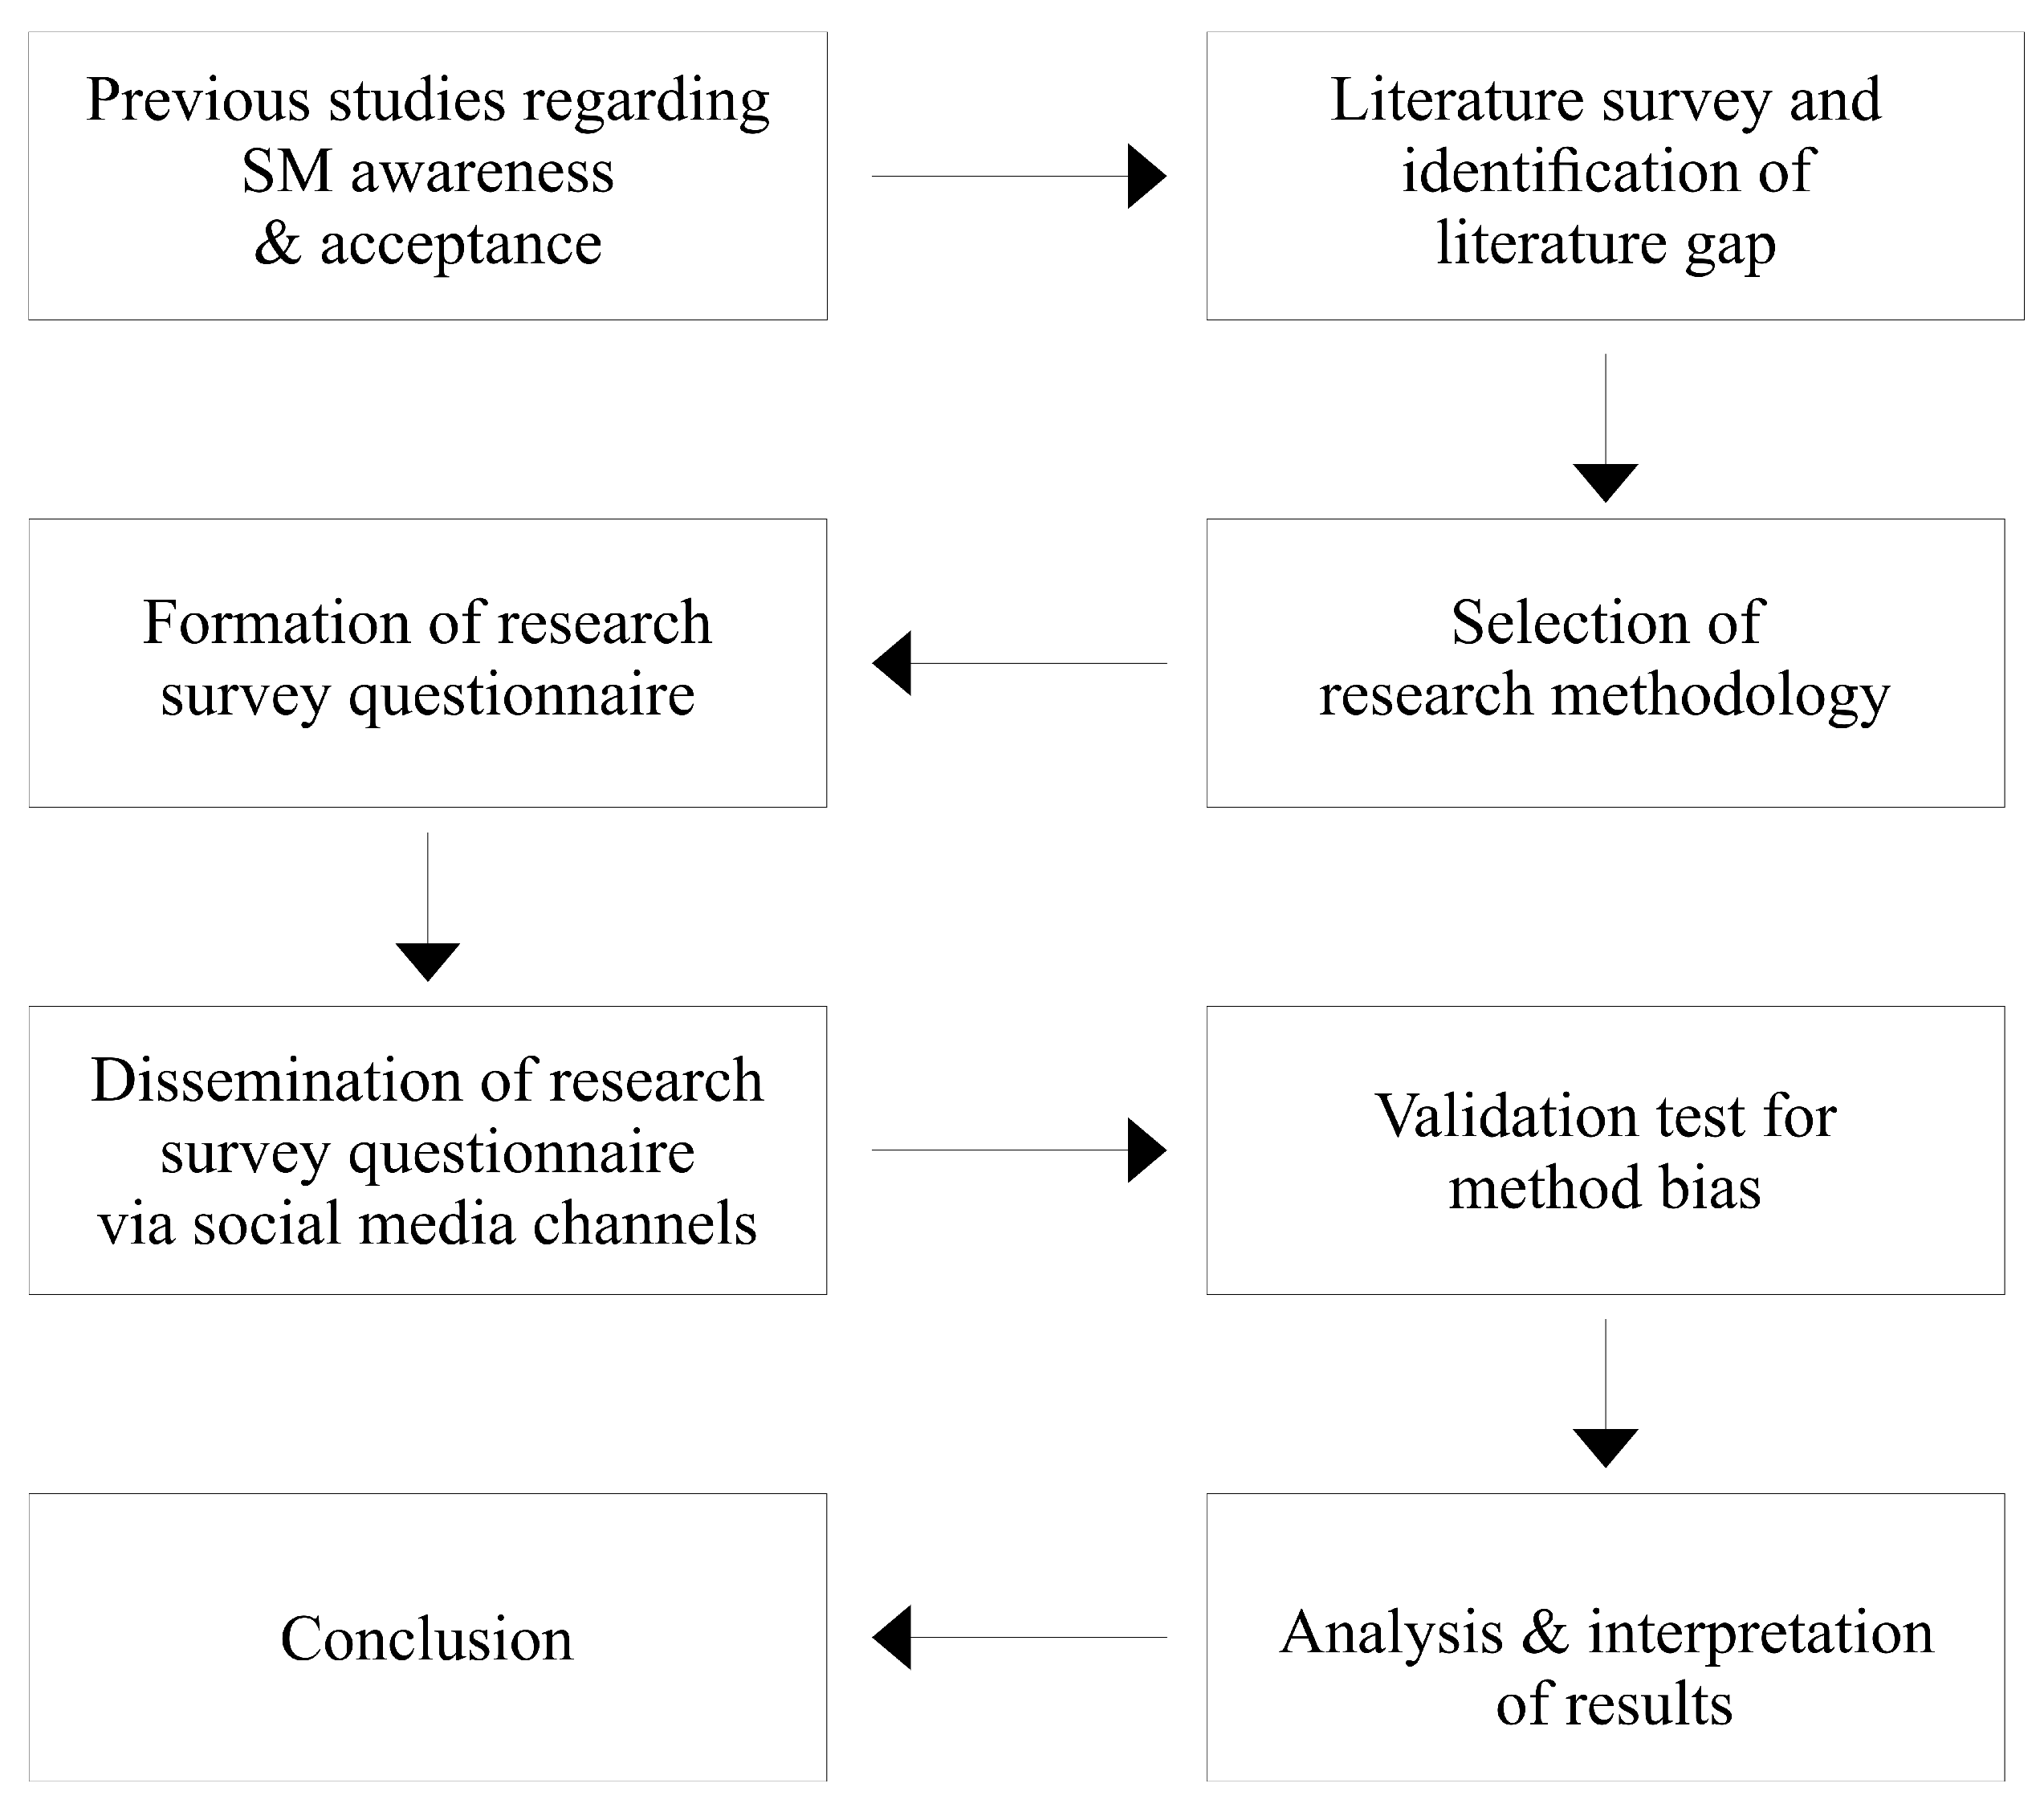
Smooth diffusion of any innovation in the market depends mostly on social acceptance [61]. Social acceptance is categorized in various levels, each with its own perspective. Wuestenhagen et al. have given a categorization of social acceptance, which distinguishes three, occasionally symbiotic, categories: socio-political acceptance—this is concerned with the acceptance of technologies and policies by the people, key stake holders and policy makers; community acceptance: this concerns the acceptance of procedures by law and trust building; and market acceptance—this concerns the acceptance by the consumers, investors, and intra-firms [62,63].
Socio-political acceptance creates a platform of (un-)favorable conditions for the other two types of acceptance [63]. Support for the smart-meters at the socio-political level would make spreading awareness easier or educating the community and market regarding it. In this article, the awareness and acceptance of the consumer component of market acceptance is being discussed. Studies indicate that there is limited awareness, knowledge and interest regarding SM among consumers and customers have shown concerns regarding the acceptance of the same [7,21,64]. Customer concerns regarding SM include privacy & security of data, network connections in remote areas with lower or no mobile coverage, installation visits & doorstep selling, effects on health, disconnection of meters on a prepayment basis, and the option to switch between suppliers and keep the ‘smart functionality’ [1,10,20].
Presently, the majority of customers remain passive in the energy market. They do not use all the possibilities given to them by the current market designs and regulations. The new smart grid (SG) approach provides consumers with more involvement opportunities [9,32]. For example, consumers may get access to their current data about energy consumption by means of SM and SMP. They may also engage in energy generation by installing solar photovoltaic, micro water or wind turbines in their households. Finally, they may participate in the energy market by means of DSM/DR tools and approval to adjust their energy usage to the current needs of the electricity balancing system and real-time electricity prices.
Even though SM could be seen as a step towards consumers gaining more access and control to their energy consumption [19,30], many studies indicate a low level of knowledge, awareness and engagement towards new solutions available in the energy markets [9,32,38,65]. In particular, many studies have shown a relatively low level of consumers’ knowledge and interest about smart metering [64]. Most consumers are not even familiar with the terms “smart grid” and “smart metering”. However, at the same time, they declare the willingness to save energy while being informed about electricity prices and ways of consumption reduction [8,9]. It was also found that only those consumers who were already interested or involved in energy savings were willing to use SM combined with some feedback devices, such as SMP, and learn from them [66]. Even if consumers have the initial interest in SMP, it is uncertain whether such engagement will persist over a longer period of time [14,30,67].
Among various behavioral obstacles of SM acceptance, the following have been mostly mentioned in the literature: bounded rationality of consumers; confusion of choice (lack of professional advice); negative perceptions, mainly because of a lack of knowledge and understanding; negative word of mouth (spreading negative information among social networks); disbelief in climate change; discomfort of usage; privacy and security concerns, among others [9,20,21,68].
The studies and various pilot programs have shown that, to increase social acceptance and awareness levels among electricity consumers, and enable the smooth diffusion of SM in the energy market, energy companies must pay attention to: simplicity of the proposed solutions (i.e., its interface; possibility to set one’s preferences, etc.) and emphasize the benefits, both on a social and individual level from various perspectives (i.e., environment protection, financial benefits, social engagement, etc.). At the same time, field experiments have proved the significant role of social influence in forming the awareness and engagement level towards energy efficiency issues, renewable energy sources and other innovations in the energy market, see [68,69,70] for more details.
Finally, consumer preferences and communication channels play a vital role in the diffusion of information as well as addressing their concerns [71]. In 2009, a case study for understanding the impact of social capital on information diffusion, for adoption of household energy efficiency measures, was carried out among three communities in the UK. Results showed the standard campaigns account for approximately two-thirds of information seeking behavior, while it may not be addressing the rest of the community who prefer to receive information from the people they knew. It was also concluded that the likelihood of acceptance towards innovations increases, up to four times, in cases where the information is shared through personal contact. This implied that it is very important to tailor the diffusion or awareness campaigns according to communities’ communication channel preferences, to have more efficient results. [5]. Social media is a very convenient medium for creating personalized social influence that has proven to be effective for the diffusion of information or creating public awareness [48].
To conclude, a state-of-the-art literature review indicates that consumer acceptance of SM, as a part of a broader market acceptance, raises with the increase of consumers’ knowledge about the energy market and SG solutions (including SM, SMP and DSM/DR), with positive social influence (the desire to “be like others”, to compete with neighbors, and the need for one’s actions and decisions to be supported by one’s peers), and with the belief in positive result of cost-benefit analysis of consumer engagement in the energy market (taking into account financial and non-financial aspects, e.g., discomfort of usage).
Although social acceptance towards SM has already been broadly investigated, we still see a gap in the literature. Namely, we believe that, presently, customers become “smart”, because of the access to various smart solutions on different markets. It is also true for the energy market. At the same time, smart customers are often present in social media, such as Facebook, Twitter or LinkedIn and are more aware regarding current and future technological trends. Various studies have already proven that dissemination of innovation through social media channels can bring effective results, see for example: [41,42,46,50,51]. To the best of our knowledge, the awareness and acceptance of SM among social media users have not been checked yet. Within our study, we want to fill this gap.

4. Methods

4.1. Data Collection and the Sample

Data for this research was collected through an online questionnaire which was disseminated through social media platforms, namely Facebook, LinkedIn, Twitter, Reddit, WhatsApp and Instagram. Targeted audiences were residents of Poland above the age of 18. To reach the targeted audience, the organic method–manual sharing, paid method–targeted social media campaigns and influencer method–sharing by highly followed users to their audience were used. An option to fill out the survey in Polish and English was given to facilitate both Polish nationals and Non-Polish nationals residing in Poland to respond to the survey. In total, N = 505 complete questionnaires had been collected, during February–March 2019. Out of these, 65 responses were in English and the rest were in Polish. Number of users visiting the online questionnaire were monitored via Google Analytics and showed that 1374 users visited the landing page, out of which 349 exited from the landing page itself, 852 visited the questionnaire in Polish language and 173 visited the questionnaire in the English language.
To explore the determinants of the willingness to accept and install SM, we performed the following statistical analyses. First, in order to describe the sample and show relations between the chosen variables, descriptive statistics were used. Then, to explore the predictors of willingness to accept SM, ordered logit and tobit regression models have been used. All calculations have been performed in SPSS and Gretl statistical programs.

4.2. Theoretical Background

As the study is focused on dissemination of innovative electricity smart meters among social media users, we rely on the theoretical concepts and models, which emphasize the role of the social network in the diffusion of innovation. The background of the study is based on Roger’s model of innovation diffusion (DoI) [4]. This model pays a great deal of attention to communication channels in spreading news about market novelties. Rogers argues that diffusion is the process by which innovation is communicated over time among the participants in a social network. According to the DoI model, four main elements influence the spread of a new product, service or idea: the innovation itself, communication channels, time, and a social network (system). Rogers emphasizes that the innovation must be widely adopted in society in order to self-sustain and spread. This is the reason this model pays great attention to human capital. There is a point, within a certain rate of adoption, at which innovation reaches the so-called “critical mass”, which allows the innovation to spread further in the market [72].
In our survey, we expect that social media users are the first, more aware and interested towards market novelties and, second, more experienced with modern communication technologies. As electricity SM are often connected with smart metering information systems (SMP), available for free on mobiles, tablets or just on internet web pages, social media users would be more inclined to have some experience with them. This assumption is caused by the general higher level of interest and engagement towards smart products and services among this group of customers. Social media users are usually in favor of new technologies, prefer to stay on-line, and are mostly familiar with various mobile applications and modern communication channels, such as Facebook Messenger or Whatsapp. We believe that staying in touch with one’s social networks may bring positive results in spreading the information about new products and ideas, as already proven on various markets, see for example [42,44,49,59]. At the same time, we are quite skeptical as to whether the energy market, electricity, and innovative energy services, such as e.g., SM, SMP or DSM/DR are advertised and offered to the potential customers via social media. Key words, such as “smart metering”, “electricity bills”, “energy saving” and others connected with the energy market and the power system, do not belong to the ones being often mentioned by the social media users. Various studies show that people generally are not interested in electricity and do not discuss it frequently [34,73], which may also turn out to be true among social media users. Our research has been conducted in order to find out whether our expectations regarding the awareness and acceptance level of SM among social media users are right or not.

4.3. Research Framework

As presented in Figure 1, we have started with exploring the results of the previous studies regarding SM awareness and acceptance such as e.g., [16,17,18,30,32]. The literature review let us make some theoretical assumptions (see Section 4.2), raise some research questions and decide about the questionnaire design. We have decided to conduct the study particularly among social media users, as based on the literature, we could have assumed that consumers, who are actively using social media, are much more familiar with and open-minded towards new technologies to which SM and SMP (i.e., smart metering platforms) belong. The dissemination of the survey has also been done through social media channels. Finally we have analyzed the collected results by conducting first reliability and validity tests, and then by exploring the data by means of descriptive statistics and regression models.

5. Results and Discussion

5.1. Descriptive Statistics

The definitions of the variables and their coding is presented in Table 1. Apart from the demographics, (D1–D10) following blocks of questions were included in the survey: belongings (possession) of smart devices (B1–B11), knowledge (K1–K5) and source of information about SM (S1–S14), social influence (W1–W3), preferences regarding the role of the government in SM enrollment (G1–G3) and SM information systems (P1–P6), concerns about SM (F1–F4), and decisions relating to options to install SM ( D e 1 D e 6 ).
Demographics (D1–D10)
The statistical description of the socio-economic variables (D1–D10) is presented in Table 2. The majority of the sample is represented by young people between 18–35 years old, with at least a secondary level of education, living currently in a flat or apartment in a major Polish city. Most of the respondents do not have children and (72%) and 31% are still students. According to Eurostats, in Poland, 63% of the population is active on social media, out of which over 90% of social media users are between the age of 18 to 35. This accounts for the majority responses from young people.
Belongings of smart devices and personal assets (B1–B11)
The structure of respondents’ belongings of smart devices and personal assets is presented in Figure 2. The majority of respondents possess a smartphone (99.8%), a laptop (94.9%), and a Wi-Fi connection at home (98%). On the other hand, the possession of an owned car, motorcycle, house or apartment is lower. The respondents were also asked whether they have some renewable energy sources installed at their household. Only 6.7% confirmed to have such energy sourced installed, and 90.5% denied.
Knowledge about SM (K1–K5)
Half of the respondents (51.9%) do not know what SM is. Even less (67.7) claim not to have a SM installed at their household. Only 5.3% of respondents declared as having SM installed. The majority of respondents (60.2%) do not know whether they plan to have a SM installed in the future, or do not plan to install it in the future (28.9%). At the same time 30.7%, would like to have SM in their household. This group is primarily composed of those respondents who are aware what SM is. Such results are not surprising, as other reports (such as, [1,9,73] indicate low levels of knowledge about SG and SM. It is also connected with a rather low level of awareness and interest towards energy itself and the energy market [67].
Source of information about electricity and SM (S1–S14, I1–I8) and social influence (W1–W3)
The most common sources of information about electricity (tariffs, offers, energy sellers, etc.) include energy companies (50.3%), TV news (49.3%), friends and colleagues (39.2%), Facebook (34.7%), radio (23.1%), newspapers (17.1%) and YouTube (10.4%). The remaining sources include official government internet platforms, workshops and educational campaigns, Facebook messenger, Twitter, Whatsapp and LinkedIn, but they have not been mentioned often. Some of the respondents use various blogs, professional journals and internet platforms to collect some recent information about the energy market and electricity.
The distribution of the variables I1–I8 indicates that the majority of the respondents (even above 90%) neither have seen any information about SM in conventional sources of media, such as newspapers, radio or TV, nor have heard about the national enrollment of SM (90%). On average, 11% of respondents have seen some posts abut SM in social media, have discussed this topic with their friends and colleagues, or have searched for some information about SM on the Internet. Half of the respondents do not know whether their peers have SM installed, and 38% think they have not (M = 2.45; SD = 0.64; where (1) means yes, (2) no, and (3) hard to say). They are also not sure whether the peers’ decision to install it would encourage them to do the same (M = 2.35; SD = 0.77). Around 30% of respondents indicated that the recommendations of their peers regarding SM installation would motivate them to install SM as well.
Preferences regarding SM (P1–P6)
Of respondents, 70.5% do not regularly monitor their energy usage. Only one fourth of the sample admit to monitoring energy consumption. At the same time, the majority (more than 70%) believe that getting more details and real time information about energy consumption would be desired (M = 1.36; SD = 0.69). 68.7% declare that access to such information would enable them to decrease the wastage of energy usage. 69.3% of respondents would like to have the possibility to remotely control their electricity supply by means of a mobile app (M = 1.45; SD = 0.73).
Concerns and fear about SM (F1–F4)
We have also explored the respondents’ fears and concerns. 38.4% indicated having some concerns regarding the safety of private data transferred through SM (M = 1.87; SD = 0.79). 36% believe that fluctuations in the energy rates would result in additional stress (M = 1.97; SD = 0.83). At the same time, most of the respondents do not think or are not sure whether SM may have a negative effect on their health (M = 2.44; SD = 0.57). Respondents are also not convinced that SM might have a negative impact on the accuracy of electricity bills (M = 2.43; SD = 0.66).
Preferences regarding government’s role in SM enrollment (G1–G3)
The desired role of the government in SM roll-out has also been investigated. 52% are not sure if the government should oblige the citizens to install SM at their household (M = 2.34; SD = 0.76). More than 70% would like to have a choice whether to install SM or not (M = 1.49; SD = 0.82). 34% of the respondents would protest if they were forced to install SM and to pay for the installation (M = 2.06; SD = 0.86).
Willingness to accept/ install SM ( D e 1 D e 6 )
Finally, we have explored the respondents’ preferences regarding the decision to install SM. We have taken into account the most vital factors which, according to the literature review, influence the acceptance of SM. In particular, we have included in our analysis: financial aspects, saving energy (and money), impact on one’s health, free advice from the energy company and safety and privacy concerns. The following options ( D e 1 D E 6 ) were considered, see Table 3 and Figure 3.

5.2. Validity and Reliability Test of the Collected Data

The common method variance (CMV) is often used to control over common method bias (CMB). CMB happens when variations in responses are caused by the collection instrument and/or method of collection rather than the actual predispositions of the respondents that the research questionnaire attempts to uncover. As mentioned in the works of Podsakoff et al., it may happen that the survey instrument, such as a questionnaire, introduces a CMB, detected by the CMV as variances. When CMB is large then it can make a major contribution to the measured effects. In such a case the results are then contaminated by the ’noise’ stemming from the biased instruments (see [74,75] for more details). One of the simplest ways to verify the potential problems with CMB is to use Harman’s single factor score, in which all items (measuring latent variables) are loaded into one common factor. If the total variance for a single factor is less than 50%, it suggests that CMB does not affect the data, hence the results. Our research instrument does not introduce CMB, as the variance is equal only to 9.688%.
We have also controlled the reliability of our variables by using Cronbach’s Alpha test. We have checked the following sets of variables: B1–B11; K1–K5; I1–I8; W1–W3; G1–G3; P1–P6; F1–F4 and S1–S13. Apart from variables, regarding the concern (F) with α = 0497, source of information about SM (S) with α = 0.399 and governmental impact and role (G) with α = 0.388, the rest of the variables have the following values of parameter α : 0.570 for (B), 0.587 for (K), 0.512 for (W), 0.688 for (P), and 0.792 for (I). It allows us to aggregate the variables in larger constructs, by taking their mean value in the further step of the analysis. Such an aggregation allowed to limit the number of significant variables for the alternative decisions and let us draw some more general conclusions.

5.3. Modeling of Willingness to Install SM

We assume that acceptance of SM can be expressed by the willingness to install SM at the consumer’s household. In the study, we have examined various options that can differentiate the acceptance level as well as the explanatory variables influencing the consumer’s choice. In particular, we have distinguished separate models for each decision alternative D e 1 D e 6 . Altogether, 6 Tobit models (with the threshold D e i 2 , excluding uncertainty in (3) “hard to say” answers) and 6 ordered logit models (for D e 1 , D e 2 , D e 4 , D e 6 ) were included in the analysis.
In the ordered logit model, it is assumed that there is a linear relationship between the unobserved value of the willingness to install SM under a certain condition ( D e i * ) and exogenous variables
D e i * = α + X i β + ε i ,
where α is an intercept, X i is a vector of exogenous variables excluding the constant and ε i as a residual. The probabilities of belonging to a certain class D e i { 1 , 2 , 3 } , can be defined in the following way,
P r o b ( D e i = 1 ) = P r o b ( D e i * 1 ) = Λ ( α 1 X i β ) P r o b ( D e i = 2 ) = P r o b ( 1 < D e * μ 1 ) = Λ ( α 2 X i Λ ( α 1 X i β ) P r o b ( D e i = 3 ) = P r o b ( μ 1 < D e * μ 2 ) = Λ ( α 3 X i β ) Λ ( α 2 X i β )
where Λ ( ) is a logit function and α k ’s are thresholds, such as α 1 < α 2 < α 3 . The ordered logit model is often used to explore and analyze the willingness to pay or to accept a certain product. Since the actual values of D e i * are not observed, (apart from the respondents who have already SM installed, we cannot be sure whether those who declare interest to install SM under a certain condition would install it), the regression (1) cannot be estimated directly and the model (2) could serve as an approximation of factor effect on willingness to accept/ install SM.
The models’ predictive capabilities are as follows: for model D e 1 69.8% with Log likelihood −331.49 and Chi-square 113.22(20) with p = 0.000; for model D e 2 73.8% with Log likelihood −337.94 and Chi-square 160.14(20) with p = 0.000; D e 3 56.7% with Log likelihood −473.20 and Chi-square 111.84(20) with p = 0.000; D e 4 52.2% with Log likelihood −463.16 and Chi-square 140.87(20) with p = 0.000; D e 5 57.9% with Log likelihood −427.62 and Chi-square 181.66(20) with p = 0.000; and D e 6 66.9% with Log likelihood −402.57 and Chi-square 206.88(20) with p = 0.000.
On the other hand, the tobit model assumes that the class number D e i { 1 , 2 , 3 } is a linear function of some exogenous variables, as in (1), however, the relationship cannot be observed for individuals who are not sure whether they would install SM under a certain condition (these are the respondents who choose the answer (3) “hard to say”). As a result, the model becomes
D e i = D e i * D e i 2 0 D e i > 2
where D e i * is a latent variable described similarly to (1).
The results of the ordered logit model, presented in Table 4, indicate that:
  • Decision D e 1 to install SM if it allows saving energy/ money correlates positively with preferences to possess more information on how to consume energy in more efficient ways and how to decrease energy wastage (P), household size (D8), and place of living (D10). It means that saving money due to the installation of SM was a motivation to citizens of larger cities rather than smaller ones that were living in bigger families. At the same time, this alternative correlates negatively with concerns about privacy and negative impact on one’s health (F), and number of information sources regarding electricity (S1–S13). The negative relation with parameter F is not surprising, because those who are in favour of alternative D e 1 , are at the same time against the statements regarding fears and concerns about negative impact of SM on their wellness and health and safety of data protection. Similarly, those who have revealed more sources of information about SM, are more inclined to confirm this decision alternative.
  • Decision D e 2 to install SM if it allows saving energy/ money but at the same time may have a negative impact of one’s health, correlates positively with (P)—preferences to possess more information on how to consume energy in more efficient ways and with an impact of the government on their obligation to install SM (G). Surprisingly, this alternative is also positively influenced by confirmed concerns and fears (F). With two demographic variables: age (D2) and marital state (D3), the probability of confirming this decision increases as well. It indicates that older consumers who are married or in a relationship are more interested in SM than younger single individuals.
  • Decision D e 3 to install SM if it allows saving energy/money and at the same time does not have a negative impact of one’s health but energy companies can know all details about one’s energy use depends positively on: parameter P, positive social influence (parameter W), meaning that one’s peers support installation of SM or already have an SM installed. This alternative is also influenced by household’s income (D6) and household’s size (D8), meaning that larger families with smaller income are more likely to accept this alternative.
  • Decision D e 4 to install SM if a company representative visits your home and explains the benefits to you correlates positively with social influence (W) and low education level (D4) and negatively with age (D2) and income (D6)- this option is rather chosen by older people, with higher income.
  • Decision D e 5 to install SM if one has to pay for the installation correlates strongly with parameters: W, G and F. Those who confirm this alternative, care about peers’ support of SM installation and would prefer the government not to force them to install SM if they do not want it. Again, this option depends on concerns and fears about negative impact of SM, which means that those who have some concerns are likely to choose the payable installation.
  • Decision D e 6 to install SM if one does not have to pay for it is likely to be confirmed if one cares about social support (W), lack of governmental obligation to install (G) and preferences to possess some information about energy saving because of SM (P). It correlates negatively with the number of information sources about SM (S).
The tobit models, in Table 5, additionally show that knowledge about SM (K) and lower income (D6) and older age (D2) impact decisions D e 1 positively, whereas a lack of regular monitoring of energy use (A1) decreases the probability of the confirmation of this decision. In the case of decision D e 3 , which also concerns about SM installation (F) and access to some sources of information regarding SM (I), have a positive impact. Concerns about SM installation have occurred to be significant also in terms of decision making D e 4 , D e 5 , and D e 6 . Social influence (W) matters in case of all decisions, apart from D e 2 .
To conclude, the following parameters have been revealed to be essential to influence a positive willingness to accept SM installation: peer’s support (W), lack of governmental obligation to install SM (G), and preferences to get some more information about SM that will enable energy conservation (P). Consumers do not want to be pressed and feel obligated to install SM but would rather prefer to have a choice. At the same time, they see the benefits connected with SM installation, such as better control over one’s energy consumption and electricity prices. Consumers rely on the opinions of their friends and colleagues regarding SM. Peer support seems to be important for them as well. On the other hand, dependent on the decision alternative D e i , different socio-economic variables seem to be important. For example, readiness to install SM, in many cases, correlates with age (D2). Older consumers are more willing to accept SM installation. Confirmation of decisions D e 1 and D e 3 increases with several household members. The impact on the household’s average income may be negative (in case of D e 1 and D e 3 ) or positive (in case D e 4 ) on SM installation and acceptance. The size of the city seems to matter only for the first alternative D e 1 and martial state ( D e 3 ) influences decision D e 2 . Surprisingly, possession of smart devices and personal assets (B) and knowledge about SM (K) does not show to be significantly correlated with SM installation, apart from decision D e 1 with which parameter (K) is significantly correlated. Also, the source of information about electricity (S) and access to information about SM (I) are important only in the case of the two alternatives, D e 1 and D e 6 .
The detailed results, including all of the individual explanatory variables, of the ordered logit and tobit models (the latter with the threshold D e i 2 ) are presented in the Appendix A in Table A1, Table A2 and Table A3. In each column, the upper rows show the results of the ordered logit regression and the bottom rows represent the results of the tobit model. For models D e 3 and D e 5 , only tobit models are provided.
From the demographic data set, age (D2), average income (D6) and household size (D8) are significantly correlated with willingness to accept SM. Older consumers, with higher incomes and larger families are more likely to accept SM installation. The correlation between willingness to accept/install SM and the possession of smart devices and personal assets is less clear. Consumers who do not have WI-FI/Internet connection in their household are less likely to accept alternatives D e 4 , D e 5 , D e 6 . Positive influence of having a laptop has occurred to be significant for alternative D e 6 , and partly for D e 2 and D e 4 .
In case of possessing knowledge about SM, mainly the desire to have SM installed in one’s house (K4 and K5) significantly increases the probability of willingness to accept alternatives: D e 1 , D e 2 , D e 5 and D e 6 . Regular monitoring of energy usage (A1) declines the probability of confirmation of decision D e 1 and increases in the case of decision D e 6 .
Having multiple sources of information about SM, both in social media, on the Internet and in conventional sources, such as TV or radio, seems to have an impact, especially on first four alternatives. In particular, those who have not seen a post about SM in social media and have not talked about this with their peers are less likely to confirm alternatives D e 1 , D e 2 , D e 3 and, partly, D e 4 . At the same time, those who have ever looked for some information about SM on the Internet are highly likely to accept the options D e 1 and D e 3 .
Receiving positive advice and recommendations from one’s peers regarding the installation of SM has been revealed as a significant factor, explaining the likelihood of all of the alternatives. Consumers, whose friends and colleagues have recommended SM installation, are much more likely to accept and install it in their households under various conditions proposed in alternatives D e 1 D e 6 .
In the case of governmental impact on SM installation, most of the respondents want to have a choice to accept or decline SM installation. This opinion increases the probability of confirming most of the alternatives, apart from D e 3 and D e 4 . The following preferences (P) correlate with the willingness to accept/install SM, especially in alternatives D e 1 , D E 2 and D e 3 : receiving more details about energy consumption (P1), the ability to remotely turn on/off the electricity supply in one’s household (P5), and the desire to have a dynamic electricity tariff with different electricity prices in load peaks and to consume more energy when it is cheaper (P6). Only in alternative D e 5 do none of the preferences show as significant.

5.4. Final Discussion

The results show that social media users between the age of 18 to 35 were the most active in responding to the questionnaire. This also compliments the literature which stats that this age group of users are the largest in number on social media. As presumed before carrying out the survey, the respondents are open to new technologies and are users of smart phones, laptops and internet. It was surprising though, to find out that social media users, described in the literature to be really active in checking their notification and news updates, are not very keen on monitoring their energy consumption regularly. At the same time they rather agree that real time information of energy consumption would lead to energy saving at their households. More than half of the respondents do not know about SM and even more do not know whether they would be installing SM at home in the future. This indicates that if the consumers’ awareness regarding SM increased, they would be open towards using it for saving energy. Lack of information in conventional communication channels as well as in social media, is one of the responsible factors for low levels of SM awareness among consumers. Respondents also indicated that discussion among peers regarding SM is not that common, which is another reason for lower diffusion of SM, especially that even one third of the respondents agreed that a recommendation from their peer would motivate them to install SM. Consumers also indicated that they fear about their data privacy and increase in stress levels (because of additional energy consumption information) through the use of SM. These fears would be addressed if the users have proper knowledge regarding SM, its functions and benefits. There are studies in the literature which indicate the fear of health problems and impact on accuracy of billing, but the results of this study do not support those findings as majority of the respondents do not think that it would be a factor of concern to them. Energy companies and the government need to proceed with caution and raise the awareness level of consumers regarding the benefits of SM, so that they accept it voluntarily rather than forcing it on them. This is because over two thirds of the respondents indicated that they should have the choice of whether or not to install SM at their houses. Over one third of the respondents also expressed that they would protest if they were not given a choice for it. Apart from all these factors which warrant for large scale awareness campaign regarding SM among consumers, this study also drew some conclusions from the question where users were given different conditions of acceptance to install SM. Majority of the users were positive to install SM if they would be able to save energy and decrease their expenses. The acceptance level decreases if consumers’ information about their energy consumption can be known by the energy companies. The numbers fall even further where consumers were asked if they would accept the use of SM if they had to pay extra for its installation and around two thirds of the users responded negatively to the prospect of accepting SM if there were any ill effects to their health because of it.

6. Conclusions and Recommendations

6.1. Conclusions

Within this study, we wanted to explore the awareness and acceptance level of SM among social media users. Although various aspects of consumers’ acceptance and engagement towards innovative, smart energy services, such as micro technologies based on renewable energy sources, dynamic electricity tariffs, green electricity tariffs or even SM and SM information systems (SMP) have already been investigated in the literature, to the best of our knowledge, the awareness and acceptance of SM among social media users has not been explored yet.
The literature also supports that, presently, social media platforms, such as Facebook or Twitter, have become very important communication channels in social systems. At the same time, communication channels play a vital role in every diffusion process of innovation (see DOI model in Section 4), which is also true for the energy market and innovative energy services being launched and offered to electricity consumers.
Even though our survey has been limited to one country, we have been able to draw some general conclusions. In particular, we have observed that consumers’ willingness to accept/install SM depends on consumers’ age, income and household size. Generally, older consumers with higher incomes and larger families are more likely to accept SM installation. Willingness to accept/install SM is also influenced by peer’s support (people care about peer’s recommendations, experiences and advice), lack of governmental obligation to install SM (people do not want to be forced to install SM and pay for it) and preferences to receive some additional information about one’s energy consumption profile and real-time electricity prices through SM and SMP. This last parameter should be emphasized because it shows that social media users, who are generally keen on modern communication technologies, could be interested in using SMP mobile apps, connected with their SM, to remain informed about their current energy consumption. Polish consumers hold similar concerns regarding SM as consumers from other countries. Namely, they are afraid about the safety of their private data being transferred through SM to energy companies. They are also worried about the impact of dynamic electricity prices on their comfort of living.
Surprisingly, possession of smart devices and personal assets, sources of information about electricity, and access to information about SM have occurred to matter only in case of two installation alternatives, both of which are connected with financial aspects, namely: energy and money savings, and lack of consumers’ payment for SM installation. Such a result may be caused by the fact that electricity, in general, and SM or SMP in particular, are not common subjects spread throughout social media. At the same time, consumers interested in some aspects of the energy market, e.g., in comparing the offers of energy companies, admit to looking for such data on the Internet. They also ask their friends and colleagues for opinions and advice. Additionally, Facebook itself has been revealed as one of the most common sources of information, especially for the younger group of consumers, who generally rely on the information found on various social media platforms. This finding shows some optimistic perspective on how social media could be used in the dissemination process of energy efficiency, energy conservation and other energy related subjects. Our study has shown that, presently, SM and SMP are mostly not advertised through conventional or social media. Consumers do not have a chance to view informative posts or messages, explaining the concept of SM enrollment, its advantages and potential benefits for electricity consumers. It is one of the reasons for a rather low level of consumers’ awareness. At the same time, we have observed a general positive interest and a desire to have SM installed in ones’ household. We believe that there is still plenty to be done in order to increase consumers’ awareness and knowledge about SM and SMP. Ideas for how it could be achieved are presented below.

6.2. Recommendations for Increasing Consumer Acceptance through Social Media

The government as well as energy companies must put in a more vigorous effort to increase public awareness regarding SM. Based on the results of this study, findings on awareness and acceptance of smart meters in the literature, and studies based on diffusion of innovation through social media, the following are recommendations that could be fruitful if implied by the government and energy companies.
  • Facebook and YouTube were mentioned by 34.7% and 10.4% of the respondents as a source of receiving information about various aspects of electricity. The remainder of the social platforms were not that popular. The authors briefly browsed Facebook, LinkedIn, Twitter, YouTube and Instagram accounts of energy companies in Poland. It was found that Facebook and YouTube had some content related to smart meters, but the rest did not. Additionally, platforms such as Instagram, which are gaining popularity, did not show presence of energy companies. To increase this number, social media campaigns must be more diverse, in terms of content type, theme and means.
  • It has been proven by several studies that the most effective content types on social networks are photos, graphics, illustrations and motion graphics. The use of these means would help in improving the outreach as well as understanding of social media users about SM.
  • Themes of the campaign are also very important and, while planning the campaign, the platform of dissemination and targeted age groups must be kept in mind. Through the results of the study, some of the recommended themes are as follows: addressing the knowledge about SM (What are smart meters, its function, benefits, myths, long term implications, financial impacts and so on.); demonstrating the controls users get through installation of SM (monitoring energy use, reducing bills, as well as wastage of energy, remotely controlling energy usage with real time information and so on.); addressing the concerns about SM (security of personal data, fluctuations in the energy rates, health effects, accuracy of billing, etc.); and social discussions through experts and current users of SM (positive feedback/experiences, expert advice/assurances and so on).
  • Through the literature as well as the results, it is evident that individuals are more open towards accepting information received though the people they know. Hence, we recommend that, instead of running paid campaigns on social media, organic campaigns and influencer campaigns would be more effective. Through organic campaigns, the users will receive information through their peers and connections, although the effect would be limited in terms of reach and would depend on the network of the page or profile where the content is posted. Through influencer campaigns, the users would be receiving information from a person well-known to them and, hence, the impact of information, as well as its lasting effect, would be greater as compared to an unknown source.

6.3. Limitations of the Study and Future Work

The conducted survey has some limitations. Firstly, the study was geographically limiting as it was only conducted in Poland. Furthermore, the study was also limited by the means of dissemination of filling out the web-based survey, it only focused on social media users. Hence, the sample does not account for consumers who are not active on social media. Further studies could be aimed at more diverse demographics and at a wider audience. The authors tried to include as many factors as possible, which have an influence on consumers towards their willingness or decision to install smart meters. Future studies might add more factors, such as ownership or tenancy of the house, whether the respondent is the decision maker, their field of education and profession. A similar study could be carried out for understanding public awareness and consumer acceptance of other innovations and novelties. It would also be interesting to measure the effects of recommendations suggested by the authors in this article.

Author Contributions

Y.C. conceived and designed the survey; A.K.-P. reviewed the design of the survey; Y.C. performed the survey in social media; A.K.-P. analyzed the data; A.K.-P. and Y.C. reviewed the literature; A.K.-P. and Y.C. drafted, reviewed and edited the paper.

Funding

This work was supported by the National Science Center (NCN, Poland) by grant no. 2016/23/B/HS4/00650.

Acknowledgments

The authors are grateful to the reviewers for their constructive and insightful remarks and suggestions. The authors would also like to thank Marta Pytel for checking and proofreading the language of the manuscript. The authors also acknowledge the support by Monika Czaplicka from WoBuzz in Poland for the dissemination of the survey questionnaire to collect responses through social media.

Conflicts of Interest

The authors declare no conflict of interest.

Abbreviations

The following abbreviations are used in this manuscript:
SGsmart grids
SMelectricity smart meters
SMPsmart metering platform (SM information systems)
DSM/DRDemand Side Management& Demand Response tools
DoIdiffusion of innovation model

Appendix A. Estimation Results for Ordered Logit and Tobit Models

Table A1. Estimation results of the ordered logit and tobit models (part 1).
De 1 De 2 De 3 De 4 De 5 D e 6
D10.365 (0.294) 0.056 (0.059)0.106 (0.259) 0.305 (0.493)0.050 (0.100)−0.001 (0.230) 0.189 (0.168)0.082 (0.183)0.261 (0.252) 0.063 (0.108)
D2−0.328 * (0.178) −0.080 ** (0.037)−0.361 ** (0.164) −0.543 * (0.301)−0.220 *** (0.065)−0.255 * (0.143) −0.129 (0.168)0.131 (0.118)0.063 (0.163) 0.026 (0.072)
D3−0.037 (0.106) 0.007 (0.022)−0.107 (0.096) 0.037 (0.184)−0.068 * (0.037)−0.030 (0.084) 0.003 (0.065)0.026 (0.066)−0.068 (0.093) −0.0114 (0.041)
D4−0.0003 (0.172) −0.004 (0.036)0.076 (0.154) −0.279 (0.359)0.007 (0.061)0.135 (0.134) −0.038 (0.107)0.292 ** (0.117)0.081 (0.152) −0.019 (0.066)
D5−0.017 (0.023) −0.002 (0.004)0.008 (0.019) 0.031 (0.032)−0.011 (0.007)0.012 (0.017) 0.0123 (0.012)−0.005 (0.012)0.001 (0.018) 0.0033 (0.008)
D60.074 (0.055) 0.014 (0.011)0.104 ** (0.049) 0.491 *** (0.156)0.052 ***  (0.019)−0.106 ** (0.043) −0.021 (0.032)−0.072 ** (0.036)−0.056 (0.048) −0.0127 (0.207)
D70.089 (0.071) 0.013 (0.015)−0.118 * (0.066) −0.036 (0.103)−0.021 (0.026)−0.003 (0.062) 0.018 (0.044)−0.005 (0.048)−0.019 (0.063) 0.004 (0.027)
D8−0.171 (0.114) −0.0555 ** (0.023)0.039 (0.100) −0.253 (0.188)−0.078 ** (0.039)−0.021 (0.091) −0.176 *** (0.064)0.066 (0.077)−0.053 (0.096) −0.083 * (0.043)
D9−0.312 * (0.188) −0.067 * (0.036)0.134 (0.158) 0.359 (0.337)0.047 (0.063)0.172 (0.136) 0.225 * (0.118)−0.147 (0.114)−0.030 (0.152) −0.049 (0.068)
D100.163 (0.114) 0.023 (0.022)0.044 (0.095) 0.340 ** (0.172)0.010 (0.037)0.027 (0.084) 0.038 (0.059)−0.082 (0.070)0.039 (0.094) 0.005 (0.039)
B100.303 (0.231) 0.023 (0.043)0.315 (0.193) −0.082 (0.288)−0.011 (0.072)0.169 (0.161) 0.044 (0.117)−0.211 (0.136)−0.011 (0.184) −0.022 (0.077)
B20.073 (0.169) 0.004 (0.034)−0.016 (0.03) −0.592 * (0.338)−0.104 * (0.057)0.071 (0.132) 0.004 (0.097)−0.168 (0.109)0.059 (0.146) 0.023 (0.062)
B3−0.146 (0.162) −0.036 (0.034)−0.014 (0.147) −0.423 (0.275)−0.046 (0.058)−0.318 ** (0.131) −0.268 *** (0.102)−0.034 (0.109)−0.182 (0.145) −0.071 (0.063)
B4−0.218 (0.251) −0.075 (0.052)0.344 (0.226) 1.296 ** (0.547)0.111 (0.086)−0.223 (0.188) −0.471 ** (0.184)0.015 (0.149)−0.287 (0.211) −0.227 ** (0.098)
B50.048 (0.149) 0.0248 (0.030)−0.255 * (0.134) 0.116 (0.274)−0.015 (0.052)−0.051 (0.114) −0.073 (0.089)−0.084 (0.09)0.107 (0.127) 0.042 (0.055)
B60.126 (0.320) 0.014 (0.069)−0.915 *** (0.314) −0.379 (0.503)0.107 (0.135)0.571 * (0.292) 0.353 (0.245)0.419 (0.113)0.786 ** (0.329) 0.336 ** (0.155)
B70.111 (0.547) 0.155 (0.260)0.119 (0.261) 0.193 (0.384)0.837 (0.377)0.115 (0.589) 0.252 (0.560)−1.639 (0.655)0.981 (0.981) 1.408 (0.366)
B80.049 (0.145) −0.007 (0.0294)0.107 (0.128) 0.968 *** (0.348)−0.008 (0.049)−0.037 (0.112) −0.014 (0.081)0.102 (0.092)−0.106 (0.124) −0.029 (0.054)
B90.159 (0.525) 0.009 (0.108)−0.115 (0.465) −1.140 (0.797)−0.0236 (0.172)−1.627 *** (0.435) −0.832 *** (0.254)−0.053 ** (0.264)−1.140 *** (0.431) −0.387 ** (0.188)
B100.183 (0.155) 0.0388 (0.031)0.265 * (0.136) −0.214 (0.274)0.045 (0.052)0.052 (0.117) 0.263 *** (0.088)−0.053 (0.096)0.019 (0.130) 0.0204 (0.056)
B11−0.255 * (0.151) −0.044 (0.031)−0.272 ** (0.137) −0.237 (0.249)−0.041 (0.052)0.075 (0.117) −0.068 (0.088)−0.047 (0.095)0.081 (0.128) 0.074 (0.056)
K10.186 (0.226) 0.033 (0.047)−0.016 (0.203) −0.285 (0.405)0.108 (0.081)0.089 (0.173) 0.159 (0.139)−0.058 (0.146)0.022 (0.191) 0.005 (0.087)
K2−0.262 (0.316) −0.006 (0.064)−0.211 (0.283) −0.611 (0.515)−0.109 (0.108)−0.515 ** (0.240) −0.006 (0.184)−0.196 (0.212)−0.098 (0.277) −0.074 (0.118)
K30.279 (0.796) 0.051 (0.136)−0.736 (0.602) 0.061 (0.781)0.069 (0.223)0.788 (0.506) 0.663 * (0.355)0.048 (0.328)−0.076 (0.559) 0.087 (0.240)
K4−0.382 (0.264) −0.051 (0.049)0.805 *** (0.232) 1.495 *** (0.430)−0.073 (0.084)0.296 (0.189) −0.027 (0.137)−0.138 (0.142)−0.241 (0.214) −0.099 (0.088)
K50.853 *** (0.231) 0.146 *** (0.039)−0.083 (0.175) −0.098 (0.257)0.044 (0.065)0.011 (0.149) 0.126 (0.106)0.247 ** (0.117)0.665 *** (0.163) 0.299 *** (0.070)
Note: *** p < 0 . 001 , ** p < 0 . 01 , * p < 0 . 05 (two-tailed test); Standard errors in brackets. LL stands for Log-Likelihood. The upper rows represent the results of the ordered logit model, whereas the bottom rows show the results of the tobit model.
Table A2. Estimation results of the ordered logit and tobit models (part 2).
De 1 De 2 De 3 De 4 De 5 D e 6
A1−0.619 ** (0.291) −0.116 ** (0.057)−0.305 (0.248) 0.981 (0.617)−0.142 (0.096)−0.142 (0.227) 0.210 (0.170)0.217 (0.182)0.502 ** (0.253) 0.226 ** (0.107)
I1−0.918 ** (0.402) −0.171 ** (0.076)−0.724 ** (0.339) −2.490 ** (0.953)−0.242 * (0.126)−0.007 * (0.281) −0.093 (0.198)0.307 (0.213)0.292 (0.306) 0.015 (0.134)
I21.115 (0.794) 0.1888 (0.128)0.080 (0.571) 0.217 (0.897)0.333 (0.126)−0.072 (0.505) −0.054 (0.333)−0.430 (0.382)0.691 (0.543) 0.126 (0.222)
I3−1.389 *** (0.529) −0.290 *** (0.101)−0.716 (0.447) 0.296 (0.717)−0.551 *** (0.173)0.060 (0.376) −0.093 (0.272)−0.119 (0.288)−0.546 (0.381) −0.227 (0.174)
I41.122 * (0.197) 0.193 * (0.115)−0.495 (0.498) 0.282 (0.782)0.283 (0.188)−0.157 (0.475) 0.336 (0.292)−0.142 (0.353)1.015 * (0.544) 0.272 (0.198)
I50.745 (0.572) 0.058 (0.113)0.887 * (0.489) 1.036 (0.735)0.194 (0.182)0.263 (0.438) 0.055 (0.273)−0.474 * (0.287)−0.385 (0.497) −0.231 (0.194)
I6−1.051 (0.812) −0.086 (0.149)1.173 * (0.660) 1.207 (0.385)−0.051 (0.248)0.865 (0.609) 0.138 (0.359)0.202 (0.403)0.222 (0.631) 0.192 (0.250)
I71.560 *** (0.591) 0.284 *** (0.102)0.499 (0.455) −0.615 (0.775)0.356 ** (0.175)−0.211 (0.358) −0.443 (0.274)0.114 (0.277)−0.272 (0.393) −0.178 (0.177)
I80.065 (0.489) 0.098 (0.103)−0.127 (0.446) −0.274 (0.763)0.195 (0.179)0.336 (0.415) 0.443 (0.281)−0.519 * (0.301)−0.284 (0.452) −0.0109 (0.187)
W10.149 (0.267) −0.027 (0.054)−0.150 (0.240) −0.346 (0.388)0.036 (0.090)−0.211 (0.205) −0.087 (0.149)0.312 * (0.174)0.250 (0.222) 0.106 (0.094)
W2−0.193 (0.253) −0.021 (0.045)−0.152 (0.204) −0.146 (0.367)0.106 (0.075)0.246 (0.169) 0.124 (0.119)0.201 (0.131)−0.139 (0.196) −0.122 (0.078)
W30.315 * (0.188) 0.041 ** (0.034)0.178 (0.151) 0.766 ** (0.334)0.207 *** (0.055)0.781 *** (0.132) 0.509 *** (0.094)0.617 *** (0.104)0.879 *** (0.147) 0.382 *** (0.059)
R1−0.523 (0.469) −0.06 (0.097)−0.136 (0.417) 1.649 ** (0.704)−0.024 (0.166)0.146 (0.377) −0.435 (0.280)0.386 (0.268)0.923 ** (0.404) 0.3111 * (0.179)
G1−0.029 (0.222) −0.039 (0.041)0.156 (0.183) −1.309 *** (0.434)−0.081 (0.068)0.048 (0.158) −0.084 (0.111)−0.089 (0.125)0.007 (0.173) −0.032 (0.072)
G20.527 *** (0.164) 0.1333 *** (0.036)0.309 ** (0.151) −1.521 *** (0.532)0.042 (0.062)0.061 (0.139) −0.03 (0.106)0.401 *** (0.139)0.248 (0.159) 0.175 ** (0.073)
G3−0.315 ** (0.156) −0.069 ** (0.032)0.076 (0.142) 0.220 (0.275)−0.123 ** (0.056)0.084 (0.124) −0.041 (0.097)−0.148 (0.108)0.270 * (0.139) 0.066 (0.060)
P10.556 *** (0.185) 0.163 ** (0.045)0.638 *** (0.183) 0.610 (0.435)0.282 *** (0.083)0.097 (0.168) 0.123 (0.146)−0.101 (0.150)0.240 (0.198) 0.173 * (0.094)
P20.101 (0.219) 0.039 (0.048)0.042 (0.202) 0.735 (0.507)0.113 (0.085)−0.349 ** (0.173) −0.168 (0.149)0.016 (0.167)−0.071 (0.198) 0.030 (0.092)
P30.189 (0.183) 0.042 (0.040)−0.372 ** (0.179) −0.811 ** (0.401)−0.027 (0.068)0.103 (0.153) 0.244 * (0.148)0.043 (0.135)−0.082 (0.166) 0.031 (0.075)
P40.043 (0.184) −0.007 (0.036)0.125 (0.156) 0.337 (0.286)0.049 (0.062)0.288 ** (0.139) 0.292 *** (0.109)0.151 (0.119)−0.075 (0.156) −0.046 (0.066)
P50.880 *** (0.191) 0.213 *** (0.042)0.402 ** (0.175) 1.293 ** (0.635)0.178 ** (0.074)−0.169 (0.154) 0.197 (0.144)0.071 (0.142)0.139 (0.176) 0.174 ** (0.083)
P60.034 (0.170) −0.006 (0.034)0.211 (0.150) 0.585 ** (0.275)0.097 * (0.057)0.015 (0.131) −0.053 (0.098)0.082 (0.111)0.368 ** (0.144) 0.157 ** (0.062)
Note: *** p < 0 . 001 , ** p < 0 . 01 , * p < 0 . 05 (two-tailed test); Standard errors in brackets. LL stands for Log-Likelihood. The upper rows represent the results of the ordered logit model, whereas the bottom rows show the results of the tobit model.
Table A3. Estimation results of the ordered logit and tobit models (part 3).
De 1 De 2 De 3 De 4 De 5 D e 6
F1−0.569 *** (0.181) −0.116 *** (0.037)0.006 (0.161) −0.903 ** (0.383)−0.332 *** (0.069)−0.206 (0.142) −0.292 ** (0.117)−0.024 (0.124)−0.177 (0.158) −0.122 * (0.069)
F2−0.130 (0.234) −0.067 (0.047)−0.222 (0.209) −0.181 (0.384)0.228 *** (0.080)0.619 *** (0.178) 0.447 *** (0.133)0.450 *** (0.146)0.210 (0.200) 0.0187 (0.097)
F30.269 (0.277) 0.046 (0.055)0.791 *** (0.252) 2.417 *** (0.762)0.164 * (0.094)0.036 (0.209) −0.145 (0.156)−0.251 (0.165)0.063 (0.235) 0.0485 (0.102)
F4−0.072 (0.169) 0.008 (0.034)0.246 * (0.149) 0.763 * (0.394)−0.034 (0.058)−0.044 (0.133) 0.015 (0.098)0.129 (0.110)0.152 (0.149) 0.075 (0.063)
S1−0.419 (0.294) −0.096 * (0.057)0.085 (0.251) −0.456 (0.464)0.006 (0.098)−0.179 (0.217) −0.349 ** (0.167)−0.218 (0.184)−0.577 ** (0.249) −0.247 ** (0.107)
S2−0.334 (0.348) −0.015 (0.068)0.306 (0.304) 0.589 (0.567)0.006 (0.116)0.039 (0.257) 0.074 (0.184)0.213 (0.226)−0.713 ** (0.287) −0.319 *** (0.119)
S30.051 (0.372) −0.036 (0.068)0.340 (0.335) 0.525 (0.720)0.119 (0.132)0.086 (0.291) −0.186 (0.207)−0.101 (0.254)−0.138 (0.313) −0.004 (0.138)
S4−0.540 * (0.281) −0.0‘01 * (0.056)−0.082 (0.247) 0.725 (0.454)−0.137 (0.095)0.273 (0.218) −0.134 (0.154)0.423 ** (0.184)−0.209 (0.237) −0.110 (0.104)
S50.248 (0.345) 0.075 (0.066)−0.168 (0.288) 0.606 (0.537)0.363 *** (0.116)−0.287 (0.247) 0.028 (0.190)0.476 ** (0.214)0.201 (0.287) 0.076 (0.123)
S6−0.187 (0.536) −0.042 (0109)0.709 (0.474) 0.449 (0.982)−0.217 (0.183)−0.519 (0.416) −0.242 (0.279)0.146 (0.351)0.087 (0.491) 0.067 (0.202)
S70.665 (0.724) 0.096 (0.153)1.106 * (0.631) 0.088 (0.257)−0.257 (0.260)0.092 (0.607) −0.051 (0.436)−0.469 (0.471)−0.366 (0.743) −0.262 (0.283)
S80.612 (0.914) 0.120 (0.162)−0.029 (0.723) −0.701 (0.862)0.253 (0.275)−0.597 (0.637) −0.0519 (0.422)−0.468 (0.392)0.181 (0.669) 0.224 (0.306)
S9−1.812 ** (0.714) −0.347 *** (0.129)−0.747 (0.575) −0.254 (0.732)−0.243 (0.223)1.071 ** (0.535) 0.426 (0.400)0.137 (0.393)0.619 (0.574) 0.303 (0.263)
S100.493 (0.477) 0.109 (0.097)0.212 (0.437) −0.258 (0.725)−0.032 (0.164)−0.343 (0.380) −0.404 (0.256)−0.319 (0.288)−0.369 (0.401) −0.117 (0.174)
S110.045 (0.124) 0.099 (0.137)0.188 (0.249) 0.129 (0.16)0.019 (0.105)−0.343 (0.380) −0.024 (0.086)0.054 (0.079)−0.369 (0.401) −0.068 (0.077)
S120.321 (0.362) 0.147 (0.245)0.245 (0.428) −0.05 (0.299)−0.152 (0.164)−0.343 (0.380) −0.203 (0.161)−0.125 (0.145)−0.369 (0.401) −0.021 (0.137)
S13−0.512 (0.231) −0.133 (0.279)0.239 (0.484) −0.281 (0.343)−0.128 (0.226)−0.152 (0.361) 0.138 (0.171)−0.272 (0.17)−0.261 (0.281) −0.146 (0.162)
LL−277.913 −396.297−297.134 −265.206−395.041 −395.041−420.643 −230.876−205.796−360.383 −367.956
Note: *** p < 0 . 001 , ** p < 0 . 01 , * p < 0 . 05 (two-tailed test); Standard errors in brackets. LL stands for Log-Likelihood. The upper rows represent the results of the ordered logit model, whereas the bottom rows show the results of the tobit model.

References

  1. Hinson, S.; Bolton, P.; Barber, S. Energy smart meters. Commons Library Briefing, 3 April 2019; No. 8119. [Google Scholar]
  2. Strbac, G. Demand-side management: Benefits and challenges. Energy Policy 2008, 36, 4419–4426. [Google Scholar] [CrossRef]
  3. Darby, S.; McKenna, E. Social implications of residential demand response in cool temperature climates. Energy Policy 2012, 49, 759–769. [Google Scholar] [CrossRef]
  4. Rogers, E.M. Diffusion of Innovations; The Free Press: New York, NY, USA, 2003. [Google Scholar]
  5. McMichael, M.; Shipworth, D. The value of social networks in the diffusion of energy-efficiency innovations in UK households. Energy Policy 2013, 53, 159–168. [Google Scholar] [CrossRef]
  6. Berger, J.; Iyengar, R. Communication channels and word of mouth: How the medium shapes the message. J. Consum. Res. 2013, 40, 567–579. [Google Scholar] [CrossRef]
  7. Krishnamutri, T.; Schwartz, D.; Davis, A.; Fischof, B.; de Bruin, W.B.; Lave, L.; Wang, J. Preparing for smart grid technologies: A behavioral decision research approach to understanding consumer expectations about smart meters. Energy Policy 2012, 41, 790–797. [Google Scholar] [CrossRef]
  8. Paetz, A.-G.; Duetschke, E.; Fichtner, W. Smart homes as a means to sustainable energy consumption: A study of consumer perceptions. J. Consum. Policy 2012, 35, 23–41. [Google Scholar] [CrossRef]
  9. Ellabban, O.; Abu-Rub, H. Smart grid customers’ acceptance and engagement: An overview. Renew. Sustain. Energy Rev. 2016, 65, 1285–1298. [Google Scholar] [CrossRef]
  10. Nachreiner, M.; Mack, B.; Matthies, E.; Tampe-Mai, K. An analysis of smart metering information systems: A psychological model of self-regulated behavioral change. Energy Res. Soc. Sci. 2015, 9, 85–97. [Google Scholar] [CrossRef]
  11. Gans, W.; Alberini, A.; Longo, A. Smart meter devices and the effect of feedback on residential electricity consumption: Evidence from a natural experiment in Northern Ireland. Energy Econ. 2013, 36, 729–743. [Google Scholar] [CrossRef]
  12. Faruqui, A.; Sergici, S. Household response to dynamic pricing of electricity—A survey of the experimental evidence. J. Regul. Econ. 2010, 38, 193–225. [Google Scholar] [CrossRef]
  13. Burchell, K.; Rettie, R.; Roberts, T. Householder engagement with energy consumption feedback: The role of community action and communications. Energy Policy 2016, 88, 178–186. [Google Scholar] [CrossRef]
  14. Ma, G.; Lin, J.; Li, N. Longitudinal assessment of the behavior-changing effect of app-based eco-feedback in residential buildings. Energy Build. 2018, 159, 486–494. [Google Scholar] [CrossRef]
  15. Podgornik, A.; Sucic, B.; Blazic, B. Effects of customized consumption feedback on energy efficient behavior in low-income households. J. Clean. Prod. 2016, 130, 25–34. [Google Scholar] [CrossRef]
  16. Schleich, J.; Faure, C.; Klobasa, M. Persistence of the effects of providing feedback alongside smart metering devices on household electricity demand. Energy Policy 2017, 107, 225–233. [Google Scholar] [CrossRef]
  17. Foulds, C.; Robison, R.; Macrorie, R. Energy monitoring as a practice: Investigating use of the i-measure online energy feedback tool. Energy Policy 2017, 104, 194–202. [Google Scholar] [CrossRef]
  18. Gerpott, T.; Paukert, M. Determinants of willingness to pay for smart meters: An empirical analysis of household customers in Germany. Energy Policy 2013, 61, 483–495. [Google Scholar] [CrossRef]
  19. Weron, T.; Kowalska-Pyzalska, A.; Weron, R. The role of educational trainings in the diffusion of smart metering platforms: An agent-based modeling approach. Phys. A Stat. Mech. Appl. 2018, 505, 591. [Google Scholar] [CrossRef]
  20. Good, N.; Ellis, K.; Mancarella, P. Review and classification of barriers and enablers of demand response in the smart grid. Renew. Sustain. Energy Rev. 2017, 16, 57–72. [Google Scholar] [CrossRef]
  21. Kahma, N.; Matschoss, K. The rejection of innovations? Rethinking technology diffusion and the non-use of smart energy services in Finland. Energy Res. Soc. Sci. 2017, 34, 27–36. [Google Scholar] [CrossRef]
  22. Gawlik, L. The Polish power industry in energy transformation process. Miner. Econ. 2017, 31, 229–237. [Google Scholar] [CrossRef] [Green Version]
  23. Rosicki, R. Poland’s energy policy: Main problems and forecasts. Srodkowoeuropejskie Stud. Polit. 2017, 2, 59–87. [Google Scholar] [CrossRef]
  24. Antosiewicz, M.; Nikas, A.; Szpor, A.; Witajewski-Baltvilks, J.; Doukas, H. Pathways for the transition of the Polish power sector and associated risks. Environ. Innov. Soc. Transit. 2019, in press. [Google Scholar] [CrossRef]
  25. Wierzbowski, M.; Filipak, I.; Lyzwa, W. Polish energy policy 2050. An instrument to develop a diversified and sustainable electricity generation mix in coal-based energy system. Renew. Sustain. Energy Rev. 2017, 74, 51–70. [Google Scholar] [CrossRef]
  26. Manowska, A.; Tobor-Osadnik, K.; Wyganowska, M. Economic and social aspects of restructuring Polish coal mining: Focusing on Poland and the EU. Resour. Policy 2017, 52, 192–200. [Google Scholar] [CrossRef]
  27. OptimalEnergy.pl. 2014. Reports on Polish Energy Market. Available online: https://optimalenergy.pl/ raport-o-rynku-energii-w-polsce/ (accessed on 14 May 2019).
  28. Institute of Renewable Energy. 2015. Poles Want to Produce Energy from RES-Results of the Latest Research Included in the Report: National Development Plan for Micro Installation of Renewable Energy Sources. Available online: https://ieo.pl/pl/aktualnosci/380-polacy-chc-produkowa-energi-z-oze-wyniki- najnowszych-bada-zawartych-w-raporcie-krajowy-plan-rozwoju-mikroinstalacji-odnawialnych-rode-energii (accessed on 14 May 2019).
  29. Nhede, N. Poland Invests in Smart Grid Rollout, Smart Energy International. 2017. Available online: https:// www.smart-energy.com/regional-news/europe-uk/energa-energy-distribution-system-operator-poland/ (accessed on 17 May 2019).
  30. Kowalska-Pyzalska, A.; Byrka, K. Determinants of the Willingness to Energy Monitoring by Residential Consumers: A Case Study in the City of Wroclaw in Poland. Energies 2019, 12, 907. [Google Scholar] [CrossRef]
  31. RAP. Report on the Polish Power System 2018; Version 2.0 Study commissioned by Agora Energie-Wende; Agora Energie-Wende: Berlin, Germany, 2018. [Google Scholar]
  32. Verbong, G.P.J.; Beemsterboer, S.; Sengers, F. Smart grids or smart users? Involving users in developing a low carbon electricity economy. Energy Policy 2013, 52, 117–125. [Google Scholar] [CrossRef]
  33. Meijer, F.; Straub, A.; Mlecnik, E. Impact of Home Energy Monitoring and Management Systems (HEMS): Triple-A: Stimulating the Adoption of Low-Carbon Technologies by Homeowners through Increased Awareness and Easy Access D2.1.1; Report on Impact of HEMS; Interreg: Lille, France, 2018. [Google Scholar]
  34. Ofgem. Energy Demand Research Project Final Analysis; OFGEM: London, UK, 2011. [Google Scholar]
  35. Star, A.; Isaacson, M.; Haeg, D.; Kotewa, L. The dynamic pricing mousetrap: Why isn’t the world beating down our door? In Proceedings of the ACEEE Summer Study on Energy Efficiency in Buildings 2010, Pacific Grove, CA, USA, 15–20 August 2010; Volume 2, pp. 257–268. [Google Scholar]
  36. UK Department of Energy and Climate Change. Written Evidence Submitted by the Department of Energy and Climate Change (SME0031); UK Department of Energy and Climate Change: London, UK, 2016.
  37. British Infrastructure Group. Not So Smart—A Comprehensive Investigation into the Roll-Out of Energy Smart Meters; British Infrastructure Group: London, UK, 2018. [Google Scholar]
  38. Claudy, M.C.; Michelsen, C.; ODriscoll, A.; Mullen, M.R. Consumer awareness in the adoption of microgeneration technologies. An empirical investigation in the Republic of Ireland. Renew. Sustain. Energy Rev. 2010, 14, 2154–2160. [Google Scholar] [CrossRef]
  39. Frederiks, E.; Stenner, K.; Hobman, E. Household energy use. Applying behavioral economics to understand consumer decision making and behavior. Renew. Sustain. Energy Rev. 2014, 41, 1385–1394. [Google Scholar] [CrossRef]
  40. Abidin, S.Z.; Omar, N.; Rahman, H.F.; Rosli, M.M. Socio-informatics: Identifying influential factors in digital elements. In Proceedings of the 14th WSEAS international conference on Computers: Part of the 14th WSEAS CSCC multiconference-Volume I, Corfu Island, Greece, 23–25 July 2010; World Scientific and Engineering Academy and Society (WSEAS): Cambridge, UK, 2010; pp. 397–402. [Google Scholar]
  41. Hanna, R.; Rohm, A.; Crittenden, V. We’re all connected: The power of the social media ecosystem. Bus. Horizons 2011, 54, 265–273. [Google Scholar] [CrossRef]
  42. Ma, L.; Lee, C.S.; Goh, D.H. Understanding news sharing in social media: An explanation from the diffusion of innovations theory. Online Inf. Rev. 2014, 38, 598–615. [Google Scholar] [CrossRef]
  43. Chawla, Y.; Chodak, G. Recommendations for Social Media Activities to Positively Influence the Economic Factors. In Double-Blind Peer-Review Proceedings Part I. of the International Scientific Conference Hradec Economic Days 2018, 30–31 January 2018; Jedlička, P., Marešová, P., Soukal, I., Eds.; University of Hradec Králové: Hradec Králové, Czech Republic, 2018; Volume 8, pp. 328–338. ISSN 2464-6059. [Google Scholar]
  44. Reid, C.K. The state of digital advertising. EContent 2014, 37, 16–17. [Google Scholar]
  45. Yang, B.; Liu, Y.; Liang, Y.; Tang, M. Exploiting user experience from online customer reviews for product design. Int. J. Inf. Manag. 2019, 46, 173–186. [Google Scholar] [CrossRef]
  46. Heinonen, S.; Hiltunen, E. Creative Foresight Space and the Futures Window: Using visual weak signals to enhance anticipation and innovation. Futures 2012, 44, 248–256. [Google Scholar] [CrossRef]
  47. Daelemans, W. Keynote: Profiling the Personality of Social Media Users; In of the Final Workshop 7 December 2016; ELRA: Naples, Italy, 2016; p. 18. [Google Scholar]
  48. Booth, N.; Matic, J. Mapping and leveraging influencers in social media to shape corporate brand perceptions. Corp. Commun. Int. J. 2011, 16, 184–191. [Google Scholar] [CrossRef]
  49. Amblee, N.; Bui, T. Harnessing the Influence of Social Proof in Online Shopping: The Effect of Electronic Word of Mouth on Sales of Digital Microproducts. Int. J. Electron. Commer. 2011, 16, 91–114. [Google Scholar] [CrossRef]
  50. Moraitis, O.T.P.; Kausika, B.B.; Van Der Velde, H.; Hart’T, S.; De Vries, A.; De Rijk, P.; De Jong, M.M.; Van Leeuwen, H.; Van Sark, W. Three years experience in a Dutch public awareness campaign on photovoltaic system performance. IET Renew. Power Gener. 2017, 11, 1229–1233. [Google Scholar] [Green Version]
  51. Wu, Y.; Xie, L.; Huang, S.; Li, P.; Yuan, Z.; Liu, W. Using social media to strengthen public awareness of wildlife conservation. Ocean. Coast. Manag. 2018, 153, 76–83. [Google Scholar] [CrossRef]
  52. Dufty, N. The use of social media in countrywide disaster risk reduction public awareness strategies. Aust. J. Emerg. Manag. 2015, 30, 12–16. [Google Scholar]
  53. Rubin, G.D.; Krishnaraj, A.; Mahesh, M.; Rajendran, R.R.; Fishman, E.K. Enhancing Public Access to Relevant and Valued Medical Information: Fresh Directions for RadiologyInfo.org. J. Am. Coll. Radiol. 2017, 14, 697–702. [Google Scholar] [CrossRef]
  54. Ghazali, Z.; Zahid, M.; Kee, T.S.; Yussoff Ibrahim, M. A step towards sustainable society: The awareness of carbon dioxide emissions, climate change and carbon capture in Malaysia. Int. J. Econ. Financ. Issues 2016, 6, 179–187. [Google Scholar]
  55. Poulopoulos, V.; Vassilakis, C.; Antoniou, A.; Lepouras, G.; Wallace, M. Personality Analysis of Social Media Influencers as a Tool for Cultural Institutions; Springer: Cham, Switzerland, 2018. [Google Scholar]
  56. Meena, L.; Alamelu, R.; Amudha, R.; Nalini, R.; Motha, L.C.S. Public awareness towards India Innovation Lab for Green Finance. Int. J. Econ. Res. 2017, 14, 391–400. [Google Scholar]
  57. Bertr, P.J.; Niles, S.L.; Newman, D.J. Human Spaceflight in Social Media: Promoting Space Exploration Through Twitter. New Space 2015, 3, 117–133. [Google Scholar] [CrossRef]
  58. Mohammadi, N.; Wang, Q.; Taylor, J.E. Diffusion dynamics of energy saving practices in large heterogeneous online networks. PLoS ONE 2016, 11, e0164476. [Google Scholar] [CrossRef]
  59. Gaál, Z.; Szabó, L.; Obermayer-Kovács, N.; Csepregi, A. Exploring the role of social media in knowledge sharing. Electron. J. Knowl. Manag. 2015, 13, 185–197. [Google Scholar]
  60. Rada, M. Industry 5.0 Definition, Medium.com, 21 July 2018. Available online: https://medium.com/@michael.rada/industry-5-0-definition-6a2f9922dc48 (accessed on 30 April 2019).
  61. Gouws, T.; Van Rheede van Oudtshoorn, G.P. Correlation between brand longevity and the diffusion of innovations theory. J. Public Aff. 2011, 11, 236–242. [Google Scholar] [CrossRef]
  62. Wuestenhagen, R.; Wolsink, M.; Buerer, M.J. Social acceptance of renewable energy innovation: An introduction to the concept. Energy Policy 2007, 35, 2683–2691. [Google Scholar] [CrossRef] [Green Version]
  63. Wolsink, M. Distributed generation of sustainable energy as a common pool resource: Social acceptance in rural setting of smart (micro-) grid configurations. In New Rural Spaces: Towards Renewable Energies, Multifunctional Farming, and Sustainable Tourism; Frantál, B., Martinát, S., Eds.; University of Amsterdam: Amsterdam, The Netherlands, 2014; pp. 36–47. [Google Scholar]
  64. Buchanan, K.; Banks, N.; Preston, I.; Russo, R. The British public’s perception of the UK smart metering initiative: Threats and opportunities. Energy Policy 2016, 91, 87–97. [Google Scholar] [CrossRef]
  65. van der Werff, E.; Steg, L. The psychology of participation and interest in smart energy systems: Comparing the value-belief-norm theory and the value-identity-personal norm mode. Energy Res. Soc. Sci. 2016, 22, 107–114. [Google Scholar] [CrossRef]
  66. Wallenborn, G.; Orsini, M.; Vanhaverbeke, J. Household appropriation of electricity monitors. Int. J. Consum. Stud. 2011, 35, 146–152. [Google Scholar] [CrossRef]
  67. Hargreeaves, T.; Nye, M.; Burgess, J. Keeping energy visible? Exploring how households interact with feedback from smart energy monitors in the longer term. Energy Policy 2013, 52, 126–134. [Google Scholar] [CrossRef]
  68. Kowalska-Pyzalska, A. What makes consumers adopt to innovative energy services in the energy market? A review of incentives and barriers. Renew. Sustain. Energy Rev. 2018, 82, 3570–3581. [Google Scholar] [CrossRef]
  69. Allcott, H. Social norms and energy conservation. J. Public Econ. 2011, 95, 1082–1095. [Google Scholar] [CrossRef] [Green Version]
  70. Nolan, J.; Schultz, P.; Cialdini, R.; Goldstein, N.; Griskevicius, V. Normative social influence is underdetected. Personal. Soc. Psychol. Bull. 2008, 34, 913–923. [Google Scholar] [CrossRef]
  71. Khan, M.Z.; Miankhel, A.K.; Nawaz, A. Information & Communication Technology and ‘Individual’: Prospects & Concerns. Glob. J. Comput. Sci. Technol. 2013, 13. Available online: https://computerresearch.org/index.php/computer/article/view/387 (accessed on 18 July 2019).
  72. Kowalska-Pyzalska, A.; Maciejowska, K.; Suszczyński, K.; Sznajd-Weron, K.; Weron, R. Turning green: Agent-based modeling of the adoption of dynamic electricity tariffs. Energy Policy 2014, 71, 164–174. [Google Scholar] [CrossRef]
  73. RWE Report. What Poles Think about the Energy Market? The Report for RWE Polska S.A. 2014. Available online: https://www.innogy.pl/en/about/about-group (accessed on 12 May 2019). (In Polish).
  74. Podsakoff, P.M.; MacKenzie, S.B.; Lee, J.-Y.; Podsakoff, N.P. Common method biases in behavioral research: A critical review of the literature and recommended remedies. J. Appl. Psychol. 2003, 88, 879–903. [Google Scholar] [CrossRef]
  75. Podsakoff, P.M.; MacKenzie, S.B.; Podsakoff, N.P. Sources of method bias in social science research and recommendations on how to control it. Annu. Rev. Psychol. 2012, 63, 539–569. [Google Scholar] [CrossRef]
Figure 1. Research framework.
Energies 12 02759 g001
Figure 2. Distribution of respondents’ belongings of smart devices and personal assets.
Energies 12 02759 g002
Figure 3. Decisions to install SM.
Energies 12 02759 g003
Table 1. Definitions of the variables and coding (N = 505).
VariableCodeDescription
GenderD1nominal variable
AgeD2ordinal variable
Marital statusD3nominal variable
EducationD4ordinal variable
Occupation/EmploymentD5nominal variable
Household’s income (in PLN per month)D6interval variable
Electricity bill (in PLN per month)D7interval variable
Household sizeD8ordinal variable
Number of childrenD81ordinal variable
Type of a houseD9nominal variable
Place of a livingD10ordinal variable
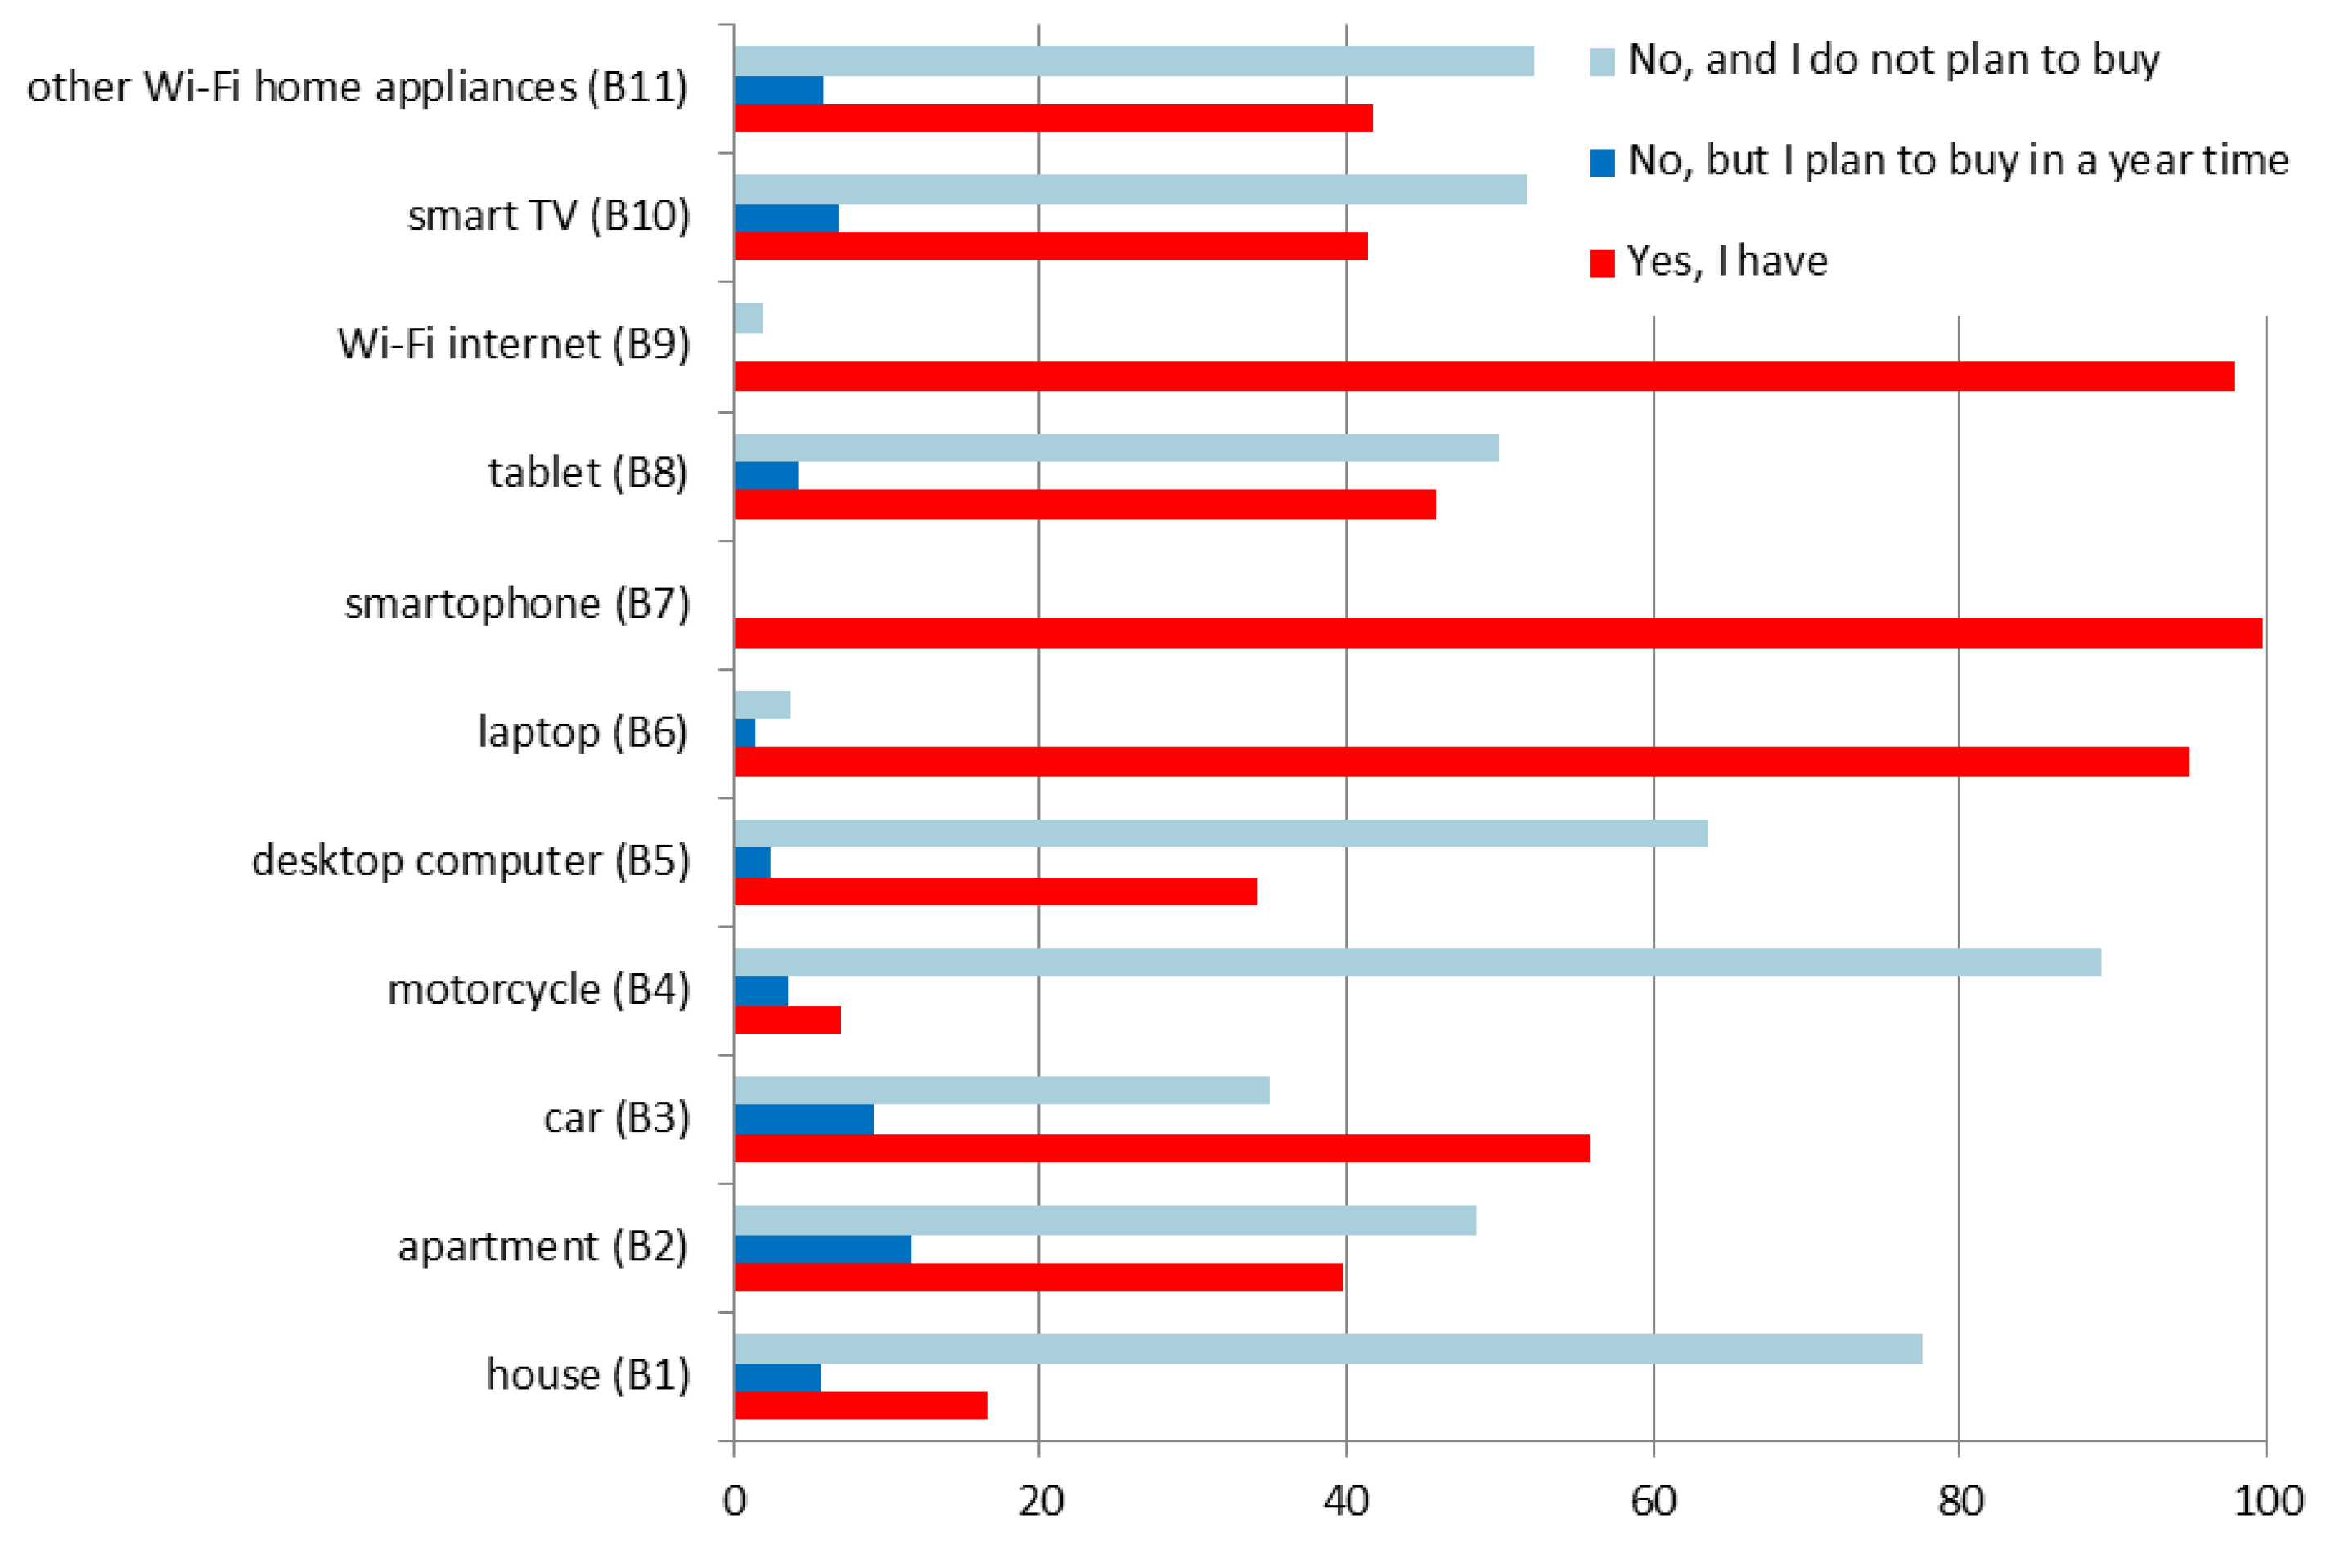
Belongings (of smart devices & personal assets)B1–B11 (1) yes/(2) no, but I plan to buy it in a year time/(3) no, and I do not plan to buy it
Regular monitoring of energy usageA1 (1) yes/(2) no/(3) hard to say
Renewable energy sources installed at the householdR1 (1) yes/(2) no/(3) hard to say
Source of information regarding electricity (prices, new offers, etc.)S1–S13nominal variable
Knowledge about SMK1–K5 (1) yes/(2) no/(3) hard to say
Source of information regarding SMI1–I8 (1) yes/(2) no/(3) hard to say
Social influenceW1–W3 (1) yes/(2) no/(3) hard to say
Preferences regarding the role of the government in SM enrollmentG1–G3(1) yes/(2) no/(3) hard to say
Preferences regarding SM platformsP1–P6 (1) yes/(2) no/(3) hard to say
Concerns about SM usageF1–F4 (1) yes/(2) no/(3) hard to say
Decisions to install SM D e 1 D e 6  (1) yes/(2) no/(3) hard to say
Table 2. Frequencies of the demographic variables (D1–D10).
VariableFrequencies
Gender (D1)female 61.4%
male 38.6%
Age (D2)18–25 years old 35.2%
26–35 years old 41.2%
36–45 years old 18.8%
46–55 years old 3.4%
over 56 years old 1.4%
Marital status (D3)single 41%
married 28.5%
divorced/separated 4.2%
in a relationship 25.5%
widowed 0.8%
Education (D4)high class pass 22.5%
bachelor complete 26.6%
masters complete 44.7%
PhD complete 6.6%
Occupation/Employment (D5)full time job in private sector 35.45%
full time job in state sector 8.51%
part time job in private sector 2.97%
part time job in state sector 1.39%
own business 12.08%
unemployed 2.77%
student in college/university 16.24%
high school student (above 18 years old) 4.95%
others (combining 2 or 3 of upper categories) 15.64%
Household’s income (in PLN per month) (D6)less than 1000 PLN 6.5%
1001 to 2500 PLN 9.7%
2501 to 4000 PLN 17.6%
4001 to 5000 PLN 12.1%
5001 to 6000 PLN 10.9%
6001 to 7000 PLN 7.5%
7001 to 8000 PLN 6.3%
8001 to 10,000 PLN 10.9%
more than 10,000 18.4%
Electricity bill (in PLN per month) (D7)0 to 20 PLN 3.8%
21 to 40 PLN 5.0%
41 to 60 PLN 11.4%
61 to 80 PLN 12.4%
81 to 100 PLN 19.8%
101 to 150 22.8%
151 to 200 12.2%
201 to 250 5.4%
251 to 300 3.0%
more than 300 PLN 4.0%
Household size (D8)M = 2.65, SD = 1.29 (where the integer number indicates the number of family members)
Number of children (D81)M = 1.45, SD = 0.83 (where (1) indicates no kids, (2) 1 kid, (3) 2 kids and so on)
Type of a house (D9)apartment/flat (in a 4 stored building) 64.8%
apartment/flat (in a more than 4 stored building) 27.1%
house (only ground floor) 3.2%
house (ground and upper floor) 5.0%
Place of a living (D10)village 8.5%
city up to 50,000 inh. 10.7%
city 50,000 to 1,001,000 inh. 5.9%
city 100,000 to 500,000 inh. 11.9%
city more than 500,000 inh. 63%
Table 3. Willingness to accept/install SM (Notation: (1) yes, (2) no (3) hard to say).
OptionDescription
D e 1 
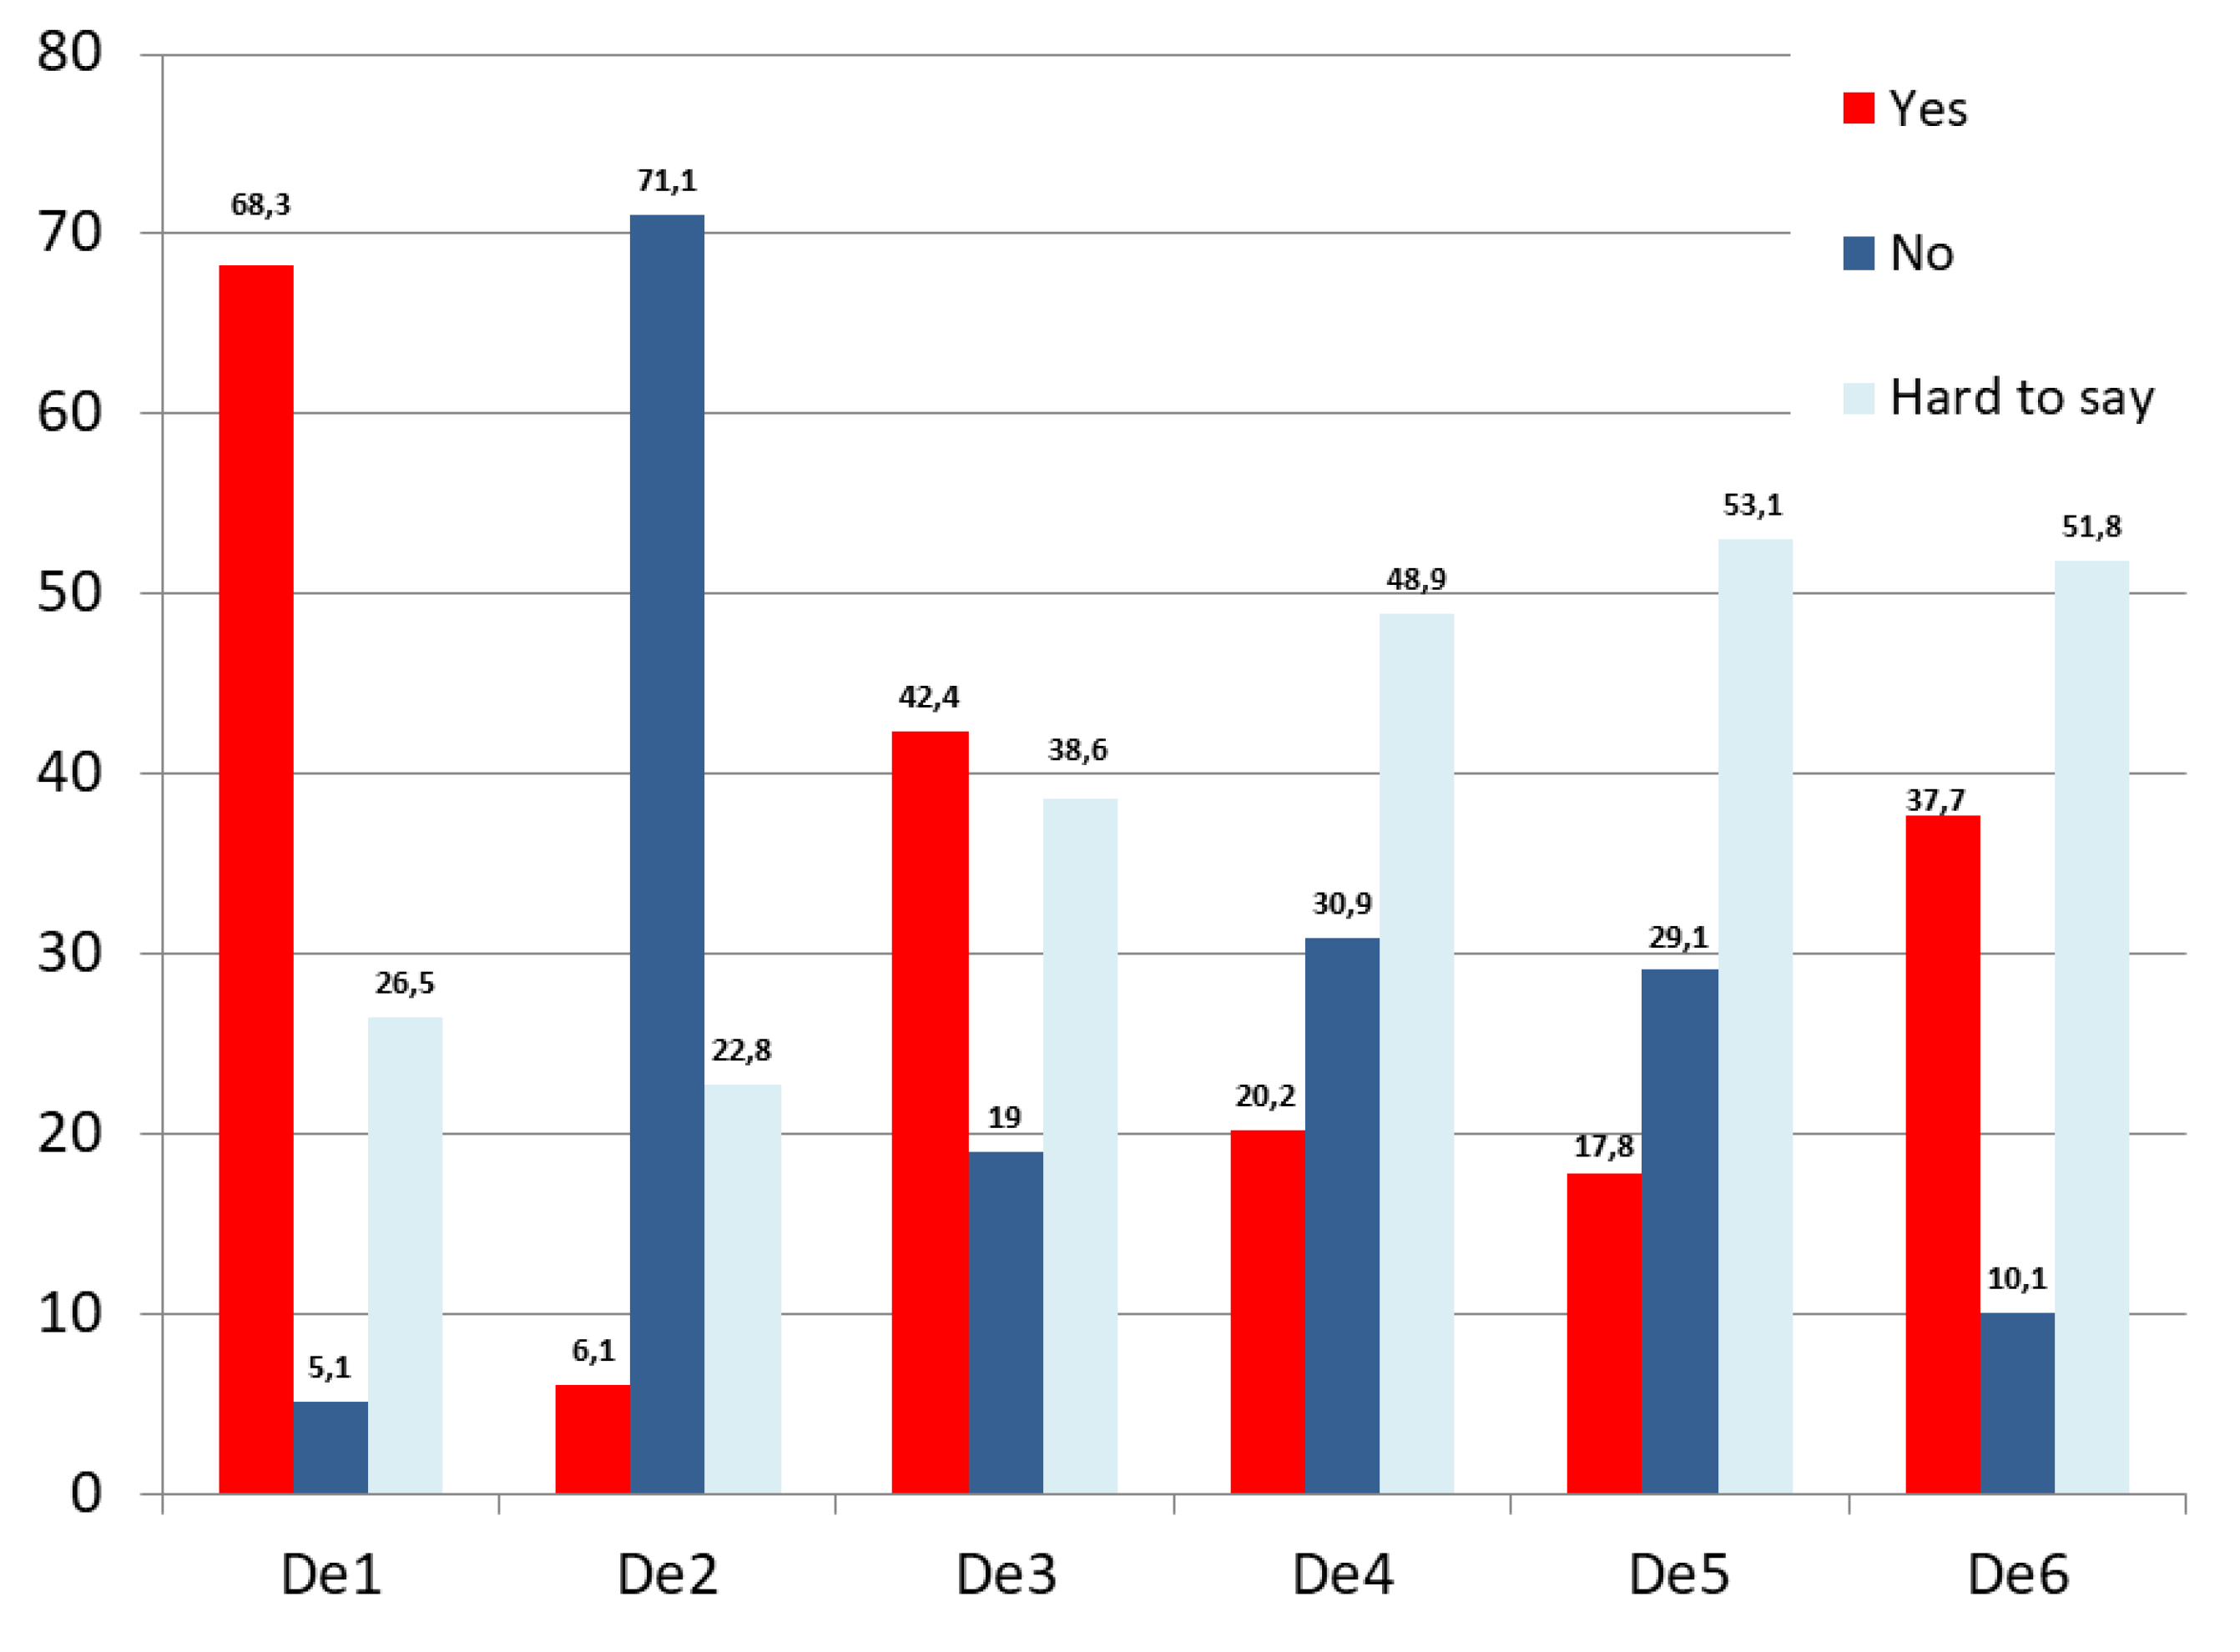
If SM can help you to save energy/money, would you decide to install it?68.3% yes; 5.1% no;
26.5% hard to say;
(M = 1.58; SD = 0.88)
D e 2 If SM can help you save energy/money, but may have bad impact on your health, would you decide to install it?6.1% yes; 71.1% no;
22.8% hard to say;
(M = 2.16; SD = 0.51)
D e 3 If SM can help you save energy/money, and does not have an impact on your health, but energy companies will know all the details about your energy consumption, would you decide to install SM?42.4% yes; 19% no;
38.6% hard to say;
(M = 1.96; SD = 0.90)
D e 4 Would you decide to install SM, if the representative of the energy supplier would visit your house and present you the benefits?20.2% yes; 30.9% no;
48.9% hard to say;
(M = 2.28; SD = 0.78)
D e 5 Would you decide to install SM, if you have to pay for the installation?17.8% yes; 29.1% no;
53.1% hard to say;
(M = 2.35; SD = 0.76)
D e 6 Would you decide to install SM, if you did not have to pay for the installation?37.7% yes; 10.1% no;
51.8% hard to say;
(M = 2.13; SD = 0.95)
Table 4. Estimation results for ordered logit model (N = 496).
D e 1 D e 2 D e 3 D e 4 D e 5 D e 6
D1 0 . 204 (0.23) 0 . 141 (0.22) 0 . 276 (0.19) 0 . 048 (0.19) 0 . 137 (0.2) 0 . 171 (0.21)
D2 0 . 193 (0.14) 0 . 283 * (0.14) 0 . 163 (0.12) 0 . 220 * (0.12) 0 . 156 (0.12) 0 . 067 (0.14)
D3 0 . 078 (0.09) 0 . 146 * (0.09) 0 . 094 (0.08) 0 . 041 (0.08) 0 . 049 (0.08) 0 . 051 (0.08)
D4 0 . 060 (0.14) 0 . 058 (0.13) 0 . 113 (0.12) 0 . 225 (0.12) 0 . 194 (0.12) 0 . 038 (0.13)
D5 0 . 009 (0.02) 0 . 004 (0.02) 0 . 020 (0.02) 0 . 004 (0.02) 0 . 025 (0.02) 0 . 013 (0.02)
D6 0 . 052 (0.04) 0 . 051 (0.04) 0 . 071 * (0.04) 0 . 105 ** (0.04) 0 . 006 (0.04) 0 . 013 (0.04)
D7 0 . 045 (0.06) 0 . 073 (0.06) 0 . 009 (0.05) 0 . 048 (0.05) 0 . 010 (0.05) 0 . 046 (0.06)
D8 0 . 198 ** (0.1) 0 . 082 (0.1) 0 . 143 * (0.08) 0 . 010 (0.08) 0 . 045 (0.08) 0 . 039 (0.09)
D9 0 . 167 (0.15) 0 . 049 (0.14) 0 . 089 (0.12) 0 . 107 (0.12) 0 . 121 (0.13) 0 . 046 (0.13)
D10 0 . 159 * (0.09) 0 . 003 (0.08) 0 . 010 (0.07) 0 . 051 (0.07) 0 . 069 (0.08) 0 . 085 (0.08)
B 0 . 057 (0.4) 0 . 202 (0.4) 0 . 029 (0.3) 0 . 167 (0.3) 0 . 096 (0.32) 0 . 036 (0.32)
K 0 . 540 (0.41) 0 . 299 (0.38) 0 . 188 (0.33) 0 . 032 (0.32) 0 . 007 (0.33) 1 . 121 (0.23)
W 0 . 033 (0.26) 0 . 005 (0.24) 0 . 808 *** (0.22) 1 . 212 *** (0.22) 1 . 279 *** (0.23) 1 . 121 *** (0.23)
G 0 . 383 * (0.21) 0 . 679 *** (0.21) 0 . 036 (0.18) 0 . 149 (0.18) 0 . 578 *** (0.19) 0 . 613 ** (0.20)
P 1 . 586 *** (0.25) 0 . 701 *** (0.23) 0 . 790 *** (0.21) 0 . 245 (0.21) 0 . 125 (0.22) 0 . 680 ** (0.23)
F 0 . 676 ** (0.27) 0 . 444 * (0.26) 0 . 214 (0.22) 0 . 372 (0.22) 1 . 018 *** (0.23) 0 . 167 (0.66)
I 0 . 417 (0.72) 0 . 001 (0.67) 0 . 854 (0.63) 0 . 493 (0.6) 0 . 088 (0.6) 0 . 167 (0.67)
SO 1 . 704 * (0.91) 0 . 644 (0.9) 0 . 807 (0.77) 0 . 741 (0.78) 0 . 744 (0.79) 0 . 443 * (0.35)
R1 0 . 179 (0.38) 0 . 056 (0.37) 0 . 007 (0.35) 0 . 014 (0.33) 0 . 090 (0.37) 0 . 443 (0.35)
A1 0 . 293 (0.23) 0 . 238 (0.22) 0 . 035 (0.19) 0 . 162 (0.2) 0 . 157 (0.2) 7 . 421 (1.63)
cut1 3 . 655 ** (1.66) 0 . 278 (1.54) 5 . 8551 *** (1.52) 2 . 939 ** (1.40) 4 . 83 5 *** (1.5) 1 . 677 *** (1.69)
cut2 3 . 965 ** (1.66) 4 . 147 *** (1.55) 6 . 751 *** (1.52) 4 . 610 *** (1.41) 6 . 618 *** (1.51) 4 . 421 *** (1.63)
LL−331.49−337.95−473.20−463.16−427.62−402.57
Note: *** p < 0 . 001 , ** p < 0 . 01 , * p < 0 . 05 (two-tailed test); Standard errors in brackets. LL stands for Log-Likelihood.
Table 5. Estimation results for tobit model (N = 496).
D e 1 D e 2 D e 3 D e 4 D e 5 D e 6
D1 0 . 163 (0.15) 0 . 038 (0.17) 0 . 147 (0.11) 0 . 046 (0.09) 0 . 015 (0.08) 0 . 056 (0.08)
D2 0 . 155 * (0.09) 0 . 241 ** (0.12) 0 . 084 (0.07) 0 . 103 * (0.06) 0 . 107 ** (0.06) 0 . 039 (0.05)
D3 0 . 031 (0.06) 0 . 128 * (0.07) 0 . 025 (0.04) 0 . 019 (0.04) 0 . 011 (0.03) 0 . 017 (0.03)
D4 0 . 017 (0.09) 0 . 003 (0.11) 0 . 064 (0.07) 0 . 097 * (0.06) 0 . 063 (0.05) 0 . 010 (0.05)
D5 0 . 005 (0.01) 0 . 008 (0.02) 0 . 006 (0.01) 0 . 004 (0.01) 0 . 010 (0.01) 0 . 002 (0.01)
D6 0 . 055 * (0.03) 0 . 002 (0.03) 0 . 021 (0.02) 0 . 049 *** (0.02) 0 . 003 (0.02) 0 . 008 (0.02)
D7 0 . 022 (0.04) 0 . 052 (0.04) 0 . 011 (0.03) 0 . 005 (0.02) 0 . 006 (0.02) 0 . 017 (0.02)
D8 0 . 040 (0.06) 0 . 051 (0.07) 0 . 031 (0.05) 0 . 041 (0.04) 0 . 032 (0.03) 0 . 029 (0.03)
D9 0 . 148 (0.1) 0 . 053 (0.1) 0 . 028 (0.1) 0 . 034 (0.06) 0 . 005 (0.05) 0 . 014 (0.05)
D10 0 . 112 * (0.06) 0 . 009 (0.06) 0 . 014 (0.04) 0 . 005 (0.03) 0 . 028 (0.031) 0 . 037 (0.03)
B 0 . 128 (0.23) 0 . 218 (0.27) 0 . 072 (0.18) 0 . 076 (0.15) 0 . 024 (0.13) 0 . 002 (0.13)
K 0 . 511 * (0.27) 0 . 073 (0.29) 0 . 232 (0.19) 0 . 045 (0.15) 0 . 056 (0.14) 0 . 203 (0.14)
W 0 . 235 (0.17) 0 . 011 (0.19) 0 . 448 *** (0.13) 0 . 472 *** (0.10) 0 . 361 *** (0.09) 0 . 501 *** (0.09)
G 0 . 271 ** (0.13) 0 . 634 *** (0.16) 0 . 116 (0.10) 0 . 135 (0.08) 0 . 252 *** (0.08) 0 . 229 *** (0.07)
P 0 . 891 *** (0.16) 0 . 436 ** (0.18) 0 . 107 (0.12) 0 . 061 (0.1) 0 . 203 ** (0.09) 0 . 083 (0.08)
F 0 . 274 (0.17) 0 . 073 (0.2) 0 . 385 *** (0.13) 0 . 322 *** (0.11) 0 . 502 *** (0.1) 0 . 194 ** (0.09)
I 0 . 089 (0.46) 0 . 171 (0.49) 0 . 635 * (0.37) 0 . 181 (0.28) 0 . 288 (0.26) 0 . 121 (0.25)
SO 0 . 907 (0.58) 0 . 234 (0.65) 0 . 679 (0.44) 0 . 002 (0.36) 0 . 052 (0.32) 0 . 739 ** (0.32)
R1 0 . 179 (0.24) 0 . 247 (0.27) 0 . 190 (0.19) 0 . 081 (0.15) 0 . 035 (0.14) 0 . 109 (0.14)
A1 0 . 255 * (0.15) 0 . 219 (0.17) 0 . 009 (0.11) 0 . 115 (0.09) 0 . 017 (0.08) 0 . 041 (0.08)
const 1 . 567 (1.08) 0 . 654 (1.15) 2 . 477 *** (0.88) 0 . 305 (0.66) 0 . 441 (0.61) 1 . 054 * (0.6)
LL−344.08−335.59−433.85−476.95−464.31−446.32
C h i 2 (20)70.92 p < 0 . 001 41.35 p = 0 . 003 71.65 p < 0 . 001 74.95 p < 0 . 001 108.98 p < 0 . 001 134.95 p < 0 . 001
Note: *** p < 0 . 001 , ** p < 0 . 01 , * p < 0 . 05 (two-tailed test); Standard errors in brackets. LL stands for Log-Likelihood; C h i 2 stands for Chi-square test.

