1. Introduction
The demand for energy in various countries is increasing with the continued development of modern society. The resources of traditional fossil fuels have diminished due to years of exploitation and utilization, and the world is facing an increasingly severe energy crisis. The natural gas hydrates that have been discovered thus far offer potential energy sources with which fossil fuels may be replaced. Natural gas hydrates are generally formed in low-temperature and high-pressure environments, and are mainly stored on deep-sea slopes and in permafrost regions [
1,
2]. Gas hydrates, primarily composed of methane, are naturally distributed across various regions worldwide. Because their shapes are similar to those of ice, they are often called “combustible ice.” According to one survey, the reserves of natural gas hydrates may be 2.1 × 10
16 m
3, and the decomposition of methane hydrates at approximately one atmosphere can produce ~160 m
3 of methane gas and ~0.87 m
3 of free water [
3]. It is estimated that this is roughly twice as much as all carbonaceous fossil fuel reserves in the world [
4].
Methane hydrate has attracted worldwide attention due to its wide distribution, large scale development, and high energy storage density. Extensive research on hydrates has been conducted in China, the United States, Japan, Canada, and other countries. At present, the methane hydrate mining methods proposed primarily include injection [
5], pressure reduction [
6], chemical reagents, and CO
2 replacement [
7]. During the mining process, artificially breaking the stable conditions of the hydrate will cause it to decompose. Studies have shown that hydrates are cemented between sediments, which enhances the strength of seafloor sediments. In the process of hydrate mining, the hydrate will gradually decompose, the cementation and filling of the hydrate will be reduced, and the bearing capacity of the bottom layer will be greatly reduced. This may cause a series of geological disasters, if occurring at the bottom of the sea, including large tsunami and submarine landslides [
8,
9]. Therefore, it is very important to study the mechanical properties of hydrate-bearing sediments.
Since methane hydrates are mainly distributed in the deep sea and in permafrost regions, the cost of obtaining in-situ hydrated sediment cores for research is high and poses technical difficulties. Therefore, laboratory-synthesized gas hydrates are currently used as samples to study the relevant properties and various parameters of natural hydrates. The mechanical properties of hydrate sediments are mainly affected by hydrate saturation, confining pressure, sediment particle size, and sediment type. Researchers worldwide have performed studies on some of these properties. Winters et al. [
10,
11] used stored sand to study the effects of sediment type and porosity on hydrate sediments., and Hyodo et al. [
12,
13,
14] used in-situ synthesis and mixed sample preparation methods to study the sedimentation, temperature, hydrate formation states (e.g., gas saturation formation, water saturation generation), and other hydrate formations in different sediments. The influence of mechanical properties indicates that the strength of hydrate sediments increases with the increase of hydrate saturation and confining pressure, and the strength of gas-saturated hydrate sediments is higher than that of other hydrate sediments under the same conditions. Moreover, Li et al. [
15,
16] studied the influence of hydrates on confining pressure and noted that the strength of hydrate sediments increased with the increase of confining pressure under certain conditions. Meanwhile, Song et al. [
17,
18] studied the effects of different temperatures and confining pressures on hydrate sediments. It is believed that under certain conditions, an increase in confining pressure will lead to an increase in the strength of hydrate sediments, as well as increases in temperature and shear rate, leading to an increase in shear strength.
Masui et al. [
19] analyzed natural gas hydrates obtained from the South China Sea Trough in 2004 and synthesized matching hydrate sediment samples in the laboratory, with the original particle distribution, and distributed the two sets of samples for triaxial compression experiments. They concluded that the strengths of the natural and laboratory-synthesized hydrate sediments were consistent, and that the volume deformation characteristics were also the same. In order to study the effects of sand particle size on the mechanical properties of natural gas hydrate sediments, Miyazaki et al. [
20] used Toyoura sand with three particle sizes as hydrate sediments, with median particle sizes (d50) of 0.230 mm, 0.205 mm, and 0.130 mm. The material skeleton was subjected to a drainage triaxial compression experiment under a constant temperature of 287 K. Their results showed that the strength of methane hydrate sediments increases with the saturation of hydrates and the effective confining pressure. Moreover, the strength of the hydrate sediments had little impact on the change in sand particle sizes, and the stiffness of the hydrate sediments was affected by the sand skeleton.
Kajiyama et al. [
21] used circular glass beads and natural sand as the skeleton of methane hydrate deposits, and then performed a series of triaxial compression experiments on the two hydrate deposits to study their mechanical properties. The effects of particle characteristics on the mechanical properties of the methane-bearing hydrate sand were explained from the perspective of particle size. The stiffness of the glass bead skeleton and the reservoir sand was relatively uniform, but the maximum breaking strength was achieved in a short period of time. The apparent post-peak-strain softening behavior of the glass beads containing methane hydrate was observed experimentally. The main reason for the increase in the shear strength of the hydrate deposit with the glass bead skeleton was cohesion, but the shear strength of the natural sand containing methane hydrate was jointly controlled by the cohesive force and the internal angle of friction. This caused the strength of the methane hydrate deposit in the natural sand skeleton to increase with the increase of the effective confining pressure, while the methane hydrate deposit in the glass bead skeleton had greater cohesion under relatively low pressures. In strong sediments and at higher effective confining pressures, cohesion will be greatly reduced due to the detachment of hydrates.
Hyodo et al. [
14,
22] used a self-made hydrate triaxial compression instrument to synthesize methane hydrate sediments using three grits with different densities as the methane sediment skeleton and by adding different contents of fine particles to the sand. They concluded that the addition of fine particles had a significant effect on the porosity of the sedimentary skeleton, and the fine particles filled in between the hydrate sediment skeletons, making the sample more compact and the initial porosity of the sample lower. Due to this lower porosity, the methane hydrate formed more severely hindered the movement of the particles, thereby increasing the strength of the entire methane hydrate sample. The porosity of the hydrate sediment samples was inversely proportional to the percentage of fine particles, and the strength of the hydrate sediments also increased. Additionally, the effects of fine particles on pure sand sediments and methane hydrate sediments differed. The presence of fine particles increased the strength of methane hydrate sediments and methane hydrates during triaxial shearing; meanwhile, dilatation occurred in the sediments, and pure sand sediments underwent shearing.
Many researchers have studied the mechanical properties of hydrate sediments. Most of this research has been focused on understanding the effects of sediments under single-variable conditions. However, fine-grained sediments host more than 90% of the accumulated global gas hydrates [
23,
24,
25]; these accumulations of hydrate-bearing clayey sediments include those in the Gulf of Mexico, Krishna–Godavari Basin, Blake Ridge, Cascadia Margin, Ulleung Basin, Hydrate Ridge [
26], and South China Sea [
27]. Therefore, it is necessary to study the influence of clay content on the mechanical properties of sediments under multifactorial conditions. In this study, quartz sands with different proportions of clay were used as sediment skeletons, and the effects of clay content on the mechanical properties of hydrate sediments were studied using multi-stage loading triaxial compression tests combined with hydrate decomposition [
28].
3. Results and Discussion
3.1. Stress–Strain Relationship of Sediments with Different Clay Contents
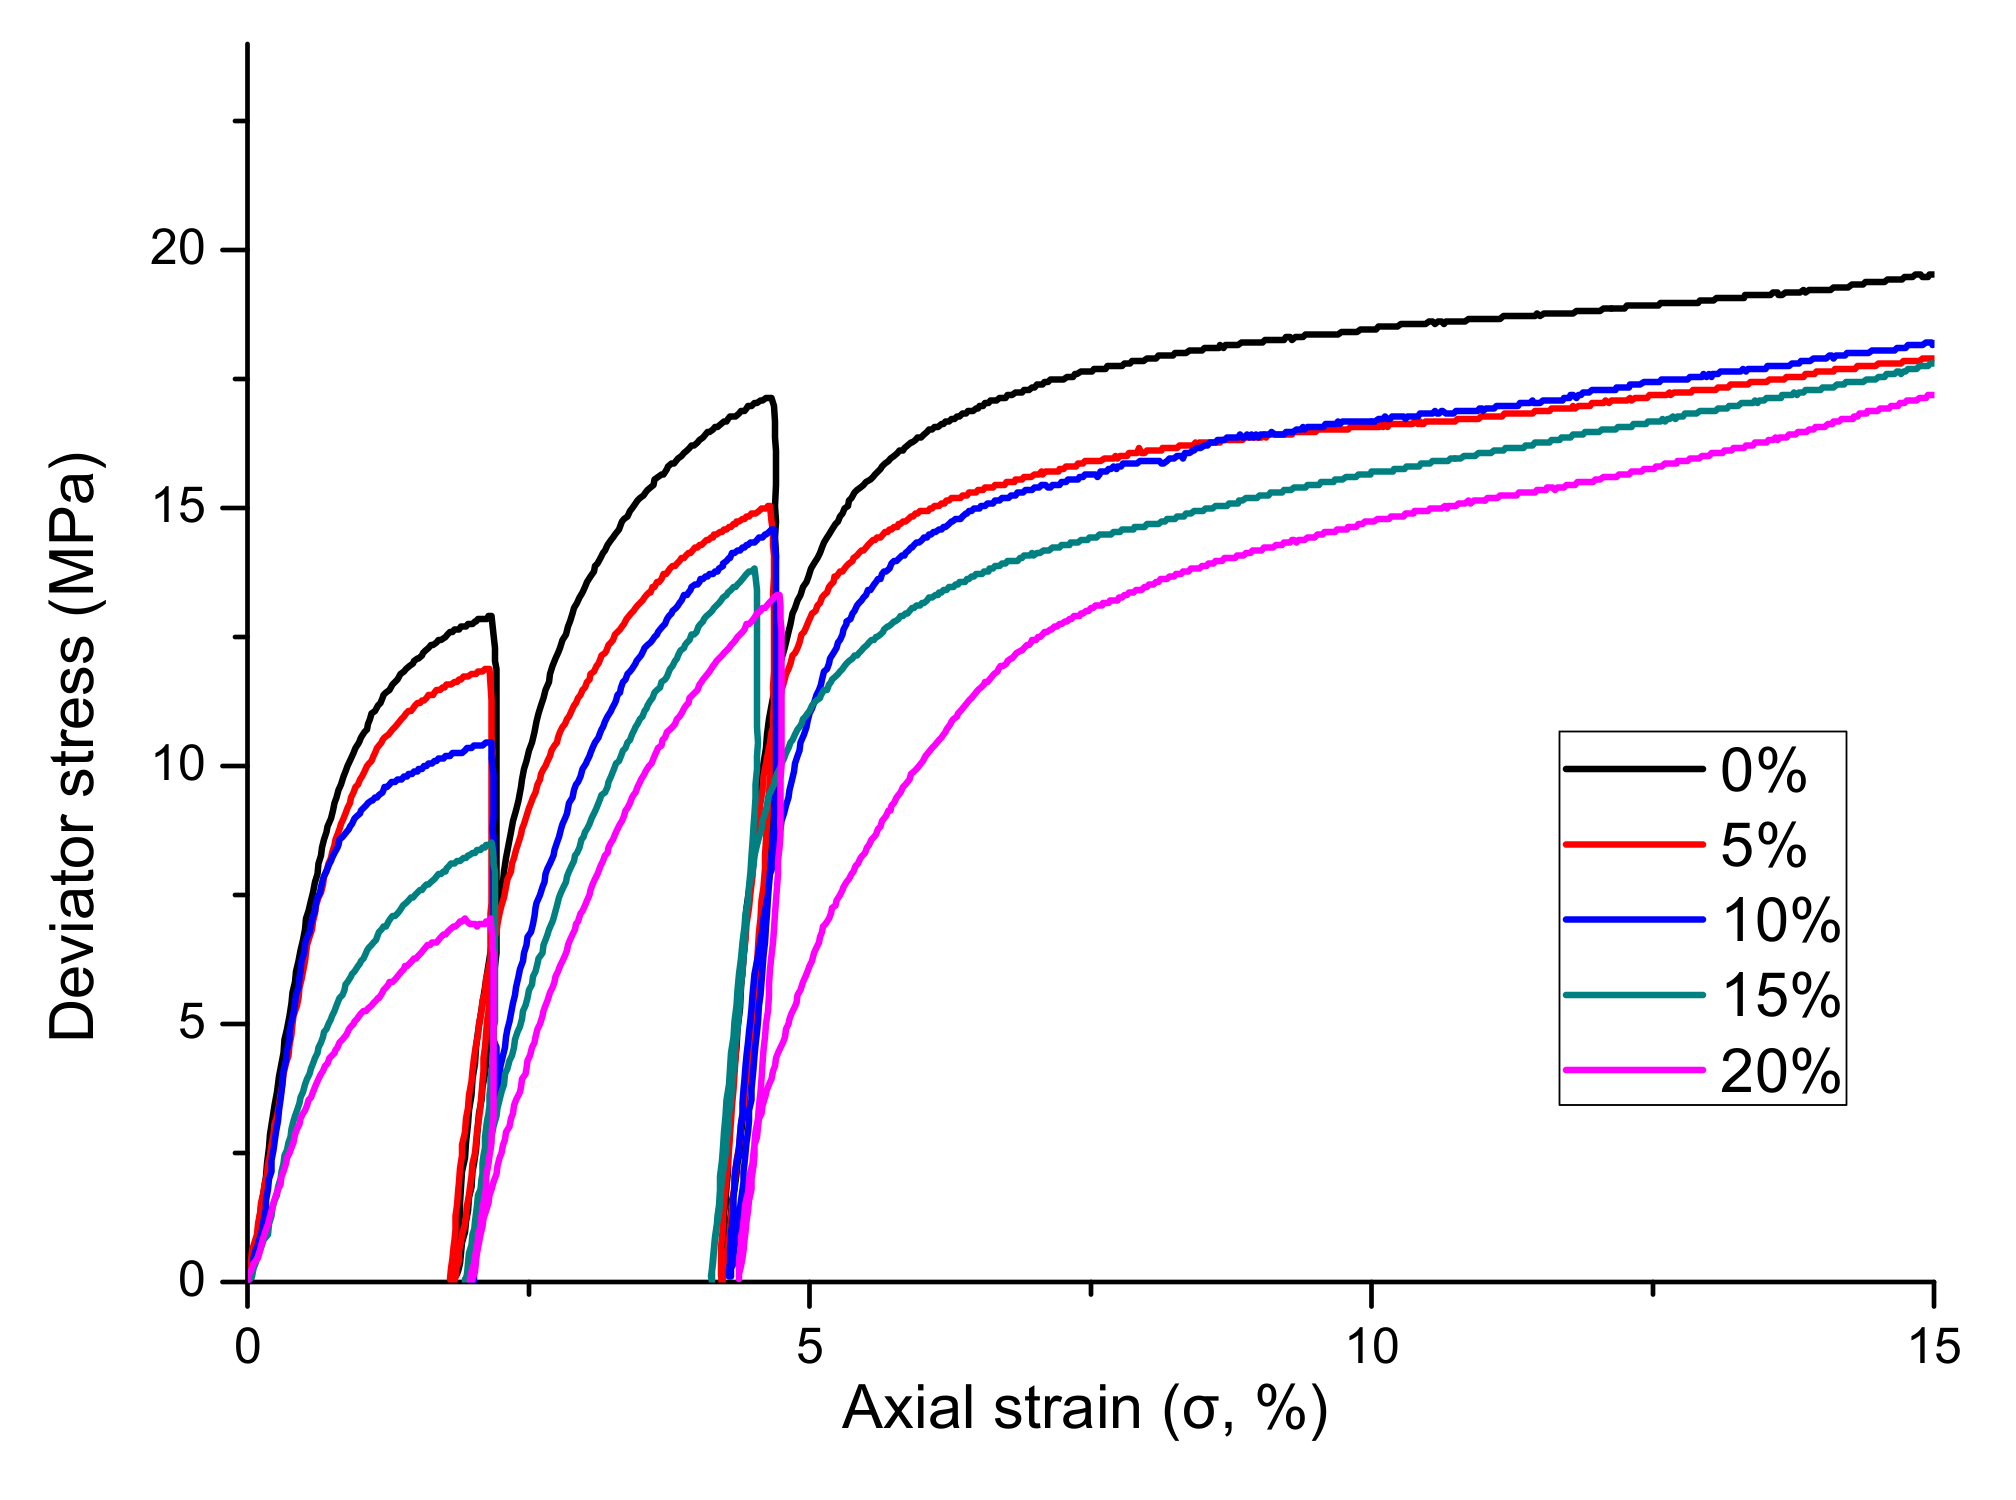
The first stage shown in the curves of
Figure 3 is the portion of the experiments with axial strain rates of 0–2.2%. At this stage, the stress–strain relationship was obtained when the sample pore pressure was 8 MPa and the confining pressure was 10 MPa (i.e., the effective confining pressure was 2 MPa). Since the pressure of the hydrate sediment sample at this stage was higher than the phase equilibrium pressure at the same temperature, the hydrate decomposition was minimal, and therefore the hydrate saturation of the sample was the highest. The stress–strain relationship at this stage reflects the initial stage of hydrate production.
It can be observed from
Figure 3 that in the first stage of shearing, the stress–strain relationship between pure sand and sediments with different clay contents gradually changed from that of elastic to plastic strain. The samples initially exhibited elastic strain, indicating that they were not destroyed at the onset of shearing; when the applied stress was removed, the specimen could be restored to the original stress state. The reason for this may be that because the hydrate had not been decomposed, there were interactions between the sediment particles and the hydrate. Furthermore, because the effective confining pressure was low, the sediment particles were complete, and the particle skeleton did not change. Afterward, the elastic strain gradually changed to plastic strain, which indicates that the sample was broken, such that even if the axial load applied to the sample was removed, the sample could not be recovered. This may be due to some of the hydrate sediment particles moving under the action of the axial load and confining pressure, resulting in the cementation of the hydrate to the skeleton being destroyed and the hydrate sediment changing. At this stage, the hydrate was minimally decomposed, but due to the axial load, some of the hydrate was split, and these destroyed hydrates filled in between the hydrate sediment skeletons, making the entire sample more compact. Thus, the stress–strain relationship changed from one of elastic to plastic strain owing to changes in the skeleton and the failure of the destroyed hydrate particles. The first stage of shearing may be considered to have extended until an axial strain rate of ~2.7%, which was the maximum shear strength of the first stage. It can also be observed that the stress–strain relationships of sediments with different clay contents in the first stage differed, and the degree of plasticity gradually increased as the proportion of clay in the sediments increased. Additionally, as the clay content in the sediments increased, the strength of the hydrate sediments decreased.
The second stage shown in the curves of
Figure 3 is for the experiments with axial strain rates of 2.2–4.7%. In this stage, the pore pressure was reduced from 8.0 MPa to 4.5 MPa, and the axial load was unloaded. After the hydrate in the sample was decomposed, the axial load system was restarted, and the effective confining pressure was kept at 10 MPa. Meanwhile, the stress–strain relationship was obtained by shearing under a confining pressure of 5.5 MPa. During the shearing process, the pressure of the hydrate sediment sample was slightly lower than the phase equilibrium pressure of the methane hydrate at 6.0 °C, and the hydrate also underwent partial decomposition. Since the hydrate had decomposed and exhaled part of the methane gas before shearing at this stage, the hydrate saturation of the sediment sample was lower than in the first stage of the experiments. In the second stage, during the exploitation of hydrates, the effective confining pressure of the hydrate sediments was greatly increased by depressurization, as the depressurized hydrate began to decompose.
The curve of the second stage represents the transformation from elastic to plastic strain (
Figure 3). It can be observed from the stress–strain relationships of the second stage that the curve representing the same clay content had a substantially higher magnitude than during the first stage, which indicates that the strength of the second stage hydrate sediment was greater than that of the first stage. Since part of the water and methane gas in the sample were removed during the depressurization process before shearing, the hydrate sediment sample changed from a completely water-saturated state to an incompletely water-saturated state. The saturation was also lower than in the first stage. Under the same experimental conditions, the strength of water-saturated sediments was lower than that of the gas-saturated sediments, and as the abundance of hydrate sediments decreased, the methane hydrate sediments gradually decreased. The reason for this behavior may be that methane hydrate was formed between the sediment skeleton, and cemented the quartz sand skeleton, resulting in the higher strength of the methane hydrate sediment.
In the second stage of the experiments, the pore pressure of the hydrate sediments was greatly reduced, resulting in the effective confining pressure of the sample being much higher than in the first stage. Within a certain range of effective confining pressures, the strength of natural gas hydrate sediments will gradually increase with the increase of effective confining pressure. Based on the influencing factors described, it can be determined that for the methane hydrate sediments with different clay contents, the effects of the second-stage effective confining pressure and the change of hydrate sediments from water-saturated to partially water-saturated were less than that of the decreasing of hydrate saturation. More importantly, when comparing the curves of the first and second stages for the same clay content, it was found that the degree of elastic strain in the second stage was more obvious than that of plastic strain, and as the particle size of the sediments increased, the strength of the hydrate sediments also increased.
The third stage in the curves shown in
Figure 3 corresponds to the part of the experiments with axial strain rates ranging from 4.7–15%, which reduced the pore pressure of the sample from 4.5 MPa to 3.0 MPa, and the effective confining pressure of this stage was 7.0 MPa. The resulting stress–strain relationship was obtained by shearing. The stress–strain relationship at this stage mainly changed from elastic to plastic strain, and finally to strain yielding. During the shearing process, the pressure of the hydrate sediment sample was much lower than the phase equilibrium pressure of the methane hydrate at 6.0 °C, at which time the hydrate in the sample was decomposed in large quantities and at a relatively fast rate. The hydrate saturation in the third stage was lower than in the first two stages, and a large volume of free water produced by the decomposition of the hydrate was also discharged. This stage simulated the middle and late stages of natural hydrate production. The hydrate had already been decomposed by a large amount, the gas hydrate sediment reservoir was greatly increased by the surrounding pressure, and the saturation of the hydrate in the reservoir was substantially reduced, resulting in hydrate sedimentation. The porosity of the sample also increased. As with the second stage, the hydrate saturation of the hydrate sediment sample was reduced due to the decomposition of the hydrate, and the decrease in the pore pressure caused the effective confining pressure of the sample to increase by 1.5 MPa relative to the second stage. However, comparing the curves of the second and third stages, it can be seen that the curve in which the axial strain rate changed to 2.5% in the third stage is essentially the same as the curve in the second stage, which indicates that the effective confining pressure increased in this stage, yet the effect was small, and the influence on the mechanical properties of hydrate sediments was the same as for the decrease of hydrate saturation caused by decomposition. Therefore, no significant change in the strength of methane hydrate sediments was observed at this stage. Once the stress–strain relationships of the three stages were obtained, it was found that with the increase of the strain rate of triaxial compression, the stress–strain relationships of different particle sizes were gradually transformed into plastic strain. Ultimately, this became the strain yielding phenomenon, wherein the strain of the specimen could be recovered at the beginning; meanwhile, the structure of the specimen was gradually destroyed with the increasing of the axial load, and the damage became irreversible.
3.2. Strength Relationship of Sediments with Different Clay Contents
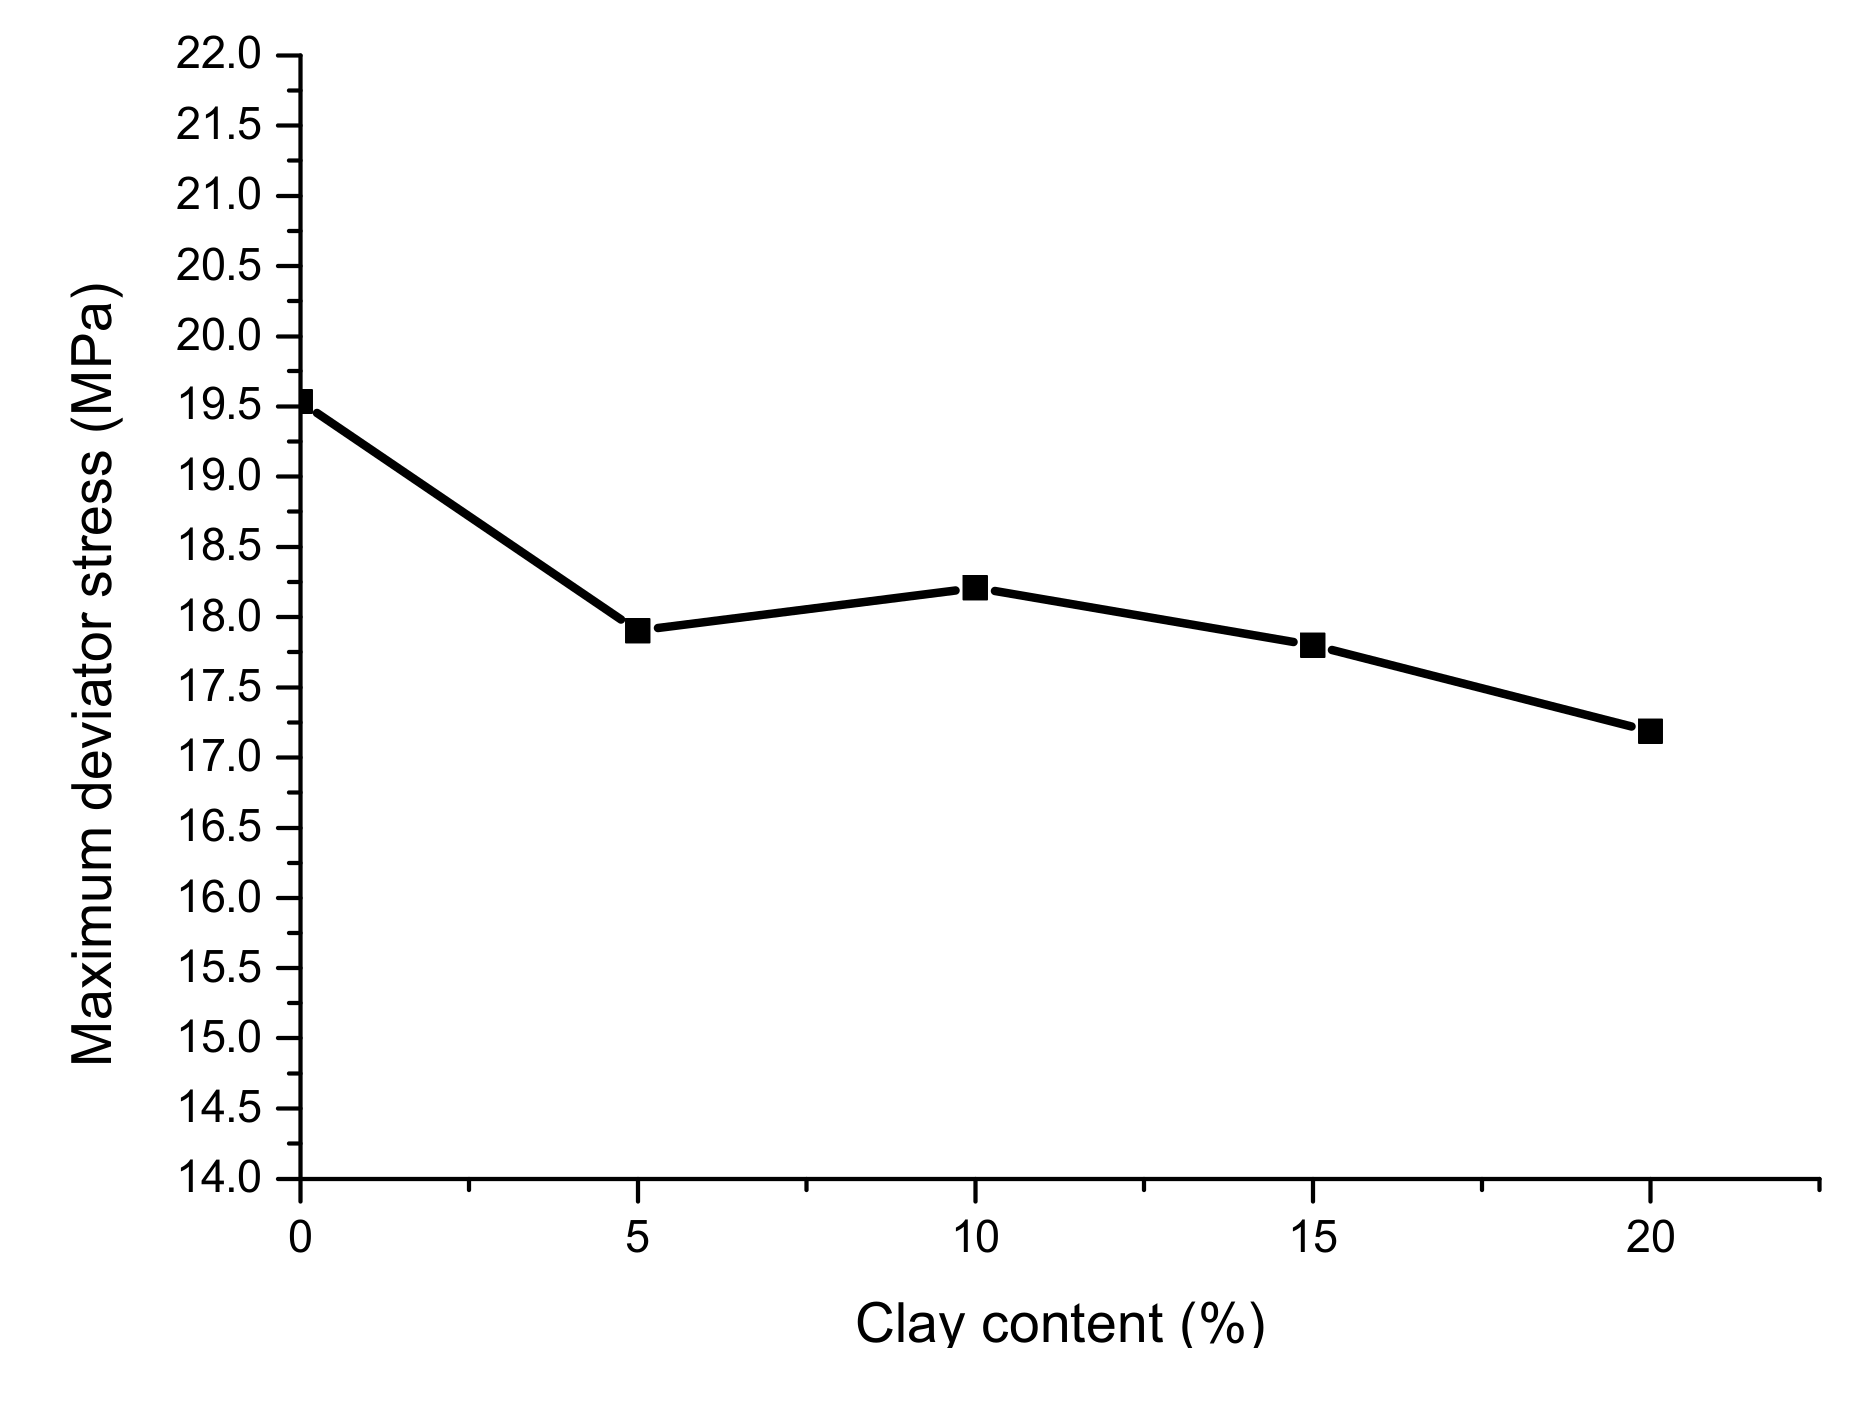
Figure 4 shows the relationship between the maximum shear strength of sediments with different clay contents and the ratio of clay to hydrate sediments from low to high. Maximum shear strength generally refers to the stress corresponding to the peak value of the stress–strain curve. However, in the case wherein the stress–strain curve has no significant peak value, the stress value at which the axial strain rate reached 15% was used. It can be seen from the figure that the maximum destructive strength of hydrate sediments was generally reduced as the proportion of clay in the sediment increased, and the maximum shear strength of the hydrate sediments of the pure sand skeleton was the highest. The reason for this may be that the strength of the material itself had a greater influence on the strength of the hydrate sediment. In general, the strength of clay is much lower than that of quartz sand. As the proportion of clay in the sediment increased, the content of quartz sand decreased correspondingly, such that the strength of the skeleton decreased. Additionally, some of the clay adhered to the surfaces of the sand grains, with some acting as a lubricant among the quartz sand particles, thereby reducing the cohesive force and internal friction, resulting in insufficient stability of the skeletal structure during the shearing process. The higher the clay content was, the more obvious this effect became.
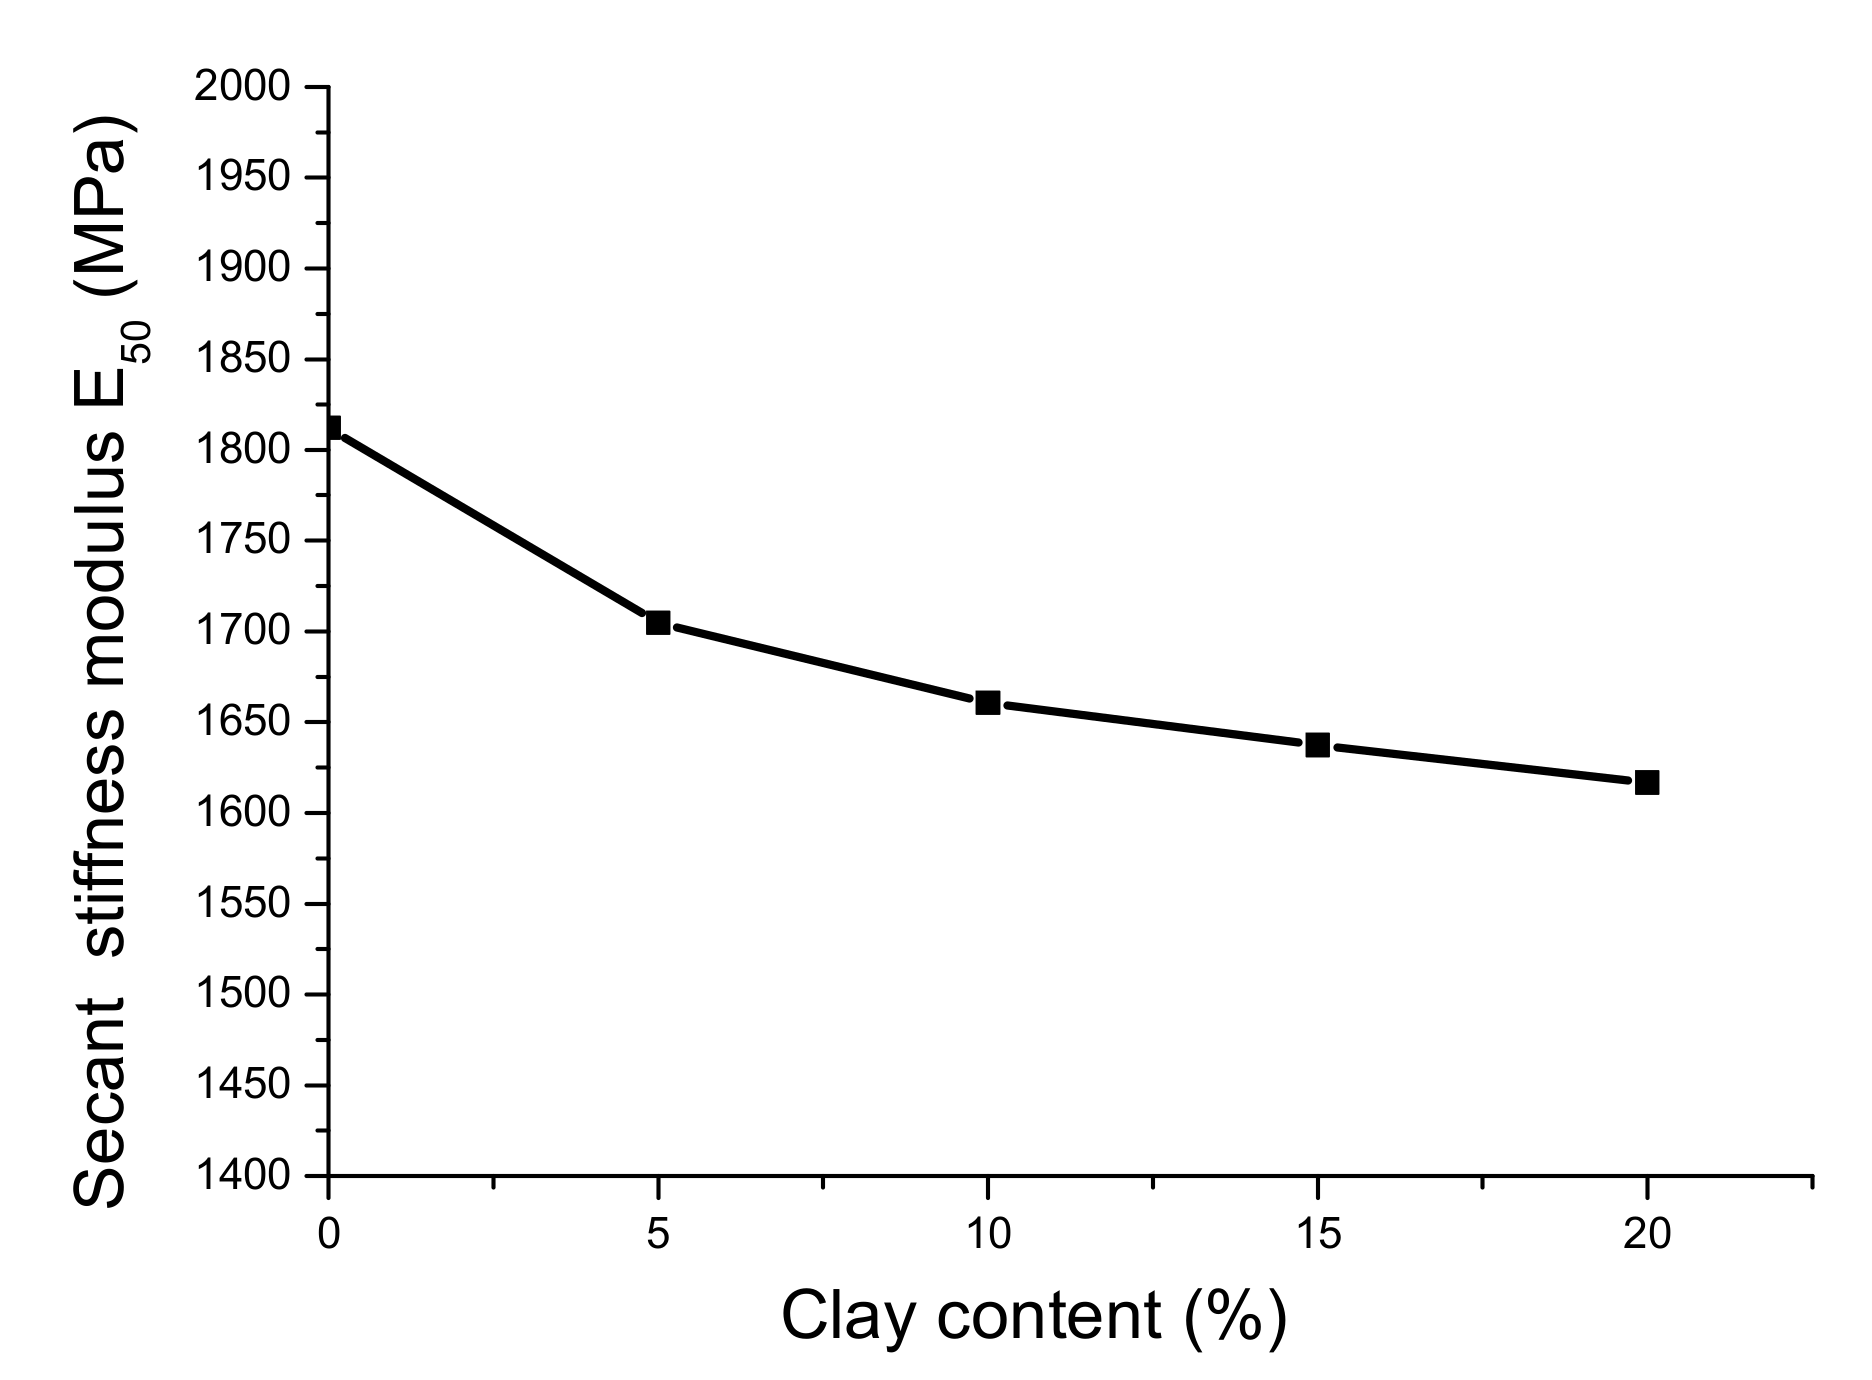
The secant stiffness modulus E
50 of sediments with different clay ratios is shown in
Figure 5. This modulus is the line connecting the origin and 50% of the maximum shear strength in the stress–strain curve of the sediments. The slope of the line segment reflects the mean stiffness characteristics of the hydrate sediment. As is shown, when the hydrate content of the hydrate sediments increased under the same temperature and pressure conditions, the secant stiffness modulus gradually decreased. This reveals that as the clay content increased, the stiffness of the hydrate sediments gradually decreased.
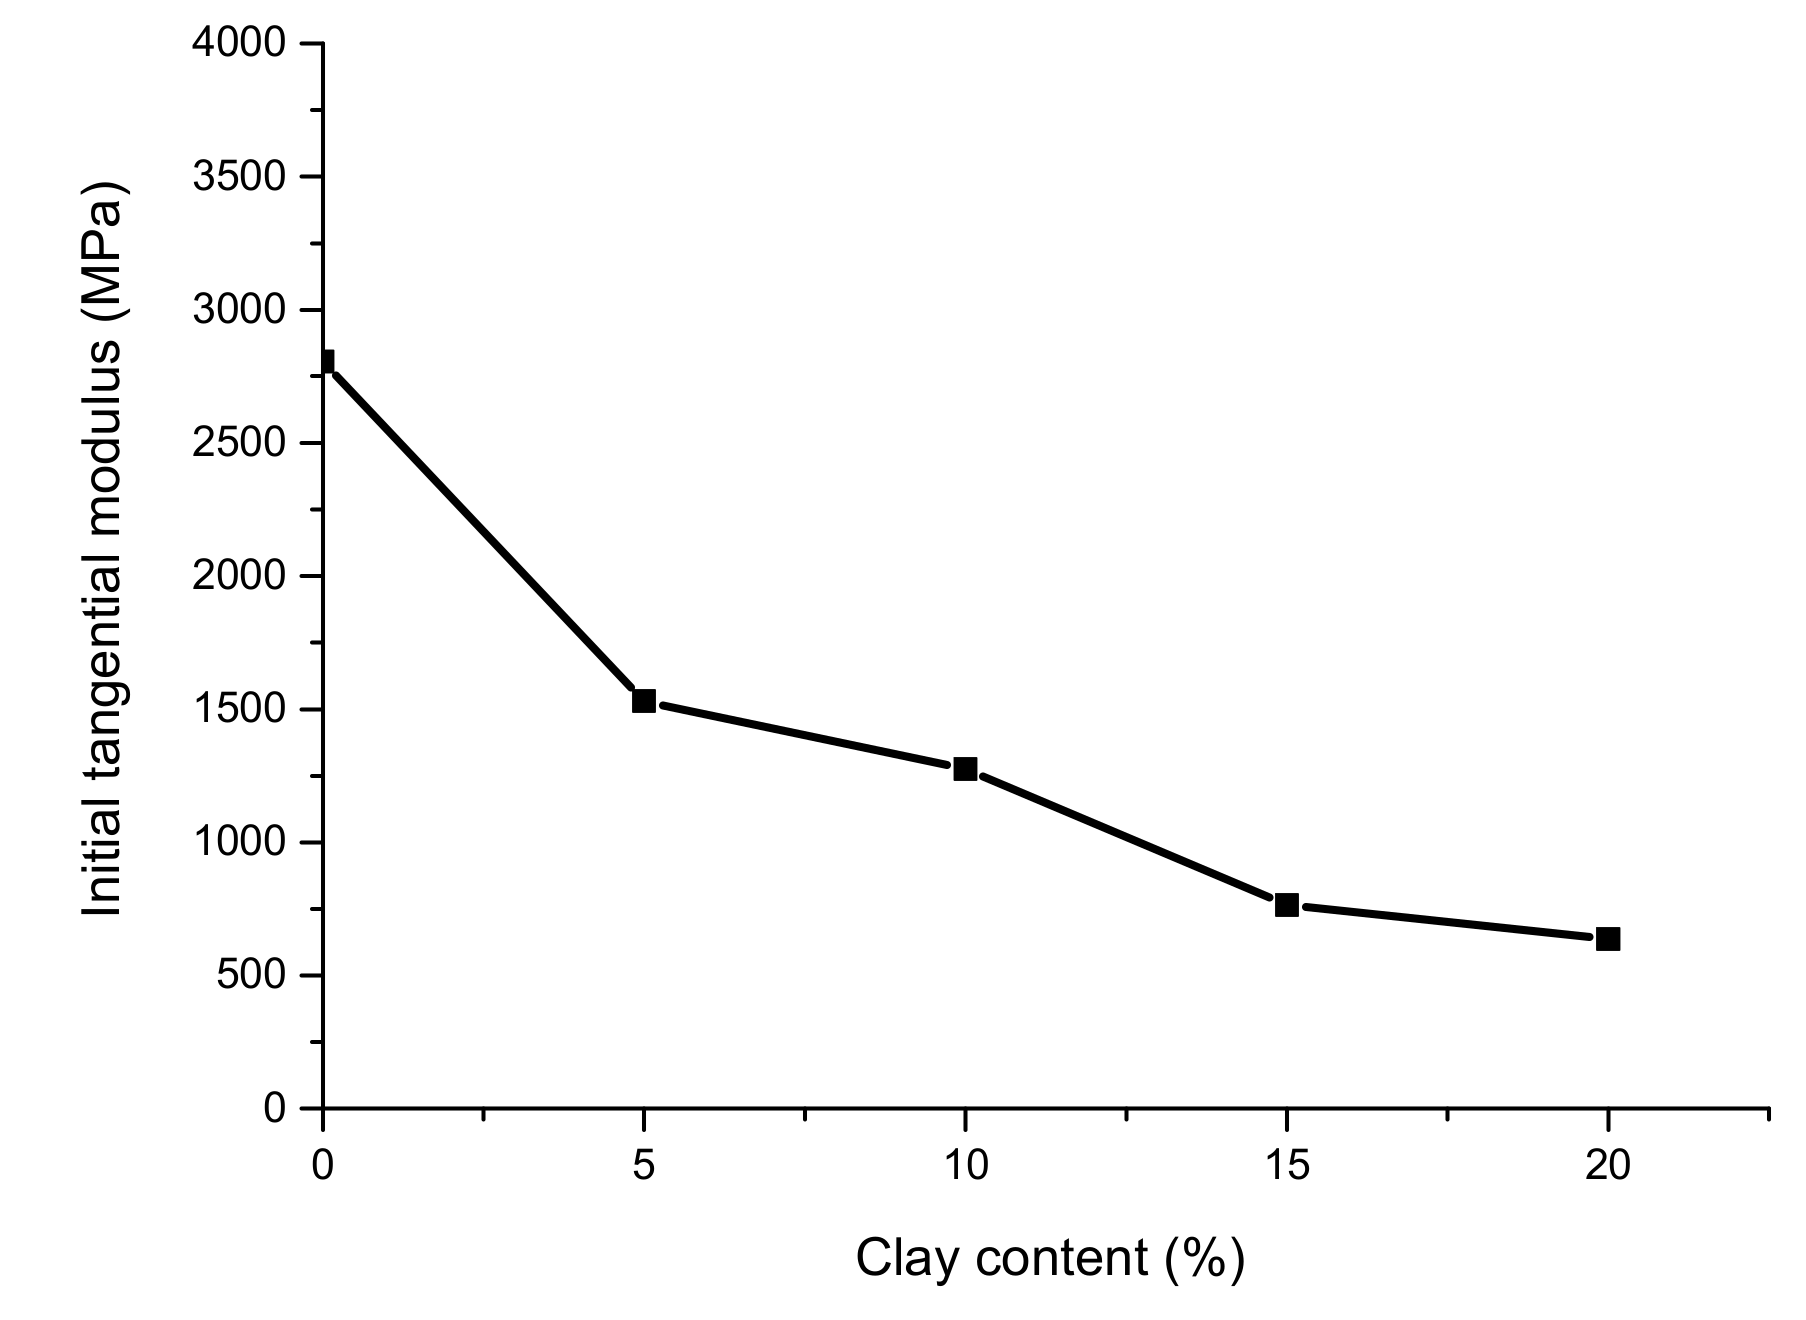
In
Figure 6, the initial tangential modulus E
0 of sediments with different clay ratios are shown. Under the same temperature and pressure conditions, the initial tangential modulus of sediments with different clay contents (as skeletons) also differed. As the clay content in the hydrate sediments increased, the initial tangential modulus of the hydrate sediments decreased gradually, while that of the pure sand (as the sediment skeleton) was the highest. Meanwhile, the initial tangential modulus of sediments with different clay contents was inconsistent. This may be due to the fact that the strength of clay is lower than that of quartz sand. The higher the clay content was in our experiments, the lower the proportion of quartz sand became. Moreover, the sediment skeletons with different clay contents were also different. The clay filled in the pores of the quartz sand skeleton, and the porosity with different clay contents also changed, which resulted in the cementation of the hydrate between the skeletons. In the same way, the initial strength of the entire hydrate sediment was decreased as the clay content increased.
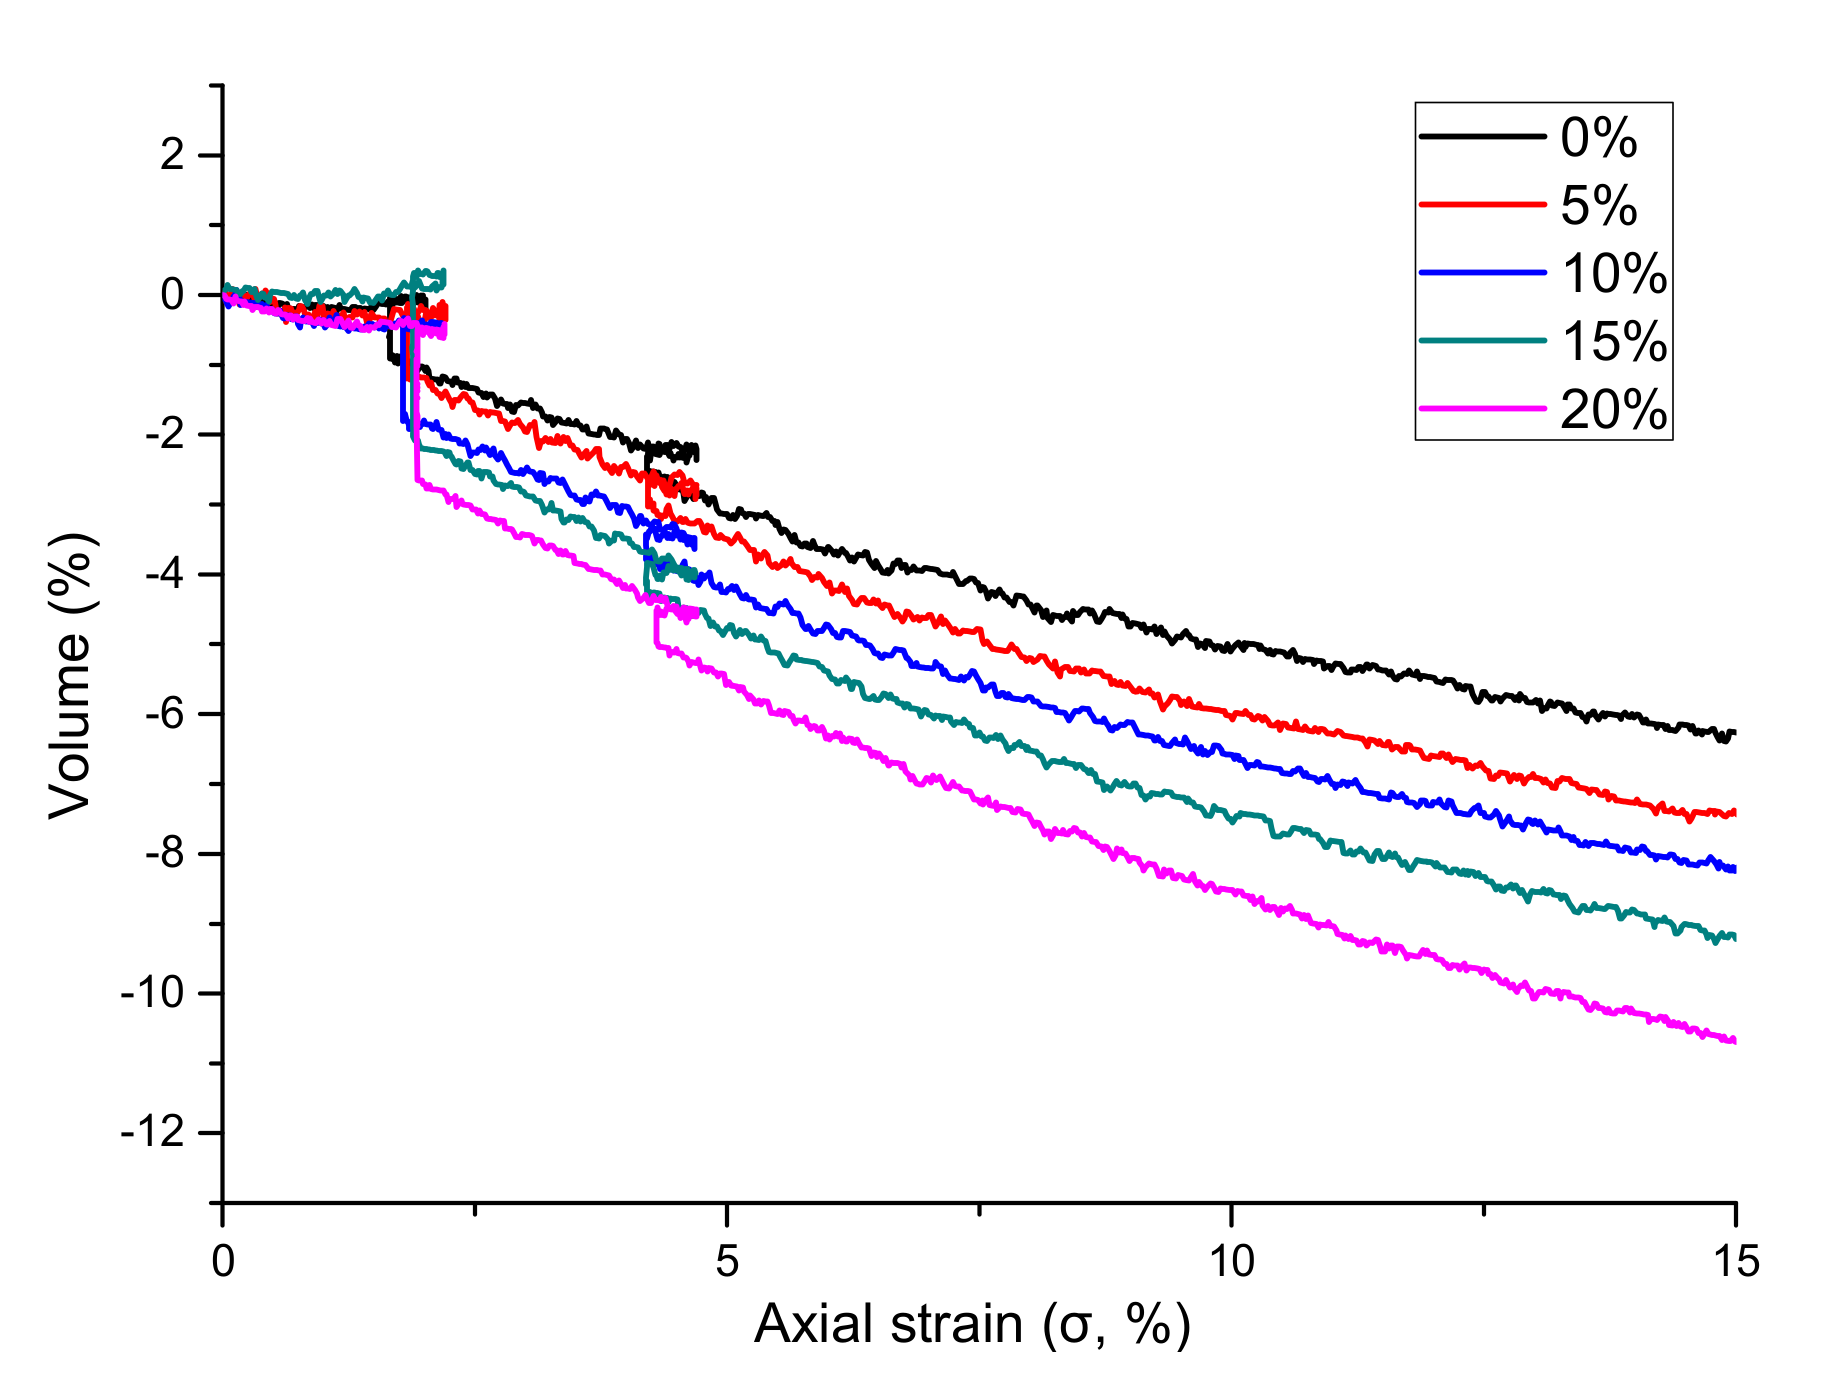
3.3. Volumetric Strain Relationship of Sediments with Different Clay Contents
Figure 7 shows the volumetric strain curves for sediments with different clay proportions. It can be seen that in the first stage of shearing (i.e., when the axial strain rate was 0–2.2%), the volume of all hydrate sediment samples slightly increased as the strain rate increased and the magnitude of the change was maintained at ~0.5. The reason for this may be that in the first stage, the pore pressure of the experiment was always maintained at 8.0 MPa, which is higher than the equilibrium pressure of the phase, and the hydrate was hardly decomposed. Thus, the relationship between the hydrate and the sediment skeleton did not have much of an influence. This caused the hydrate sediment skeleton to not undergo much deformation. Additionally, the effective confining pressure at this stage was always 2.0 MPa, and such a pressure condition was not enough to destroy the particles of the hydrate sediment. Therefore, the interaction between the particles and the relative position did not change much, which resulted in there being no significant change in the volume of the entire hydrate sediment sample.
In the second and third stages of the experiments, the axial strain rates were 2.2–4.7% and 4.7–15%, respectively, and the volume of hydrate sediments with different clay contents increased with the axial strain rate. With the reduction of hydrate content, an important clipping phenomenon occurred. The volumetric change in the second stage was generally >2.0%, while the shear shrinking phenomenon was more obvious in the third stage. The change in the volume of the sample with 20% clay content in the third stage even reached 5.0%. The reason for this may be that the pore pressures of the hydrate sediment samples in these two stages were lower than the phase equilibrium pressure of the hydrate at the same temperature, especially in the third stage. Thus, during the shearing process, the hydrate in the sample gradually decomposed, resulting in the formation of pores in the middle of the hydrate sediment skeleton. Under the influence of a certain effective confining pressure, some of the finer particles of clay filled the skeleton under the actions of the free water and gas generated by decomposition. Additionally, due to the large effective confining pressures in these two stages, some of the sediment particles may have been shredded. Under the external pressure, the shredded particles would have experienced larger positional changes, resulting in a change in the skeleton of the hydrate sediment sample, and ultimately in the volumetric reduction of the entire sample.
With the increase of clay content, the volumetric shearing effect of hydrate sediments became more obvious, likely because the strength of the clay was less and its compressibility was higher than that of the quartz sand. Therefore, as the clay content increased, the volume became more compressed.
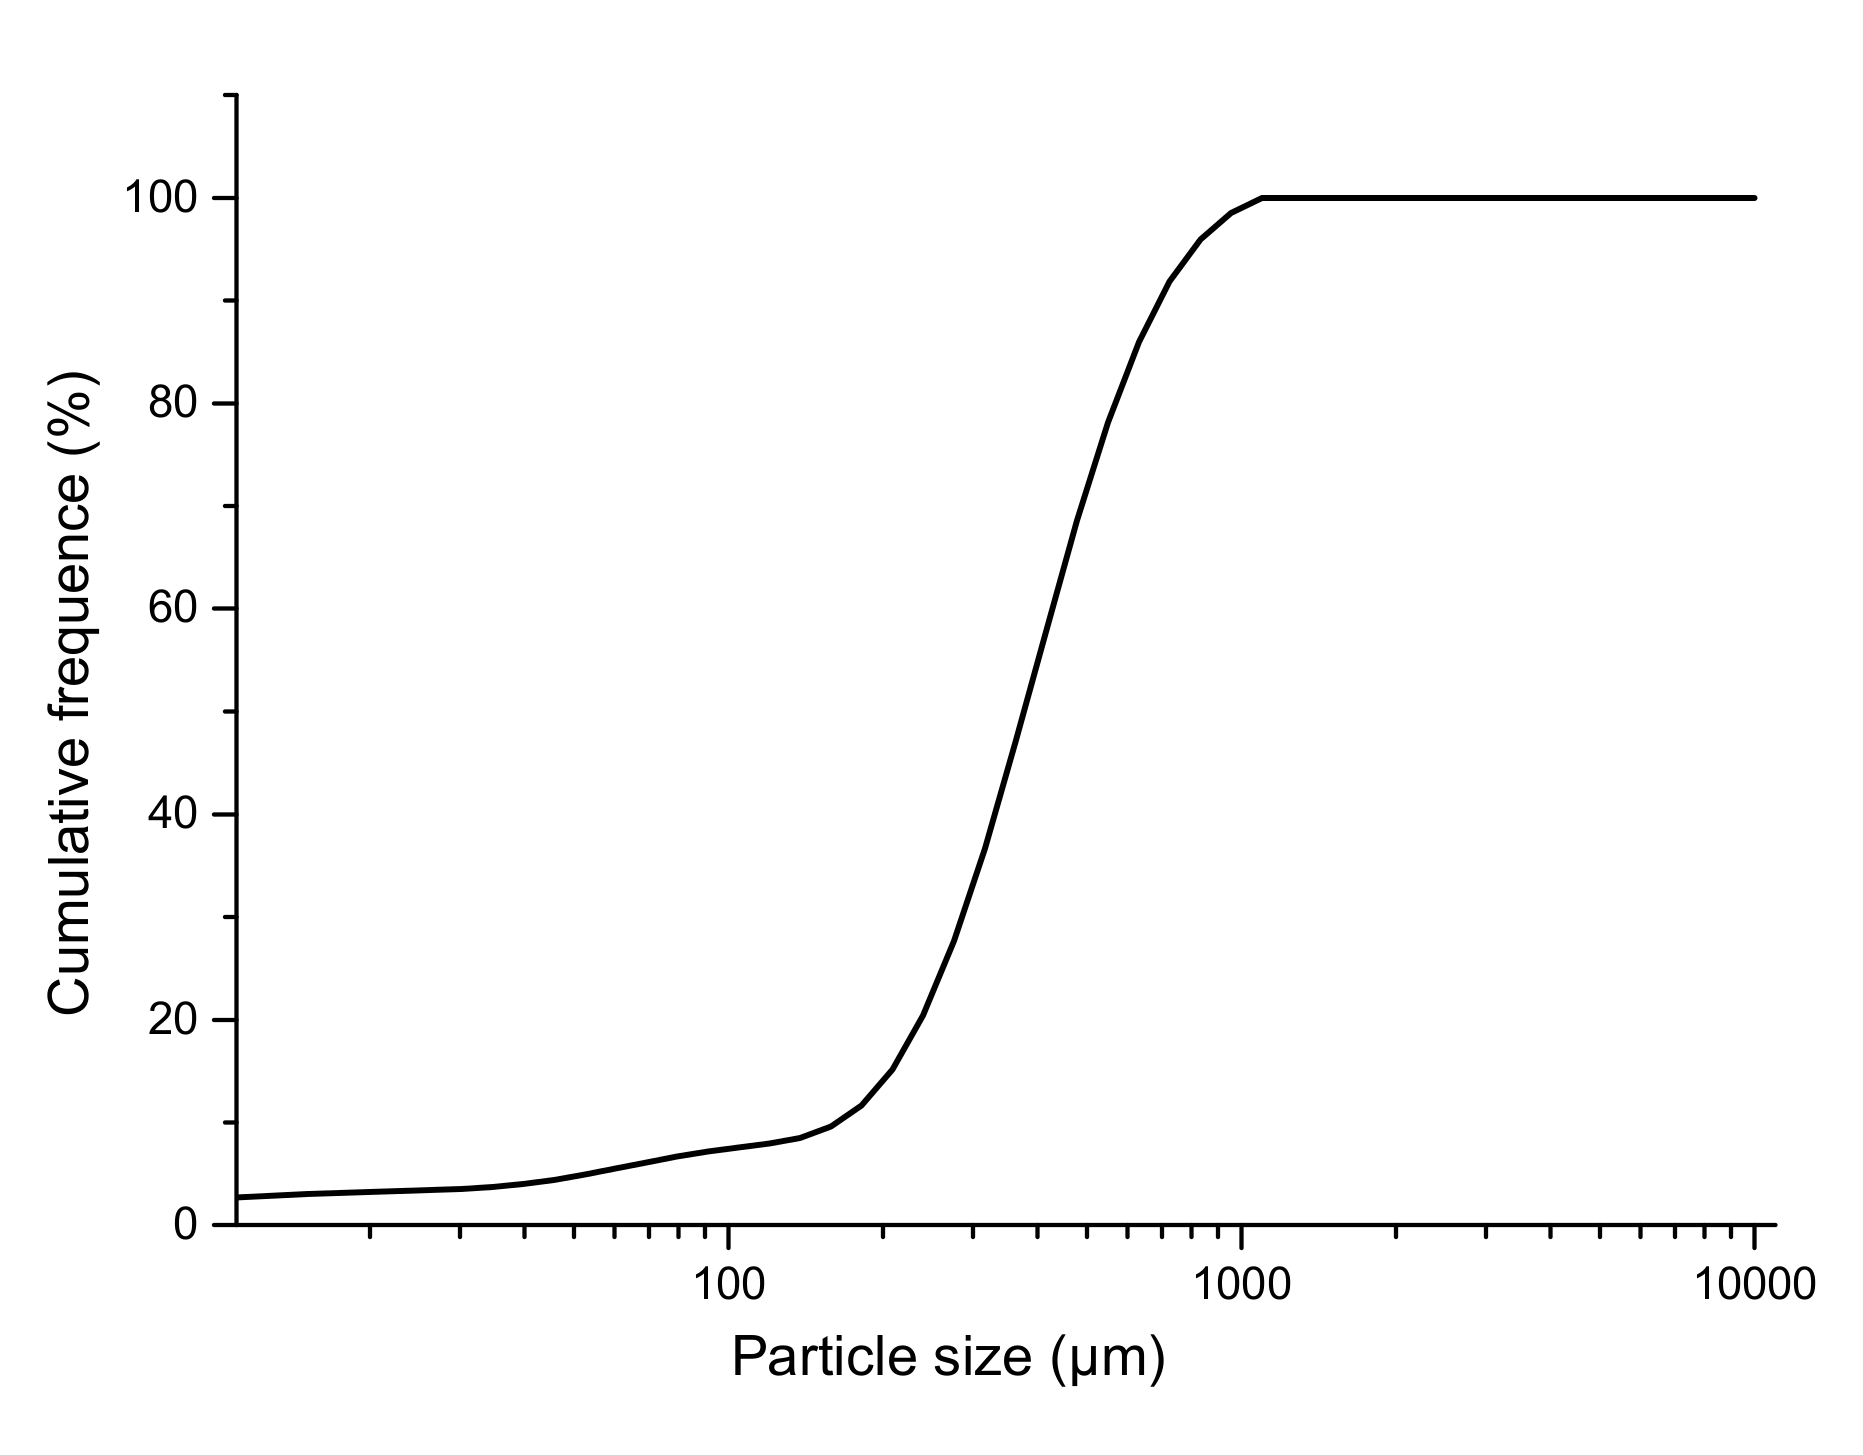
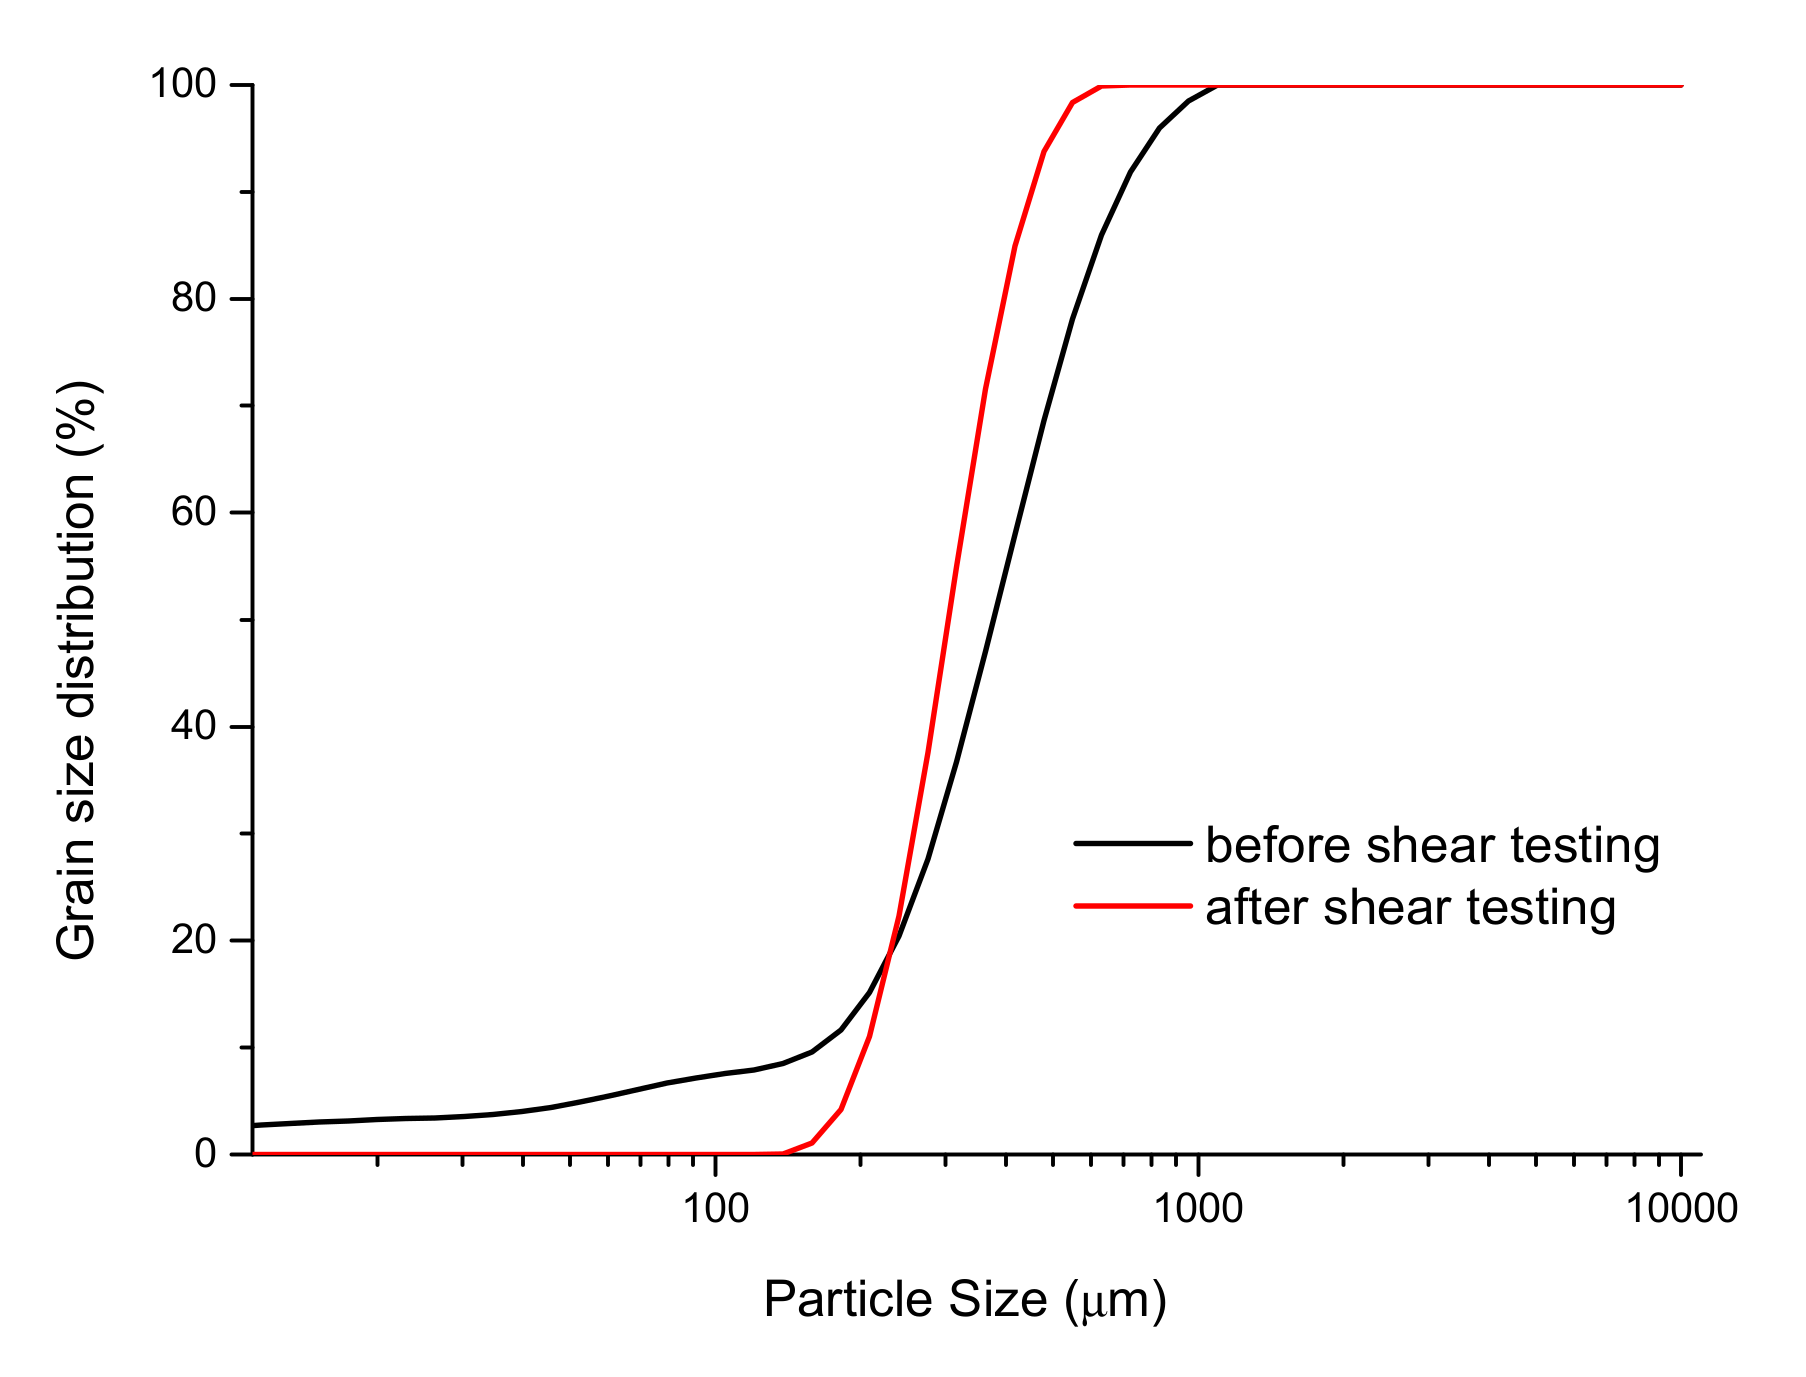
Figure 8 shows the grain size curve of the sediments before and after the triaxial compressive shearing of 40–60 μm specimens. It can be seen from this figure that the particle sizes before shearing were larger than afterward. This means that after shearing, the higher effective confining pressure and axial load became part of the sand. Additionally, the volume of the hydrate sediment sample suddenly declined each time the axial load pressure was unloaded during the experiment. This may have been due to the fact that these two stages comprised a process of hydrate decomposition and drainage. First, the depressurized hydrate was decomposed, and a certain amount of gas and the free water generated by decomposition were discharged, such that many pores were generated among the hydrate sediment samples. Moreover, in the process of free water and gas discharge, sand and clay also underwent substantial displacement under the movement of the free water and methane gas, which could have significantly changed the skeletal structure of hydrate sediments, especially when they were not decomposed. Finally, the sediment skeleton played a very important role in cementation, and the originally fixed skeleton was destroyed after decomposition; because of the increase in the effective confining pressure, the compression of the sample became more pronounced.
4. Conclusions
The stress–strain relationship of hydrate sediments containing clay (kaolin) during shearing is mainly divisible into three stages, namely elastic strain, plastic strain, and the strain yielding stage. In multi-stage triaxial shear tests with discontinuous depressurization, the mechanical strength varied with hydrate decomposition. With the increase of the axial strain rate under triaxial compression, all experiments showed that the elastic strain was gradually transformed into plastic strain. During the course of these experiments, the strain yielding phenomena changed, which indicates that the strain of the specimen could be restored at the beginning, but with the progressive loading of the axial load, the structure of the specimen was gradually destroyed, and the damage became irreversible.
The proportion of clay in the methane sediment affected the mechanical strength of the hydrate sediment sample. This may have been because the clay particles were smaller and could fill the pores of the coarser sediment skeleton, while the clay offered less support to the skeleton, and the hydrate more strongly cemented the skeleton with increasing clay content. As the proportion of clay increased, the strength of the entire sample gradually decreased. The clay also affected the volumetric strain during methane hydrate shearing. Regardless of the amount of clay added, the hydrate sediments shrank, but as the hydrates gradually decomposed, the shrinkage of the sediments became more pronounced as the clay content increased. The reason for this may be that the strength of the clay was less than that of the quartz sand, and the change in volume during the shearing process was greater than that of the quartz sand. As the hydrate decomposed, the pores between the quartz sand skeletons gradually increased, and the smaller clay particles filled the pores of the skeleton under the external shearing force, thereby causing the shearing behavior observed.


