Article

Bi-Objective Optimization Model for Optimal Placement of Thyristor-Controlled Series Compensator Devices

by
Mohammad Reza Salehizadeh
1,
Mahdi Amidi Koohbijari
1,
Hassan Nouri
2,
Akın Taşcıkaraoğlu
3,
Ozan Erdinç
4 and
João P. S. Catalão
5,*
1
Department of Electrical Engineering, Marvdasht Branch, Islamic Azad University, Marvdasht, Iran
2
Power Systems, Electronics and Control Research Laboratory, UWE Bristol BS16 1QY, UK
3
Department of Electrical and Electronics Engineering, Mugla Sitki Kocman University, Mugla 48000, Turkey
4
Department of Electrical Engineering, Yildiz Technical University, Istanbul 34220, Turkey
5
Faculty of Engineering of the University of Porto and INESC TEC, 4200-465 Porto, Portugal
*
Author to whom correspondence should be addressed.
Energies 2019, 12(13), 2601; https://doi.org/10.3390/en12132601
Submission received: 19 May 2019 / Revised: 24 June 2019 / Accepted: 3 July 2019 / Published: 6 July 2019

Abstract

:
Exposure to extreme weather conditions increases power systems’ vulnerability in front of high impact, low probability contingency occurrence. In the post-restructuring years, due to the increasing demand for energy, competition between electricity market players and increasing penetration of renewable resources, the provision of effective resiliency-based approaches has received more attention. In this paper, as the major contribution to current literature, a novel approach is proposed for resiliency improvement in a way that enables power system planners to manage several resilience metrics efficiently in a bi-objective optimization planning model simultaneously. For demonstration purposes, the proposed method is applied for optimal placement of the thyristor controlled series compensator (TCSC). Improvement of all considered resilience metrics regardless of their amount in a multi-criteria decision-making framework is novel in comparison to the other previous TCSC placement approaches. Without loss of generality, the developed resiliency improvement approach is applicable in any power system planning and operation problem. The simulation results on IEEE 30-bus and 118-bus test systems confirm the practicality and effectiveness of the developed approach. Simulation results show that by considering resilience metrics, the performance index, importance of curtailed consumers, congestion management cost, number of curtailed consumers, and amount of load loss are improved by 0.63%, 43.52%, 65.19%, 85.93%, and 85.94%, respectively.

1. Introduction

1.1. Motivation and Background

Resiliency is generally defined as the strength of a power system in front of high-impact, low-probability, sudden events which lead to component outage [1,2]. These huge outages might affect several consumers and the related costs might be high. The Lawrence Berkeley National Laboratory has designed a free website for estimating interruption costs in different U.S. states [3]. In recent years, extreme weather-related events have increased due to climate change, and these events can decrease the resiliency of different civilized structures [3].
The most widely spread manmade systems, transmission and distribution assets are generally highly likely to be exposed to climate disasters. Besides climate change, an increase in electricity demand, competition of electricity market players for increased profit, and less concern for power system security and reliability constraints and the increasing penetration of renewable energy with high intermittency increases the degree of vulnerability of power systems while faced with weather disasters. Since 2002, 80% of major power outages in the U.S. have occurred due to weather events [3], with severe consequences. Weather disasters could affect the number of interruptions not only in transmission systems, but also in the distribution level [4].
In order to reduce the impacts of such events, it is crucial to develop resiliency-oriented power systems plans to reinforce the network against disasters’ consequences. Improving resiliency is shown by a set of metrics such as the number of consumers affected by an interruption, etc. Besides this, the importance of the interrupted consumers might be considered as a resilience metric. The planner might give a different importance degree to each of the metrics. It is necessary to develop an effective planning framework to be able to simultaneously consider all metrics by paying attention to the degree of importance planners give to different metrics.

1.2. Relevant Background

Numerous efforts have been made to incorporate resiliency in power systems. Generally, the developed resiliency-oriented methods have focused on cyber or physical aspects of power systems. In Ref. [5], seven groups have been mentioned for cyber-physical attacks based on the end goal of attackers. These groups include bad measurement, bad command injection, control center impersonation attack, communication delay attack, unresponsive command attack, denial of services attack, and coordinated cyber-attack [5]. All such attacks could threaten power systems in all levels of operation. In this regard, some of the papers improved resiliency near to end-user consumers in micro grids or distribution networks and the rest focused on transmission-network resiliency enhancement. While facing the natural disaster, a few preventive and corrective actions can be performed [1]. Hardening of the system by expanding new generation units, transmission components, and lines are suggested as effective preventive actions. It has been customary, even in traditional power systems, to locate new transmission, generation, and flexible AC transmission system (FACTS) devices to meet future demands or for improving reliability. However, by emphasizing sustainability in modern power systems, Sedzero has shown that resiliency consideration is also essential [6].
On the other hand, apart from resiliency-oriented studies, FACTS devices have been extensively applied for power flow control by taking advantage of recent power electronics progress and FACTS devices oriented studies in literature. Different objectives have been considered for FACTS placement, such as stability improvement, voltage deviation reduction [7], voltage unbalance improvement [8], loss minimization [9], congestion reduction [10], and high renewable penetration enabling [11].
From the viewpoint of security enhancement, a few studies considered the potential of FACTS devices. In [12], a continuously variable series reactor (CVSR) was applied for improvement of transmission expansion planning while satisfying N 1 contingences. In Ref. [13], static security was improved by the optimal allocation of thyristor-controlled phase shifting transformer (TCPST) and thyristor-controlled series compensation (TCSC) devices. In [14], operational cost in contingencies was considered in FACTS placement. In [15], compensation payment to market participants due to generation re-scheduling and load shedding was considered together with the placement of the FACTS devices. Recently, the effectiveness of the application of FACTS devices for resiliency enhancement was demonstrated in [16]. In Ref. [17], FACTS placement was done based on vulnerability indices. The used vulnerability indices are extracted from the security margin indices. However, the indices are not comprehensive enough to consider the number and importance of curtailed consumers, the amount of load loss, and congestion management cost. Overall load shedding and the duration due to network outages were considered as the resiliency metric in [16].
In the above papers and other papers on FACTS placement and/or power systems planning that could not all be mentioned here, different resiliency-based congestion-driven indices such as the number and importance of curtailed consumers, the amount of load loss, congestion management cost, and performance index have not been simultaneously considered in the assessment of contingencies. On the other hand, the developed models are not capable enough to consider different types of resilience metrics without imposing further computational burden.
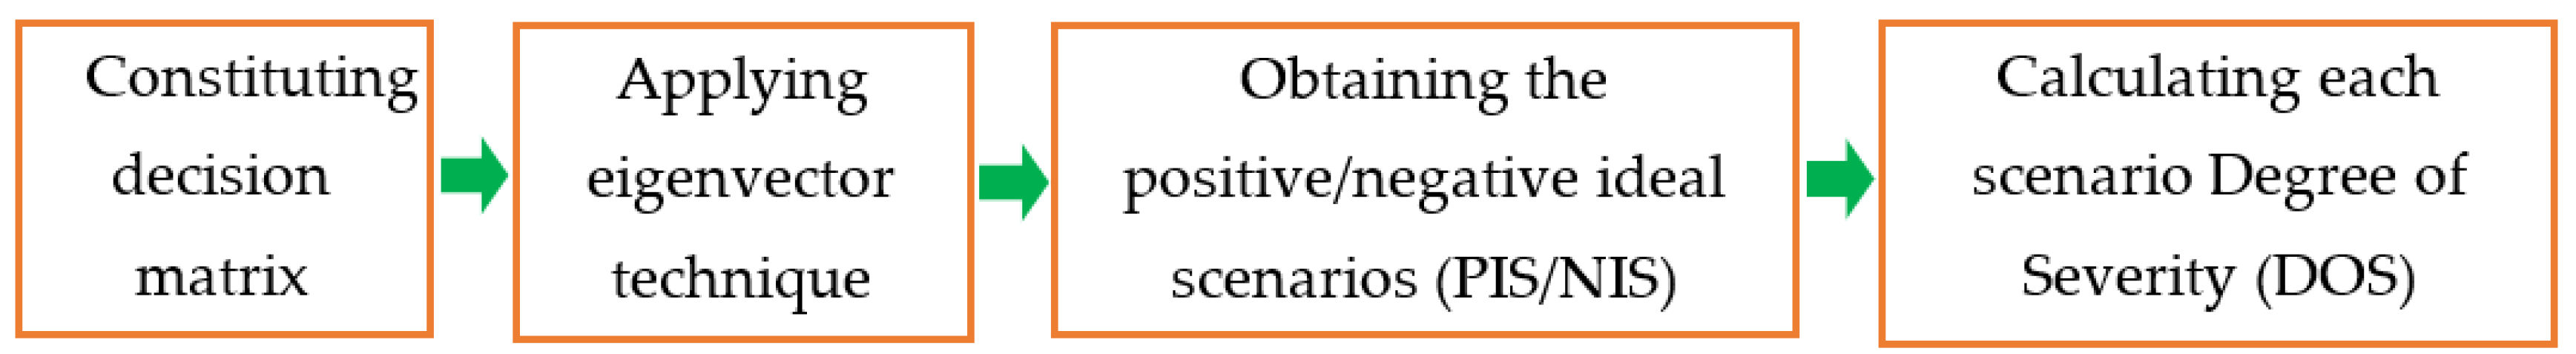
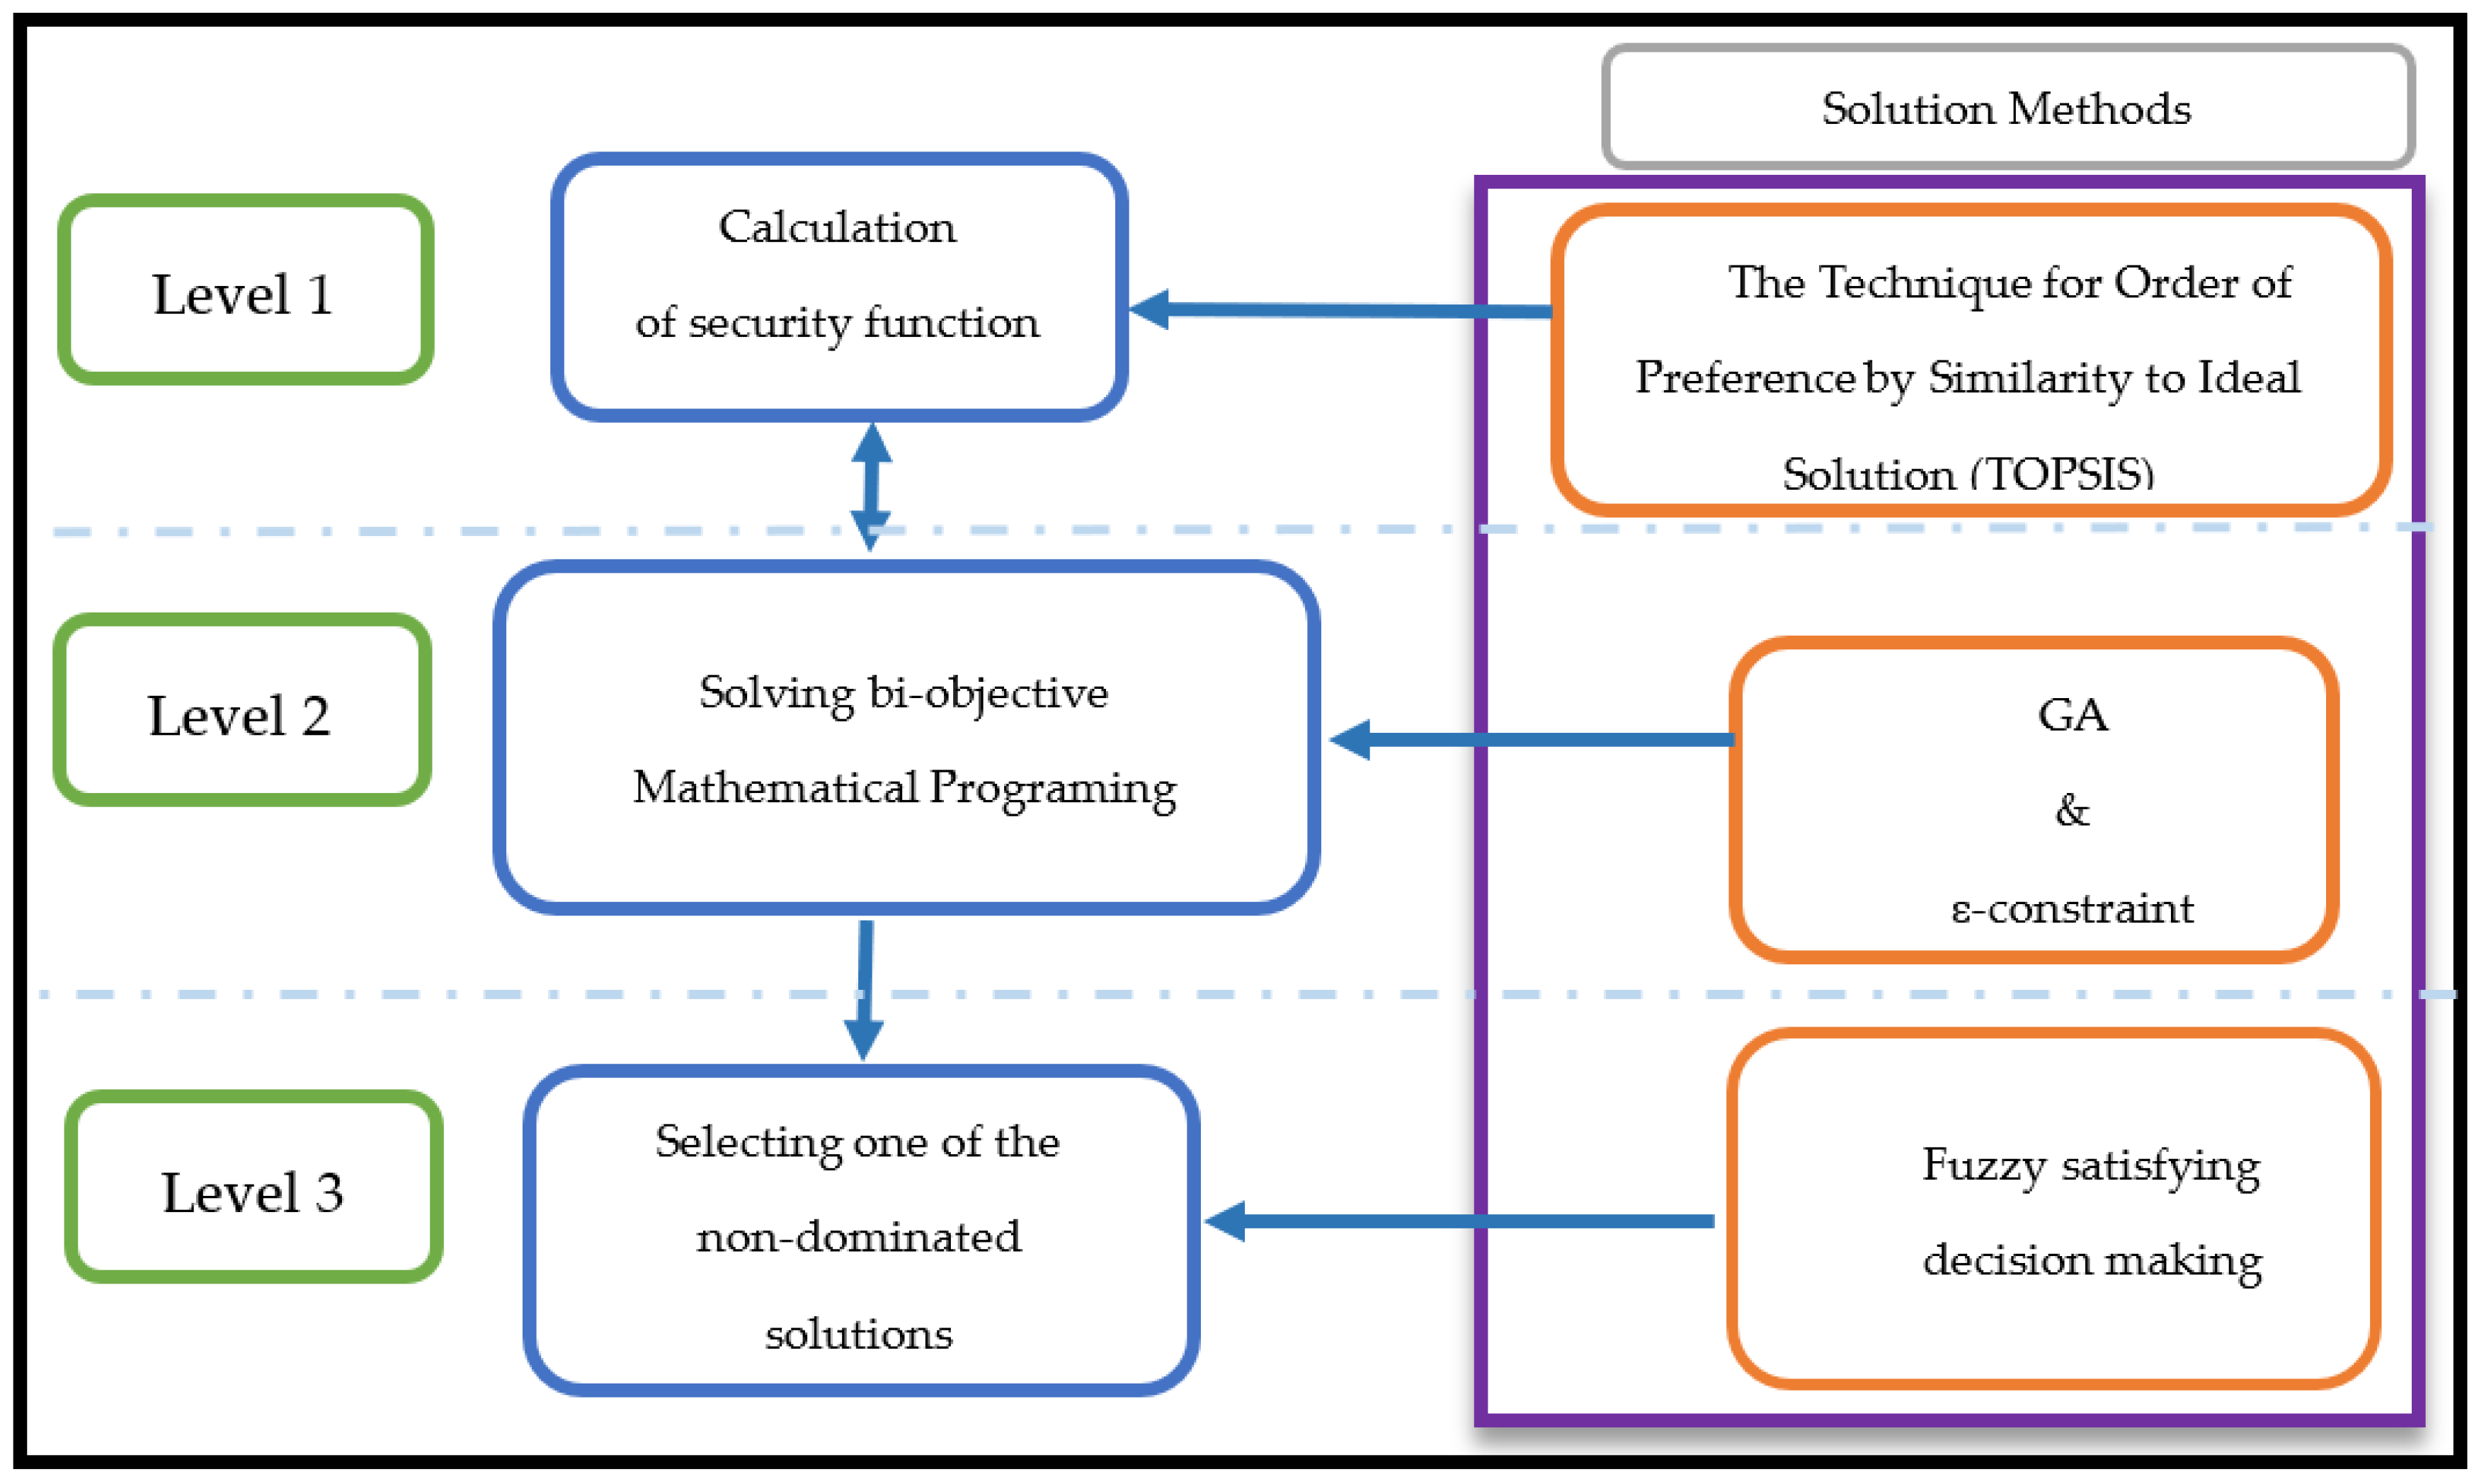
The scenario degree of severity (DOS) concept established based on the Technique for Order of Preference by Similarity to Ideal Solution (TOPSIS), a well-known multi-criteria decision making approach, has been shown in previous literature [18,19] that is capable enough to handle different metrics by considering the decision makers’ viewpoint. TOPSIS is a multi-criteria decision making approach that the chosen alternative should have the shortest geometric distance from the positive ideal solution (PIS) and the longest geometric distance from the negative ideal solution (NIS). One of the earliest works in this topic is developed by Lai and Hwang [20]. More information about TOPSIS is referred to [19]. In [18], DOS was used for selecting the most-secure operating point from a set of the Pareto optimal fronts in a multi-objective transmission congestion management framework. Also, in [19], DOS was used for making security-dependent decisions for the assessment of a proposed power generation plan. The application of multi-objective optimization in power systems is referred to [21]. Also, the impacts of contingencies on power system stability are referred to in [22].
It is very promising to use the DOS concept for proposing an effective mechanism to include resiliency in the power system planning approach.
According to the understanding gained from the above literature, FACTS devices placement could be an effective case study for applying the proposed method.

1.3. Content and Contributions

In this paper, after provision of a new resiliency improvement approach for power system planning, the proposed approach is applied for TCSC (known as one of the most popular FACTS devices) placement in power systems.
From the mentioned literature, it is observed that in spite of many attempts for resiliency improvement in power systems, none of the aforementioned valuable studies considers several resiliency metrics simultaneously in their proposed approach.
The major contributions of this paper are as follows:
  • Development of a novel multi-criteria resiliency improvement approach for transmission systems.
  • Improvement of all considered resilience metrics regardless of their amount in a multi-criteria decision making framework.
  • Development of a vulnerability function (VF) that reflects all considered resilience metrics.
  • Provision of a novel bi-objective mathematical model for resiliency improvement via TCSC placement.

1.4. Organization

After having provided the introductory information in Section 1, Section 2 describes the proposed methodology. The mentioned section is divided into two major parts. In the first part, by introducing resilience metrics, the VF is developed and in the second part, as an application, a bi-objective mathematical model is provided for TCSC placement by considering resiliency improvement. In Section 3, a solution approach is proposed for solving the bi-objective optimization model. In Section 4, the proposed methodology is applied to IEEE 30-bus and 118-bus test systems and the results are compared. Finally, Section 5 concludes the paper.

2. Methodology

2.1. Vulnerability Function

In this paper, in order to consider resiliency, first, a VF which considers outage-based indices is developed and second, the developed VF is minimized in a bi-objective mathematical framework. It is worth noting that outage consideration is very important and powerful power system operational tools such as security-constrained optimal power flow have been developed for this purpose [23]. For contingency sifting, the decision makers could employ the methods proposed in [19]. In this paper, N 1 contingencies are considered. The proposed VF is formulated based on DOS index which has been developed in [18,19]. The calculation procedure of DOS is depicted in Figure 1.
As depicted in Figure 1, the calculation procedure of DOS starts from constituting the decision matrix. For this purpose, the set of resilience metrics is considered. In this paper, the number of curtailed consumers, the importance of curtailed consumers, the amount of load loss, congestion management cost, and performance index are considered as the resilience metrics.
Similar to the previous multi-criteria decision making literature [24], power system planners are asked to provide a judgment matrix which is a comparison matrix of the resilience metrics. By applying the eigenvector technique, proposed by Saaty and Vargas [25], the pure weights of all metrics ( w j , j = 1 , , 5 ) are obtained and used for calculating DOS. More detail on the mathematical formulation is discussed in [18,19]. The decision matrix is calculated as
D = [ ρ 1 , 1 ρ 1 , 5 ρ n b , 1 ρ n b , 5 ρ ( n b + 1 ) , 1 ρ ( n b + 1 ) , 5 ρ 2 n b , 1 ρ 2 n b , 5 ]
where ρ i j is the jth resilience metrics of the ith contingency. In this matrix, metrics values related to the contingencies belonging to the cases before and after implementing the intended planning decision are indicated at the top and bottom of the matrix, respectively. In the next section, we consider TCSC placement as a case study for intended planning decision. By normalizing the decision matrix, each element of the matrix is obtained as
y i j = ρ i j max ρ i j j = 1 : 2 n b
Multiplying the columns of the normalized decision matrix by their corresponding weights yields the weighted decision matrix and each element is
z i j = w j y i j
The positive and negative ideal scenarios are obtained as
z i + = max z i j i = 1 : 2 n b
z i = min z i j i = 1 : 2 n b
The closeness of ith scenario to the positive and negative ideal scenario is calculated as
k i + = j = 1 5 ( z i j z j + ) 2    i = 1 , , 2 n b
k i = j = 1 5 ( z i j z j ) 2    i = 1 , , 2 n b
By defining h i = k i k i + + k i ( i = 1 , , 2 n b ), the DOS of each scenario is obtained
D O S i = h i j = 1 2 n b h j    i = 1 , , 2 n b
The VF is formulated as
V F = i = n b + 1 2 n b D O S i
where DOS i is the ith scenario degree of severity. It is noted that by minimizing VF , resiliency is improved. One of the advantages of this function is that it is able to reflect different consequences of disasters which are considered as the resilience metrics.
Since VF is able to consider different metrics regardless of their number (amount), the intended planning decision is able to be modeled as a bi-objective mathematical model as depicted in Figure 2. In this model, aggregative cost, which is the main objective function of all power system planning problems such as [26], could include investment, installation, operation, and also maintenance costs.
The proposed formulated VF can be traded-off with the aggregated cost objective to improve resiliency. Similar to the other mathematical planning models, satisfaction of Kirchhoff current law; active power limitation of generation units, voltage magnitude limitations, and many other technical, economical, and environmental constraints could be considered in the proposed model. One of the advantages of this proposed modeling framework is that it is capable enough to improve even numerous resiliency metrics in a bi-objective model without imposing any further complexity.
In the next subsection, the proposed modeling framework is applied for TCSC placement.

2.2. Bi-Objective TCSC Placement Model

An application of the proposed model, which is the determination of optimal location and size of the TCSCs, is considered through the following developed bi-objective mathematical model
M i n    f 1 = j = 1 n t I C T C S C j + i = 1 n g a i P g i 2 + b i P g i + c i
M i n    f 2 = V F
subject to
P g i P d i = V i j = 1 N V j ( G i j cos ( δ i δ j ) + B i j sin ( δ i δ j ) ) i = 1 : N
Q g i Q d i = V i j = 1 N V j ( G i j sin ( δ i δ j ) B i j cos ( δ i δ j ) ) i = 1 : N
| P l | P l max l = 1 : m
V i min V i V i max i = 1 : N
P g i min P g i P g i max i = 1 : N
Q g i min Q g i Q g i max i = 1 : N
P l o s s _ a P l o s s _ b
In this model, f 1 is composed of the aggregation of Investment Cost (IC) of TCSCs and operational cost of power generation units, and f 2 is the VF. Equations (12) and (13) guarantee Kirchhoff’s current law in each of the transmission buses. Equations (14)–(17) retain the power flow of each line, the voltage magnitude of each bus, the active and reactive power generation of each generation unit within their limits, respectively. Also we can consider (18) in order to guarantee that active power losses do not worsen after TCSC placement. Active power loss could also be considered as the objective function. Since the focus of this paper is on providing an effective multi-objective TCSC placement model for vulnerability consideration, active power loss is not included in the objective function set. It is worth mentioning that the proposed model is capable enough to include environmental constraints such as CO2 emission restriction. However, such consideration is beyond the scope of this paper. In Equations (12) and (13), G i j and B i j are known as the real and imaginary parts of the nodal admittance matrix
G i j = R e [ y i j ]
B i j = I m [ y i j ]
where y i j is the ijth element of the nodal admittance matrix. TCSC affects the reactance of the transmission line as
x i j = x i j b ( 1 + r T C S C k i j )
k i j { 0 , 1 }
0.7 r T C S C 0.2
where x i j is total reactance of transmission line after TCSC placement, x i j b is the reactance of line ij before installing TCSC. k i j is a binary index which is 0 if the TCSC is not located in line ij and is 1 if the TCSC is located in this line. Equation (23) represents the safe operation limits of TCSC for stability purposes [27].

3. Solution Approach

By combination of TOPSIS, ε-constraint method and genetic algorithm (GA) for solving the proposed multi-objective mixed-integer optimization model of (10)–(18), the Pareto-optimal front is obtained and a final solution is achieved using the fuzzy satisfying decision making approach. As a whole, the proposed approach is divided into three levels of decision making, which is shown in Figure 3. The ε-constraint method treats the multi-objective model as a single-objective model by retaining one of the objective functions and treating the others in the constraints. More information about ε-constraint method is found in [28]. For solving the problem, the following steps are taken:
Step 1—Obtaining point A: Consider (10) as the single objective function with the set of (12)–(18) as the constraints. This single-objective optimization is solved by GA. The reason for selecting GA is because of the GA capabilities for solving non-linear non-convex problems [29]. For applying GA to this problem, a chromosome has been designed as [ L O , R A ] , where LO is an array with the size of n b r a n c h the elements of which are either 1 or 0. If in a chromosome the element t of L O array ( 1 t n b r a n c h ) is 1, it means that in that chromosome the transmission line t is considered as a location for TCSC placement. In this designed chromosome, RA is also an array with the size of n b r a n c h whereby its element t is the degree of compensation ( 0.7 r T C S C 0.2 ) in the transmission line t. The other GA parameters such as population, mutation, and crossover are set. By solving this single-objective optimization point A is obtained. The respective fitness function is named f 1 and if any of the constraints of Equations (12)–(18) are not satisfied, a large number will be yielded.
Step 2—Obtaining point B: Consider (11) as the single objective function with the set of Equations (12)–(18) as the constraints. For solving this single objective optimization, the chromosome has been designed the same as in Step 1. For each of the chromosomes, the N 1 contingencies before and after placement of the chromosome’s related TCSCs are evaluated and afterwards the decision matrix of (1) is constituted. For evaluation of each contingency and for obtaining the related resilience metrics, classical transmission congestion management model of [30] is solved. After constituting the decision matrix, by applying Equations (2)–(9) VF is evaluated. By solving this single-objective optimization, point B is obtained. The related fitness function is named f 2 and if any of the constraints of Equations (12)–(18) are not satisfied, a large number will be yielded. It is noted that f 2 , which is VF, is obtained based on Equations (2)–(9).
Step 3—Calculate ε = f 1 ( B ) f 1 ( A ) n
Step 4—Consider k = 1
Step 5—Consider VF, Equation (11), as the single objective function with Equations (12)–(18) and (24) as the constraints
i = 1 n g a i P g i 2 + b i P g i + c i f 1 ( B ) k ε
Solving the resultant single-objective optimization model by GA yields a non-dominated solution from the Pareto-optimal set.
Step 6—Consider k = k + 1 . If k n 1 , go to Step 5
Step 7—Apply fuzzy satisfying decision making for selecting one of the non-dominated solutions among the obtained Pareto-front. Fuzzy decision making has been applied for selecting a compromise solution among the obtained Pareto-optimal front [31]. The decision makers’ degree of satisfaction from both objective functions is shown by linear membership function [31]
η g i ( X ¯ ) = { 0 g i ( X ¯ ) > g i m a x g i m a x g i ( X ¯ ) g i m a x g i min g i m i n g i ( X ¯ ) g i m a x 1 g i ( X ¯ ) < g i m i n
where g i ( X ¯ ) is the ith objective function, thereafter, a desirable level of achievement for both objective functions is chosen and shown by η r i . The final solution is found from the following minimax optimization problem [31].
m i n X ¯ ϕ i = 1 2 | η r i η g i ( X ¯ ) | p
where η r i is the desirable level of achievement for the ith objective function.

4. Tests and Results

In this section, the proposed approach is examined and evaluated on IEEE 30-bus and 118-bus test systems and the results are analyzed.
All simulations are carried out using MATPOWER package [32] and MATLAB Optimization Toolbox.

4.1. IEEE 30-Bus Test System

IEEE 30-bus test system is a standard test system with 6 generation units, 41 transmission lines, and 20 loads. The topology and some basic information related to this test system has been taken from [33]. The active and reactive power demands and cost function of the system’s generation units are provided in Table 1 and Table 2, respectively. As shown in Table 1, the total active load of the system is 212 MW, which is distributed among different transmission buses.
For calculating the VF, the judgment matrix A is assumed and by applying the technique in [25], the pure weights of resiliency metrics are obtained as 0.201, 0.1238, 0.4682, 0.0179, and 0.1891 for the number of curtailed consumers, the importance of curtailed consumers, the amount of load loss, congestion management cost, and performance index, respectively. The type and importance of the loads is shown in Table 3. It is also assumed that 1 MW in residential and commercial buses feeds 700 consumers. The rate of interest and investment period are considered 5% and 20 years, respectively. After examining different population size and generation numbers in the GA, which is part of the solution approach in Section 3, the values are set at 20 and 100, respectively. Also, in fuzzy satisfying decision making, desirable levels of achievement for cost and VF are considered 0.5 and 0.4, respectively.
By applying the proposed procedure given in Section 3, the Pareto-optimal fronts before and after applying loss constraint (18) are obtained as shown in Figure 4. As seen from this figure, in this case study, considering loss constraint causes the obtained Pareto-optimal solutions to deteriorate, which results in a non-dominated solution set with worse vulnerability and cost in some of the non-dominated solutions.
Table 4 provides more details about the obtained non-dominated solutions of Figure 4 in the case of considering loss constraint. It is observed from this table that the range of cost of the obtained non-dominated solution set is 451.3742 $/h, i.e., 33.2%. To compromise between the obtained solutions, the fuzzy satisfying decision making of Section 3 is implemented. The result shows that the eighth and ninth non-dominated solutions of Table 4 are obtained as the final solution for the case before and after considering loss constraint, respectively.
For the obtained final solutions, the averages of the resilience metrics have been obtained for three cases, which are shown in Table 5.
  • Case 1: Only considering cost as the objective function without considering resiliency.
  • Case 2: The proposed approach without considering loss constraint.
  • Case 3: The proposed approach by considering loss constraint.
In each case, firstly, N 1 contingencies due to the outage of transmission lines are simulated, relevant metrics for each contingency are obtained, and then the average of each metric in all contingencies is obtained as depicted in Table 5. It is observed that the average of resiliency-based metrics (performance index, the amount of loss of load, the importance of curtailed consumers, the number of curtailed consumers, and congestion management cost) are reduced in Cases 2 and 3 compared to Case 1. From Figure 4, it is observed that by considering loss constraint, the obtained Pareto-front is worsened. However, the result of Table 5 shows that the average of resiliency metrics in the obtained final solution has no significant difference in Case 2 in comparison with Case 3. It is noted that the obtained final solution highly depends on the satisfactory level of fuzzy decision making. In this case, by considering desirable levels of achievement 0.5 for cost and 0.4 for VF, the obtained final solution for cases without and with considering loss constraint is eighth and ninth Pareto-optimal point. As observed from Figure 4, these points are very close, hence no significant difference in Case 2 in comparison with Case 3 is observed. It is also shown in Table 5 that considering additional loss constraint causes aggregative cost to be increased.
The resilience metrics of the final solutions in Cases 1 and 3 are shown in Figure 5 and Figure 6. It can be seen from these figures that the resilience metrics are improved as a whole for contingencies (disaster scenarios) in the case of implementing the proposed approach.

4.2. IEEE-118 Bus Test System

In this subsection, the proposed approach is applied to IEEE 118 bus test system. The single-line diagram of the system is referred to in Figure 1 of [34]. The information related to active and reactive power demand, cost function of power plants is derived from MATPOWER [32].
The judgment matrix, rate of interest and investment period are assumed to be the same as in the previous case study. The importance and type of the consumers connected to each bus are the same as in Table 3. As an additional assumption, the demands connected to the other load buses are assumed to be residential or commercial and the importance of their consumers is low.
By implementing the proposed approach, the obtained Pareto-optimal solutions for the cases with and without considering loss constraint are depicted in Figure 7. It is observed that by considering the loss constraint the range of Pareto-optimal front is reduced in comparison with the case without considering loss constraint. From the obtained results, the range of cost is reduced from 520 ($/h) to 280 ($/h) and the range of VF from 0.3914 to 0.3007. As seen from Figure 7, in this case study, the obtained non-dominated solutions in the case of considering loss constraint overlaps with a region of Pareto-front obtained for the case without considering loss constraint. From this observation, we conclude that in the overlapping region, (18) is a redundant constraint. The average of resilience metrics for the obtained Pareto-optimal front in the case of considering the loss constraint is presented in Table 6.
By considering desirable levels of achievement 0.5 and 0.4 for the cost and VF, the non-dominated solution 5 is selected as the final solution. Figure 8 shows the resilience metrics improvement of this final solution in comparison with the single objective case by considering only cost as the objective function without any regard for resilience merits. By considering resilience metrics, the performance index, the importance of curtailed consumers, congestion management cost, the number of curtailed consumers, and the amount of load loss are 45.72, 0.41, 7.33 $/h, 125, 0.18 MW, respectively. As seen from Figure 8, these metrics are improved by 0.63%, 43.52%, 65.19%, 85.93%, and 85.94%, respectively. Also, in this case study, the amount of load losses and the number of curtailed consumers are the most affected resilience metrics. This improvement in resilience metrics is obtained by sacrificing the cost objective function by 80 $/h, i.e., 0.05%.

5. Conclusions

Resiliency considerations in any energy management mechanism are crucial, especially in power systems in which transmission components are always exposed to undesirable outages due to natural disasters. To address this issue, a resiliency-based multi-criteria energy management scheme by optimal TCSC placement is proposed in this paper. To this end, first, a VF is developed based on the scenario DOS concept, which is able to consider different resilience metrics such as the number of curtailed consumers, the importance of curtailed consumers, the amount of load loss, congestion management cost, and performance index while evaluating contingencies. Several advantages are attained for the proposed VF: (i) considering different resilience metrics which might be a matter of importance from the viewpoint of the transmission system operators, (ii) including decision makers’ preferences while evaluating the resilience metrics, (iii) simple and easy-to-understand calculation. In this paper, for the optimal placement of TCSC, a mathematical model is developed for the trade-off between the cost and VF. In order to maintain the amount of active loss less or equal to the case before TCSC placement, a relevant constraint is considered in the proposed mathematical model. A combination of TOPSIS, the ε-constraint method and GA is used for obtaining the Pareto-optimal front. After obtaining the Pareto-optimal front, a fuzzy satisfying decision making approach is employed for selecting the most preferred non-dominated solution from the Pareto-optimal front.
The proposed method is applied to IEEE 30-bus and 118-bus test systems and the results are analyzed and compared. The analysis of the results shows that the proposed approach is able to efficiently consider resilience metrics. The proposed approach gives the decision makers the option to select their most preferred non-dominated solution by considering not only operation cost, but also a set of resiliency-based congestion-driven indices. Furthermore, the results show that the average of pertaining resilience metrics of the final solutions improves considerably in both IEEE-30 bus and IEEE-118 bus test systems. For the obtained final solution of the IEEE-118 bus test system, the performance index, the importance of curtailed consumers, congestion management cost, the number of curtailed consumers, and the amount of load loss are 45.72, 0.41, 7.33 ($/h), 125, 0.18 (MW), respectively. As seen from Figure 8, these metrics are improved by 0.63%, 43.52%, 65.19%, 85.93%, and 85.94%, respectively. In this case study, the amount of load loss and the number of curtailed consumers are the most affected resilience metrics. This improvement in resilience metrics is obtained by sacrificing the cost objective function by $80/h, i.e., 0.05%. As a future research task, the impact of different types of FACTS devices for security improvement is suggested to be studied. Furthermore, the approach developed in this study can be easily applied to the other power system operation and planning problems in which resiliency is to be considered. For example, optimal transmission switching is considered as an effective flexible tool for improving the economic situation of electricity market operation. However, transmission switching might affect resiliency. The proposed procedure of this paper could be very promising for devising a new resilient transmission switching approach. Also, in the other planning problems such as transmission and generation expansion planning, the devised resiliency modeling approach could be implemented and developed.

Author Contributions

All authors worked on this manuscript together and all authors have read and approved the final manuscript.

Funding

J.P.S.C. acknowledges the support by FEDER funds through COMPETE 2020 and by Portuguese funds through FCT, under 02/SAICT/2017 (POCI-01-0145-FEDER-029803).

Conflicts of Interest

The authors declare no conflict of interest.

Nomenclature

x i j b Reactance of line ij before TCSC placement.
r T C S C Degree of compensation.
t i j jth resilience metric of the ith disaster scenario.
S a Set of disaster scenarios after TCSC placement.
S b Set of disaster scenarios before TCSC placement.
A Judgment matrix.
VF Vulnerability function.
n a Number of disaster scenarios after TCSC placement.
n g Number of generation units.
n t Number of TCSCs.
k i j A binary index which is 0 if TCSC is not located in line ij and 1 if the TCSC is located in this line.
η r i Desirable level of achievement for the ith objective function, i = 1 : 2 .
η g i ( X ¯ ) Level of satisfaction of solution X ¯ with respect to ith objective function, i = 1 : 2 .
D O S i Degree of severity of ith disaster scenario, i = 1 : 2 n b .
n b Number of transmission line outages.
W Pure weights of resilience metrics.
P l o s s _ a Transmission system losses after TCSC placement.
P l o s s _ b Transmission system losses before TCSC placement.
NNumber of power system buses.
n b r a n c h Number of transmission lines.
DDecision matrix.
ρ i j jth resilience metrics of the ith contingency.
z i + Positive ideal scenario.
z i Negative ideal scenario.
H I C T C S C j Investment cost of TCSCs.
y i j ijth element of the nodal admittance matrix.

References

  1. Panteli, M.; Mancarella, P. Influence of extreme weather and climate change on the resilience of power systems: Impacts and possible mitigation strategies. Electr. Power Syst. Res. 2015, 127, 259–270. [Google Scholar] [CrossRef]
  2. Panteli, M.; Pickering, C.; Wilkinson, S.; Dawson, R.; Mancarella, P. Power system resilience to extreme weather: Fragility modelling, probabilistic impact assessment, and adaptation measures. IEEE Trans. Power Syst. 2017, 32, 3747–3757. [Google Scholar] [CrossRef]
  3. Yuan, C.; Illindala, M.S.; Khalsa, A.S. Modified Viterbi algorithm based distribution system restoration strategy for grid resiliency. IEEE Trans. Power Deliv. 2017, 32, 310–319. [Google Scholar] [CrossRef]
  4. Sarwat, A.I.; Amini, M.; Domijan, A.; Damnjanovic, A.; Kaleem, F. Weather-based interruption prediction in the smart grid utilizing chronological data. J. Mod. Power Syst. Clean Energy 2016, 4, 308–315. [Google Scholar] [CrossRef]
  5. Gholami, A.; Shekari, T.; Amirioun, M.H.; Aminifar, F.; Amini, M.H.; Sargolzaei, A. Toward a consensus on the definition and taxonomy of power system resilience. IEEE Access 2018, 6, 32035–32053. [Google Scholar] [CrossRef]
  6. Sedzro, K.S.A. Reliability and Resiliency Driven Solutions for Electric Power Systems Operation and Planning; Lehigh University: Bethlehem, PA, USA, 2018. [Google Scholar]
  7. Dong, P.; Xu, L.; Lin, Y.; Liu, M. Multi-objective coordinated control of reactive compensation devices among multiple substations. IEEE Trans. Power Syst. 2018, 33, 2395–2403. [Google Scholar] [CrossRef]
  8. Pezeshki, H.; Arefi, A.; Ledwich, G.; Wolfs, P. Probabilistic voltage management using OLTC and dSTATCOM in distribution networks. IEEE Trans. Power Deliv. 2018, 33, 570–580. [Google Scholar] [CrossRef]
  9. Packiasudha, M.; Suja, S.; Jerome, J. A new Cumulative Gravitational Search algorithm for optimal placement of FACT device to minimize system loss in the deregulated electrical power environment. Int. J. Electr. Power Energy Syst. 2017, 84, 34–46. [Google Scholar] [CrossRef]
  10. Ziaee, O.; Choobineh, F.F. Optimal location-allocation of TCSC devices on a transmission network. IEEE Trans. Power Syst. 2017, 32, 94–102. [Google Scholar] [CrossRef]
  11. Kapetanaki, A.; Levi, V.; Buhari, M.; Schachter, J.A. Maximization of wind energy utilization through corrective scheduling and FACTS deployment. IEEE Trans. Power Syst. 2017, 32, 4764–4773. [Google Scholar] [CrossRef]
  12. Zhang, X.; Tomsovic, K.; Dimitrovski, A. Security constrained multi-stage transmission expansion planning considering a continuously variable series reactor. IEEE Trans. Power Syst. 2017, 32, 4442–4450. [Google Scholar] [CrossRef]
  13. Jordehi, A.R. Optimal allocation of FACTS devices for static security enhancement in power systems via imperialistic competitive algorithm (ICA). Appl. Soft Comput. 2016, 48, 317–328. [Google Scholar] [CrossRef]
  14. Yorino, N.; El-Araby, E.; Sasaki, H.; Harada, S. A new formulation for FACTS allocation for security enhancement against voltage collapse. IEEE Trans. Power Syst. 2003, 18, 3–10. [Google Scholar] [CrossRef]
  15. Elmitwally, A.; Eladl, A.; Morrow, J. Long-term economic model for allocation of FACTS devices in restructured power systems integrating wind generation. IET Gener. Transm. Distrib. 2016, 10, 19–30. [Google Scholar] [CrossRef]
  16. Soroudi, A.; Maghouli, P.; Keane, A. Resiliency oriented integration of DSRs in transmission networks. IET Gener. Transm. Distrib. 2017, 11, 2013–2022. [Google Scholar] [CrossRef]
  17. Jafarzadeh, J.; Haq, M.T.; Mahaei, S.M.; Farhadi, P. Optimal placement of FACTS devices based on network security. In Proceedings of the 2011 3rd International Conference on Computer Research and Development, Shanghai, China, 11–13 March 2011; Volume 3, pp. 345–349. [Google Scholar]
  18. Salehizadeh, M.R.; Rahimi-Kian, A.; Oloomi-Buygi, M. Security-based multi-objective congestion management for emission reduction in power system. Int. J. Electr. Power Energy Syst. 2015, 65, 124–135. [Google Scholar] [CrossRef]
  19. Salehizadeh, M.R.; Rahimi-Kian, A.; Oloomi-Buygi, M. A multi-attribute congestion-driven approach for evaluation of power generation plans. Int. Trans. Electr. Energy Syst. 2015, 25, 482–497. [Google Scholar] [CrossRef]
  20. Lai, Y.-J.; Liu, T.-Y.; Hwang, C.-L. Topsis for MODM. Eur. J. Oper. Res. 1994, 76, 486–500. [Google Scholar] [CrossRef]
  21. Tomoiagă, B.; Chindriş, M.; Sumper, A.; Sudria-Andreu, A.; Villafafila-Robles, R. Pareto optimal reconfiguration of power distribution systems using a genetic algorithm based on NSGA-II. Energies 2013, 6, 1439–1455. [Google Scholar] [CrossRef]
  22. Mohammadi, F.; Zheng, C. Stability Analysis of Electric Power System. In Proceedings of the 2018 4th National Conference on Technology in Electrical and Computer Engineering, Bern, Switzerland, 20–22 December 2018; pp. 20–22. [Google Scholar]
  23. Madani, R.; Ashraphijuo, M.; Lavaei, J. Promises of conic relaxation for contingency-constrained optimal power flow problem. IEEE Trans. Power Syst. 2015, 31, 1297–1307. [Google Scholar] [CrossRef]
  24. Qin, J.; Liu, X.; Pedrycz, W. An extended TODIM multi-criteria group decision making method for green supplier selection in interval type-2 fuzzy environment. Eur. J. Oper. Res. 2017, 258, 626–638. [Google Scholar] [CrossRef]
  25. Saaty, T.L.; Vargas, L.G. Models, Methods, Concepts and Applications of the Analytic Hierarchy Process; Springer: New York, NY, USA, 2012. [Google Scholar]
  26. Lu, Z.; Li, H.; Qiao, Y. Probabilistic flexibility evaluation for power system planning considering its association with renewable power curtailment. IEEE Trans. Power Syst. 2018, 33, 3285–3295. [Google Scholar] [CrossRef]
  27. Cai, L.; Erlich, I.; Stamtsis, G. Optimal choice and allocation of FACTS devices in deregulated electricity market using genetic algorithms. In Proceedings of the IEEE PES Power Systems Conference and Exposition, New York, NY, USA, 10–13 October 2004; pp. 201–207. [Google Scholar]
  28. Mavrotas, G.; Florios, K. An improved version of the augmented ε-constraint method (AUGMECON2) for finding the exact pareto set in multi-objective integer programming problems. Appl. Math. Comput. 2013, 219, 9652–9669. [Google Scholar] [CrossRef]
  29. Östermark, R. A multipurpose parallel genetic hybrid algorithm for non-linear non-convex programming problems. Eur. J. Oper. Res. 2004, 152, 195–214. [Google Scholar] [CrossRef]
  30. Conejo, A.J.; Milano, F.; García-Bertrand, R. Congestion management ensuring voltage stability. IEEE Trans. Power Syst. 2006, 21, 357–364. [Google Scholar] [CrossRef]
  31. Maghouli, P.; Hosseini, S.H.; Buygi, M.O.; Shahidehpour, M. A multi-objective framework for transmission expansion planning in deregulated environments. IEEE Trans. Power Syst. 2009, 24, 1051–1061. [Google Scholar] [CrossRef]
  32. Zimmerman, R.; Murillo-Sanchez, C.; Gan, D. MATPOWER: A MATLAB Power System Simulation Package. 2006. Available online: http://pserc.cornell. edu/matpower (accessed on 1 June 2019).
  33. Salehizadeh, M.R.; Soltaniyan, S. Application of fuzzy Q-learning for electricity market modeling by considering renewable power penetration. Renew. Sustain. Energy Rev. 2016, 56, 1172–1181. [Google Scholar] [CrossRef]
  34. Pena, I.; Martinez-Anido, C.B.; Hodge, B.-M. An extended IEEE 118-bus test system with high renewable penetration. IEEE Trans. Power Syst. 2017, 33, 281–289. [Google Scholar] [CrossRef]
Figure 1. Calculation procedure of DOS.
Energies 12 02601 g001
Figure 2. Holistic bi-objective model.
Energies 12 02601 g002
Figure 3. Decision making levels.
Energies 12 02601 g003
Figure 4. Obtained Pareto-optimal front for IEEE 30-bus test system. Note: By increasing vulnerability function, resiliency is deteriorated.
Energies 12 02601 g004
Figure 5. Resilience metrics for the final solution in Cases 1 and 3.
Energies 12 02601 g005
Figure 6. Congestion management cost for the final solution in Cases 1 and 3.
Energies 12 02601 g006
Figure 7. Obtained Pareto-optimal front for the IEEE 118-bus test system. Note: By increasing vulnerability function, resiliency is deteriorated.
Energies 12 02601 g007
Figure 8. Percentage of improvement in resilience metrics: 1—performance index; 2—importance of curtailed consumers; 3—congestion management cost; 4—number of curtailed consumers; 5—amount of load loss.
Energies 12 02601 g008
Table 1. Active and Reactive Power Demands.
BusActive Power (MW)Reactive Power (Mvar)BusActive Power (MW)Reactive Power (Mvar)
1001610.51.8
221.712.717185.8
32.41.2183.20.9
47.61.6199.53.4
500204.40.7
6002117.511.2
722.810.92200
82430233.21.6
900248.76.7
105.822500
1100263.52.3
1211.27.52700
13002800
146.21.6292.40.9
158.22.53021.21.9
Table 2. Cost Function of the Systems’ Generation Units.
BusActive Generation Power (MW)Cost Coefficients
abc
123.5420.0223.54
260.971.750.017560.97
2221.5910.062521.59
2726.91200.038426.91
2319.2200.2519.2
1337400.0137
Table 3. Importance and Type of the Consumers Connected to Each Bus.
BusType of Connected ConsumersImportance of the Consumers
2, 10, 30IndustrialHigh
12, 14IndustrialMedium
8, 20, 24IndustrialLow
4, 15, 21Residential/commercialHigh
19, 26, 29Residential/commercialMedium
3, 7, 16, 17, 18, 23Residential/commercialLow
Table 4. Detailed Information about the Obtained Pareto-Front in the Case of Considering Loss Constraint Shown in Figure 4.
Non-Dominated SolutionsCost ($/h)Vulnerability FunctionPower Loss (MW)Investment Cost of TCSC ($/h)
19080.5108570.795.6377
2937.50.4893576.5333.9128
3939.20.4861638.1122.6151
4941.80.4721623.3228.2960
5979.80.472664.0233.9768
6996.80.4689678.5725.4300
71041.30.4649681.2231.0500
81051.10.4564673.8829.7319
91090.50.4287692.1728.1871
101170.90.4135667.4525.3823
1112240.4051685.3828.1995
121227.50.3933646.2929.6592
131234.60.3748666.7538.0800
141251.50.3668672.6632.5044
151359.40.3546650.4026.8742
Table 5. Average of the Resilience Metrics and Operation Cost.
Resilience MetricsCase1Case 2Case 3
Average of the metricsPerformance index7.3446.96.622
Amount of loss of load0.9010.6640.623
Importance of curtailed consumers1.5651.151.143
Number of curtailed consumers2529088
Congestion management cost41.4619.815.1
Total installation cost of TCSC ($/h)5.6429.59128.19
Operation cost related to the final solution ($/h)902.391037.81062.3
Table 6. Average of Resilience Metrics for the Obtained Non-Dominated Set in IEEE 118-Bus Test System.
Non-Dominated SolutionsPerformance IndexAmount of Loss of LoadImportance of Curtailed ConsumersNumber of Curtailed ConsumersCongestion Management Cost ($/h)Vulnerability FunctionCost ($/h)
146.011.2680.72688821.0430.631159,830
246.5760.44260.49131010.7890.5535159,850
345.9830.2950.49520714.520.549159,860
446.2680.3060.4062157.2010.5137159,880
545.7200.1780.4101257.3260.4925159,910
646.0540.0630.331443.50.421159,920
745.5550.0460.249332.7030.3756159,940
846.140.04140.248292.3650.3706160,040
946.450.0390.166282.2960.3303160,110

