Article

A Rebalancing Strategy for the Imbalance Problem in Bike-Sharing Systems

College of Computer Science, Sichuan University, Chengdu 610065, Sichuan, China
*
Author to whom correspondence should be addressed.
Energies 2019, 12(13), 2578; https://doi.org/10.3390/en12132578
Submission received: 25 May 2019 / Revised: 29 June 2019 / Accepted: 1 July 2019 / Published: 4 July 2019
(This article belongs to the Special Issue Energy Saving at Cities)

Abstract

:
Shared bikes have become popular traveling tools in our daily life. The successful operation of bike sharing systems (BSS) can greatly promote energy saving in a city. In BSS, stations becoming empty or full is the main cause of customers failing to rent or return bikes. Some truck-based rebalancing strategies are proposed to solve this problem. However, there are still challenges around the relocation of bikes. The truck operating costs also need to be considered. In this paper, we propose a customer-oriented rebalancing strategy to solve this problem. In our strategy, two algorithms are proposed to ensure the whole system is balanced for as long as possible. The first algorithm calculates the optimal state of each station through the one-dimensional Random Walk Process with two absorption walls. Based on the derived optimal state of each station, the second algorithm recommends the station that has the largest difference between its current state and its optimal state to the customer. In addition, a simulation system of shared bikes based on the historical records of Bay Area Bikeshare is built to evaluate the performance of our proposed rebalancing strategy. The simulation results indicate that the proposed strategy is able to effectively decrease the imbalance in the system and increase the system’s performance compared with the truck-based methods.

1. Introduction

Energy saving is a vital task for the sustainable development of a city [1]. The government attaches great importance to the development of bike sharing systems (BSS), since they can greatly help reduce urban energy consumption [2,3]. We think the essential condition for the successful operation of BSS is solving the imbalance problem.
In BSS, the imbalance problem means some stations are empty (there are no available bikes for renting) while some stations are full (there are no empty docks for returning). A customer will experience an unsatisfactory service when there are no available bikes or docks at a station. Improving customer satisfaction is one of the tasks for BSS operators.
In order to deal with the imbalance problem, the operators of BSS need to relocate bikes among stations by trucks. Some static truck-based strategies for relocating bikes have been proposed [4,5,6]. The repositioning time is usually at the system’s idle time (such as midnight) in these truck-based strategies. Recently, some work has paid attention to dynamic truck-based strategies which relocate bikes based on the advanced prediction of bikes [7,8,9]. However, the truck-based approaches are not only expensive to operate but also violate the low-carbon goal of bike-share due to the amount of pollution from the trucks.
There are also some strategies that encourage customers to participate in bike allocation. For example, some bike-sharing systems incentivize customers to rent bikes from stations with many available bikes and return to those with many empty docks by giving fare discounts [10,11,12]. Implementing the customer-oriented rebalancing strategies should consider the following tasks: (1) Determine the optimal number of bikes for each station; (2) Deal with the changing of bike demand over time in a day; (3) Suggest the incentive station which cannot be too far from customer’s original target station; and (4) Set an appropriate bonus for the customer under a limited budget. In existing studies, the incentive strategies will be implemented only when a station’s number of bikes is not enough. However, the station is already in a bad state when its number of bikes is not enough, which will effect the performance of incentive measures.
In this paper, we propose a strategy which can help the system choose a suitable time and determine a suitable station for implementing the incentive measure. Based on the proposed strategy, a bike-sharing system can effectively lengthen its uptime. First, the proposed strategy calculates the most suitable number of available bikes for each station. Then it determines the station which has the largest capacity for renting. In addition, the walking distance is also considered in the strategy. Take an instance in Figure 1—a customer intends to rent a bike at station S1. At present, S1 has eight available bikes, which is less than the optimal state (ten available bikes). According to the idea of our proposed strategy, a returning action is helpful for S1 to reach its optimal state rather than a renting action. Therefore, the system should incentivize him to rent a bike at station S2. S2 is within r1 meters away from S1. After this rebalancing, the states of S1 and S3 will not be worse. At the same time, S2 can also reach its optimal state. For the bike-sharing system, the result reduces the probability of the imbalance problem occurring in future. The main contributions of this work are listed as follows.
  • An algorithm based on the Random Walk Process with two absorption walls (RWTAW) is proposed to calculate the optimal state of each station at a specific time. We prove that a station in the optimal state has the lowest possibility of being empty or full.
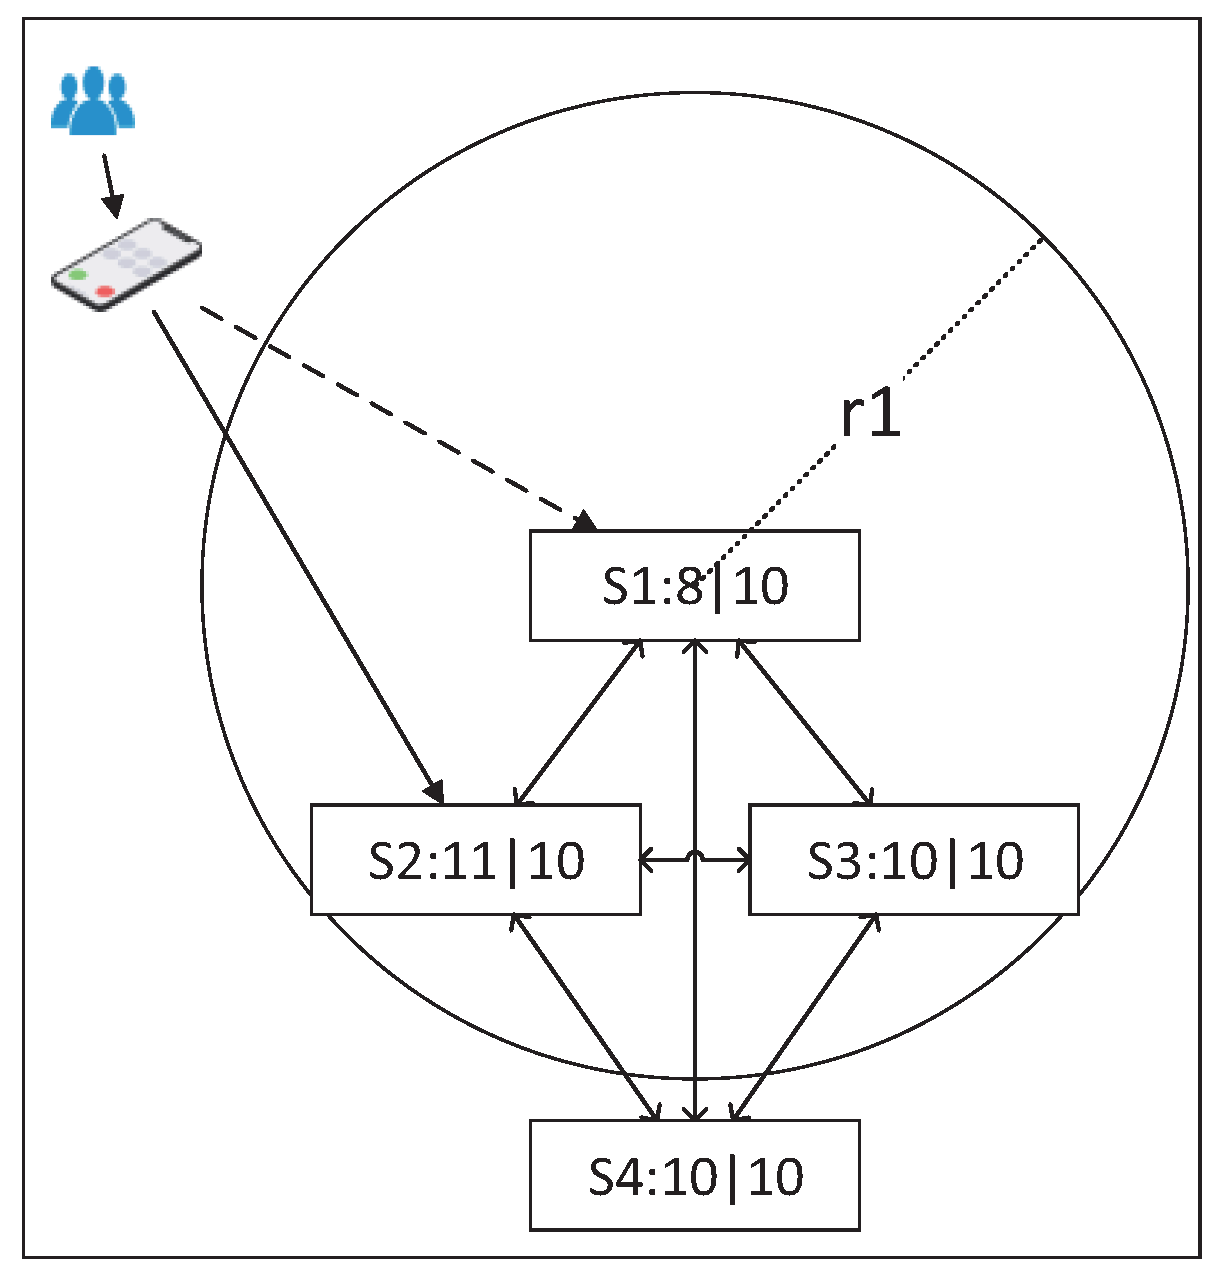
  • An algorithm called the largest the first (TLTF) is proposed to choose the optimal station among the candidate stations on consideration of the walking distance and the minimal influence for the chosen station.
  • Through establishing a simulation model of BSS based on historical datasets, we verify the effectiveness of our strategy for solving the imbalance problem compared with the truck-based static and dynamic strategies.
The rest of this paper is organized as follows. Section 2 gives an outline of the development of BSS and research on rebalancing optimization; the problem statement and the framework are presented in Section 3; Section 4 introduces the details of the RWTAW and TLTF algorithms; we talk about the performance of the proposed rebalancing strategy in Section 5; finally, we conclude this work and look forward to future research in Section 6.

2. Related Work

BSS has achieved great development, with the goal of solving the “last kilometer” problem in cities [13], since it was first built in Amsterdam in 1965. The first kind of BSS is the traditional dock-based bike sharing system in which a customer must rent and return the bike at a dock and the number of docks at each station is fixed, such as the CitiBike in New York and the Hubway in Boston. The second is the dockless bike-sharing system such as the Mobike and Ofo in China. Each bike has a unique QR code and GPS tracking model. These two technologies increase the ease of use and management. The biggest advantage of the dockless bike-sharing system is customers can easily rent bikes via a smartphone app and park the bikes at any valid places [14,15,16]. The convenience also brings some problems, for example, operators have to rebalance the bikes. The existing studies on BSS mainly focus on the following aspects.

2.1. System Rebalancing

In BSS, system rebalancing is the main method for solving the imbalance problem. The truck-based rebalancing strategies and the customer-oriented rebalancing strategies are two popular approaches. In this section, we will introduce these two approaches in detail.

2.1.1. Truck-Based Rebalancing

The truck-based rebalancing approaches have two main challenges, that is, determining the optimal inventory for each station and designing the optimal truck route with budget constraint. The approaches can be summarized into two categories according to the time of rebalancing. (1) Static Repositioning. Chemla et al. [4] used a branch-and-cut algorithm based on the tabu search to obtain the upper bounds and feasible routing solutions. However, their work only focused on solving the repositioning with a single vehicle in part of the city area. For the static bicycle repositioning problem under multiple vehicles, Raviv et al. [17] used the mixed integer linear program (MILP) to minimize the routing cost and customer dissatisfaction. Schuijbroek et al. [18] presented a rigorous cluster-first route-second heuristic to solve the inventory determining and routing decision problems. For the dockless system, Liu et al. [19] developed an enhanced version of chemical reaction optimization to solve the static bike repositioning problem by considering multiple heterogeneous vehicles, multiple depots and multiple visits. Pal and Zhang [5] presented a Novel Mixed Integer Linear Program for solving the static rebalancing problem in a free-floating bike sharing system. They also presented a hybrid nested large neighborhood search for large-scale bike sharing programs. (2) Dynamic Repositioning. Chiariotti et al. [20] used the Birth-Death Process to model a station’s occupancy and proposed a dynamic rebalancing strategy. They first determined the optimal inventory for stations and then modeled the path-planning problem as a vehicle routing problem and adopted the greedy heuristic to dynamically redistribute bikes every hour. Contardo et al. [8] presented a mathematical programming formulation for the dynamic repositioning problem and obtained the lower bounds and feasible solutions by using the decomposition schemes. Li et al. [9] proposed a spatio-temporal reinforcement learning (STRL) model for dynamic bike repositioning. They first proposed an inter-independent inner-balance clustering algorithm to cluster stations into groups. Then they utilized the O-Model and the I-Model to predict the demands of renting and returning respectively. Lastly, for each cluster, the STRL obtains the optimal inner-cluster reposition policy based on a deep neural network. Liu et al. [21] developed a multi-source optimization approach for the rebalancing problem. They proposed an Adaptive Capacity Constrained K-centers Clustering (AdaCCKC) algorithm which can reduce the large-scale multiple vehicle routing problem to an inner cluster one vehicle routing problem with guaranteed feasible solutions. Then the vehicle rebalancing route can be optimized by a mixed integer nonlinear programming (MINLP) model.
The drawbacks of the static and dynamic truck-based strategies are the expensive truck operating costs and the pollution of tail gas. Some researchers therefore now pay more attention to the customer-oriented rebalancing strategies.

2.1.2. Customer-Oriented Rebalancing

The customer-oriented rebalancing approach is to solve the imbalance problem by providing customer incentives (bonus, fare discount or otherwise) without deploying trucks. For example, Singla et al. [11] proposed a method on the basis of a crowdsourcing mechanism [22] to incentivize customers to rent or return bikes at specific station. In their work, the dynamic pricing mechanism with a limited budget was proposed. It utilizes the regret minimization approach to maximize rebalancing efficiency. Chemla et al. [10] proved that the dynamic regulation problem is NP-hard (non-deterministic polynomial-time) and presented a heuristic to circumvent it. In their work, the pricing technique based on the linear programming was proposed. Fernandez et al. [23] designed a bike sharing system simulator to evaluate incentive-based rebalancing strategies. Some incentive strategies have been adopted in BSS. For instance, the work of Fricker and Gast [12] was used in the Velib+ system (in Paris). The incentive strategy is that customers will receive additional riding time for free if they return bikes at uphill stations. They also proved that the system can improve the operating efficiency if the customers who enjoy the incentive strategy park their bikes at two or more stations in a bad state. According to the current and predicted state of the system, Pfrommer et al. [24] proposed the price incentive scheme which takes into account the model-based predictive control principles. In a free-floating bike sharing system, Pan et al. [25] proposed a novel deep reinforcement learning framework for incentivizing users. Their work modeled the rebalancing problem as a Markov decision process and took both spatial and temporal features into consideration. The proposed Hierarchical Reinforcement Pricing (HRP) algorithm shows great performance on a dataset from Mobike, a major Chinese dockless bike sharing system. More recently, Diez et al. [26] proposed a persuasion model to recommend the optimal station and the shortest riding route between two locations. The model combines the argumentation theory and the characteristics of customers. In our work, the rebalancing strategy, which is based on the Random Walk process and integrates the walking distance between stations, was designed. The proposed strategy helps to lengthen the station’s working time by inferring the optimal station for customers.

2.2. System Prediction

The prediction of bike demand is crucial for the bike repositioning problem. An accurate prediction can improve the effect of repositioning. Some station-level predicting models have been proposed. For example, Zeng et al. [27] proposed a station-centric model which takes into account the global features such as weather, user activity and season. Kaltenbrunner et al. [28] adopted the auto-regressive moving-average (ARMA) model to predict the number of bikes and docks for each station. Similarly, Yoon et al. [29] used a modified autoregressive integrated moving average (ARIMA) model to predict the available resources at each station. In their work, the spatial interaction and temporal factors are considered. Unlike the station-level prediction, some models are proposed according to the clustering of stations with similar patterns of usage. For example, Li et al. [30] proposed a hierarchical prediction model to predict the check-out/in of each station cluster. They first clustered the stations by the bipartite clustering algorithm based on the geographical locations of stations and transition patterns and then predicted the entire traffic in the city by way of the gradient boosting regression tree (GBRT) model. Finally, the rental proportion across clusters was predicted by a multi-similarity-based inference model. Chen et al. [31] proposed a dynamic cluster-based framework for over-demand bike prediction. Recently, neural networks have been adopted to predict bike demand. Liu et al. [32] proposed a prediction model based on artificial neural networks (ANN). The model utilizes a set of features such as human mobility data, POI and station network structures. Lin et al. [33] proposed a novel graph convolutional neural network to predict the hourly demand in a BSS.

2.3. System Design and Traffic Pattern Analyzing

System design, including the station layout, capacity, and price policy, is the premise of successfully operating a bike sharing system. Dell’Olio et al. [34] calculated the potential demand of bike usage in a city and the price the customer would like to pay. They also proposed a location model with the help of geographical information about the stations. Chen and Sun [35] proposed a mathematical model to formulate the layout of public bike stations with the objective of minimizing users’ total travel time. Lin and Yang [36] designed the strategic planning of BSS with service level considerations. They proposed an optimization model including a nonlinear integral and greedy heuristic to help operators determine the number of stations, the network structure of bike paths connecting the stations and the travel paths for users between each origin and destination station. In addition to the system design and efficient operation, the traffic pattern analysis is another important topic, such as the bike usage pattern and the transition pattern across stations in BSS [37,38,39]. Understanding the traffic pattern of BSS is helpful for operating the system efficiently and knowing the mobility of a city. Furthermore, the massive real trajectories generated by users help to solve some city problems, such as bike lanes planning [40] and illegal parking detection [41].

3. Design Overview

3.1. Problem Statement
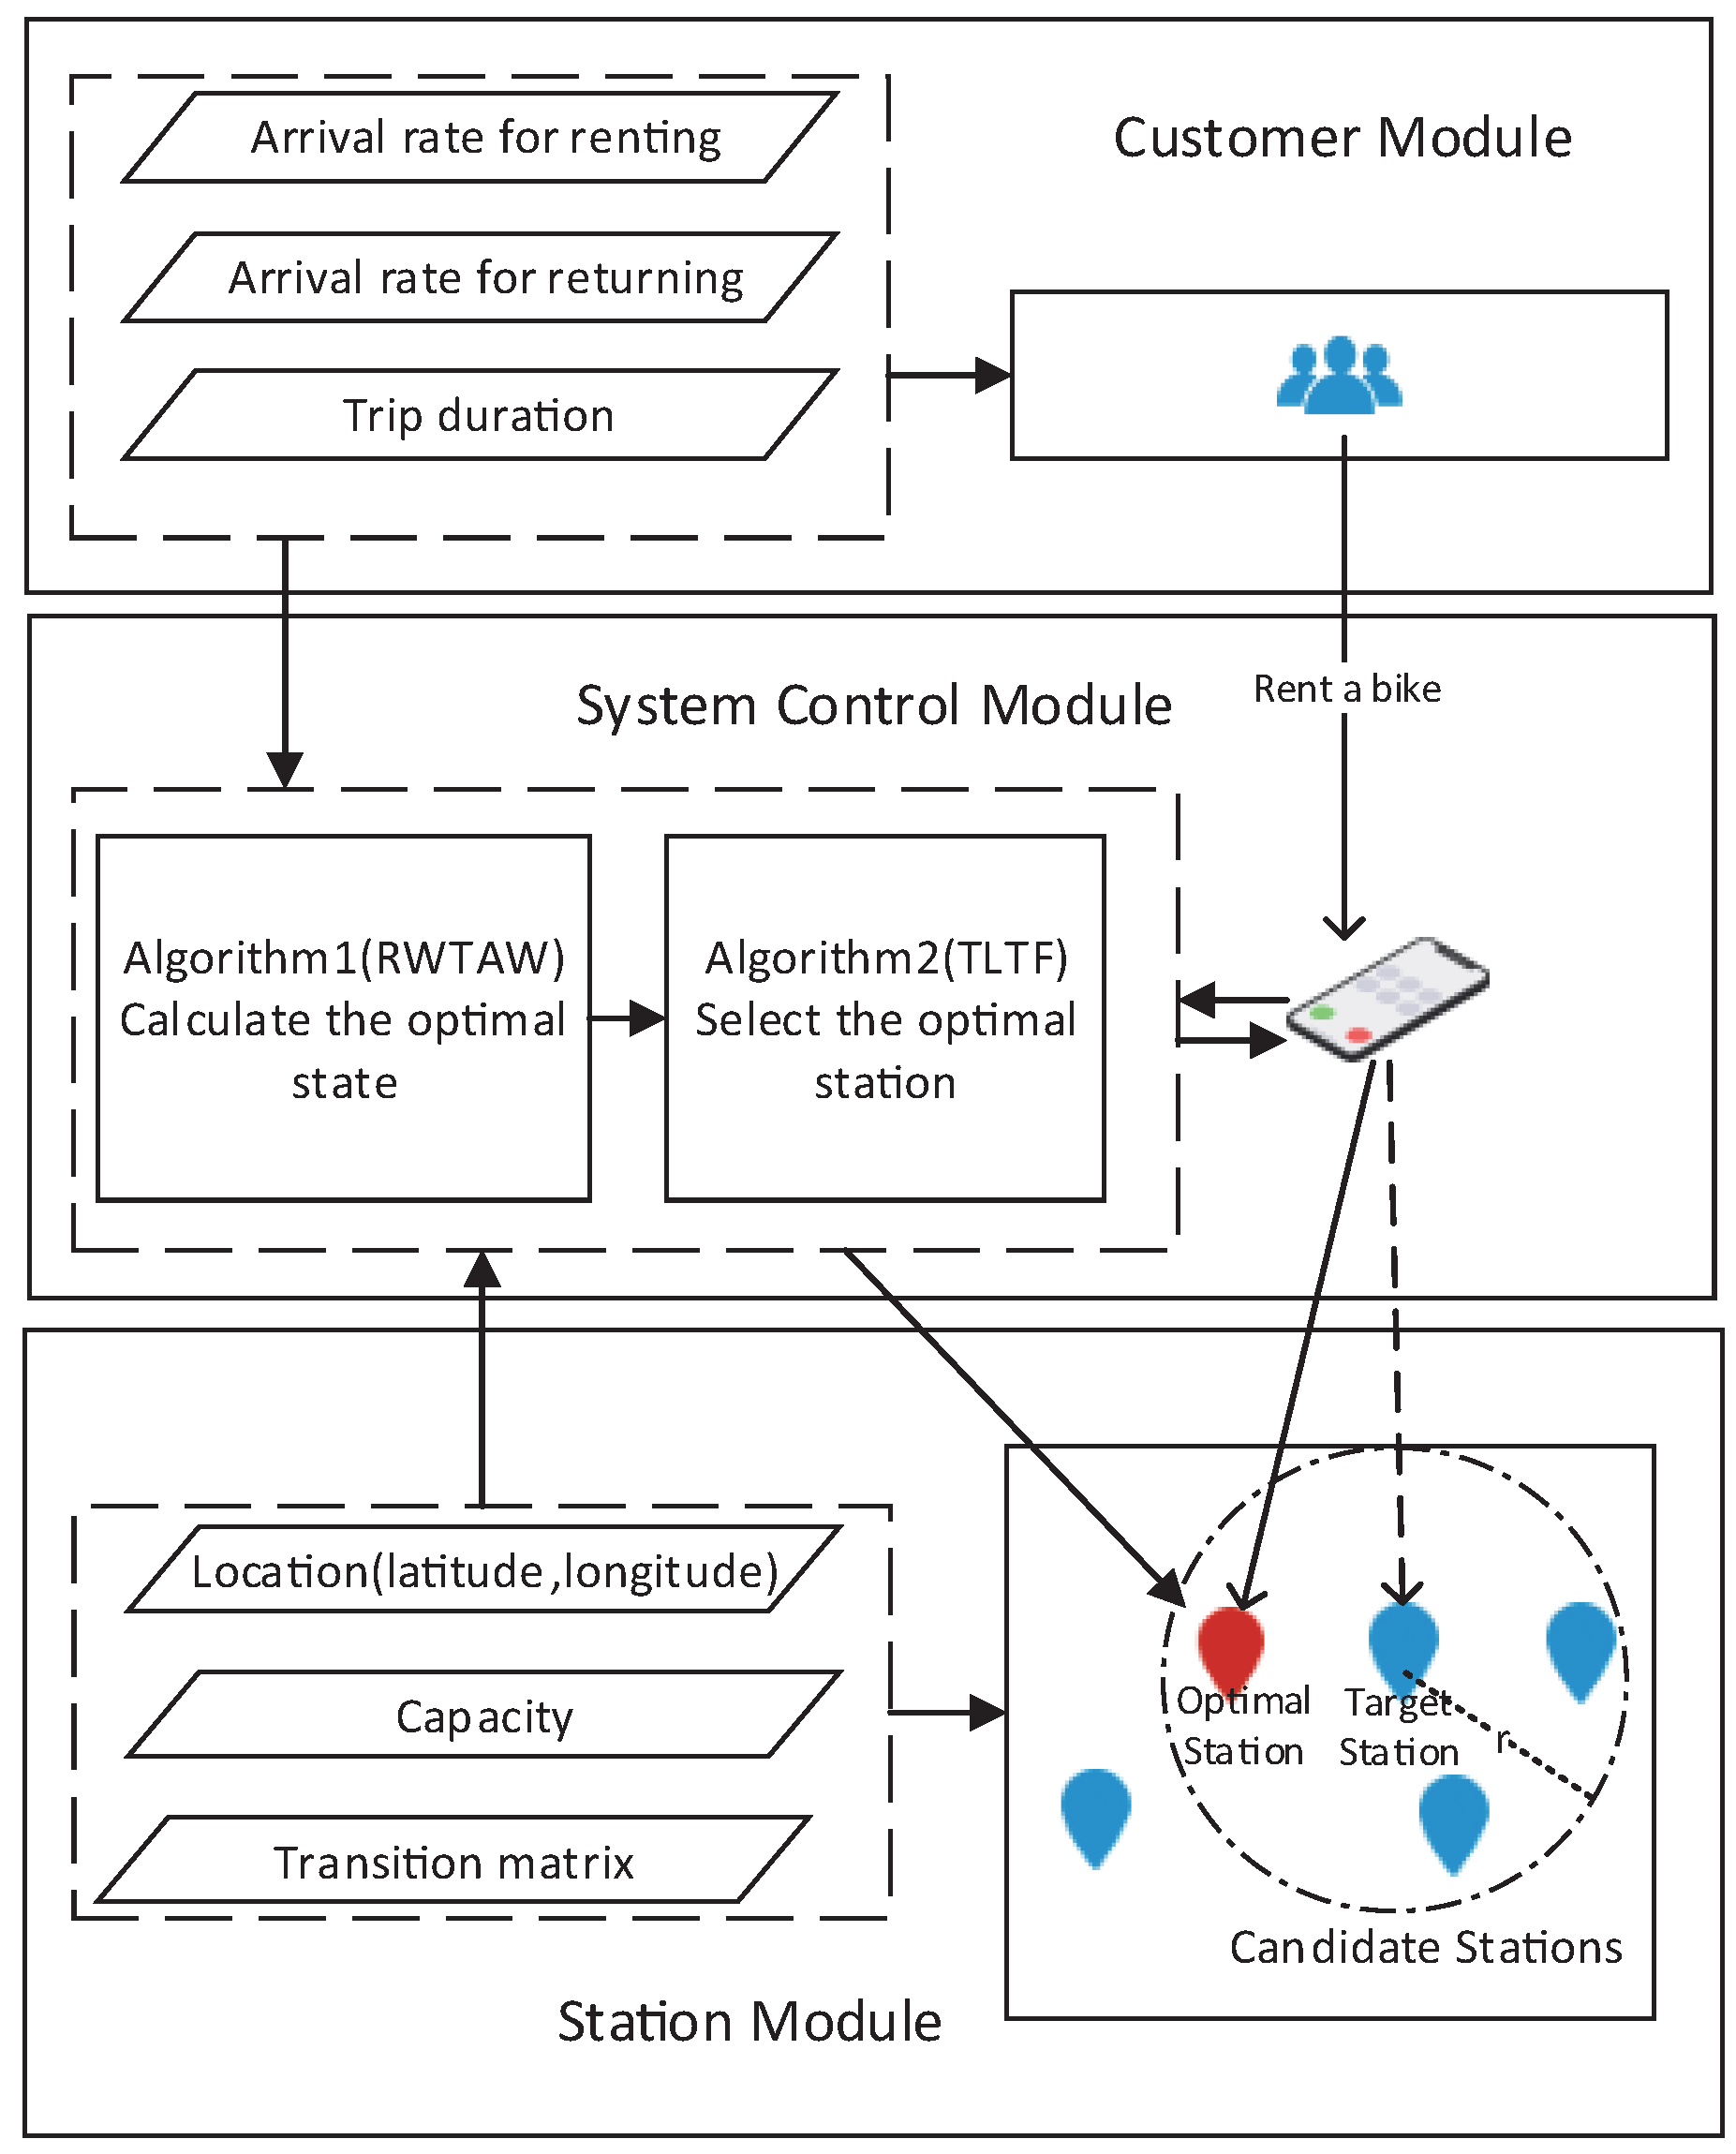
In this paper, we focus on a bike sharing system in which the station is fixed. Generally, a BSS has n stations. The set of stations is defined as S = { S 1 , S 2 , , S n } . The maximum capacity of station S i is defined as M i . m i ( t ) represents the available bikes at station S i at time t. We model the bike sharing system as a fully connected graph G = { S , I } . Each node I i , j = ( S i , S j ) corresponds to the edge between two stations S i and S j . The edges are weighed by walking distance metric r i , j . Notations used in this paper are shown in Table 1.
We set the scene of rebalancing as follows. A customer will query the information about stations on his mobile phone before his trip. After the customer selects the station at which he will rent a bike, the bike system immediately checks the station’s state. If the number of the station’s available bikes is less than its optimal state, the system would incentivize the customer to another station according to the states of nearby stations and the walking distance. We hope the whole system can obtain the least values of three metrics, that is, the unworking time, the proportion of lost customers and the times of reposition. The detailed definitions of the three metrics are introduced in Section 5. The selection of the recommended station at which the system incentivizes the customer to rent bikes is the main task in this work. Formally, the problem is defined as follows:
Problem Definition: Given the station S i at which a customer will rent a bike, the bike system will determine whether to incentivize the customer to another station S j or not. If needed, the bike system should output the recommendation station S j .

3.2. Framework

Figure 2 shows the framework of our bike-sharing system with the rebalancing strategy, which consists of the following three components:
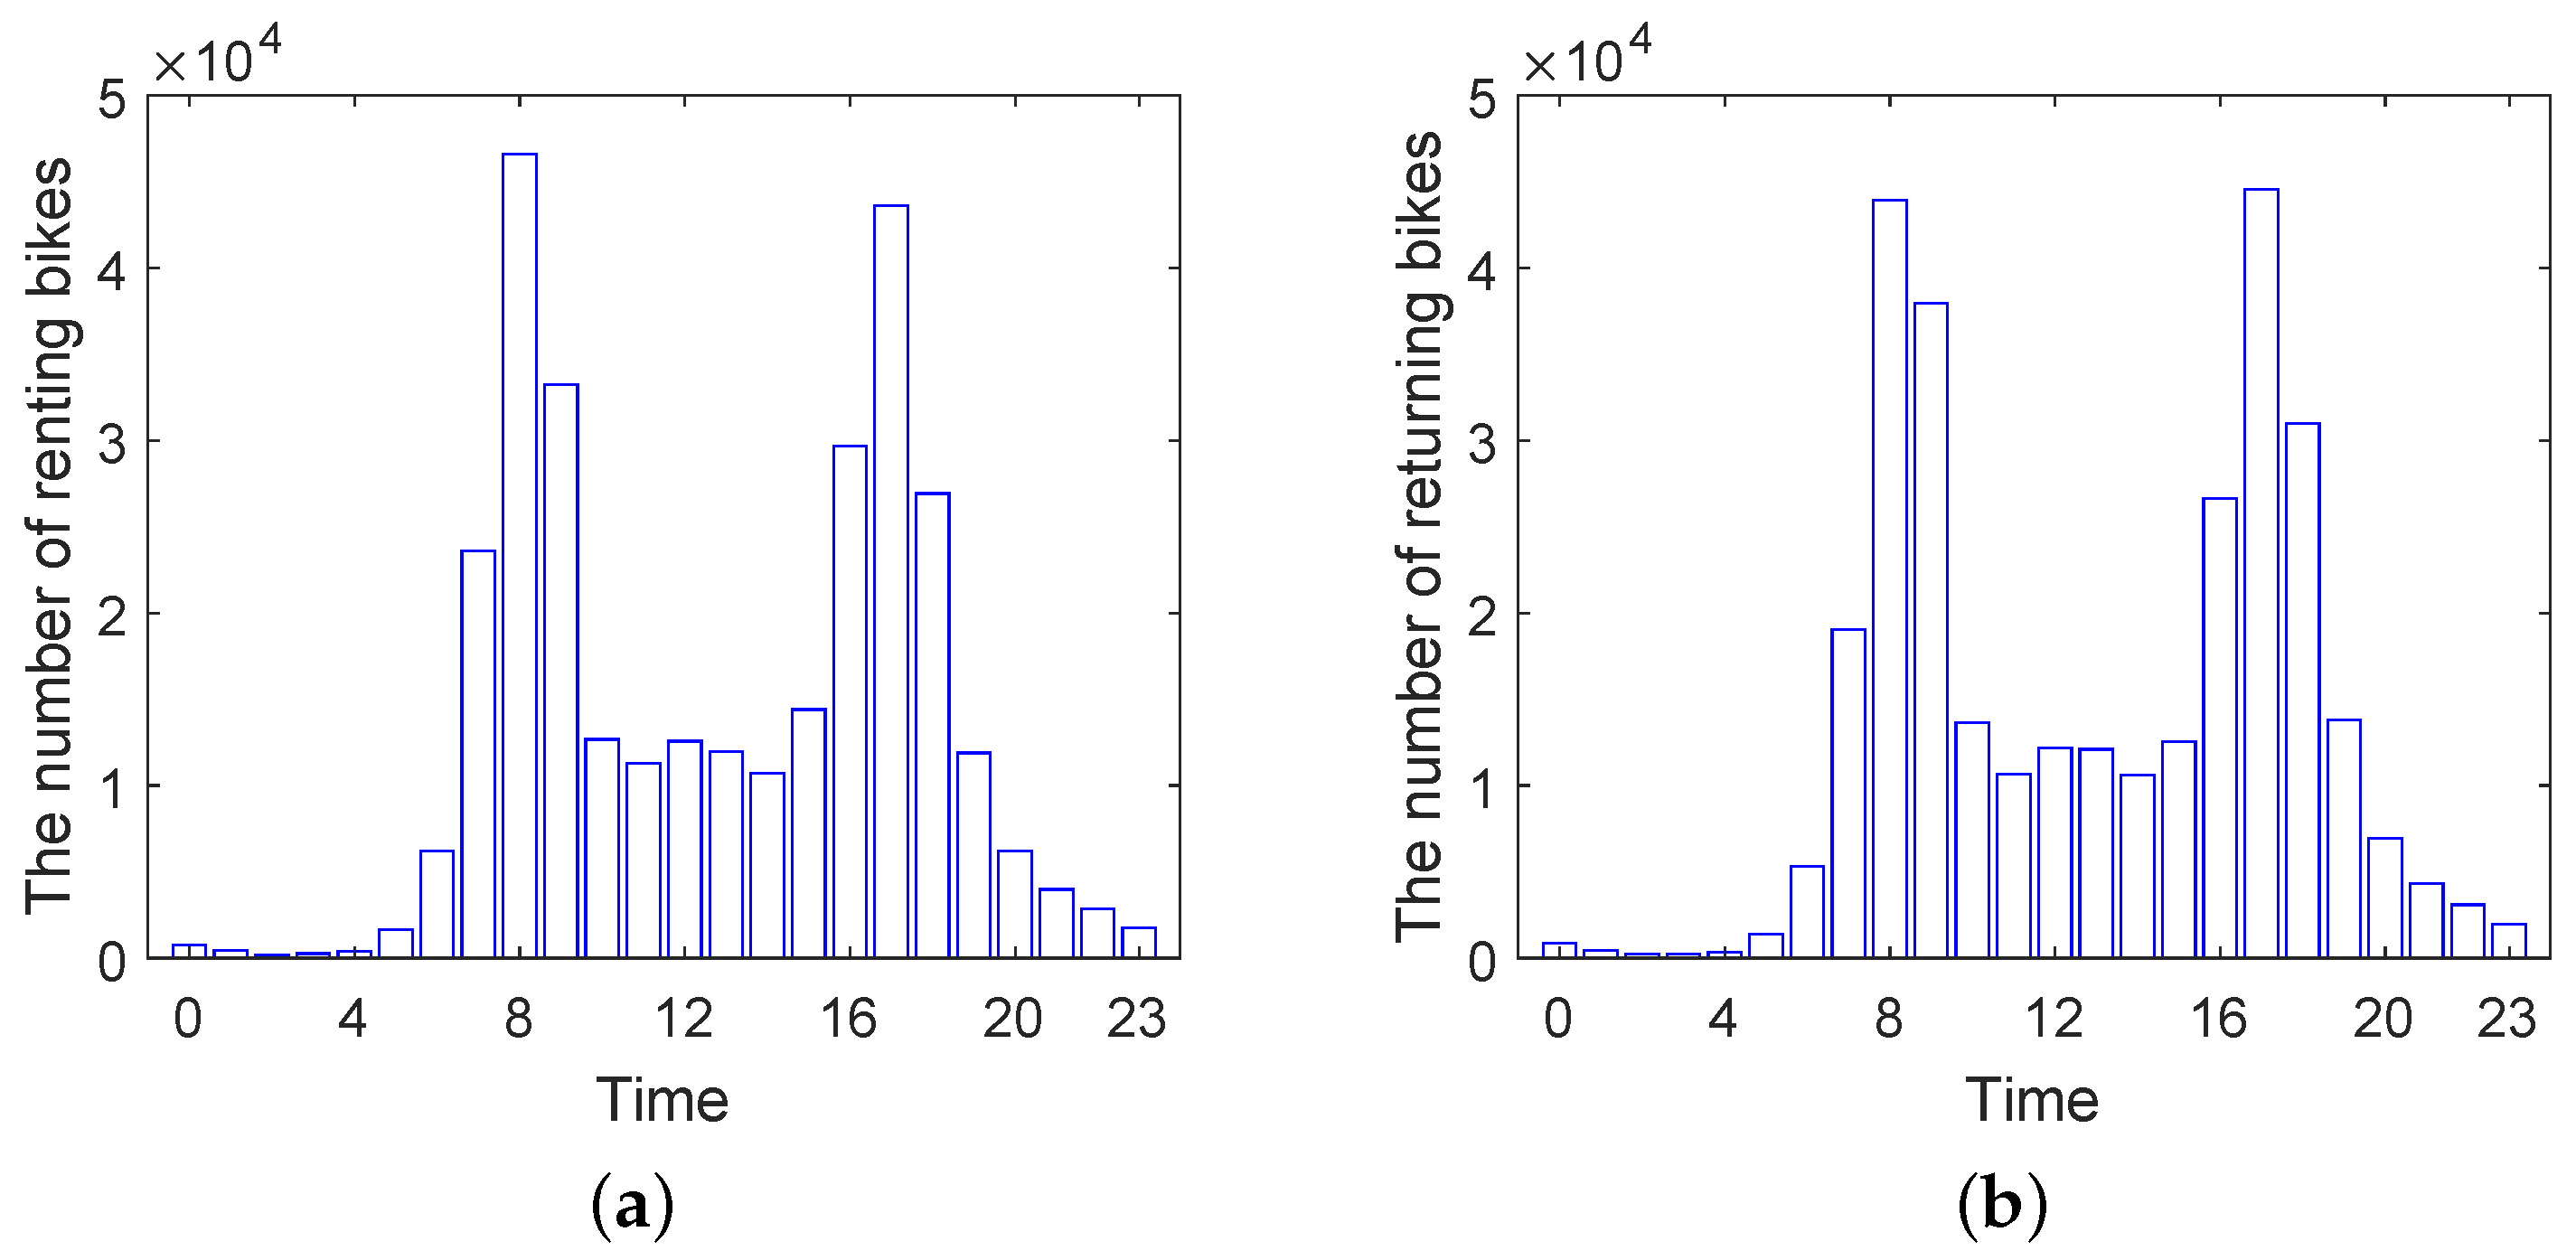
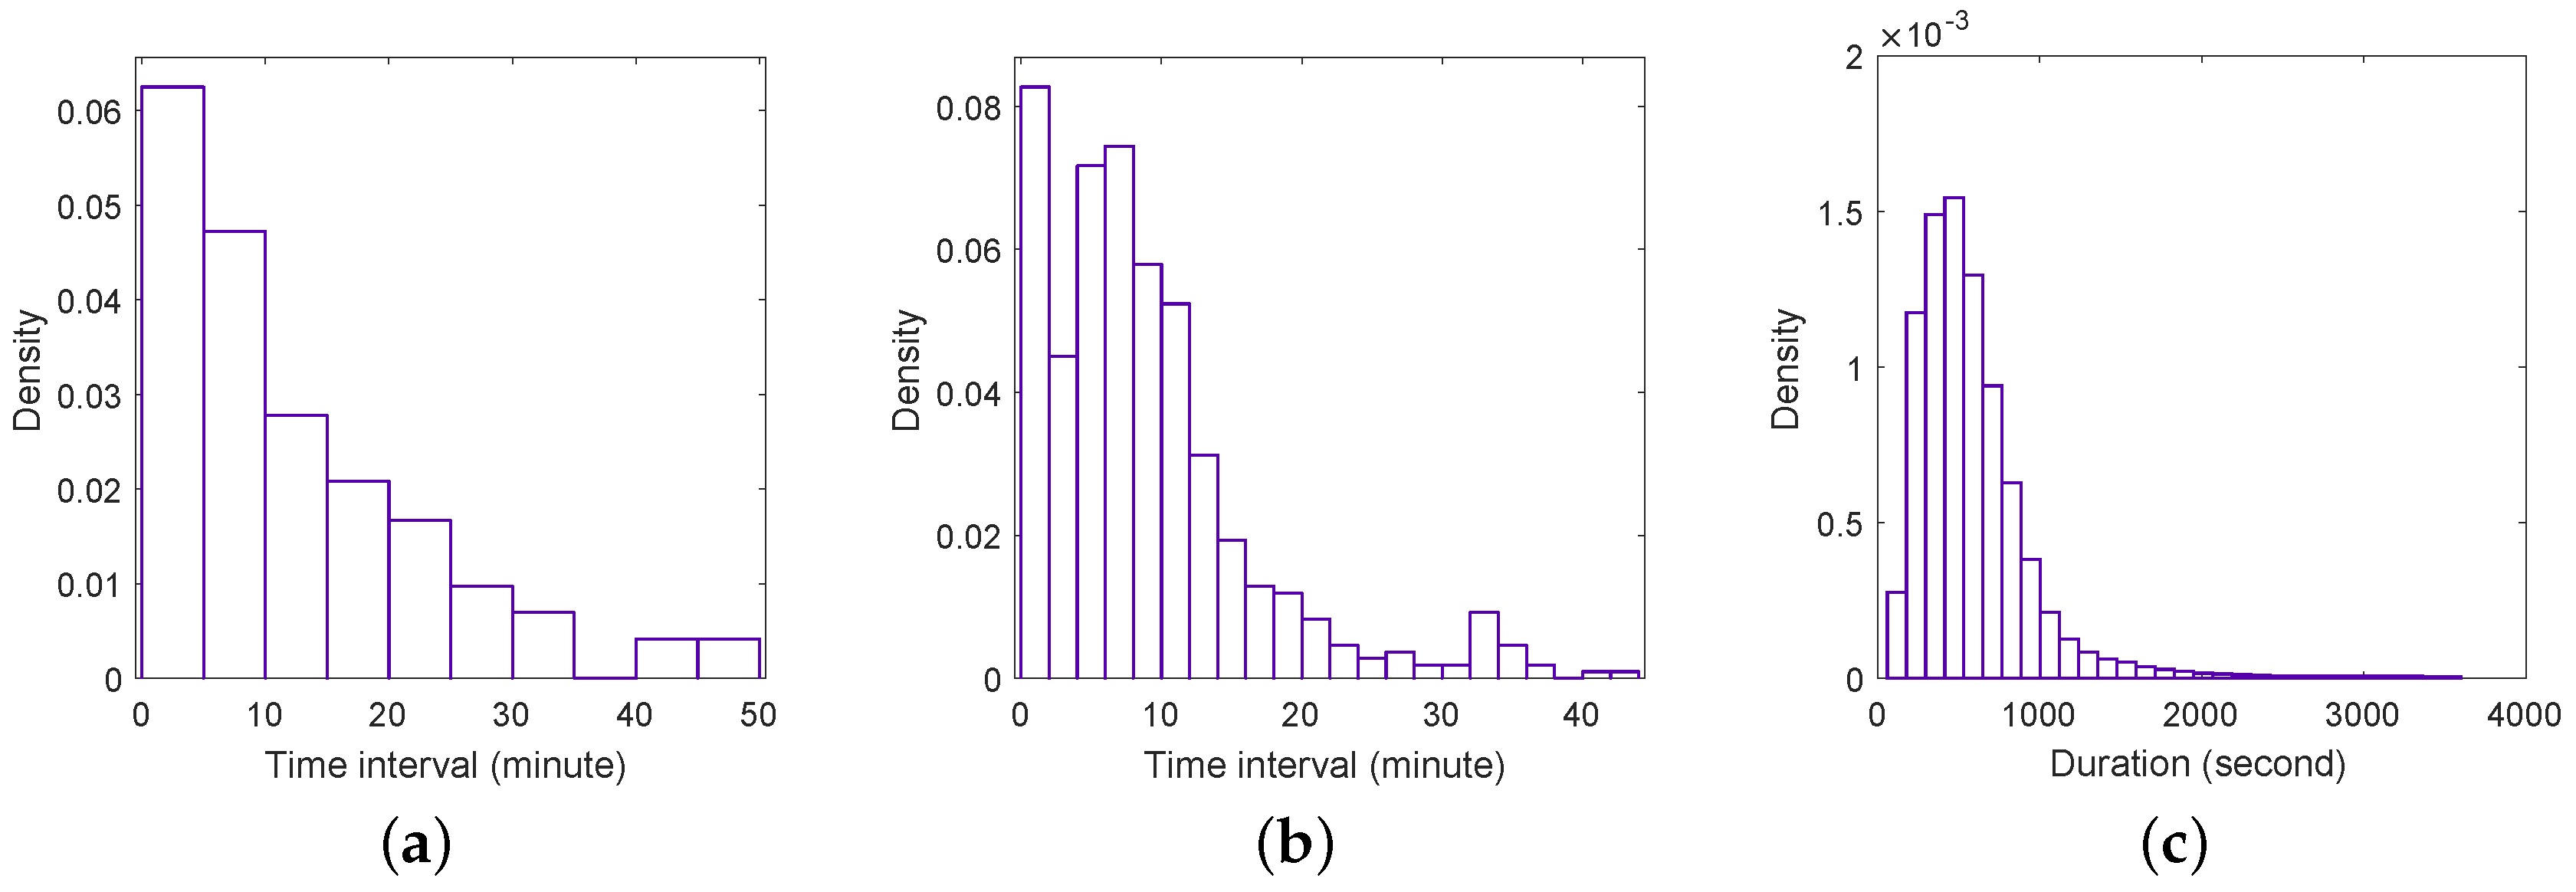
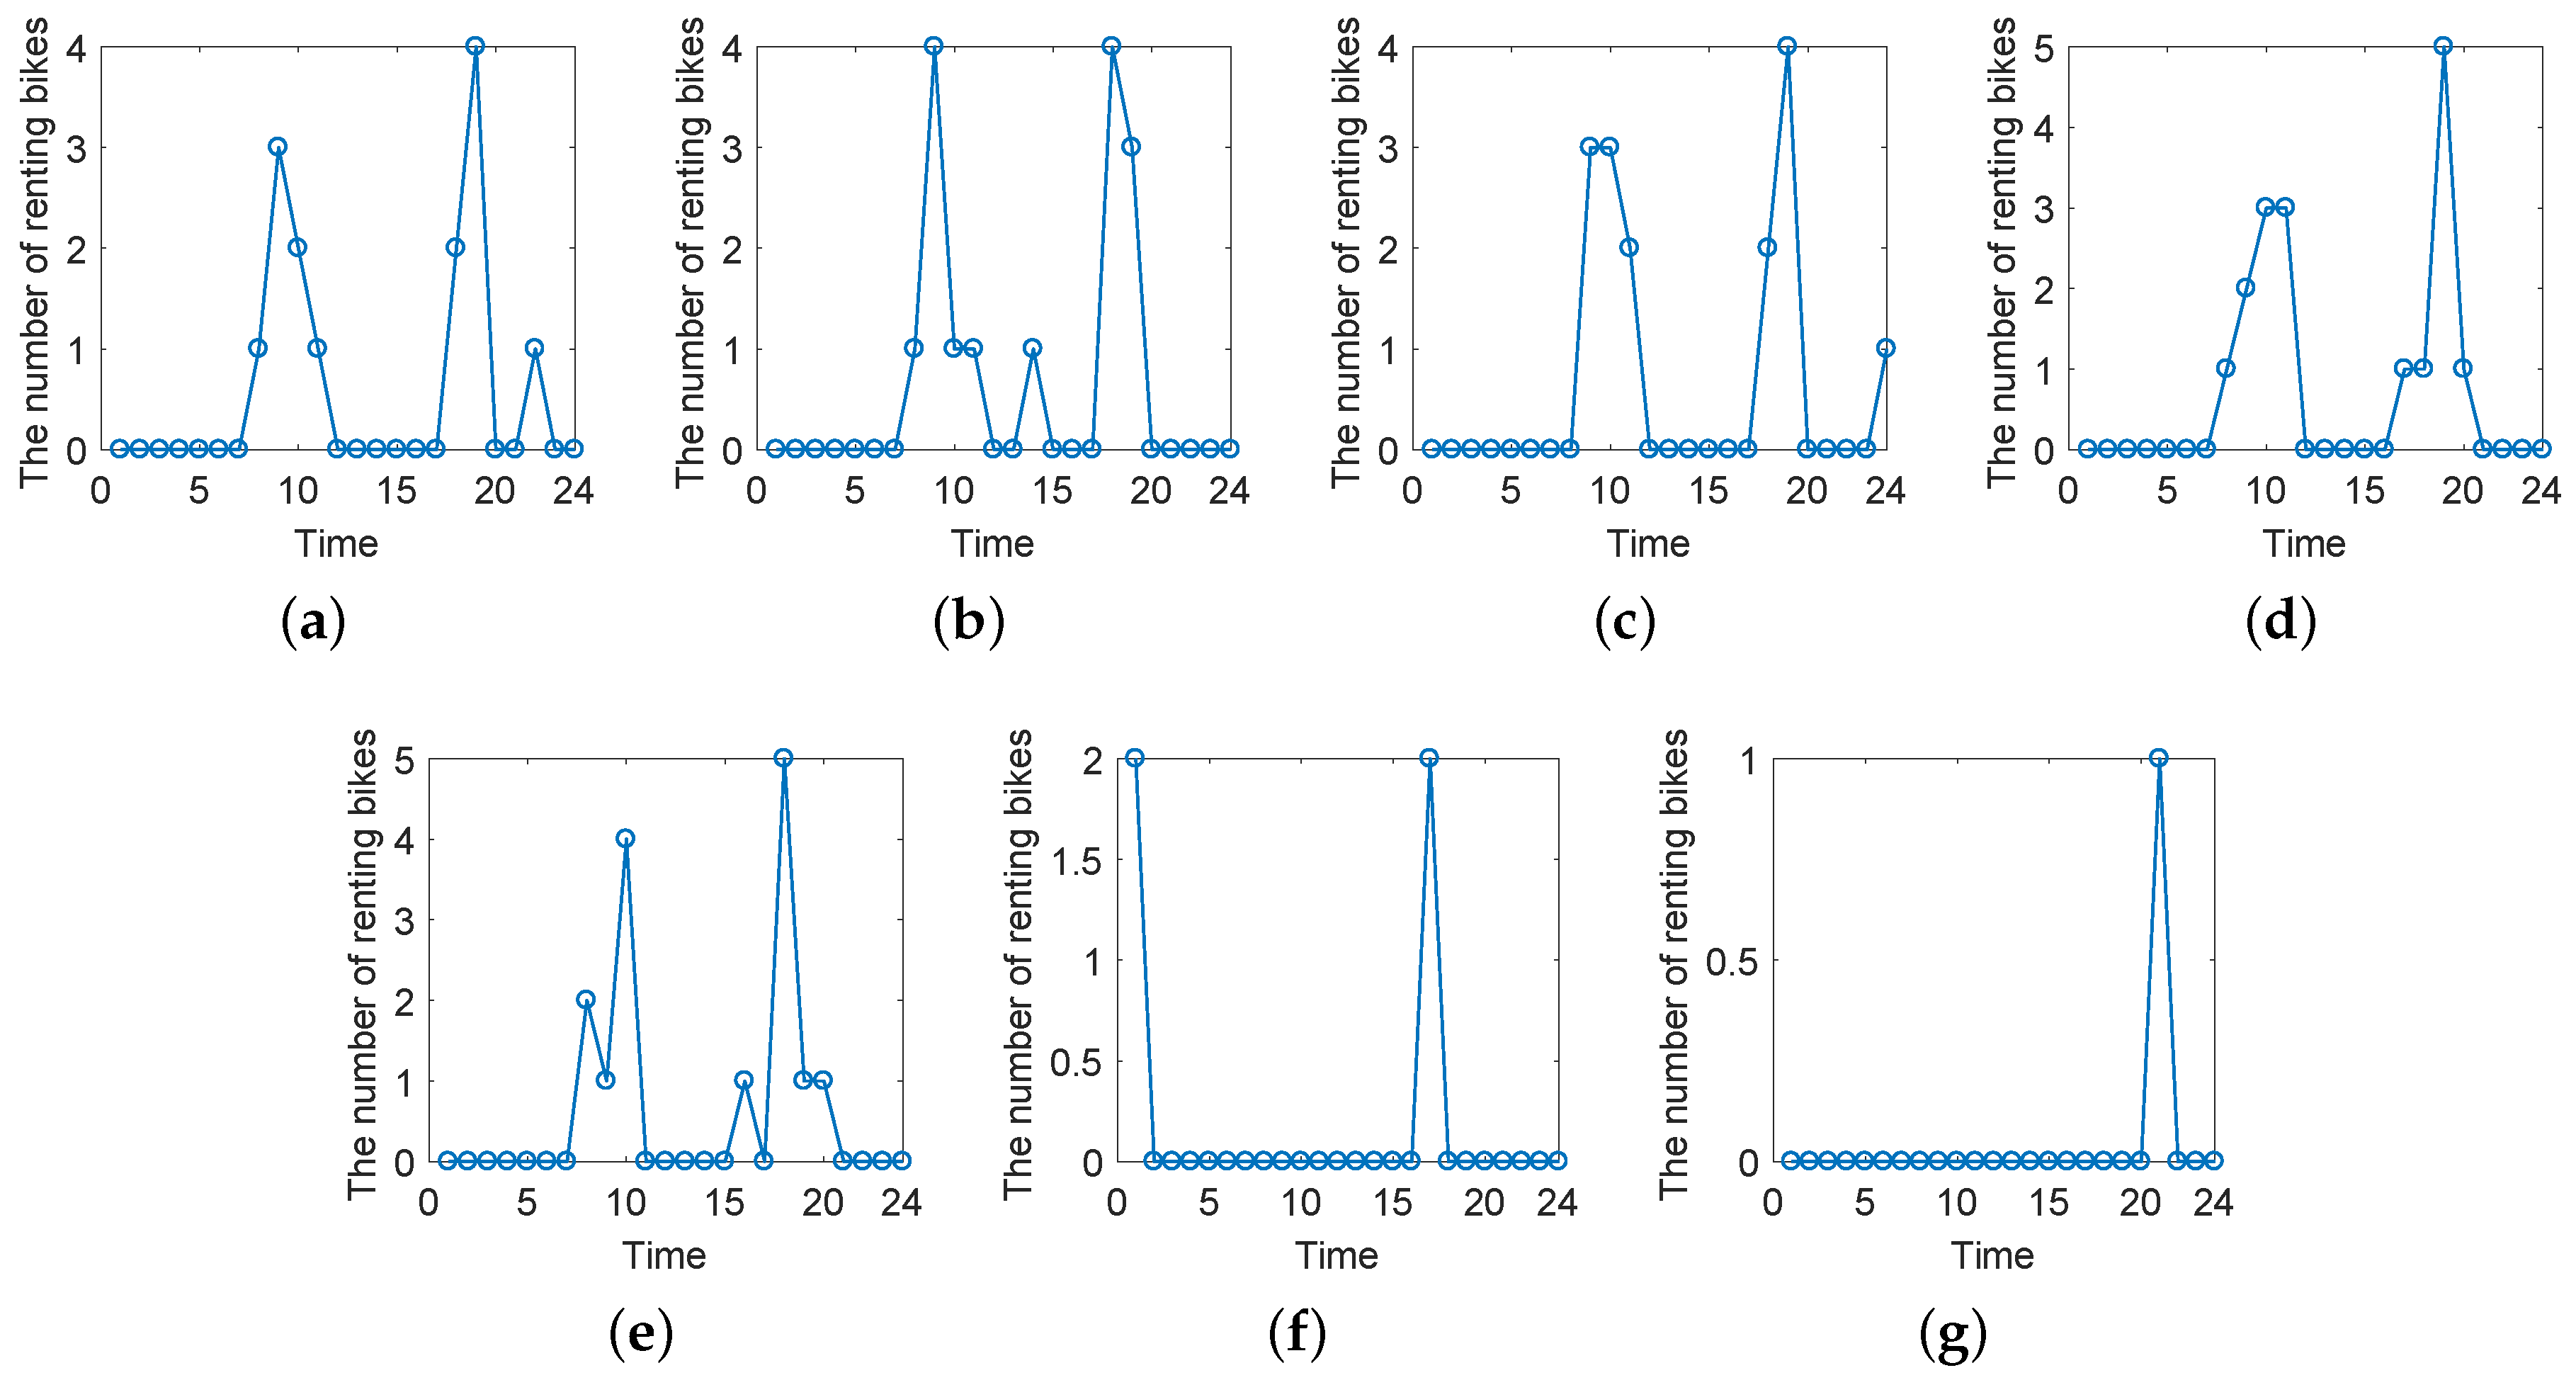
  • Customer Module: This module is designed to simulate the behaviors of customers. In BSS, there are two processes that need to be modeled. One is the customers’ arrival process for renting at a station and the other is the arrival process for returning. Previous studies [42,43] have demonstrated that these two processes can be described by the inhomogeneous Poisson process. According to the definition of the Poisson process, in BSS, we need to determine the arrival rate. λ i ( t ) and μ i ( t ) are defined as the arrival rates corresponding to the two processes, respectively. The arrival rate represents the number of customers arriving at the station per unit time. Therefore, λ i ( t ) and μ i ( t ) are two important parameters in the customer module. Moreover, the trip duration is necessary for each trip. According to the analysis of historical data (as shown in Section 5), the distribution of trip duration fits well with the lognormal distribution. Therefore, the trip duration for a certain trip is a random number of log-normal distribution in our simulated BSS.
  • Station Module: We design this module to simulate the states of stations in the BSS. Each station in the system has three properties: geographic location, capacity and transition matrix. The geographic location is decided by the latitude and longitude. The capacity represents the number of docks. The transition matrix includes the probabilities that customers ride bikes from station S i (departure station) to other stations. The geographic location and capacity are defined in the system. The transition matrix can be obtained by the historical records.
  • System Control Module: This module is the core part of rebalancing in the BSS. The optimal state of a station is calculated by the RWTAW algorithm. The TLTF algorithm calculates the optimal station based on the walking distance and the current states of the candidate stations. The control module is the main contribution of this work. We will describe the details of the RWTAW and TLTF algorithms in the next section.

4. Methodology

4.1. The Optimal State Calculating

In the BSS, we hope the station can keep the optimal state as long as possible, thus it should have the lowest possibility that it will be empty or full in future. Motivated by this idea, O P i , k is defined as the optimal state of S i at time slice k. It can be calculated on the basis of the probability that station becomes either empty state ( m i ( t ) = 0 ) or full state ( m i ( t ) = M i ). Formally, it can be defined as follows:
O P i , k = arg min a P a , a { 1 , 2 , , M i 1 }
where P a is the probability that station becomes either empty or full during time t ( k ) and it is calculated by:
P a = P a 0 + P a M i
where P a 0 and P a M i respectively represent the probabilities that station S i becomes empty state and full state when the current state m i ( t ) = a .
Random Walk is a mathematical statistical model [44,45], which has a wide range of applications. For example, researchers have studied the application of the Random Walk model in finance prediction [46], high level data classification [47] and social network optimization [48,49]. A one-dimensional random walk can be looked at as a Markov chain whose state space is given by the integers τ ( τ = 0 , ± 1 , ± 2 , ). The Random walk with two absorption states ( τ 1 and τ 2 ) at both ends is an important model. The model stops walking once it reaches either absorption state. For an initial state τ a ( τ 1 < τ a < τ 2 ), the probability P τ a represents walking from τ a to either absorption state. P τ a can be calculated as follows:
P τ a = ( q p ) τ a τ 1 ( q p ) τ 2 1 ( q p ) τ 2
where p represents the probability of walking toward τ 2 at each step, q represents the probability of walking toward τ 1 at each step.
In this paper, we describe the state changing process of each station by the one-dimensional Random Walk process. In a bike sharing system, a station’s state has only two changing directions: the empty state ( m i ( t ) = 0 ) and the full state ( m i ( t ) = M i ). The state of a station goes one step toward the empty state when a renting event occurs. In the same way, the state of station goes one step toward the full state when a returning event occurs. For a middle state m i ( t ) = a , if 0 < a < O P i , k , the smaller the value of a, the larger the probability that the station will become empty; if O P i , k < a < M i , the larger the value of a, the larger the probability that the station will become full. We assume that the station will stop working and wait for supplementary as long as its state becomes either empty or full. Thus, the empty state and full state of a station correspond to two absorption walls.
Specifically, given the total changing steps e 1 and e 2 , if the station becomes empty after e 1 steps, the probability for this case is calculated by the following formula:
P a 0 = i = 0 e 1 C a + 2 i i × P r e n t a + i × P r e t u r n i
Similarly, P a M i is given as:
P a M i = i = 0 e 2 C M i a + 2 i i × P r e t u r n M i a + i × P r e n t i
P r e n t and P r e t u r n , respectively, represent the probabilities of a renting event and a returning event for each step at a station. The constraints of total steps e 1 and e 2 are:
e 1 = min { R e n t i , k a , R e t u r n i , k }
e 2 = min { a M i + R e t u r n i , k , R e n t i , k }
In a bike sharing system, the process by which customers arrive at a station to rent or return bikes can be described by the Poisson process [43]. The renting intensity of Poisson process R e n t i , k corresponds to the total number of customers who rent at station S i during time t ( k ) . The returning intensity of Poisson process R e t u r n i , k corresponds to the total number of returning customers. R e n t i , k and R e t u r n i , k can be calculated as follows:
R e n t i , k = λ i ( k ) × T
R e t u r n i , k = μ i ( k ) × T
where λ i ( k ) and μ i ( k ) correspond to the customer arrival rate for renting and returning respectively. T is the length of time slice k. It is worth noting that we divide a day into 24 time slices. For instance, λ i ( 8 ) means the arrival rate for renting from 7:00 am to 8:00 am.
According to the R e n t i , k and R e t u r n i , k , the probabilities of renting ( P r e n t ) and returning ( P r e t u r n ) at each step at time slice k are defined respectively as follows:
P r e n t = R e n t i , k R e n t i , k + R e t u r n i , k
P r e t u r n = R e t u r n i , k R e n t i , k + R e t u r n i , k
In Equations (10) and (11), we ignore the influence of customers’ arrival order for renting and returning and only focus on the total number of customers that have arrived in this time period [20].
The above discussions indicate that the proposed RWTAW algorithm can describe the changing state of a station during a certain period. Algorithm 1 gives the details of calculating O P i , k . This proposed algorithm can be computed in O ( n ) operations. The total runtime of the algorithm is determined by the capacity of the station. Next, we will introduce how to choose the optimal station at which the system incentivizes the customer to rent bikes.
Algorithm 1: RATAW
Energies 12 02578 i001

4.2. The Optimal Station Selecting

When a customer chooses his target station S i at time t on the APP (application program) of BSS, the system would incentivize him to rent bikes at another optimal station O S t if S i is not in its optimal state ( m i ( t ) < O P i , k ). Two issues need to be solved before deciding the optimal station: (1) The selected station should be as close as possible to the customer’s target station, because customer may be unwilling to walk too far; and (2) The incentive measure should have a minimal impact on the station’s sustainable working or can help the station be closer to its optimal state. Aiming to solve these two issues, we proposed the TLTF algorithm to determine the optimal station O S t which satisfies:
O S t = arg max S j δ j , k , S j C i
where C i is the set of candidate stations. We choose C i based on the maximum distance r that customers are willing to walk [11]. Specifically, we select the stations which are no more than r from S i as the candidate stations in C i :
C i = { S j d ( S i , S j ) r }
In Equation (12), δ i , k represents the difference between the current state of station S i and its optimal state at time slice k, which is the key influence on O S t . Its definition is given as follows:
δ i , k = m i ( t ) O P i , k
If δ i , k > 0 , the rebalancing strategy will not be triggered when a customer chooses S i for renting. If δ i , k 0 , the system will incentivize him to rent bikes at station O S t . As defined in Equation (12), the station O S t is the one which has the largest difference between its current state and the optimal state. The procedure to determine the optimal station O S t is described in Algorithm 2. The complexity of the algorithm is O ( n ) .
Algorithm 2: TLTF
Energies 12 02578 i002

5. Experimental

5.1. Data Set Description

The datasets used in this paper were obtained from Bay Area, a bike sharing system in San Francisco. We have uploaded the datasets to github (https://github.com/TwinkleBill/babs_open_data_year_3). The datasets include 68 stations’ records from 1 September 2015 to 31 August 2016. Each record includes the status of station and customer’s trajectory information. We give a visualization of the stations in Figure 3 and show the statistical information of the datasets in Table 2.

5.2. Performance Metrics for Bike-Sharing System

Here we define three metrics to evaluate the performance of the rebalancing strategies in a bike sharing system.
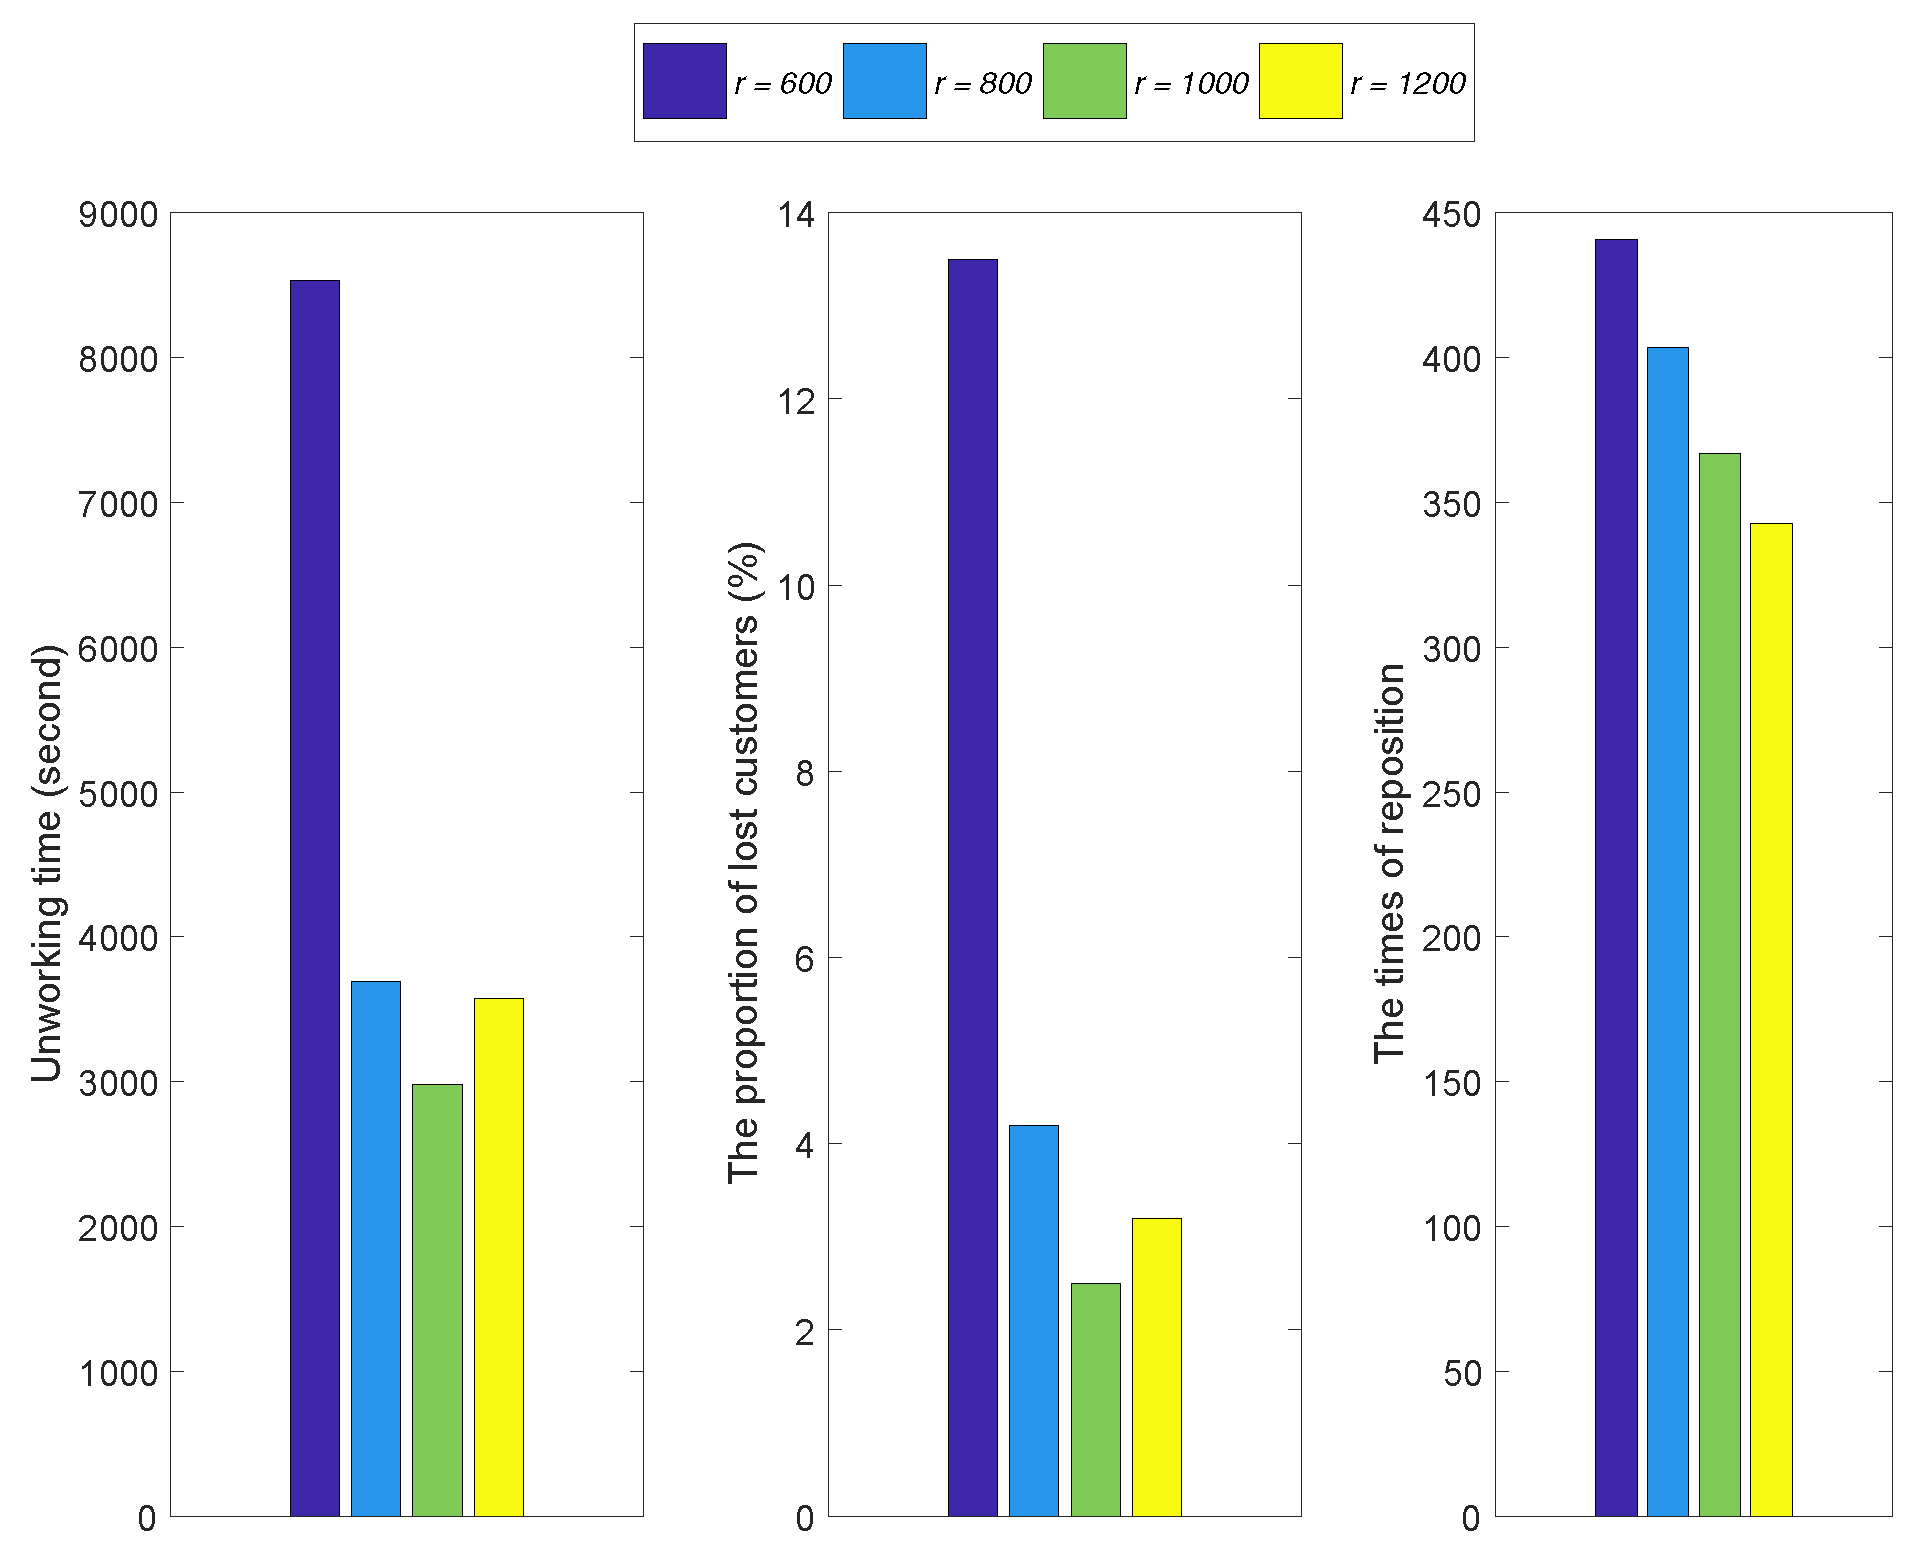
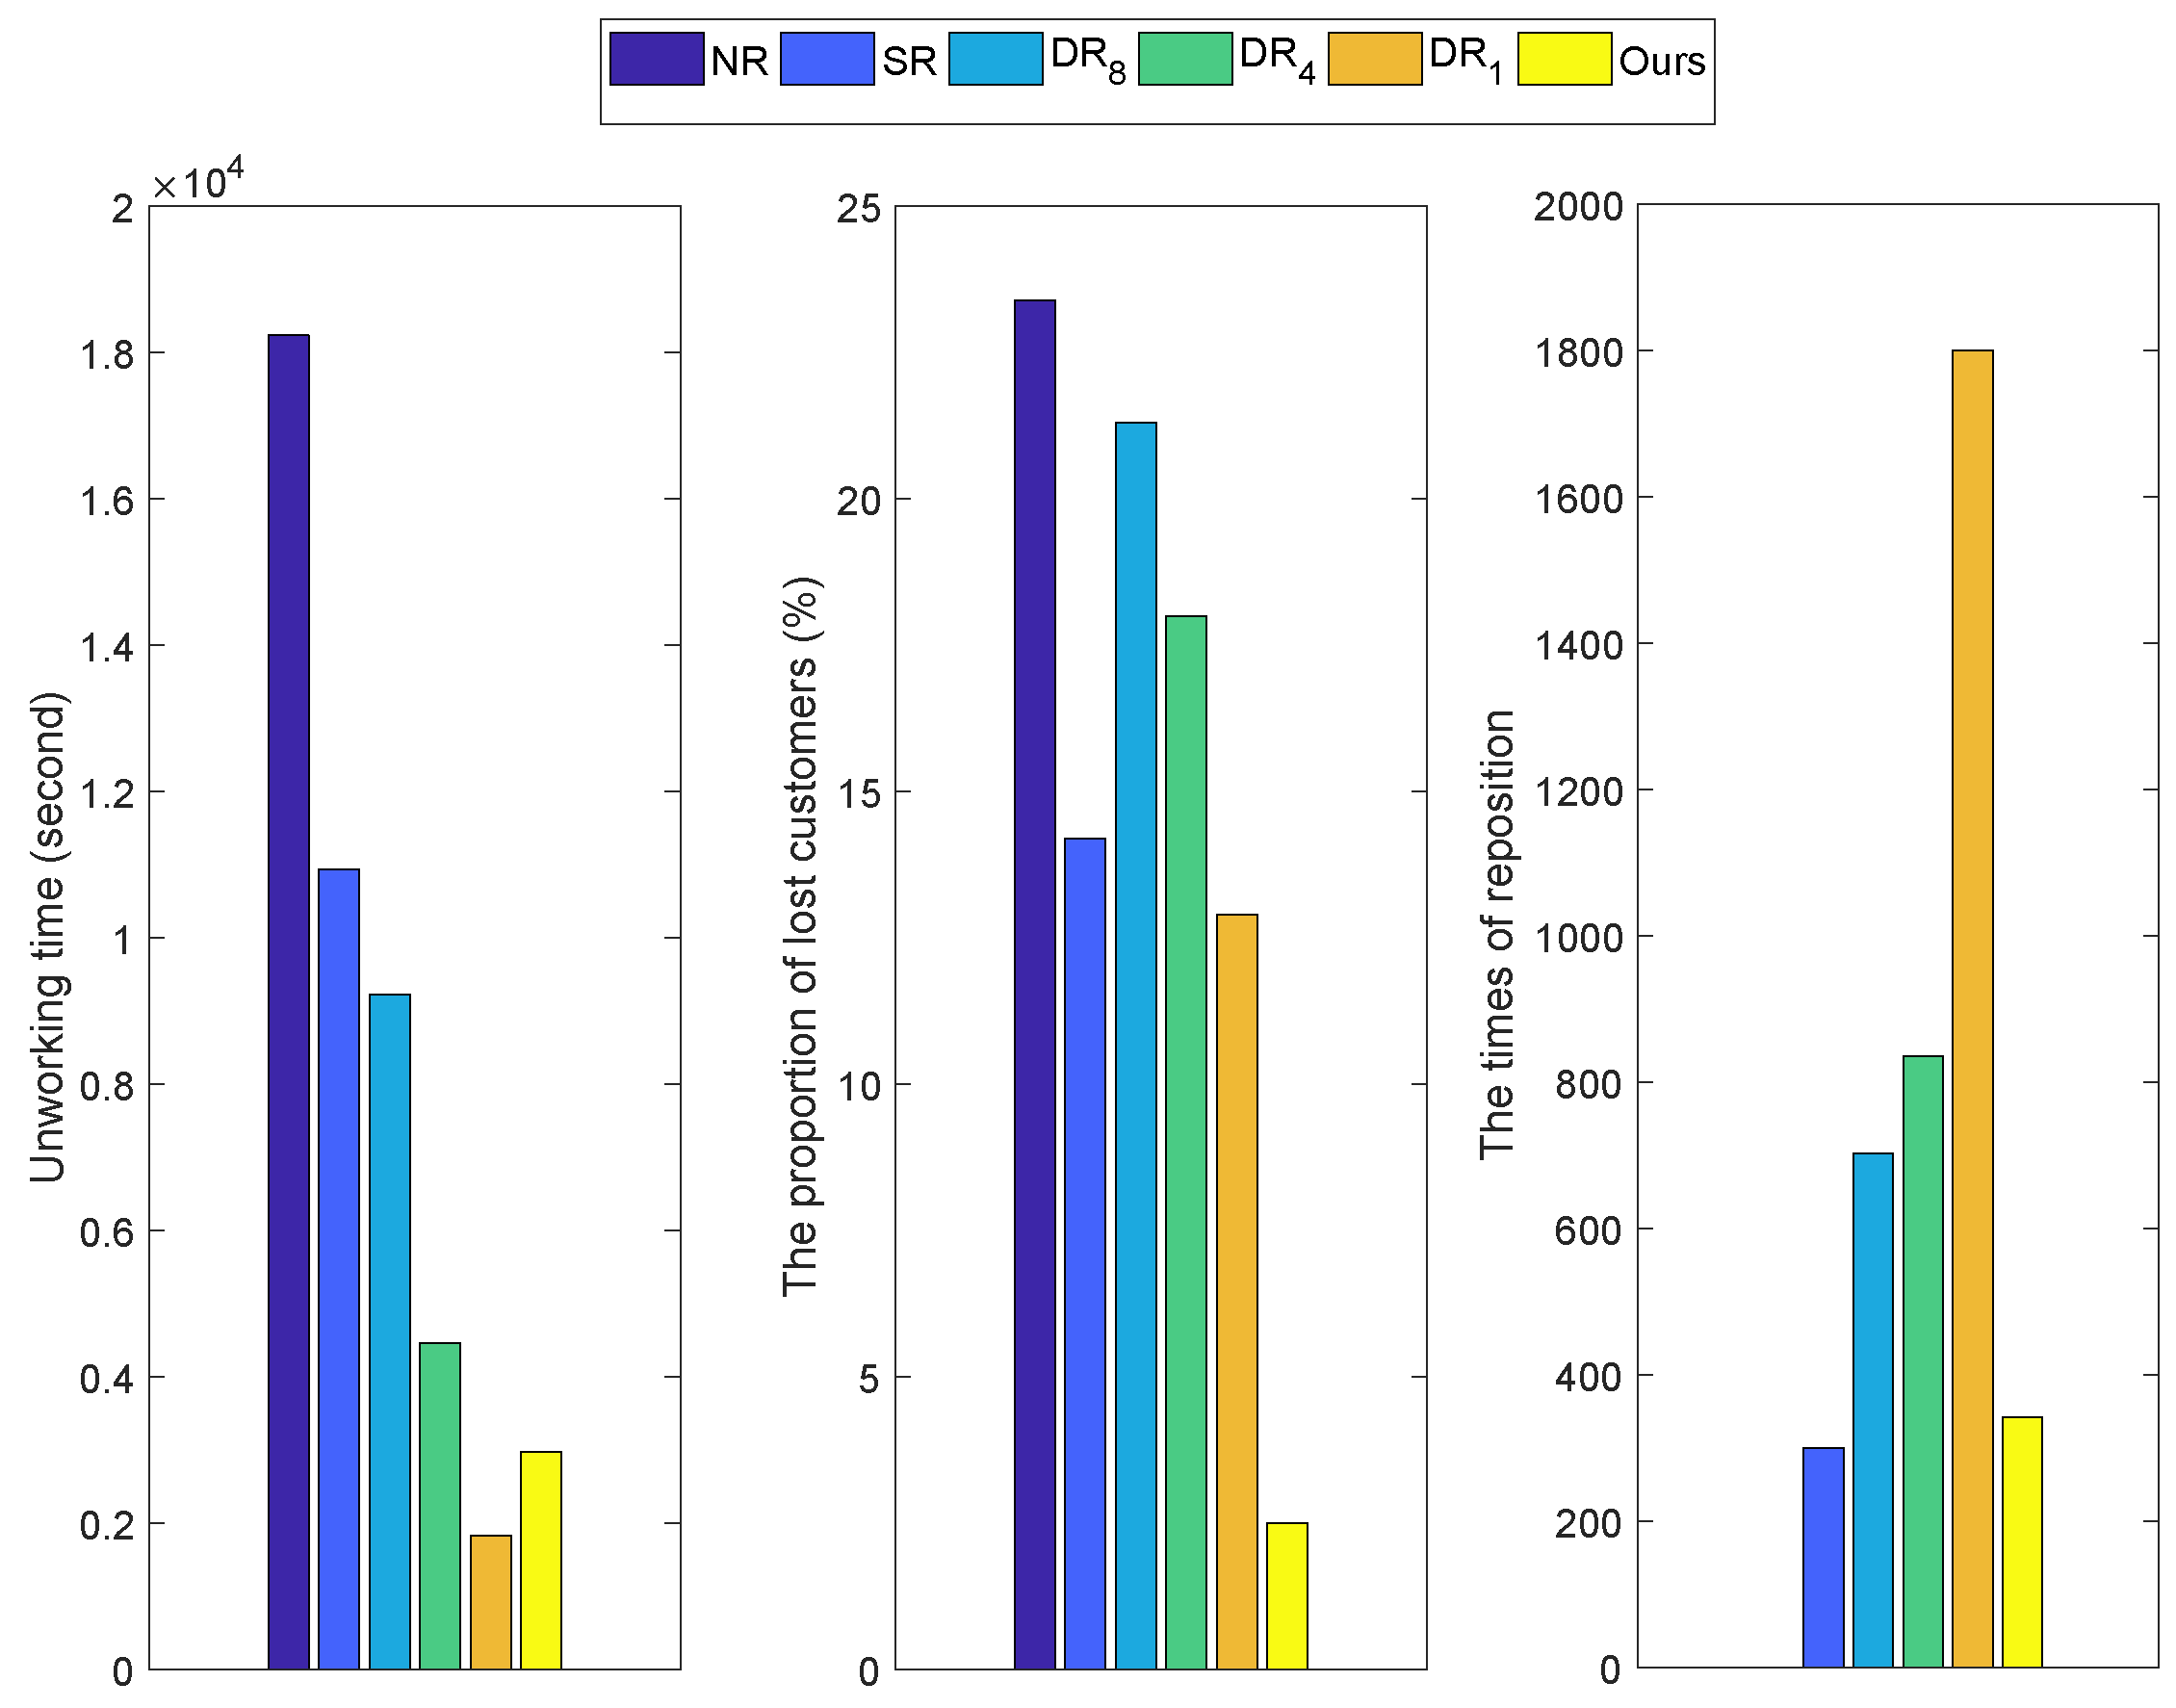
  • The unworking time: The sum of the duration time of the stations which keep empty or full. The unsatisfactory service increases when a station is in its unworking time, since customers have no available bikes or docks to use. The smaller the unworking time of the system, the smaller the probability of failing to rent bikes or return bikes.
  • The proportion of lost customers ( γ l o s t ): γ l o s t is defined as follows:
    γ l o s t = n l o s t n l o s t + n r i d e
    where n l o s t is the number of customers who fail to rent or return a bike, n r i d e is the number of customers who successfully ride a bike. The smaller the value of γ l o s t , the better the performance of the system.
  • The times of reposition: The number of bikes that need to be rebalanced (the truck-based rebalancing strategies) or the number of customers (the customer-oriented rebalancing strategies). In terms of the truck-based rebalancing strategies, the times of relocating bikes corresponds to the truck operating costs. For customer-oriented rebalancing strategies, the incentive cost also increases with the increasing number of incentive customers. To simplify things, the cost of delivering a bike is seen as the same as incentivizing a customer. Obviously, the smaller the times of reposition, the less the costs of rebalancing.

5.3. Parameter Setting

In the simulative bike sharing system, we need to set the following parameters: (1) λ i and μ i , the customer arrival rates for renting and returning at station S i respectively. (2) The distribution parameters of trip duration T i , j . (3) The walking distance r in the TLTF algorithm.
As discussed before, for each station in a BSS, the arrival processes of customers for renting and returning can be described by the Poisson process [43], which indicates that the time interval between two adjacent events should obey the exponential distribution. We analyzed the time interval distribution of the experimental data and found that most of the stations followed the exponential distribution. We take the historical records of the station named “San Jose Diridon Caltrain Station” from 7:00 a.m. to 8:00 a.m. (the morning peak [50], as shown in Figure 4) as an example. Figure 5a shows the time interval distribution of the renting process. It follows the exponential distribution with the parameter λ = 1 11.5208 . Thus, we utilize the Poisson process with λ i = 1 11.5208 to simulate the renting process of customers at this station from 7:00 a.m. to 8:00 a.m. Similarly, as shown in Figure 5b, the Poisson process with μ i = 1 8.4724 is used to simulate the returning process. In the RWTAW algorithm, the values of λ i and μ i of each station are different.
The trip duration is also an important parameter in the simulation system. As shown in Figure 5c, the distribution of trip duration obeys the lognormal distribution (the mean is 6.2806 and the sigma is 0.7032). In our simulation system, the trip duration of each trip is generated by this lognormal distribution.
In order to demonstrate the effectiveness of our simulated bike sharing system, the result of one simulation of the station named “San Jose Diridon Caltrain Station” is illustrated in Figure 6. We plot the variation of the number of bikes rented by customers. The changing pattern of the simulation is in line with that of the empirical data. According to the results of the simulation, we have confidence that the simulated bike sharing system with the aforementioned parameters can reproduce the results of a real system.
In TLTF, the value of walking distance r is crucial, because it will take more incentivizing bonus to encourage customers to rent bikes at stations further away. Furthermore, the r is also related to the computational cost of the algorithm. In other words, a large value of r means lots of stations will be selected as candidate stations by the algorithm when it calculates the O S t . On the other side, the increase of r may help to select the optimal station for renting. Figure 7 shows the influence of distance r on the performance of the system. When r increases from 600 m to 1000 m, the unworking time and the proportion of lost customers decrease. Because the candidate stations will include more stations with an increase of the walking distance r. For example, in the datasets, S 14 is the only candidate of S 2 when r = 600 m, while the candidate stations consist of S 4 , S 5 and S 14 when r = 1000 m. However, the result will be bad if the walking distance is too far. As we can see, the unworking time and the proportion of lost customers increase when r = 1200 m. Although a large r increases the number of candidate stations, it also leads to an increase in the size of the intersection of candidate stations. These stations will be recommended by the system. In this case, they will become empty or full soon. So the unworking time and the proportion of lost customers increase when r = 1200 m. We also care about the relationship between the probability of a customer’s acceptance of walking distance and people’s travel behavior [51], and count each station’s walking distance to its adjacent stations which are not more than 1000 m away. We find that the stations uniformly distribute within 1000 m away from a center station. We think the acceptance probability of this walking distance is also suitable for customers, because they have a wide choice for purpose station [11]. Therefore, we set r = 1000 m.
In addition, we also analyze bike usage on workdays and weekends. As shown in Figure 8, the patterns of the system on workdays are similar, that is, two peaks respectively appear at 10:00 a.m. and 18:00 p.m. One is the morning peak, the other is the evening peak (the two peaks for whole system are 8:00 a.m. and 18:00 p.m., as shown in Figure 4a). However, the patterns on weekends are distinctly different. On weekends, the usage is lower than that on workdays, and is irregular. Such a phenomenon is consistent with what we have mentioned before, that is, commuting time is an important factor which leads to the stable traffic pattern on workdays. Therefore, in this work, we only simulate the operation of the bike sharing system on workdays. The parameters of the system are the same on each workday.
Note that in the dataset of Bay Area, stations are distributed into four districts (as shown in Figure 3a). There are no trajectories between any two different districts. The reason is that customers generally do not choose bikes for long-distance travel. Therefore, stations in our simulation system are all in “San Jose” which has 15 stations (as shown in Figure 3b). The probability of choosing the returning station for the customer satisfies the uniform distribution. Experiments indicate that such an assumption does not influence the time interval distribution of a customer’s arrival process for returning to a station, which still fits well with the exponential distribution.

5.4. Results

In order to validate the proposed strategy, we compared it with three scenarios: the system with no rebalancing, the static rebalancing strategy and the dynamic rebalancing strategy. Note that our target is to verify the effectiveness of the rebalancing strategy, so we do not take too much care on the truck routing problem and the price strategy of incentive in this paper.
  • No Rebalancing (NR): We operate the system without any intervention, even if there appears full or empty stations.
  • Static Rebalancing (SR): The static rebalancing strategy is that we bring the stations to their optimal state once a day, at 3:00 a.m., as in Reference [7].
  • Dynamic Rebalancing (DR): The dynamic rebalancing strategy proposed in Reference [20] calculates the optimal state for stations first, and then makes each station be in its optimal state at the beginning of every i hours. In our experiments, we simulate three DR strategies, that is, i = 1 , 4 , 8 .
Figure 9 shows the system’s performance with different rebalancing strategies. The system with no rebalancing gets the worst performance on the unworking time and the proportion of lost customers. Compared with the NR strategy, the SR strategy decreases by nearly 40% and 39% on these two metrics, respectively. With the decrease of the scheduling time interval, the effectiveness of the dynamic strategy improves (in D R i , i = 1 , 4 , 8 ). As shown in Figure 9, among the three DR strategies, the one which has the shortest scheduling time interval ( i = 1 ) has the least unworking time and the smallest proportion of lost customers. However, its times of reposition is the largest. According to the simulation results, the proposed rebalancing strategy can obtain the smallest proportion of lost customers with the proper times of reposition. At the same time, the unworking time is also within our acceptance.
In BSS, the traffic pattern changes rapidly. The rapid response of the system is important for offering customers a better service. Thus, the rebalancing algorithm should be in real-time. For static strategies, they are implemented at the system’s idle time, which means there is no user in the system during this period. So we do not have to pay attention to the real-time performance of static strategies. Table 3 shows the runtime of our strategy and the DR strategy [20] to calculate a station’s optimal state at a specific hour. There are four stations. The capacity of each station is 11, 15, 19 and 27 respectively. As we can see, the increase of the station’s capacity increases the computing time. The time cost of the DR strategy is greater than ours. The results show that our strategy is real-time and efficient.

6. Conclusions

In this paper, we designed a customer-oriented rebalancing strategy for bike sharing systems. On the basis of the one-dimension Random Walk process with two absorption walls, we infer the probability that a station becomes empty or full, which is useful to both system operators and customers. The proposed strategy includes two algorithms called RWTAW and TLTF respectively. The RWTAW calculates the optimal state of the station. The TLTF determines the optimal station at which the system encourages customers to rent. Compared with the truck-based static and dynamic rebalancing methods, our strategy has the best performance on decreasing the imbalance of the system while keeping the rebalancing cost as low as possible. In future work, we will explore how to predict the number of bikes for each station to improve customer satisfaction.

Author Contributions

Conceptualization, P.Y. and F.H.; methodology, P.Y.; software, P.Y.; validation, P.Y., F.H. and J.P.; formal analysis, P.Y.; investigation, F.H.; resources, J.P.; data curation, P.Y.; writing–original draft preparation, P.Y. and F.H.; writing–review and editing, P.Y., F.H. and J.P.; visualization, P.Y.; supervision, P.Y.; project administration, J.P.; funding acquisition, J.P.

Funding

This research was funded by the National Key Research and Development Project with Grant No. 2017YFB0202403, Sichuan Key Research and Development Program (2017GZDZX0003-02, 2019KJT0015-2018GZ0098), and the Sichuan University-Zigong Science and Technology Fund (2018CDZG-15).

Conflicts of Interest

The authors declare no conflict of interest.

References

  1. Lin, B.; Zhu, J. Impact of energy saving and emission reduction policy on urban sustainable development: Empirical evidence from China. Appl. Energy 2019, 239, 12–22. [Google Scholar] [CrossRef]
  2. Fishman, E.; Washington, S.; Haworth, N. Bike share’s impact on car use: Evidence from the United States, Great Britain, and Australia. Transport. Res. Part D-Transport. Environ. 2014, 31, 13–20. [Google Scholar] [CrossRef]
  3. Zhang, Y.; Mi, Z. Environmental benefits of bike sharing: A big data-based analysis. Appl. Energy 2018, 220, 296–301. [Google Scholar] [CrossRef]
  4. Chemla, D.; Meunier, F.; Calvo, R.W. Bike sharing systems: Solving the static rebalancing problem. Discret. Optim. 2013, 10, 120–146. [Google Scholar] [CrossRef]
  5. Pal, A.; Zhang, Y. Free-floating bike sharing: Solving real-life large-scale static rebalancing problems. Transp. Res. Part C-Emerg. Technol. 2017, 80, 92–116. [Google Scholar] [CrossRef]
  6. Erdoğan, G.; Battarra, M.; Calvo, R.W. An exact algorithm for the static rebalancing problem arising in bicycle sharing systems. Eur. J. Oper. Res. 2015, 245, 667–679. [Google Scholar] [CrossRef] [Green Version]
  7. O’Mahony, E.; Shmoys, D.B. Data Analysis and Optimization for (Citi)Bike Sharing. In Proceedings of the Twenty-Ninth AAAI Conference on Artificial Intelligence, AAAI’15, Austin, TX, USA, 25–30 January 2015; AAAI Press: Menlo Park, CA, USA, 2015; pp. 687–694. [Google Scholar]
  8. Contardo, C.; Morency, C.; Rousseau, L.M. Balancing a Dynamic Public Bike-Sharing System; Technical Report; Cirrelt: Montreal, QC, Canada, 2012. [Google Scholar]
  9. Li, Y.; Zheng, Y.; Yang, Q. Dynamic Bike Reposition: A Spatio-Temporal Reinforcement Learning Approach. In Proceedings of the 24th ACM SIGKDD International Conference on Knowledge Discovery & Data Mining, London, UK, 19–23 August 2018; ACM: New York, NY, USA, 2018; pp. 1724–1733. [Google Scholar]
  10. Chemla, D.; Meunier, F.; Pradeau, T.; Calvo, R.W.; Yahiaoui, H. Self-Service Bike Sharing Systems: Simulation, Repositioning, Pricing; Technical Report; Centre d’Enseignement et de Recherche en Mathematiques et Calcul Scientifique (CERMICS): Marne la Vallée, France, 2013. [Google Scholar]
  11. Singla, A.; Santoni, M.; Bartók, G.; Mukerji, P.; Meenen, M.; Krause, A. Incentivizing Users for Balancing Bike Sharing Systems. In Proceedings of the Twenty-Ninth AAAI Conference on Artificial Intelligence, Austin, TX, USA, 25–30 January 2015; AAAI Press: Menlo Park, CA, USA, 2015; pp. 723–729. [Google Scholar]
  12. Fricker, C.; Gast, N. Incentives and redistribution in homogeneous bike-sharing systems with stations of finite capacity. EURO J. Transp. Logist. 2014, 5, 261–291. [Google Scholar] [CrossRef]
  13. DeMaio, P. Bike-sharing: History, Impacts, Models of Provision, and Future. J. Publ. Transp. 2009, 12, 41–56. [Google Scholar] [CrossRef]
  14. Wang, M.; Zhou, X. Bike-sharing systems and congestion: Evidence from US cities. J. Transp. Geogr. 2017, 65, 147–154. [Google Scholar] [CrossRef]
  15. Fishman, E. Bikeshare: A Review of Recent Literature. Transp. Rev. 2015, 36, 92–113. [Google Scholar] [CrossRef]
  16. Shen, Y.; Zhang, X.; Zhao, J. Understanding the usage of dockless bike sharing in Singapore. Int. J. Sustain. Transp. 2018, 12, 686–700. [Google Scholar] [CrossRef]
  17. Raviv, T.; Tzur, M.; Forma, I.A. Static repositioning in a bike-sharing system: models and solution approaches. EURO J. Transp. Logist. 2013, 2, 187–229. [Google Scholar] [CrossRef] [Green Version]
  18. Schuijbroek, J.; Hampshire, R.; van Hoeve, W.J. Inventory rebalancing and vehicle routing in bike sharing systems. Eur. J. Oper. Res. 2017, 257, 992–1004. [Google Scholar] [CrossRef] [Green Version]
  19. Liu, Y.; Szeto, W.; Ho, S.C. A static free-floating bike repositioning problem with multiple heterogeneous vehicles, multiple depots, and multiple visits. Transp. Res. Pt. C-Emerg. Technol. 2018, 92, 208–242. [Google Scholar] [CrossRef]
  20. Chiariotti, F.; Pielli, C.; Zanella, A.; Zorzi, M. A Dynamic Approach to Rebalancing Bike-Sharing Systems. Sensors 2018, 18, 512. [Google Scholar] [CrossRef] [PubMed]
  21. Liu, J.; Sun, L.; Chen, W.; Xiong, H. Rebalancing bike sharing systems: A multi-source data smart optimization. In Proceedings of the 22nd ACM SIGKDD International Conference on Knowledge Discovery and Data Mining, San Francisco, CA, USA, 13–17 August 2016; ACM: New York, NY, USA, 2016; pp. 1005–1014. [Google Scholar]
  22. Sadilek, A.; Krumm, J.; Horvitz, E. Crowdphysics: Planned and opportunistic crowdsourcing for physical tasks. In Proceedings of the Seventh International AAAI Conference on Weblogs and Social Media, Boston, MA, USA, 8–11 July 2013. [Google Scholar]
  23. Fernández, A.; Timón, S.; Ruiz, C.; Cumplido, T.; Billhardt, H.; Dunkel, J. A Bike Sharing System Simulator. In Proceedings of the International Conference on Practical Applications of Agents and Multi-Agent Systems, Toledo, Spain, 20–22 June 2018; Springer: Berlin, Germany, 2018; pp. 428–440. [Google Scholar]
  24. Pfrommer, J.; Warrington, J.; Schildbach, G.; Morari, M. Dynamic Vehicle Redistribution and Online Price Incentives in Shared Mobility Systems. IEEE Trans. Intell. Transp. Syst. 2014, 15, 1567–1578. [Google Scholar] [CrossRef]
  25. Pan, L.; Cai, Q.; Fang, Z.; Tang, P.; Huang, L. A Deep Reinforcement Learning Framework for Rebalancing Dockless Bike Sharing Systems. arXiv 2018, arXiv:1802.04592. [Google Scholar]
  26. Diez, C.; Palanca, J.; Sanchez-Anguix, V.; Heras, S.; Giret, A.; Julián, V. Towards a Persuasive Recommender for Bike Sharing Systems: A Defeasible Argumentation Approach. Energies 2019, 12, 662. [Google Scholar] [CrossRef]
  27. Zeng, M.; Yu, T.; Wang, X.; Su, V.; Nguyen, L.T.; Mengshoel, O.J. Improving Demand Prediction in Bike Sharing System by Learning Global Features. In Proceedings of the Machine Learning for Large Scale Transportation Systems (LSTS)@ KDD-16, San Francisco, CA, USA, 13 August 2016. [Google Scholar]
  28. Kaltenbrunner, A.; Meza, R.; Grivolla, J.; Codina, J.; Banchs, R. Urban cycles and mobility patterns: Exploring and predicting trends in a bicycle-based public transport system. Pervasive Mob. Comput. 2010, 6, 455–466. [Google Scholar] [CrossRef]
  29. Yoon, J.W.; Pinelli, F.; Calabrese, F. Cityride: A predictive bike sharing journey advisor. In Proceedings of the 2012 IEEE 13th International Conference on Mobile Data Management (MDM), Bengaluru, Karnataka, India, 23–26 July 2012; pp. 306–311. [Google Scholar]
  30. Li, Y.; Zheng, Y.; Zhang, H.; Chen, L. Traffic prediction in a bike-sharing system. In Proceedings of the 23rd SIGSPATIAL International Conference on Advances in Geographic Information Systems, Seattle, WA, USA, 3–6 November 2015; ACM: New York, NY, USA, 2015; p. 33. [Google Scholar]
  31. Chen, L.; Zhang, D.; Wang, L.; Yang, D.; Ma, X.; Li, S.; Wu, Z.; Pan, G.; Nguyen, T.M.T.; Jakubowicz, J. Dynamic cluster-based over-demand prediction in bike sharing systems. In Proceedings of the 2016 ACM International Joint Conference on Pervasive and Ubiquitous Computing, Heidelberg, Germany, 12–16 September 2016; ACM: New York, NY, USA, 2016; pp. 841–852. [Google Scholar]
  32. Liu, J.; Li, Q.; Qu, M.; Chen, W.; Yang, J.; Xiong, H.; Zhong, H.; Fu, Y. Station site optimization in bike sharing systems. In Proceedings of the 2015 IEEE International Conference on Data Mining, Atlantic City, NJ, USA, 14–17 November 2015; IEEE: Piscataway, NJ, USA, 2015; pp. 883–888. [Google Scholar]
  33. Lin, L.; He, Z.; Peeta, S. Predicting station-level hourly demand in a large-scale bike-sharing network: A graph convolutional neural network approach. Transp. Res. Pt. C-Emerg. Technol. 2018, 97, 258–276. [Google Scholar] [CrossRef] [Green Version]
  34. Dell’Olio, L.; Ibeas, A.; Moura, J.L. Implementing bike-sharing systems. Proc. Inst. Civ. Eng.-Munici. Eng. 2011, 164, 89–101. [Google Scholar] [CrossRef]
  35. Chen, Q.; Sun, T. A model for the layout of bike stations in public bike-sharing systems. J. Adv. Transp. 2015, 49, 884–900. [Google Scholar] [CrossRef]
  36. Lin, J.R.; Yang, T.H. Strategic design of public bicycle sharing systems with service level constraints. Transp. Res. Part E Logist. Transp. Rev. 2011, 47, 284–294. [Google Scholar] [CrossRef]
  37. Bargar, A.; Gupta, A.; Gupta, S.; Ma, D. Interactive visual analytics for multi-city bikeshare data analysis. In Proceedings of the 3rd International Workshop on Urban Computing (UrbComp 2014), New York, NY, USA, 24 August 2014; Volume 45. [Google Scholar]
  38. Vogel, P.; Greiser, T.; Mattfeld, D.C. Understanding Bike-Sharing Systems using Data Mining: Exploring Activity Patterns. Procedia-Soc. Behav. Sci. 2011, 20, 514–523. [Google Scholar] [CrossRef] [Green Version]
  39. Froehlich, J.E.; Neumann, J.; Oliver, N. Sensing and predicting the pulse of the city through shared bicycling. In Proceedings of the Twenty-First International Joint Conference on Artificial Intelligence, Pasadena, CA, USA, 14–17 July 2009. [Google Scholar]
  40. Bao, J.; He, T.; Ruan, S.; Li, Y.; Zheng, Y. Planning bike lanes based on sharing-bikes’ trajectories. In Proceedings of the 23rd ACM SIGKDD International Conference on Knowledge Discovery and Data Mining, Halifax, NS, Canada, 13–17 August 2017; ACM: New York, NY, USA, 2017; pp. 1377–1386. [Google Scholar]
  41. He, T.; Bao, J.; Li, R.; Ruan, S.; Li, Y.; Tian, C.; Zheng, Y. Detecting Vehicle Illegal Parking Events Using Sharing Bikes’ Trajectories; ACM: New York, NY, USA, 2018. [Google Scholar]
  42. Pemantle, R. A survey of random processes with reinforcement. Probab. Surv. 2007, 4, 1–79. [Google Scholar] [CrossRef]
  43. Huang, F.; Qiao, S.; Peng, J.; Guo, B. A Bimodal Gaussian Inhomogeneous Poisson Algorithm for Bike Number Prediction in a Bike-Sharing System. IEEE Trans. Intell. Transp. Syst. 2018, 1–10. [Google Scholar] [CrossRef]
  44. Pearson, K. The problem of the random walk. Nature 1905, 72, 342. [Google Scholar] [CrossRef]
  45. Weiss, G.H.; Rubin, R.J. Random walks: theory and selected applications. Adv. Chem. Phys. 1982, 52, 363–505. [Google Scholar]
  46. Scalas, E.; Gorenflo, R.; Mainardi, F. Fractional calculus and continuous-time finance. Physica A 2000, 284, 376–384. [Google Scholar] [CrossRef] [Green Version]
  47. Cupertino, T.H.; Carneiro, M.G.; Zheng, Q.; Zhang, J.; Zhao, L. A scheme for high level data classification using random walk and network measures. Expert Syst. Appl. 2018, 92, 289–303. [Google Scholar] [CrossRef]
  48. Pons, P.; Latapy, M. Computing Communities in Large Networks Using Random Walks. J. Graph Algorithms Appl. 2006, 10, 191–218. [Google Scholar] [CrossRef] [Green Version]
  49. Backstrom, L.; Leskovec, J. Supervised random walks: predicting and recommending links in social networks. In Proceedings of the Fourth ACM International Conference on Web Search and Data Mining, Hong Kong, China, 9–12 February 2011; ACM: New York, NY, USA, 2011; pp. 635–644. [Google Scholar]
  50. Shaheen, S.A.; Chan, N.D.; Gaynor, T. Casual carpooling in the San Francisco Bay Area: Understanding user characteristics, behaviors, and motivations. Transp. Policy 2016, 51, 165–173. [Google Scholar] [CrossRef] [Green Version]
  51. Cervero, R.; Duncan, M. Walking, Bicycling, and Urban Landscapes: Evidence From the San Francisco Bay Area. Am. J. Public Health 2003, 93, 1478–1483. [Google Scholar] [CrossRef] [PubMed]
Figure 1. Example of renting process.
Energies 12 02578 g001
Figure 2. Framework of simulate system.
Energies 12 02578 g002
Figure 3. Map of the Bay Area bike sharing system. (a) Stations in Bay Area; (b) Stations in our simulation.
Energies 12 02578 g003
Figure 4. The renting and returning bikes by hours. (a) Renting by hours; (b) Returning by hours.
Energies 12 02578 g004
Figure 5. Statistical information of time interval and trip duration. (a) Rent; (b) Return; (c) Trip Duration.
Energies 12 02578 g005
Figure 6. Simulation Results of station named “San Jose Diridon Caltrain Station”.
Energies 12 02578 g006
Figure 7. System performance with different r in TLTF.
Energies 12 02578 g007
Figure 8. Bike usage on workdays and weekends. (a) Monday; (b) Tuesday; (c) Wednesday; (d) Thursday; (e) Friday; (f) Saturday; (g) Sunday.
Energies 12 02578 g008
Figure 9. Comparison of system performance.
Energies 12 02578 g009
Table 1. Notations.
Table 1. Notations.
nTotal number of stations
I i , j The edge between station S i and S j
M i Capacity of station S i
m i ( t ) Available bikes of station S i at time t
r i , j Walking distance from S i to S j
p i , j The probability ride from S i to S j
T i , j Trip duration by bike from S i to S j
t ( k ) The time period in the day indexed by slice k
λ i ( k ) / μ i ( k ) The customer arrival rate for renting/returning at S i
O P i , k The optimal state of S i during time t ( k )
O S t The optimal station for renting at time t
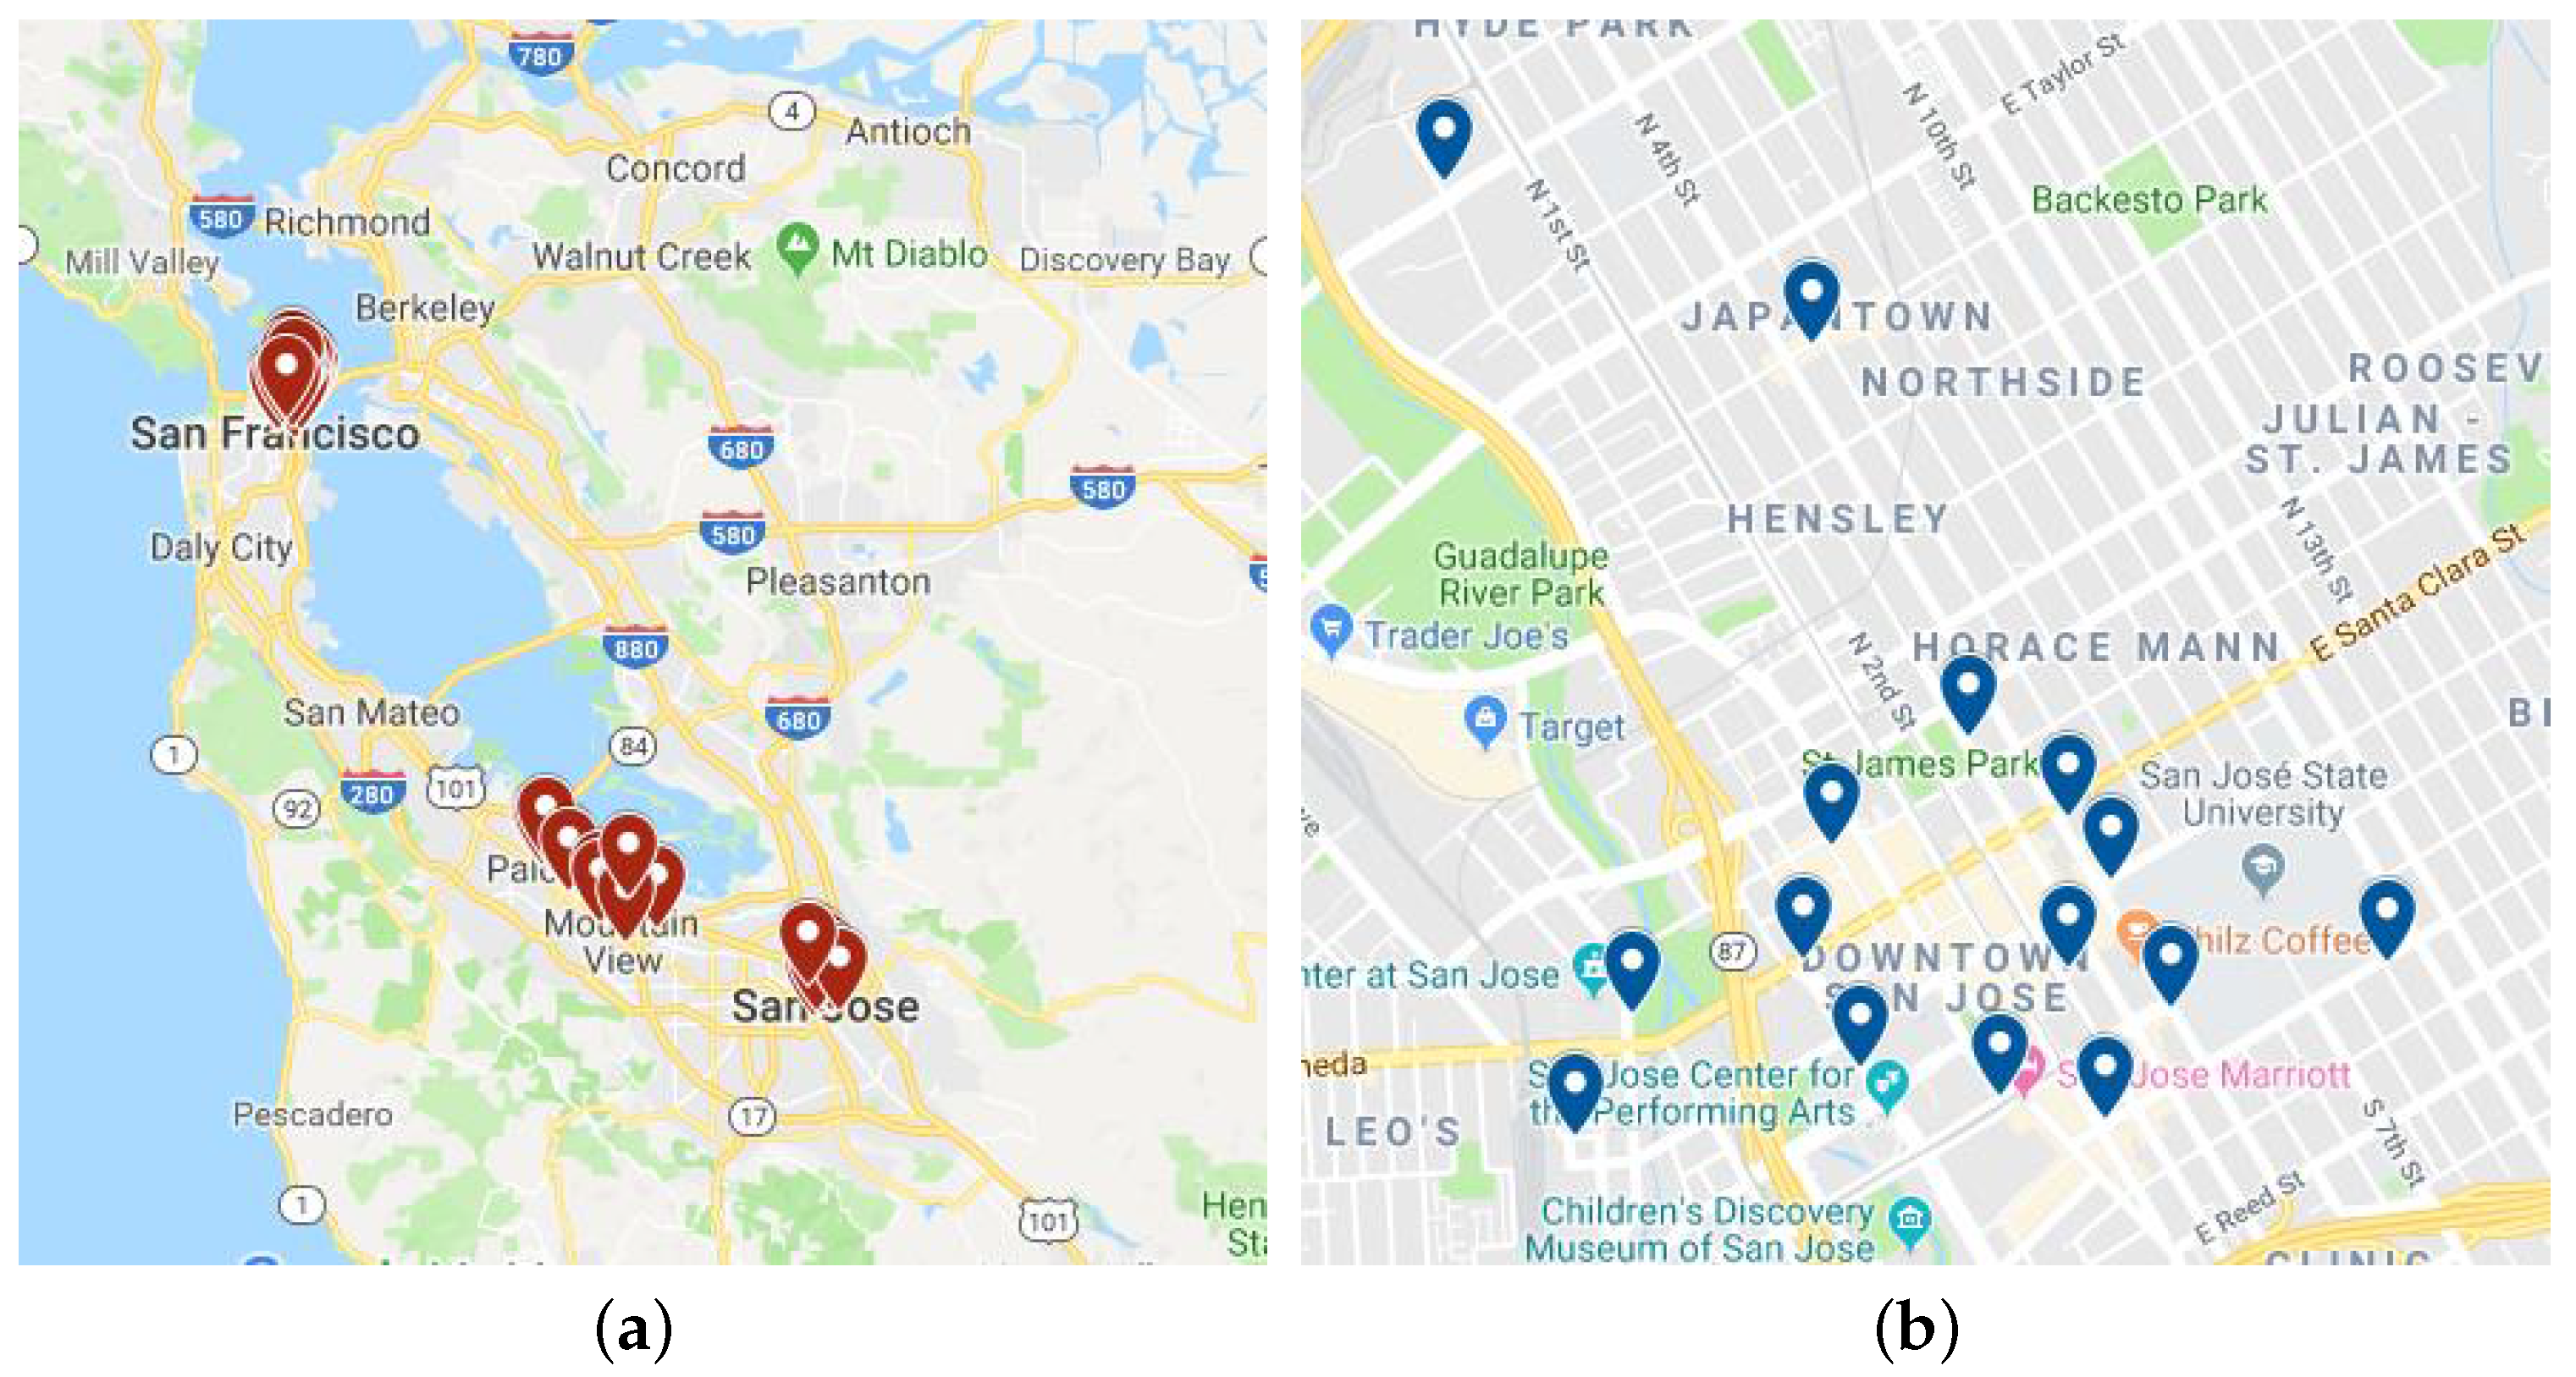
Table 2. Details of the Dataset.
Data sourceBay Area
Time span1 September 2015 to 31 August 2016
Stations68 (ID, name, latitude, longitude, capacity, city, installation date)
Trajectory trips314,000
Status records36 million (the number of available bikes and docks)
Table 3. Comparison of runtime of calculating the optimal state.
StationID (Capacity)DROurs
Runtime (s)Optimal StateRuntime (s)Optimal State
2(27)13.35280.0266
5(19)9.76550.0085
6(15)10.53380.0149
4(11)7.22480.0127

