Article

Combined Environmental and Economic Assessment of Energy Efficiency Measures in a Multi-Dwelling Building

1
School of Technology and Business Studies, Dalarna University, 791 88 Falun, Sweden
2
Faculty of Engineering and Sustainable Development, University of Gävle, 801 76 Gävle, Sweden
3
Department of Applied Physics and Electronics, Umeå University, 901 87 Umeå, Sweden
*
Author to whom correspondence should be addressed.
Energies 2019, 12(13), 2484; https://doi.org/10.3390/en12132484
Submission received: 9 May 2019 / Revised: 19 June 2019 / Accepted: 25 June 2019 / Published: 27 June 2019
(This article belongs to the Special Issue Life Cycle Energy Assessment on Buildings)

Abstract

:
The aim of this study is to assess how different renovation scenarios affect the environmental and economic impacts of a multi-dwelling building in a Nordic climate, how these aspects are correlated and how different energy carriers affect different environmental impact categories. In order to reduce greenhouse gas emissions, the European Union has set an agenda in order to reduce energy use in buildings. New buildings on the European market have a low replacement rate, which makes building renovation an important factor for achieving the European Union goals. In this study, eight renovation strategies were analyzed following the European Committee for Standardization standards for life cycle assessment and life cycle costs of buildings. This study covers all life cycle steps from cradle to grave. The renovation scenarios include combinations of photovoltaics, geothermal heat pumps, heat recovery ventilation and improved building envelopes. Results show that, depending on the energy carrier, reductions in global warming potential can be achieved at the expense of an increased nuclear waste disposal. It also shows that for the investigated renovation strategies in Sweden there is no correlation between the economic and the environmental performance of the building. Changing energy carriers in Sweden in order to reduce greenhouse gas emissions can be a good alternative, but it makes the system more dependent on nuclear power.

1. Introduction

In 2015, members of the United Nations adopted a resolution to the 2030 agenda for sustainable development [1]. By fulfilling the goals, a separation of economic growth from climate change, poverty and inequality will be reached. The World Green Building Council [2] has identified nine of these goals as relevant for buildings, including affordable and clean energy, responsible use and production and climate action. Related to this, in order to tackle climate action, the European Union launched a plan to reduce energy use in buildings by 30% and greenhouse gas emissions (GHG) by 40% by 2030, compared with 1990 levels [3]. It is estimated that 80% of the total building stock will remain in use in 2050 [4], having a low replacement rate of about 1 to 3% [5]. In order to reduce emissions to conform to the EU aspirations, there is a need for energy efficient renovation of existing buildings. According to Moschetti et al. [6], there are three main renovation categories that are often analyzed in life cycle assessment (LCA): Renovation of the building envelope, improvement of technical systems and implementation of renewable energies. These measures are often analyzed separately and the total environmental and economic impacts of the renovations are rarely evaluated [7], leading to the need for a more lifecycle-thinking approach [8]. Nemry et al. [9] states that there is a potential for economic and environmental savings in single and two-family buildings. Ostermeyer et al. [10] have proposed a methodology to assess renovation measures in a multidimensional perspective, taking into consideration life cycle assessment (LCA), life cycle costing (LCC) and social life cycle assessment (S-LCA). Cetiner and Edis [11] have performed studies in detached family buildings in Turkey. Pombo et al. [12] have used the same approach for a case study in Spain. However, there is a lack of comprehensive LCA/LCC studies for building renovation projects in multifamily buildings [13]. Moschetti et al. [6] presented a methodological approach for such renovations in Norway.
The aim of this paper is to assess the environmental impact and economic performance of different renovation strategies for a multi-dwelling building in a Nordic climate. Further aims are to identify and discuss the implications of different energy carriers regarding the environmental impact of the building, and also possible correlations between environmental impacts and the economic performance of renovation strategies. This is facilitated by using a multicriteria evaluation integrating life cycle assessment (LCA) and life cycle costing (LCC), and investigating different environmental indicators. Both LCA and LCC are applied in accordance with the EN standards 15978 and 16627 [14,15].

2. Methodology

The case study object and the selected renovation scenarios were simulated in the software IDA-ICE [16] to establish the energy demand of the building for the different renovation strategies. This was followed by an LCA in line with EN standard 15978 for life cycle assessments for buildings [14]. Then, an LCC analysis based on EN standard 16627 for life cycle cost for buildings [15] was performed. Finally, a sensitivity analysis was made based on the results of the LCA.

2.1. Case Study

The analyzed building is a three-story multi-dwelling building in the city of Borlänge, Sweden. The building is part of a large-scale settlement called Tjärna Ängar, built in 1969–1971. The building has 36 apartments and a gross building area of 2822 m2. The different renovation scenarios are based on the same building. The entire building, heated to an indoor temperature of 21 °C, acts as the functional unit of the analysis. The study is based on a life perspective of a period of 50 years including the relevant maintenance and repairs during this time period.
In total, eight different renovation scenarios were assessed (based on the scenarios defined in [17]) scenarios 5, 6, 7 and 8 have improvements of the building envelope, by adding extra insulation and changing to energy efficient windows. Scenarios 3, 4, 7 and 8 change the ventilation system to heat recovery ventilation (HRV), scenarios 2, 4, 6 and 8 change district heating (DH) to geothermal heat pumps (GHP) and scenarios 1, 4, 5 and 8 include photovoltaics (PV) (see Table 1). Notice that scenario 0 is the reference scenario, i.e., no relevant measures other than the replacement of the mechanical ventilation fans is taken into consideration.

2.2. Energy Simulation

The building renovation scenarios were simulated using IDA-ICE [16] to calculate the annual energy demand. The PV production was estimated using PVGIS [18]. More details of the energy simulation can be found in [17,19]. In this study, the energy demand is that stated in the Swedish building code [20] regarding space heating, domestic hot water and facility electricity. The emission factors of the selected energy sources are listed in Table S5 of Supplementary Materials. The selected scenarios affect the environmental impact differently. Mainly, the scenarios reduce the active heating demand of the building, that is, they use installations that are more efficient and change the energy carrier. The assumption in this study is that energy use would be the same in the building during the whole lifetime.

2.3. Life Cycle Assessment

The proposed LCA is made in line with the EN standard for LCA of buildings [14]. The goal of the analysis was to assess the environmental impacts of the different renovation scenarios, during a life span of 50 years. The functional unit was determined as the whole building. The system boundary is cradle-to-grave; the study includes manufacture and construction material (A1-3), construction processes (A4-5), use and maintenance (B1-7) and end of life (C1-4). The benefits and loads beyond the system boundaries (D) were calculated, but not included in the total results, in accordance with the EN standards 15978 and 16627 [14,15]. The maintenance measures taken into consideration are the replacement of all materials and components that have a technical service life shorter than 50 years. The end of life (EoL) scenarios are in accordance with the EN standard and listed in Table S7 of Supplementary Materials.

2.3.1. Life Cycle Inventory

The proposed measures to improve the building envelope have previously been studied in Ramírez-Villegas et al. [19]. In this study, photovoltaic panels and a geothermal heat pump were added to the renovation scenarios as these are considered to be cost-effective measures in Sweden [21]. Data for these are presented in Table 2 and Table S3 of Supplementary Materials.

2.3.2. Life Cycle Impact Assessment

According to the EN standard for LCA of buildings [14], the CML 2002 impact assessment method is required [4]. In this study five relevant impact categories are considered: Global Warming Potential (GWP), Acidification Potential (AP), Eutrophication Potential (EP), Abiotic Depletion Potential of non-fossil elements (ADP) and Radioactive Waste disposal (RW). GWP indicates relevant impact globally, AP and EP are indicators of local environmental impact, ADP is relevant when considering the use of limited resources, and RW is relevant as nuclear power constitutes a large share of power generation in Sweden and neighboring countries. As the LCA is based on simulations that complies with the EN standard, the analysis is using an attributional approach.

2.4. Life Cycle Costs

The assessment was calculated in One Click LCA software using an automated LCC tool based on the standard ISO 15686-5 and EN 16627. The LCC considers the same life cycle stages as the LCA. The LCC analysis has been made for eight renovation scenarios shown in Table 1, and their impact was calculated as an undiscounted cost, including inflation and increasing energy prices. All costs included in the analysis are listed in Table S6 of Supplementary Materials.

Parameters of the Analysis

All costs were calculated in Swedish Krona (1.00 SEK = 0.104 EUR). The discount rate is the interest rate used to determine the present value of future cash flows; the regional material cost index represents the variation in nonlabor costs for construction; the inflation rate is the rate as inflation increases the future cost.
According to the software developers, the automated datasets for material costs are based on data compiled by Müller [22] and Spon’s Architects’ and Builders’ Price [23] and are modified by the regional material cost index. Labor costs are based on data from the International Labor Organization [24]. Maintenance costs are based on Lufkin et al. [25,26] and end-of-life costs are calculated based on the capital costs [27]. The used LCC calculation parameters are presented in Table 3 and in the Table S6 in Supplementary Materials.

2.5. Combined LCA-LCC

To identify correlation between the results from the LCA and LCC analysis, results were plotted in the same graph using the reference building as the 0 point. In order to simplify the analysis, the costs are plotted as percentages, showing how the economic and environmental impacts are compared to the base scenario.
LCC (%) = (LCCs − LCCo)/LCCo
where LCCs is the life cycle cost of the selected scenarios, and LCCo is the life cycle cost of the base scenarios. The same equation has been used for the LCA.

2.6. Sensitivity Analysis

In order to check the robustness of the LCA analysis in relation to the uncertainty of the input parameters, a sensitivity analysis was carried out based on changing the electricity mix during the whole life span of the building. The electricity mixes used were of neighboring countries (Denmark, Estonia, Finland, Germany and Norway) that have a similar climate. Additionally, the electricity mixes were selected due to a shared market of electricity. The energy sources used in this analysis are listed in Table S5 of Supplementary Materials.

3. Results

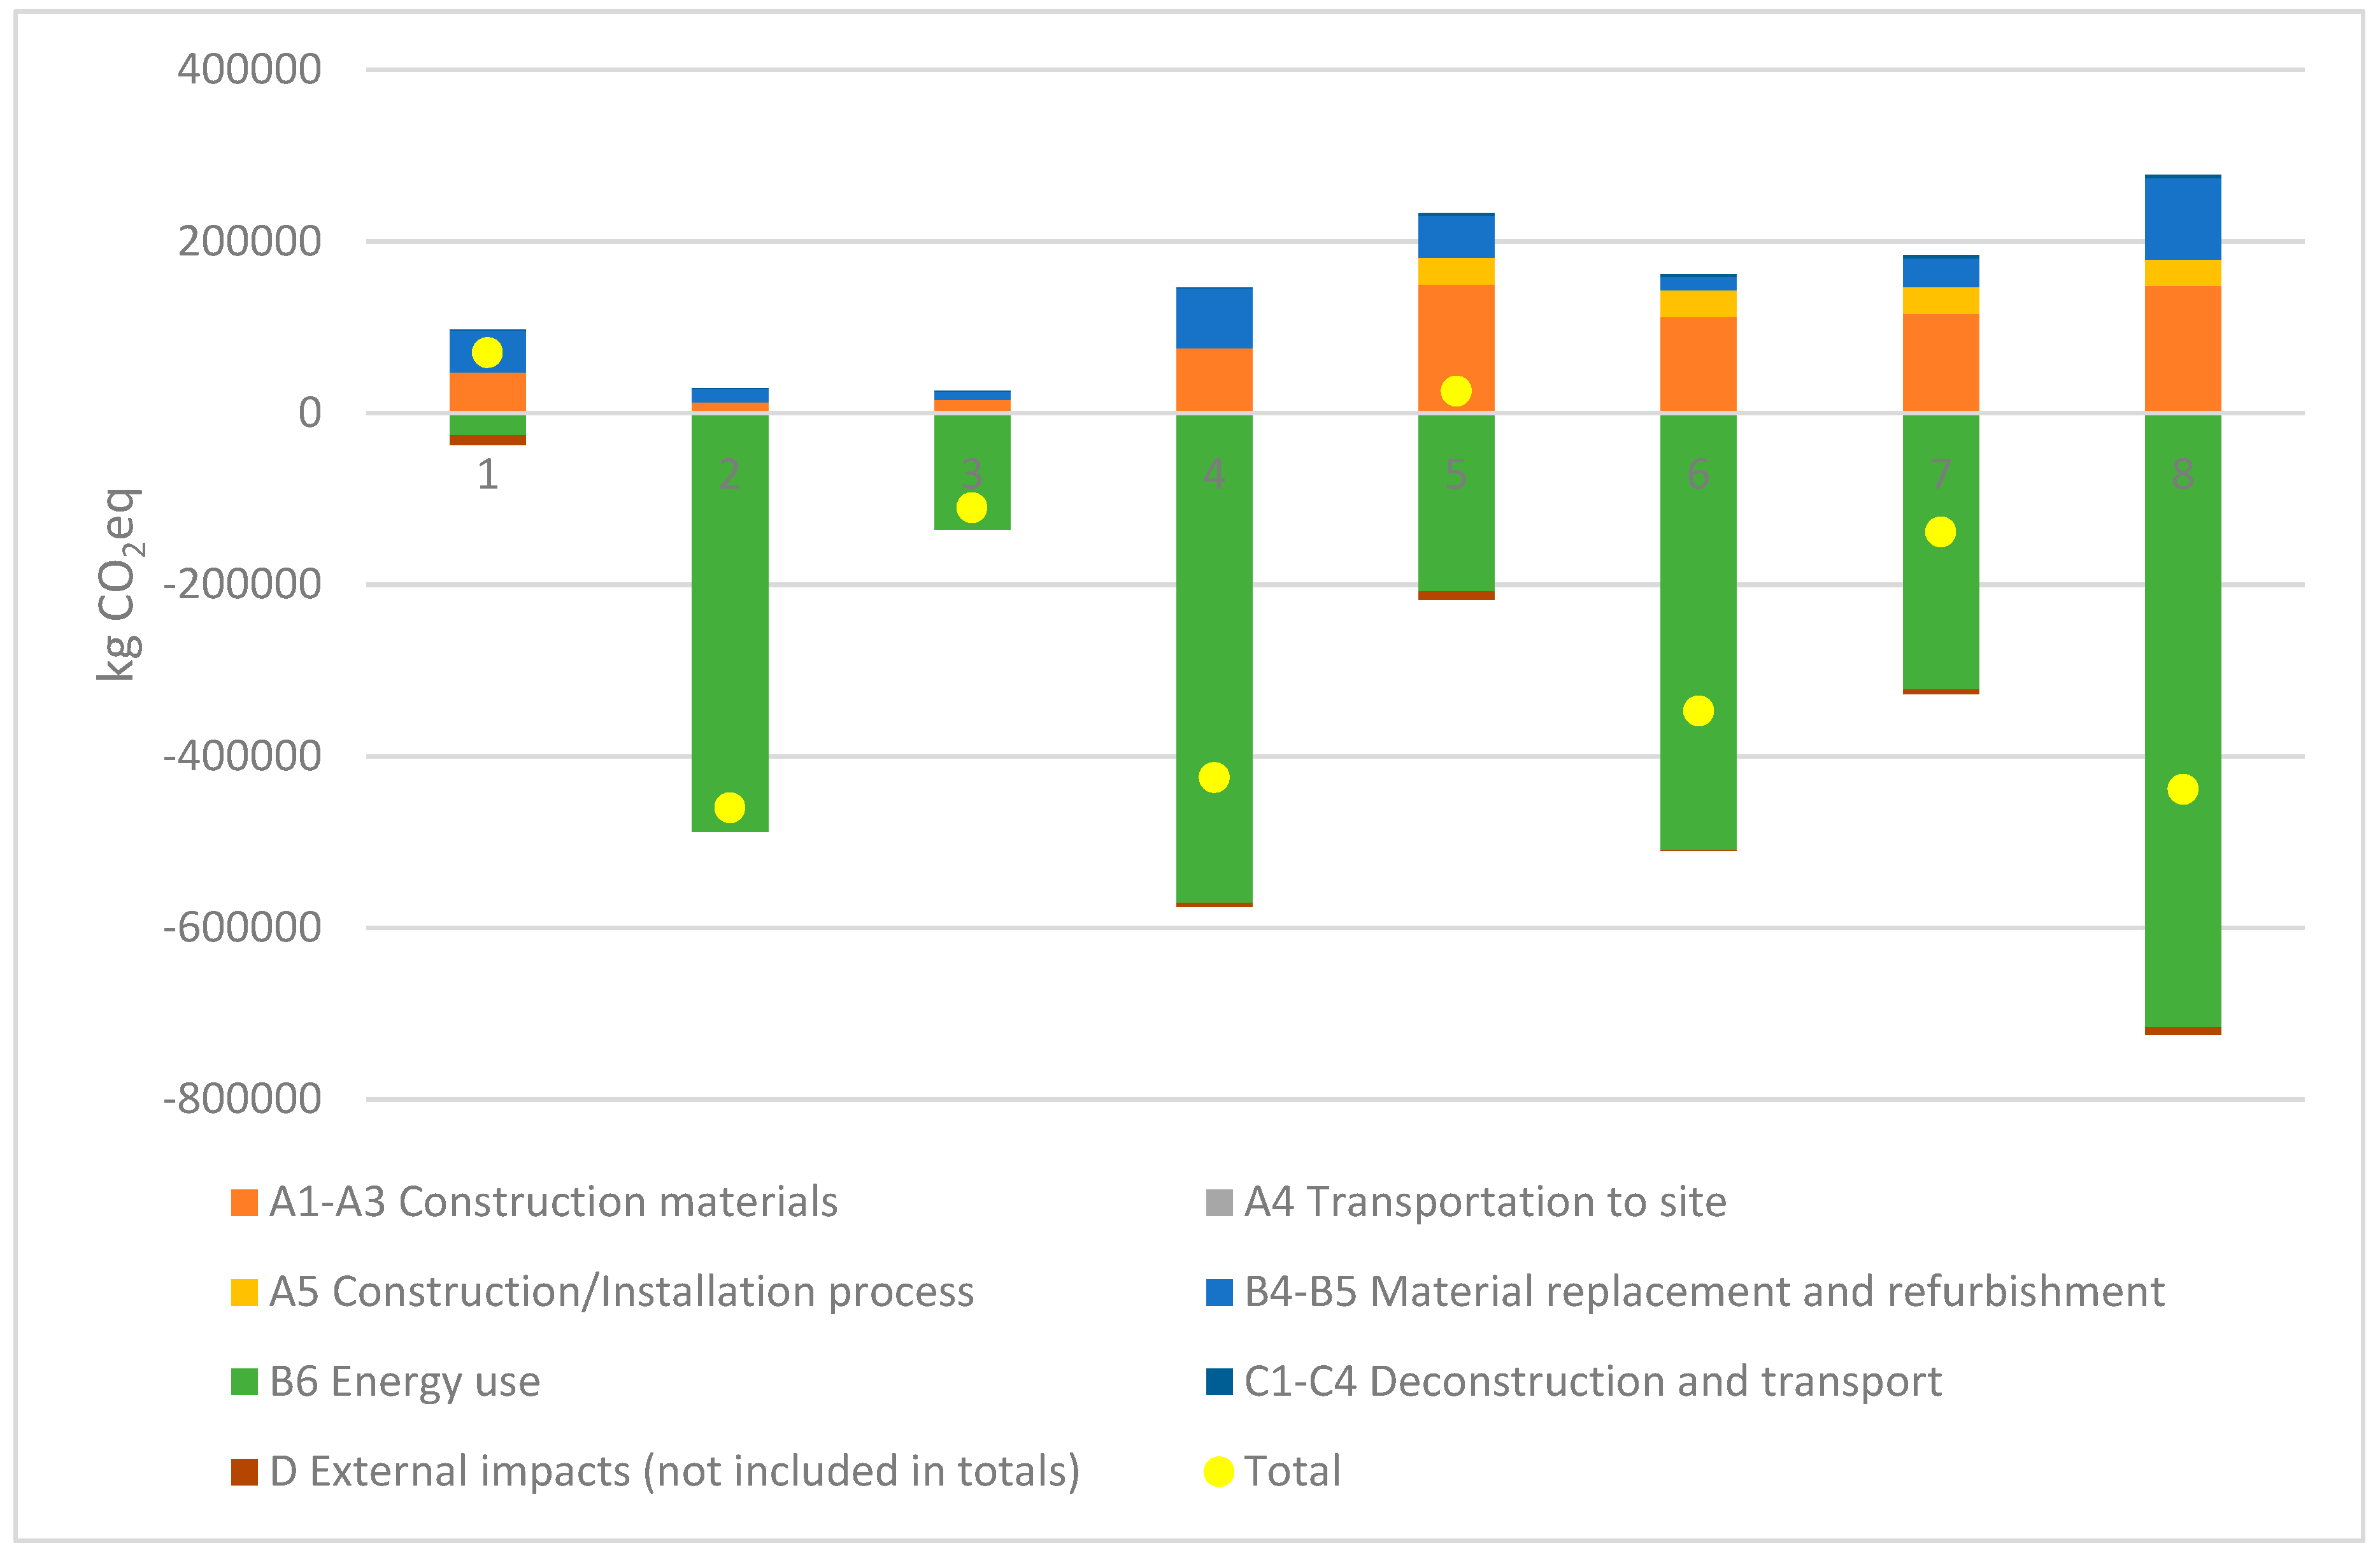
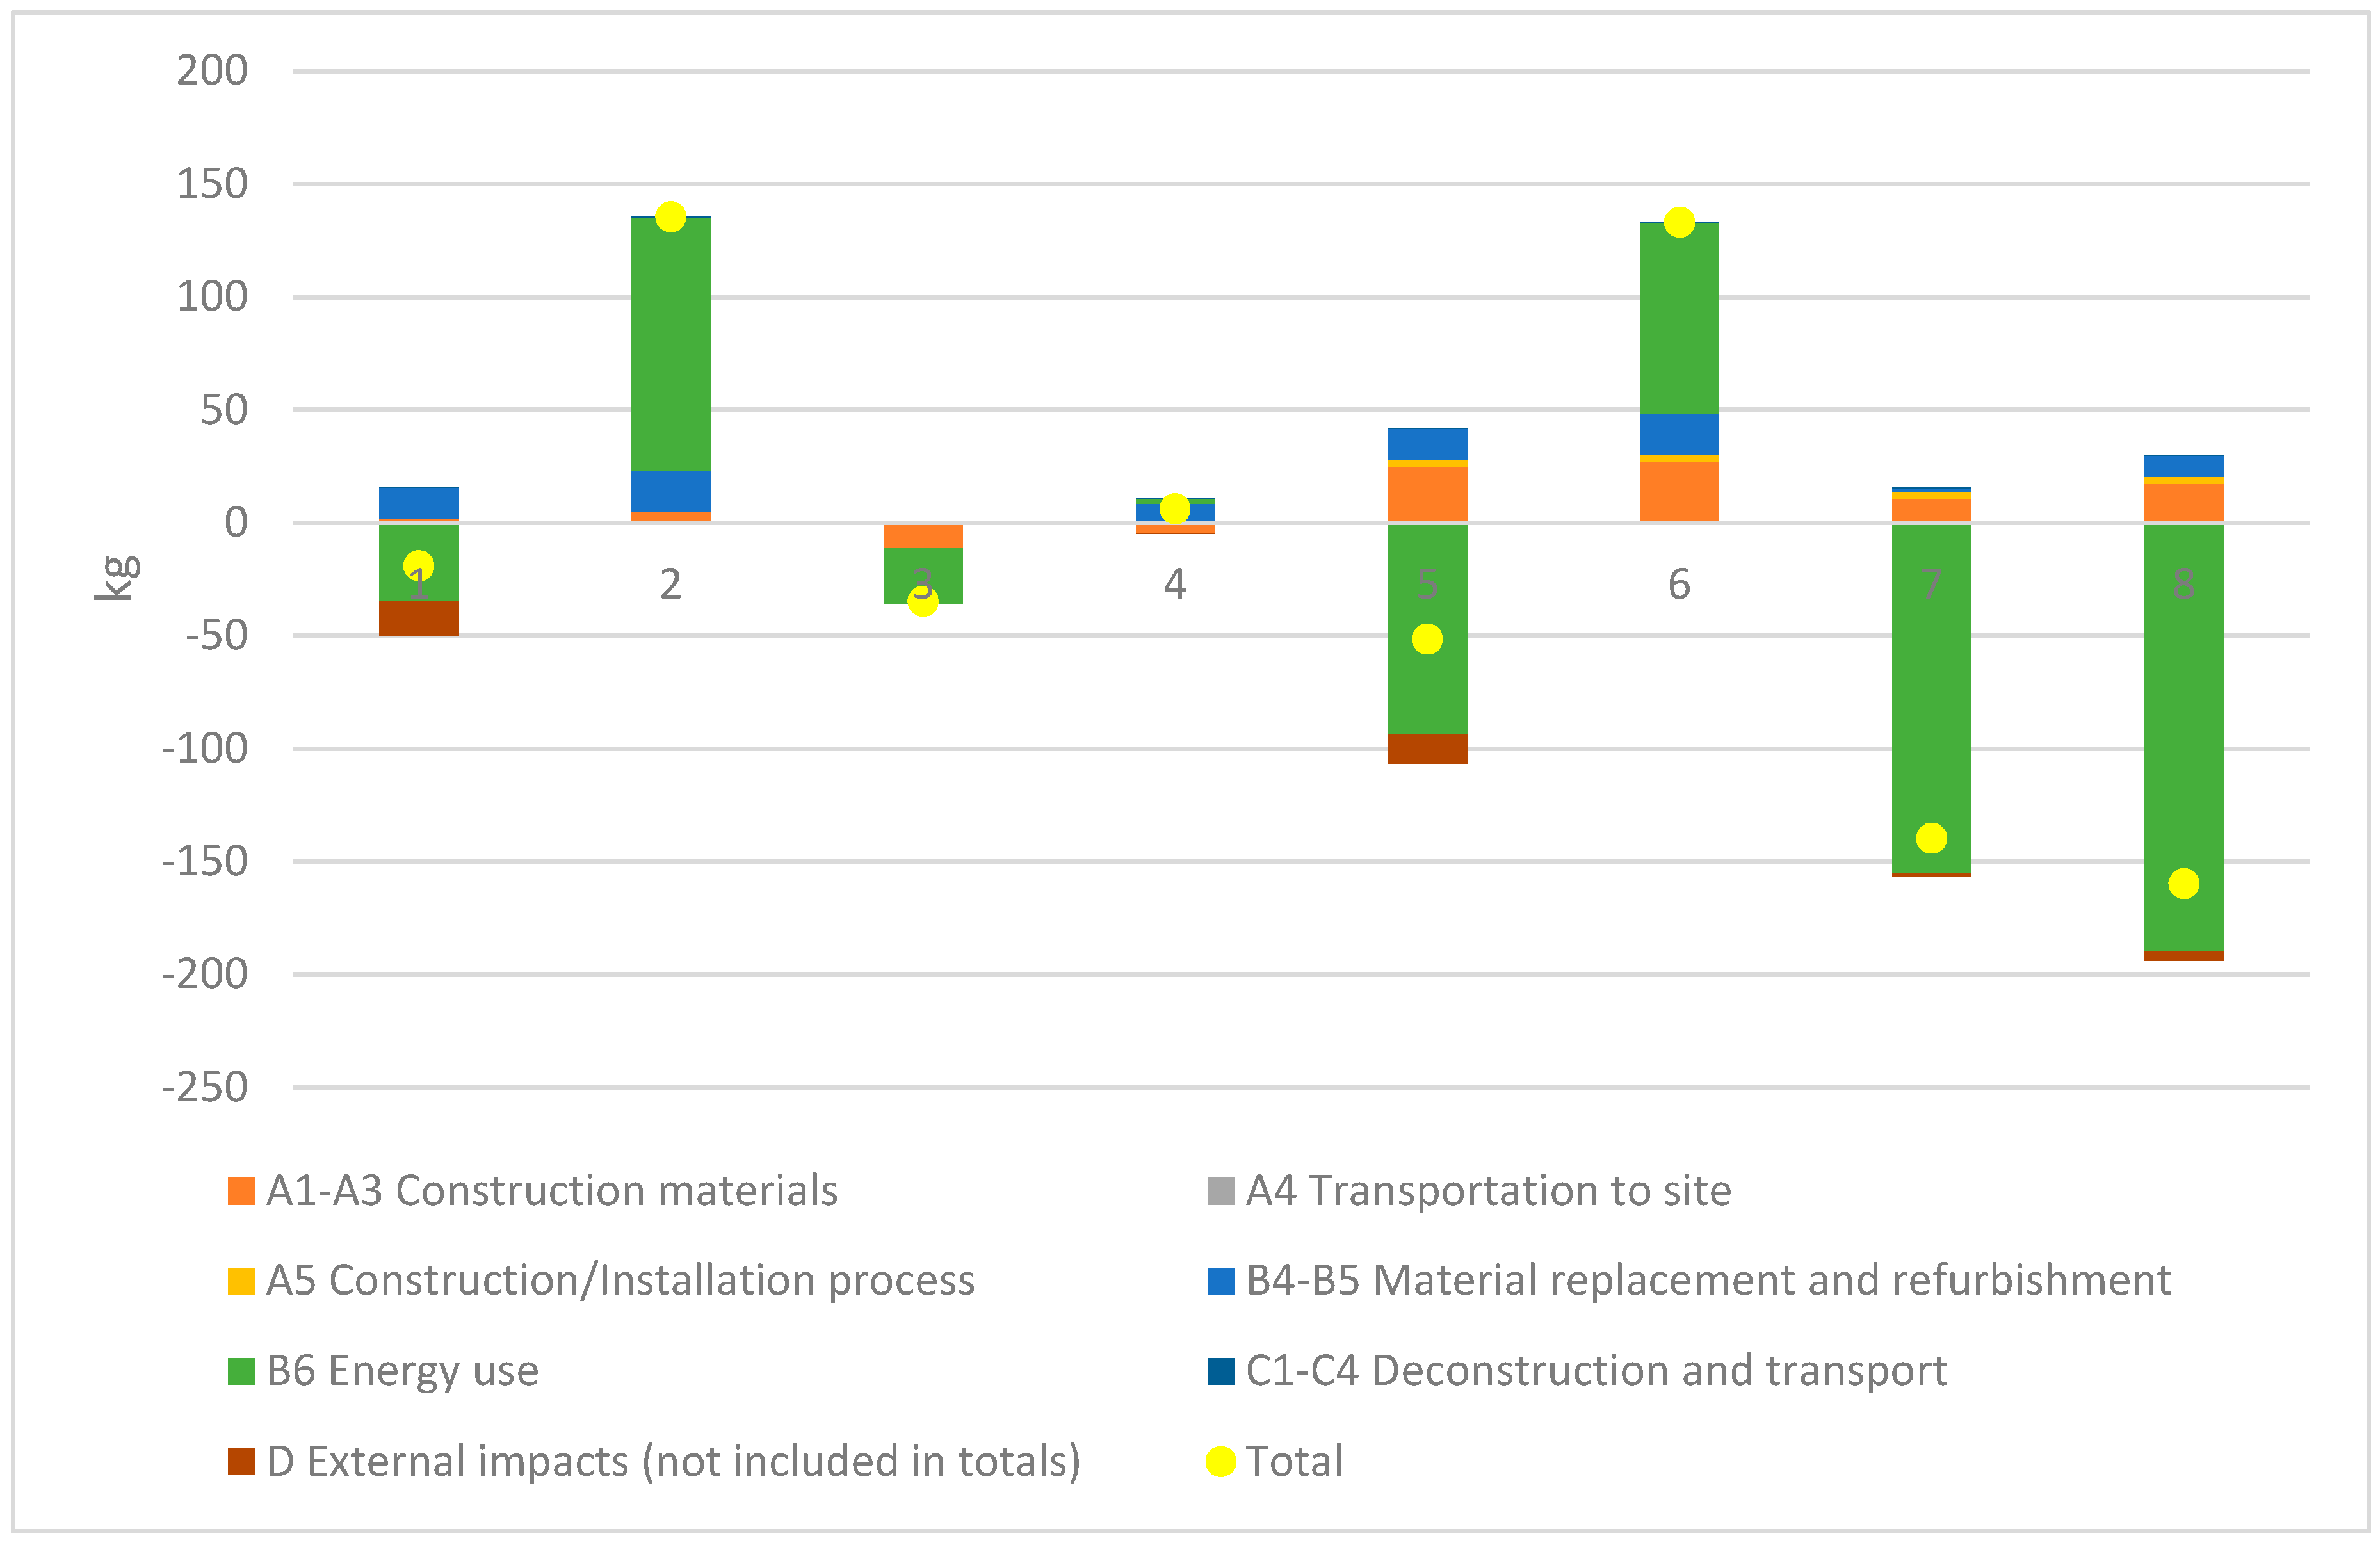
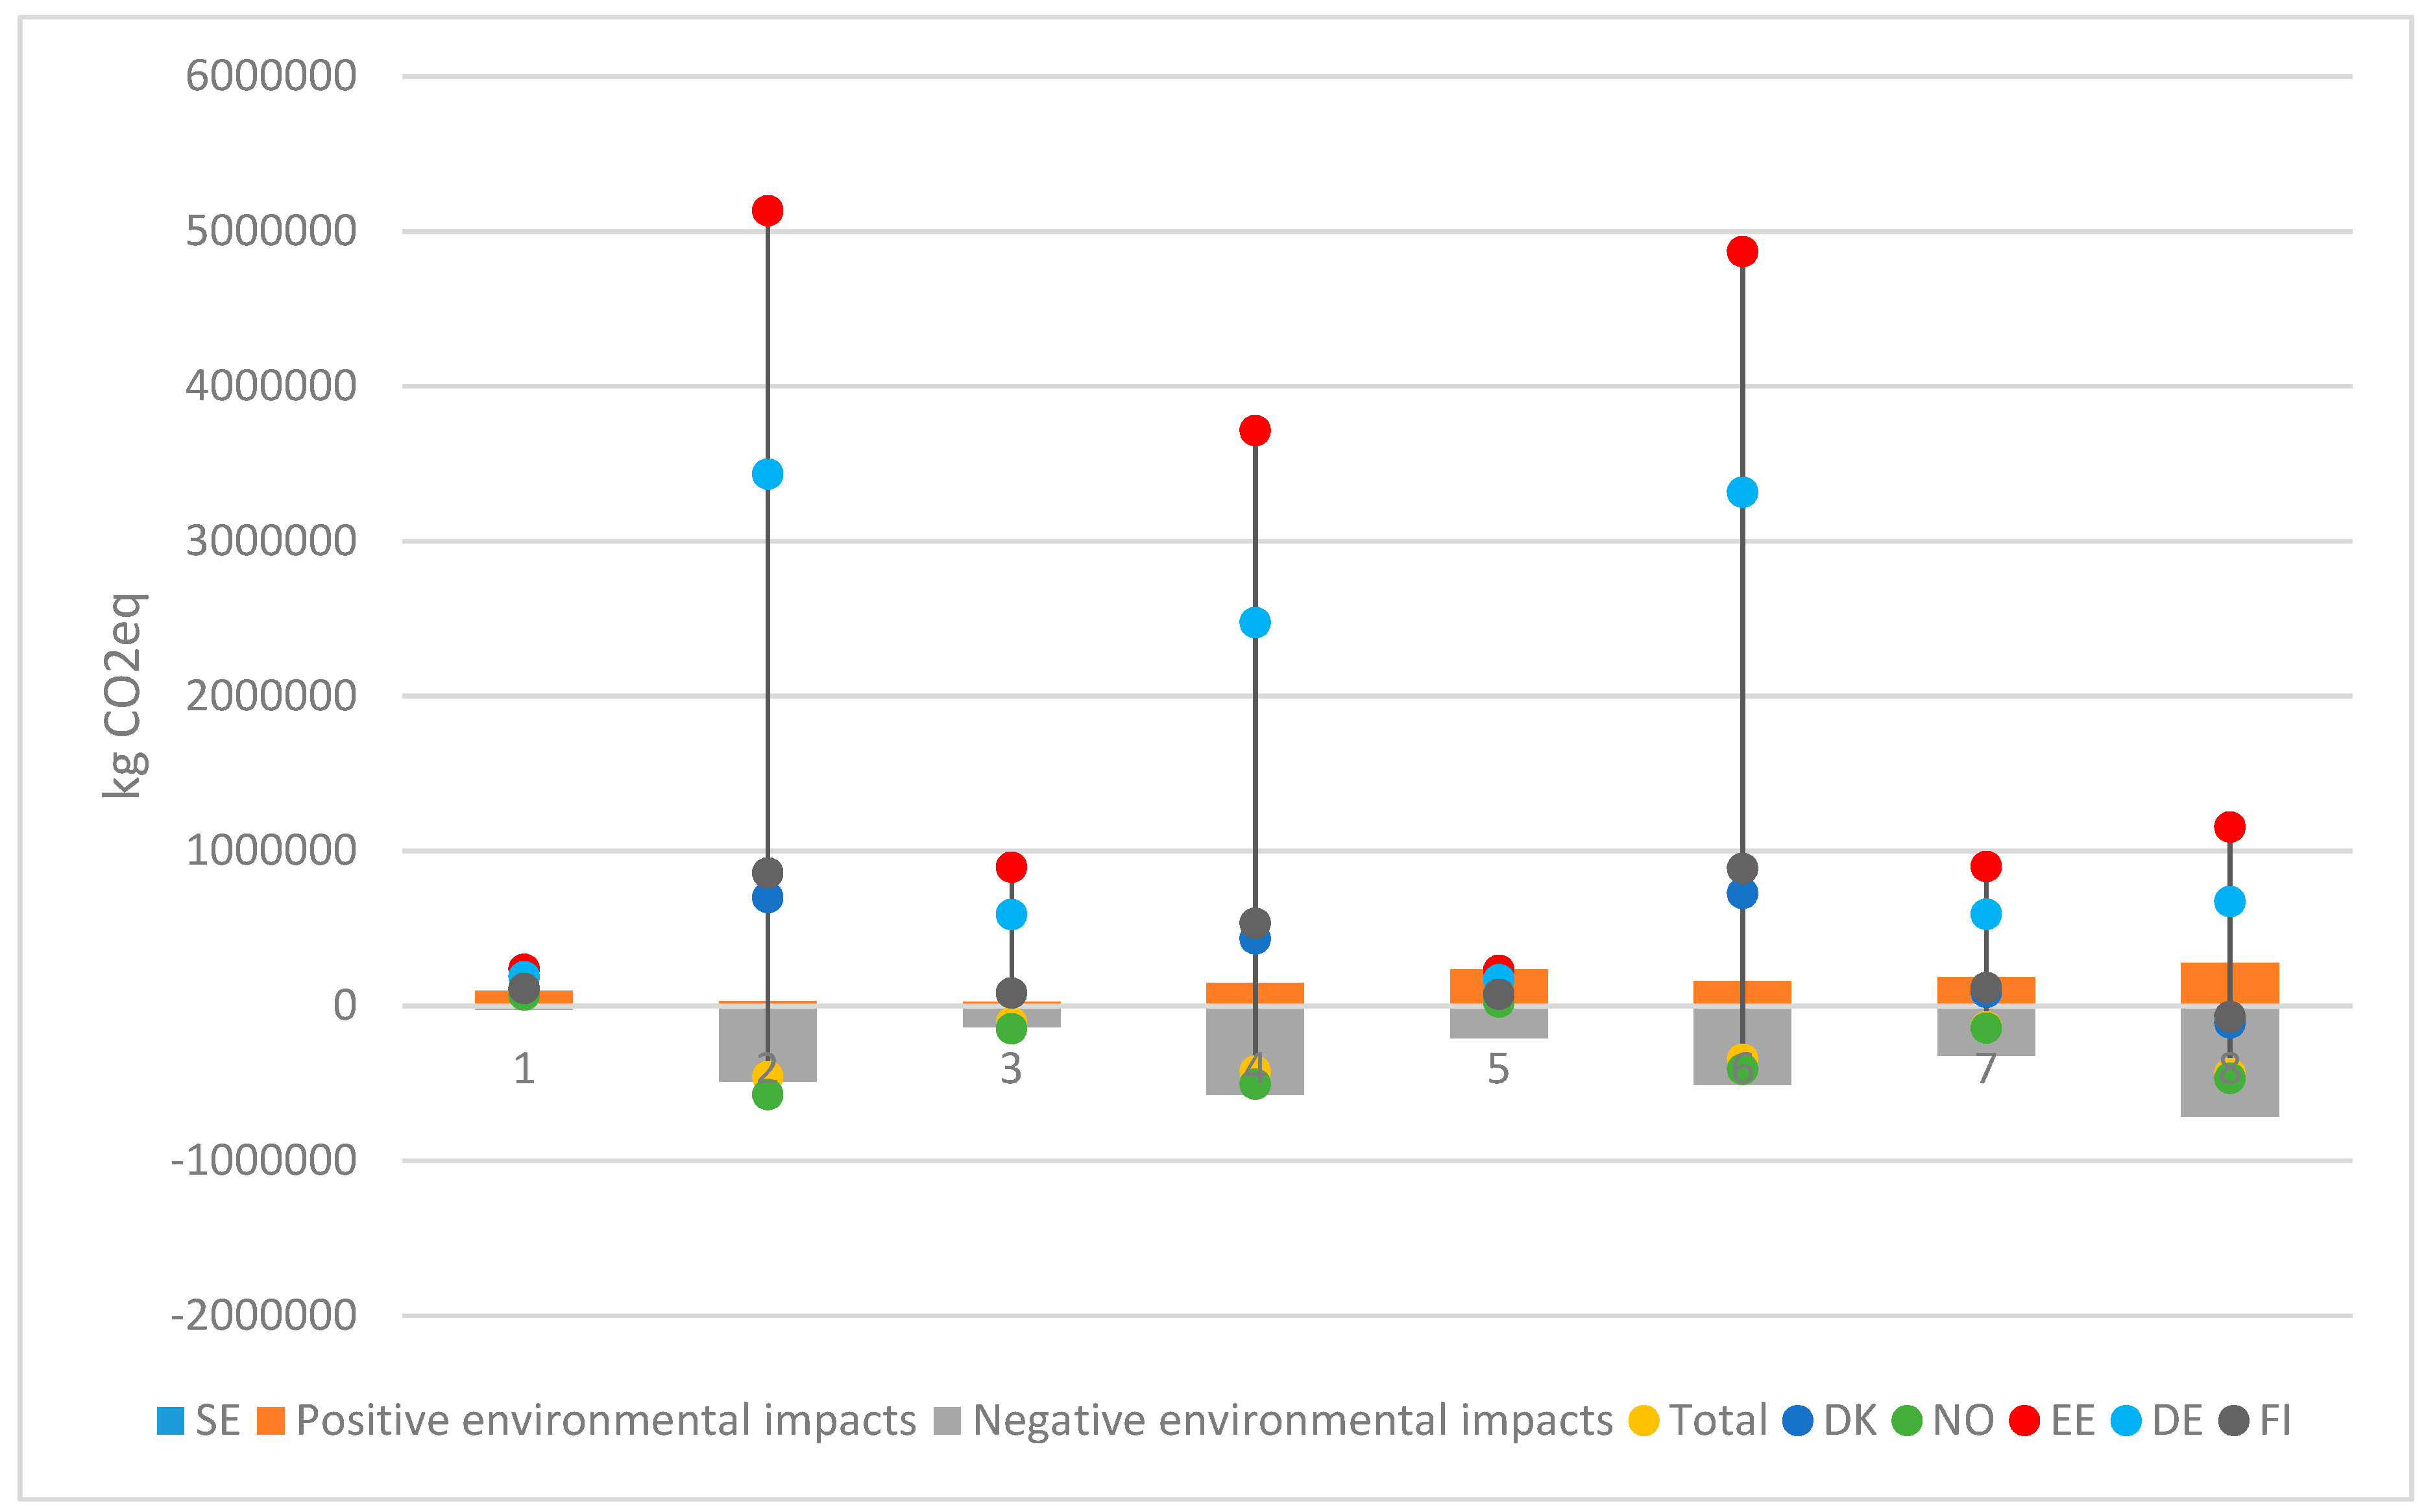
3.1. Life Cycle Assessment

The obtained energy use of the building during the operation phase are listed in Table 4. It is important to note that scenario 0 is the original building.
Figure 1, Figure 2, Figure 3 and Figure 4 show results for the renovation scenarios displayed as relative impacts compared to as built, i.e., the environmental impact or cost for a zero alternative has been subtracted in each renovation scenario. This typically implies that impact from the use of building materials will result in an impact above zero, while energy savings cause environmental and cost savings. The magnitude of the environmental savings depends on both the energy savings and excluded energy supply.
In Figure 1, scenarios 2, 4, 6 and 8 have similar total GWP savings given that the GHP reduced the active energy demand. This is due to the use of geothermal energy using Swedish power mix with a low-GWP factor. Scenarios 5 to 8 have total GWP potential similar to scenarios 1–4, focusing on installations. This is during the upstream processes (A and B) as well as downstream processes (C). It can be explained by complex renovation processes and the need for significantly more materials, although there are larger GWP savings for the scenarios that focus just on installations. In this way, the GWP impacts from the renovation of the building envelope counteract the GWP savings from energy use. It is noticeable also that scenarios 1 and 5 increase the GWP of the building as compared with the as-built scenario. In the Swedish context, this is due to the PV installations not compensating for the negative environmental impact from material production in relation to the decrease in electricity use with a low GWP.
The results for AP and EP are similar to those for GWP and for the same reasons described above.
Figure 2 shows that the production of materials has a relatively low impact compared to energy use, but the largest ADP savings are for the energy use of the building. In this case, it is possible to note another two groups, the change in energy carrier (2, 4, 6 and 8) and the reliance on district heating (3, 5 and 7). The difference in ADP is due to the scale of the system, because large energy systems are more energy efficient (as in the case of the national electrical grid), while moderate ADP savings are related to local energy systems (district heating).
Figure 3 shows a somewhat different pattern than that for previous impact categories. It is clearly noticeable that the scenarios that rely on a different energy carrier (2 and 6) increase the RW disposed. This due to the increase in electricity use as seen in Table 4, as Sweden generates nearly 40% of its electricity by nuclear power. The only scenario that relies on a different energy carrier and decreases the amount of RW disposed is scenario 8. It is due to the cut in the total heating demand.

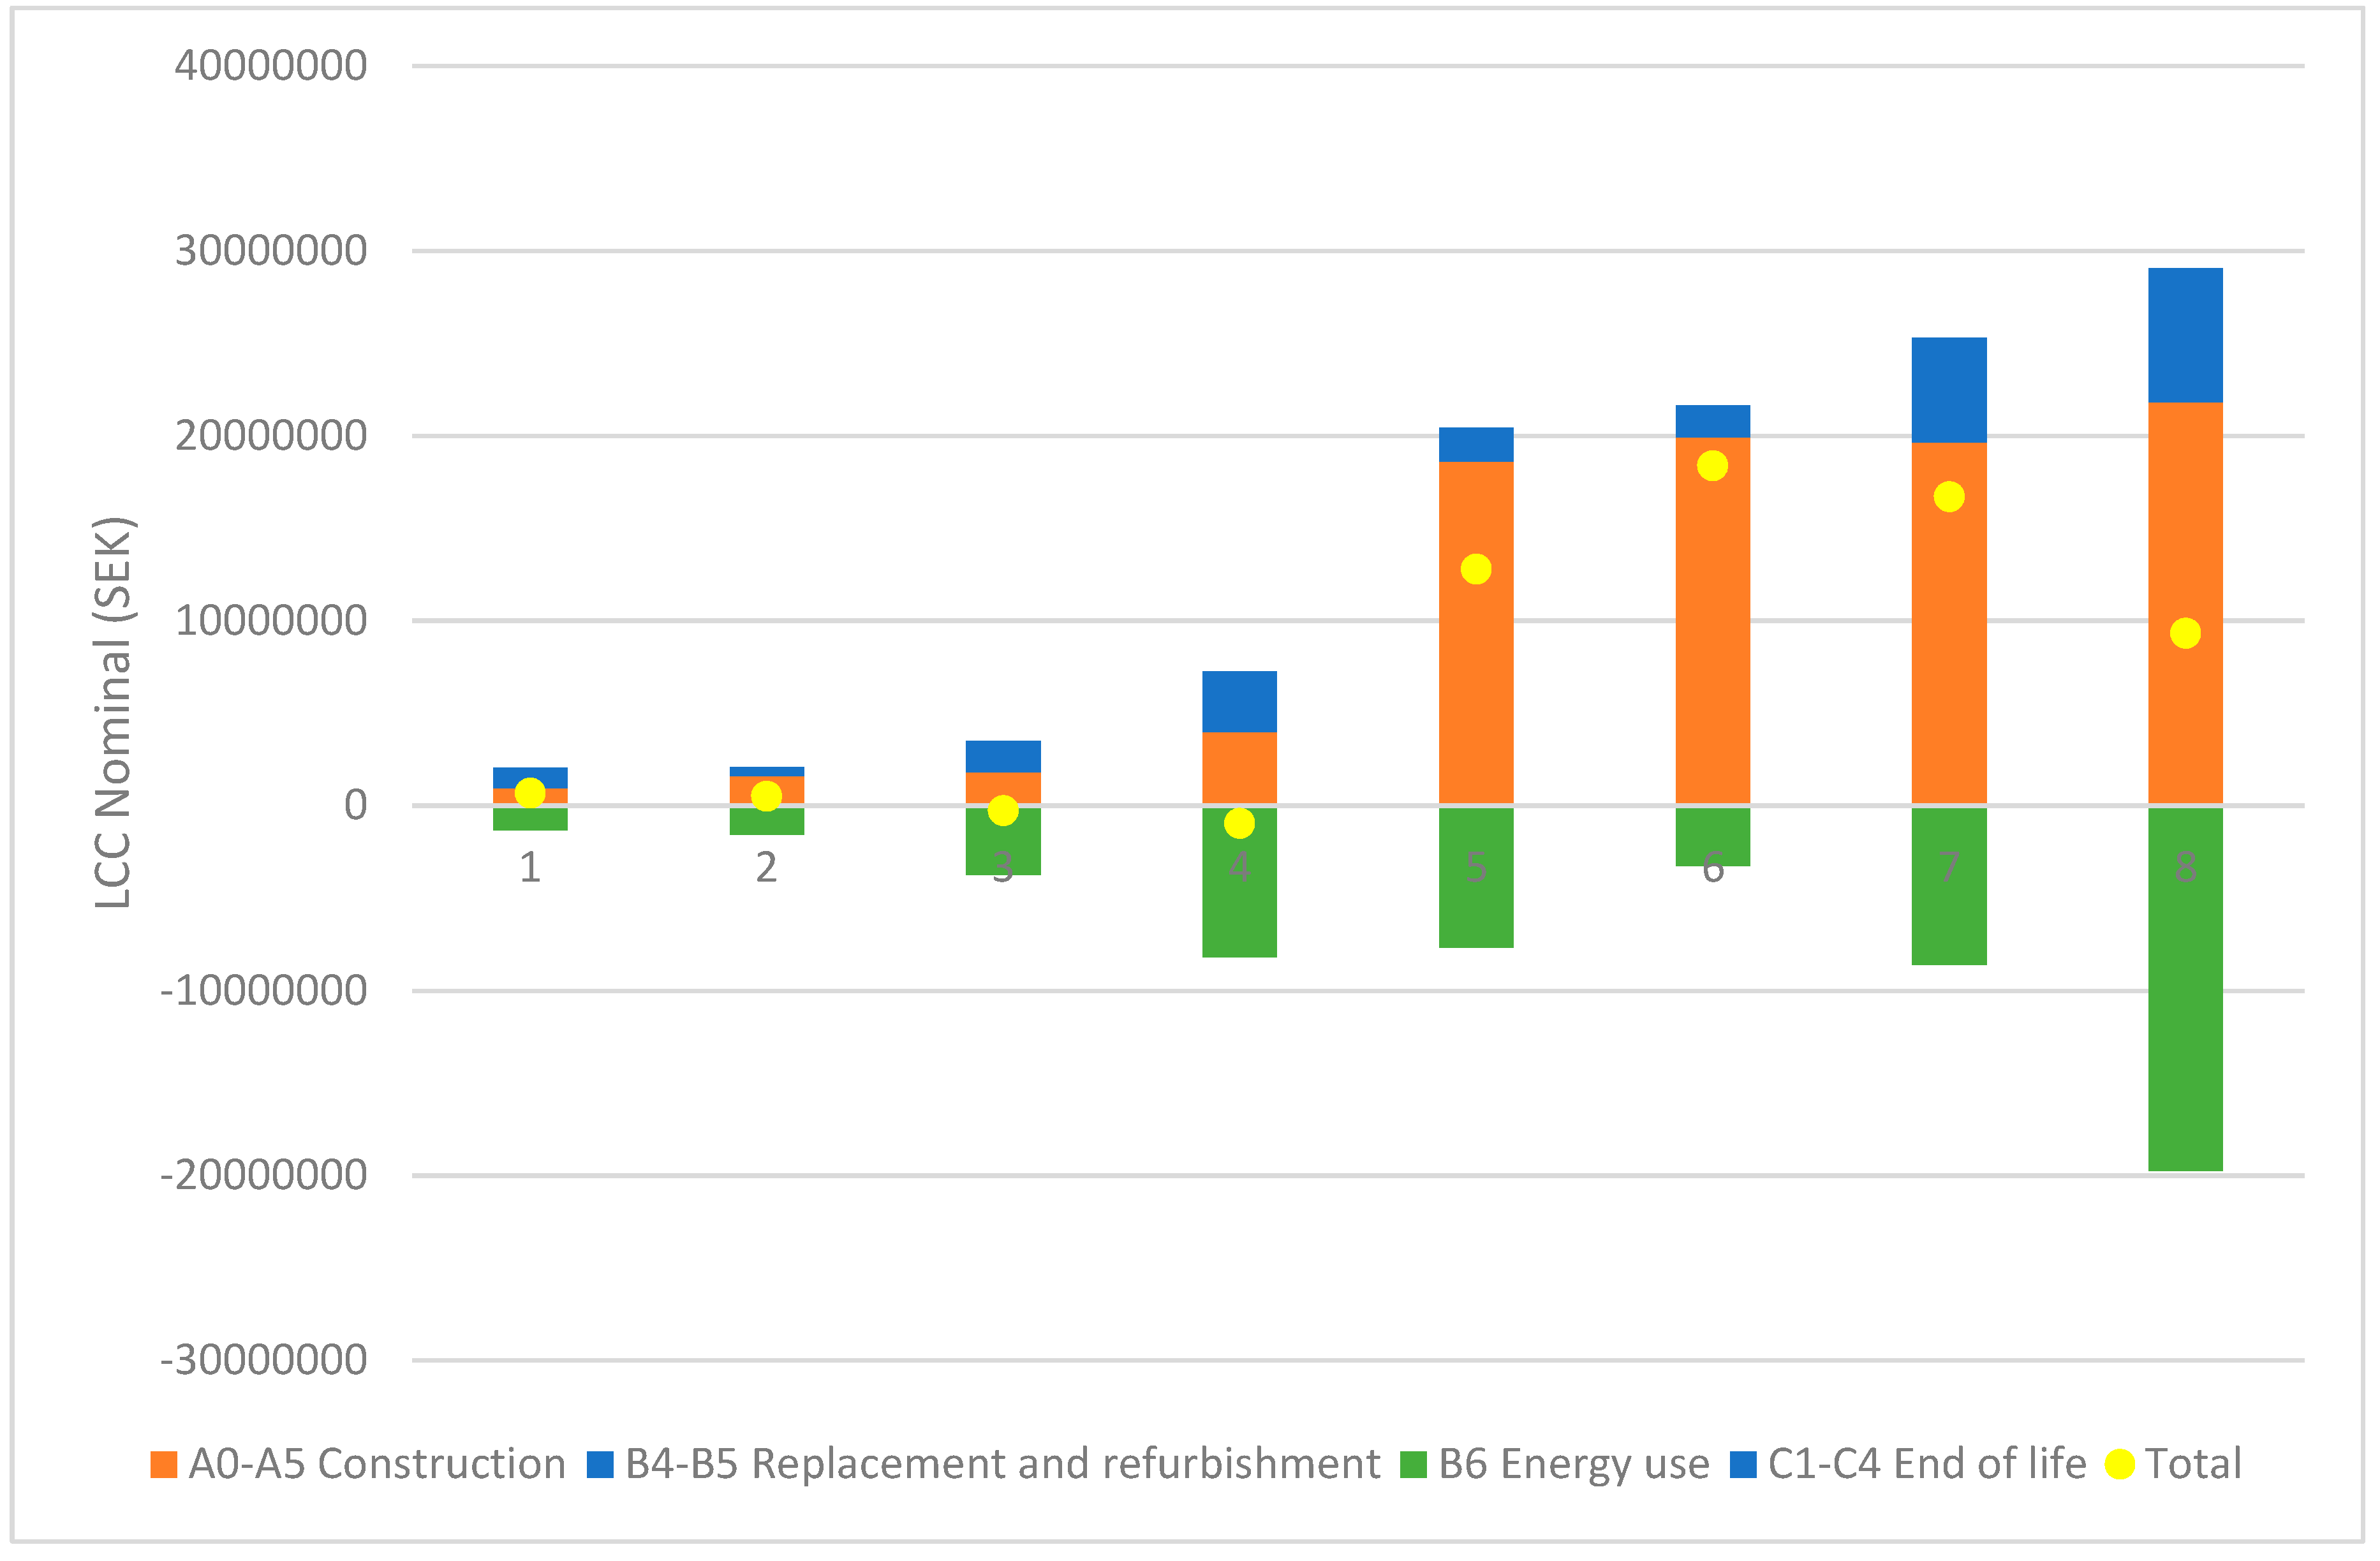
3.2. Life Cycle Costs

In Figure 4 the nominal LCC refers to the undiscounted costs of the renovation scenarios, taking into consideration the inflation rate and the energy inflation rate. It is noticeable that the two identified groups (1–4 vs 5–8) have different LCCs. For 1 to 4, the total LCC is more or less unchanged, compared to the reference object. It is due to the simplicity of the installations that makes it cost-efficient. Scenarios 5 to 8, however, show that the renovation costs are far higher than the cost savings in energy use, mainly due to the need for more materials and high labor costs.

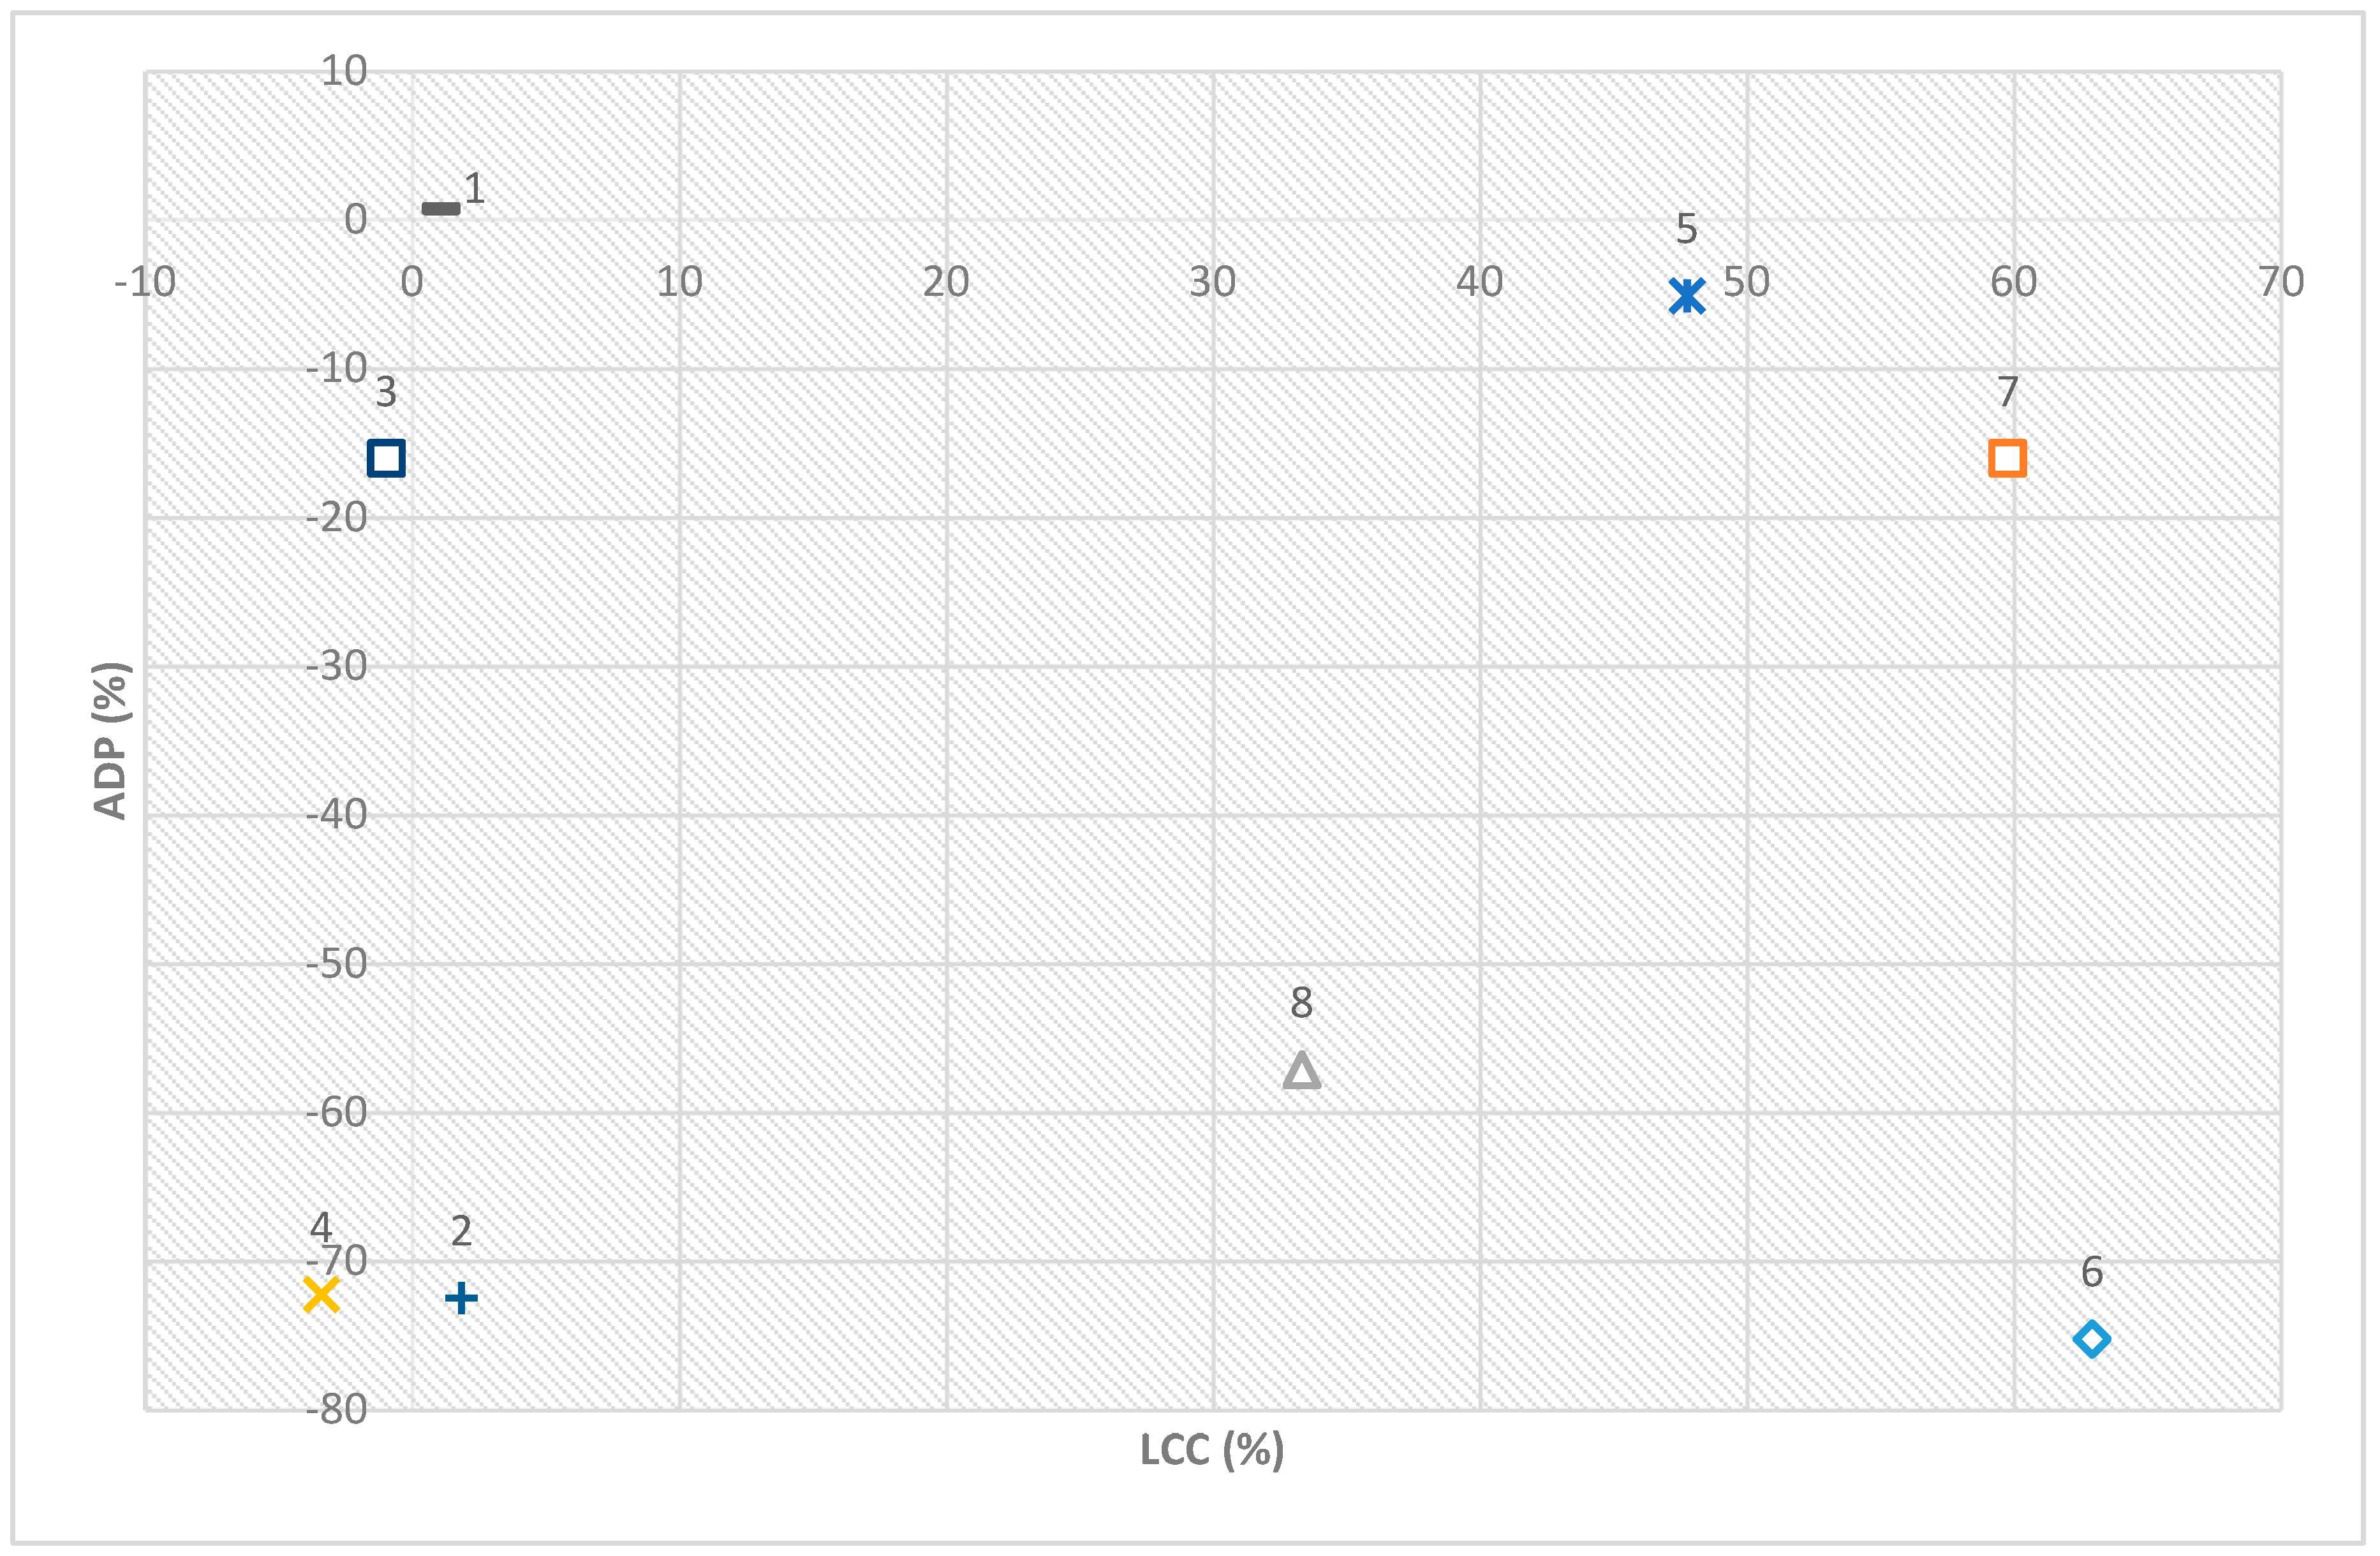
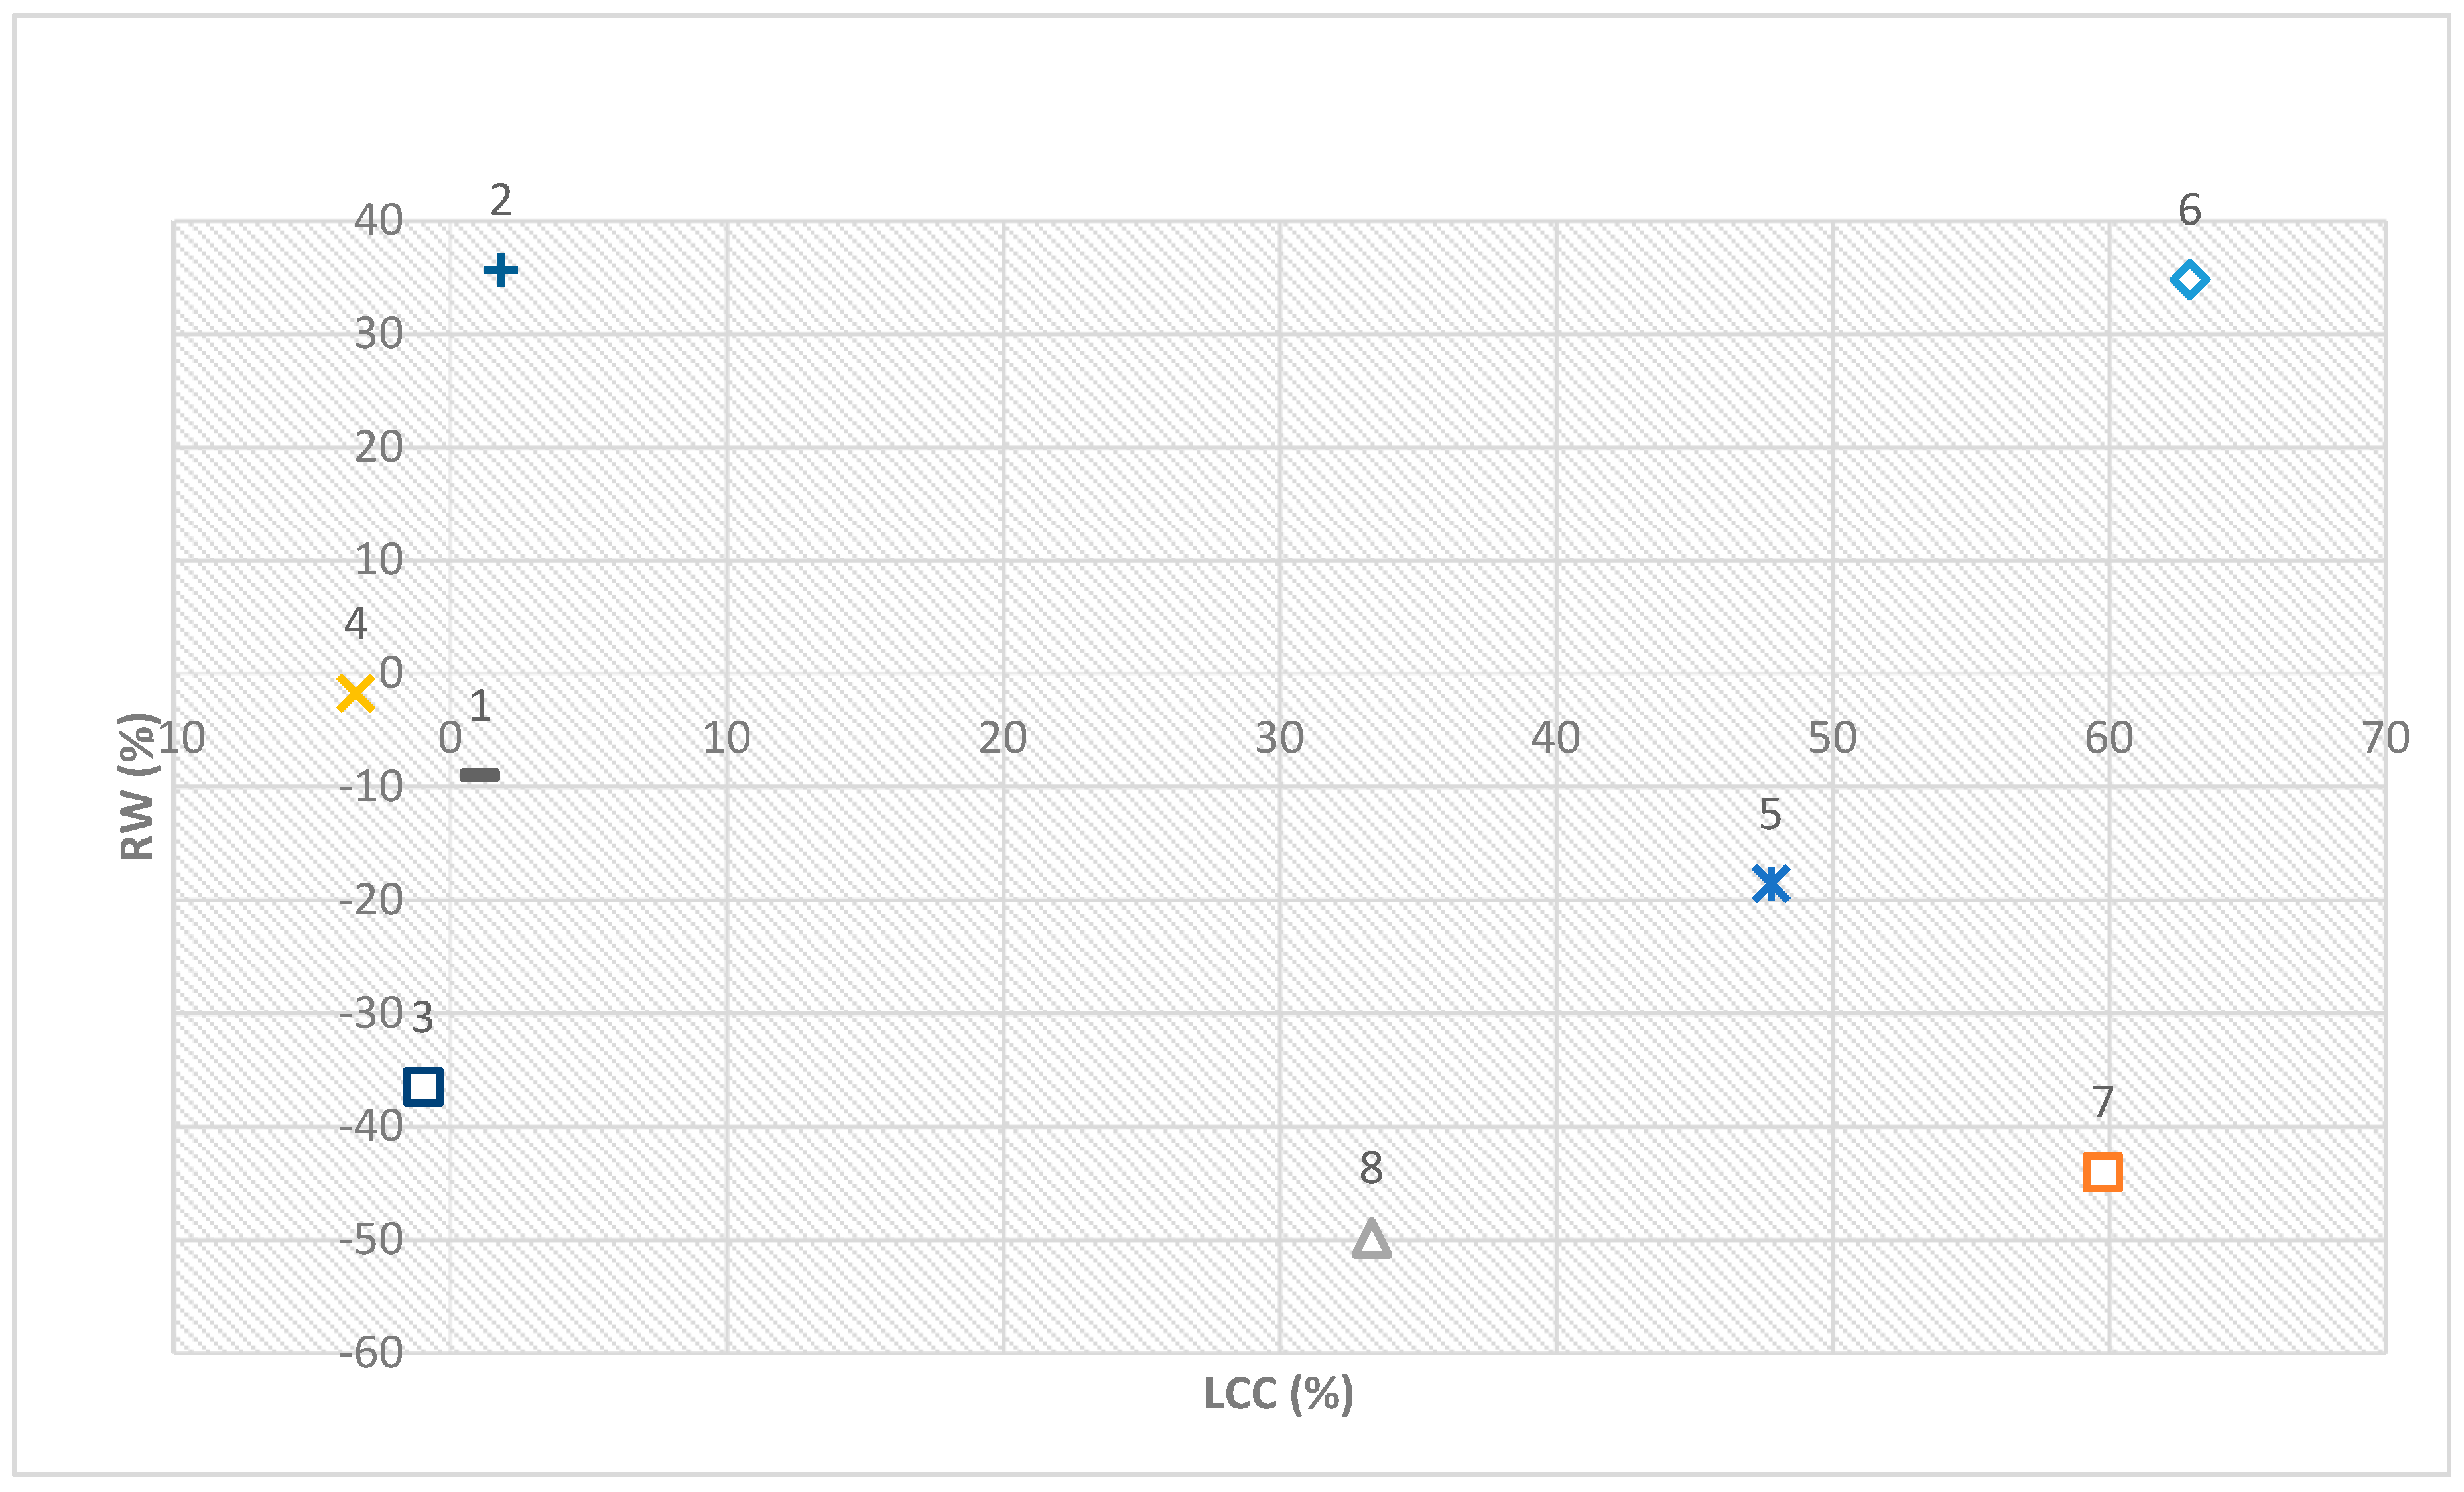
3.3. Combined Life Cycle Assessment and Life Cycle Costs Results

As seen in Figure 5. It is however possible to distinguish two different sets of groupings; on the left, around the base scenario, it is possible to see scenarios 1, 2, 3, and 4, with varying GWP impacts. And on the right, with higher LCCs, scenarios 5 to 8 with improvements in the energy envelope. When it comes to GWP, three different groups can be identified:
(1)
The ones that rely on PV (1 and 5) which mainly have a negative environmental impact due to the reduction of already carbon poor electricity;
(2)
the ones that use district heating with relative improvements of GWP (3 and 7); and
(3)
the ones with changed energy carriers (2, 4, 6 and 8).
In this figure, it is also noticeable that scenarios 2 and 4 are the “low-hanging fruits” when it comes to GWP savings. The additional costs of renovation of the building envelope do not compensate for the negative GWP of materials in the Swedish context.
When it comes to ADP, Figure 6 shows the same pattern as that for GWP. The distribution around the y-axis also shows how the resources efficiency change from building (1 and 5), to local (3 and 7) to national energy systems (2, 4, 6 and 8). Again, scenarios 2 and 4 are the low-hanging fruits to reduce depletion of resources.
When it comes to RW, the scenarios in Figure 7 are different. Scenarios 3 and 7 rely on district heating which has a small proportion of electricity in its production, reducing the RW disposed. Then, scenarios 1 and 5 also reduce the electricity demand from the grid, giving some moderate savings. Scenario 4 has a combination of PV, HRV and GHP so that both the HRV and the GHP compensate for the GHP’s increase in electricity use. Scenarios 2 and 6 increase the electricity use, causing the need for nuclear power used in the mix to increase as well. Finally, even if scenario 8 relies on a HP, there is a decrease in heating demand. This means that the total RW disposal decreases, but this is mainly due to the energy efficiency of the building.

3.4. Sensitivity Analysis

In order to identify the possible impacts of changes in the electricity system, a sensitivity analysis has been performed. It considers different northern European electricity mixes (Norway, Finland, Denmark, Estonia and Germany). These electricity mixes were chosen because of a common electricity market and similarities in climate and location. It is interesting to note that even if these northern European countries are similar, the energy mixes are completely different in terms of generation. Some countries have high shares of renewables (as Norway), while other countries rely on thermal heat (as Estonia), see Table 5.
In Figure 8, the values of GWP for the case study building in Sweden are shown in the bars. The whiskers represent the total maximum and minimum values in terms of GWP for the different energy mixes. The total results for the different energy mixes are shown in Figure 8. The graph illustrates the robustness of the renovation strategies. Changing the energy carrier can result in a marginal increase of the GWP emission, while decreasing the electricity use, and the total heat demand of the building can have less potential to increase the GWP emissions. The graph describes that the renovation scenarios rely heavily on the low share of fossil fuels on the Swedish electricity mix (see Table 5). It also shows that replacing DH for GHP to increase energy efficiency can be counterproductive in counties with a greater share of fossil fuels (as Estonia).

4. Discussion

4.1. On the Results

When it comes to environmental impacts of the different renovation scenarios, it is interesting to note that different approaches can give similar environmental impacts. The case of the comparison between scenarios 4 and 8 is of particular importance. The use of GHP in buildings in the Swedish context decreases the GWP and ADP as Sweden mainly generates fossil-free electricity. However, when examined in detail, the scenarios that rely heavily on electricity increase the amount of RW disposed. This poses a problem in Sweden, where the country in the long term aims for a 100% renewable electrical system, free from both nuclear power and fossil fuels. According to the sensitivity analysis, changing of energy carriers are susceptible to a GWP increase, if the share of thermal power increases (e.g., coal and natural gas). When combining all possible technologies with renovation of the building envelope, the impacts on GWP are less sensitive to variations. In addition, the share of non-renewables has little influence on GWP, due to the reduced active heat demand.
Particular attention can also be given to the scenarios that include PV. PV is a well-used renovation strategy in Sweden and gets substantial subsidies from the government [29]. However, housing companies have been complaining about the consequence of different taxes. If the size of the PV installation exceeds the government regulations, the housing company has to pay the higher tax as an electricity producer [30]. In this study, the size of the PV installation is moderate with a small input. Additionally, as it is well known that PV installations produce more electricity during summer and have a negligible output during winter, some of the electricity produced ends up in the grid as electricity export. This reduction of electricity ends up in category D (loads and benefits beyond the system boundaries) and cannot be included in the total output of the renovation. This, combined again with the low GWP of the Swedish electricity mix and the relative short lifecycle of the PV installations, makes it a counterproductive installation for the investigated building.
In a broader perspective it can be said that, for this particular analysis, there is one renovation scenario (scenario 3) that has moderate savings for all impact categories, while being relatively robust in the sensitivity analysis. This scenario consists mainly of the installation of a HRV aggregate. Thus, it can be considered as the low-hanging fruit, neither excelling in any category, nor having a negative performance.
As the analysis in this study shows, based on current energy prices in Sweden and with the current electricity mix, it is difficult to justify stronger or more powerful energy efficient renovation strategies. However, according to the sensitivity analysis, further investigation of the repercussions of changes of the electricity mix would be interesting.
Today, special attention is paid to CO2 emissions, due to the urgency of the matter. Apart from increasing power supply from renewables, nuclear power is a solution. However, in this case, the environmental burden is shifted to future generations, since nuclear power is not renewable and the formation of radioactive waste (shown in this study). It is an issue associated with high costs and potential risks as hazardous waste has to be handled by others in the future. In fact, the nuclear waste represents a loss of primary energy, as shown in a previous study [31].

4.2. On the Methodology

As discussed in a previous study [19], there are some uncertainties since the EN standards 15978 and 16627 [10,11,12] do not allow for counting the benefits and loads beyond the system boundaries in the overall results. In this study, a factor that can have a significant effect, especially in the environmental impact of PV, is that the exported energy cannot be counted in the total results. In addition, a big share of potentially recycled materials would be located beyond the system boundaries of the building. In this study, the problem has been addressed by making a sensitivity analysis using different electricity generation mixes. By making this assumption, the importance of the electricity generation for GWP is shown.
Still, as this study is an attributional LCA, changes in future energy sources are not taken into consideration and the LCC is based on gradually rising energy prices without possible future outside influence.
It is found in this study that combining environmental and economic impacts can make the results useful for building companies and real estate owners that struggle with environmental performance. Even if it was shown in this particular study that there is no correlation between environmental impact and LCC, it is possible to identify the so-called “low-hanging fruits” (i.e., scenarios) in order to maximize the environmental and economic potential, helping to address two of the three main components of sustainability. As this study has been based on the work of Moschetti et al. [6], we include the recommendations to use other endpoint indicators, in this case AP, EP, ADP and RW. Still, this work does not include social indicators.

5. Conclusions

In this study, different renovation strategies were investigated for a multifamily building in Borlänge, Sweden. The energy system in Sweden has a high share of renewables and nuclear power. It makes the system carbon-low, but very dependent on nuclear in the end. This study focuses on LCA for five different environmental categories: GWP, AP, EP, ADP and NW.
This study focuses on how different energy carriers can affect the environmental impacts of the building and how the economy of renovation measures is correlated to the environmental performance of the building. It shows that the energy carrier is of major importance when assessing environmental impacts in Nordic countries, and that assessing different environmental impacts is relevant. No scenario performs well in all categories, as many trade-offs from the energy carriers must be considered. When buildings with low GWP impacts depend on nuclear power, using PV in Northern latitudes cannot compensate for that dependence.
The case study also showed there is no correlation between environmental impacts and LCC. Buildings that were more energy efficient have such a high LCC that there is no benefit in renovation to that standard. A change of energy carrier seems to be a good alternative in Sweden, if the goal is to reduce GWP. However, a consequence is a system more dependent on nuclear power. As shown in the sensitivity analysis, those scenarios are more susceptible to changes in the energy system.
It is important to note that the 50 years’ perspective used here does not take into consideration that the system can change during that period. However, the sensitivity analysis shows how possible changes (such as phasing out nuclear power) can affect the environmental performance of the building.
As it has not been possible to study future uncertainty, such as different life spans and the perceived obsolesce of different components, a deeper sensitivity analysis could improve the results of this study.

Supplementary Materials

The following are available online at https://www.mdpi.com/1996-1073/12/13/2484/s1, Table S1: Case Study Building Information, Table S2: Renovations Scenarios, Table S3: Materials datasets not listed in the article, Table S4: Fuel use (%) for district heating 2016, Table S5: Greenhouse gas emissions (GHG) emission factors for DH 2016, Table S6: LCC parameters, Table S7: End of life scenarios.

Author Contributions

Conceptualization, R.R.-V., O.E. and T.O.; Formal analysis, R.R.-V., O.E. and T.O.; Investigation, R.R.-V.; Methodology, R.R.-V. and O.E.; Software, R.R.-V.; Supervision, O.E. and T.O.; Validation, R.R.-V.; Visualization, R.R.-V.; Writing—original draft, R.R.-V., O.E. and T.O.; Writing—review & editing, R.R.-V., O.E. and T.O.

Funding

This work was carried out under the auspices of the industrial post-graduate school Reesbe, which is financed by the Knowledge Foundation (KK-stiftelsen) and Byggpartner i Dalarna AB.

Acknowledgments

The authors would specially like to thank Kristian Haglund from ByggPartner i Dalarna AB for contributing with his professional advice.

Conflicts of Interest

The authors declare no conflicts of interest.

References

  1. United Nations Transforming Our World: The 2030 Agenda for Sustainable Development 2015. Available online: https://sustainabledevelopment.un.org/post2015/transformingourworld (accessed on 16 March 2019).
  2. World Green building Council. The Sustainable Development Goals World Green Building Council. Available online: https://www.worldgbc.org/green-building-sustainable-development-goals (accessed on 14 February 2019).
  3. European Parliament, Council of the European Union. EU Directive 2010/31/EU of the European Parliament and of the Council of 19 May 2010 on the energy performance of buildings. Off. J. Eur. Union 2010, 13–35. [Google Scholar] [CrossRef]
  4. Vilches, A.; Garcia-Martinez, A.; Sanchez-Montã, B. Life cycle assessment (LCA) of building refurbishment: A literature review. Energy Build. 2017, 135, 286–301. [Google Scholar] [CrossRef]
  5. Ma, Z.; Cooper, P.; Daly, D.; Ledo, L. Existing building retrofits: Methodology and state-of-the-art. Energy Build. 2012, 55, 889–902. [Google Scholar] [CrossRef]
  6. Moschetti, R.; Brattebø, H.; Skeie, K.S.; Lien, A.G. Performing quantitative analyses towards sustainable business models in building energy renovation projects: Analytic process and case study. J. Clean. Prod. 2018, 199, 1092–1106. [Google Scholar] [CrossRef]
  7. Malmgren, L.; Mjörnell, K.; Malmgren, L.; Mjörnell, K. Application of a Decision Support Tool in Three Renovation Projects. Sustainability 2015, 7, 12521–12538. [Google Scholar] [CrossRef] [Green Version]
  8. Pombo, O.; Rivela, B.; Neila, J. Life cycle thinking toward sustainable development policy-making: The case of energy retrofits. J. Clean. Prod. 2019, 206, 267–281. [Google Scholar] [CrossRef]
  9. Nemry, F.; Uihlein, A.; Colodel, C.M.; Wetzel, C.; Braune, A.; Wittstock, B.; Hasan, I.; Kreißig, J.; Gallon, N.; Niemeier, S.; et al. Options to reduce the environmental impacts of residential buildings in the European Union—Potential and costs. Energy Build. 2010, 42, 976–984. [Google Scholar] [CrossRef]
  10. Ostermeyer, Y.; Wallbaum, H.; Reuter, F. Multidimensional Pareto optimization as an approach for site-specific building refurbishment solutions applicable for life cycle sustainability assessment. Int. J. Life Cycle Assess. 2013, 18, 1762–1779. [Google Scholar] [CrossRef] [Green Version]
  11. Cetiner, I.; Edis, E. An environmental and economic sustainability assessment method for the retrofitting of residential buildings. Energy Build. 2014, 74, 132–140. [Google Scholar] [CrossRef]
  12. Pombo, O.; Allacker, K.; Rivela, B.; Neila, J. Sustainability assessment of energy saving measures: A multi-criteria approach for residential buildings retrofitting—A case study of the Spanish housing stock. Energy Build. 2016, 116, 384–394. [Google Scholar] [CrossRef]
  13. Gonzalez, F.J.N.; Touceda, M.; Richard, A.; Degrez, M. Methodology proposal for the life cycle sustainability assessment applied to retrofitting in a local context. World Sustain. Build. Conf. Wsb14 2014, 3, 235–242. [Google Scholar]
  14. European Commitee for Standarization. Sustainability of Construction Work—Assessment of Environmental Performance of Buildings—Calculation Methods; (CEN) EN 15978; European Commitee for Standarization: Brussels, Belgium, 2011. [Google Scholar]
  15. European Commitee for Standarization (CEN) EN 16627. Sustainability of construction work—Assessment of Economic Performance of Buildings—Calculation Methods; European Commitee for Standarization: Brussels, Belgium, 2015. [Google Scholar]
  16. EQUA Use Manual IDA Indoor Climate and Energy; EQUA: Stockholm, Sweden, 2013.
  17. Ramírez-Villegas, R.; Eriksson, O.; Olofsson, T. Assessment of renovation measures for a dwelling area—Impacts on energy efficiency and building certification. Build. Env. 2016, 97, 26–33. [Google Scholar] [CrossRef]
  18. European Commission, Joint Research Centre (JRC). JRC Photovoltaic Geographical Information System (PVGIS)—European Commission. Available online: http://re.jrc.ec.europa.eu/ (accessed on 5 February 2019).
  19. Ramírez-Villegas, R.; Eriksson, O.; Olofsson, T. Life Cycle Assessment of Building Renovation Measures–Trade-off between Building Materials and Energy. Energies 2019, 12, 344. [Google Scholar] [CrossRef]
  20. Regelsamling för energideklaration med kommentarer; Boverket: Karlskrona, Sweden, 2010; ISBN 9789186342586.
  21. Gustafsson, M. Energy Efficient Renovation Strategies for Swedish and Other European Residential and Office Buildings. PhD Thesis, KTH Royal Institute of Technology, Stockholm, Sweden, 9 May 2017. [Google Scholar]
  22. Müller, V.R. BKI Baupreise Kompakt 2017—Neubau: Statistische Baupreise für Positionen mit Kurztexten; Müller Rudolf: Cologne, Germany, 2016; ISBN 9783481034788. [Google Scholar]
  23. AECOM. Spon’s Architects’ and Builders’ Price Book; Spon’s Price Books; CRC Press: Boca Raton, FL, USA, 2018; ISBN 9780429875793. [Google Scholar]
  24. International Labour Organization Labour Costs. Available online: https://www.ilo.org/ilostat/faces/oracle/webcenter/portalapp/pagehierarchy/Page3.jspx?MBI_ID=443&_afrLoop=1112617909900872&_afrWindowMode=0&_afrWindowId=1a9o9sak28_1#!%40%40%3F_afrWindowId%3D1a9o9sak28_1%26_afrLoop%3D1112617909900872%26MBI_ID%3D443%26_afr (accessed on 6 March 2019).
  25. Lufkin, P.S.; Miller, J.; Romani, L.; Towers, M. The Whitestone Facility Maintenance and Repair Cost Reference 2009-2010; Whitestone Research Corporation: Santa Barbara, CA, USA, 2009; ISBN 9780967062990. [Google Scholar]
  26. Lufkin, P.; Abate, D.; Romani, L.; Towers, M.; Dotz, R.; Miller, J. The Whitestone Facility Operations Cost Reference 2014-2015, North. America; Whitestone Research Corporation: Santa Barbara, CA, USA, 2014; ISBN 9780989774338. [Google Scholar]
  27. Bionova LCC Tool, Assessment Scope and Costing Database. Available online: https://desk.zoho.eu/portal/oneclicklca/kb/articles/lcc-assessment-scope-and-costing-database (accessed on 6 March 2019).
  28. International Energy Agency. Electricity Information 2018; IEA Publications: Paris, France, 2018; ISBN 978-92-64-30120-7. [Google Scholar]
  29. Swedish National Audit Office. Support to Solar Power (RiR 2017:29); Swedish National Audit Office: Stockholm, Sweden, 2017. [Google Scholar]
  30. Solelkommissionen Energiskatt. Available online: http://www.solelkommissionen.se/energiskatt/ (accessed on 2 April 2019).
  31. Eriksson, O. Nuclear Power and Resource Efficiency—A Proposal for a Revised Primary Energy Factor. Sustainability 2017, 9, 1063. [Google Scholar] [CrossRef]
Figure 1. Global Warming Potential (CO2eq).
Energies 12 02484 g001
Figure 2. Abiotic depletion potential (ADP) of nonfossil elements (Sbeq).
Energies 12 02484 g002
Figure 3. Radioactive waste disposed (kg).
Energies 12 02484 g003
Figure 4. Nominal life cycle costs.
Energies 12 02484 g004
Figure 5. Global warming potential (GWP) against life cycle costs.
Energies 12 02484 g005
Figure 6. Abiotic depletion potential of nonfossil elements against life cycle costs.
Energies 12 02484 g006
Figure 7. Radioactive waste disposed against life cycle costs.
Energies 12 02484 g007
Figure 8. GWP for the scenarios with sensitivity analysis for different electricity mixes.
Energies 12 02484 g008
Table 1. Renovation packages.
Renovation Measure012345678
Heat Recovery Ventilation---XX--XX
Photovoltaic panels-X--XX--X
Geothermal Heat Pump--X-X-X-X
480 mm outer wall insulation-----XXXX
300 mm attic insulation-----XXXX
3-glass argon-filled low-emissivity pane windows-----XXXX
Table 2. Installations dataset.
ResourceQuantityUnitService Life
Electric heat pump (brine-water, geothermal probe), 70 kW (Coefficient of performance (COP):3)1Pcs20
Pipework for electric heat pump (brine-water, geothermal collector), 70 kW1Pcs50
Photovoltaic panel system for roofs, 300 Wp capacity134m230
Table 3. Life cycle cost (LCC) calculation parameters.
FactorValue
Calculation period (Years)50
Discount rate (cost of capital) (%)7
Regional material cost index (%)1.3
Inflation rate (%)2
End of Life (EOL) as % of Capital Expenses (%)2.5
Hourly labor rate, worker (SEK)306.1
Hourly labor rate, craftsman (SEK)413.3
Table 4. Annual energy use.
Scenario012345678
District heating use (kWh/m2)134134-109-108-91-
Electricity use (kWh/m2)61.5479431.843921
Table 5. Share of electricity generation by fuel on % 2018 [28].
CountryNuclearOilWasteHydroSolar PVWindBiofuelsCoalGas
Sweden (SE)40.40.32.139.80.19.96.30.70.4
Denmark (DK) 01.15.10.12.441.913.3297.1
Norway (NO)000.396.401.400.11.7
Estonia (EE)02.11.1004.97.383.80
Finland (FI)33.90.31.423.104.516.115.35.5
Germany (DE)13.10.9245.912.1742.212.7

