Article

Grey SWARA-FUCOM Weighting Method for Contractor Selection MCDM Problem: A Case Study of Floating Solar Panel Energy System Installation

by
Qingpeng Cao
,
Moses Olabhele Esangbedo
*,
Sijun Bai
and
Caroline Olufunke Esangbedo
School of Management, Northwestern Polytechnical University, Xi’an 710072, China
*
Author to whom correspondence should be addressed.
Energies 2019, 12(13), 2481; https://doi.org/10.3390/en12132481
Submission received: 1 May 2019 / Revised: 16 June 2019 / Accepted: 25 June 2019 / Published: 27 June 2019
(This article belongs to the Special Issue Sustainable Energy Consumption)

Abstract

:
Selection of the most appropriate contractor for the installation of solar panels is essential to maximizing the benefit of this renewable, sustainable energy source. Solar energy is one of the 100% renewable energy sources, but implementation may not be very simple and cost-effective. A key phase in the implementation of renewable energy is the evaluation of contractors for the installation of solar panels, which is addressed as a multi-criteria decision-making (MCDM) problem. A new hybrid method is proposed that combines the stepwise weight analysis ratio assessment (SWARA) and full consistent method (FUCOM) weights that are represented as grey numbers used with traditional grey relational analysis (GRA) and evaluation based on distance from average solution (EDAS) methods. The ranking of contractors by both methods is the same, which confirmed the results presented in this research. The use of the grey SWARA-FUCOM weighting method combined with the GRA and EDAS methods increased the decision-makers’ (DMs) confidence in awarding the installation of the solar panel energy system to the top-ranked contractor.

Graphical Abstract

1. Introduction

In recent times, the Chinese have been working hard to cut down the use of coal power generation plants and switch to alternative clean energy sources, and the government is pushing towards more renewable energy while balancing the overall demand for electrical energy of its citizens. Companies are taking the initiative of contributing to the society by reducing their dependency on the national electricity grid and, similarly, individuals are switching to a home-based solar panel. However, there is a limited amount of land that can be dedicated to harvesting solar energy, because this land can also be used for other facilities such as farming and housing projects, and solar panels on the rooftops of these houses may not be enough to sustain the inhabitants and may be difficult to maintain. The push for installing solar panels on bodies of water like rivers and lakes is an ingenious approach. In 2018, the Anhui province of China completed a 60-megawatt photovoltaic (PV) on a lake that is estimated to provide electricity for at least 15,000 homes [1]. Besides the environmental benefits of this kind of project, there are financial rewards and prestige for contractors that win the bid to install the solar panels and build the power stations. In this paper, the evaluation of these contractors is classified as a multi-criteria decision-making (MCDM) problem because there are several evaluation criteria and the best contractor is selected using the weights assigned by decision-makers (DMs) based on the evaluation criteria.
Multi-criteria decision-making weighting is a way of giving values to different criteria for evaluation to indicate their level of importance. There are two main classifications of MCDM weighting approaches: subjective and objective weighting. Objective weights can be described as the surrogate weights which comprise the ratio of the importance of the evaluation criteria. Surrogate weights are used when the exact weights of the criteria are unknown. Subjective weights are direct estimation of weights by assigning points to the decision criteria based on the DMs’ preferences, which are ranked by the degree of importance. In the 1970s, Dawes and Corrigan [2] proposed a solution for unknown weights called equal weights (EW), and they argued that equal weights produce optimal results. However, the efficacy of these weights was tested by Barron and Barrett [3,4] using 10,000 trials of 100 randomly generated weight vectors and value matrices. They concluded that one of the main advantages of objective weight is that it requires little intervention from the DMs in estimating the weights. By contrast, the subjective weighting approach would require direct input from the DM that is aggregated using various computation operations to estimate the weights. Until now, there has been no single weighting method that completely addresses all the concerns in estimating the weights of criteria in an MCDM problem.
Today, hybrid weighting methods are commonly accepted approaches to improve the accuracy of the criteria weights. The ability to combine both subjective and objective weighting methods has been proven to be among the best methods for weights estimation. This combination is usually in the form of ranking the decision-making criteria and allocating comparative points to the criteria to leverage the advantages that ranking and pairwise comparison methods present. Although it is mentally easy to rank the decision criteria, it sometimes psychologically tasking to pairwise compare a lot of criteria, and the main advantage that the pairwise methods provide is equal comparisons of all the evaluation criteria among themselves. For instance, the stepwise weight analysis ratio assessment (SWARA) [5] and the full consistent method (FUCOM) [6] both effectively combine the ranking of criteria and comparative points of these criteria that are differently computed to obtain their respective estimated weights. However, there is a problem: The weights obtained by both methods, using the same rankings of criteria and relative points allocated to the criteria, result in different weights for the same criteria. Interestingly, both methods have been well received in the literature, but uncertainty arises when they both do not provide the same weight.
In this research, we provide a solution to this problem by applying the grey system theory (GST) [7] to embrace the weights of both the SWARA and FUCOM methods by proposing a hybrid weighting method called the grey SWARA-FUCOM weighting method, which represents the uncertainty in weighting presented by SWARA and FUCOM methods as grey numbers. In dealing with uncertainty in decision-making, probability and statistical models, fuzzy sets, rough sets, and the GST can be employed. The GST is an approach that allows one to account for uncertainty in a model that is designed with poor, i.e., incomplete, information [8]. In GST, if a conclusion is drawn and there is no solution, the system can be classified as a black system. Next, when a conclusion is drawn and there is a unique solution, the system can be classified as a white system. Furthermore, when multiple solutions are drawn from the conclusion using the same input data, the system can be classified as a grey system. As the same preferences from the DMs give rise to different weighting, we classify the uncertainty in weighting as, certainly, a grey system problem. Thus, this research is based on the GST.
Moreover, in solving an MCDM problem, comparing the alternatives to a given benchmark is a way of evaluating and ranking the alternatives. The traditional grey relational analysis (GRA) and evaluation based on distance from the average (EDAS) compare alternatives to an optimal solution and average solution, respectively. In this paper, the grey SWARA-FUCOM method is combined with the traditional GRA and EDAS to evaluate the contractors for the floating solar panel power system, which is a form of sustainable energy. This paper does not provide an evaluation of the project but selects the contractor to execute the project.
Unarguably, the accuracy of the criteria weights in solving an MCDM problem is important. Therefore, the main contribution of this paper is presenting a hybrid method that combines both objective and subjective weights and representing them as grey numbers for the estimation of criteria weights, which can be used in conjunction with various MCDM evaluation methods. In addition, an application of the SWARA-FUCOM weighting method is applied in solving a floating solar panel contractor selection MCDM problem. The paper is presented as follows: Section 2 presents a literature review of the MCDM method, and Section 3 presents the methodology. Results and analysis are presented in Section 4. Finally, Section 5 concludes the paper.

2. Literature Review

Generally, MCDM weighting method can be grouped into two main classifications: subjective and objection. Subjective weights are weights obtained by points been allocated to the criteria by the DMs, and these points could be in the form of linguistic variable. An example of subjective weighting method is the analytical hierarchical process (AHP) [9], where a worksheet is given to the DM that compares two criteria at a time. Relative scores are given to the criteria based on the scale provided. Next, the scores are aggregated by adding all the scores. Then, the results are scaled to a sum put to one, and the consistency of the weights is validated. Another example is the SMART [10], where points are assigned from the least important criterion to the most important criterion without a limit to the points assigned to the most important criterion. Then, the weights are estimated by normalizing the total number of points. By contrast, the objective weights are primarily based on the computational methods with little or no intervention by the decision-makers. For instance, the equal weighting method [2], which is an even distribution of the weight across all criteria. Moreover, one clear example of the objective weight is the entropy weighting method [11]. The entropy weights are based on the extent to which the information on the system is reflected and the extent of uncertainty in the system. The SWARA and FUCOM approaches combine the advantages of subjective and objective weighting approaches.

2.1. Solar Panel Implementation

The main thread in the literature is generating the most electrical energy from the sun, and Siksnelyte et al. [12] presented an overview of the MCDM methods in addressing sustainability problems. Among the MCDM method reported are the AHP [13], analytic network process (ANP) [14], fuzzy set [15], technique for order of preference by similarity to ideal solution (TOPSIS) [16], weighted aggregated sum product assessment (WASPAS) [17], PROMETHEE [18], VIKOR [19], ELECTRE [20], analysis and synthesis of parameters under information deficiency (ASPID) [21] and multi-objective optimization by a ratio analysis (MULTIMOORA) [22]. Reshma and Sreejith [23] analyzed the maximum power point tracking controller for a PV system and reported that higher efficiency and reduced switching loss is achievable using interleaving and coupled-inductor-based topologies. The design of a power system with optimal maximum power transfer capacity has been the general focus of researchers in recent years, as indicated by Shinde and Mane [24]. They also indicated that there is still room to reduce the fabrication cost and improve energy management as well as convergence of the rooftop solar system to maximize the power transfer capacity. Sherwani et al. [25] showed that the energy payback time is between 1.5 and 5.7 years and greenhouse gas emission is as low as 9.4 g-CO2/kWhe and as high as 280 g-CO2/kWhe using solar panel energy.
The implementation of solar panels for electricity generation is a global solution for both developing and developed nations. Akhtar et al. [26] recommended the use of solar reflectors to increase the solar energy generated in Pakistan. Akinyele et al. [27] presented the global developmental progress in PV using the situation in Nigeria as a case study. They suggested that, when building a solar panel plant in underdeveloped countries, the technical facility, financing, and administration should be considered. Topcu [28] proposed a decision model for the selection of a contractor in Turkey that consisted of the prequalification and choice stages. The AHP was used in estimating the weights of the evaluation criteria with the simple additive weighting method, and the primary objective was to select the contractor with the best bid based on the expert ratings using the evaluation criteria, but not selecting the contractor with the lowest bid. After 15 years, Topcu et al. [29] revisited the previous proposal [28], updated it and presented an evaluation hybrid approach that integrated the Monte Carlo Simulation, entropy, and Bordo count method. They concluded that renewable energy sources should be included in the generation of electricity in Turkey. Chan and Starcher [30] evaluated the performance of wind and solar energy investments in Texas, USA by conducting a feasibility analysis that computes the payback period of the investment, net present value, internal rate of return, and profitability index.
Some researchers compared alternative energy sources and maximized the use of the power produced by an existing solar plant as a linear program. Abu-Hamdeh and Alnefaie [31] compared a PV system to a wind turbine solar power tower system and diesel generator on a small load. The PV system was the best cost-effective energy source. Andrade et al. [32] designed a DC–DC converter, which is more efficient in a distributed PV generation system. Bhattacharyya et al. [33] presented a concept of combining PV solar energy with hydrogen production for efficient energy generation. The design used the electricity produced by the PV module for alkaline water electrolysis. Fan and Xu [34] formulated a multi-objective optimization problem in maximizing energy savings and economic benefits by defining a constraint on the net present value and payback period. This was solved as a non-linear programming problem by the weighted sum method. Tu et al. [35] presented a mixed integer linear programming (MILP) model to minimize the overall cost of electricity that consists of a PV power source, wind turbine, diesel generator, and energy storage system. Maghami et al. [36] recommended daily cleaning when the dirt intensity was high and weekly cleaning for the dry season of the solar panel, to reduce the power loss resulting from soil on the panel.
The use of MCDM methods in deciding the most appropriate solar energy solution is presented in the literature. Wang et al. [37] used the hybrid of fuzzy ANP (FANP) and TOPSIS to select the best location among seven other places for the construction of a nuclear power plant in Vietnam. The FANP is used for weighting the criteria based on expert consultation, and the TOPSIS method is used to evaluate the locations. Lui et al. [38] evaluated low-carbon planning as an MCDM problem by proposing a hybrid of DANP and VIKOR method. Nie et al. [39] combined an interval neutrosophic set and the WASPAS to evaluate the solar-wind power station location. The neutrosophic set is used to depict the uncertainty in the form of an interval fuzzy number to express the DMs’ emotional tendency and numerical rating as well as the ratings of the locations as alternatives. Cui and Ye [40] improved the symmetry measurement of the neutrosophic sets for MCDM based on a Sino entropy weight model to overcome the deficiency of previous symmetry measurement that can result in undefined equations and cannot be useful in pattern-recognition problems. Their improvement resulted in a simpler and more efficient algorithm for solving the MCDM problem. Besides, all the advances in technology and recommendations made in the literature cannot be achieved if the selection of the contractor that would install the solar system is left to chance.

2.2. Contractor Selection

Sustainable energy projects are usually executed by contractors. Samee and Pongpeng [41] presented the important link in the causal relationship between construction equipment selection and competitive advantages. Compatibility with site characteristics, services and maintenance, costs, safety, and environmental effects, ease of acquisition, and technology and innovation were the significant factors that affect competitive advantages when considering the contractor’s financial stability, corporate image and reputation, bidding opportunity, and technical capacity. Lines and Kumar [42] analyzed 71 contractors and reported that the scores of the evaluated bid were high, with emphasis on contractor-controlled, design-related, and concealed conditions content. Finding the best value of procurement from the contractor’s perspective helps the contractor to differentiate their proposal from those of other bidders. Khatri [43] designed and assessed a solar PV plant in the girls’ hostel of Malaviya National Institute of Technology (MNIT) based on its financial and environmental impact. The main environmental impacts considered were a reduction in carbon emissions and carbon credits earned. Mokhlesian [44] analyzed how contractors select suppliers for greener construction. Mokhelsian presented three Swedish companies as case studies and came to the conclusion that the selection of supplier is not dramatically changed when it is between a conventional and a greener project.
In contractor selection problems, a fuzzy-based approach is commonly used to account for the vagueness in the evaluation model. Alhumaidi [45] used a triangular fuzzy linguistic value to measure the performance of a group of 10 DMs and aggregated their performance using the fuzzy weighted average method to evaluate a commercial development project in Kuwait. Akcay and Manisali [46] proposed a fuzzy support system for evaluating contractors, where the DMs ratings are captured using fuzzy linguistic values. An et al. [47] applied an interval-value intuitionistic fuzzy set to represent uncertainty in the project delivery system, in which DM weights are estimated using information utility level in project delivery system selection. Tomczak and Jaśkowski [48] applied type-2 interval fuzzy sets in evaluating the qualification of a contractor.
The use of pairwise comparison hybrid method is used in the literature for contractor selection. In 2013, El-Abbasy et al. [49] applied the Monte Carlo simulation design of highway contractors selection model, and the Analytic Network Process (ANP) was used for weighting the evaluation criteria. Interestingly, they showed that using the lowest bidder might not be the optimal solution to the selection problem. Senthil et al. [50] selected the best third-party reverse logistics by combining the AHP and the fuzzy TOPSIS method. The AHP was applied in determining the weight of the criteria, and the fuzzy TOPSIS was applied in the evaluation of the alternatives using fuzzy numbers. Taylan [51] applied the Fuzzy AHP in evaluating the contractor selected for a construction project. The preferences of the DM were measured using fuzzy linguistic variables, and the TOPSIS method was applied in ranking the contractors. Similarly, Lesniak et al. [52] applied the FAHP in evaluating the supporting contractors for marker construction bidding in Poland. In addition, Wang and Tsai [53] combined the FAHP and data envelopment analysis (DEA) in the selection of solar panels for PV system design.
However, the major problem with the pairwise comparison method is an exponential increase in the number of comparisons as the number of criteria increases. One method to reduce the number of comparisons is to design the higher-level hierarchical model for evaluation, and another method is presenting the problem as a multi-objective optimization problem with suitable constraints such as [54,55,56]. Razael [57] proposed the best-worst MCDM method that reduces the pairwise comparison of criteria by comparing the best criterion among the other criteria as well as comparing the worst criterion among them. The number of comparisons decreased significantly from n(n − 1)/2 to (n − 1)/2. Furthermore, Pamučar et al. [6] developed the FUCOM method which needs less pairwise comparison of criteria. The FUCOM method begins by ranking the criteria, comparing direct higher-ranking criteria with direct lower-ranking criteria. The FUCOM method amounts to n − 1 comparison. Recently, the FUCOM method has been combined with other hybrid methods such as the multi attributive border approximation area comparison method [58] and multi attributive ideal-real comparative analysis [59]. The FUCOM method has been applied in different areas such as ranking of airlines [60], and the selection of forklift in a warehouse [61]. In this paper, we present a new hybrid method that combines SWARA and FUCOM with the GST.

2.3. Grey System Theory

The GST was introduced by Deng [62] as an approach for representing uncertain information. In GST a system with no information is called a black system. For instance, a black box in system engineering is one that exists, but we have no knowledge of what is inside. A system with perfect information is called a white system. In contrast to a black box, a system that is built with an open design is a white system. Now, a grey system is one in which we have incomplete information or, for simplicity, a system in which some information is known. Logically, a grey system is one in which some information is also unknown. There is an absolute possibility of mathematically formulating real-life problems with some unknown information. In other words, all real-life problems can be described as a grey system.
The depiction of a grey system is mathematically represented using grey numbers. The unbounded and bounded grey numbers, as well as the interval grey number, are the main types of grey number. In this research, the interval grey numbers are used. It should be noted that an interval number is different from an interval grey number. Whereas an interval number is all numbers between the lower and upper bounds of the interval, an interval grey number is just a single number between the lower and upper bounds of the grey interval number. In other words, an interval grey number is not a continuous number between both bounds but is just an uncertain number between an interval number that is certain. Not only can the GST be applied in for solving uncertainty MCDM problems, but also the GST can be applied in forecasting. For instance, Lin et al. [63] combined multivariable grey forecasting and genetic programming approach to predict CO2 emission. Indeed, no one knows the future.
One of the predominant representations of uncertainty is the use of fuzzy numbers [64]. The object studied in the fuzzy set is cognitive, whereas that of GST is poor information. Another difference between fuzzy mathematics and GST is the representation in their primary methods. Fuzzy membership function is used to describe the function of affliction, whereas grey numbers describe information coverage. Moreover, whereas the fuzzy system requires experience as a requirement and characteristic for a valid result, the grey system can be applied to any data distribution using a small sample size. Furthermore, it should be noted that the concept of probability and statistics is different from GST. Probability and statistics deal with determining the weights from a large sample of random data, which should correspond to a distinct type of distribution, for example, normal distribution [8]. Although there is some application of stochastic in renewable and green energy namely [65], uncertainties in optimization can either be treated as stochastic or robust programming. While Stochastic programming fundamentally depends on probability assumption such as the distribution of the uncertain data, robust programming does not. However, basically, robust programming has rigid constraints with uncertainty data set [66]. Thus, GST is used in this study.
There are several applications of GST. Esangbedo and Che [67,68] evaluated the business environment in Africa, and getting electricity was one of the evaluation criteria. They proposed the grey rank order centroid weights for aggregating the weights of criteria. Other research simply used the mean of the grey numbers to aggregate the preferences of group DMs, such as grey arithmetic mean and grey product mean. Lastly, Zhao and Zhou [69] presented a grey prediction model that incorporated a smoothness operator for forecasting electricity usage. Although Zavadskas et al. [70] applied the SWARA and MULTIMOORA approach to solving sustainability problem in internal combustion engine by analyzing the ecological energy parameters, this paper fills the gap in the literature that has not specifically evaluated the selection of contractors for floating solar panel selection. Specifically, this paper presents a new hybrid method called the Grey SWARA-FUCOM for group decision-making.
3. Methodology

3.1. Evaluation Criteria

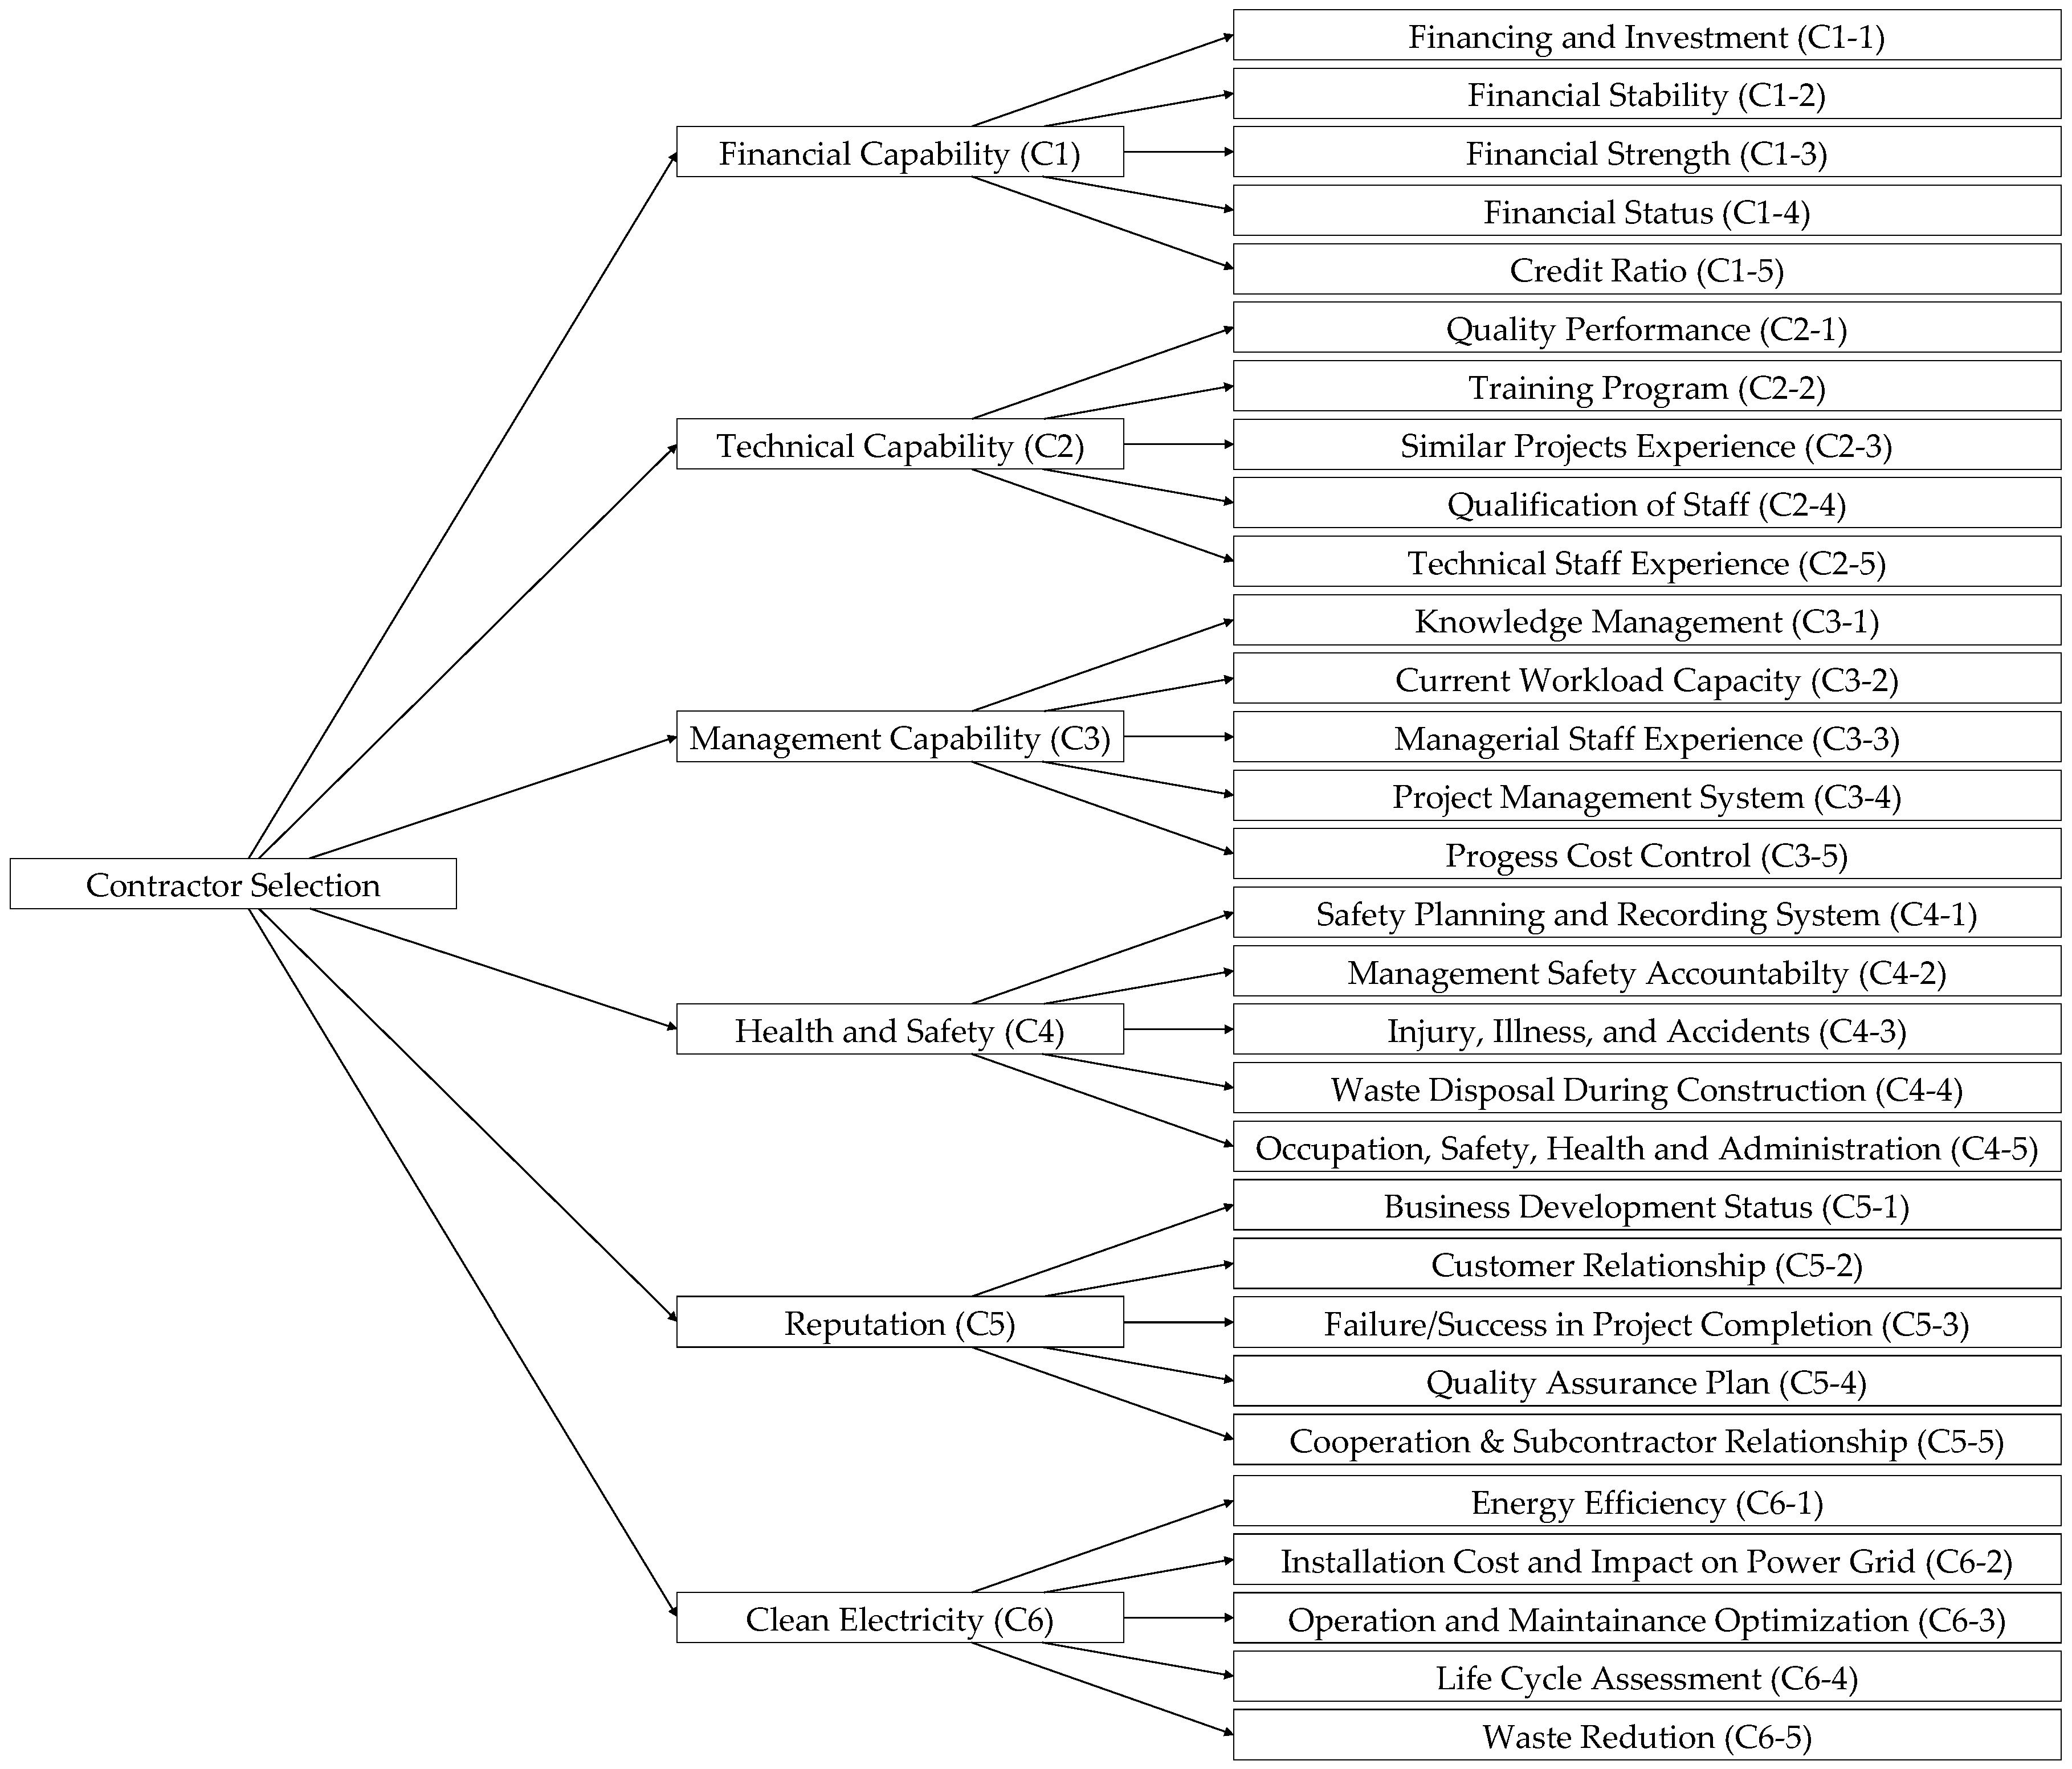
The main standard for evaluating the alternatives of an MCDM problem is the criteria. In this research, 36 criteria are used for evaluating contractors. These criteria are divided into two levels: six first-level criteria and 30 second-level criteria. Figure 1 shows the hierarchical diagram used for evaluation, where each first-level criterion consists of five second-level criteria. These criteria are deduced from the literature.

3.1.1. Financial Capabilities (C1)

This describes the qualities and ability associated with activities necessary to manage the funds to implement the solar panel installation project [51,71]. The amount of money set aside for the project in order to make it successful is measured as Financing and Investment (C1-1) [72,73]. Moreover, the quality of the fund is measured through the contracts cash flow to determine if it is steady, i.e., unlikely to change or interrupted, and this is described as Financial Stability (C1-2) [49,74]. Whereas the Financial Strength (C1-3) of the contractor is the degree to which the contractor can resist financial challenges without running into bankruptcy [44,51], the Financial Status (C1-4) is the contractor’s financial standing with a financial institution, e.g., banks [28,46,74]. The contractor’s Credit Ratio (C1-5) is the finding presented by the bank about their ability to borrow money for the contract [71,75].

3.1.2. Technical Capability (C2)

This evaluates the ability of the contractor’s staff to execute the project of installing the solar panel, including their ability to keep to national electrical regulation standards [72,73]. The contractor’s Quality Performance (C2-1) measures their bidding proposal in terms of describing how well they will maintain the national electricity regulatory standards, as well as precautionary measures incorporated into the installation to increase its longevity [73,74]. Training Program (C2-2) measures how far the contract will go beyond just teaching the project owners the skills for managing the installed solar panel as well as indoctrinating the concept of clean energy as part of the training plan [75,76,77]. Similar Project Performance (C2-3) measures how well or badly the contract would execute a similar project [73,76]. Qualification of Staff (C2-4) measures the number of licensed staff able to complete the project [72,73]. Technical Staff Experience (C2-5) evaluates staff skills for installation [44,78,79].

3.1.3. Management Capability (C3)

This measures the contractor’s potential for managing the solar panel installation within the scope of the contract. [71,72,73,75]. Knowledge Management (C3-1) is taken into consideration. There are multiple definitions of knowledge management that are recursive [72,80,81]. We describe knowledge management as the process of creating, acting on or dealing with information in the organization based on education and experience. Current Workload Capacity (C3-2) analyzes the amount of work that the contractor can do to minimize subcontracting by the contractor that wins the bid [28,72]. Managerial Staff Experience (C3-3) measures the ability of the contractor to run and control the project based on practical knowledge and skills gained over a relatively long period [78]. Project Management System (C3-4) measures how the contractor plans and organizes their resources for installing the solar panel [75,82]. Progress Cost Control (C3-5) evaluates relative cost of the process towards the completion of the installation of the solar panels, including checks and restrictions made to reasonably minimize cost [83,84].

3.1.4. Health and Safety (C4)

There are risks associated with work relating to staff health and safety. Risk can be minimized, and the compensation for this risk cannot be neglected. Safety Planning and Records System (C4-1) is the process of developing and taking detailed steps to protect the staff both during and after installation, which extends to having written accounts that can be analyzed in the future for making cautionary improvements [44,72,79]. Management Safety Accountability (C4-2) is the act of running and controlling the methods of keeping staff safe, which includes the contractor’s explicitly knowing their duties to help and take care of the staff executing the project if something goes wrong [72]. Injury, Illness, and Accidents (C4-3) are the measures the contractors would take when workers are not feeling well, which may be caused by an unpleasant and unplanned event that may result in damages. Some of these measures should be insurance cover and financial compensation that would be given to these members of staff [73,75]. Waste Disposal during Construction (C4-4) evaluates the contractor’s approach to getting rid of material that is no longer considered useful for the project. Special attention is given not only to the contractor that does not use more than the necessary materials but also to the contractor that has a plan to reuse materials deemed unusable within the same project. Occupation, Safety, Health, and Management (C4-5) evaluates the contractor’s adherence to statutory requirements for the local environment, such as the occupational disease control and work safety acts of China [71,73,77].

3.1.5. Reputation (C5)

This evaluates the opinion that people have of the contractor based on past interaction [71,74]. Business Development Status (C5-1) of the contractor evaluates the advancement of the contractors over time by rating the firm size, quality of their projects, and their ranking in the industry. Customer Relationship (C5-2) evaluates the way the contractor deals with the people or organizations that use their services [71]. Failure/Success in Project Completion (C5-3) evaluates the contractor by investigating their past projects [74,85]. Quality Assurance Program (C5-4) considers the plans and processes that will be followed to maintain high standards and excellence. This also evaluates the timeliness of services that address problems such as troubleshooting [50,72]. Cooperation and Subcontractor Relationship (C5-5) considers the interaction between the contractor and other partners as well as statutory personnel [28,77,86].

3.1.6. Clean Power (C6)

These are energy sources for lighting and heating as well as for driving machines that are free from pollutants as by-products. Energy Efficiency (C6-1) of the solar panel and other equipment is rated. Installation Cost and Impact on the Grid (C6-2) [45,47,76,87] evaluates the extent to which the contractor solution would be able to significantly reduce access to the electricity network or having the ability to supply excess energy to the grid. Operation and Maintenance Optimization (C6-3) evaluates the bidder’s description of their organized activities that require a number of workers to make sure the installed solar panel is up and running in the best way possible. Life Cycle Assessment (C6-4) evaluates the projected period that the solar panel will be used, as its efficiency depreciates over time. Pollution and Waste Reduction (C6-5) measures how the contractor will maximize energy production and cut loss of energy as unwanted heat, such as the use of energy-saving lightbulbs and highly efficient air-conditioning systems.

3.2. Weighting Method

When the DMs are clear about their rankings of the criteria based on their preferences, they may not be able to represent them as weights because the weights may not be evenly distributed. For example, the weights of three criteria that are ranked first, second, and third may have have a weight of 0.5, 0.3, and 0.2, respectively. For the same criteria weights, the first, second and third positions may be 0.7, 0.2, and 0.1, respectively. Therefore, the rankings of the criteria alone are not enough to determine the weights. Interestingly, SWARA and FUCOM methods begin by determining the ranking of the criteria and then systematically compare some of the criteria to obtain the weights that are reasonably distributed based on the DM’s preferences.

3.2.1. SWARA Method

The SWARA weighting method begins by ranking the criteria, and then pairwise compares the direct upper-ranking criterion to the lower-ranking criterion, i.e., direct adjacent criterion. Next, a comparative coefficient is computed, and the weight is determined and scaled for solving MCDM problems. The steps for estimating the criteria weights using SWARA are as follows:
Step 1. Rank the criteria. The criteria are ranked based on the DM’s preference from the most important criterion to the least important criterion.
Step 2. Determine the comparative importance of average value. The comparative importance is determining from the criteria that are ranked in the second position, and subsequent comparative importance is obtained by comparing criterion j and criterion j-1.
Step 3. Calculate the comparative coefficient. Coefficient kj is obtained using Equation (1):
k j = { 1 j = 1 s j + 1 j > 1 ,
where sj is the comparative importance of average value [5].
Step 4. Calculate the weights. The weight q j is the unscaled weight given in Equation (2):
q j = { 1 j = 1 k j 1 k j j > 1 ,
Step 5. Calculate the scaled weight. Generally, MCDM criteria weights are scaled to one unit, or 100%. Scaled weight is calculated using Equation (3):
w j = q j k = 1 n q k .
Step 6. Compute the effective weight. In group decision-making, the weights of each DM based on the SWARA method are aggregated as a summation, then scaled to obtain the effective weights. A SWARA weights vector for the first-level criteria W α s = { w j ( 1 ) , w j ( 2 ) , w j ( 3 ) , , w j ( v ) } by v DMs for the j t h criteria is given in Equation (4):
w α s = w j ( u ) u = 1 v w j ( u ) .
Similarly, for a SWARA weight vector for the second-level criteria W α β s = { w j ( 1 ) , w j ( 2 ) , w j ( 3 ) , , w j ( v ) } by v DMs for the j t h criteria is given in Equation (5):
w α β s = w α β ( u ) u = 1 v w α β ( u ) .
Thus, the effective SWARA weight is
w v s = w α s × w α β s .
The steps above are used for estimating the criteria weight using the SWARA method for group decision used in this paper, which begins with ranking the criteria and pairwise comparing the adjacent ranking criteria.

3.2.2. FUCOM Method

Similar to the SWARA weighting method, this begins with ranking the criteria and pairwise comparing the direct adjacent criteria, i.e., the direct upper-ranking criterion to the lower-ranking criterion. Next, the weights are obtained by solving an optimization function that minimizes the deviation from full consistency. The steps for the FUCOM method are as follows.
Step 1. Rank the criteria based on the level of importance. The DMs rank the criteria according to their preference from the most important criterion to the least important criterion.
C j ( 1 ) > C j ( 2 ) > C j ( 3 ) > > C j ( k ) > C j ( k + 1 )
Step 2. Determine the comparative priority. This is the lead preference which the upper-ranking criterion C j ( k ) has over the lower-ranking criterion, C j ( k + 1 ) .
Φ = ( φ 1 / 2 , φ 2 / 3 , , φ k / ( k + 1 ) ) ,
where φ k / ( k + 1 ) is the comparative priority C j ( k ) has over C j ( k + 1 ) .
Step 3. Compute the weights. The weights are computed as an optimization function by minimizing the deviation from full consistency ( χ ), as given below in Optimization Function (9).
min χ s . t . | w j ( k ) w j ( k + 1 ) φ k / ( k + 1 ) | χ , j | w j ( k ) w j ( k + 2 ) φ k / ( k + 1 ) φ ( k + 1 ) / ( k + 2 ) | χ , j j = 1 n w j = 1 , j w j 0 , j .
The first constraint is to ensure the weight is computed. The second constraint is to satisfy mathematical transitivity of the criteria weights. The third constraint is to ensure that the criteria weights are fractions that add up to a unit. The last constraint ensures that weights are non-negative.
Step 4. Compute the effective weight. In group decision-making, the weights of each DM based on the FUCOM method are aggregated as a summation, then scaled to obtain the effective weights using Equation (12). A FUCOM weights vector for the first-level criteria W α f = { w j ( 1 ) , w j ( 2 ) , w j ( 3 ) , , w j ( v ) } by v DMs for the j t h criteria is given in Equation (10),
w α f = w j ( u ) u = 1 v w j ( u ) ,
Similarly, for a SWARA weight vector for the second-level criteria W α β f = { w j ( 1 ) , w j ( 2 ) , w j ( 3 ) , , w j ( v ) } by v DMs for the j t h criteria is given in Equation (11),
w α β f = w α β ( u ) u = 1 v w α β ( u ) .
Thus, the effective SWARA weight is
w v f = w α f × w α β f .

3.2.3. Grey SWARA-FUCOM Method

The grey SWARA-FUCOM represents different weights obtained using the SWARA and FUCOM methods. The procedure for the grey SWARA-FUCOM weighting method is as follows:
Step 1. Obtain the SWARA and FUCOM weights of the criteria using Equation (3) and the Optimization Function (9).
Step 2. Represent the SWARA and FUCOM weights as grey numbers. The minimum and maximum weights using both methods are scaled to obtain the grey SWARA-FUCOM weights, w v = [ w _ v , w ¯ v ] , respectively, where the lower bound and upper bound of the grey number is computed using Equation (13):
min ( w v f , w v s ) i = 1 n max ( w i f , w i s ) ,
whereas the upper bound of the grey number is computed using Equation (14):
max ( w v f , w v s ) i = 1 n max ( w i f , w i s ) ,
where w s and w f are the SWARA and FUCOM weights, respectively, v is the index of the criteria for the MCDM evaluation method, i.e., the second-level criteria index, w v = [ w _ v , w ¯ v ] and v = 1 m w ¯ v = 1 .
W = ( w 1 w 2 w n ) T
The transpose of the matrix in Equation (15) is the effective weight of the decision criteria that can be used in other MCDM evaluation methods, such as GRA and EDAS.

3.3. Evaluation Method

In this research, alternative comparison methods are used. The first is the traditional GRA method that has been extended to grey numbers. The second is the EDAS method that also extends to grey numbers. Whereas the GRA method compares the alternatives to an optimal alternative, the EDAS compares the alternative to the average of the alternatives measured as positive and negative distances.

3.3.1. GRA with Grey Numbers

Grey relational analysis involves a comparison of the ideal alternative to the other alternatives based on their weighted preferences, and the best alternative is determined based on the average grey relational coefficient of the criteria for each of the alternatives. These steps are summarized as follows:
Step 1. Construct the hierarchical criteria model. A hierarchical model assists in breaking down the decision problem into smaller sections. For example, see Figure 1.
Step 2. Construct the decision matrix. The problem in an array is used to simplify the computational process. A decision table can equally be used. The decision matrix is given in Equation (16),
D = ( d 1 , 1 d 1 , 2 d 1 , n d 2 , 1 d 2 , 2 d 2 , n d m , 1 d m , 2 d m , n ) ,
where the performance value of the j t h criteria by the i t h alternative is represented as the element d i j .
Step 3. Normalize the decision matrix. This is to make the element in the decision matrix uniform, ranging from 0 to 1, as given in Equation (17):
D = ( d 1 , 1 d 1 , 2 d 1 , n d 2 , 1 d 2 , 2 d 2 , n d m , 1 d m , 2 d m , n ) ,
where:
1. Beneficial criteria, i.e., higher values correspond to better performance, the raw data are normalized using Equation (18):
d i j = d i j min 1 i n d i j min 1 i n d i j min 1 i n d i j
Cost criteria, i.e., lower values corresponding to higher performance. The raw data are normalized using Equation (19):
d i j = max 1 i n d i j d i j max 1 i n d i j min 1 i n d i j
Step 4. Compute the weighted normalized decision matrix. This is simply the product of weights and the element in the normalized decision matrix. For weight in grey numbers, W = ( w 1 w 2 w m ) T , grey operation is used. The weighted-normalized decision matrix is given in Equation (20):
D * = ( d 1 , 1 * d 1 , 2 * d 1 , n * d 2 , 1 * d 2 , 2 * d 2 , n * d m , 1 * d m , 2 * d m , n * ) ,
where d i j * = d i j × w i j .
In vector form, the series can be written as:
D 1 * = { d 1 , 1 * , d 1 , 2 * , , d 1 , n * } D 2 * = { d 2 , 1 * , d 2 , 2 * , , d 2 , n * } D m * = { d m , 1 * , d m , 2 * , , d m , n * } .
Step 5. Determine the weighted reference alternative. This is the optimal obtainable performance by the alternatives in all criteria. This is obtained using Equation (21).
D 0 * = { d 01 * , d 02 * , , d 0 n * } ,
where d 0 j * = [ max 1 i m d i j * _ , max 1 i m d i j * ¯ ] .
Step 6. Calculate the weighted alternatives difference. This difference is calculated using the arbitrary distance [88] between the elements of the weighted reference alternative and elements of the weighted normalized decision matrix as given in Equation (22).
Δ = ( δ 1 , 1 δ 1 , 2 δ 1 , n δ 2 , 1 δ 2 , 2 δ 2 , n δ m , 1 δ m , 2 δ m , n ) ,
where δ i j = | d 0 j * d i j * | = max ( | d _ 0 j * d _ i j * | , | d 0 j * ¯ d i j * ¯ | ) .
Step 7. Calculate the grey relational grade. The grey relational grey is used to obtain the overall performance of the alternative, and it is calculated using Equation (23):
r i = 1 n j = 1 n γ i j ,
where the grey relational coefficient is
γ i j = min 1 i m min 1 j n δ i j + ζ max 1 i m max 1 j n δ i j δ i j + ζ max 1 i m max 1 j n δ i j ,
The grey distinguishing coefficient, ζ [ 0 , 1 ] .
Step 8. Rank the alternatives. This means sorting the alternatives from best to worst, where the highest score is the best alternative.

3.3.2. EDAS with Grey Numbers

Unlike GRA, which compares the alternatives with the optimal alternative, EDAS evaluates the alternatives by comparing the alternatives with the average performance of the alternatives. The steps are given as follows.
Step 1. Construct the hierarchical criteria model. See Figure 1.
Step 2. Construct a decision-matrix. See Equation (16).
Step 3. Determine the average alternative. The average performance value of the alternative is the arithmetic mean of all the criteria by the alternatives.
D ¯ = ( d ¯ i 1 d ¯ i 2 d ¯ i m ) ,
where d ¯ i j = 1 n i = 1 n d i j .
Step 4. Compute the distances from the average. Both positive and negative distances are obtained.
1. Positive distance from average
D + = ( d 1 , 1 + d 1 , 2 + d 1 , n + d 2 , 1 + d 2 , 2 + d 2 , n + d m , 1 + d m , 2 + d m , n + ) ,
where d i j + = max ( 0 , ( d i j d ¯ j ) ) d ¯ j and d i j + = max ( 0 , ( d ¯ j d i j ) ) d ¯ j are beneficial and cost criteria, respectively.
2. Negative distance from average
D = ( d 1 , 1 d 1 , 2 d 1 , m d 2 , 1 d 2 , 2 d 2 , m d n , 1 d n , 2 d n , m ) ,
where and d i j = max ( 0 , ( d ¯ j d i j ) ) d ¯ j and d i j = max ( 0 , ( d i j d ¯ j ) ) d ¯ j are beneficial and cost criteria, respectively.
Step 5. Determine the weighted sum of the distances. The weighted sum is obtained using matrix multiplication.
1. The weighted positive distance,
D * + = W × D +
D + * = ( w 1 w 2 w m ) T × ( d 1 , 1 + d 1 , 2 + d 1 , m + d 2 , 1 + d 2 , 2 + d 2 , m + d n , 1 + d n , 2 + d n , m + )
2. The weighted negative distance,
D * = W × D ,
D * = ( w 1 w 2 w m ) T × ( d 1 , 1 d 1 , 2 d 1 , m d 2 , 1 d 2 , 2 d 2 , m d n , 1 d n , 2 d n , m ) ,
Step 6. Normalize the values of the weighted sum. The weight sums are normalized as follows:
1. The positive weighted sum,
D + = ( d 1 + d 2 + d n + ) T ,
where d 1 + = D * + max ( d ¯ i * + ) .
2. The negative weighted sum,
D = ( d 1 d 2 d n ) T ,
where d 1 = 1 D * max ( d ¯ i * ) .
Step 7. Calculate the appraisal scores.
A i = ( a 1 a 2 a n ) T ,
where a i = 1 2 ( d 1 + + d 1 ) .
Step 8. Rank the alternatives. The appraisal scores in grey numbers are whitened using Equation (35) and then from the highest scores the best alternative is selected.
s i = a _ i ( 1 λ ) + a ¯ i λ
where the whitenization coefficient λ [ 0 , 1 ] .
The steps presented above represent the EDAS MCDM evaluation method using grey weights. Although at the expense of computational cost and complexity, the primary benefit of the grey SWARA-FUCOM approach is that it considers uncertainty in a group decision-making environment. Most importantly, the grey SWARA-FUCOM could be integrated with other MCDM evaluation methods.

4. Results and Analysis

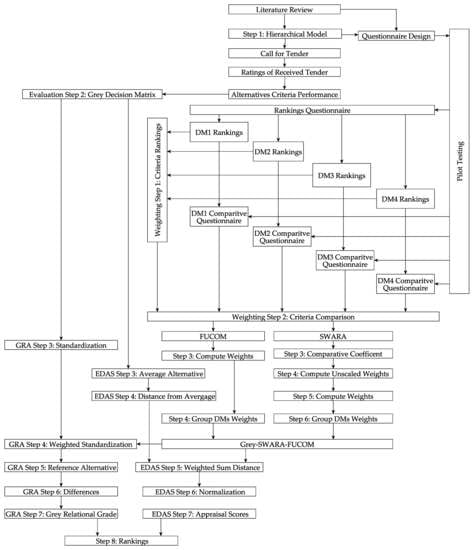
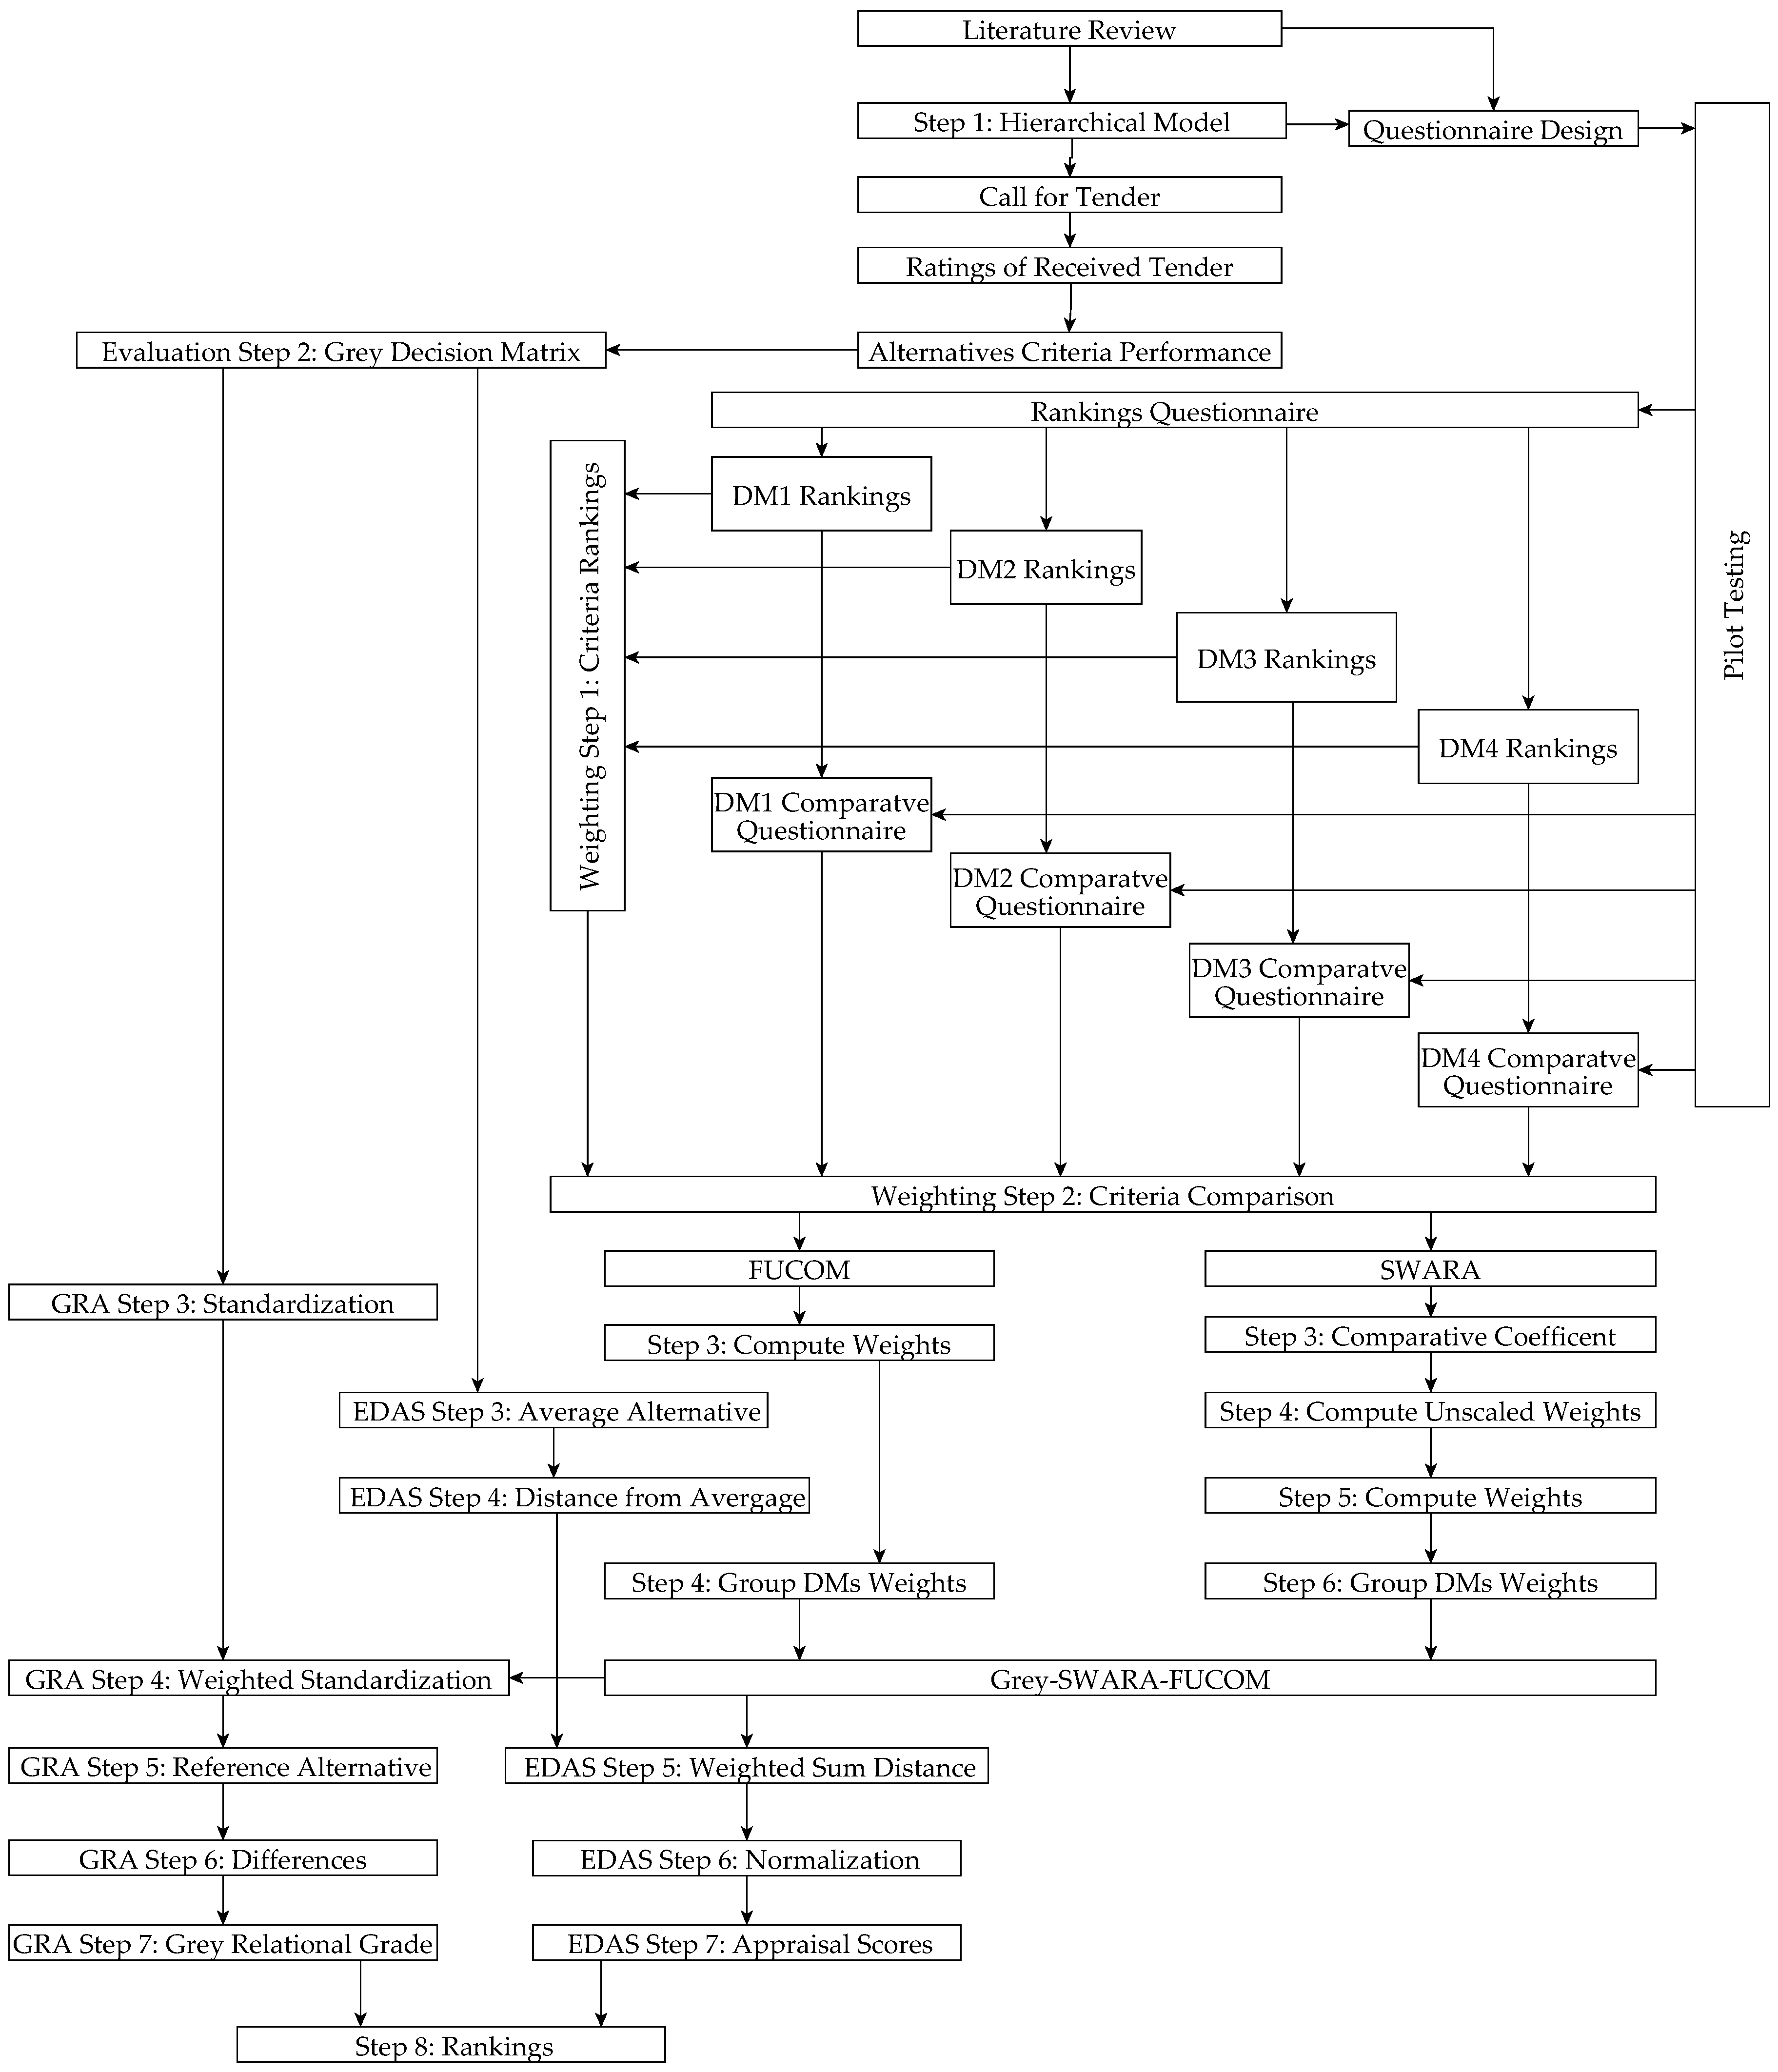
The evaluation of the contractors for the installation of the solar panel system began with the contracting company (Company Z) doing some background checks on certain contractors with which they felt comfortable doing business. Four contractors (A1, A2, A3, and A4) were selected, and the call for tender that presented the evaluation criteria in Figure 1 was restricted to these contractors. In this paper, the contractors are kept anonymous, and no background information about them is presented. The analysis consists of two main aspects: First, weighting based on the grey SWARA-FUCOM method. Secondly, evaluation based on the GRA and EDAS method with grey numbers. Figure 2 shows a flowchart of this analysis.
The flowchart begins with a literature review, the fundamental part of the research, which was used to design the hierarchical model (Figure 1) and the questionnaires. After that, a call for tender based on the hierarchical model as the requirements requested from the contractors. Subsequently, the contract awarding committee allocated point to the bids. Questionnaires for ranking and pairwise comparison were designed, and pilot tested before being used in this research. The first round of the questionnaires was for ranking the criteria. Then, the second round of questionnaires were customized comparative questionnaires, which were based on each DM rankings, to estimate the group DMs weights using the grey SWARA-FUCOM presented in Section 3.2.3. Finally, the weights are applied in the evaluation and ranking of the contractors using the GRA and EDAS with grey numbers as given in Section 3.3.

4.1. Application of Grey SWARA-FUCOM Weighting Method

Two sets of questionnaires were designed to obtain data from the DMs. All questionnaires were web based because of the ease of ranking by moving the important criteria upwards on the scale. Before administering the questions to the DM, several revisions were made and piloted. The first set of questionnaires was used to rank the criteria, and the data obtained from the rankings are shown in Table 1. The second set of questionnaires was designed to obtain the degree to which the direct upper-ranked criteria were more important than the lower-ranked criteria. A nine-point scale was used where equally important is denoted as 1, weakly important is denoted as 3, essentially important is denoted as 5, very strongly important is denoted as 7, absolutely important is denoted as 9, and the intermediate value between two adjacent preferences are 2, 4, 6, and 8. Table 2 shows the comparison data obtained from the DMs.

4.1.1. SWARA Weights

Based on the steps in Section 3.2.1, the weights of the DMs are computed. Table 3 shows the computation of the weights for the first-level indicator using the first DM’s preferences. The computation for the other criteria by the other DMs is omitted. The effective SWARA weights for the DMs are given in Table 4, and the effective SWARA weight is given in Table 5.

4.1.2. FUCOM Weights

Based on the steps in Section 3.2.2, the DMs using FUCOM are shown in Table 4, and the group effective FUCOM weights are presented in Table 6. Based on the Objective Function (9), for the first criteria by DM1, the objective function is given as follows:
min χ s . t . | w 5 w 4 1 4 | χ , j ; ; | w 3 w 1 5 5 | χ , j ; | w 5 w 6 1 4 × 4 3 | χ , j ; ; | w 2 w 1 8 5 × 5 5 | χ , j
j = 1 6 w j = 1 , j w 1 , w 2 , w 3 , w 4 , w 5 , w 6 0 , j
The objectives for different criteria by the other DMs are omitted.

4.1.3. Grey SWARA-FUCOM Weights

This is the weight used in this research based on Equation (15):
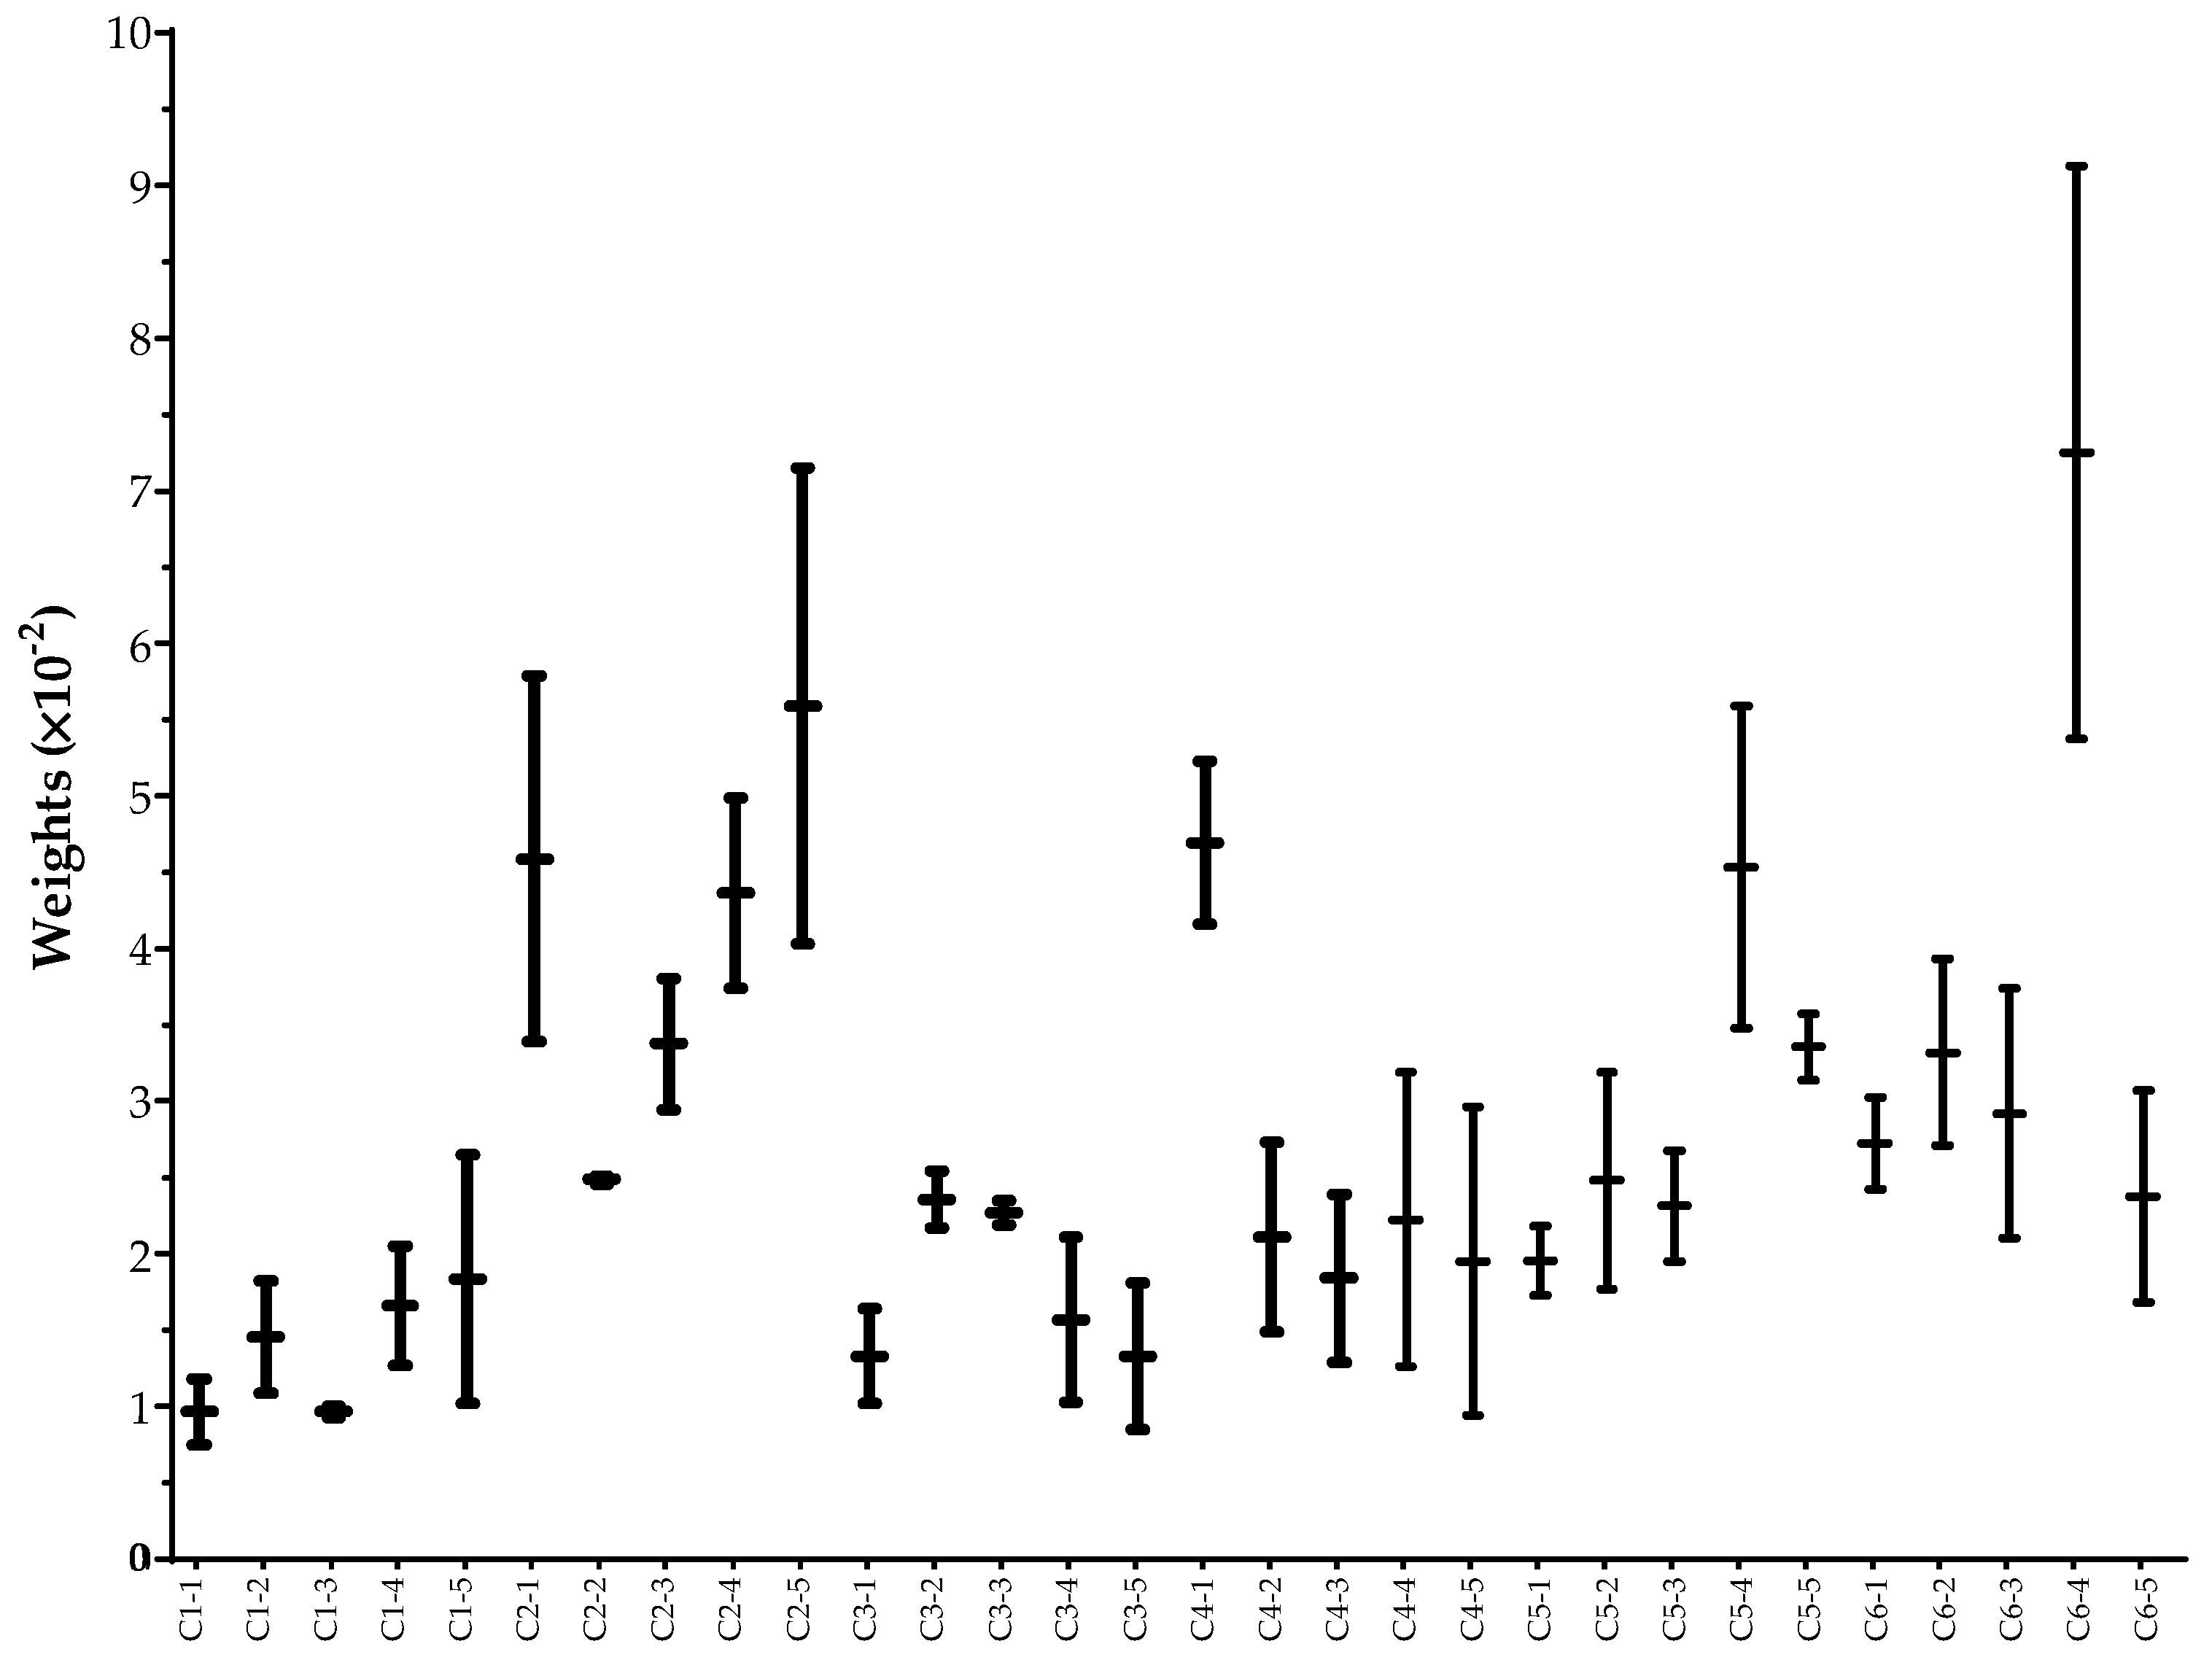
W = ([0.0075, 0.0118], [0.0109, 0.0182], [0.0093, 0.01], [0.0127, 0.0205], [0.0102, 0.0265], [0.0339, 0.0579], [0.0246, 0.0251], [0.0294, 0.0381], [0.0374, 0.0499], [0.0403, 0.0715], [0.0102, 0.0164], [0.0217, 0.0254], [0.0219, 0.0235], [0.0103, 0.0211], [0.0085, 0.0181], [0.0416, 0.0523], [0.0149, 0.0273], [0.0129, 0.0239], [0.0126, 0.0319], [0.0094, 0.0296], [0.0173, 0.0218], [0.0177, 0.0319], [0.0195, 0.0268], [0.0348, 0.0559], [0.0314, 0.0357], [0.0242, 0.0302], [0.0271, 0.0393], [0.021, 0.0374], [0.0537, 0.0913], [0.0168, 0.0307])T.
A plot of the weights is given in Figure 3. The shortest weight bar, Training Program (C2-2), indicates the closest possible convergence between the SWARA and FUCOM method, whereas the longest bar, Life Cycle Assessment (C5-4), indicates the largest divergence between the SWARA and FUCOM method. The set of criteria with the lowest possible weight is Financing and Investment (C1-1), with a lower bound of 0.0043, and the criterion with the highest possible weight is Life Cycle Assessment (C5-4), with an upper bound of 0.0913.

4.2. Evaluating Solar Panel Contactors

Company Z sets up a committee that reviews the proposals of the contractors, and four of the top managers in the company add veto power to grade proposals during the review meeting. The average points given by these managers for the four contractors are shown in Table 7. The average points are used as the performance rates by the GRA and EDAS methods with grey weights.

4.2.1. GRA with Grey Numbers

This is the traditional GRA method in Section 3.3.1, using the grey SWARA-FUCOM method presented in Section 4.1.3. Following the steps presented, the hierarchical model is in Figure 1 and the decision matrix D is constructed from Table 7 based on Equation (16),
D = ( d 1 , 1 d 1 , 2 d 1 , 3 d 1 , 30 d 2 , 1 d 2 , 2 d 2 , 3 d 2 , 30 d 3 , 1 d 3 , 2 d 3 , 3 d 3 , 30 d 4 , 1 d 4 , 2 d 4 , 3 d 4 , 30 ) = ( 86.25 82.25 82.5 88.33 70 56.25 57.5 61.25 78.5 77.5 73.75 81.25 84.25 80 80 78.75 ) .
Then, the normalized decision matrix is obtained using Equation (17):
D = ( d 1 , 1 d 1 , 2 d 1 , 3 d 1 , 30 d 2 , 1 d 2 , 2 d 2 , 3 d 2 , 30 d 3 , 1 d 3 , 1 d 3 , 3 d 3 , 30 d 4 , 1 d 4 , 2 d 4 , 3 d 4 , 30 ) = ( 1 1 1 1 0 0 0 0 0.5231 0.8173 0.65 0.7386 0 . 8769 0 . 9135 0 . 9 0.6462 ) .
The weighted standardized decision matrix is computed using the grey SWARA-FUCOM weight in Equation (36). Grey weight is: W = ( [ 0.0075 ,   0.0118 ] [ 0.0109 ,   0.0182 ] [ 0.0093 ,   0.01 ] [ 0.0168 ,   0.0307 ] ) T ,
D * = ( d 1 , 1 * d 1 , 2 * d 1 , 3 * d 1 , 30 * d 2 , 1 * d 2 , 2 * d 2 , 3 * d 2 , 30 * d 3 , 1 * d 3 , 2 * d 3 , 3 * d 3 , 30 * d 4 , 1 * d 4 , 2 * d 4 , 3 * d 4 , 30 * )   = ( [ 0.0075 ,   0.0118 ] [ 0.0109 ,   0.182 ] [ 0.0093 ,   0.0100 ] [ 0.0168 ,   0.0307 ] 0 0 0 0 [ 0.0039 ,   0.0062 ] [ 0.0089 ,   0.0149 ] [ 0.0060 ,   0.0065 ] [ 0.0124 ,   0.0227 ] [ 0.0066 ,   0.0103 ] [ 0.0100 ,   0.0166 ] [ 0.0084 ,   0.0090 ] [ 0.0109 ,   0.0198 ] )
where d i j * = d i j × w i j .
Subsequently, the weighted grey reference alternative is determined.
D 0 * = { d 0 , 1 * , d 0 , 2 * , , d 0 , 30 * } = { [ 0.0075 ,   0.0118 ] [ 0.0109 ,   0.0182 ] [ 0.0093 ,   0.01 ] [ 0.0168 ,   0.0307 ] } ,
where d 0 j * = [ max 1 i 4 d i j * _ , max 1 i 4 d i j * ¯ ] .
Then, weighted alternative differences are calculated.
Δ = ( δ 1 , 1 δ 1 , 2 δ 1 , 3 δ 1 , 30 δ 2 , 1 δ 2 , 2 δ 2 , 3 δ 2 , 30 δ 3 , 1 δ 3 , 2 δ 3 , 3 δ 3 , 30 δ 4 , 1 δ 4 , 2 δ 4 , 3 δ 4 , 30 ) = ( 0 0 0 0 0.0118 0.0182 0.0100 0.0307 0.0056 0.0033 0.0035 0.0080 0.0015 0.0016 0.0010 0.0109 ) .
Finally, the grey relational coefficient is computed to determine the grey relational grade, which is used for ranking. The grey relational coefficient is
γ i j = min 1 i 4 min 1 j 30 δ i j + ζ max 1 i 4 max 1 j 30 δ i j δ i j + ζ max 1 i 4 max 1 j 30 δ i j ,
where the grey distinguishing coefficient, ζ = 0.5 , is calculated. Thus, the grey relational grade r i = 1 30 j = 1 30 γ i j ,
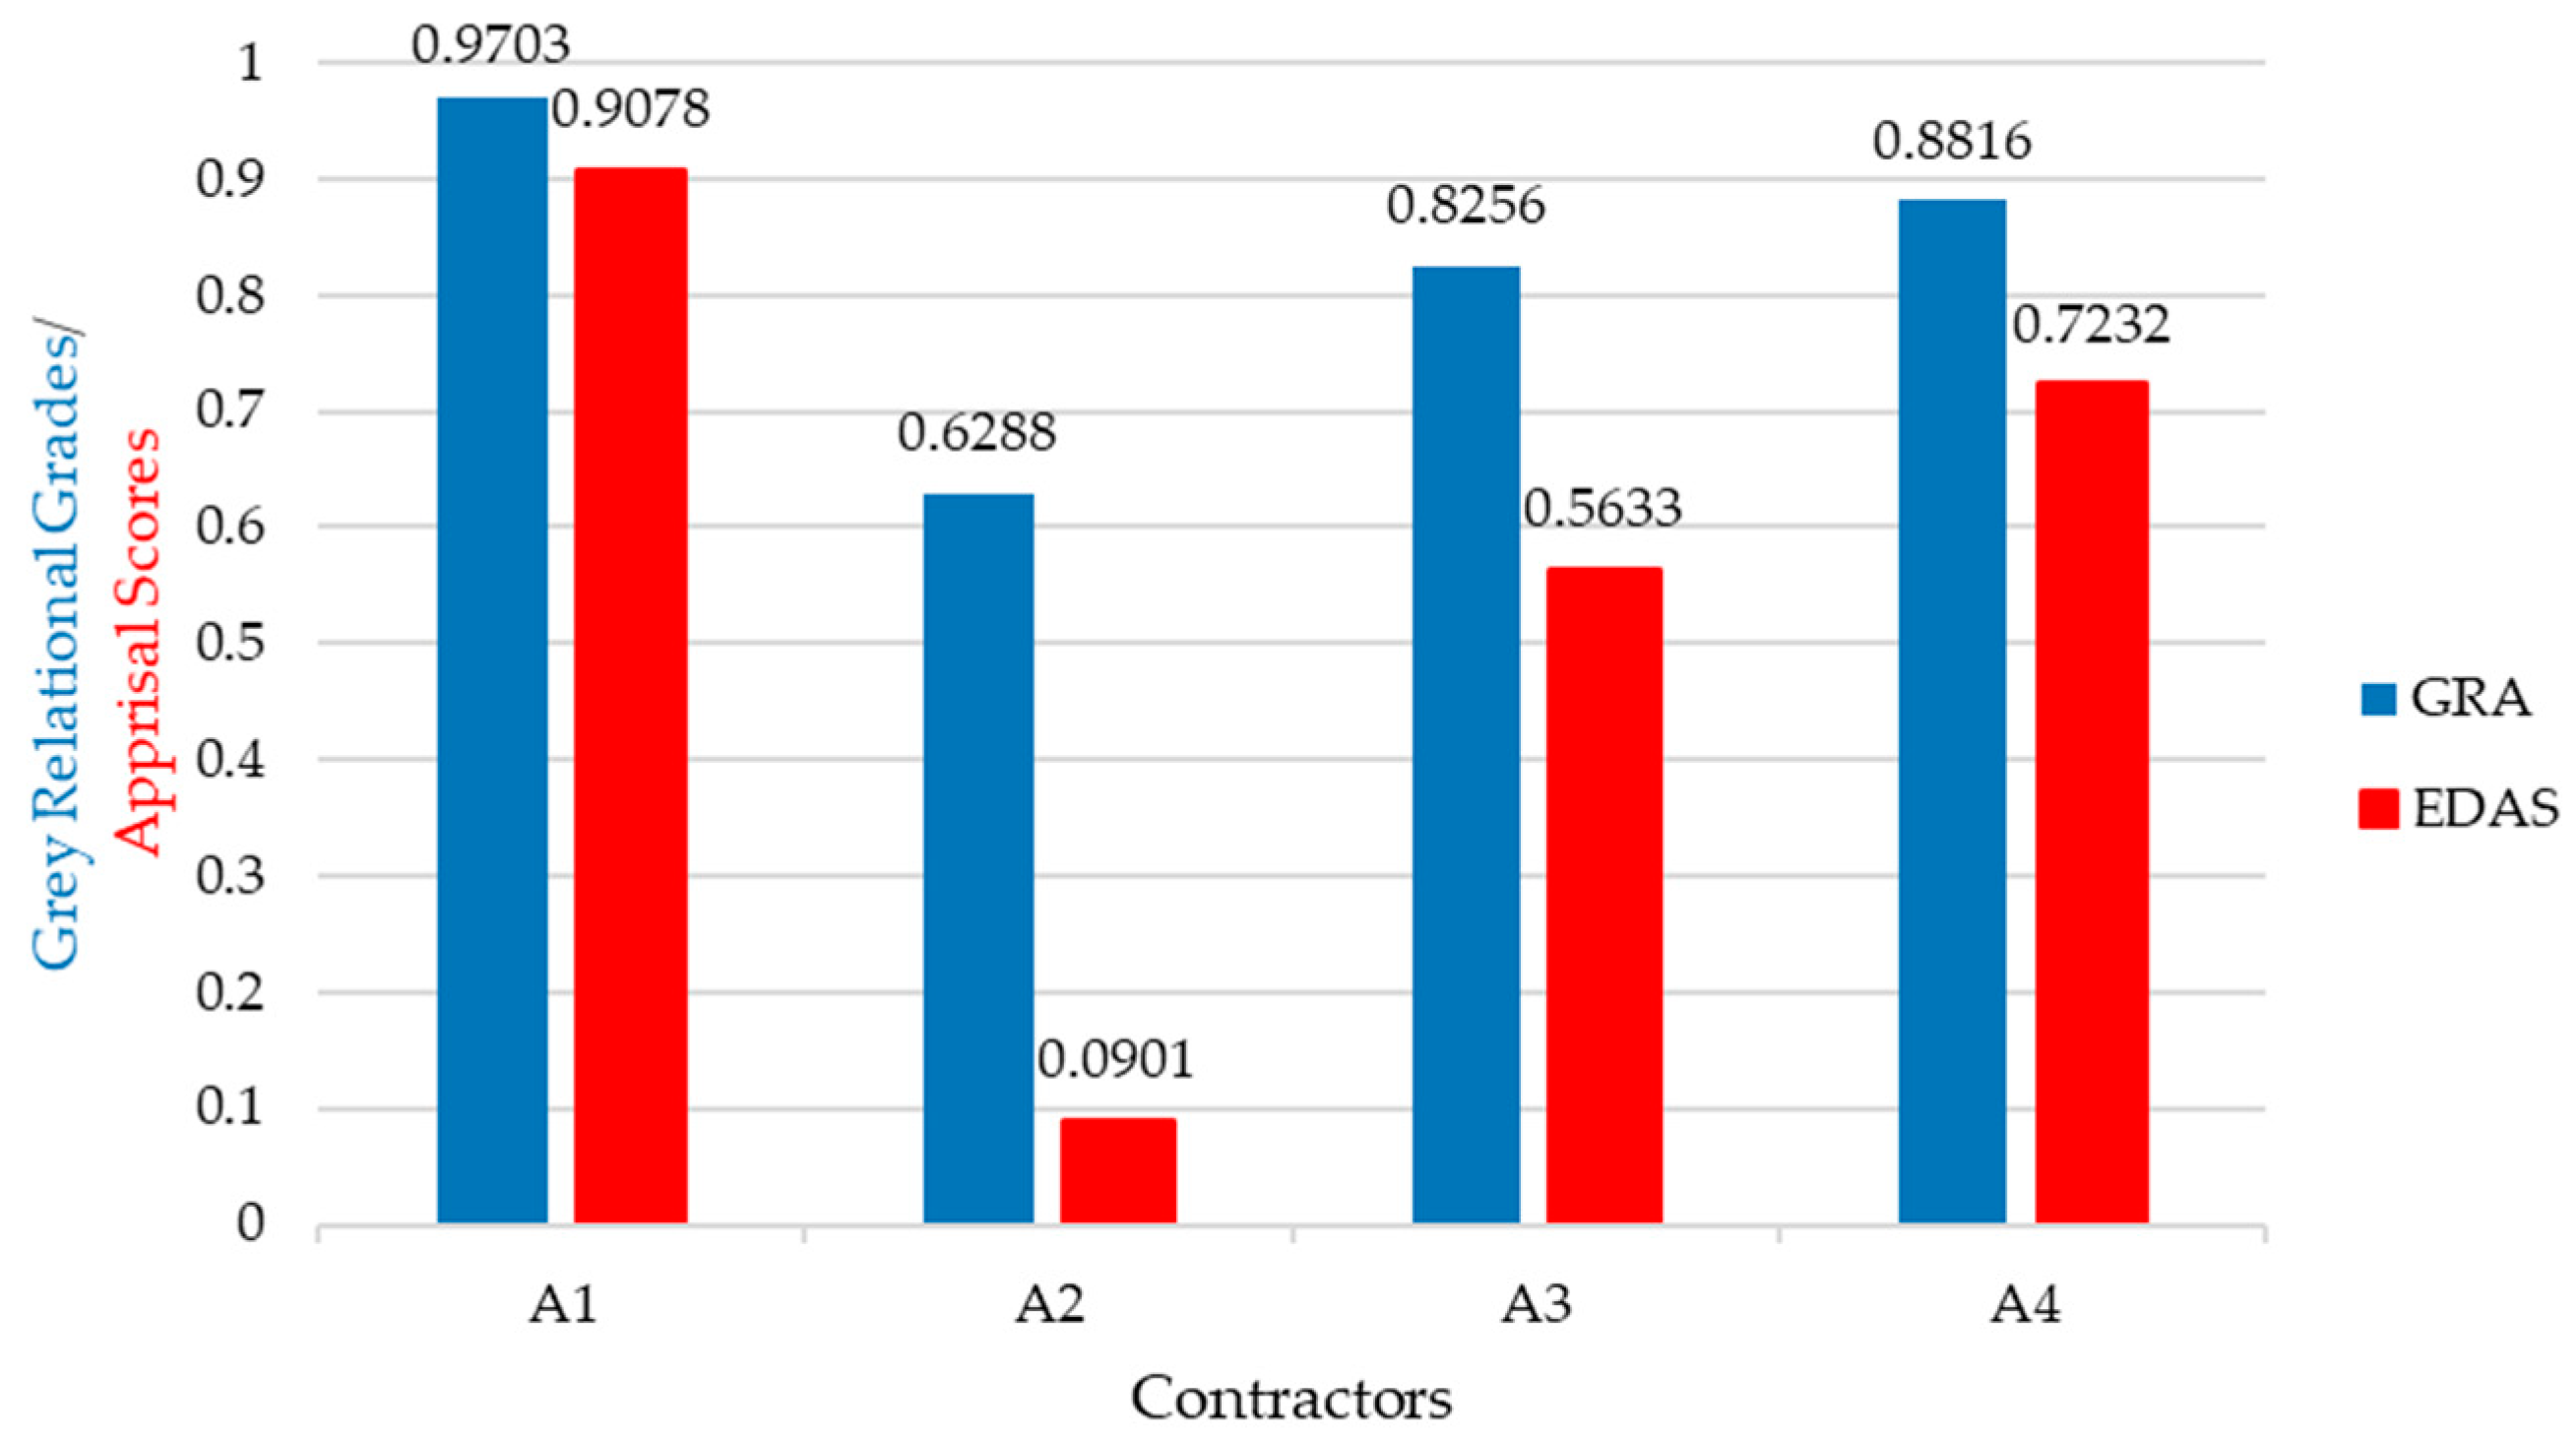
r 1 = 0.9703 ,   r 2 = 0.6288 ,   r 3 = 0.8256 ,   r 4 = 0.8816 .
As r 1 > r 4 > r 3 > r 2 , the A 1 A 4 A 3 A 2 , i.e., contractors A1, A4, A3, A2 are ranked as the first, second, third and fourth positions, respectively.

4.2.2. EDAS with Grey Numbers

This is the EDAS method in Section 3.3.2, using the grey SWARA-FUCOM weights presented in Section 4.1.3. The hierarchical diagram is given in Figure 1, and the decision matrix is given in Equation (37). Next, the average performance value of contractors is the arithmetic mean of all the criteria.
D ¯ = ( d ¯ i , 1 d ¯ i , 2 d ¯ i , 3 d ¯ i , 30 ) = ( 79.7500 74.0000 73.4375 77.3950 ) .
The distances from the average are computed:
1. Positive distance from average
D + = ( d 1 , 1 + d 1 , 2 + d 1 , 3 + d 1 , 30 + d 2 , 1 + d 2 , 2 + d 2 , 3 + d 2 , 30 + d 3 , 1 + d 3 , 2 + d 3 , 3 + d 3 , 30 + d 4 , 1 + d 4 , 2 + d 4 , 3 + d 4 , 30 + ) = ( 0.0815 0.1115 0.1234 0.0579 0 0 0 0 0 0.0473 0.0043 0.0744 0.0564 0.0811 0.0894 0.0413 ) .
2. Negative distance from average
D = ( d 1 , 1 d 1 , 2 d 1 , 3 d 1 , 30 d 2 , 1 d 2 , 2 d 2 , 3 d 2 , 30 d 3 , 1 d 3 , 2 d 3 , 3 d 3 , 30 d 4 , 1 d 4 , 2 d 4 , 3 d 4 , 30 ) = ( 0 0 0 0 0.1222 0.2399 0 0.2086 0.0157 0 0 0 0 0 0 0 ) .
Then, the weighted sums of the distances are computed:
1. Weighted sum positive distance, D * + = W × D +
D + * = ( w 1 w 2 w 30 ) T × ( d 1 , 1 + d 1 , 2 + d 1 , 3 + d 1 , 30 + d 2 , 1 + d 2 , 2 + d 2 , 3 + d 2 , 30 + d 3 , 1 + d 3 , 2 + d 3 , 3 + d 3 , 30 + d 4 , 1 + d 4 , 2 + d 4 , 3 + d 4 , 30 + ) = ( [ 0 . 0617 ,   0 . 0975 ] [ 0 ,   0 ] [ 0 . 0128 ,   0 . 0210 ] [ 0 . 0349 ,   0 . 0533 ] ) T .
2. Weighted sum negative distance, D * = W × D
D * = ( w 1 w 2 w 30 ) T × ( d 1 , 1 d 1 , 2 d 1 , 3 d 1 , 30 d 2 , 1 d 2 , 2 d 2 , 3 d 2 , 30 d 3 , 1 d 3 , 2 d 3 , 3 d 3 , 30 d 4 , 1 d 4 , 2 d 4 , 3 d 4 , 30 ) = ( [ 0 . 0001 ,   0 . 0001 ] [ 0 . 1029 ,   0 . 1609 ] [ 0 . 0057 ,   0 . 0095 ] [ 0 . 0007 ,   0 . 0013 ] ) T .
Next, the normalized values of the sum are computed for both positive and negative distances using Equations (32) and (33), respectively.
1. Positive distance,
D + = ( d 1 + d 2 + d 3 + d 4 + ) T = ( [ 0 . 6329 ,   1 ] [ 0 ,   0 ] [ 0 . 1317 ,   0 . 2158 ] [ 0 . 3579 ,   0 . 5470 ] ) T
2. Negative distance
D = ( d 1 d 2 d n ) T = ( [ 0 . 9991 ,   0 . 9992 ] [ 0 ,   0 . 3606 ] [ 0 . 9412 ,   0 . 9647 ] [ 0 . 9922 ,   0 . 9956 ] ) T
Finally, appraisal scores are calculated,
S i = ( s 1 s 2 s 3 s 4 ) T = ( [ 0 . 8160 ,   0 . 9996 ] [ 0 ,   0 . 1803 ] [ 0 . 5364 ,   0 . 5902 ] [ 0 . 6751 ,   0 . 7713 ] ) T
Using a whitenization coefficient of 0.5, i.e., λ = 0.5 ,
s 1 = 0.9078 ,   s 2 = 0.0901 ,   s 3 = 0.5633 ,   s 4 = 0.7232 .
s 1 > s 4 > s 3 > s 2 ; r 1 > r 4 > r 3 > r 2 , the A 1 A 4 A 3 A 2 , i.e., contractors A1, A4, A3, A2 are ranked in first, second, third, and fourth position, respectively.
The rankings using the GRA and EDAS methods is the same. Inferably, based on the affirmative results using both methods combined with the grey SWARA-FUCOM weights, contractor A1 is the best one to award the project.

4.3. Discussion

Based on the subjective opinion and ratings of the DMs, the most important criterion is Life Cycle Assessment (C6-4) for the installation of a floating solar panel energy system. Specifically, this is the holistic evaluation of the system’s component to the environmental impact of raw material extraction to its end of life. The assessment specifies the impacts and effects of the contractors’ solution on climate change, human health ecosystem quality, and non-renewable resources. These allow DM to reduce the negative impact of new products and identify areas that can be improved in existing component as well as avoiding the modifications of parts that can arise to significant issues in another stage in the solar panel life by comparing the environmental footprint of similar solutions. Next, the second criterion that is highly important is Technical Staff Experience (C2-5). Then, the third criterion that is also highly important is the contractor’s Quality Performance (C2-1).
On the contrary, the least important criteria based on the DMs’ preference using the grey SWARA-FUCOM method is Financing and Investment (C1-1). This may be the case since the DMs are Chinese, and generally, the Chinese are not lacking funds to see capital investment projects to completion. Currently, the Chinese economy is robust as can be seen from it historical growth that has allowed their nation to embark on gound breaking financial decisions such as the inception of the Asia Infrastructure Investment Bank (AIIB), a bank that has some chance to rival the International Monetary Fund (IMF). Large scale projects are being undertaken with little or no friction on funding that can hold back projects in under-developed countries. Subsequently, the second-least important criteria, according to the DMs perception is Progress Cost Control (C3-5). Interestingly, the company involved in this project is not in pursuit of the immediate cost-saving, but they are working towards making a positive impact on the environment by attempting to reduce their carbon footprint.
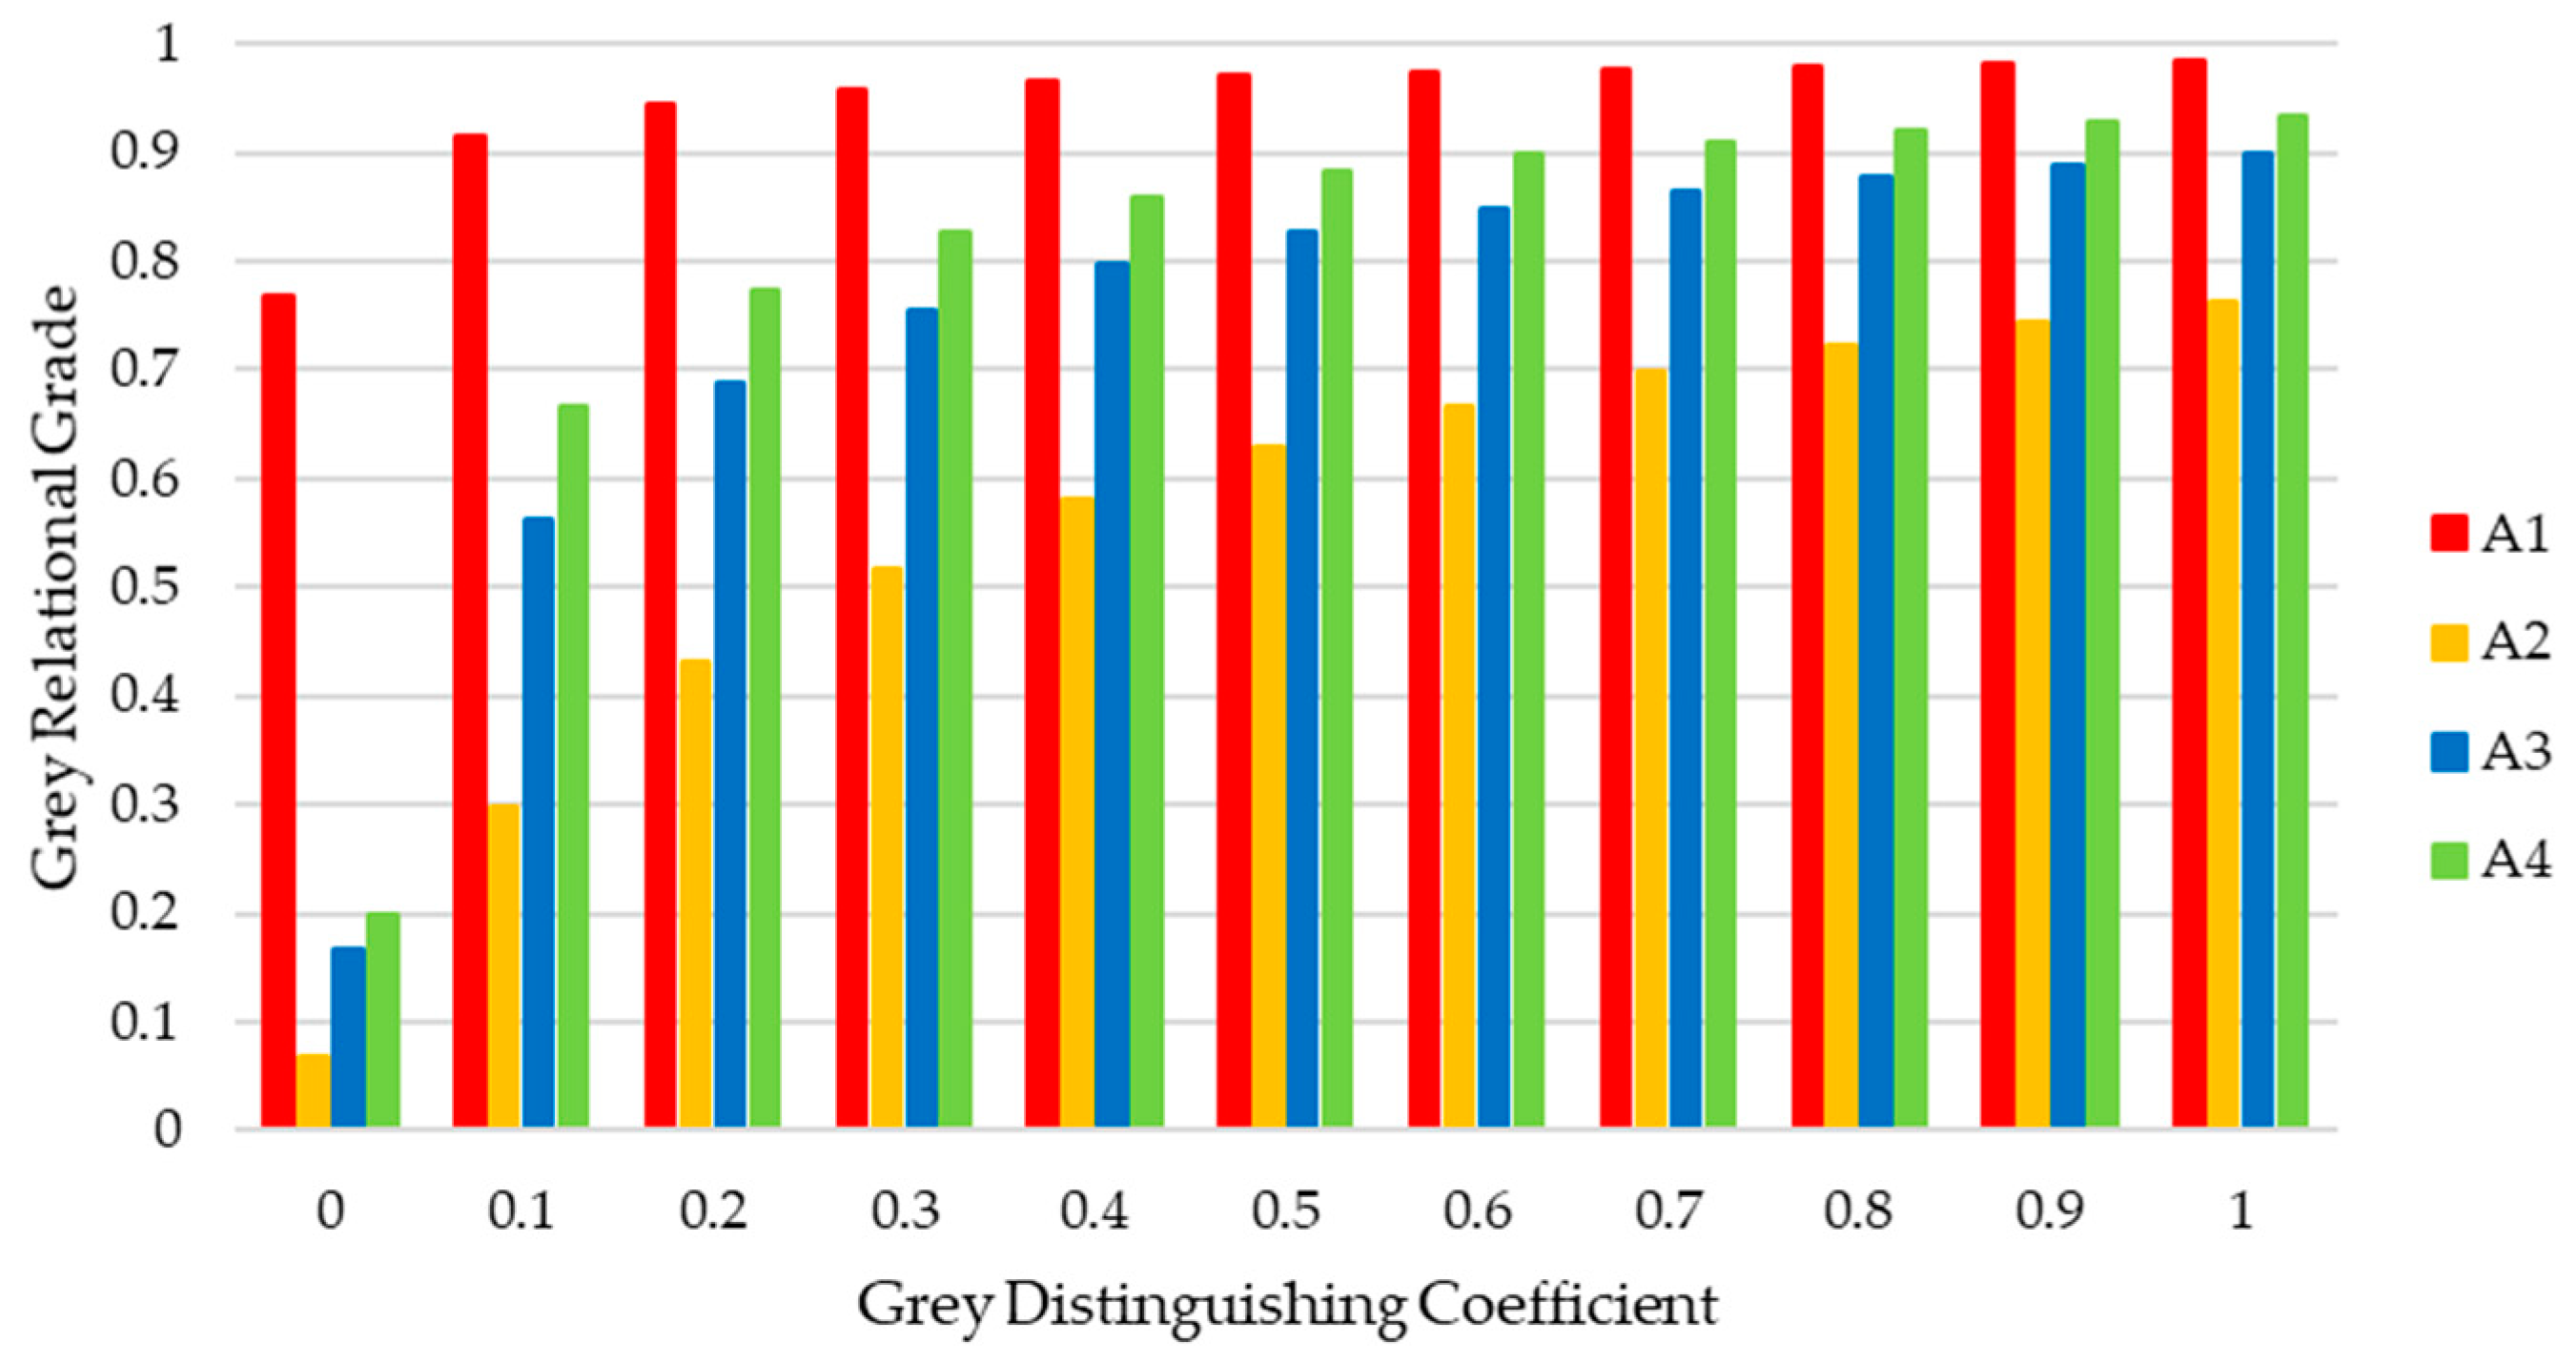
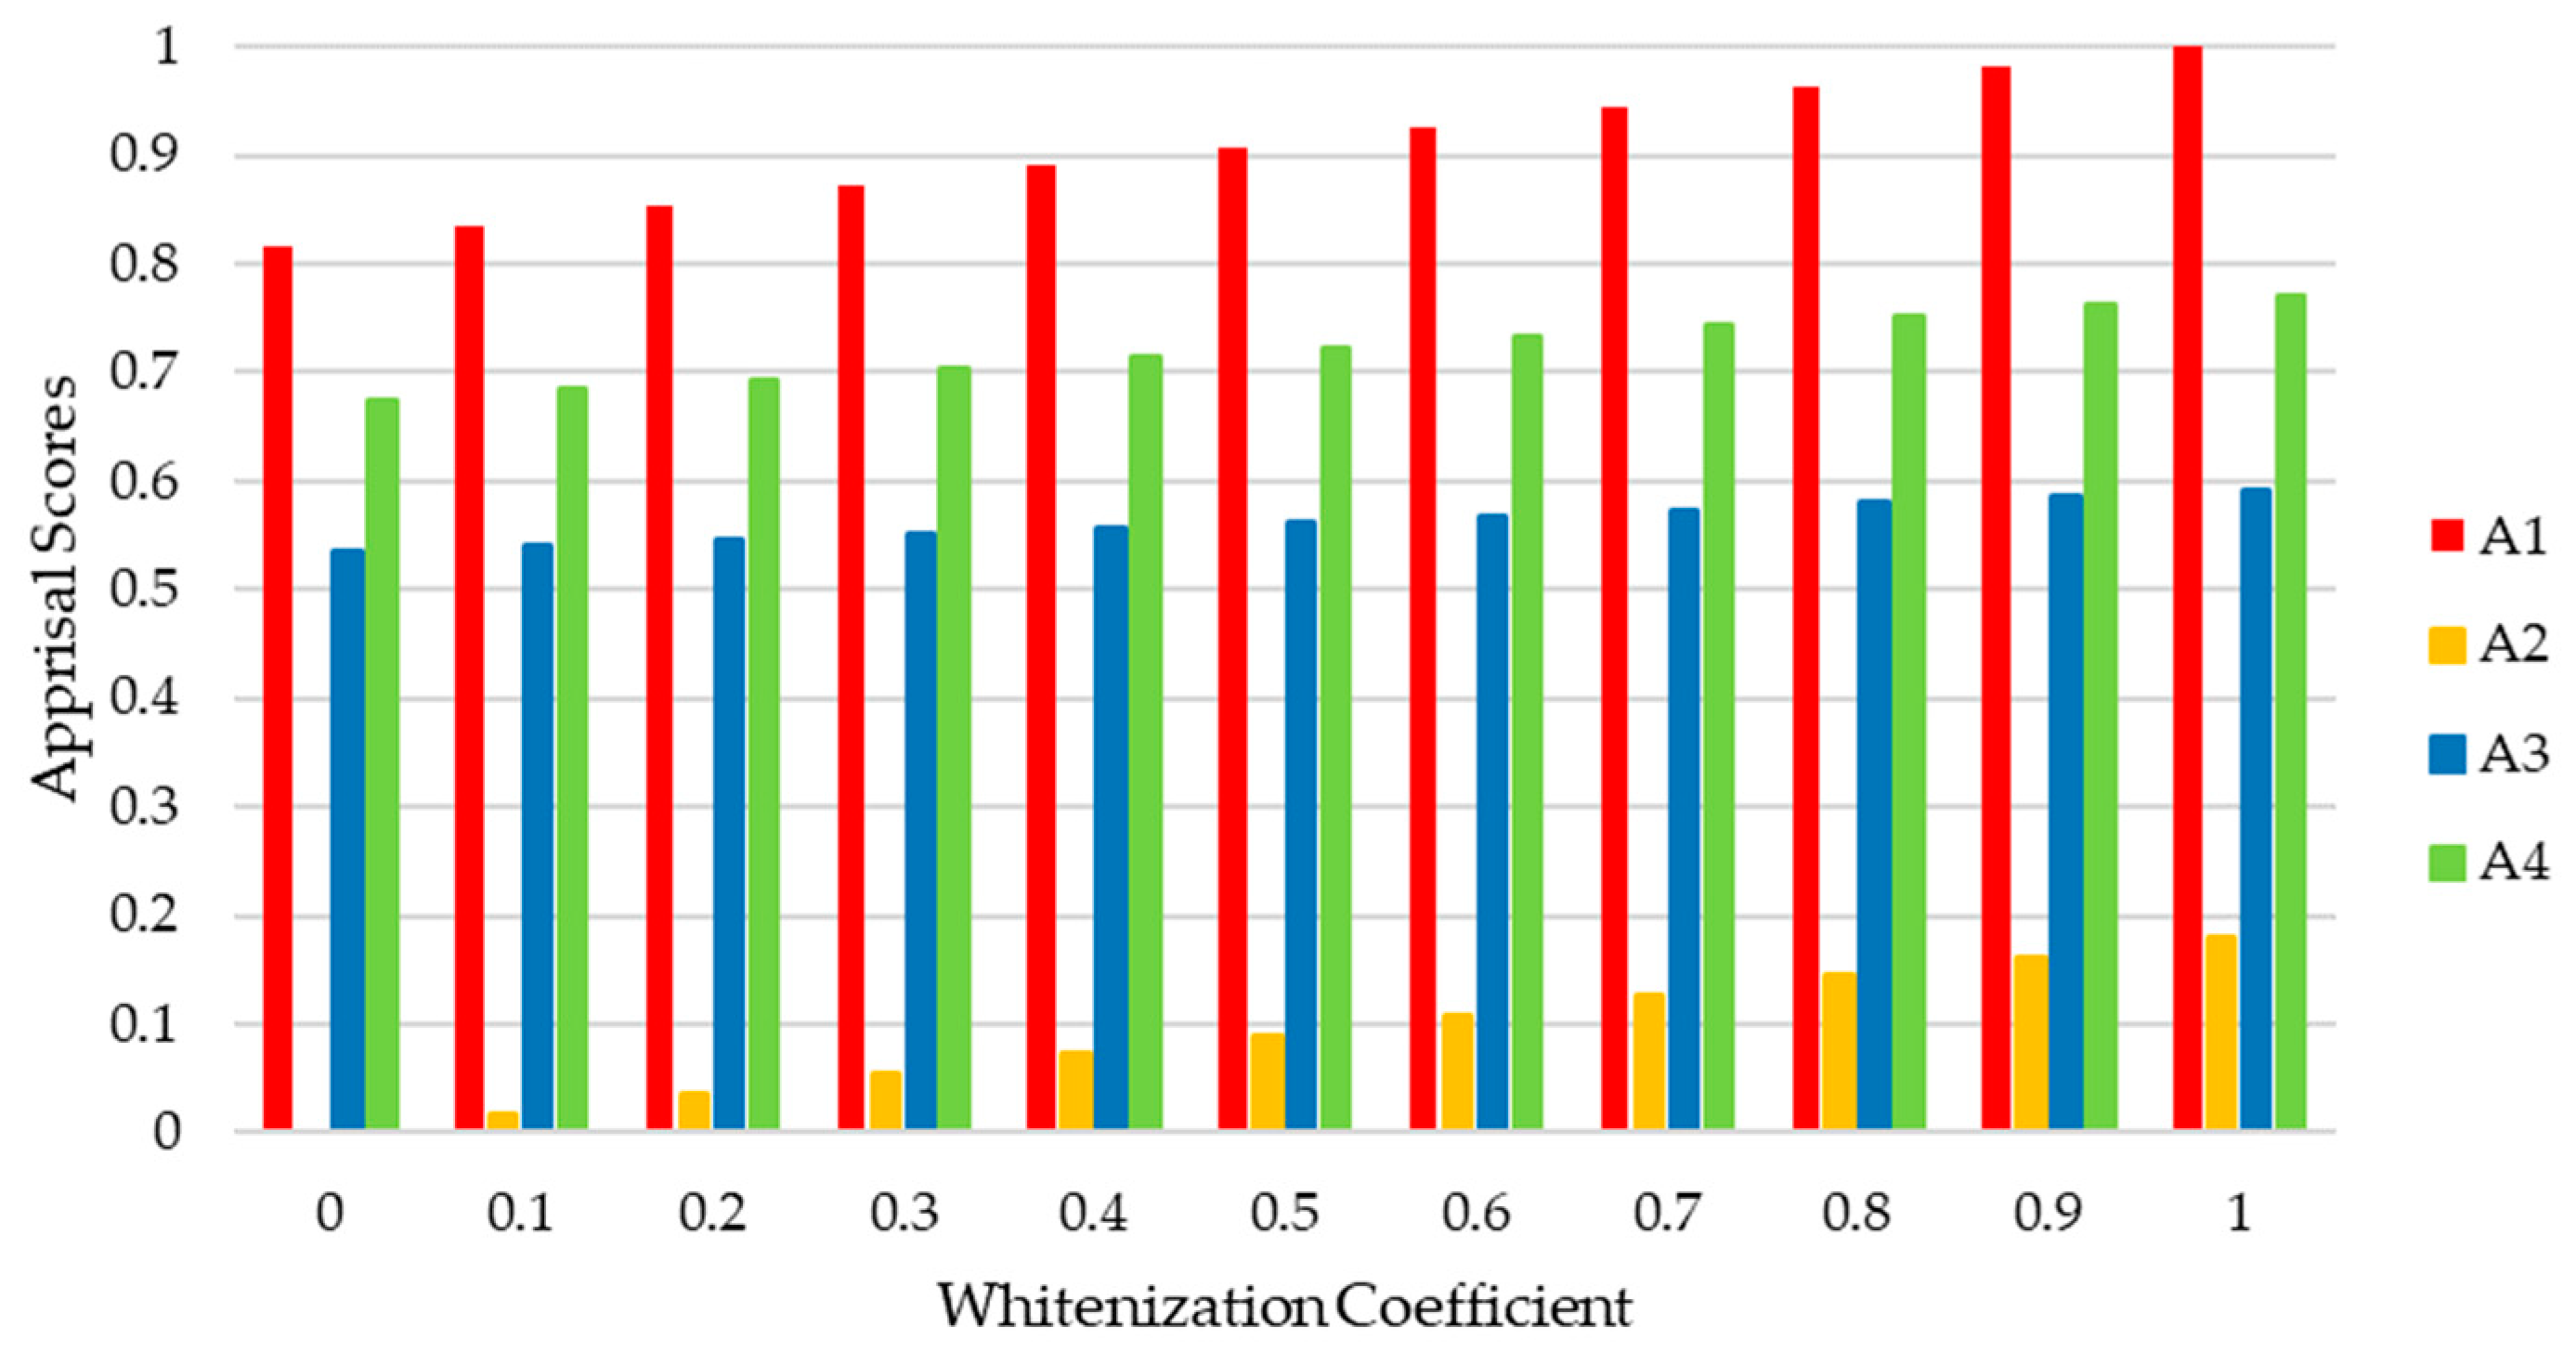
Although the GRA and EDAS evaluation methods are both comparison methods that amount to the same rankings, EDAS used more range of the evaluation scale from 0.0901 to 0.9078 for the appraisal scores (AS), on the other hand the GRA used less range of the evaluation scale from 0.6288 to 0.9703 for the grey relational grade (GRG) as shown in Figure 4. Moreover, the sensitivity analysis of the grey distinguishing coefficient ( ζ ) for the GRA and the whitenization coefficient ( λ ) for the EDAS were conducted as shown in Figure 5 and Figure 6, respectively. In this study, the rankings are not sensitive to the changes in ζ and λ . This affirms the results of selecting the first contractor as the best.

5. Conclusions

Sustainable energy solutions should embrace the use of raw material without denying the future generation using these resources. Nevertheless, not all sustainable energy solution can be regarded as the best decision, i.e., there is room to improve the decision process to maximize the benefits and minimize the associated costs. Consequently, this presents a problem of choosing the best solution, as well as choosing the best contractor that will execute the project. Obviously, it has long been known that different weighting and evaluation methods can result in different criteria weights that contribute to the rankings of different outcomes, and this kind of uncertainty can result in choosing a lesser optimal alternative. Interestingly, the GRA and EDAS resulted in the same rankings.
Most importantly, this paper presents a new hybrid method called the grey SWARA-FUCOM weighting method for evaluating contractors that will be installing a floating solar panel energy system. The case study presented in this paper applied a two-level hierarchical model consisting of 36 criteria for evaluating solar panel contractors. The DMs preferences were captured using two rounds of the questionnaires. The first round of questionnaires was for ranking the criteria, and the second round of questionnaires was customized based on the rankings obtained for the previous questionnaire to determine the relative performance of the most important to its direct next important criteria. The preferences of the group DMs were aggregated using the grey SWARA-FUCOM weighting method that was combined with the traditional GRA and EDAS method for selecting the best contractor. The rankings of the contractors applying the GRA method were consistent with the rankings using the EDAS method. To reiterate, the main contribution in the paper is the grey SWARA-FUCOM method which can be integrated with other MCDM evaluation methods in the literature.
One major limitation of this research, as is common in businesses that are run for profit, is that investors may focus on the direct financial cost of project implementation and may be passive towards the environmental impact. Moreover, customizing each comparative questionnaire based on the rankings of each DM may be considered too onerous in the application of the grey SWARA-FUCOM method. Further research could be done on extending the grey SWARA-FUCOM method to other MCDM methods, as well as solving other MCDM problems. In addition, longitudinal studies could evaluate the impact of the shadowing of a large portion of the water body, which includes the pH and O2 level change for the aquatic animal habitat. Lastly, the impact of the health of the entire water body and the economic health of the community that it supports can be further studied.

Author Contributions

Resources, Q.C. and C.O.E.; writing—original draft, Q.C. and M.O.E.; conceptualization, methodology, formal analysis and writing—review & editing, M.O.E.; data curation—C.O.E.; funding acquisition and supervision and validation, S.B.

Funding

This research was funded by Shaanxi Province Soft Science Plan-Key Projects, grant number 2015KRM039.

Conflicts of Interest

The authors declare no conflict of interest.

References

  1. CCTV News Huainan, Anhui Province: Fishing and Light Co-existence for the Development of Green Energy with a Future. Available online: http://news.cctv.com/2018/03/13/ARTIUELyKlSiJHJIkfXl9qYt180313.shtml (accessed on 10 March 2019).
  2. Dawes, R.M.; Corrigan, B. Linear models in decision making. Psychol. Bull. 1974, 81, 95. [Google Scholar] [CrossRef]
  3. Barron, F.H.; Barrett, B.E. Decision Quality Using Ranked Attribute Weights. Manag. Sci. 1996, 42, 1515–1523. [Google Scholar] [CrossRef]
  4. Barron, F.H.; Barrett, B.E. The efficacy of SMARTER—Simple Multi-Attribute Rating Technique Extended to Ranking. Acta Psychol. 1996, 93, 23–36. [Google Scholar] [CrossRef]
  5. Keršuliene, V.; Zavadskas, E.K.; Turskis, Z. Selection of rational dispute resolution method by applying new step-wise weight assessment ratio analysis (Swara). J. Bus. Econ. Manag. 2010, 11, 243–258. [Google Scholar] [CrossRef]
  6. Pamučar, D.; Stević, Ž.; Sremac, S. A New Model for Determining Weight Coefficients of Criteria in MCDM Models: Full Consistency Method (FUCOM). Symmetry 2018, 10, 393. [Google Scholar] [CrossRef]
  7. Deng, J. The Primary Methods of Grey System Theory, 1st ed.; Huazhong University of Science and Technology Press: Wuhan, China, 1987; ISBN 7-5609-0045-3. [Google Scholar]
  8. Liu, S.; Lin, Y. Introduction to Grey Systems Theory. In Grey Systems Theory and Applications; Understanding Complex Systems; Springer: Berlin/Heidelberg, Germany, 2010; ISBN 978-3-642-16157-5. [Google Scholar]
  9. Saaty, T.L. The Analytic Hierarchy Process: Planning, Priority Setting, Resource Allocation; McGraw-Hill International Book Co: New York, NY, USA; London, UK, 1980; ISBN 978-0-07-054371-3. [Google Scholar]
  10. Edwards, W.; Barron, F.H. SMARTS and SMARTER: Improved Simple Methods for Multiattribute Utility Measurement. Organ. Behav. Hum. Decis. Process. 1994, 60, 306–325. [Google Scholar] [CrossRef]
  11. Mon, D.-L.; Cheng, C.-H.; Lin, J.-C. Evaluating weapon system using fuzzy analytic hierarchy process based on entropy weight. Fuzzy Sets Syst. 1994, 62, 127–134. [Google Scholar] [CrossRef]
  12. Siksnelyte, I.; Zavadskas, E.K.; Streimikiene, D.; Sharma, D. An Overview of Multi-Criteria Decision-Making Methods in Dealing with Sustainable Energy Development Issues. Energies 2018, 11, 2754. [Google Scholar] [CrossRef]
  13. Saaty, T.L. Decision making with the analytic hierarchy process. Int. J. Serv. Sci. 2008, 1, 83. [Google Scholar] [CrossRef] [Green Version]
  14. Saaty, T.L. Decision making—The Analytic Hierarchy and Network Processes (AHP/ANP). J. Syst. Sci. Syst. Eng. 2004, 13, 1–35. [Google Scholar] [CrossRef]
  15. Zadeh, L.A. Fuzzy sets. Inf. Control 1965, 8, 338–353. [Google Scholar] [CrossRef] [Green Version]
  16. Hwang, C.-L.; Yoon, K. Multiple Attribute Decision Making; Lecture Notes in Economics and Mathematical Systems; Springer: Berlin/Heidelberg, Germany, 1981; Volume 186, ISBN 978-3-540-10558-9. [Google Scholar]
  17. Zavadskas, E.K.; Turskis, Z.; Antucheviciene, J.; Zakarevicius, A. Optimization of Weighted Aggregated Sum Product Assessment. Elektron. Elektrotech. 2012, 122, 3–6. [Google Scholar] [CrossRef]
  18. Behzadian, M.; Kazemzadeh, R.B.; Albadvi, A.; Aghdasi, M. PROMETHEE: A comprehensive literature review on methodologies and applications. Eur. J. Oper. Res. 2010, 200, 198–215. [Google Scholar] [CrossRef]
  19. Tzeng, G.-H.; Huang, J.-J. Multiple Attribute Decision Making: Methods and Applications; CRC Press: Boca Raton, FL, USA, 2011; ISBN 978-1-4398-6157-8. [Google Scholar]
  20. Roy, B. Classement et choix en présence de points de vue multiples (The ELECTRE method). RAIRO Oper. Res. Rech. Opér. 1968, 2, 57–75. [Google Scholar]
  21. Stefanović, G.; Milutinović, B.; Vučićević, B.; Denčić-Mihajlov, K.; Turanjanin, V. A comparison of the Analytic Hierarchy Process and the Analysis and Synthesis of Parameters under Information Deficiency method for assessing the sustainability of waste management scenarios. J. Clean. Prod. 2016, 130, 155–165. [Google Scholar] [CrossRef]
  22. Hafezalkotob, A.; Hafezalkotob, A.; Liao, H.; Herrera, F. An overview of MULTIMOORA for multi-criteria decision-making: Theory, developments, applications, and challenges. Inf. Fusion 2019, 51, 145–177. [Google Scholar] [CrossRef]
  23. Reshma Gopi, R.; Sreejith, S. Converter topologies in photovoltaic applications—A review. Renew. Sustain. Energy Rev. 2018, 94, 1–14. [Google Scholar] [CrossRef]
  24. Shinde, K.D.; Mane, P.B. Augmenting rooftop solar energy penetration ratio with secondary distribution network using smart inverter for maximum power transfer capacity for subordinate grid- A review. Energy Sources Part A Recovery Util. Environ. Eff. 2019, 41, 713–733. [Google Scholar] [CrossRef]
  25. Sherwani, A.F.; Usmani, J.A. Varun Life cycle assessment of solar PV based electricity generation systems: A review. Renew. Sustain. Energy Rev. 2010, 14, 540–544. [Google Scholar] [CrossRef]
  26. Akhtar, S.; Hashmi, M.K.; Ahmad, I.; Raza, R. Advances and significance of solar reflectors in solar energy technology in Pakistan. Energy Environ. 2018, 29, 435–455. [Google Scholar] [CrossRef]
  27. Akinyele, D.O.; Rayudu, R.K.; Nair, N.K.C. Global progress in photovoltaic technologies and the scenario of development of solar panel plant and module performance estimation—Application in Nigeria. Renew. Sustain. Energy Rev. 2015, 48, 112–139. [Google Scholar] [CrossRef]
  28. Topcu, Y.I. A Decision Model Proposal for Construction Contractor Selection in Turkey. Build. Environ. 2004, 39, 469–481. [Google Scholar] [CrossRef]
  29. Topcu, I.; Ülengin, F.; Kabak, Ö.; Isik, M.; Unver, B.; Onsel Ekici, S. The evaluation of electricity generation resources: The case of Turkey. Energy 2019, 167, 417–427. [Google Scholar] [CrossRef]
  30. Chang, B.; Starcher, K. Evaluation of wind and solar energy investments in Texas. Renew. Energy 2019, 132, 1348–1359. [Google Scholar] [CrossRef]
  31. Abu-Hamdeh, N.; Alnefaie, K. Techno-economic comparison of solar power tower system/photovoltaic system/wind turbine/diesel generator in supplying electrical energy to small loads. J. Taibah Univ. Sci. 2019, 13, 216–224. [Google Scholar] [CrossRef]
  32. Andrade, A.M.S.S.; Schuch, L.; da Silva Martins, M.L. Analysis and Design of High-Efficiency Hybrid High Step-Up DC–DC Converter for Distributed PV Generation Systems. IEEE Trans. Ind. Electron. 2019, 66, 3860–3868. [Google Scholar] [CrossRef]
  33. Bhattacharyya, R.; Misra, A.; Sandeep, K.C. Photovoltaic solar energy conversion for hydrogen production by alkaline water electrolysis: Conceptual design and analysis. Energy Convers. Manag. 2017, 133, 1–13. [Google Scholar] [CrossRef]
  34. Fan, Y.; Xia, X. A multi-objective optimization model for energy-efficiency building envelope retrofitting plan with rooftop PV system installation and maintenance. Appl. Energy 2017, 189, 327–335. [Google Scholar] [CrossRef] [Green Version]
  35. Tu, T.; Rajarathnam, G.P.; Vassallo, A.M. Optimization of a stand-alone photovoltaic–wind–diesel–battery system with multi-layered demand scheduling. Renew. Energy 2019, 131, 333–347. [Google Scholar] [CrossRef]
  36. Maghami, M.R.; Hizam, H.; Gomes, C.; Radzi, M.A.; Rezadad, M.I.; Hajighorbani, S. Power loss due to soiling on solar panel: A review. Renew. Sustain. Energy Rev. 2016, 59, 1307–1316. [Google Scholar] [CrossRef] [Green Version]
  37. Wang, C.-N.; Su, C.-C.; Nguyen, V.T. Nuclear Power Plant Location Selection in Vietnam under Fuzzy Environment Conditions. Symmetry 2018, 10, 548. [Google Scholar] [CrossRef]
  38. Liu, R.; Sun, H.; Zhang, L.; Zhuang, Q.; Zhang, L.; Zhang, X.; Chen, Y. Low-Carbon Energy Planning: A Hybrid MCDM Method Combining DANP and VIKOR Approach. Energies 2018, 11, 3401. [Google Scholar] [CrossRef]
  39. Nie, R.; Wang, J.; Zhang, H. Solving Solar-Wind Power Station Location Problem Using an Extended Weighted Aggregated Sum Product Assessment (WASPAS) Technique with Interval Neutrosophic Sets. Symmetry 2017, 9, 106. [Google Scholar] [CrossRef]
  40. Cui, W.; Ye, J. Improved Symmetry Measures of Simplified Neutrosophic Sets and Their Decision-Making Method Based on a Sine Entropy Weight Model. Symmetry 2018, 10, 225. [Google Scholar] [CrossRef]
  41. Samee, K.; Pongpeng, J. Structural equation model for construction equipment selection and contractor competitive advantages. KSCE J. Civ. Eng. 2016, 20, 77–89. [Google Scholar] [CrossRef]
  42. Lines, B.C.; Kumar, G.G.R. Developing More Competitive Proposals: Relationship between Contractor Qualifications-Based Proposal Content and Owner Evaluation Scores. J. Constr. Eng. Manag. 2018, 144, 04018030. [Google Scholar] [CrossRef]
  43. Khatri, R. Design and assessment of solar PV plant for girls hostel (GARGI) of MNIT University, Jaipur city: A case study. Energy Rep. 2016, 2, 89–98. [Google Scholar] [CrossRef] [Green Version]
  44. Mokhlesian, S. How Do Contractors Select Suppliers for Greener Construction Projects? The Case of Three Swedish Companies. Sustainability 2014, 6, 4133–4151. [Google Scholar] [CrossRef] [Green Version]
  45. Alhumaidi, H.M. Construction Contractors Ranking Method Using Multiple Decision-Makers and Multiattribute Fuzzy Weighted Average. J. Constr. Eng. Manag. 2015, 141, 04014092. [Google Scholar] [CrossRef]
  46. Akcay, C.; Manisali, E. Fuzzy decision support model for the selection of contractor in construction works. Rev. Constr. J. Constr. 2018, 17, 258–266. [Google Scholar]
  47. An, X.; Wang, Z.; Li, H.; Ding, J. Project Delivery System Selection with Interval-Valued Intuitionistic Fuzzy Set Group Decision-Making Method. Group Decis. Negot. 2018, 27, 689–707. [Google Scholar] [CrossRef]
  48. Tomczak, M.; Jaśkowski, P. Application of Type-2 Interval Fuzzy Sets to Contractor Qualification Process. KSCE J. Civ. Eng. 2018, 22, 2702–2713. [Google Scholar] [CrossRef]
  49. El-Abbasy, M.S.; Zayed, T.; Ahmed, M.; Alzraiee, H.; Abouhamad, M. Contractor Selection Model for Highway Projects Using Integrated Simulation and Analytic Network Process. J. Constr. Eng. Manag. 2013, 139, 755–767. [Google Scholar] [CrossRef]
  50. Senthil, S.; Srirangacharyulu, B.; Ramesh, A. A robust hybrid multi-criteria decision making methodology for contractor evaluation and selection in third-party reverse logistics. Expert Syst. Appl. 2014, 41, 50–58. [Google Scholar] [CrossRef]
  51. Taylan, O.; Kabli, M.R.; Porcel, C.; Herrera-Viedma, E. Contractor Selection for Construction Projects Using Consensus Tools and Big Data. Int. J. Fuzzy Syst. 2018, 20, 1267–1281. [Google Scholar] [CrossRef]
  52. Leśniak, A.; Kubek, D.; Plebankiewicz, E.; Zima, K.; Belniak, S. Fuzzy AHP Application for Supporting Contractors’ Bidding Decision. Symmetry 2018, 10, 642. [Google Scholar] [CrossRef]
  53. Wang, T.-C.; Tsai, S.-Y. Solar Panel Supplier Selection for the Photovoltaic System Design by Using Fuzzy Multi-Criteria Decision Making (MCDM) Approaches. Energies 2018, 11, 1989. [Google Scholar] [CrossRef]
  54. Yang, X.-S. Multi-Objective Optimization. In Nature-Inspired Optimization Algorithms; Elsevier: Amsterdam, The Netherlands, 2014; pp. 197–211. ISBN 978-0-12-416743-8. [Google Scholar]
  55. Mollahassani-Pour, M.; Rashidinejad, M.; Pourakbari-Kasmaei, M. Environmentally constrained reliability-based generation maintenance scheduling considering demand-side management. IET Gener. Transm. Distrib. 2018, 13, 1153–1163. [Google Scholar] [CrossRef]
  56. Pourakbari-Kasmaei, M.; Rider, M.J.; Mantovani, J.R.S. An unequivocal normalization-based paradigm to solve dynamic economic and emission active-reactive OPF (optimal power flow). Energy 2014, 73, 554–566. [Google Scholar] [CrossRef]
  57. Rezaei, J. Best-worst multi-criteria decision-making method. Omega 2015, 53, 49–57. [Google Scholar] [CrossRef]
  58. Nunić, Z.B. Evaluation and selection of Manufacturer PVC carpentry using FUCOM-MABAC model. Oper. Res. Eng. Sci. Theory Appl. 2018, 1, 13–28. [Google Scholar] [CrossRef]
  59. Pamučar, D.; Lukovac, V.; Božanić, D.; Komazec, N. Multi-criteria FUCOM-MAIRCA model for the evaluation of level crossings: Case study in the Republic of Serbia. Oper. Res. Eng. Sci. Theory Appl. 2018, 1, 108–129. [Google Scholar] [CrossRef]
  60. Badi, I.; Abdulshahed, A. Ranking the Libyan airlines by using Full Consistency Method (FUCOM) and Analytical Hierarchy Process (AHP). Oper. Res. Eng. Sci. Theory Appl. 2019, 2, 1–14. [Google Scholar] [CrossRef] [Green Version]
  61. Fazlollahtabar, H.; Smailbašić, A.; Stević, Ž. FUCOM method in group decision-making: Selection of forklift in a warehouse. Decis. Mak. Appl. Manag. Eng. 2019, 2, 49–65. [Google Scholar] [CrossRef]
  62. Deng, J. Introduction to Grey System Theory. J. Grey Syst. 1989, 1, 1–24. [Google Scholar]
  63. Lin, C.-C.; He, R.-X.; Liu, W.-Y. Considering Multiple Factors to Forecast CO2 Emissions: A Hybrid Multivariable Grey Forecasting and Genetic Programming Approach. Energies 2018, 11, 3432. [Google Scholar] [CrossRef]
  64. Liu, S.; Lin, Y. Grey Information: Theory and Practical Applications; Advanced Information and Knowledge Processing; Springer: London, UK, 2006; ISBN 978-1-85233-995-1. [Google Scholar]
  65. Home-Ortiz, J.M.; Melgar-Dominguez, O.D.; Pourakbari-Kasmaei, M.; Mantovani, J.R.S. A stochastic mixed-integer convex programming model for long-term distribution system expansion planning considering greenhouse gas emission mitigation. Int. J. Electr. Power Energy Syst. 2019, 108, 86–95. [Google Scholar] [CrossRef]
  66. Gorissen, B.L.; Yanıkoğlu, İ.; den Hertog, D. A practical guide to robust optimization. Omega 2015, 53, 124–137. [Google Scholar] [CrossRef] [Green Version]
  67. Esangbedo, M.O.; Che, A. Evaluating Business Environment in Africa Using Grey Number Weights. J. Grey Syst. 2016, 28, 26–47. [Google Scholar]
  68. Esangbedo, M.O.; Che, A. Grey Weighted Sum Model for Evaluating Business Environment in West Africa. Math. Probl. Eng. 2016, 2016. [Google Scholar] [CrossRef]
  69. Zhao, L.; Zhou, X. Forecasting Electricity Demand Using a New Grey Prediction Model with Smoothness Operator. Symmetry 2018, 10, 693. [Google Scholar] [CrossRef]
  70. Zavadskas, E.K.; Čereška, A.; Matijošius, J.; Rimkus, A.; Bausys, R. Internal Combustion Engine Analysis of Energy Ecological Parameters by Neutrosophic MULTIMOORA and SWARA Methods. Energies 2019, 12, 1415. [Google Scholar] [CrossRef]
  71. Puri, D.; Tiwari, S. Evaluating the Criteria for Contractors’ Selection and Bid Evaluation. Int. J. Eng. Sci. Invent. 2014, 3, 44–48. [Google Scholar]
  72. Chiang, F.-Y.; Vincent, F.Y.; Luarn, P. Construction Contractor Selection in Taiwan Using AHP. Int. J. Eng. Technol. 2017, 9, 211–215. [Google Scholar] [CrossRef] [Green Version]
  73. Rashvand, P.; Abd Majid, M.Z.; Baniahmadi, M.; Ghavamirad, F. Contractor Selection at Prequalification Stage: Current Evaluation and Shortcomings. J. Teknol. 2015, 77. [Google Scholar] [CrossRef]
  74. Mahdi, I.M.; Riley, M.J.; Fereig, S.M.; Alex, A.P. A multi-criteria approach to contractor selection. Eng. Constr. Archit. Manag. 2002, 10, 29–37. [Google Scholar]
  75. Salama, M.; El Aziz, H.A.; El Sawah, H.; El Samadony, A. Investigating the Criteria for Contractors’ Selection and Bid Evaluation in Egypt. Management 2006, 3, 531–540. [Google Scholar]
  76. Hasnain, M.; Thaheem, M.J.; Ullah, F. Best Value Contractor Selection in Road Construction Projects: ANP-Based Decision Support System. Int. J. Civ. Eng. 2018, 16, 695–714. [Google Scholar] [CrossRef]
  77. Hatush, Z.; Skitmore, M. Contractor selection using multicriteria utility theory: An additive model. Build. Environ. 1998, 33, 105–115. [Google Scholar] [CrossRef] [Green Version]
  78. Kumaraswamy, M.M. Contractor evaluation and selection: A Hong Kong perspective. Build. Environ. 1996, 31, 273–282. [Google Scholar] [CrossRef]
  79. Alptekin, O.; Alptekin, N. Analysis of Criteria Influencing Contractor Selection Using TOPSIS Method. IOP Conf. Ser. Mater. Sci. Eng. 2017, 245, 062003. [Google Scholar] [CrossRef] [Green Version]
  80. Girard, J.; Girard, J. Defining knowledge management: Toward an applied compendium. Online J. Appl. Knowl. Manag. 2015, 3, 20. [Google Scholar]
  81. Popper, M.; Lipshitz, R. Organizational Learning: Mechanisms, Culture, and Feasibility. In Essential Readings in Management Learning Essential Readings in Management Learning; SAGE Publications Ltd.: London, UK, 2004; pp. 37–52. ISBN 978-1-4129-0142-0. [Google Scholar] [Green Version]
  82. Koskela, L.; Howell, G. The Theory of Project Management: Explanation to Novel Methods. In Proceedings of the IGLC, Gramado, Brazil, 10 August 2002. [Google Scholar]
  83. Singh, D.; Tiong, R.L. A Fuzzy Decision Framework for Contractor Selection. J. Constr. Eng. Manag. 2005, 131, 62–70. [Google Scholar] [CrossRef]
  84. Plebankiewicz, E. Model of Predicting Cost Overrun in Construction Projects. Sustainability 2018, 10, 4387. [Google Scholar] [CrossRef]
  85. Araujo, M.C.B.; Alencar, L.H.; Mota, C.M.M. Contractor selection in construction industry: A multicriteria model. In Proceedings of the 2015 IEEE International Conference on Industrial Engineering and Engineering Management (IEEM), Singapore, 6–9 December 2015; pp. 519–523. [Google Scholar]
  86. Liefers, M. Contractor Selection Criteria and Public Infrastructure Project Success: An exploratory Study among Public Infrastructure Principals. Master’s Thesis, Open University in the Netherlands, Heerlen, The Netherlands, 2012. [Google Scholar]
  87. Yang, J.-B.; Wang, W.-C. Contractor selection by the most advantageous tendering approach in Taiwan. J. Chin. Inst. Eng. 2003, 26, 381–387. [Google Scholar] [CrossRef]
  88. Dawood, H. Theories of Interval Arithmetic: Mathematical Foundations and Applications; LAP LAMBERT Academic Publishing, 2011; ISBN 978-3-8465-0154-2. [Google Scholar]
Figure 1. Hierarchical diagram for evaluating solar panel contractor.
Energies 12 02481 g001
Figure 2. Evaluation process using the grey stepwise weight analysis ratio assessment-full consistent method (SWARA-FUCOM) with grey relational analysis (GRA) and evaluation based on distance from average solution (EDAS).
Energies 12 02481 g002
Figure 3. Grey SWARA-FUCOM weights.
Energies 12 02481 g003
Figure 4. Ratings by the grey relational analysis (GRA) and evaluation based on distance from average solution (EDAS) based on grey SWARA-FUCOM weights.
Energies 12 02481 g004
Figure 5. Grey distinguishing coefficient sensitivity analysis of the GRA.
Energies 12 02481 g005
Figure 6. Whitenization coefficient sensitivity analysis for EDAS.
Energies 12 02481 g006
Table 1. Raw data of the decision-makers’ (DMs) rankings.
CriteriaDM1DM2DM3DM4CriteriaDM1DM2DM3DM4
C16th6th6th6thC332nd1st3rd2nd
C24th1st1st3rdC341st2nd2nd3rd
C35th5th4th4thC353rd3rd5th4th
C42nd3rd2nd5thC413rd1st4th1st
C51st4th5th2ndC422nd4th3rd2nd
C63rd2nd3rd1stC434th5th5th5th
C1-15th5th3rd3rdC445th2nd2nd4th
C1-21st4th5th4thC451st3rd1st3rd
C1-34th3rd2nd1stC512nd5th1st1st
C1-42nd2nd1st2ndC523rd4th4th3rd
C1-53rd1st4th5thC531st3rd5th2nd
C2-12nd4th5th1stC544th1st2nd5th
C2-25th5th3rd4thC555th2nd3rd4th
C2-31st3rd4th2ndC611st4th1st1st
C2-43rd2nd2nd5thC624th3rd5th3rd
C2-54th1st1st3rdC633rd2nd2nd2nd
C3-14th5th1st1stC642nd1st3rd4th
C3-25th4th4th5thC655th5th4th5th
Table 2. Raw data of the comparison.
CriteriaRankingsDM2DM3DM4DM5
First-level1st----
2nd4258
3rd3845
4th8585
5th5454
6th5563
Second-level of C11st----
2nd5244
3rd5346
4th4453
5th3543
Second-level of C21st----
2nd5455
3rd4375
4th3444
5th6365
Second-level of C31st----
2nd4344
3rd4455
4th4453
5th3564
Second-level of C41st----
2nd3346
3rd3569
4th4365
5th3444
Second-level of C51st----
2nd5349
3rd3465
4th3353
5th3444
Second-level of C61st----
2nd6377
3rd3365
4th3545
5th5554
Table 3. Estimated weights for DM1 based on the stepwise weight analysis ratio assessment (SWARA) weighting method.
RankingsFirst-Level Criteria (Cj)Comparative Importance of Average, s j Coefficient, k j = s j + 1 Re-Calculated Weights, w j = x j 1 k j Scaled Weights, q j = w j j = 1 m w j
1st(C5)-1.00001.00000.2480
2nd(C4)0.08331.08330.92310.2289
3rd(C6)0.05561.13890.81050.2010
4th(C2)0.19441.33330.60790.1507
5th(C3)0.11111.44440.42080.1044
6th(C4)0.11111.55560.27050.0671
Table 4. Computed SWARA and full consistent method (FUCOM) weights for each DM.
CriteriaSWARAFUCOM
DM1DM2DM3DM4DM1DM2DM3DM4
C10.06710.06790.05840.05660.08790.08790.08580.1581
C20.15070.24610.26470.18710.08790.43960.5150.0949
C30.10440.10370.14360.13210.10990.10990.06440.0949
C40.22890.19590.23820.08810.21980.05490.1030.1186
C50.2480.14690.09570.24430.43960.08790.1030.0593
C60.2010.23940.19940.29180.05490.21980.12880.4743
C1-10.11460.1420.20880.11940.16810.08760.12820.16
C1-20.1560.18140.24370.26930.12610.10950.12820.48
C1-30.20370.21170.16340.20340.10080.1460.10260.08
C1-40.2490.22930.2640.24860.10080.2190.51280.12
C1-50.27660.23570.12010.15920.50420.4380.12820.16
C6-10.15940.17820.09090.18640.16390.09680.16390.1116
C6-20.19920.21770.24720.13420.16390.16130.16390.1116
C6-30.23790.24190.18940.09120.0820.16130.0820.1394
C6-40.2710.25540.28840.27790.49180.48390.49180.5578
C6-50.11710.13360.13640.23820.09840.09680.09840.0797
Table 5. Overall weights using the SWARA method.
First-Level CriteriaLocal Weights ( w α s ) Second-Level CriteriaIndex (v)Local Weights ( w α β s ) Effective Weights ( w v s )
C10.0625C1-110.14620.0091
C1-220.21260.0133
C1-330.19560.0122
C1-440.24770.0155
C1-550.19790.0124
C60.2329C6-1260.1580.0368
C6-2270.20520.0478
C6-3280.19540.0455
C6-4290.28080.0654
C6-5300.16070.0374
Table 6. Overall weights using the FUCOM method.
First-Level CriteriaLocal Weights ( w α f ) Second-Level CriteriaIndex (v)Local Weights ( w α β f ) Effective Weights ( w v f )
C10.1049C1-110.1360.0143
C1-220.21090.0221
C1-330.10730.0113
C1-440.23820.025
C1-550.30760.0323
C60.2194C6-1260.1340.0294
C6-2270.15020.033
C6-3280.11620.0255
C6-4290.50630.1111
C6-5300.09330.0205
Table 7. Ratings (%) of the contractors based on their proposals.
CriteriaIndexA1A2A3A4CriteriaIndexA1A2A3A4
C11186.257078.584.25C411683.7567.573.7578.75
C12282.2556.2577.580C42178068.757075
C13382.557.573.7580C431881.256078.7578.75
C14482.561.257580C441982.56577.575
C15586.2571.2572.575C452082.56576.2578.75
C21682.561.2571.2588.75C512182.568.7583.7582.5
C22786.256578.7587.5C522279.337082.585
C2388058.757581.25C53238567.582.577.5
C24986.256077.585C542488.33657575
C25108758.7578.7583.75C552576.6773.758077.5
C311184.562.58080C612681.6766.2576.2580
C321286.2567.577.577.5C622788.3367.577.580.75
C331385.567.577.579.5C63288062.581.2578.75
C341482.562.577.575C642983.336078.7581.25
C351582.568.7573.7575C653088.3361.2581.2578.75