1. Introduction
Electric power is one of the basic conditions for the rapid development of modern society. As support systems for industrial production and residential electricity consumption, power supply and demand system have multiple influencing factors, and complex mechanisms of interaction exist among these factors. On the one hand, a power supply and demand system covers the entire process of power production, transmission, and consumption, and changes in each link will have an impact on the overall state of the system. On the other hand, a power supply and demand system will interact with external systems such as the economy, society, resources and the environment. The blind development of any system will lead to the disorder of other systems. Therefore, the internal and external factors of a power supply and demand system must reach a relatively balanced state to meet the needs of sustainable development.
As the most populous country in the world, China had a total installed capacity of 1777 GW and a total electricity consumption of 6307.7 billion kWh at the end of 2017, representing an increase of 425.86% and 328.41% compared to 2001, respectively [
1]. With the increasing level of urbanization and industrialization, the scale of China’s power supply and demand system has expanded rapidly in the past decade. However, long-standing structural problems still restrict the effective development of China’s power supply and demand system. From the cumulative installed capacity and power supply structure shown in
Figure 1 and
Figure 2, respectively [
2], it is clear that, despite the rapid growth of China’s power installation in recent years, it is still dominated by coal power. In comparison, the power supply structure in developed countries such as the United States are more balanced and diversified. The coal-dominated structure of China’s power supply and demand system has brought about many negative effects. For instance, excessive reliance on coal for power generation has not only accelerated the exhaustion of fossil energy resources but has also caused the problems of high comprehensive energy consumption and low power supply efficiency.
With the rapid development of China’s power supply and demand system, power engineering construction and power production activities have had irreversible negative impacts on the ecological environment. For example, atmospheric pollutants and greenhouse gases emitted by thermal power plants have gradually caused permafrost melting, ice shelf collapse, regional haze pollution, and other environmental problems. China is now the largest emitter of energy-related carbon dioxide, accounting for 28% of the world’s total.
Figure 3 [
2] shows the growth trend of China’s carbon dioxide emissions over the past decade. More than half of China’s coal consumption is used for power production, and the carbon dioxide emissions of the Chinese power industry account for more than 45% of total emissions. The rapid expansion of China’s power supply and demand system has led to the aggravation of environmental pollution and represents a serious threat to the sustainable development of resources, the environment, and ecology.
Based on the above analysis, it can be seen that the development of China’s power supply and demand system is not only restricted by the internal structure of the system, but also by multiple factors such as the social economy and ecological environment. As the scale of China’s power supply and demand system is expanding rapidly, the internal and external sustainable development problems are becoming increasingly prominent. Therefore, it is of great importance to obtain a better understanding of the sustainability trend of China’s power supply and demand system in recent years, and to analyze the main factors that constrain the sustainable development of the system. In this research, dynamic evolution simulation is used to deeply analyze the process mechanisms of various elements of China’s power supply and demand system, and interactions between the elements. Based on this, a new evaluation index system and a comprehensive evaluation model will be constructed to analyze the sustainable development status and bottleneck of China’s power supply and demand system. Moreover, effective strategies are proposed, which could be helpful for the optimal development of China’s power supply and demand system.
2. Literature Review
There have been various studies on the sustainability of power systems in recent years. These mainly focus on the optimization of power systems and its external effects:
- (1)
Optimization of power systems: Recently, the sustainability of renewable energy, such as solar and wind energy, has been widely studied. Sun et al. pointed out the potential of renewable energy in China and evaluated the sustainability of different development schemes through comparison [
3]. Hosenuzzaman et al. systematically reviewed the literature on photovoltaic (PV) power generation technology and its application [
4]. Sahoo discussed the development and application of PV power generation in India and the policy mechanism introduced by the government to promote its development [
5]. Yu and Halog evaluated the sustainability of PV power generation in Australia from the perspective of the whole life cycle, and put forward relevant development suggestions for both PV manufacturing and the government [
6]. Kumar et al. investigated the necessity for the deployment of renewable energy sources and discussed various wind energy technologies and their applications [
7]. With the rapid development of renewable energy, national energy needs to be included in the power generation portfolio for consideration. Ahn and Lee applied least-cost and cost-risk optimization models to energy sources allocation [
8]. Nie et al. constructed an interval type-2 fuzzy fractional programming (IT2FFP) method to program the renewable energy in a power system in order to support the sustainable development under uncertainty [
9]. Additionally, traditional power generation technology is also breaking through. Lisin et al. proposed a combined algorithm, which can help optimize the production structure of thermal power plants and improve the steady-state problem in a power system [
10]. Chen et al. explored the typical mode of installing efficient thermoelectric generators in cogeneration equipment to utilize waste heat, and analyzed its overall conversion efficiency and external benefits [
11].
- (2)
The external effects of power systems: Related research focuses on the economic and environmental impacts of power system. Based on the concept of sustainable development, Zhao and Guo evaluated the external benefits of renewable energy in China from the perspective of economic, social and environmental factors [
12]. Needleman et al. used cost modeling to explore the current economic viability of PV power generation technology [
13]. The risk analysis of energy system are more and more concerned due to the uncertainty of demand and the intermittency of supply. For the risk analysis of micro energy grids (MEGs), Gabbar and Koraz developed a hazard matrix for a MEG and two advanced risk assessment methods, and proposed a resilient MEG configuration model composed of many independent protection layers (IPLs) to improve its safety integrity level [
14,
15]. The emission of greenhouse gases and pollutants is a key issue for the sustainable development of power systems. Shi et al. used panel data to assess the spatiotemporal dynamics of carbon dioxide emissions in China from a multi-scale perspective [
16]. Zhong et al. designed a new energy-saving power generation dispatch (ESGD) framework was proven to be able to further reduce energy consumption and reduce pollutant emissions [
17]. Sumabat et al. used the logarithmic mean Divisia index (LMDI) to qualify the drivers of carbon emissions in the Philippines [
18]. Yu and Zhou respectively developed a two-stage interval probability planning (TIPP) method and fuzzy interval probability planning (FIPP) method, which were used to plan carbon emission trading in power systems and reduce carbon dioxide emission [
19,
20].
In order to realize the quantitative evaluation of sustainability, the concept of a sustainability index has been proposed. This innovative concept combines the results of qualitative and quantitative analysis and has the characteristics of adaptivity and multiple criteria. Farfan and Breyer introduced new sustainability indicators that can be used to analyze the environmental and social sustainability boundaries of various power generation methods [
21]. Raza et al. proposed a new sustainable development index which focuses on environmental and economic factors, to compare the sustainability of different energy storage options [
22]. Kostevsek et al. assessed the sustainability of the Slovenian locally integrated energy sector (LIES) using four dimensions, namely energy, environment, economy, and society [
23]. Based on the concept of sustainable development, Sun et al. established a multi-dimensional index system to evaluate the sustainable development level (SDI) of an active distribution network (ADN). The indicators are mainly related to social, economic, and environmental aspects [
24]. From the above analysis, it can be seen that the sustainability index of a power supply and demand system mainly focuses on the impact of the system on external systems, and does not involve analysis of the internal factors of the system or analysis of externalities to comprehensively evaluate its sustainability in research. Therefore, determining how to quantitatively and comprehensively evaluate the sustainability of power supply and demand systems has strong research value. This research comprehensively considers the internal factors and external effects of a power supply and demand system, proposes a novel index system for the evaluation of the sustainability of such systems from the perspectives of total amount, system structure, technology, and environment, and constructs an evaluation model, which is of great significance for the quantitative evaluation of the sustainability of power supply and demand systems.
3. Methodology
The methodology of this research is shown in
Figure 4.
Firstly, by deepening the interaction mechanisms between the power supply and demand systems, the economic system, the social system and the environmental system, the coordination mechanism of various elements among the systems was determined, and the causal feedback loop between various elements was described by using the system dynamics (SD) theory. On this basis, an SD model of the power supply and demand system was constructed, and the reliability of the model was proved by a historical test and a system operation test.
Secondly, based on the target stratification method, indices were selected based on the three dimensions of support, pressure, and state, and an index system was proposed for the evaluation of the sustainability of a power supply and demand system consisting of the four factor layers of total amount, structure, technology and environment.
Then, by integrating the Principal Component Analysis (PCA) method and the State Space (SS) method, a PCA-SS evaluation model was constructed to quantitatively analyze the sustainable development status of the target layer and the element layers of China’s power supply and demand system. According to the analysis results, a sustainable development bottleneck was identified, and some optimization strategies were proposed based on this.
4. Dynamic Evolution Simulation Analysis of a Power Supply and Demand System
4.1. Analysis of the Evolution Mechanism
An analysis of the evolution mechanism of a power supply and demand system can reveal the internal structure of the system and the interaction between it and external systems, and support the evaluation of the sustainability of the system. Power supply and demand can be regarded as a huge complex system, in which the power supply and demand system, social system, economic system and environmental system restrict and influence each other.
Figure 5 briefly shows the mechanism of interaction among the systems [
23].
Based on the analysis of the interaction among the systems, a causal feedback diagram of system elements was produced, as shown in
Figure 6.
As can be seen from
Figure 6, the power supply and demand system and the social, economic, and environmental systems are interrelated and mutually constrained. On the one hand, power consumption is affected by population, and plays an important role in promoting social development. On the other hand, economic system and the power supply and demand system are mutually causal. Economic growth promotes the increase of power consumption, and the increase of power consumption can also guarantee economic development. At the same time, with the growth of power demand in industry and life, pollutant emissions are continuing to increase, and ecological and environmental problems are becoming more and more prominent. If the Chinese government’s investment in science and technology and environmental protection increases, pollutant emissions could be controlled. Therefore, the power supply and demand system and the environmental system also have a causal relationship.
4.2. Construction of Simulation Model
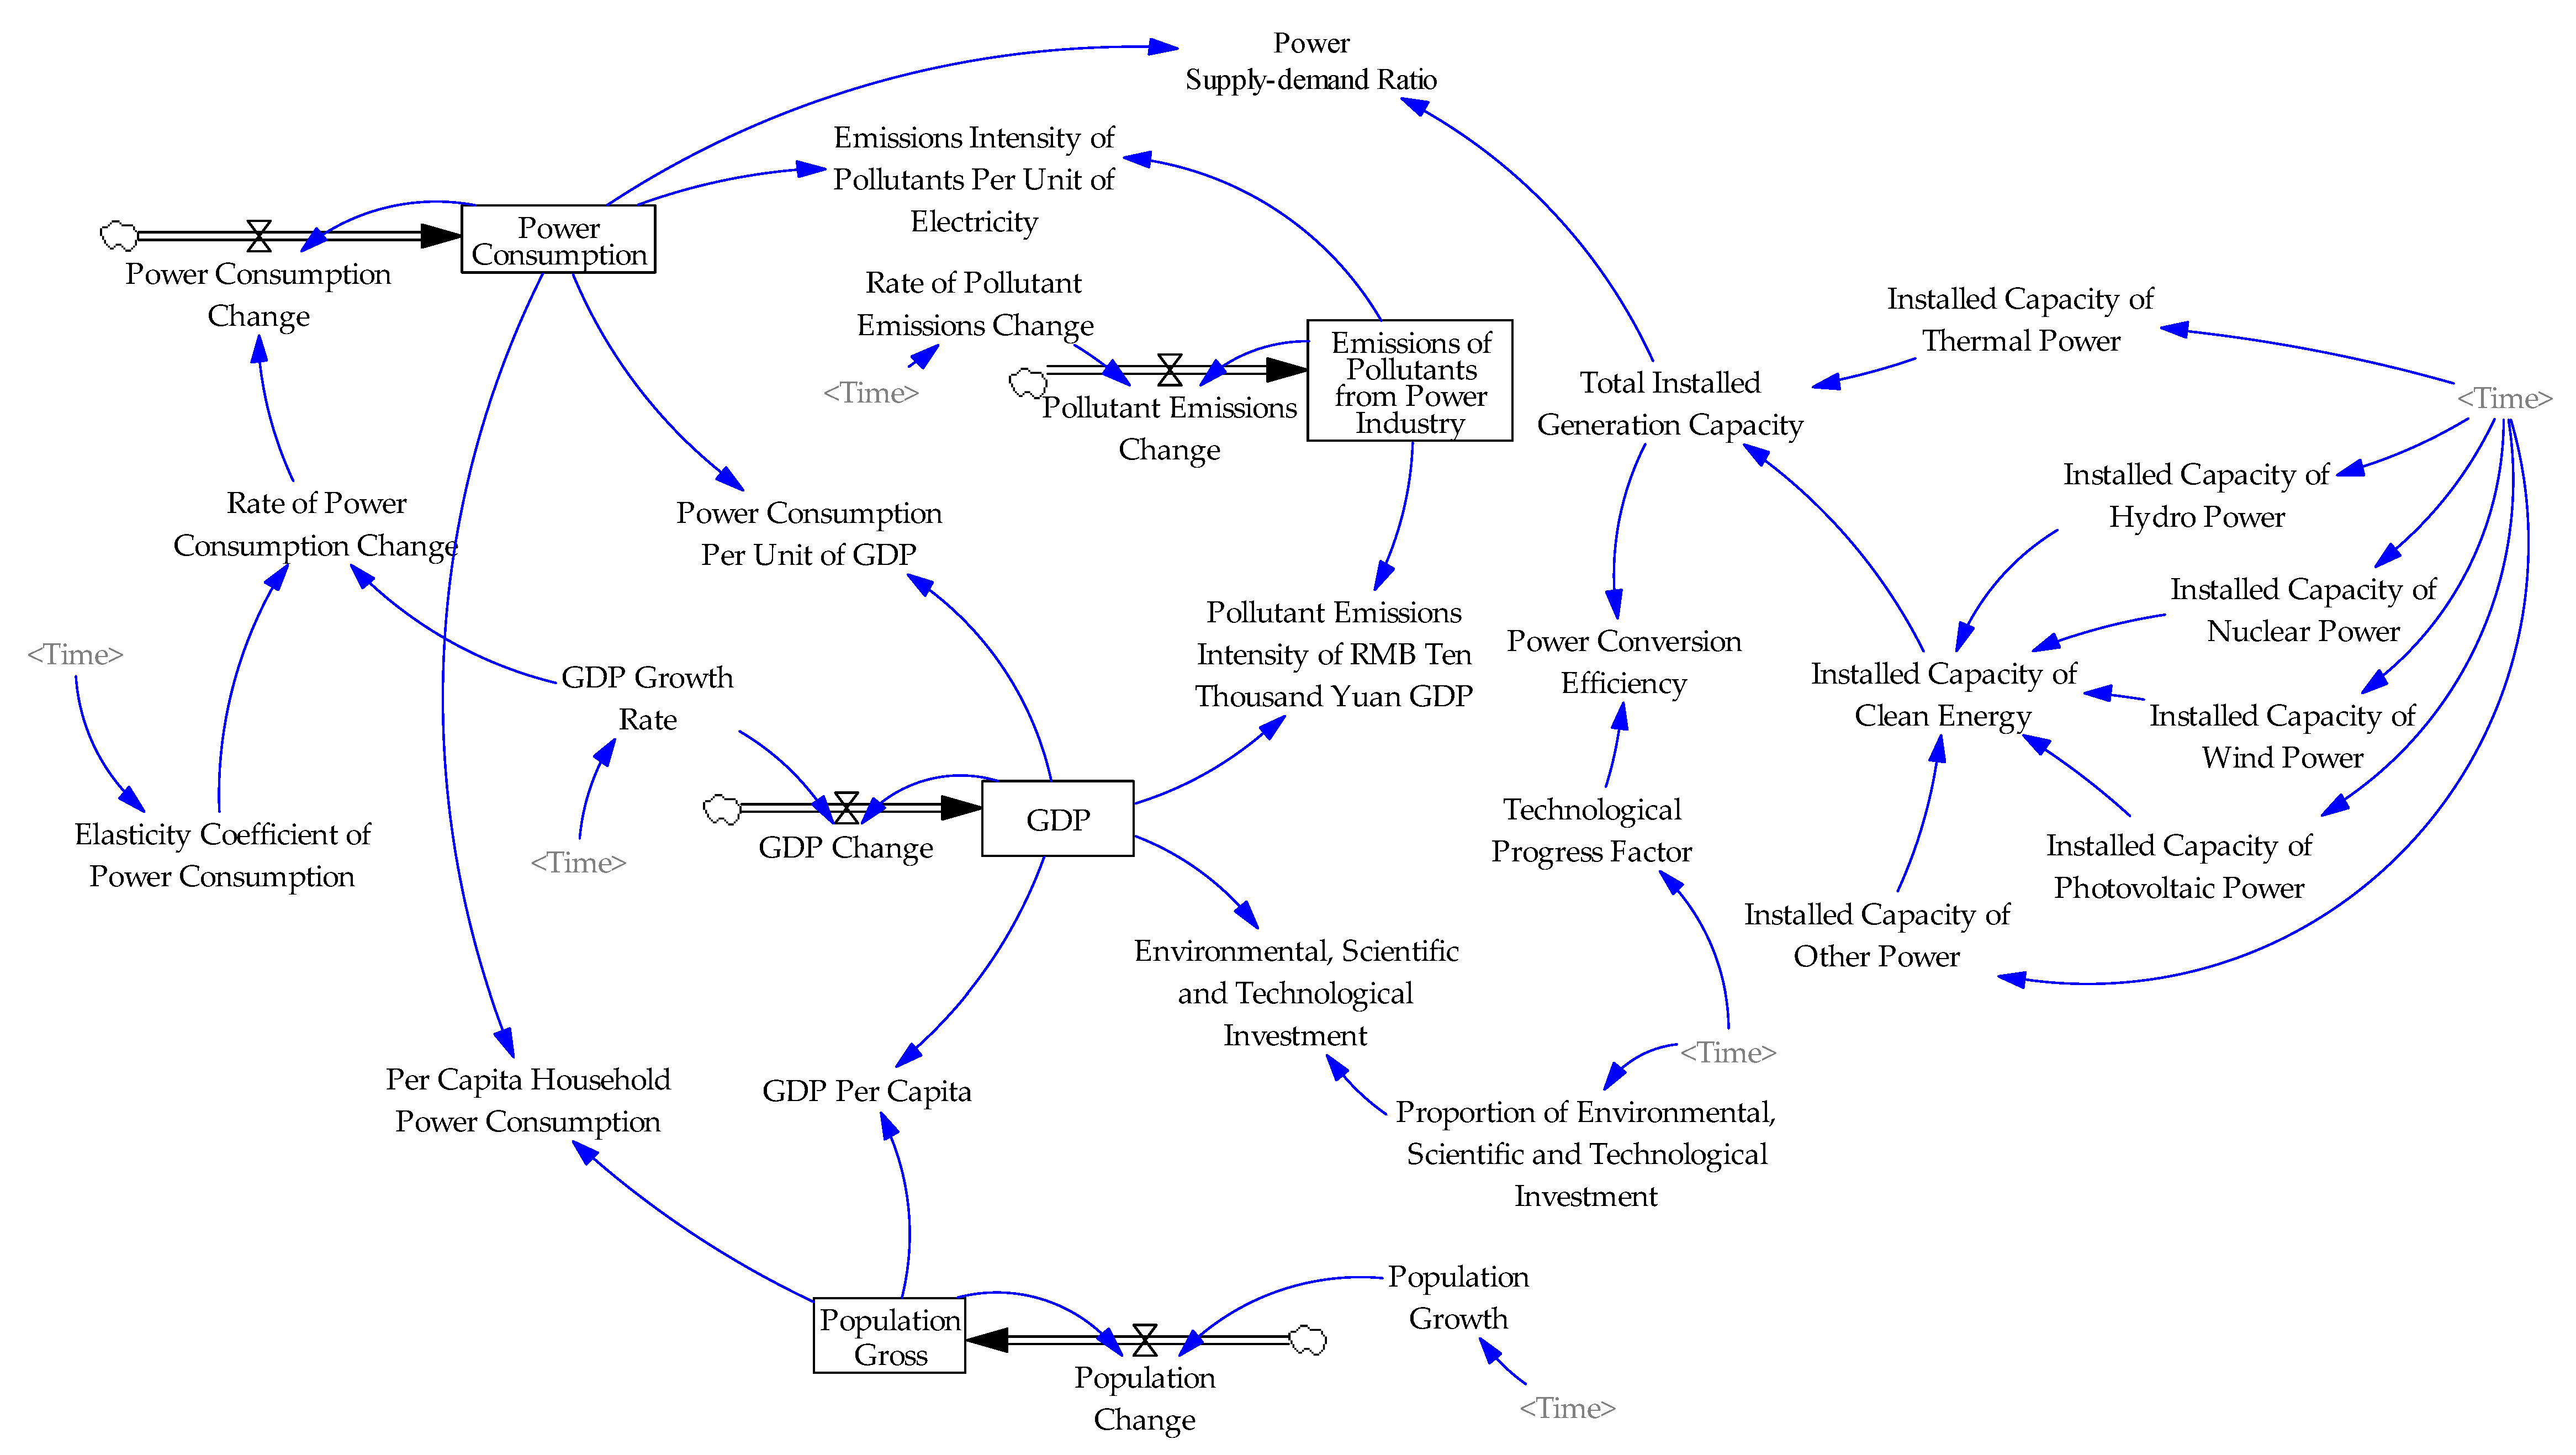
Causal feedback diagrams can only qualitatively describe system structure and feedback mechanisms, and cannot reflect the difference of variables in the system and the cumulative effect of the feedback system. Therefore, it is necessary to distinguish the nature of each variable in the model of the power supply and demand system. This research adopts an SD model, uses the Vensim software as a simulation platform to define state variables, rate variables and auxiliary variables, establish variable equations, and quantify the nonlinear relationships among variables through table functions, so as to specifically reflect system composition, system behavior and change process of interaction between system elements. Based on previous analysis of the causal feedback relationship among the systems, a flow-stock diagram of the SD model of the power supply and demand system is obtained, as shown in
Figure 7.
As can be seen from
Figure 7, the SD model of the power supply and demand system established in this research considers the interaction of the four modules of society, economy, power and environment. The system dynamics equations used in the power module are as follows:
where:
is the rate of power consumption change,
is the elasticity coefficient of power consumption,
is the growth rate of GDP,
is the change in power consumption change,
is the power consumption,
is the current time,
is the past time,
is the cumulative variation function of the system dynamics;
is the variation of the variable,
is the initial value of the variable, and
is the time span from time
to time
.
The system dynamics equations used in the economic module are as follows:
where:
is the change in GDP,
is the GDP, and
is the growth rate of GDP.
The system dynamics equations used in the social module are as follows:
where:
is the population change;
is the population gross;
is the population growth.
The system dynamics equations involved in the environment module are as follows:
Among them: is the pollutant emissions from the power industry, is the change in pollutant emissions, is the CO2 emission intensity per unit of electricity, and is the power consumption.
4.3. Empirical Simulation and Results Analysis
4.3.1. Model Parameter Input
Taking the Chinese administrative division as the model boundary, the SD model is empirically tested based on the actual status of China’s power supply and demand system, thus verifying the reliability of the model. This model consists of 31 variables, including four state variables, four rate variables, and 23 auxiliary variables. Initial values need to be set for the state variables, such as GDP and power consumption in the initial year [
26]. It is necessary to establish the mathematical functional relationship between auxiliary variables [
27]. The table function is used to define the non-linear relationship between some variables [
28]. The input variables in the SD model include population growth, GDP growth rate, the proportion of environmental, scientific, and technological investment, the elasticity coefficient of power consumption, and the installed capacity of different power sources. The values of the input variables from 2001 to 2017 need to be input as initial parameters. Additionally, the gross population, GDP, power consumption, and pollutant emissions from the power industry are state variables of the model, so their values in 2001 also need to be input as initial parameters. Data related to population, the economy, and environmental protection were all taken from the 2018 China Statistical Yearbook. The data related to electricity were taken from the 2018 China Energy Statistical Yearbook.
4.3.2. Model Test
In this research, the reliability and stability of the proposed model are respectively analyzed using a historical test and a system operation test. The historical test is used to analyze whether the simulation result of the model is consistent with China’s actual power supply and demand system, that is, the degree of fitting between the system behavior and historical data is checked [
29,
30]. The system operation test verifies the stability of the model by selecting different simulation steps for simulation analysis [
31,
32].
Table 1 gives a comparison between the simulated value and the actual value of the indices of power consumption per unit GDP, per capita GDP and per capita power consumption from 2010 to 2016.
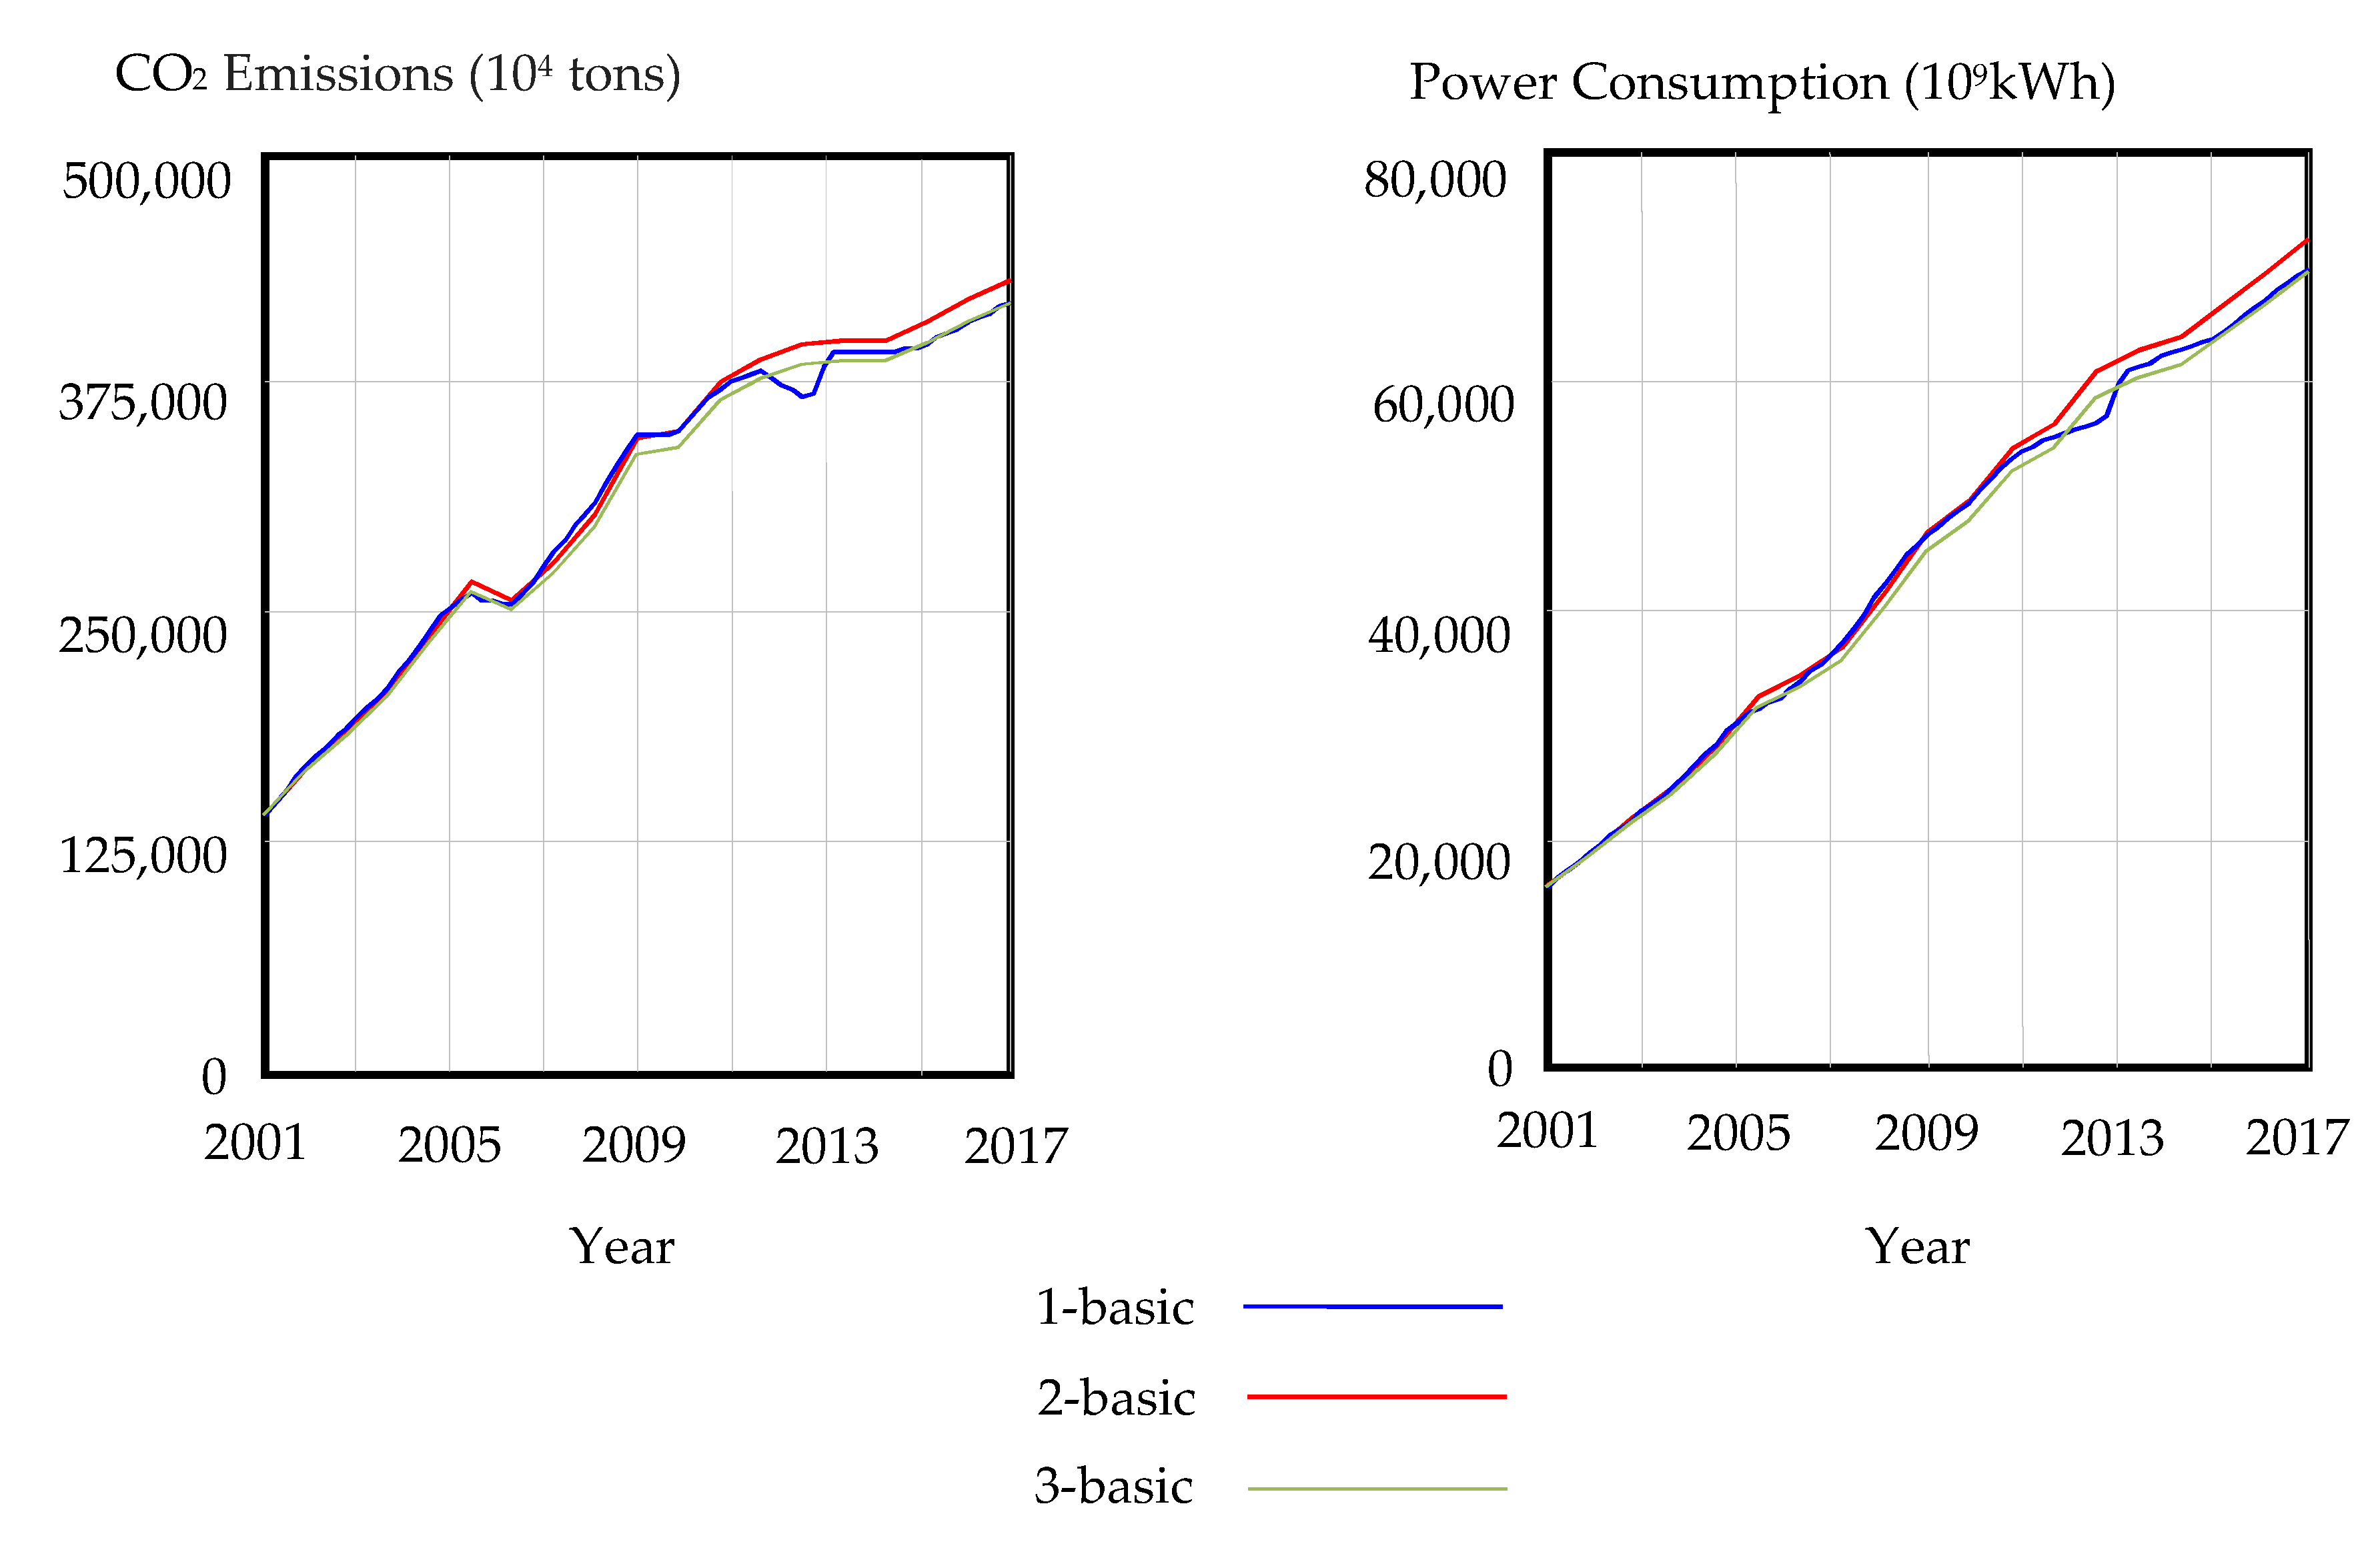
Figure 8 shows a comparison of CO
2 emissions from the Chinese power industry and China’s power consumption under the different time steps (TD) of 1 (1-basic), 0.5 (2-basic) and 0.25 (3-basic), namely 1a, 1/2a and 1/4a.
The results of the historical test of the model show that the errors between the simulated values and the actual values of the model output variables established in this research are all within ±10%, which corresponds the trustable range, indicating that the model predictions correspond well with the actual system. The results of the operation test of the model system show that the variation trend of power industry CO2 emissions of and power consumption are basically the same for all the different time step, with extreme fluctuation. Therefore, the proposed SD model is highly reliable and can be used for the dynamic simulation of the evolution of China’s power supply and demand system.
5. Research on Sustainability Evaluation of China’s Power Supply and Demand System
5.1. Construction of Evaluation Index System
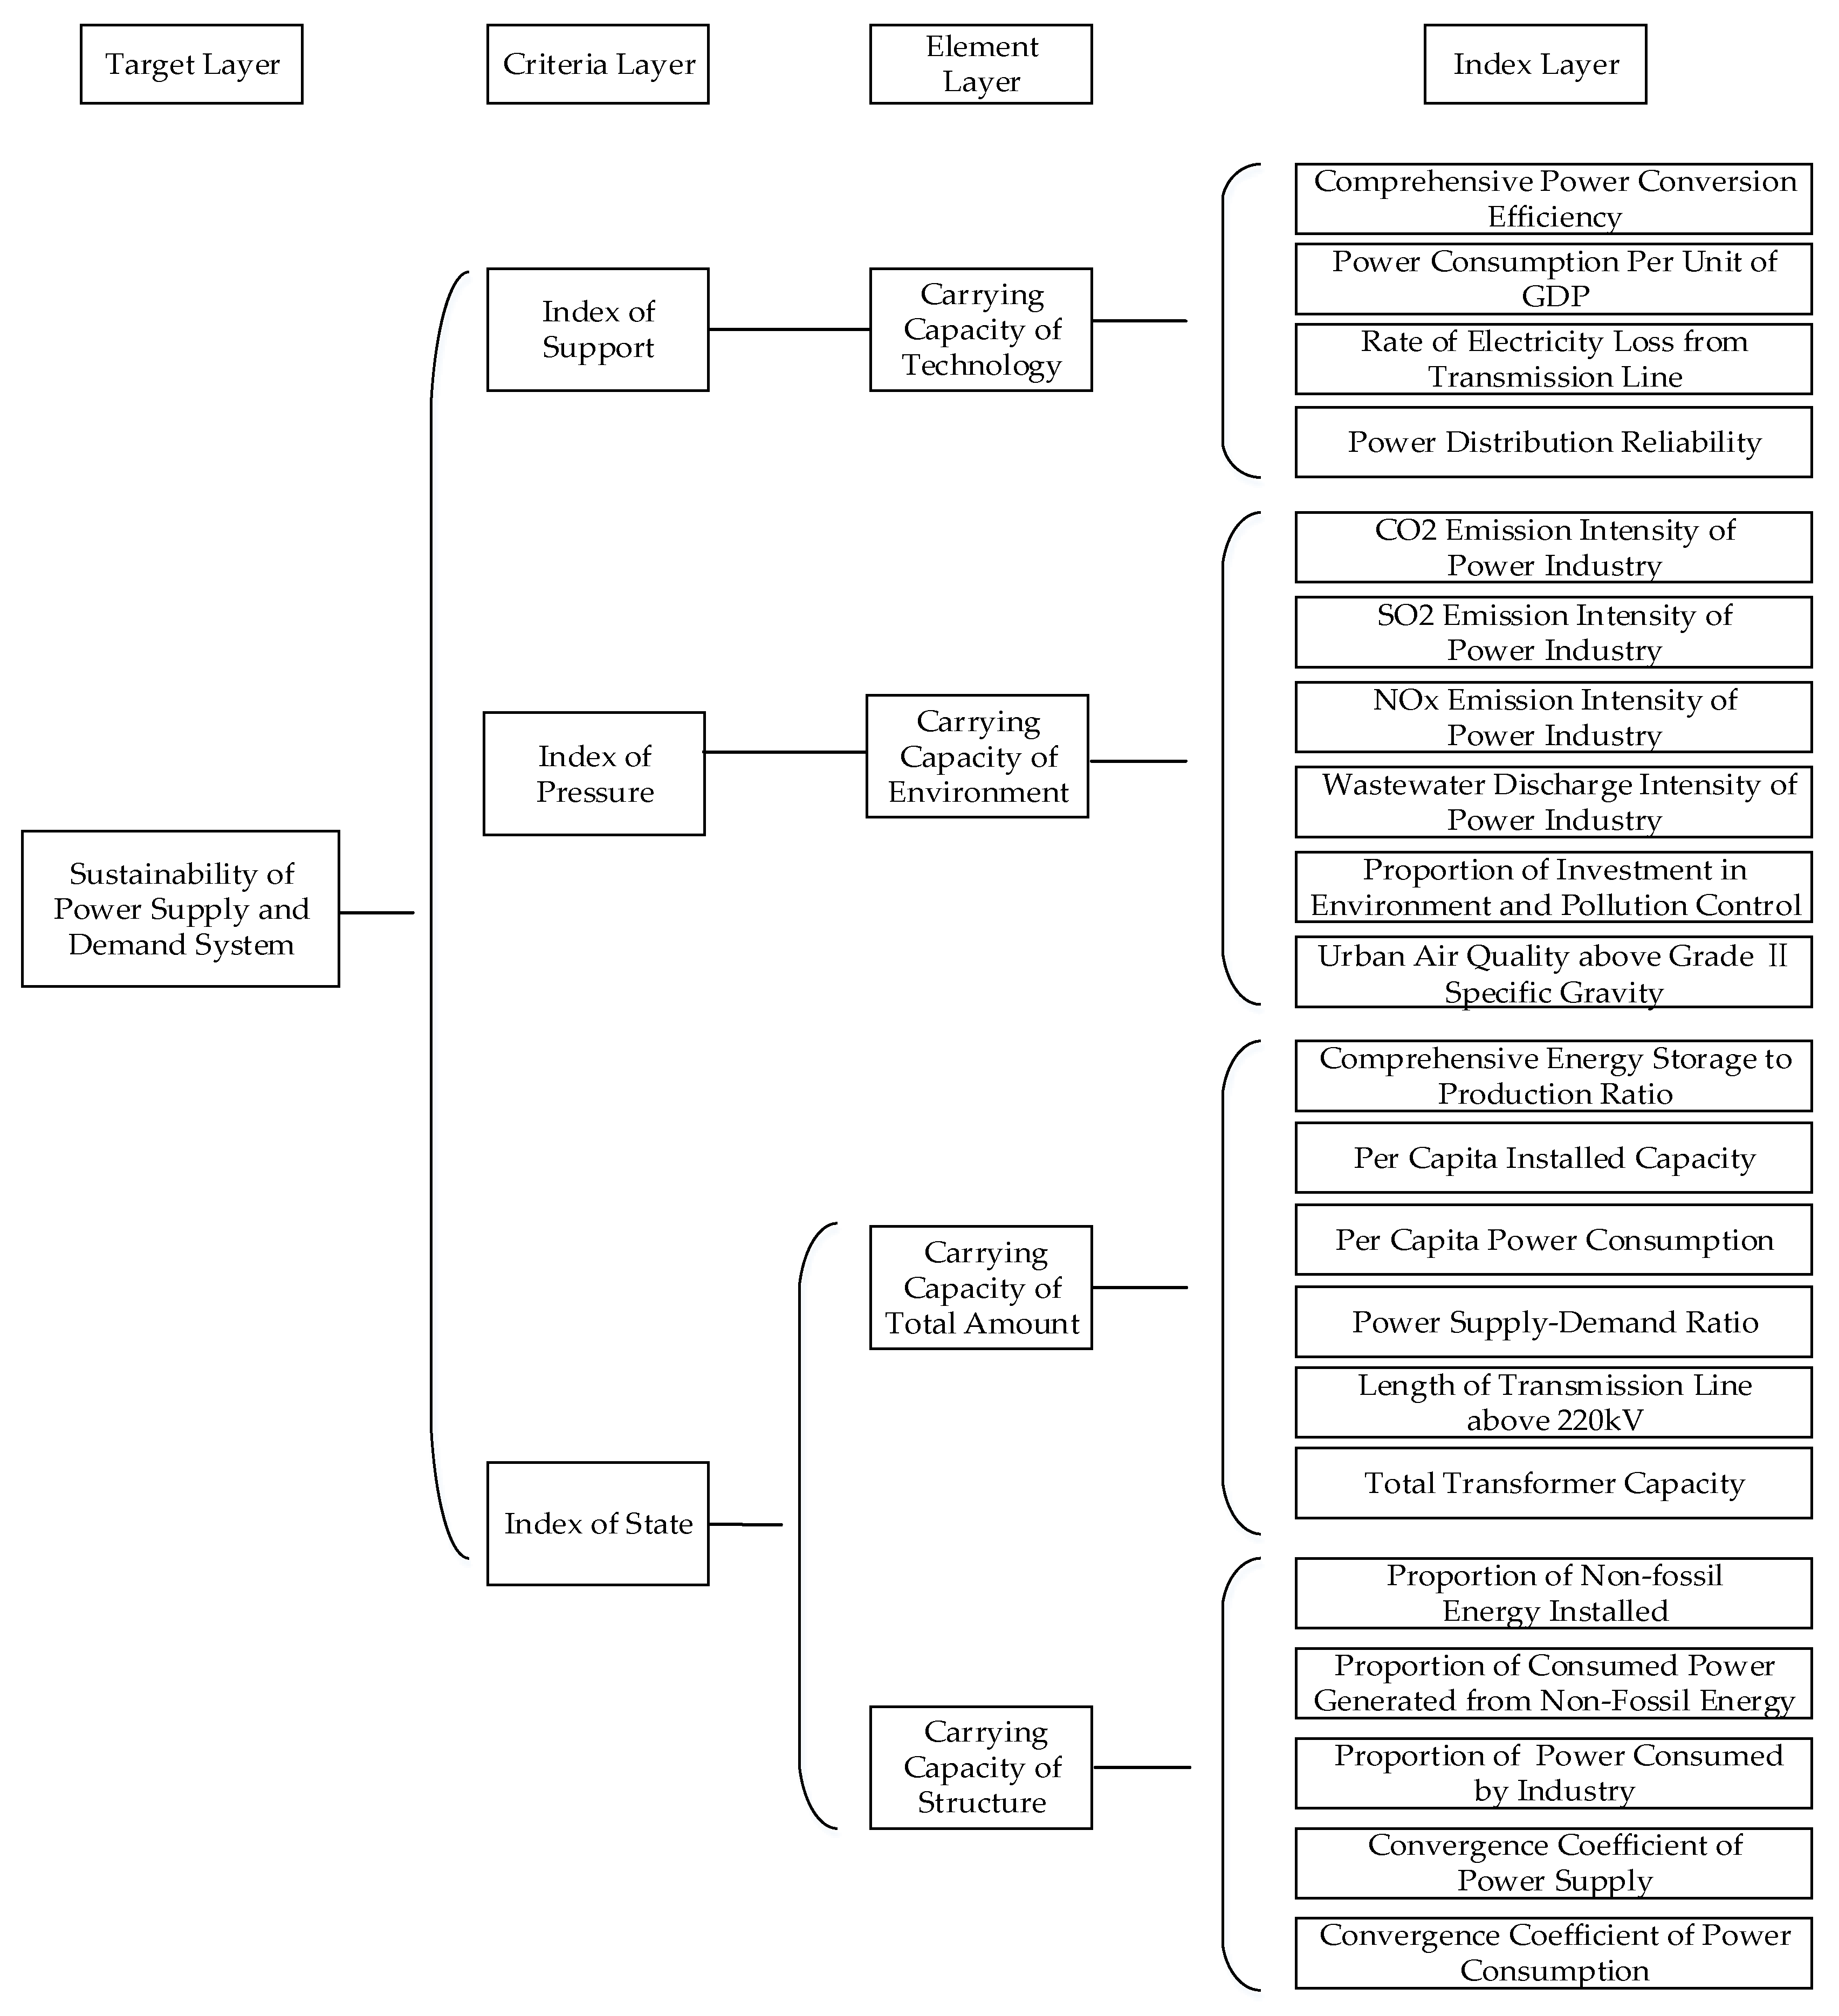
Based on the interaction between the power supply and demand system and economy–society–environment system, this research takes the sustainability of the power supply and demand system as the evaluation target, and uses the target stratification method to construct a multi-level index system from the three aspects of support, pressure and state.
Among the measurement indices, the measurement indices of support mainly focus on the technical level. Based on the whole process of power supply and demand, the indices reflecting the efficiency characteristics of the power supply and demand system are selected. The measurement indices of pressure mainly reflect the negative impact of the power supply and demand system on the ecological environment, consider the main pollutants and greenhouse gases emitted by power production, and reflect the government’s pollution control efforts. The state measurement indices are mainly selected from two levels—indices of the total amount level are mainly based on the input–output–transportation–consumption sequence of power production, highlighting the development level of the power supply and demand system at the present stage, while indices of the structural level are selected from the quantitative, industrial and spatial dimensions, in an attempt to fully reflect the structural characteristics of power supply and demand system. The indices were screened by considering the sustainability indicators of power supply and demand systems in existing research, and by combining energy and power planning indices, interfacing with the output parameters of the SD model as much as possible. Based on the above principles, the indices were preliminarily screened to obtain the general index system, and then multi-collinearity analysis was adopted to eliminate the errors caused by the collinearity among variables, so as to obtain. Thus, the final evaluation index system was obtained, as shown in
Figure 9.
5.2. Construction of Principal Component Analysis-State Space (PCA-SS) Evaluation Model
5.2.1. Standardization of Evaluation Indices
Since there are significant differences in the nature, unit, and magnitude of each index in the evaluation system, it is necessary to standardize all indices before a comprehensive evaluation to eliminate the effects of differences between the original data. This research uses the ratio between the actual value and the ideal value of each index to standardize the index.
For positive indices, the standardized formula used is as follows:
For negative indices, the standardized formula used is as follows:
where
is the value of each index after standardization,
is the original value of each index, and
is the ideal value of each index. When the standardized value of the evaluation index
is less than 1, equal to 1, and greater than 1, this indicates that the index is at the level of sustainable, critical and unsustainable with respect to the ideal state, respectively.
In this research, the ideal value of each index in this research is mainly determined by the following methods:
Refer to the target values of corresponding indices in the national power development plan and economic development plan at all stages, such as the CO emission intensity of the power industry and the proportion of non-fossil energy installed.
According to the reference value of the corresponding index under the similar development level in the world, combined with the development forecast of the Chinese power industry, the ideal value of the corresponding index, such as the power conversion efficiency or rate of electricity loss from transmission line, can be obtained.
With the development of society and the economy, the ideal value of indicators should be in a process of dynamic and continuous change, and the Chinese development plan is often phased. Therefore, this research adopts interpolation method to calculate the ideal value of indices for each year.
5.2.2. Determination of Index Weights Based on PCA
This research adopts the principal component analysis PCA method among objective weighting methods to determine the index weight.
To determine the index weight, PCA mainly obtains the contribution rate of the corresponding characteristic root of each index value to variance through factor analysis. Generally, the more information the index value has on the original data load, the larger the index weight will be. This research uses the PCA function of the IBM SPSS Statistics 20 to determine the weight of each index in the power supply and demand system evaluation index system. The specific steps are as follows:
Calculate the correlation coefficient matrix
R:
Calculate the characteristic root or the characteristic vector (g = 1, 2, …, n);
Calculate the variance contribution rate. The characteristic roots are arranged in order of size, and the variance contribution rate indicates the contribution of the factor to the evaluation. For the g-th principal component, the variance contribution rate is equal to . The principle of PCA is to select as few principal components (k; k ≤ n) as possible for analysis, and the value of k is determined according to the cumulative variance contribution rate ≥ 85% and the eigenvalue of ≥ 1;
Principal component conversion. For each characteristic root , there is a corresponding characteristic vector , then the principal components can be expressed as (g = 1, 2, …, n, R’ is the mean of the data), with the subscript g representing the g-th principal component;
The weight of each index is equal to the weighted average normalized value of the contribution matrix with the weight contribution rate of each principal component as a weight.
5.2.3. State Space Method
Based on the PCA method to determine the index weight, the SS method is introduced to construct the PCA-SS evaluation model for quantitatively analyzing the sustainability of the power supply and demand system. The coordinate axes in the three-dimensional state space are defined as the support axis, pressure axis and state axis. Any point can be expressed as a three-dimensional combination of the support, pressure and state of the power supply and demand system at a certain moment. The sustainability of the system at this moment can be judged according to the spatial position of the point. Each moment corresponds to an equilibrium point at which the support, pressure and state indices of the power supply and demand system are in a critical state. All the equilibrium points form a curved surface in space, and points located inside the surface are in a sustainable state. For points outside the curved surface, the negative impact of the development of the power supply and demand system exceeds the environmental tolerance, and the power supply and demand system is therefore in an unsustainable state. By judging the relationship between the relative position of points in the state space and the critical state surface, the status of the power supply and demand system under corresponding conditions can be determined. The modulus of the space vector from any point to the origin represents the sustainability of the power supply and demand system. The mathematical expression of this modulus is:
where,
IS is the sustainability of the power supply and demand system,
is the modulus representing the sustainability of the power supply and demand system,
is the coordinate value in space (
I = 1, 2,…,
n),
n is the number of selected indices, and
is the weight of
.
Since there is a difference between the actual sustainability of power supply and demand system and the ideal sustainability, the actual sustainability can be expressed as follows:
where,
AS is the actual sustainability of the supply and demand system,
is the modulus of the representing the sustainability of the power supply and demand system in the real state, and
is the spatial coordinate value of each index in the real state (
I = 1, 2,…,
n).
According to the principle of the SS method, the current status of the power supply and demand system can be determined by the following conditions:
Put the ideal value of each index into this evaluation model, and the standardized value of each ideal value is 1. Therefore, the sustainability of the power supply and demand system under the ideal state can be calculated as follows:
In theory, when
AS is equal to 1, it barely reaches the critical state. However, considering the complexity and volatility of power supply and demand systems, the standard tolerance is set as ±0.1. The evaluation criteria for the status of the power supply and demand system are shown in
Table 2.
When AS < 0.9, the power supply and demand system is in a sustainable state. When 0.9 ≤ AS ≤ 1.1, the power supply and demand system is in a critical state; when AS > 1, it indicates that the actual status exceeds the ideal upper limit, and the power supply and demand system is unsustainable. At this time, it is necessary to adopt control measures to improve the status of, and ensure the sustainable development of, the power supply and demand system.
5.3. Empirical Analysis on the Sustainablility of China’s Power Supply and Demand System
5.3.1. Calculation of Index Weight
The weights of the evaluation indices were calculated according to the PCA method. The eigenvalue and variance contribution rate of each principal component, and the component matrix are shown in
Table 3 and
Table 4, respectively.
The weight of each index is equal to the normalized value of the weighted average coefficient of this index in the linear combination of principal components, with the variance contribution rate of each principal component as the weight. The weight of each index is shown in
Table 5.
5.3.2. Calculation of the Sustainability of the Target Layer
After standardizing the evaluation indices, using the index weights, the sustainability of China’s power supply and demand system from 2001 to 2017 was calculated. The results are shown in
Figure 10.
The calculated sustainability of China’s power supply and demand system was between 2.025 and 3.662 from 2001 to 2017, that is, it was always unsustainable during this time. However, the sustainability value shows a downward trend over time, that is, the system has become more sustainable since 2001. Between 2001 and 2017, the AS fell by an average of 3.79% per year. The largest decline in AS occurred in 2007, with a drop of 6.02%, and the smallest occurred in 2017, with a drop of 1.60%.
5.3.3. Calculation of the Sustainability of Element Layers
According to the analysis of the causal relationship among systems in
Section 4, the power supply and demand system is a huge complex system with multi-factor coupling. Therefore, in this section, the sustainability of the element layers is analyzed, on the basis of the overall evaluation of the sustainability of China’s power supply and demand system, to explore the impact of element layers on this sustainability. After the weights of the evaluation indices in each element layer were calculated and the standardized values of the indices were substituted, the sustainability of each element layer from 2001 to 2017 was obtained, and the results are shown in
Figure 11 and
Figure 12.
According to the calculated of sustainability of the element layers of China’s power supply and demand system, all four element layers were all unsustainable from 2001 to 2017, and the four curves all show a downward trend. The sustainability of the technology and total amount layers greatly decreased, with average annual declines of 6.19% and 5.77%, respectively. On the other hand, the change in the sustainability of the structure and environment layers was significantly smaller, with average annual declines of only 0.97% and 0.28%, respectively.
6. Discussion
In the previous section, an empirical calculation of the sustainability of China’s power supply and demand system was carried out. However, the results still require further analysis. In the following, an in-depth discussion is presented on the change in the sustainability of China’s power supply and demand system from the perspective of the target layer and the element layers.
- (1)
Analysis of the change in the sustainability of the target layer.
Figure 10 shows the trend of the calculated sustainability of China’s power supply and demand system from 2001 to 2017. Overall, the curve shows a downward trend, indicating that the sustainability gradually increased, which proves that the power development policies adopted by the Chinese government in the past 20 years have achieved good sustainability optimization results. However, the increase in sustainability slowed significantly after 2010, indicating that the optimization effect of the existing policies for the sustainable development of China’s power supply and demand system is gradually weakening. Additionally, there is still a big gap between the current sustainability and the ideal sustainability of China’s power supply and demand system, and the problems caused by its lack of sustainability are still significant. Although the sustainability of China’s power supply and demand system has been improved in recent years, it is foreseeable that it will remain unsustainable for a long time to come. Therefore, new stimulus policies need to be introduced to change this situation.
- (2)
Analysis of the change in the sustainability of the element layers.
Figure 11 and
Figure 12 show the impact of the four element layers (total amount, structure, technology, and environment) on the sustainability of China’s power supply and demand system. Among them, the curves of the total amount and technology layers both decline rapidly between 2001 and 2017, and the average annual declines are significantly larger than for the structure and environment layers. This shows that the sustainability of the total amount and technology layers of China’s power supply and demand system improved significantly from 2001 to 2017. The rapid development of the scale of power development and the continuous development of power-generation technology are the main driving factors behind the optimization of the overall sustainable development of China’s power supply and demand system. However, the sustainability of the structure and environment element layers of China’s power supply and demand system have increased slowly in recent years, which has become the main barrier to the improvement of the sustainability of the system. In general, the sustainability of each element layer is expected to remain unsustainable in the short term, and the sustainability of the structure and environment layers in particular needs to be further improved. Therefore, in the future, the Chinese government should focus on the structure of the country’s power system and clean power production as the main direction for the continuous optimization and development of its power supply and demand system.
7. Conclusions and Optimal Strategies
7.1. Conclusions
In this research, an SD model of China’s power supply and demand system was constructed to realize the dynamic simulation of the evolution of the system. By using actual data to conduct a historical test and a system operation test, it is shown that the simulated values of output variables are within ±10% of the actual values, which is within the trusted range, and the variation trend of the selected variable under different sizes of simulation step is stable. Therefore, the SD model of China’s power supply and demand system established in this research is highly reliable. Based on this model, an index system for the evaluation of the sustainability of China’s power supply and demand system is proposed for the four dimensions of total amount, structure, technology, and environment. The Principal Component Analysis (PCA) method and State Space (SS) method are integrated to establish a PCA-SS evaluation model to analyze the sustainability of China’s power supply and demand system. The results show that the sustainability of the system from 2001 to 2017 was between 2.025 and 3.662—that is, it was always in an unsustainable state—and that there is still a large gap between the actual sustainability and the ideal range. The slow improvement of structural and environmental sustainability is the main bottleneck restricting the optimization of China’s power supply and demand system.
Based on the analysis of the evolution mechanism of China’s power supply and demand system, this research quantitatively analyzes the sustainability of the system by proposing an evaluation index system and constructing a comprehensive evaluation model. At the same time, an empirical analysis is conducted to calculate the sustainability of the target layer and the element layers of China’s power supply and demand system. Additionally, the main factors that constrain the sustainability of China’s power supply and demand system are investigated. The research results effectively solve the quantitative evaluation of the sustainability of China’s power supply and demand system, expand the understanding of the sustainability evaluation of power supply and demand systems and provide a theoretical reference for the optimization of China’s power supply and demand system.
7.2. Optimal Strategies
The above empirical analysis shows that the slow improvement of structural and environmental sustainability is currently the main barrier to the sustainable development of China’s power supply and demand system. Therefore, in the future, the government should focus on the structural optimization of China’s power supply and demand and clean power production to effectively improve the sustainability of the country’s power supply and demand system.
7.2.1. Accelerate China’s Development of Clean Energy and Optimize the Structure of Its Power Supply and Demand System
The optimization of the structure of China’s power supply and demand system can be promoted by expanding the scale of renewable energy application and increasing the proportion of clean energy in power consumption. On the one hand, the government must pay attention to rationally adjusting the development layout, developing clean energy according to local conditions, and avoiding the problems of abandoning wind and solar power. For example, wind power can be developed in areas with a strong capacity for consumption, such as mid-Eastern and Southern China. On the other hand, it is necessary to encourage diversified energy utilization, actively and cleanly utilize biomass energy, and to promote biogas power generation and distributed biomass gasification power generation. Additionally, the government should accelerate the transformation and upgrading of traditional coal-fired power stations, encourage joint coal-electricity joint ventures, and promote the efficient, clean and sustainable development of coal-fired power.
7.2.2. Promote Key Technological Innovations and Achieve Clean and Efficient Power Production
This analysis of the current status of China’s power supply and demand system shows that the expansion of the system has a serious negative impact on the ecological environment. Therefore the government needs to guide the innovation of clean power production technology in order to promote the sustainability of China’s power supply and demand system. On the one hand, a group of relatively mature and marketable new technologies should be applied and promoted to realize industrialization as soon as possible. On the other hand, the government should focus on a number of key technologies with broad prospects but limited core technologies, such as dust removal, desulfurization and denitration technology for coal-fired power generation, as well as on research into carbon capture and storage (CCS) technology, so as to effectively reduce emissions of major pollutants and greenhouse gases. Furthermore, enterprises should be encouraged to increase investment in research and to actively participate in independent innovation.
7.2.3. Deepen Supporting Policies to Promote Development, and Ensure the Sustainable Development of China’s Power Supply and Demand System
The optimization of the sustainability of China’s power supply and demand system needs strong support from national policies. The formulation and improvement of relevant policies can ensure the steady progress of the clean development of the country’s power supply and demand system. Regarding the development of clean energy, the government needs to focus on subsidies for new energy utilization patterns, formulate guidelines for the preferential use of clean energy, improve the subsidy mechanism for new energy generation, explore market-oriented trading models, and promote technological progress and cost reduction. The above policy strategies can provide effective guarantees for promoting the sustainable development of China’s power supply and demand system.
Author Contributions
Conceptualization, Y.T.; data curation, H.Z.; formal analysis, Y.T.; methodology, H.Z.; validation, Y.T.; writing—original draft, Y.T. and H.Z.; writing—review & editing, J.-p.L. and T.Y.
Funding
This study is supported by the National Natural Science Foundation of China (NSFC) (71501071), Beijing Social Science Fund (16YJC064) and the Fundamental Research Funds for the Central Universities (2017MS059, 2018ZD14).
Conflicts of Interest
The authors declare no conflict of interest.
References
- National Bureau of Statistics of China. China Statistical Yearbook in 2018; China Statistics Press: Beijing, China, 2019.
- BP Amoco. BP Statistical Review of World Energy 2018. Available online: https://www.bp.com/content/dam/bp/business-sites/en/global/corporate/pdfs/energyeconomics/statistical-review/bp-stats-review-2018-full-report.pdf (accessed on 10 April 2019).
- Sun, X.Y.; Zhang, B.S.; Tang, X.; McLellan, B.C.; Hook, M. Sustainable Energy Transitions in China: Renewable Options and Impacts on the Electricity System. Energies 2016, 9, 20. [Google Scholar] [CrossRef]
- Hosenuzzaman, M.; Rahim, N.A.; Selvaraj, J.; Hasanuzzaman, M.; Malek, A.; Nahar, A. Global prospects, progress, policies, and environmental impact of solar photovoltaic power generation. Renew. Sustain. Energy Rev. 2015, 41, 284–297. [Google Scholar] [CrossRef]
- Sahoo, S.K. Renewable and sustainable energy reviews solar photovoltaic energy progress in India: A review. Renew. Sustain. Energy Rev. 2016, 59, 927–939. [Google Scholar] [CrossRef]
- Yu, M.; Halog, A. Solar Photovoltaic Development in Australia-A Life Cycle Sustainability Assessment Study. Sustainability 2015, 7, 1213–1247. [Google Scholar] [CrossRef]
- Kumar, Y.; Ringenberg, J.; Depuru, S.S.; Devabhaktuni, V.K.; Lee, J.W.; Nikolaidis, E.; Andersen, B.; Afjeh, A. Wind energy: Trends and enabling technologies. Renew. Sustain. Energy Rev. 2016, 53, 209–224. [Google Scholar] [CrossRef]
- Ahn, J.; Woo, J.; Lee, J. Optimal allocation of energy sources for sustainable development in South Korea: Focus on the electric power generation industry. Energy Policy 2015, 78, 78–90. [Google Scholar] [CrossRef]
- Nie, S.; Huang, C.Z.; Huang, G.H.; Li, Y.P.; Chen, J.P.; Fan, Y.R.; Cheng, G.H. Planning renewable energy in electric power system for sustainable development under uncertainty—A case study of Beijing. Appl. Energy 2016, 162, 772–786. [Google Scholar] [CrossRef]
- Lisin, E.; Shuvalova, D.; Volkova, I.; Strielkowski, W. Sustainable Development of Regional Power Systems and the Consumption of Electric Energy. Sustainability 2018, 10, 1111. [Google Scholar] [CrossRef]
- Chen, M.; Lund, H.; Rosendahl, L.A.; Condra, T.J. Energy efficiency analysis and impact evaluation of the application of thermoelectric power cycle to today’s CHP systems. Appl. Energy 2010, 87, 1231–1238. [Google Scholar] [CrossRef]
- Zhao, H.R.; Guo, S. External Benefit Evaluation of Renewable Energy Power in China for Sustainability. Sustainability 2015, 7, 4783–4805. [Google Scholar] [CrossRef]
- Needleman, D.B.; Poindexter, J.R.; Kurchin, R.C.; Peters, I.M.; Wilson, G.; Buonassisi, T. Economically sustainable scaling of photovoltaics to meet climate targets. Energy Environ. Sci. 2016, 9, 2122–2129. [Google Scholar] [CrossRef]
- Koraz, Y.; Gabbar, A. Risk analysis and self-healing approach for resilient interconnect micro energy grids. Sustain. Cities Soc. 2017, 32, 638–653. [Google Scholar] [CrossRef]
- Gabbar, H.A.; Koraz, Y. Risk Assessment of Micro Energy Grid Protection Layers. Energies 2017, 10, 1176. [Google Scholar] [CrossRef]
- Shi, K.F.; Chen, Y.; Yu, B.L.; Xu, T.B.; Chen, Z.Q.; Liu, R.; Li, L.; Wu, J.P. Modeling spatiotemporal CO2 (carbon dioxide) emission dynamics in China from DMSP-OLS nighttime stable light data using panel data analysis. Appl. Energy 2016, 168, 523–533. [Google Scholar] [CrossRef]
- Zhong, H.W.; Xia, Q.; Chen, Y.G.; Kang, C.Q. Energy-saving generation dispatch toward a sustainable electric power industry in China. Energy Policy 2015, 83, 14–25. [Google Scholar] [CrossRef]
- Sumabat, A.K.; Lopez, N.S.; Yu, K.D.; Hao, H.; Li, R.; Geng, Y.; Chiu, A.S.F. Decomposition analysis of Philippine CO2 emissions from fuel combustion and electricity generation. Appl. Energy 2016, 164, 795–804. [Google Scholar] [CrossRef]
- Yu, L.; Li, Y.P.; Huang, G.H.; Li, Y.F.; Nie, S. Planning carbon dioxide mitigation of Qingdao’s electric power systems under dual uncertainties. J. Clean. Prod. 2016, 139, 473–487. [Google Scholar] [CrossRef]
- Zhou, Y.; Li, Y.P.; Huang, G.H. Planning sustainable electric-power system with carbon emission abatement through CDM under uncertainty. Appl. Energy 2015, 140, 350–364. [Google Scholar] [CrossRef]
- Farfan, J.; Breyer, C. Structural changes of global power generation capacity towards sustainability and the risk of stranded investments supported by a sustainability indicator. J. Clean. Prod. 2017, 141, 370–384. [Google Scholar] [CrossRef]
- Raza, S.S.; Janajreh, I.; Ghenai, C. Sustainability index approach as a selection criteria for energy storage system of an intermittent renewable energy source. Appl. Energy 2014, 136, 909–920. [Google Scholar] [CrossRef]
- Kostevsek, A.; Klemes, J.J.; Varbanov, P.S.; Cucek, L.; Petek, J. Sustainability assessment of the Locally Integrated Energy Sectors for a Slovenian municipality. J. Clean. Prod. 2015, 88, 83–89. [Google Scholar] [CrossRef]
- Sun, C.; Mi, Z.; Ren, H.; Jing, Z.; Lu, J.; Watts, D. Multi-Dimensional Indexes for the Sustainability Evaluation of an Active Distribution Network. Energies 2019, 12, 369. [Google Scholar] [CrossRef]
- Zuo, Y.; Shi, Y.-L.; Zhang, Y.-Z. Research on the Sustainable Development of an Economic-Energy-Environment (3E) System Based on System Dynamics (SD): A Case Study of the Beijing-Tianjin-Hebei Region in China. Sustainability 2017, 9, 1727. [Google Scholar] [CrossRef]
- Yu, S.; Lu, H.W. An integrated model of water resources optimization allocation based on projection pursuit model—Grey wolf optimization method in a transboundary river basin. J. Hydrol. 2018, 559, 156–165. [Google Scholar] [CrossRef]
- Zhao, Y.; Su, X.H.; Wang, M.H.; Li, Z.Y.; Li, E.K.; Xu, X. Evaluation of Water Resources System Vulnerability Based on Co-Operative Co-Evolutionary Genetic Algorithm and Projection Pursuit Model Under the DPSIR Framework. In Proceedings of the 3rd International Conference on Water Resource and Environment, Qingdao, China, 26–29 June 2017; Li, P., Ed.; Iop Publishing Ltd.: Bristol, UK, 2017; Volume 82. [Google Scholar]
- Zhou, R.X.; Pan, Z.W.; Jin, J.L.; Li, C.H.; Ning, S.W. Forewarning Model of Regional Water Resources Carrying Capacity Based on Combination Weights and Entropy Principles. Entropy 2017, 19, 574. [Google Scholar] [CrossRef]
- Yang, J.F.; Lei, K.; Khu, S.; Meng, W. Assessment of Water Resources Carrying Capacity for Sustainable Development Based on a System Dynamics Model: A Case Study of Tieling City, China. Water Resour. Manag. 2015, 29, 885–899. [Google Scholar] [CrossRef]
- Herce, C.; Stendardo, S.; Cortes, C. Increasing CO2 carrying capacity of dolomite by means of thermal stabilization by triggered calcination. Chem. Eng. J. 2015, 262, 18–28. [Google Scholar] [CrossRef]
- Guyondet, T.; Comeau, L.A.; Bacher, C.; Grant, J.; Rosland, R.; Sonier, R.; Filgueira, R. Climate Change Influences Carrying Capacity in a Coastal Embayment Dedicated to Shellfish Aquaculture. Estuar. Coasts 2015, 38, 1593–1618. [Google Scholar] [CrossRef]
- Tian, Y.H.; Govindan, K.; Zhu, Q.H. A system dynamics model based on evolutionary game theory for green supply chain management diffusion among Chinese manufacturers. J. Clean. Prod. 2014, 80, 96–105. [Google Scholar] [CrossRef]
© 2019 by the authors. Licensee MDPI, Basel, Switzerland. This article is an open access article distributed under the terms and conditions of the Creative Commons Attribution (CC BY) license (http://creativecommons.org/licenses/by/4.0/).


