Spatial Analysis of Residual Biomass and Location of Future Storage Centers in the Southwest of Europe


Abstract
:1. Introduction
2. Materials and Methods
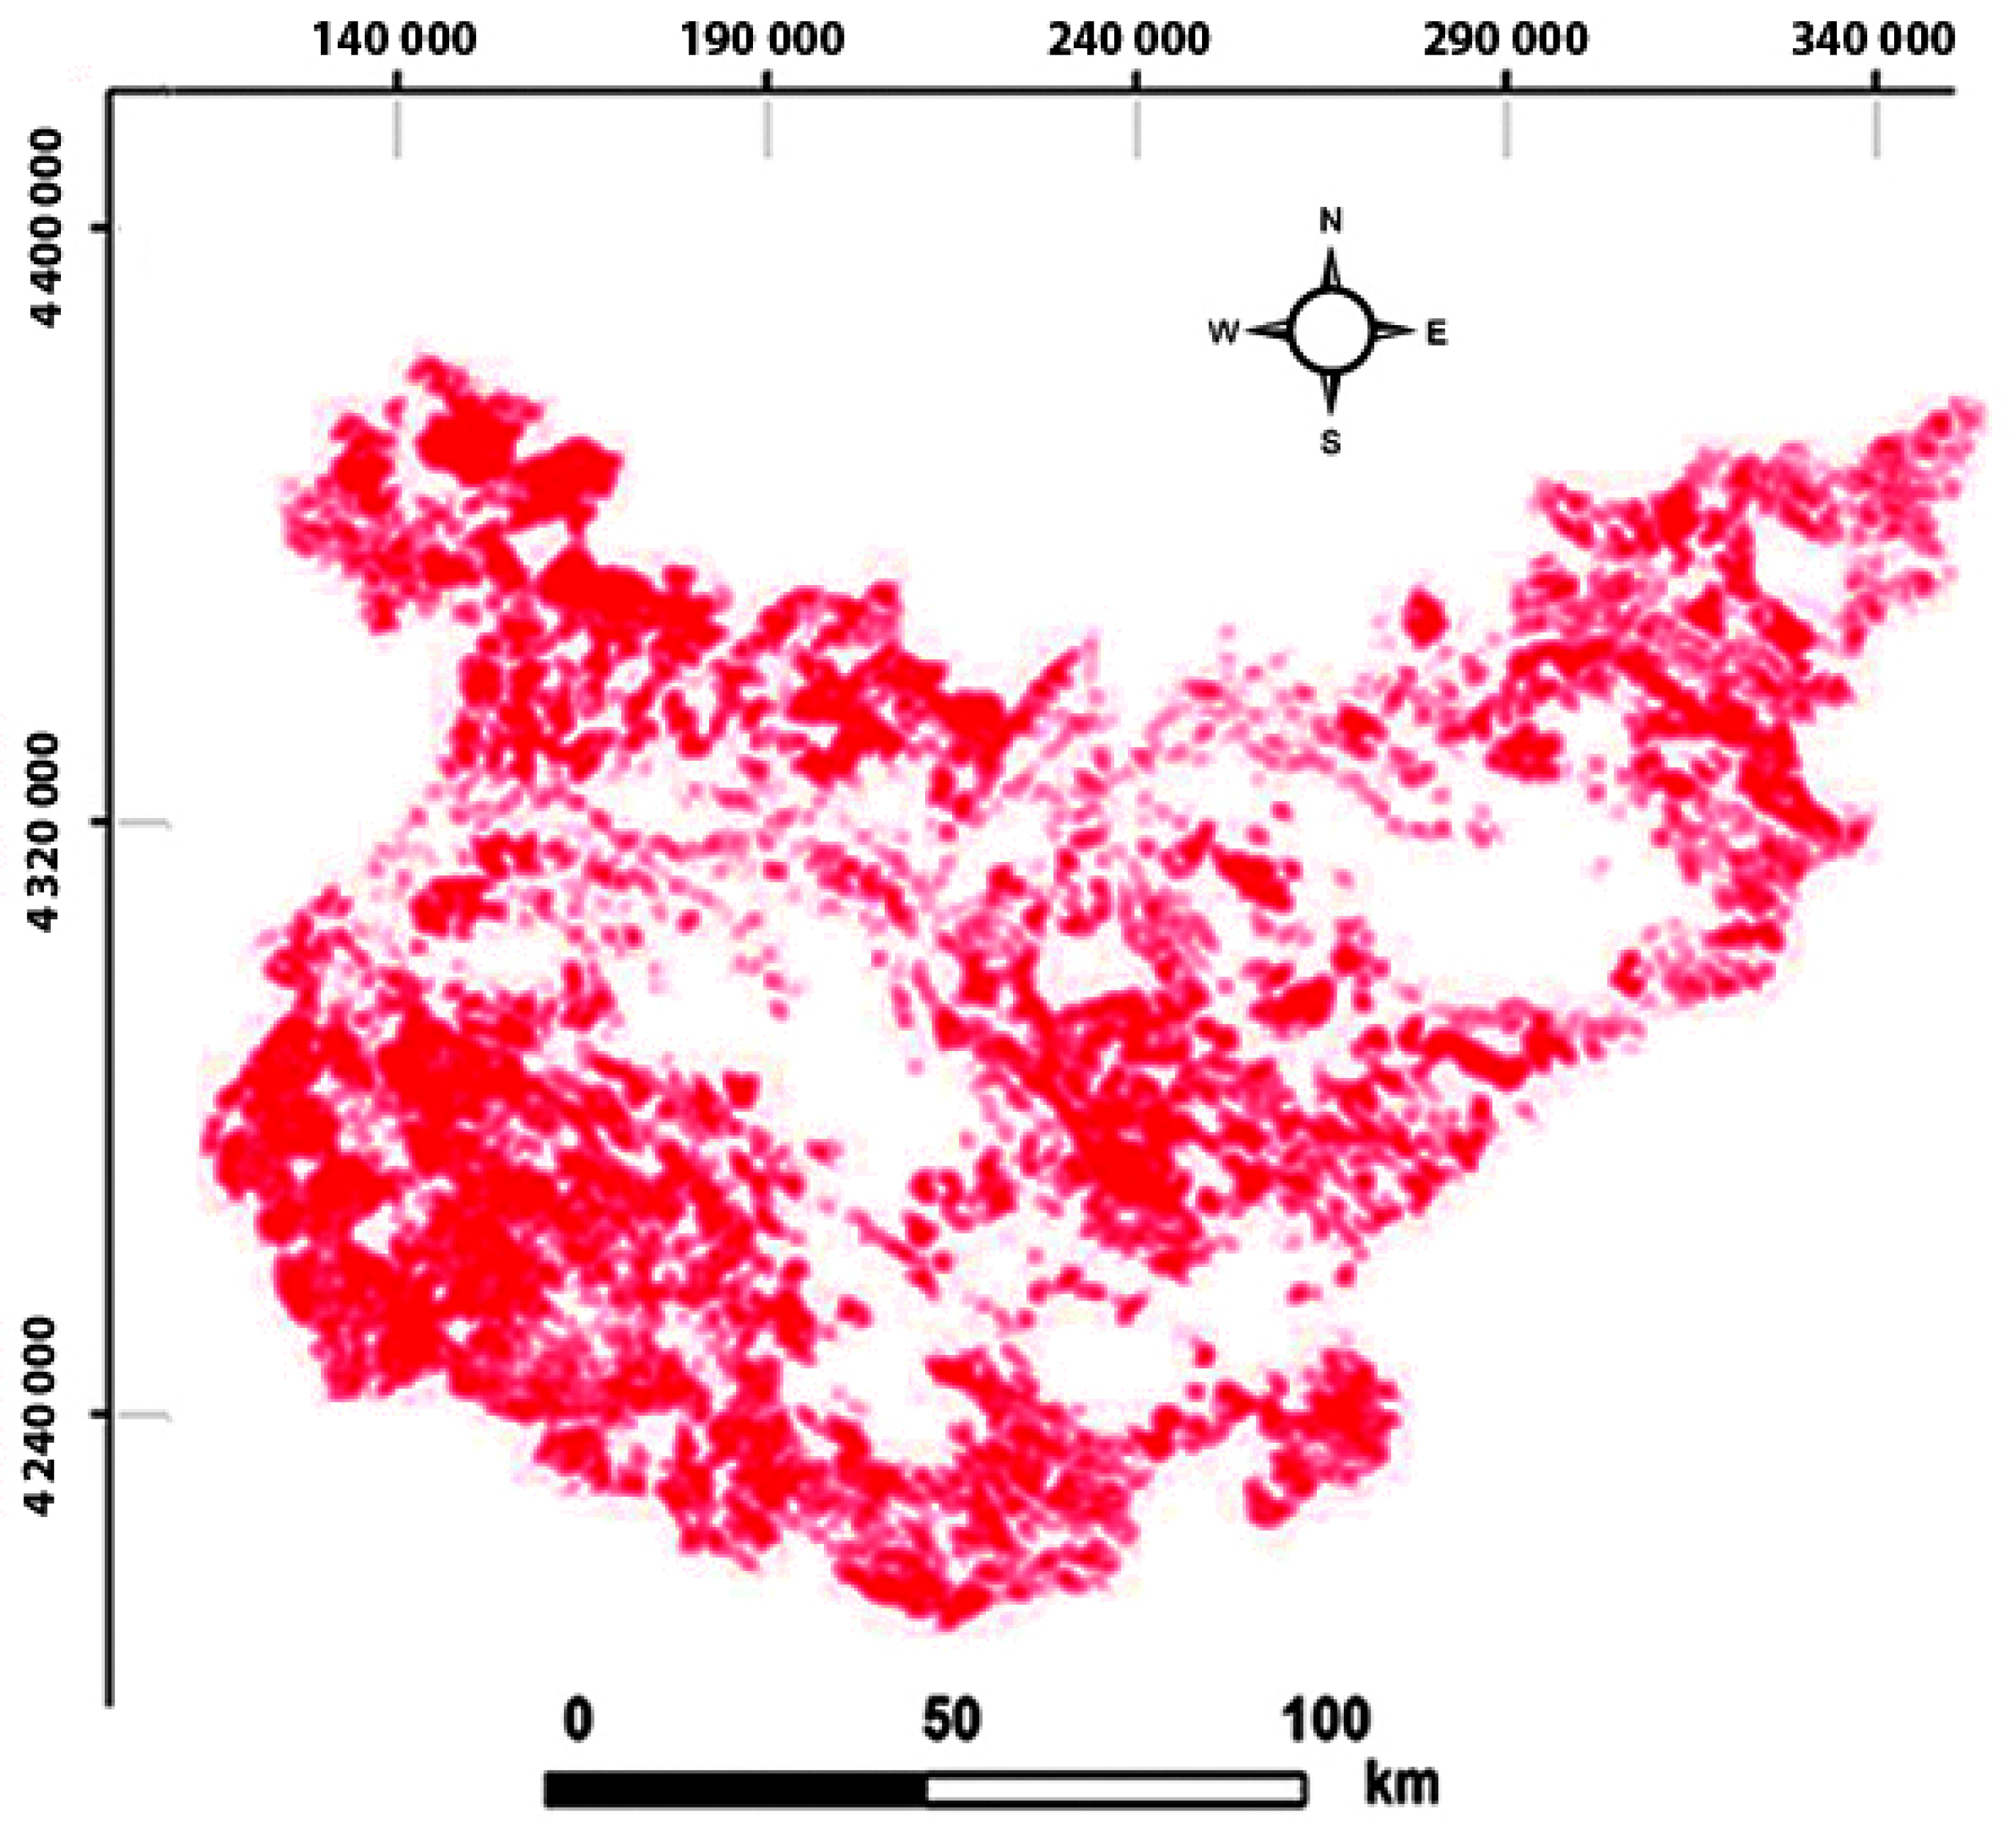
2.1. Selection of Suitably Exploitable Areas
- Selection of the surface of the stratum that will generate the residue
- Selection of exploitable surface that does not meet certain conditions.
- Depending on the slope percentage map, areas with a slope under 20% are classified as 1, and those over 20% are classified as 0.
- GIS is used to link the grid model and unify all those slope layers under 20%.
- A new layer was created with all those new polygons that met the required criteria.
- The entire forested area that may produce forest residues (i.e., that from the IFN) was replaced by the layer of exploitable area in the total zone.
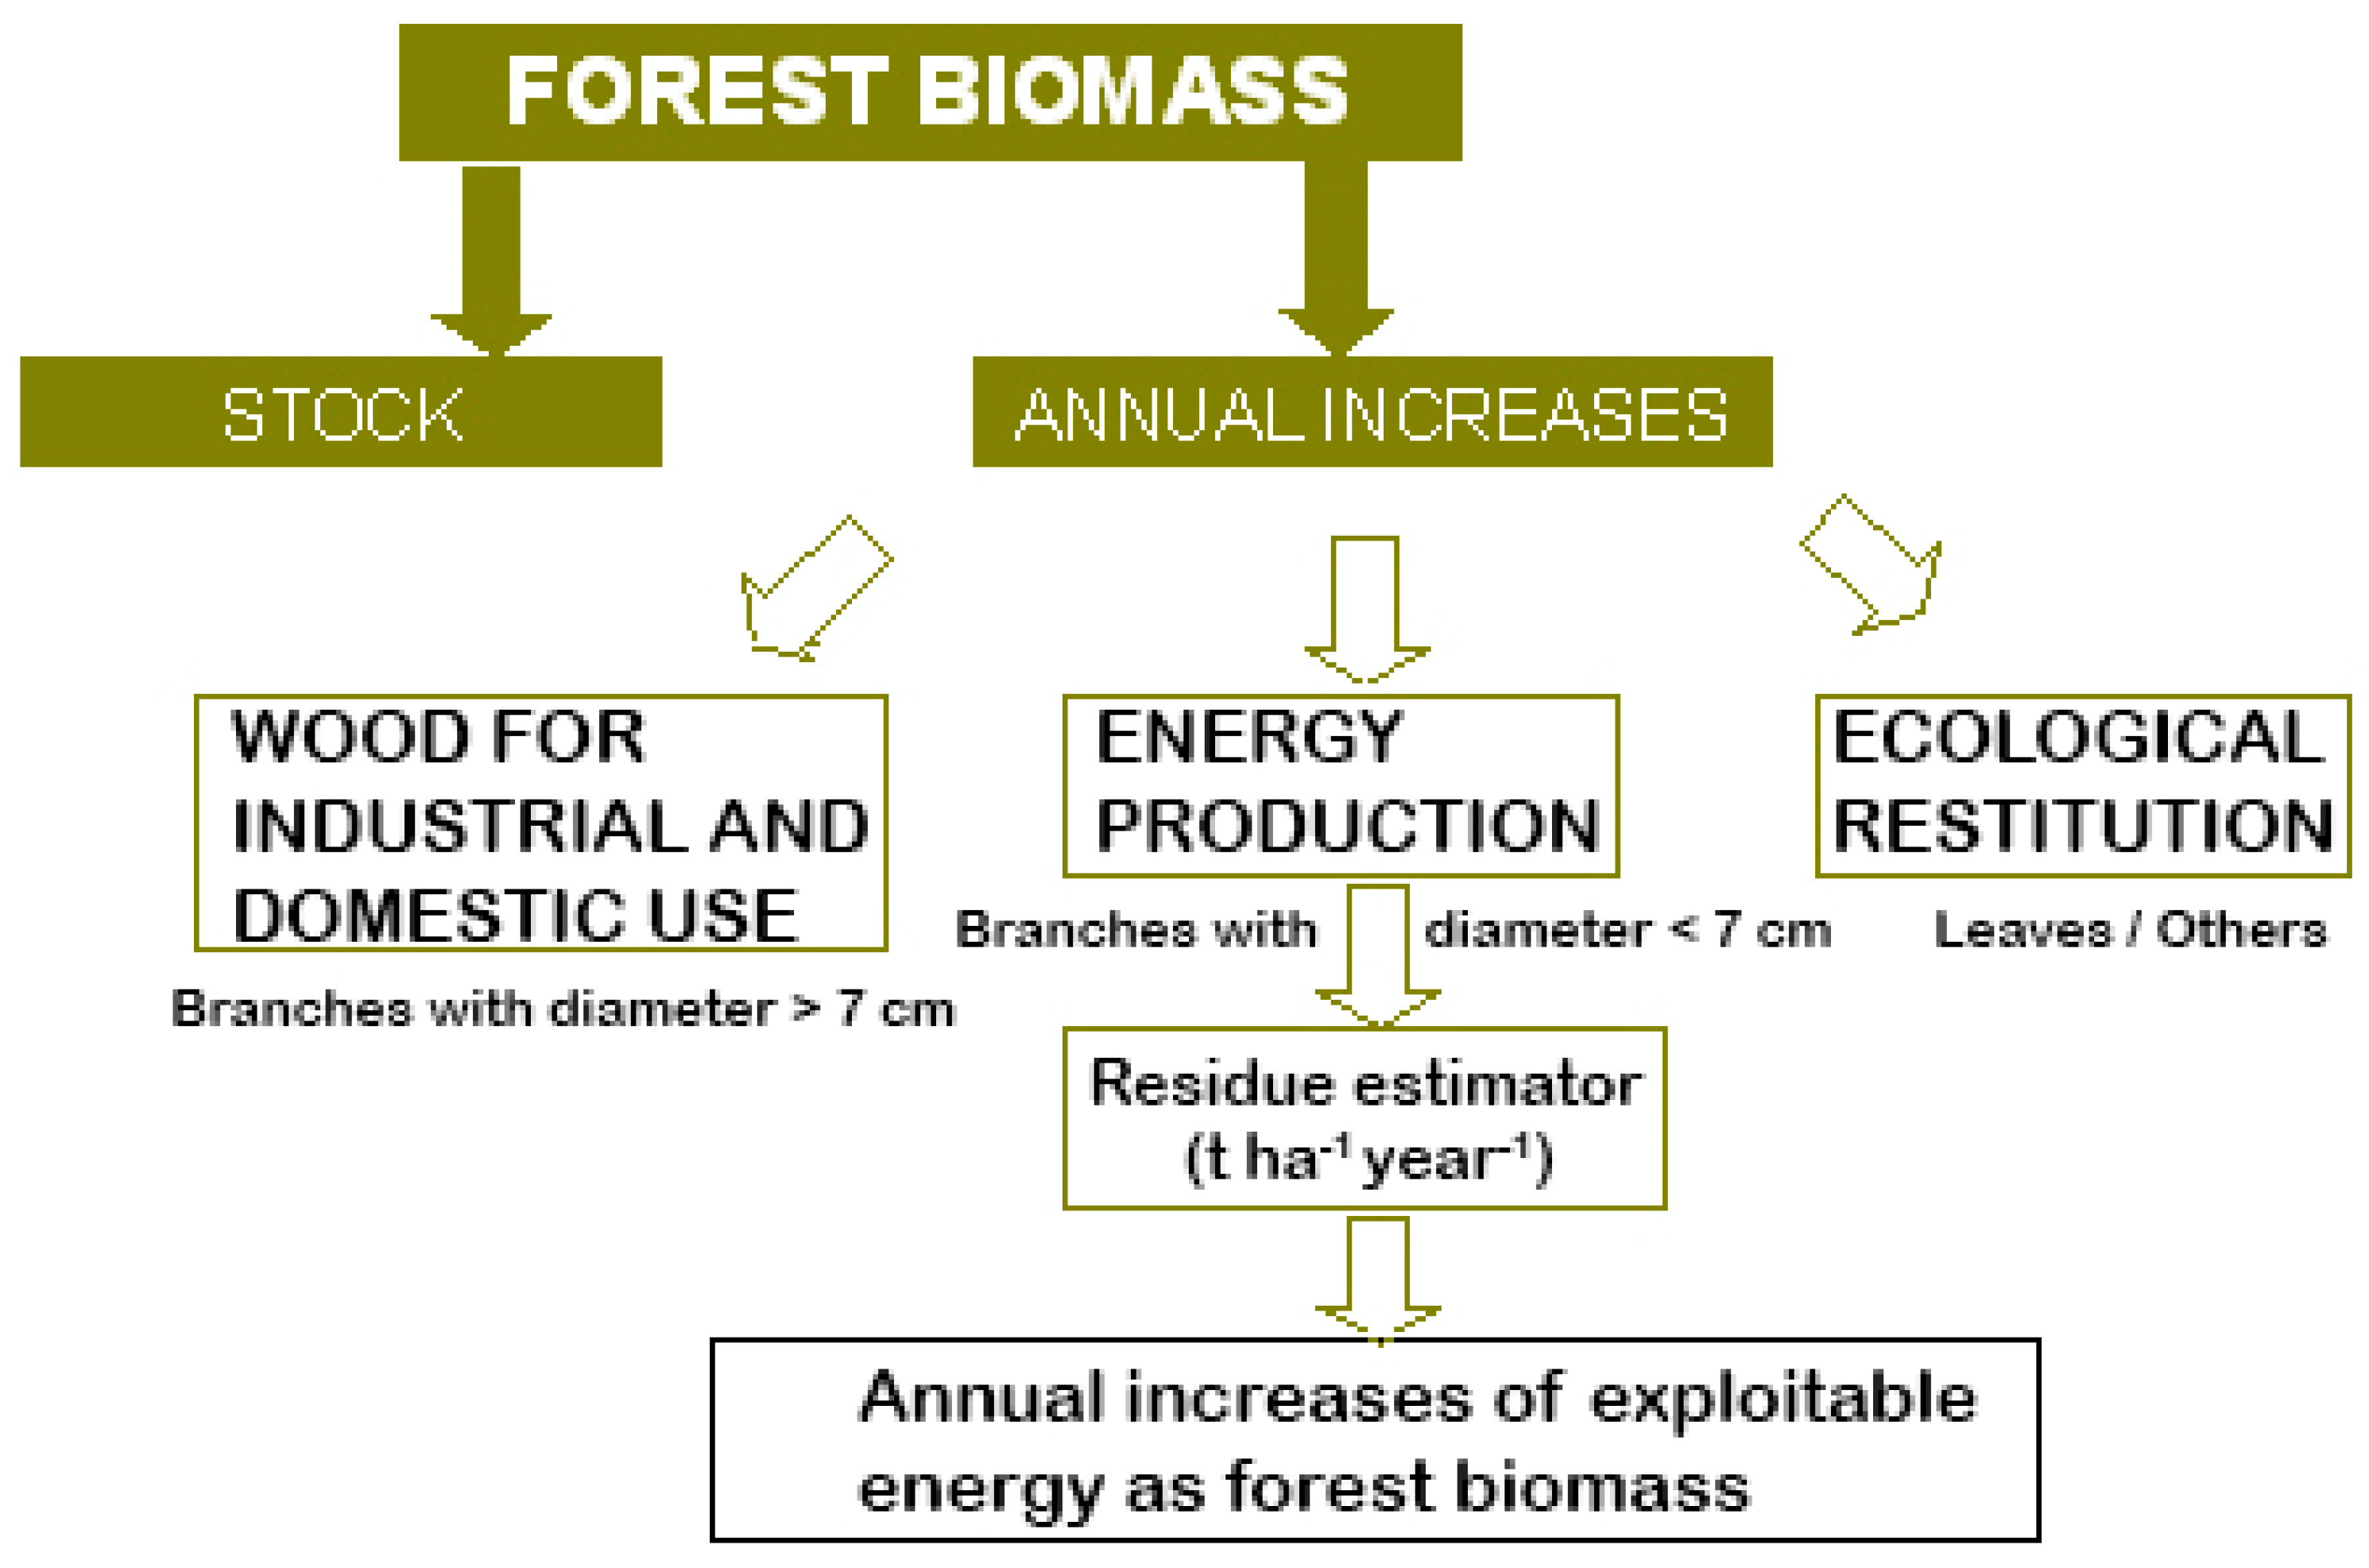
2.2. Determination of Available Forest Biomass
- Tree bole
- Branches with a diameter greater than 7 cm R > 7 cm
- Branches with diameters between 2 and 7 cm R 2–7 cm
- Branches with a diameter less than 2 cm R < 2 cm
- Leaves
- Domestic and industrial use of wood Tree bole and R > 7 cm.
- Energy production 2–7 cm and R < 2 cm.
- Ecological recovery Leaves
2.3. Calculation of Energy Potential
3. Results
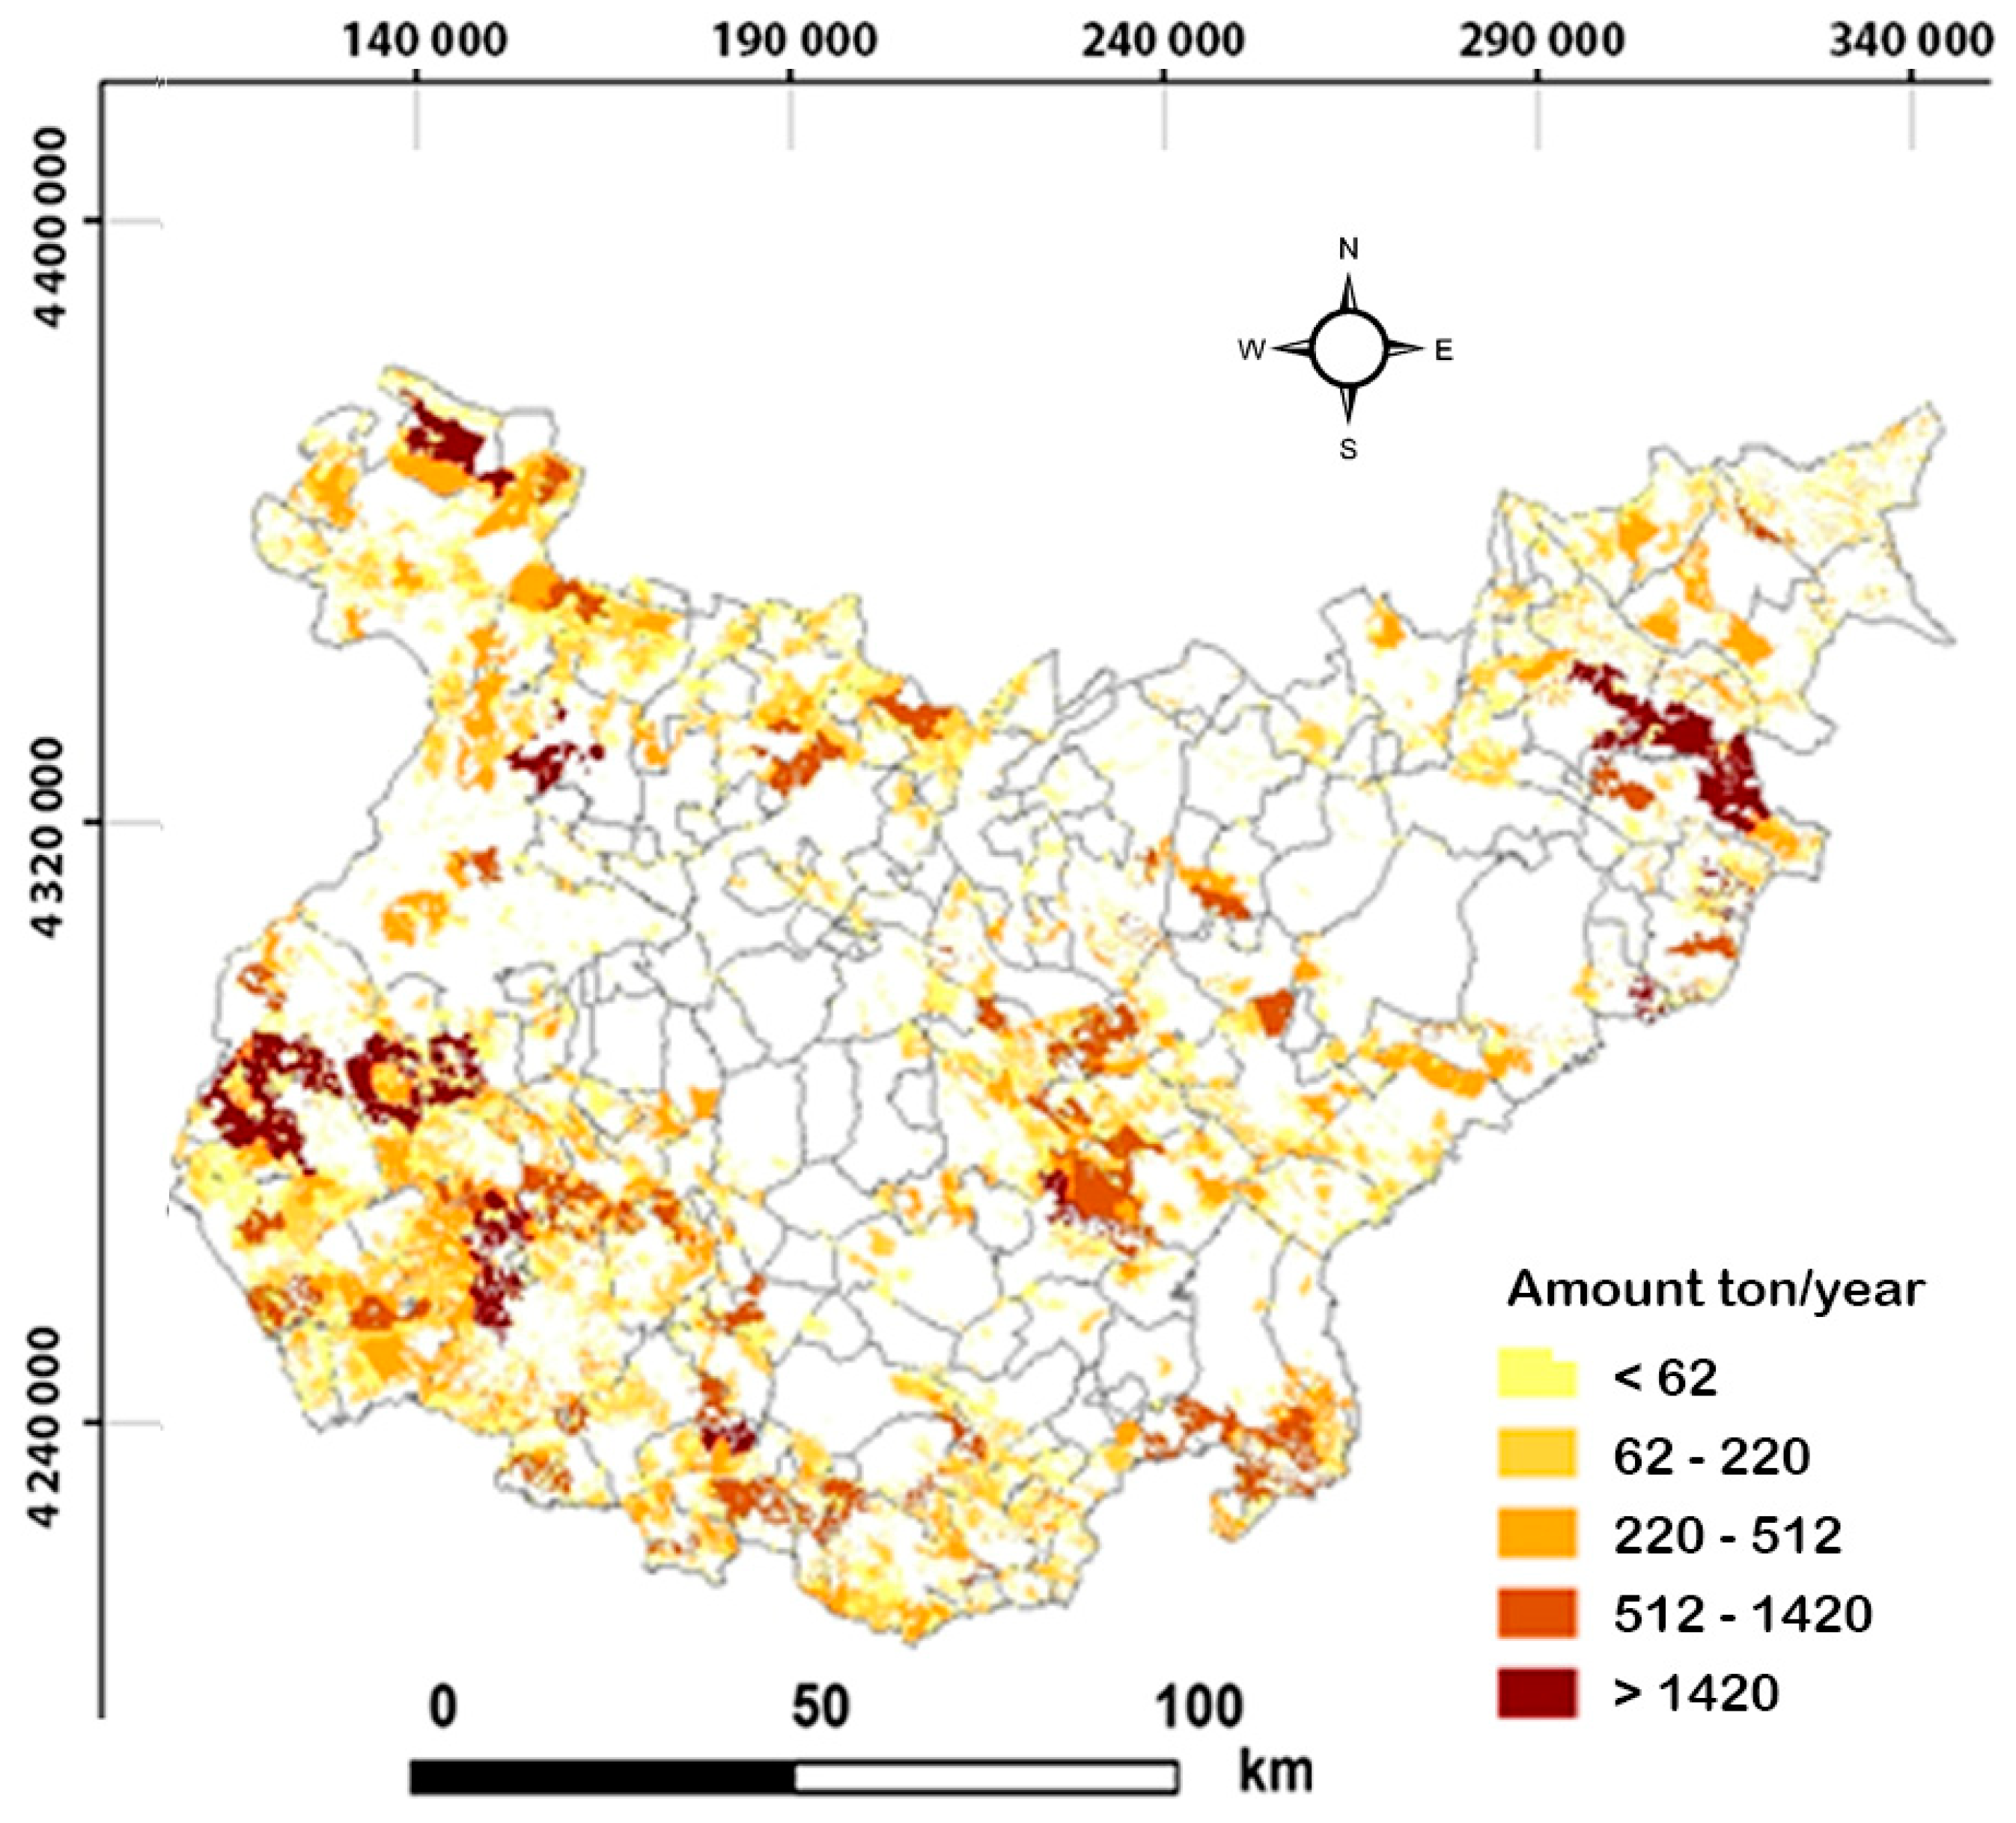
- Amount expressed in ton/year for a given municipality.
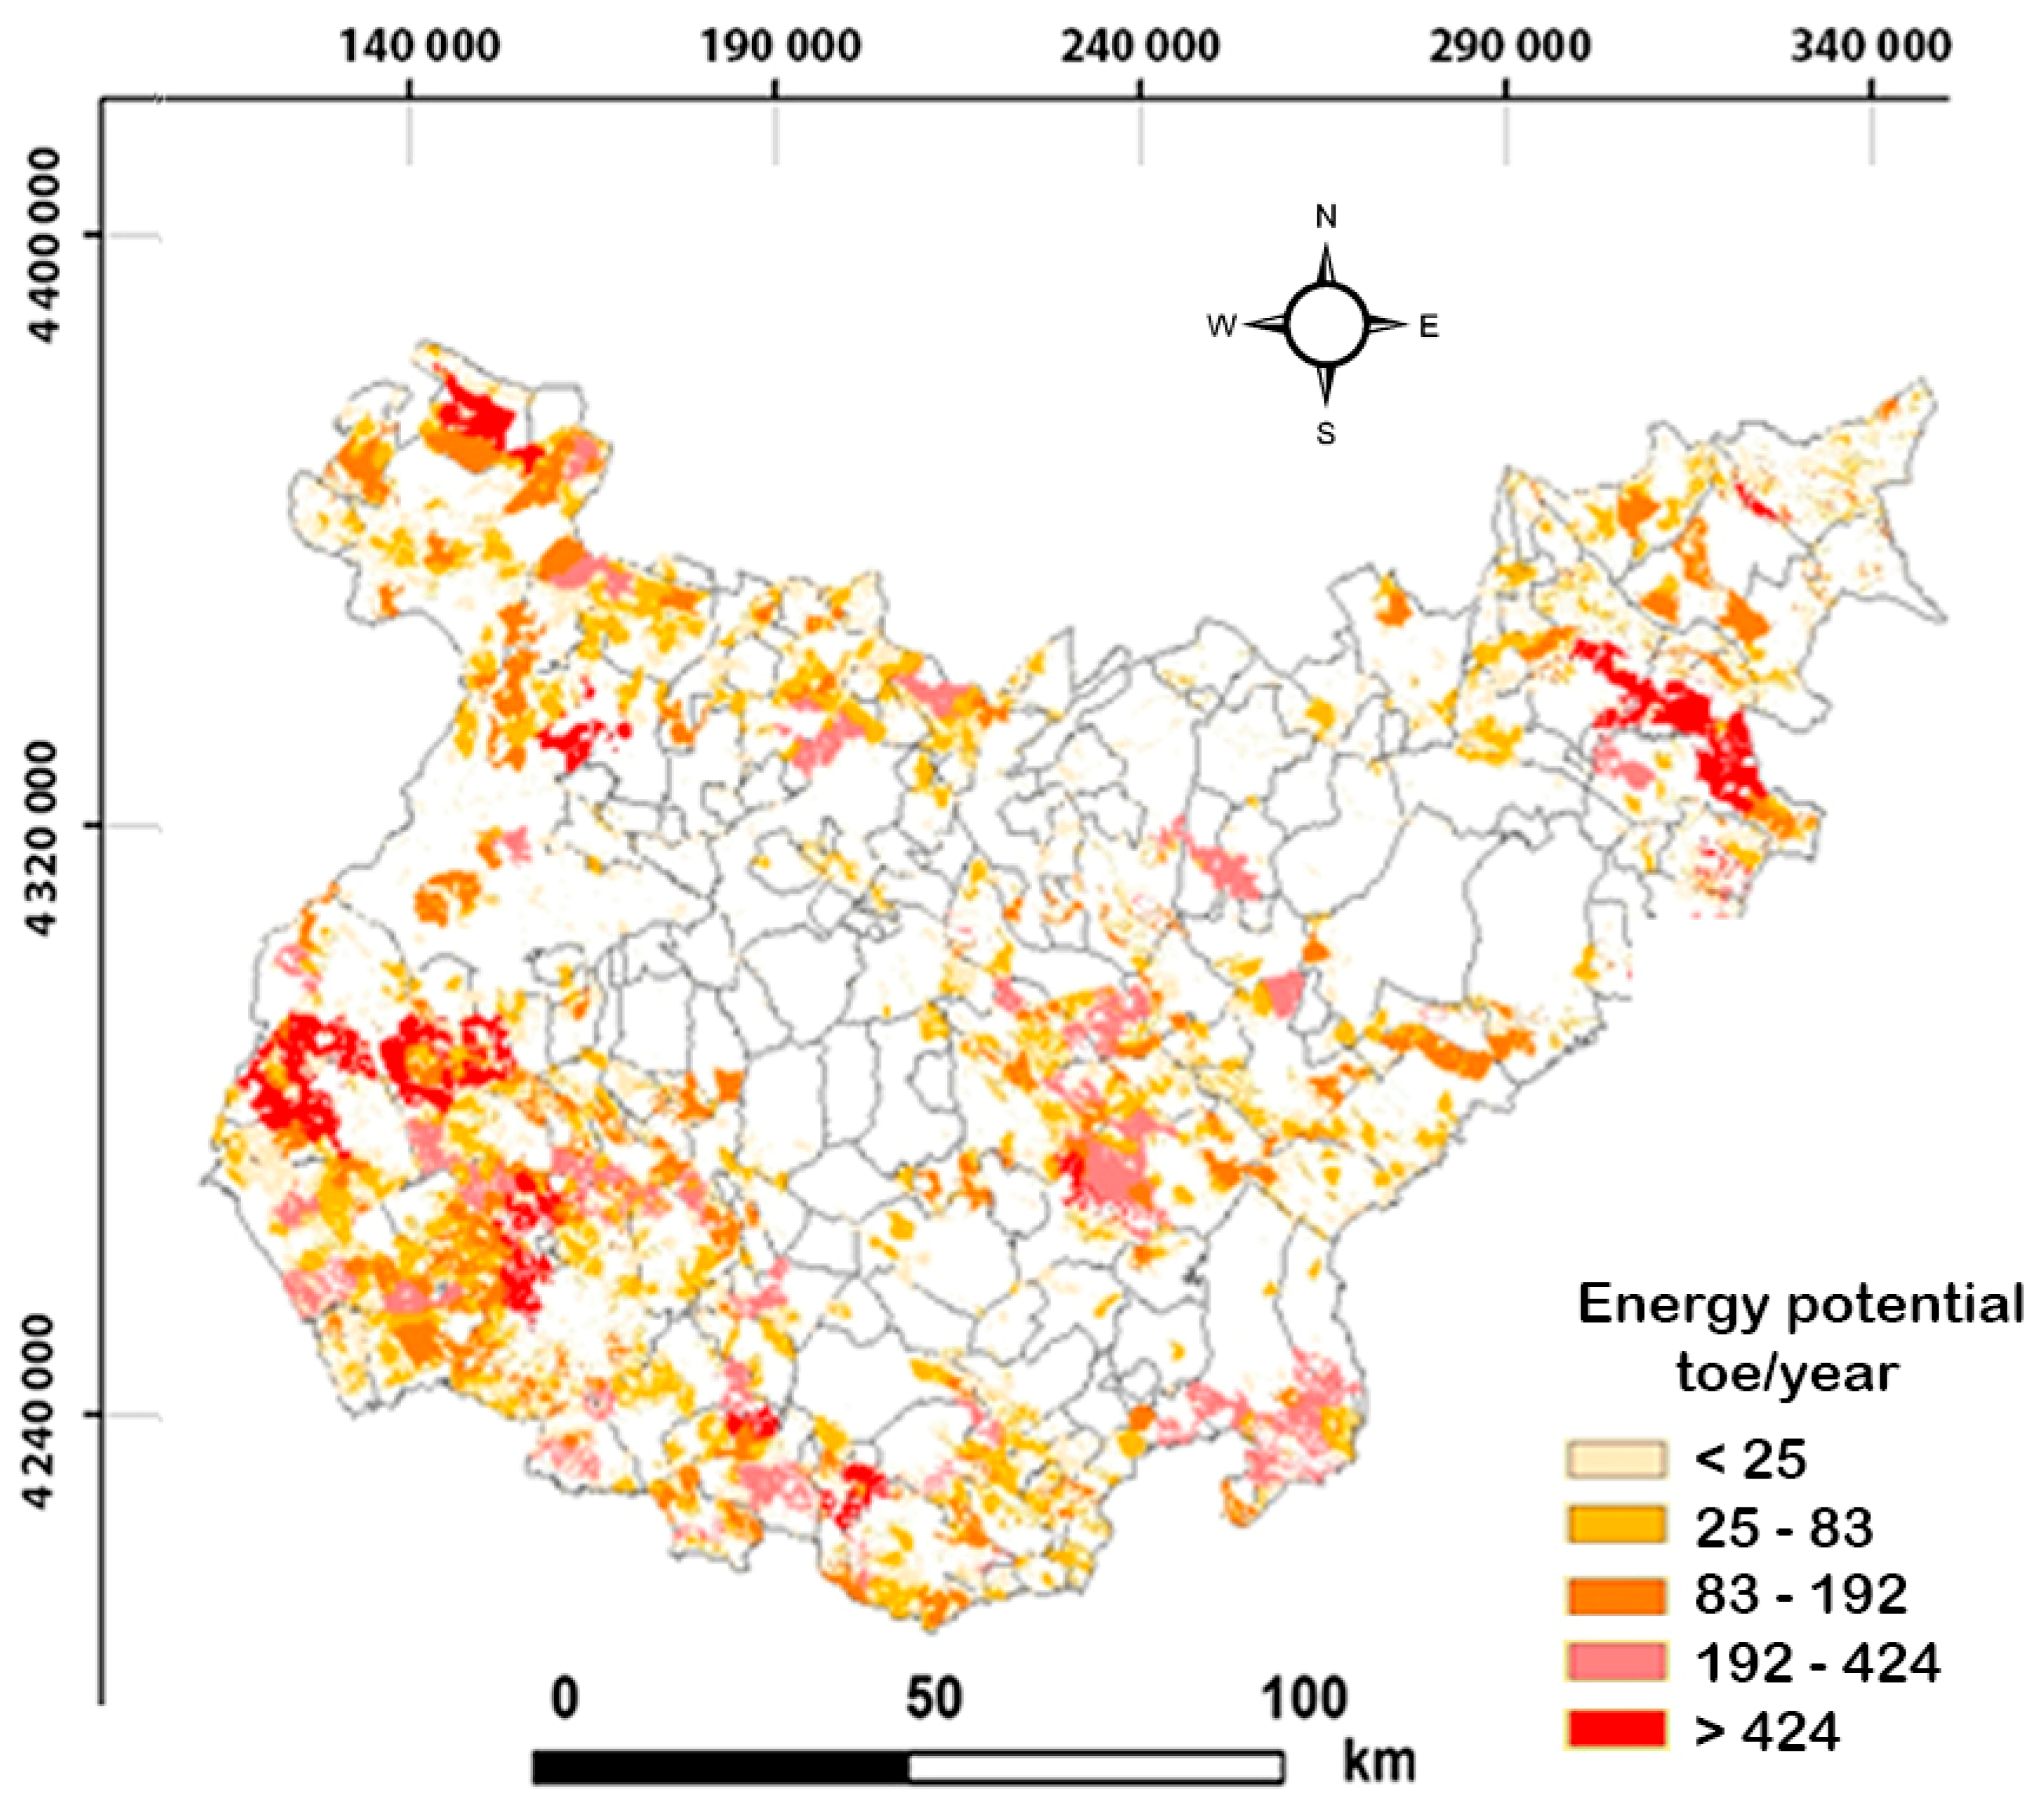
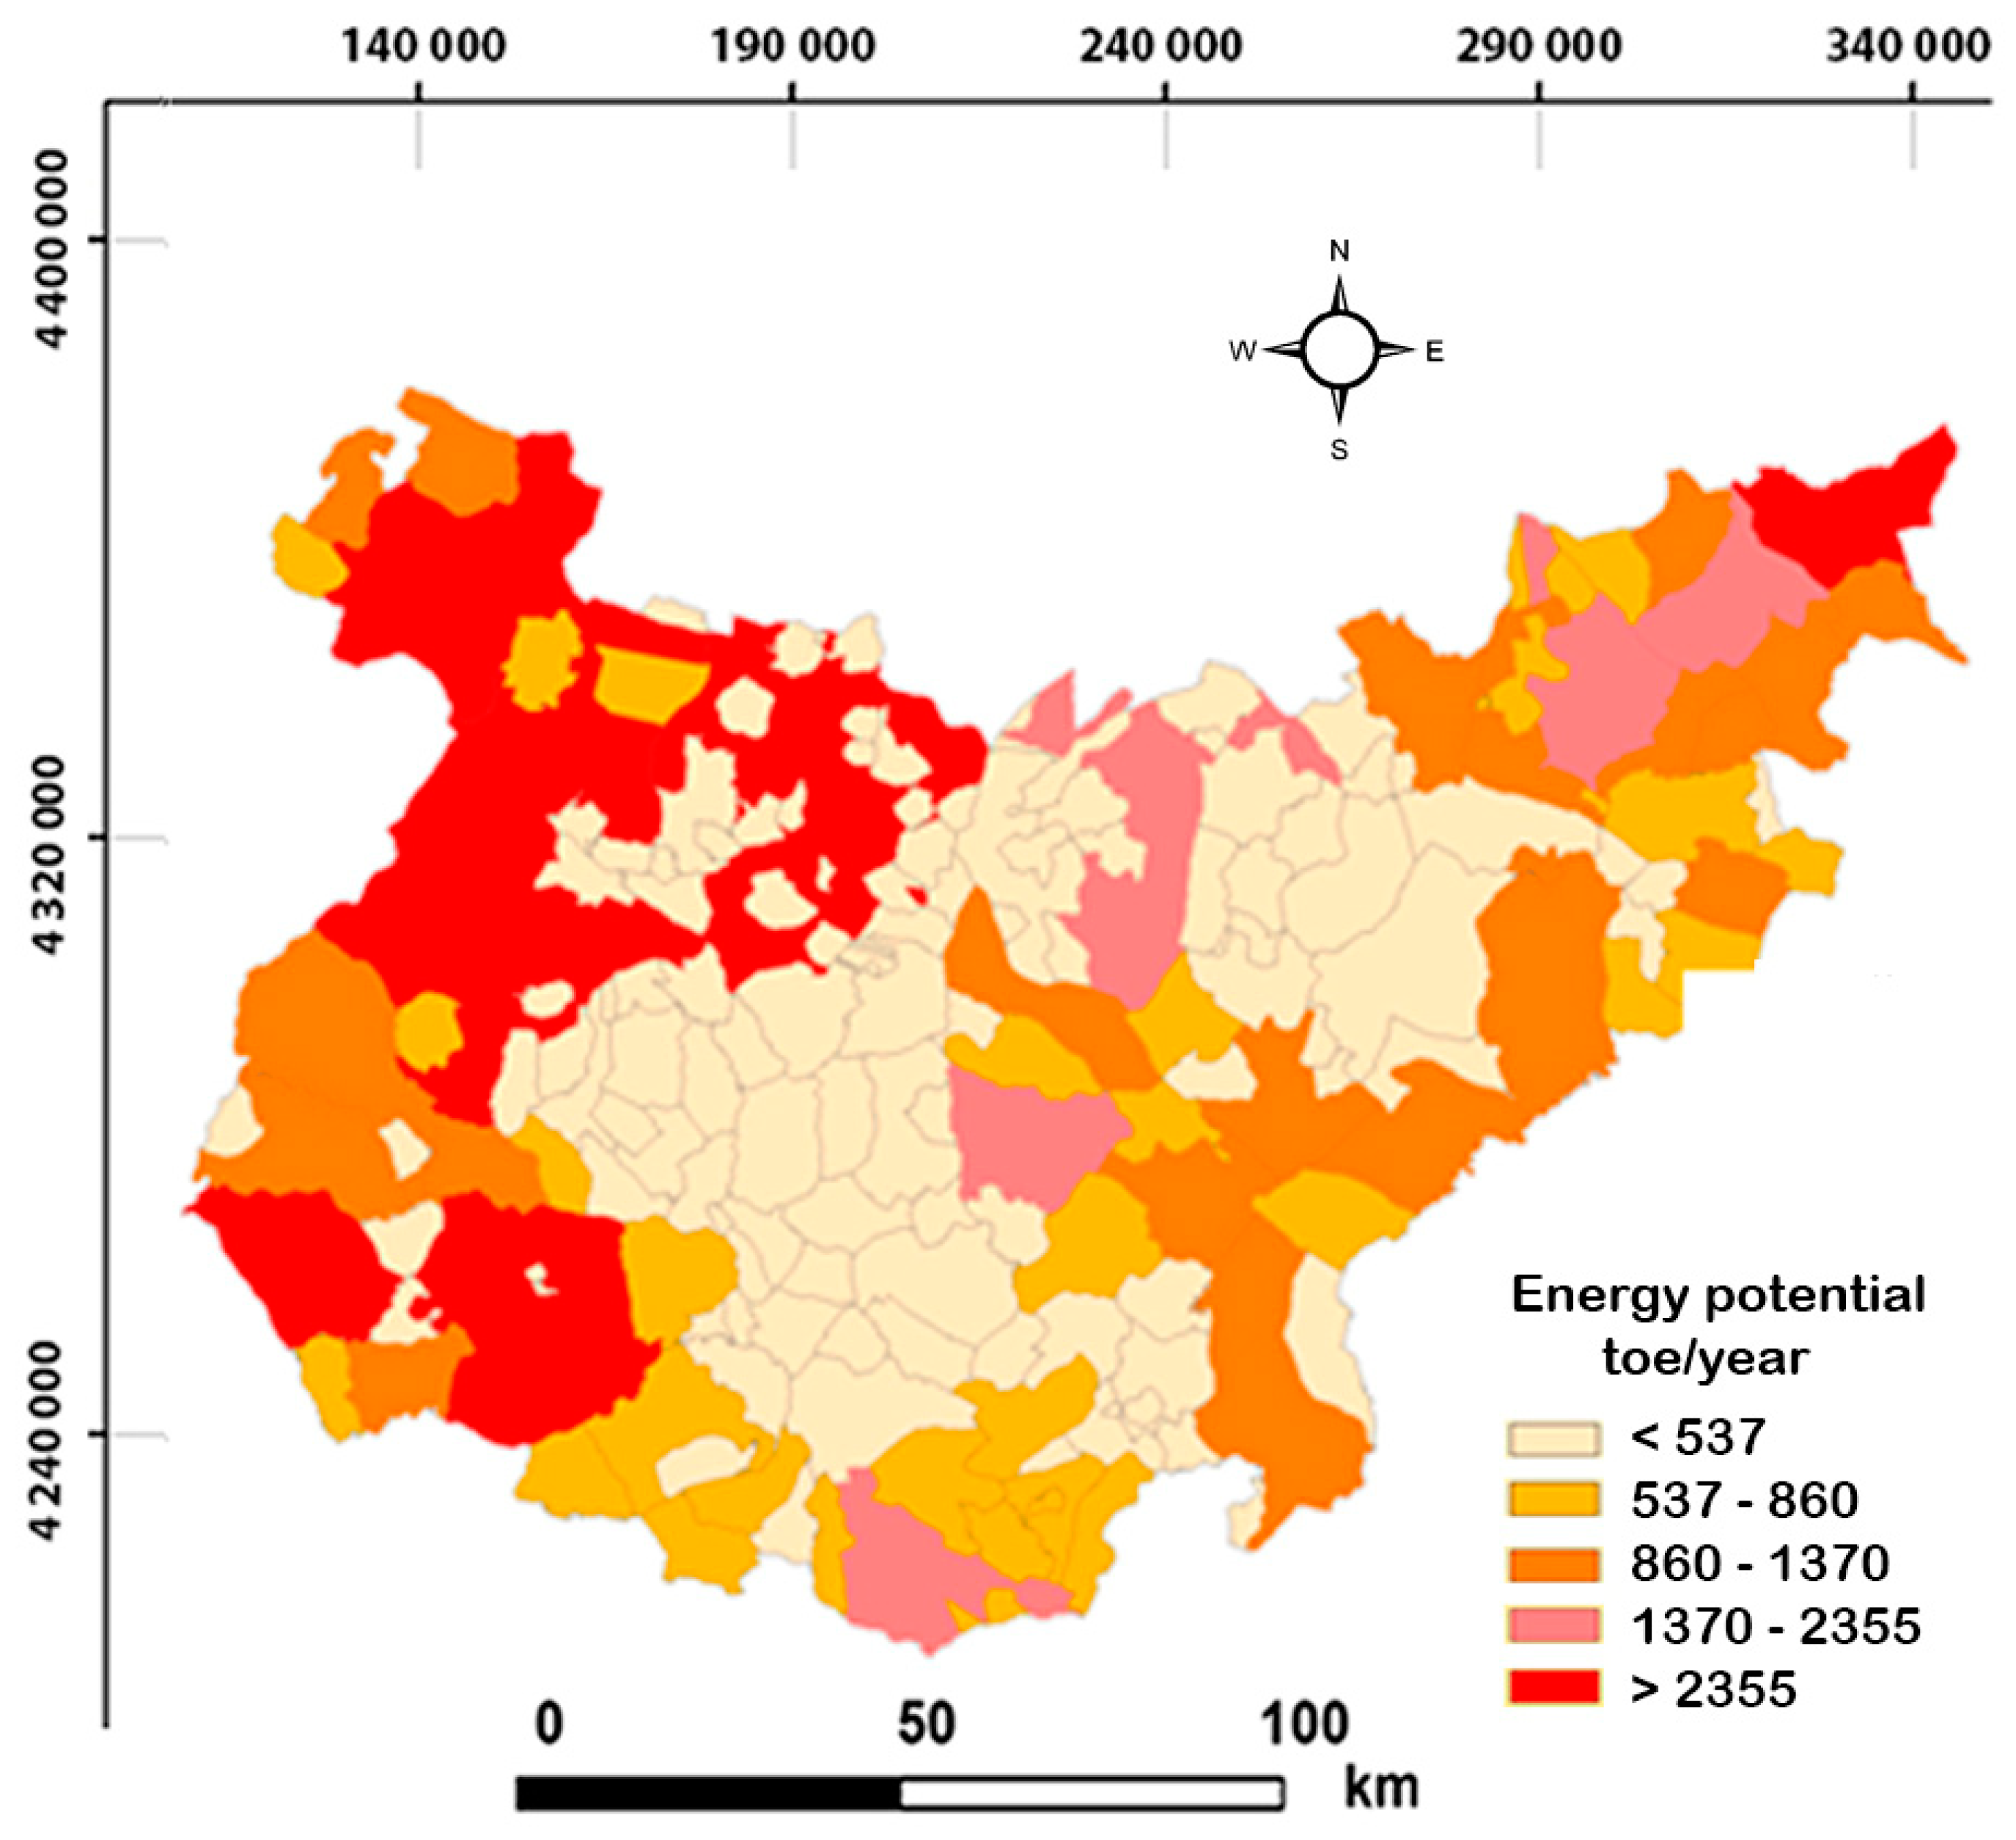
- Energy potential expressed in toe/year for a given municipality.
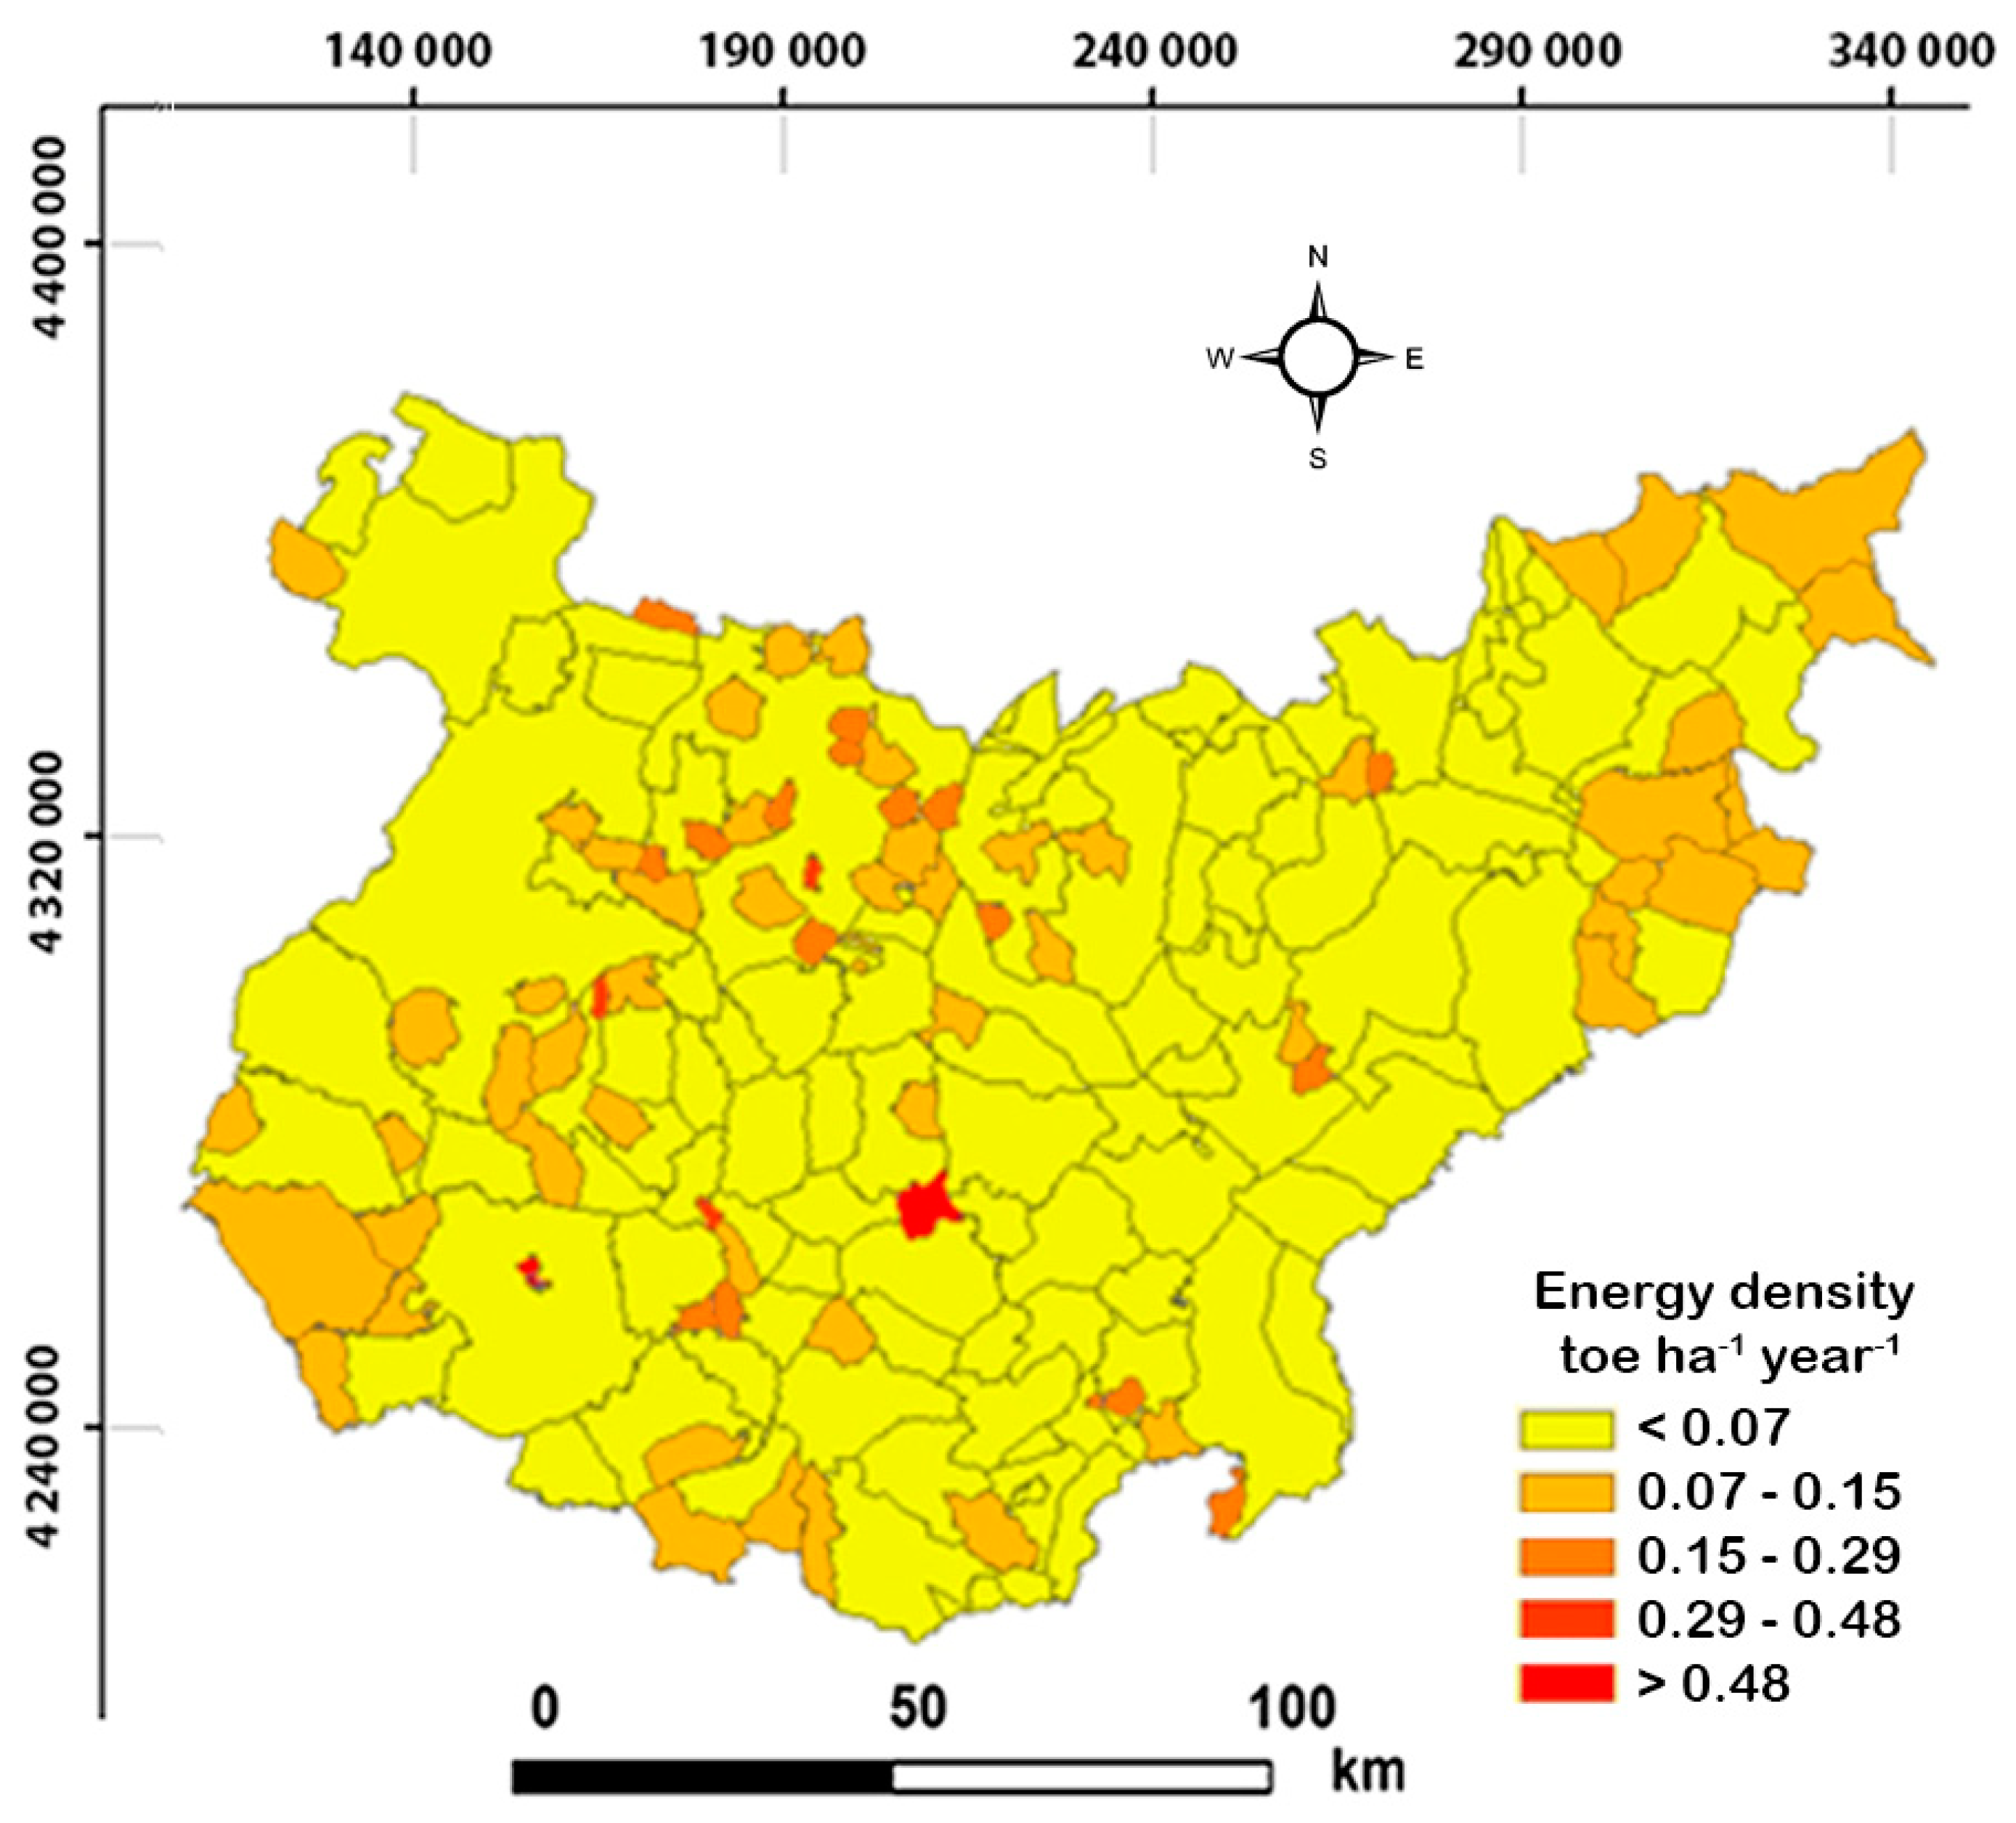
- Energy density for a given municipality (toe/ha year).
3.1. Geographic Distribution of the Variables Under Study
3.2. Municipality Level Data
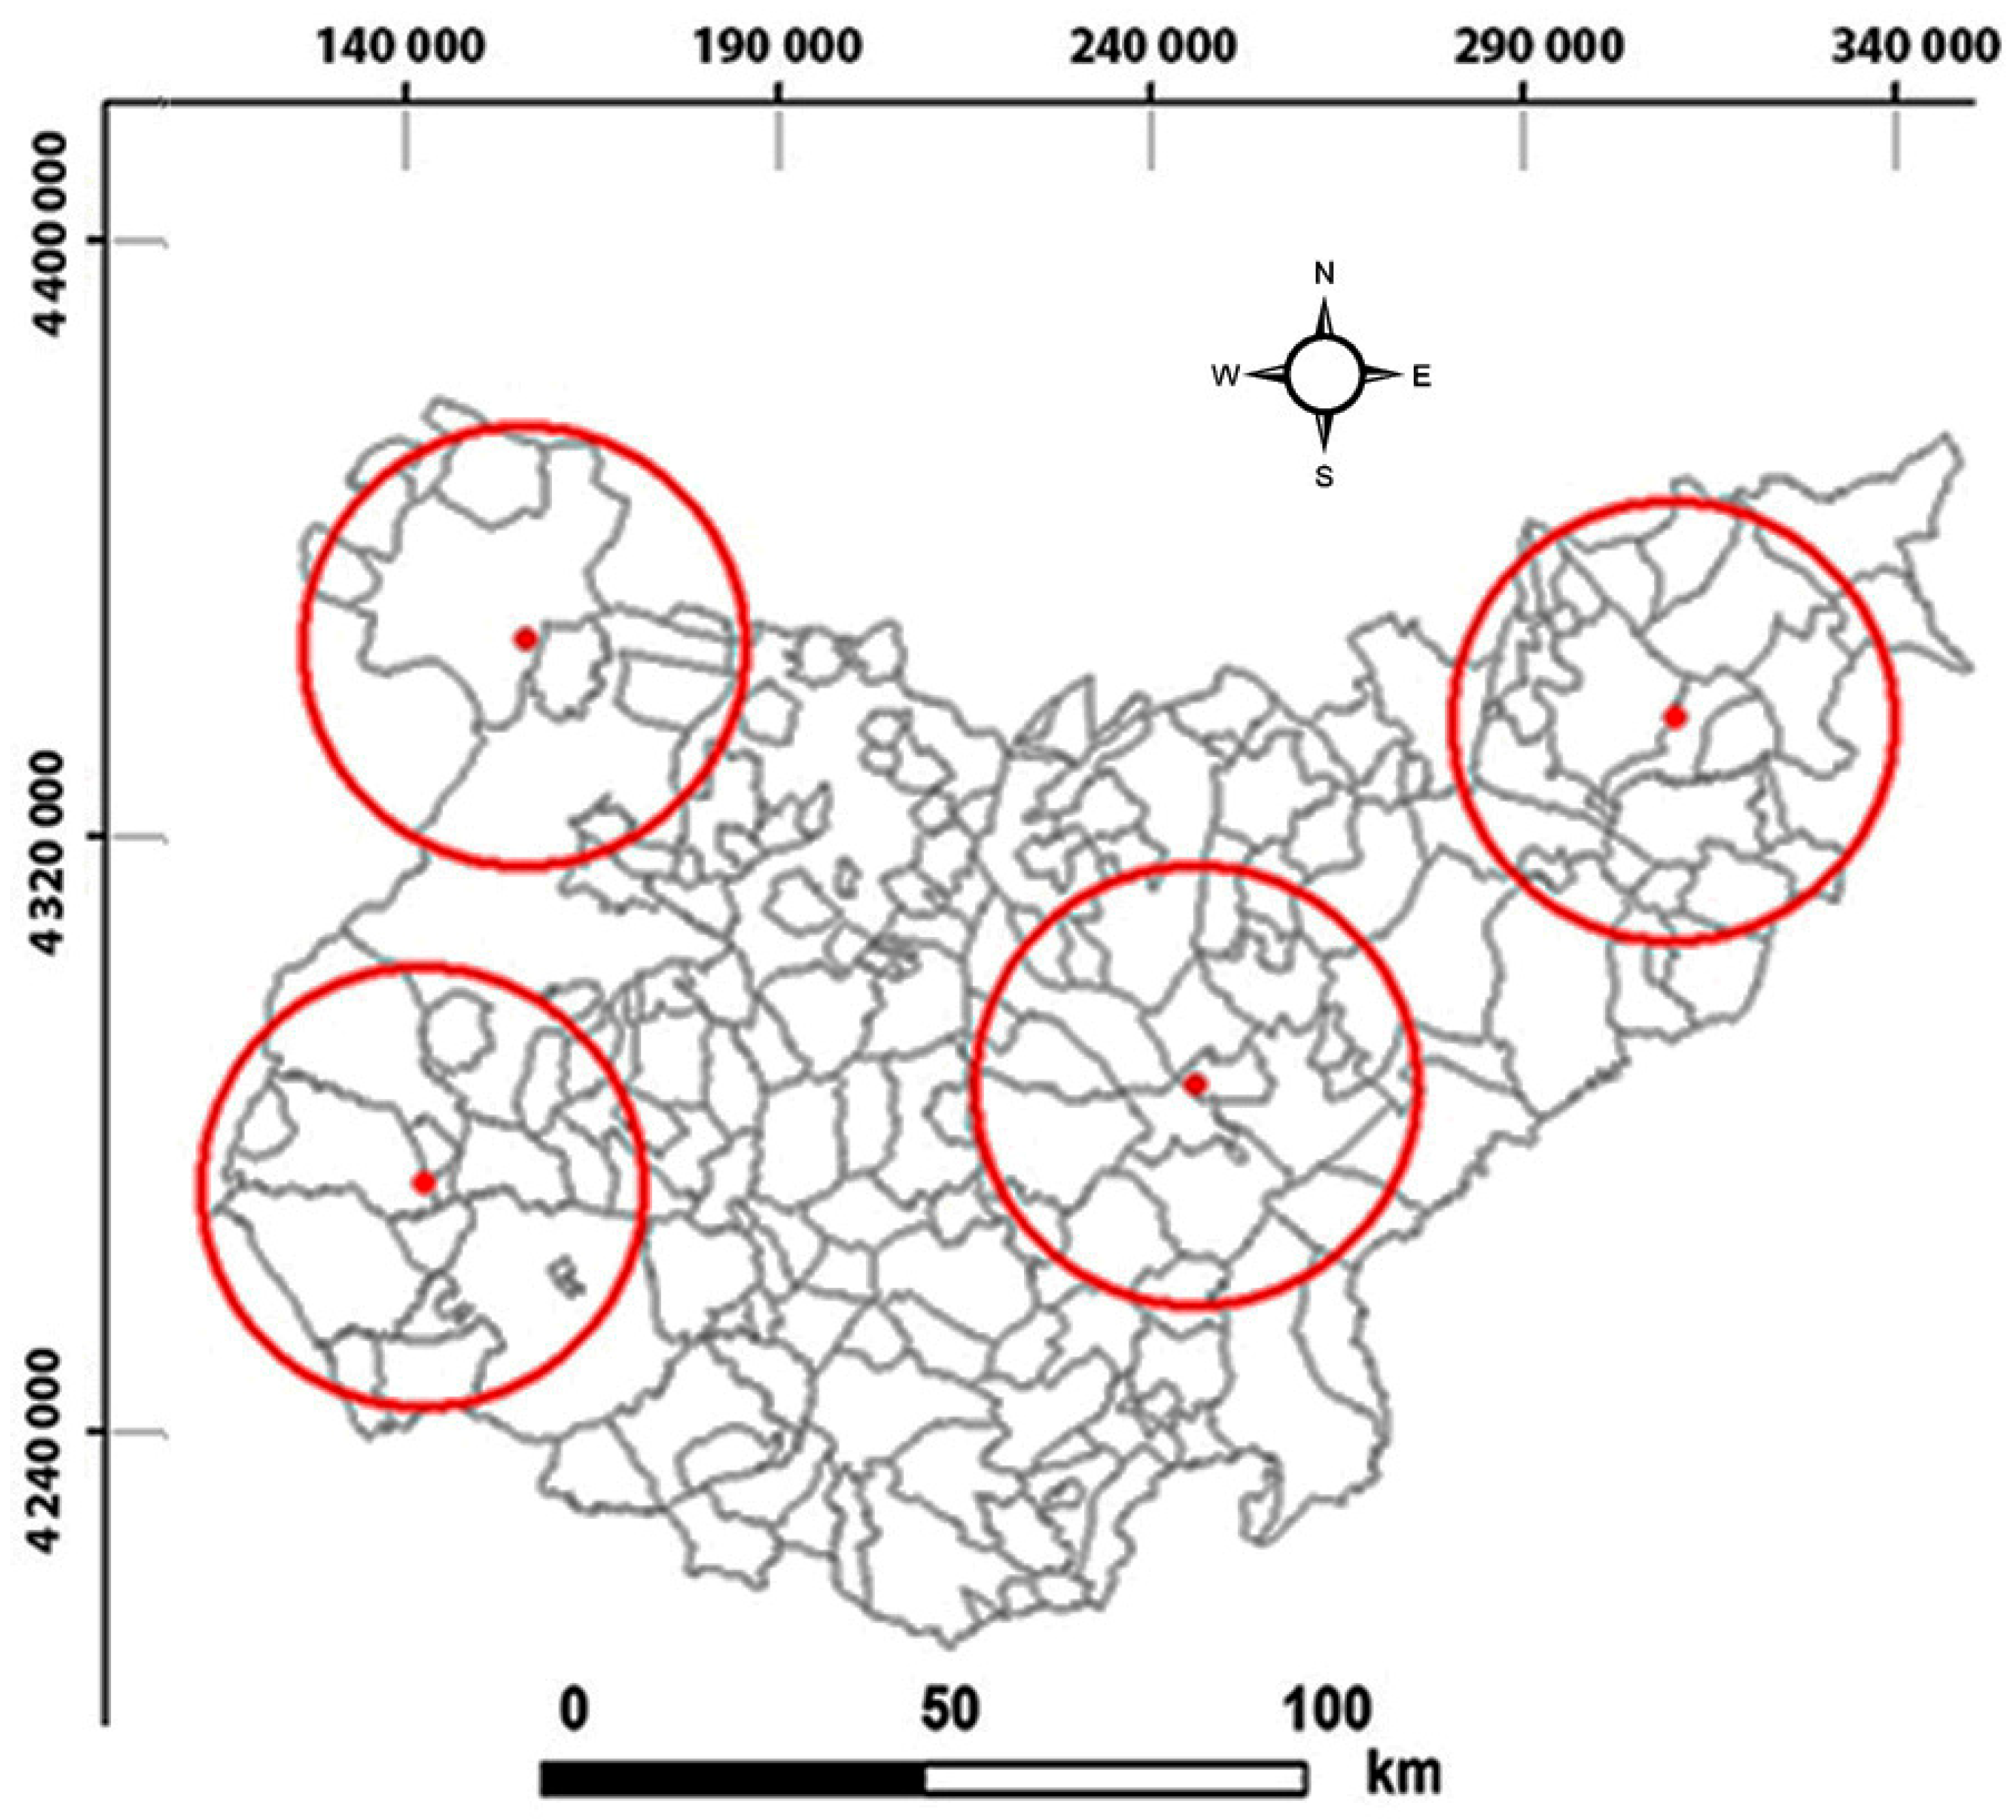
3.3. Location of Storage Centers of Forest Biomass
4. Discussion
- (i)
- Determination of layers of biomass extraction by plant species, excluding those areas “cut” with the GIS, such as those with a slope higher than 20% and those further away from roads and forest roads (over 4 km).
- (ii)
- Creation of specific Excel tables that collect the growths of the fraction of annual biomass in kg of dry matter per tree, and using logarithmic equations, as shown in Table 2.
- (iii)
- Classification of biomass in fractions, so that only diameters between 2 and 7 cm, and diameters smaller than 2 cm are used for energy production.
- (iv)
- Use of residual forest biomass estimators that represent the annual increase of biomass for energy use, which may be the greatest contribution of this procedure.
- (v)
- And finally, optimal location of storage centers, taking into account that biomass supply areas should be restricted to distances less than 30 km from the storage center, due to transportation costs.
5. Conclusions
Author Contributions
Funding
Acknowledgments
Conflicts of Interest
References
- San Miguel, A. La Dehesa Española. Origen, Tipología, Características y Gestión; Fundación Conde del Valle de Salazar: Madrid, Spain, 1994. [Google Scholar]
- Noon, C.H.; Daly, M.J. GIS-based biomass resource assessment with BRAVO. Biomass Bioenergy 1996, 10, 101–109. [Google Scholar] [CrossRef]
- Schneider, L.C.; Kinzig, A.P.; Larson, E.D.; Solórzano, L.A. Method for spatially explicit calculations of potential biomass yields and assessment of land availability for biomass energy production in Northeastern Brazil. Agric. Ecosyst. Environ. 2001, 84, 207–226. [Google Scholar] [CrossRef]
- Pérez-Atanet, C.; López Rodríguez, F.; Moral-García, F.J.; Ruiz, A. Análisis del potencial de biomasa forestal en Extremadura (España) mediante Sistemas de Información Geográfica. In X Congreso Internacional de Ingeniería de Proyectos; Asociación Española de Dirección e Ingeniería de Proyectos (AEIPRO): Valencia, Spain, 2006. [Google Scholar]
- Batzias, F.A.; Sidiras, D.K.; Spyrou, E.K. Evaluating livestock manures for biogas production: A GIS based method. Renew. Energy 2005, 30, 1161–1176. [Google Scholar] [CrossRef]
- Alves, D.N.; Míguez, J.L.; Saavedra, Á.; Arce, E. GIS-based residual forest biomass assessment and energy potential on a northern region of Portugal. Forests 2014, 5. [Google Scholar] [CrossRef]
- Viana, H.; Dias, S.; Marques, C.; Cruz, M.; Lopes, D.; Aranha, J. Establecimiento de modelos alométricos para prediçao da biomasa aerea da Pinus Pinaster. In Proceedings of the Actas do 6° Congresso Florestal Nacional, Ponta Delgada, Portugal, 6–9 October 2009. [Google Scholar]
- Viana, H.; Viana, H.; Dias, S.; Marques, C.; Cruz, M.; Lopes, D.; Aranha, J. Establecimiento de modelos alométricos para prediçao da biomasa aerea da Eucalyptus globulus. In Proceedings of the Actas do 6° Congresso Florestal Nacional, Ponta Delgada, Portugal, 6–9 October 2009. [Google Scholar]
- Carvalho, J. Crescimento, Produção e Ecologia de Povoamentos de Quercus Pyrenaica Willd. Em Portugal Continental; Universidade de Trás-os-Montes (UTAD): Vila Real, Portugal, 2000. [Google Scholar]
- Correia, A.C.; Tomé, M.; Pacheco, C.; Faias, S.; Dias, A.; Freire, J.; Ochoa-Carvalho, P.; Santos-Pereira, J. Biomass allometry and carbon factors for a Mediterranean pine (Pinus pinea L.) in Portugal. For. Syst. 2010, 19, 418–433. [Google Scholar] [CrossRef]
- Santibañez-Aguilar, J.; Flores-Tlacuahuac, A.; Betancourt Galvan, F.; Lozano-García, D.F.; Lozano, F.J. Facilities Location for Residual Biomass Production System Using Geographic Information System under Uncertainty. ACS Sustain. Chem. Eng. 2018, 6, 3331–3348. [Google Scholar] [CrossRef]
- Fernandes, U.; Costa, M. Potential of biomass residues for energy production and utilization in a region of Portugal. Biomass Bioenergy 2010, 34, 661–666. [Google Scholar] [CrossRef]
- Sahoo, K.; Hawkins, G.L.; Yao, X.; Samples, K.; Mani, S. GIS-based biomass assessment and supply logistics system for a sustainable biorefinery: A case study with cotton stalks in the Southeastern US. Appl. Energy 2016, 182, 260–273. [Google Scholar] [CrossRef] [Green Version]
- Vukašinović, V.; Gordić, D. Optimization and GIS-based combined approach for the determination of the most cost-effective investments in biomass sector. Appl. Energy 2016, 178, 250–259. [Google Scholar] [CrossRef]
- Haase, M.; Rösch, C.; Ketzer, D. GIS-based assessment of sustainable crop residue potentials in European regions. Biomass Bioenergy 2016, 86, 156–171. [Google Scholar] [CrossRef]
- Ma, J.; Scott, N.R.; DeGloria, S.D.; Lembo, A.J. Siting analysis of farm-based centralized anaerobic digester systems for distributed generation using GIS. Biomass Bioenergy 2005, 28, 591–600. [Google Scholar] [CrossRef]
- Zyadin, A.; Natarajan, K.; Latva-Käyrä, P.; Igliński, B.; Iglińska, A.; Trishkin, M.; Pelkonen, P.; Pappinen, A. Estimation of surplus biomass potential in southern and central Poland using GIS applications. Renew. Sustain. Energy Rev. 2018, 89, 204–215. [Google Scholar] [CrossRef]
- Pérez-Atanet, C.; López-Rodríguez, F.; Ruíz, A. Potencial de la Biomasa Forestal en Extremadura y su aprovechamiento energético. In Proceedings of the CONEERR 2005, Congreso Nacional Sobre la Energías Renovables, 14–16 November 2005; ARGEM: Murcia, Spain. [Google Scholar]
- Ranta, T. Logging residues from regeneration felling for biofuel production. A GIS-based availability analysis in Finland. Biomass Bioenergy 2005, 28, 171–182. [Google Scholar] [CrossRef]
- Aldana, H.; Lozano, F.J.; Acevedo, J. Evaluating the potential for producing energy from agricultural residues in México using MILP optimization. Biomass Bioenergy 2014, 67, 372–389. [Google Scholar] [CrossRef]
- Frombo, F.; Minciardi, R.; Robba, M.; Sacile, R. A decision support system for planning biomass-based energy production. Energy 2009, 34, 362–369. [Google Scholar] [CrossRef]
- Gómez, A.; Rodrigues, M.; Montañés, C.; Dopazo, C.; Fueyo, N. The potential for electricity generation from crop and forestry residues in Spain. Biomass Bioenergy 2010, 34, 703–719. [Google Scholar] [CrossRef]
- Mitchell, C.P. Development of decision support systems for bioenergy applications. Biomass Bioenergy 2000, 18, 265–278. [Google Scholar] [CrossRef]
- Voivontas, D.; Assimacopoulos, D.; Koukios, E.G. Assessment of biomass potential for power production: a GIS based method. Biomass Bioenergy 2001, 20, 101–112. [Google Scholar] [CrossRef]
- López-Rodríguez, F.; Pérez-Atanet, C.; Cuadros, F.; Ruiz-Celma, A. Spatial assessment of the bioenergy potential of forest residues in the western province of Spain, Cáceres. Biomass Bioenergy 2009, 33, 1358–1366. [Google Scholar] [CrossRef]
- Kinoshita, T.; Inoue, K.; Iwao, K.; Kagemoto, H.; Yamagata, Y. A spatial evaluation of forest biomass using GIS. Appl. Energy 2009, 86, 1–8. [Google Scholar] [CrossRef]
- Beccali, M.; Columba, P.; D’Alberti, V.; Franzitta, V. Assessment of bioenergy potential in Sicily: A GIS-based support methodology. Biomass Bioenergy 2009, 33, 79–87. [Google Scholar] [CrossRef]
- Ćosić, B.; Stanić, Z.; Duić, N. Geographic distribution of economic potential of agricultural and forest biomass residual for energy use: Case study Croatia. Energy 2011, 36, 2017–2028. [Google Scholar] [CrossRef] [Green Version]
- Velázquez-Martí, B.; Fernández-González, E.; López-Cortés, I.; Salazar-Hernández, D.M. Quantification of the residual biomass obtained from pruning of trees in Mediterranean olive groves. Biomass Bioenergy 2011, 35, 3208–3217. [Google Scholar] [CrossRef]
- Gil, M.V.; Blanco, D.; Carballo, M.T.; Calvo, L.F. Carbon stock estimates for forests in the Castilla y León region, Spain. A GIS based method for evaluating spatial distribution of residual biomass for bio-energy. Biomass Bioenergy 2011, 35, 243–252. [Google Scholar] [CrossRef]
- Viana, H.; Cohen, W.B.; Lopes, D.; Aranha, J. Assessment of forest biomass for use as energy. GIS-based analysis of geographical availability and locations of wood-fired power plants in Portugal. Appl. Energy 2010, 87, 2551–2560. [Google Scholar] [CrossRef]
- Ministerio de Medio Ambiente y Medio Rural y Marino. National Forestry Inventary for the Province of Badajoz (IFN); Ministerio de Medio Ambiente y Medio Rural y Marino: Madrid, Spain, 2017.
- Diputación Provincial de Badajoz. Road Map of the Province of Badajoz. 2016. Available online: http://sig.dip-badajoz.es (accessed on 25 March 2019).
- Consejería de Agricultura, Desarrollo Rural, Medio Ambiente y Energía de la. Junta de Extremadura; 1ª Revision of the Forest Plan of Extremadura; Consejería de Agricultura, Desarrollo Rural, Medio Ambiente y Energía: Badajoz, Spain, 2012.
- EUROSTAT. Production and Consumption of Wood in the EU27, Almost Half of Renewable Energy Comes from Wood and Wood Waste. In EUROSTAT Press Releases Database; EUROSTAT: Luxembourg, 2012. Available online: http://europa.eu/rapid/search.htm (accessed on 21 November 2018).
- AEBIOM. European Bioenergy Outlook 2012; AEBIOM: Bruxelles, Belgium, 2012; Available online: http://www.jotformeu.com/AEBIOMstatisticalreport/2012_European_Bioenergy_Outlook (accessed on 18 February 2019).
- Santibañez-Aguilar, J.E.; González-Campos, J.B.; Ponce-Ortega, J.M.; Serna-González, M.; El-Halwagi, M.M. Optimal Planning of a Biomass Conversion System Considering Economic and Environmental Aspects. Ind. Eng. Chem. Res. 2011, 50, 8556–8570. [Google Scholar] [CrossRef]
- Santibañez-Aguilar, J.E.; González-Campos, J.B.; Ponce-Ortega, J.M.; Serna-González, M.; El-Halwagi, M.M. Optimal planning and site selection for distributed multiproduct biorefineries involving economic, environmental and social objectives. J. Clean. Prod. 2014, 65, 270–294. [Google Scholar] [CrossRef]
- Perez-Ortiz, P.; Esteban-Pascual, L.S. Cuantificación de los recursos de biomasa forestal en la provincia de Soria y evaluación de alternativas para su aprovechamiento energético. Montes Revista de Ámbito Forestal 2004, 75, 17–25. [Google Scholar]
- Graham, R.L.; English, B.C.; Noon, C.E. A geographic information system-based modeling system for evaluating the cost of delivered energy crop feedstock. Biomass Bioenergy 2000, 18, 309–329. [Google Scholar] [CrossRef]
- Montoya Oliver, J.M. Encinas y Encinares; Mundi-Prensa: Madrid, Spain, 1993. [Google Scholar]
- Montero, G.; Ruiz-Peinado, R.; Muñoz, M. Producción de Biomasa y Fijación de CO2 Por Los Bosques Españoles; Instituto Nacional de Investigaciones y Tecnología Agraria y Alimentaria: Madrid, Spain, 2005. [Google Scholar]
- Pérez-Atanet, C. Modelización Mediante Sistemas de Información Geográfica Para la Evaluación de la Biomasa Forestal. Determinación del Potencial Energético Para la Generación de Biocombustibles. Ph.D. Thesis, Universidad de Extremadura, Badajoz, Spain, 2010. [Google Scholar]
- Lopez-Rodriguez, F.; Perez Atanet, C.; Cadahia, D.; Ruiz, A. Producción de Biomasa Forestal y Potencial Energético en la Provincia de Cáceres; Diputación de Cáceres: Cáceres, Spain, 2011. [Google Scholar]
- Cuadros, F.; González, A.; Ruiz-Celma, A.; López-Rodríguez, F.; García-Sanz-Calcedo, J.; García, J.A. Qué pasa con la biomasa? Revista Española de Física 2011, 25, 13–22. [Google Scholar]
- Universidad de Extremadura. Poderes Caloríficos de Especies Forestales; Universidad de Extremadura: Badajoz, Spain, 2006. [Google Scholar]
- García Sanz-Calcedo, J.; Cuadros, F.; López, F. Eficiencia de una caldera de biomasa en un centro hospitalario. Aprovechamiento de huesos de aceitunas triturados para producción de calor. Dyna 2011, 86, 343–349. [Google Scholar]
- Al-Kassir, A.; Coelho, P.; García-Sanz-Calcedo, J.; Moral, F.J.; Al-Karany, R.K.; Yusaf, T. An Experimental Technology of Drying and Clean Combustion of Biomass Residues. Appl. Sci. 2018, 8, 905. [Google Scholar] [CrossRef]
- Mateos, E.; Ormaetxea, L. Sustainable Renewable Energy by Means of Using Residual Forest Biomass. Energies 2019, 12, 13. [Google Scholar] [CrossRef]
- Cuadros, F.; González-González, A.; Ruiz-Celma, A.; López-Rodríguez, F.; García-Sanz-Calcedo, J.; García, J.A.; Mena, A. Challenges of biomass in a development model based on renewable energies. Underst. Complex Syst. 2013, 1, 747–768. [Google Scholar]
- Lopez-Rodriguez, F.; Cuadros, C.; Segador-Vegas, C.; Ruiz-Celma, A.; Sanz-Calcedo, J.G.; Mena, A.; Soutullo, S.; Giancola, E.; Tevar, J.A.F.; Heras, M.R. Peter Building: An example of bioclimatic building and integration of renewable energies into the edification. Dyna 2011, 86, 212–221. [Google Scholar]
- Eteiba, M.B.; Barakat, S.; Samy, M.M.; Wahba, W.I. Optimization of an off-grid PV/Biomass hybrid system with different battery technologies. Sustain. Cities Soc. 2018, 40, 713–727. [Google Scholar] [CrossRef]


| Species | % | Species | % |
|---|---|---|---|
| Alnus glutinosa | <0.5 | Pinus pinea | 2.4 |
| Castanea Sativa | <0.5 | Populus C. | <0.5 |
| Cupressus sempervirens | <0.5 | Quercus f. | <0.5 |
| Eucalyptus camaldulensis | 6.1 | Quercus ilex | 81.0 |
| Eucalyptus globulus | 0.7 | Quercus pyrenaica | <0.5 |
| Fraxinus angustifolia | <0.5 | Quercus suber | 8.0 |
| Pinus halepensis | <0.5 | Ulmus minor | <0.5 |
| Pinus pinaster | 1.1 | Populus nigra | <0.5 |
| Salix spp. | <0.5 | Tamarix spp. | <0.5 |
| Y | Species | |||||||
|---|---|---|---|---|---|---|---|---|
| Pinus pinaster Ait. | Quercus ilex L. | Quercus suber | Eucalyptus Camal. | |||||
| a | b | a | b | a | b | a | b | |
| BT | −3.00347 | 2.49641 | −2.31596 | 2.47745 | −3.36627 | 2.60685 | −1.33002 | 2.19404 |
| BF | −3.43957 | 2.56636 | −1.99607 | 2.01754 | −3.01942 | 2.25213 | −2.20421 | 2.38196 |
| BR7 | −23.0418 | 6.52359 | −5.3470 | 3.04363 | −6.43076 | 3.21136 | ||
| BR2-7 | −6.66264 | 2.63946 | −2.52588 | 2.00304 | −3.3924 | 1.99526 | −2.67562 | 1.87183 |
| BR2 | −4.66658 | 2.38009 | −2.66407 | 1.97498 | −5.33638 | 2.10315 | −2.64825 | 1.61429 |
| BH | - | - | −4.13268 | 1.97313 | −6.05826 | 2.14483 | −2.05864 | 1.61762 |
| Br | −3.85184 | 2.37592 | −0.73028 | 1.7893 | −2.81593 | 2.07774 | - | - |
| Diametric Class (cm) | Annual Increase of the Different Fractions of Biomass (kg/Tree) | |
|---|---|---|
| Branches 2.7 cm | Branches < 2 cm | |
| 5 | 0.00 | 0.07 |
| 10 | 0.44 | 0.25 |
| 15 | 0.47 | 0.54 |
| 20 | 0.31 | 0.82 |
| 25 | 0.43 | 1.08 |
| 30 | 0.58 | 1.39 |
| 35 | 0.71 | 1.63 |
| 40 | 0.92 | 2.03 |
| 45 | 1.08 | 2.36 |
| 50 | 1.28 | 2.67 |
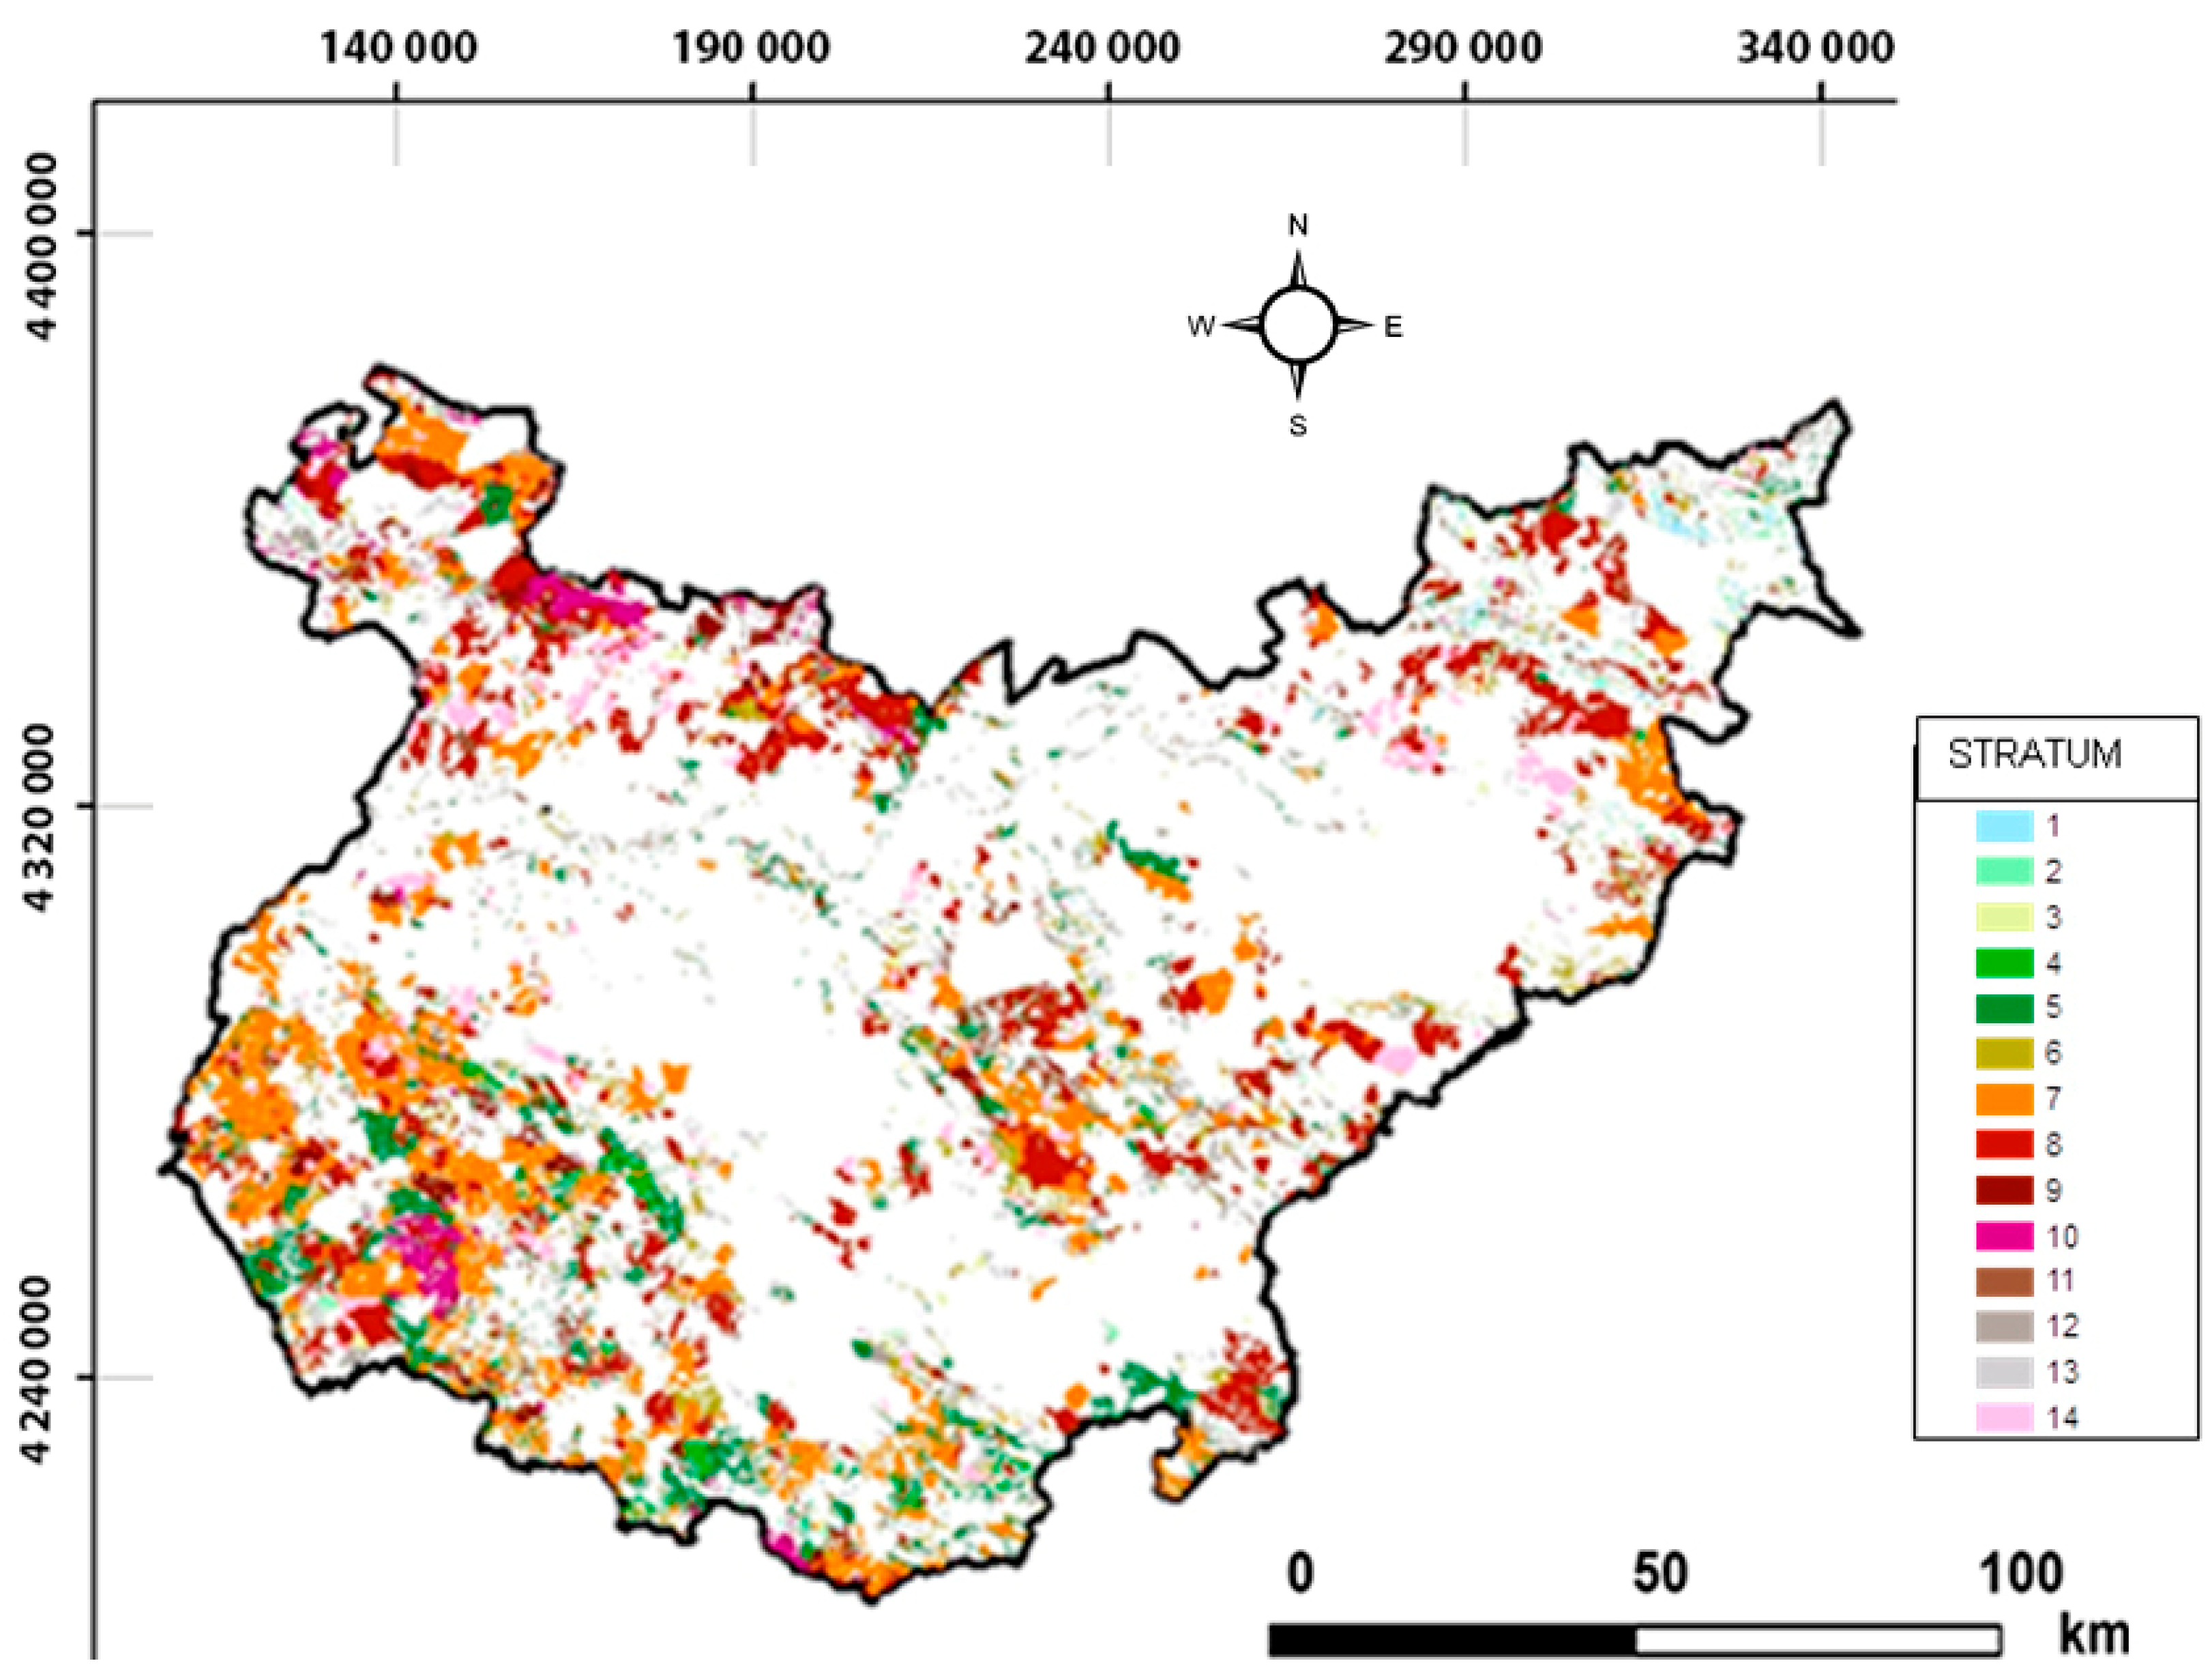
| Stratum | Dominant Species | y (ton/ha Dry Biomass) |
|---|---|---|
| 01 | Pino pinea and Pinus pinaster | 1.035 |
| 02 | Pino pinea and Pinus pinaster | 0.462 |
| 03 | Quercus ilex and Quercus suber | 0.172 |
| 04 | Quercus ilex with other hardwood species | 0.443 |
| 05 | Quercus ilex | 0.235 |
| 06 | Quercus ilex | 0.833 |
| 07 | Quercus ilex | 0.398 |
| 08 | Quercus ilex | 0.165 |
| 09 | Quercus suber and Quercus ilex | 0.517 |
| 10 | Quercus suber | 0.258 |
| 11 | Eucalyptus camaldulensis | 7.453 |
| 12 | Eucalyptus camaldulensis | 4.893 |
| 13 | Shrubs | 0.115 |
| 14 | Quercus ilex | 0.202 |
| Biomass Residues | LHV wb MJ/kg | LHV db MJ/kg |
|---|---|---|
| Eucalyptus wastes | 14.96 | 15.97 |
| Pine wastes | 9.09 | 18.60 |
| Cork oak slash | 1.60 | 16.90 |
| Holm oak slash | 14.33 | 17.58 |
| Oak slash | 13.10 | 16.60 |
| Municipality | Amount of Biomass Available Ton/Year (30 km Radius) |
|---|---|
| Alconchel | 36.030 |
| Higuera de la Serena | 22.169 |
| Alburquerque | 29.436 |
| Puebla de Alcocer | 36.262 |
© 2019 by the authors. Licensee MDPI, Basel, Switzerland. This article is an open access article distributed under the terms and conditions of the Creative Commons Attribution (CC BY) license (http://creativecommons.org/licenses/by/4.0/).
Share and Cite
López-Rodríguez, F.; García Sanz-Calcedo, J.; Moral-García, F.J. Spatial Analysis of Residual Biomass and Location of Future Storage Centers in the Southwest of Europe. Energies 2019, 12, 1978. https://doi.org/10.3390/en12101978
López-Rodríguez F, García Sanz-Calcedo J, Moral-García FJ. Spatial Analysis of Residual Biomass and Location of Future Storage Centers in the Southwest of Europe. Energies. 2019; 12(10):1978. https://doi.org/10.3390/en12101978
Chicago/Turabian StyleLópez-Rodríguez, Fernando, Justo García Sanz-Calcedo, and Francisco J. Moral-García. 2019. "Spatial Analysis of Residual Biomass and Location of Future Storage Centers in the Southwest of Europe" Energies 12, no. 10: 1978. https://doi.org/10.3390/en12101978
APA StyleLópez-Rodríguez, F., García Sanz-Calcedo, J., & Moral-García, F. J. (2019). Spatial Analysis of Residual Biomass and Location of Future Storage Centers in the Southwest of Europe. Energies, 12(10), 1978. https://doi.org/10.3390/en12101978