Article

Biogas Production and Heat Transfer Performance of a Multiphase Flow Digester

1
School of Mechanical Engineering, Southwest Jiaotong University, Chengdu 610031, China
2
Department of Building Science, Tsinghua University, Beijing 100084, China
*
Author to whom correspondence should be addressed.
Energies 2019, 12(10), 1960; https://doi.org/10.3390/en12101960
Submission received: 6 May 2019 / Revised: 19 May 2019 / Accepted: 20 May 2019 / Published: 22 May 2019
(This article belongs to the Section A4: Bio-Energy)

Abstract

:
Traditional static anaerobic digestion technology presents the disadvantages of a low gas production rate and long digestion cycle, which is not conducive to the treatment of livestock manure. A 12 m3 multiphase flow anaerobic digester (MFD) was developed in this study to improve the biogas production rate and maintain constant temperature digestion during winters. Full-scale field experiments were conducted on the biogas production rate at different temperatures, the dynamic digestion effects, and the dynamic heating digestion effects of the system at Sichuan, China. A comparison of the dynamic and static digestion results of 50 days indicated that the biogas production for the dynamic digestion (DD) group was 115.22 m3 or 127.1% higher than that of the static digestion (SD) group with the same digestion temperature. The results of the heat transfer performance experiment revealed that the heat transfer rate of the system increased significantly, and the temperature of the biogas slurry increased rapidly. The optimization analysis of the system was based on the experimental results of the relationship between the slurry temperature and biogas production rate, and the economical digestion temperature of the system was proposed and calculated. Different insulation materials or insulation thicknesses have an influence on the economical digestion temperature. Additionally, the economical digestion temperature of the system in which the polystyrene insulation layer with a thickness of 90 mm was used, was found to be 27.2 °C. When digestion temperature was 22.3 °C, the energy efficiency ratio (EER) of dynamic anaerobic digestion system is 1. The advantages of MFD are low biogas production unit cost and high heat and mass transfer rate. However, the disadvantage of high operation energy consumption needs further improvement. And additional energy was required when system digestion temperature below 22.3 °C. The proposed MFD and dynamic anaerobic digestion system can play a significant role in using biomass resources and promoting the development of biogas projects.

1. Introduction

In recent years, rapid increases in livestock manure emissions and straw production have resulted in significant environmental pressure. Anaerobic digestion biogas production technology is an environmentally friendly technology reduces waste while producing renewable energy that has been widely used in many countries worldwide [1].
Mixing is the key factor that has the most significant influence on the gas production rate of anaerobic digestion. Without mixing, several drawbacks are presented, such as uneven material distribution, poor fluidity, and difficulties with respect to heat and mass transfer in the static digestion process [2,3,4,5]. Conversely, mixing by dynamic digestion can effectively improve the digestion efficiency and biogas production rate. At present, there are three general mixing methods, namely, mechanical (impeller) mixing [6], slurry recirculation [7], and gas recirculation [8]. The advantages of mechanical mixing are high heat and mass transfer rates, in addition to the effective reduction of the hydraulic dead space, maintenance of reproduction, and metabolism of anaerobic bacteria. De Jesus et al. evaluated the hydrodynamic mass transfer of four bioreactors using a viscous Newtonian and non-Newtonian fluid. It was concluded that mechanical mixing has higher mass transfer coefficients and provides a better homogeneity of the digester contents [9]. Trad et al. compared the three mixing methods and found that the mixing energy level (MEL) for mechanical mixing was the highest. Furthermore, mechanical mixing promoted homogeneity at a lower mixing time and faster mass transfer, especially in a non-Newtonian fluid with a high organic loading rate (OLR) [10]. Therefore, the mechanical mixing technology has been intensively developed in Europe [11]. The disadvantages of slurry and gas recirculation are high equipment costs, the easy formation of dead zones, and easy clogging at high concentration digestions; thus limiting the application [12]. Huang et al. designed a slurry recirculation digester for the anaerobic digestion of straw granules. It was found that, although the particle size was less than 3 mm, blockages could easily form [13]. Xiong et al. reported that in straw digestion, gas recirculation tends to bring straw particles to the liquid surface and deposits crusts on the liquid surface, which is not conducive to digestion [14]. However, these three technologies provide limited enhancements to the biogas production rate, especially in large digestion systems [15]. This is because they do not change the mechanism of static digestion or solve the defects of traditional biogas digesters. More information is provided in Table 1.
Anaerobic digestion is also dependent on temperature, and a constant and appropriate temperature is required to ensure the maintenance of digestion at a high biogas production rate [16,17]. To ensure the energy demand of anaerobic bacteria reproduction, a high heat transfer rate is required. The static heating method involves the transfer of thermal energy to the digester via hot water in the pipeline, which typically requires the installation of heat exchange coils in the digester. The drawbacks of static heating methods are non-uniform heating and a low thermal efficiency, which has an influence on the stability of the biogas production. Liu et al. designed a static heating digestion system that used polyethylene helical coil pipes and found that there was a large temperature gradient in the vertical direction after heating. This was reported as non-conducive to anaerobic digestion [18]. The dynamic heating method involves the transfer of thermal energy to the digester through the direct heating of the circulating slurry, which offers the advantages of rapid heat transfer and a uniform increase in temperature. Moreover, the current dynamic digestion heating methods present the drawbacks of a complex structure and the easy blockage of the pipeline [19].
Multiphase flow technology is a mature industrial technology that is widely used in many fields such as the petrochemical, power, and metallurgical fields, among others [20,21]. This solves the problem of fluidity in traditional industries, which transforms solid particles into “quasi-fluids” with “fluid properties”. Due to the thin boundary layer of the particle surface, its heat and mass transfer rates are significantly high [22].
Accordingly, in this paper, a multiphase flow digester (MFD) and dynamic anaerobic digestion system were built based on the multiphase flow technology. The system formed a solid-liquid two-phase flow pumped by the slurry pump, then the slurry was digested in a fluidized state. This pilot scale system is situated near a pig farm in Suining City, Sichuan Province, China, which is located at a latitude of 30°15′–30°55′ N and longitude of 105°13′–105°48′ E. Although a number of anaerobic digester pattern have been proposed, most of the studies involved were focus on pH, initial substrate concentration, and chemical oxygen demand (COD), only a few studies have been explored heat transfer performance and economical digester temperature of anaerobic digestion system. Nevertheless, comparing with general anaerobic digester [13,19], higher heat and mass transfer rates are most significant advantages. Therefore, the biogas production performance and heat transfer performance of the MFD were evaluated with respect to the pilot scale digestion. Furthermore, the optimization analysis of the system was carried out, and the economical digestion temperature of the system was also proposed and calculated. This study may help promote the use of multiphase flow technology in the biogas field and lead to developments in biogas science research. Moreover, this study has a significant role in promoting the biogas production rate and promoting the development of large and medium-sized biogas projects in China.

2. Materials and Methods

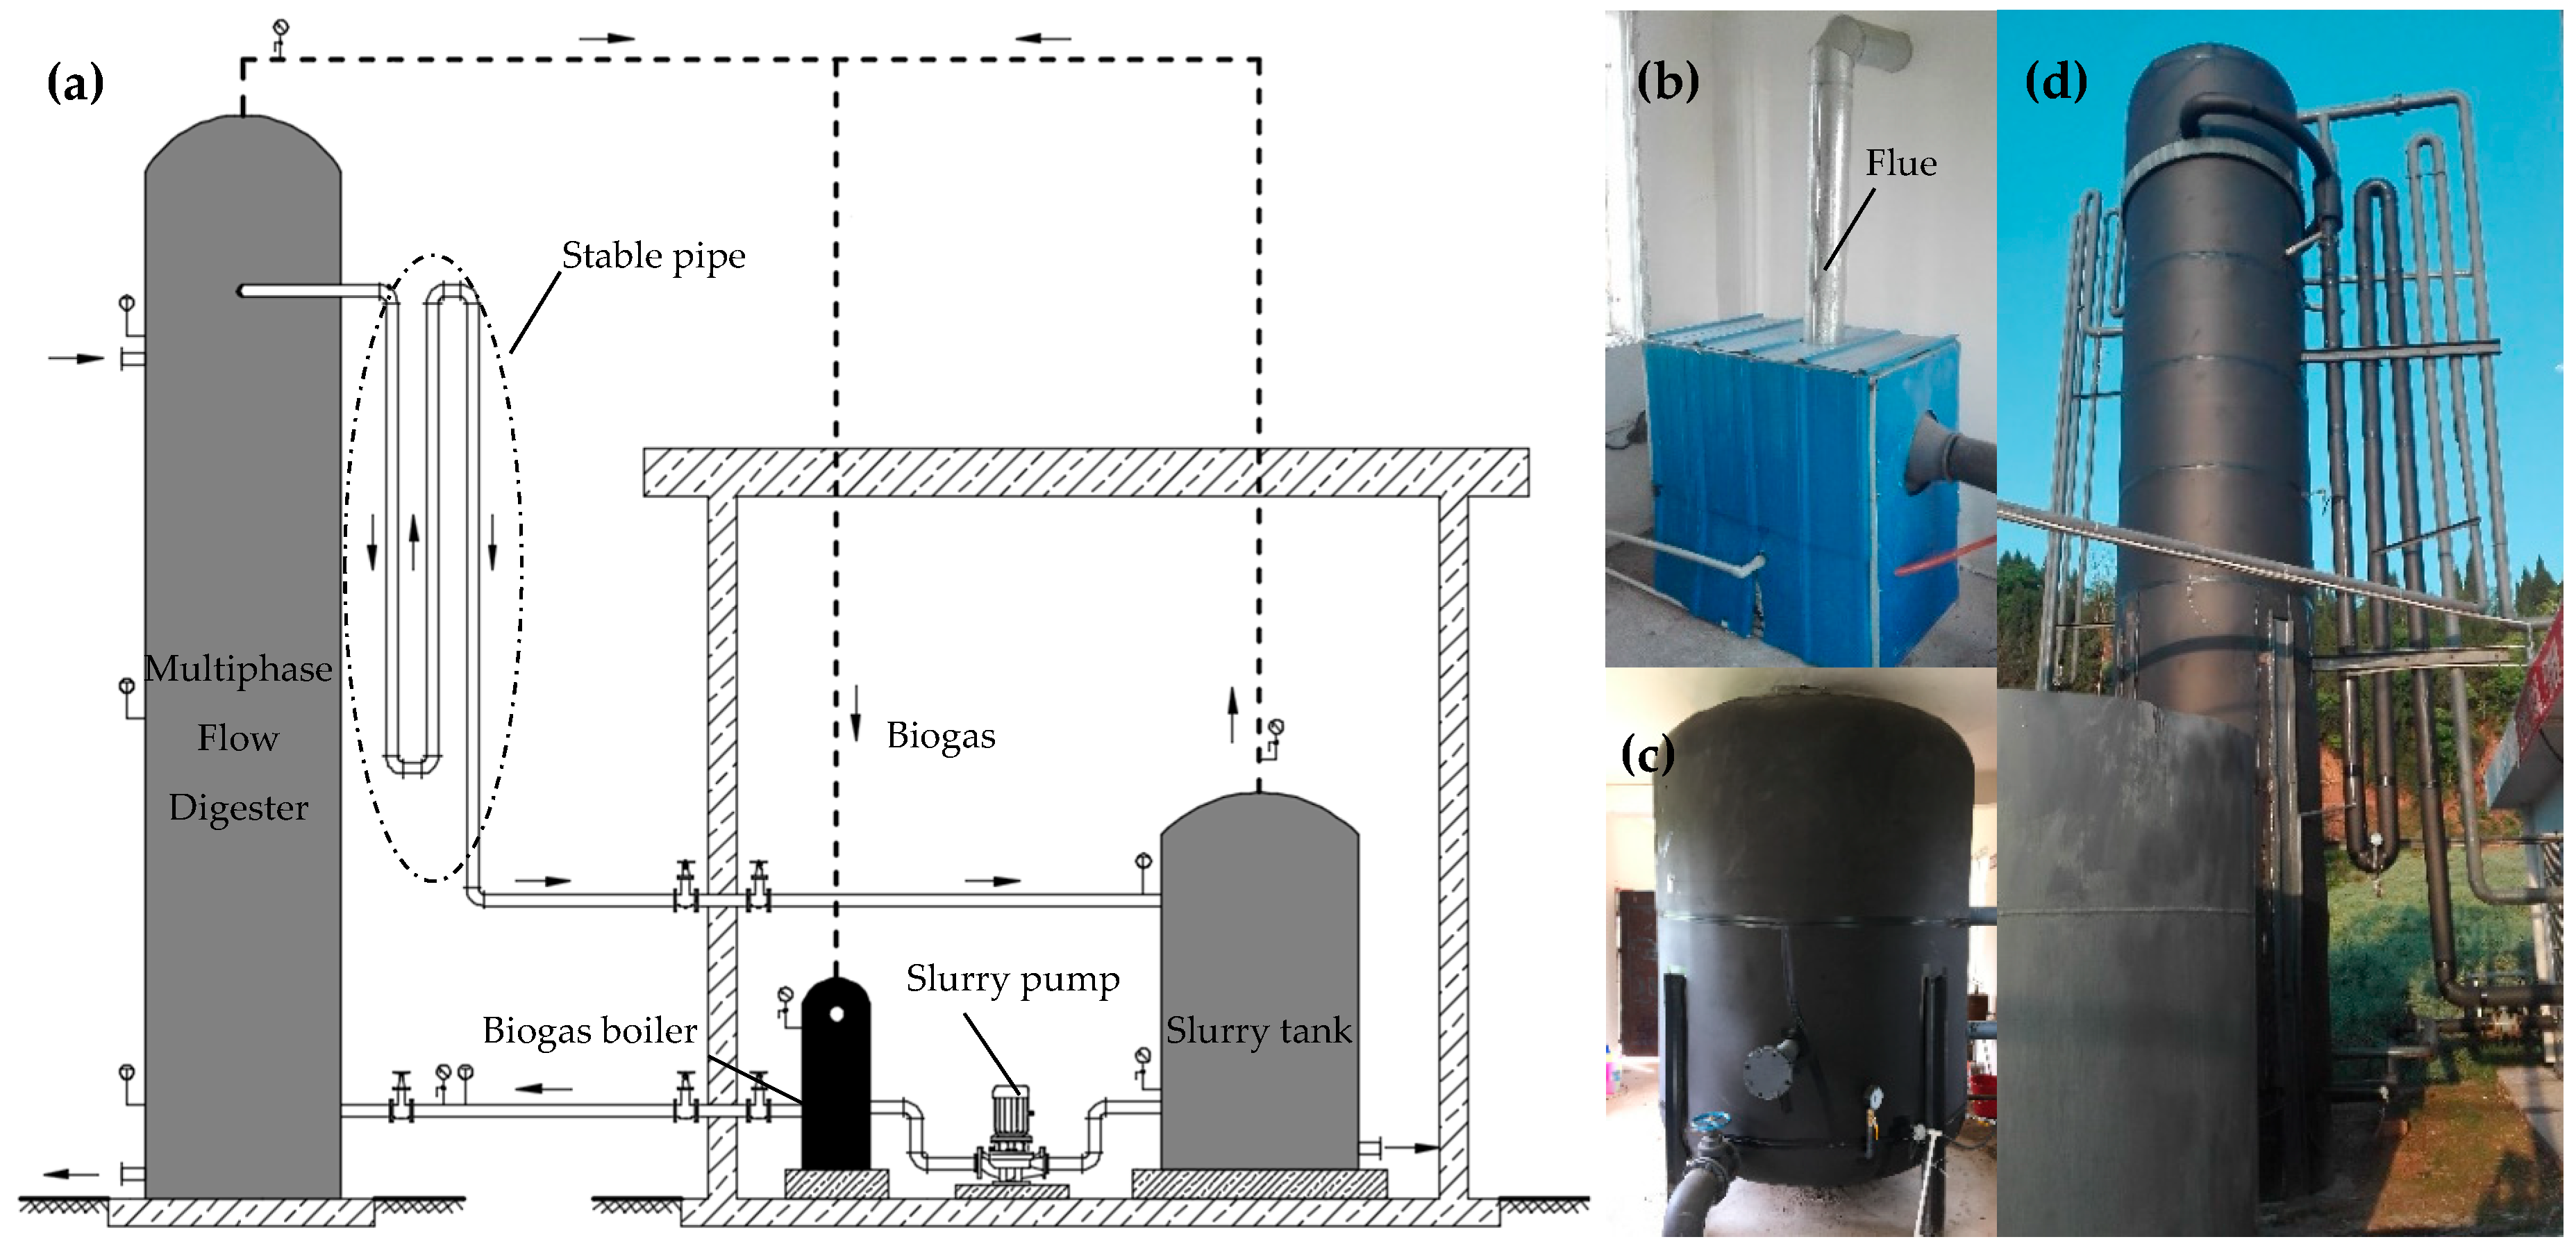
2.1. Experimental System

The experimental system was located close to a pig farm, which had 750 pigs in stock and produced 2.5 t of manure per day, in Suining City, Sichuan Province, China. The system was mainly composed of a multiphase flow digester, biogas boiler, biogas pump, and biogas tank. Moreover, it was mounted as shown in Figure 1. The slurry was pumped into the multiphase flow digester by a slurry pump from the low part of the digester, and then pumped out from the upper part.

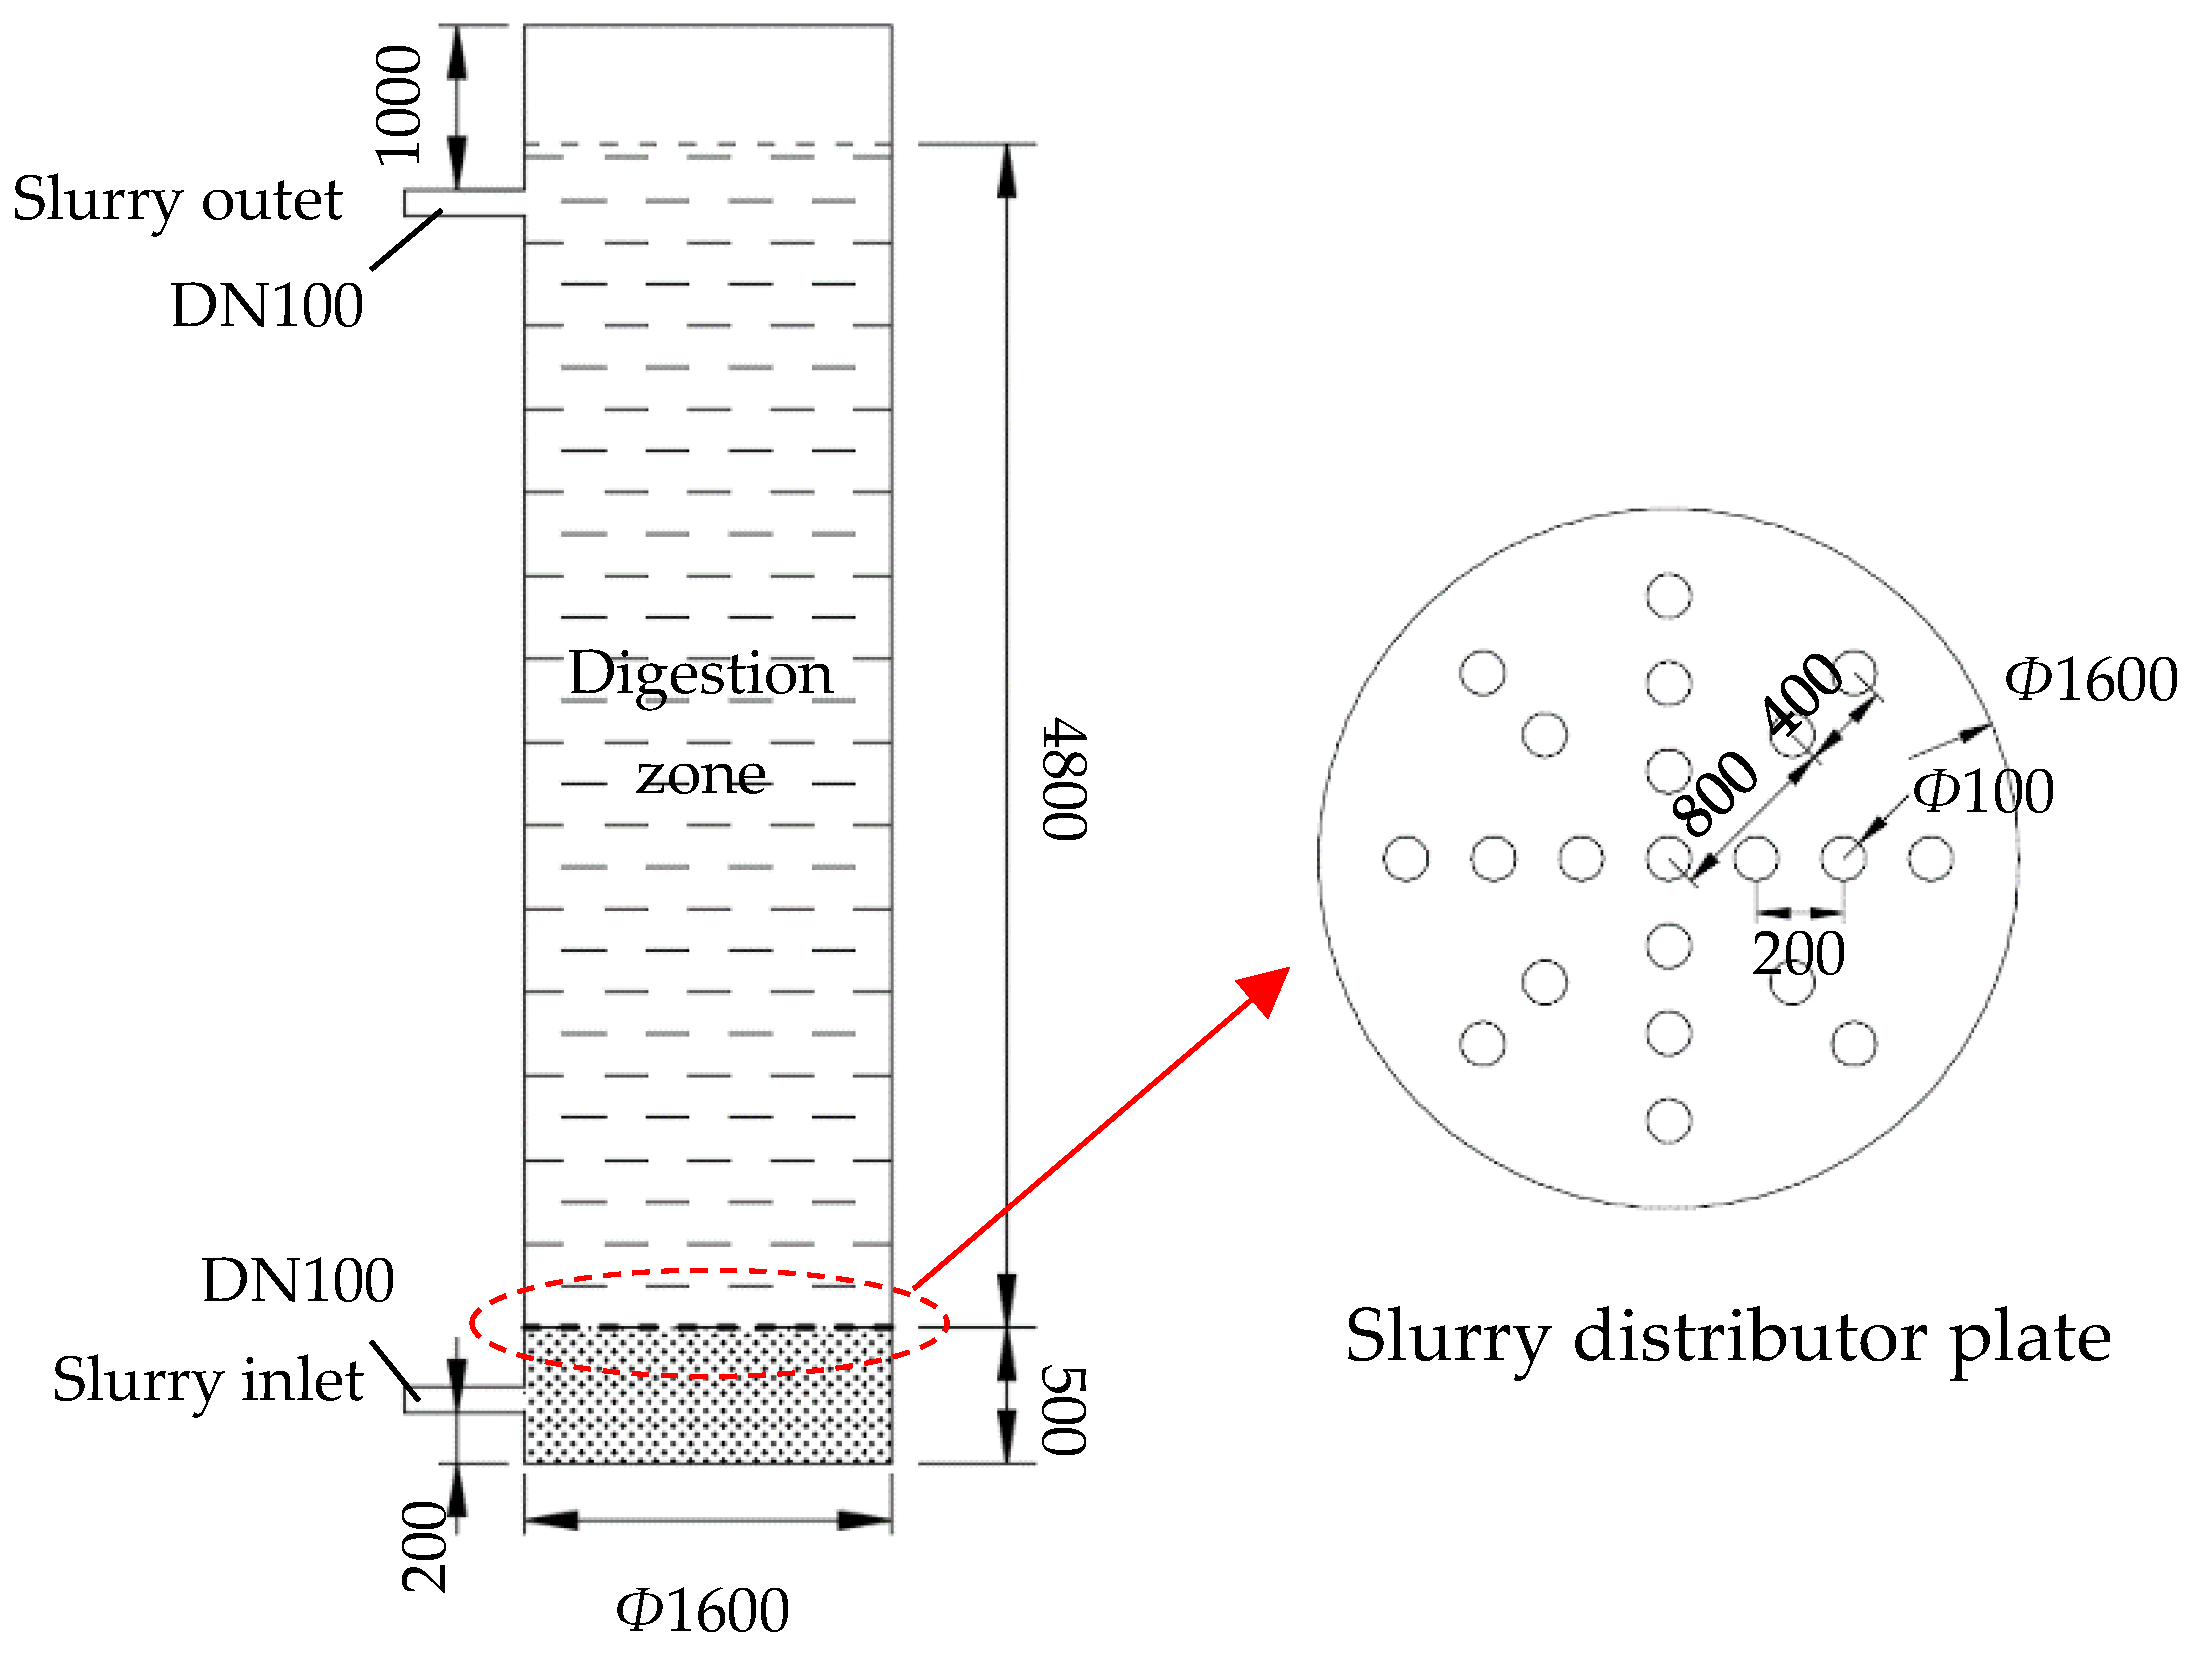
2.1.1. Multiphase Flow Digester (MFD)

The volume of the multiphase flow digester (Figure 2) used in the experiment was 12 m3 (Φ1600 × 6000 mm). The multiphase flow digester (MFD) was made of an enamel steel plate, and the thickness of the walls was 10 mm. The polystyrene insulation layer with a thickness of 90 mm was wrapped around the MFD. For easy installation and removal, the MFD was placed on the concrete foundation with a thickness of 200 mm. The slurry distributor plate with a thickness of 10 mm was the key device in the MFD, which included 21 holes, and the diameters of the holes were 10 mm.

2.1.2. Biogas Boiler

A biogas boiler was selected in the system as the heat source for heating, and biogas produced in the experiment was used as the fuel. The maximum power and voltage of the biogas boiler were 5 kW and 380 kV, respectively. The temperature control function of the biogas boiler regulated the slurry temperature in the MFD through the setting of the digestion target temperature. Similar to the MFD, the biogas boiler was placed on a concrete foundation with a thickness of 200 mm.

2.1.3. Slurry Pump

To ensure the stability of slurry fluidized digestion, the slurr. y pump should be kept running all day. The rated power, rated flow, head, and rotating speed of the slurry pump were 1.0 kW, 10 m3 h−1, 12.5 m, and 2000 rpm, respectively. The slurry pump was placed on a concrete foundation with a thickness of 100 mm.

2.1.4. Slurry Tank

To reduce the backflow of slurry, a slurry tank was placed near the biogas boiler, and the volume, height, and inner diameter were 5 m3, 2.0 m, and 1.8 m, respectively. The slurry tank was made of 304 stainless steel with a thickness of 10 mm, and the polystyrene insulation layer with a thickness of 90 mm was wrapped around the slurry tank. The thickness of concrete foundation was 200 mm.

2.2. Experimental Methods

The digestion materials of the experiments were fresh pig manure from a pig farm next to the experimental system. The pilot scale experiments were divided into a dynamic group and static group, and the pre-treatment process was the same. To evaluate the relationship between the biogas production rate and slurry temperature, the continuous feeding digestion experiments (450 kg per day) were conducted from February 12–July 20, 2016. Moreover, the difference between the biogas production of dynamic digestion (DD) and static digestion (SD) was evaluated using a two-batch feeding scheme (6.6 t in one feed, the inlet slurry temperature of DD and SD were 15.6 °C and 7.8 °C) and 50-day digestion cycle experiments, which were conducted from September 11–December 25, 2016. Before the start of digestion, the digestion material was pumped into the MFD by a slurry pump from the pretreatment tank. After digestion, the digestion material was pumped into a Decanter centrifuge for solid-liquid separation. The basic values of the parameters used in the experiments are listed in Table 2.
The main measurement parameters included the slurry temperature, slurry flow rate, ambient air temperature, and biogas production. Other parameters such as the total solid concentration of the digestion slurry (TS), volatile solid concentration of digestion slurry (VS), chemical oxygen demand (COD), and biochemical oxygen demand (BOD) were tested by the Sichuan Zhonghuanbo Environment Testing Co., Ltd. (Chengdu, China).
Slurry temperature: the inlet and outlet of the slurry were equipped with platinum resistance temperature sensors (pt100, manufactured by Hangzhou Meikong Technology Co., Ltd., Hangzhou, China, with a precision of ±0.1 °C). An electrical temperature controller (ZNHW-II, measurement range: 0–400 °C, with a precision of ±0.1 °C, manufactured by Henan Aibote Technology Co., Ltd., Zhengzhou, China) was used to control the digestion temperature.
Slurry flow rate: an electromagnetic flowmeter (EMFM-HFD3000, measurement range: 0–100 m3 h−1) was used to monitor the slurry inlet and outlet flow rates, which was manufactured by Chengdu Youlide Instrument Co., Ltd. (Chengdu, China).
Ambient air temperature: the ambient temperature was monitored using a testo temperature logger (176 T2, with a precision of ±0.1 °C).
Biogas production: a membrane gas meter (SC300 G4, manufactured by Chongqing Shancheng Gas Equipment Co., Ltd., Chongqing, China, with a precision of ±0.01 m3 h−1) was used. Daily biogas production was measured with gas meter connected to a vacuum pump to extract gas from storage bag at 10:00.

3. Results and Discussion

3.1. Biogas Production Performance of MFD

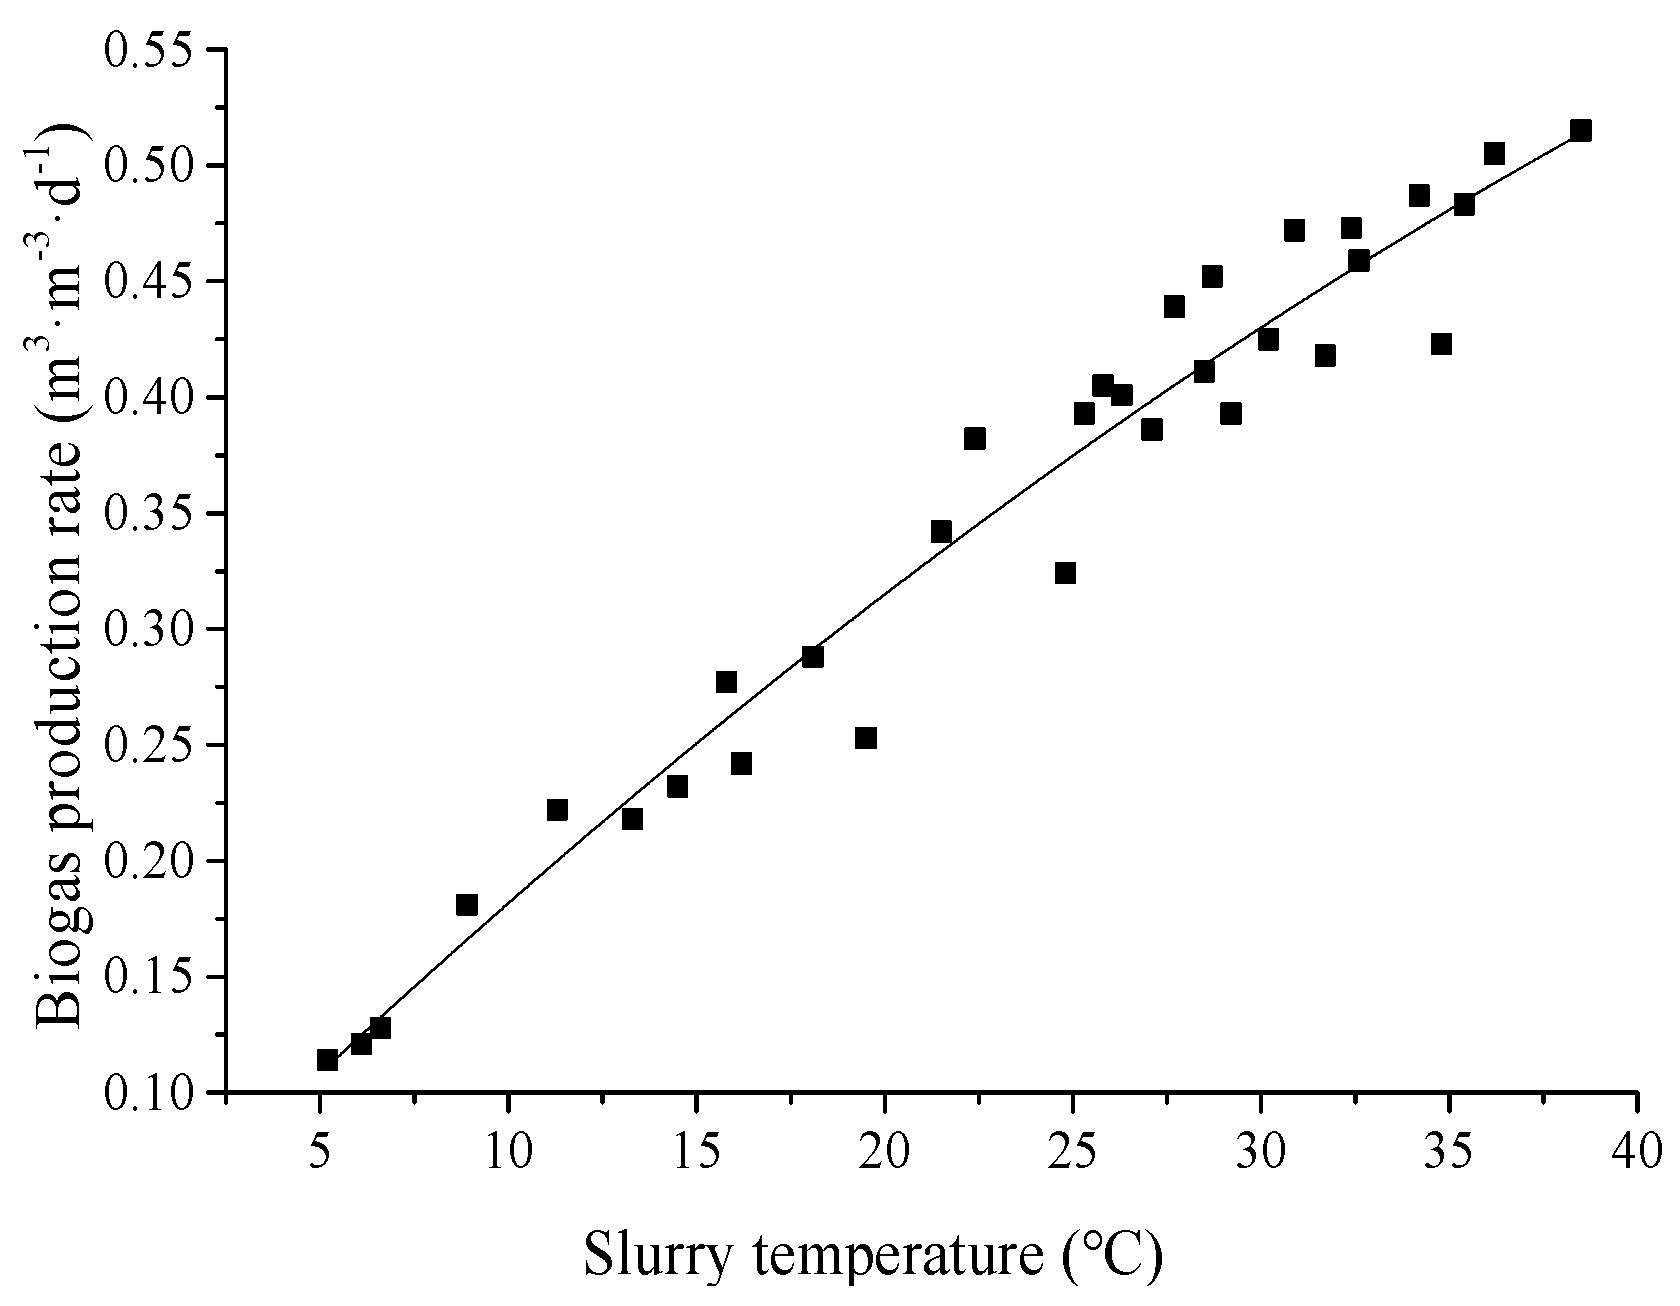
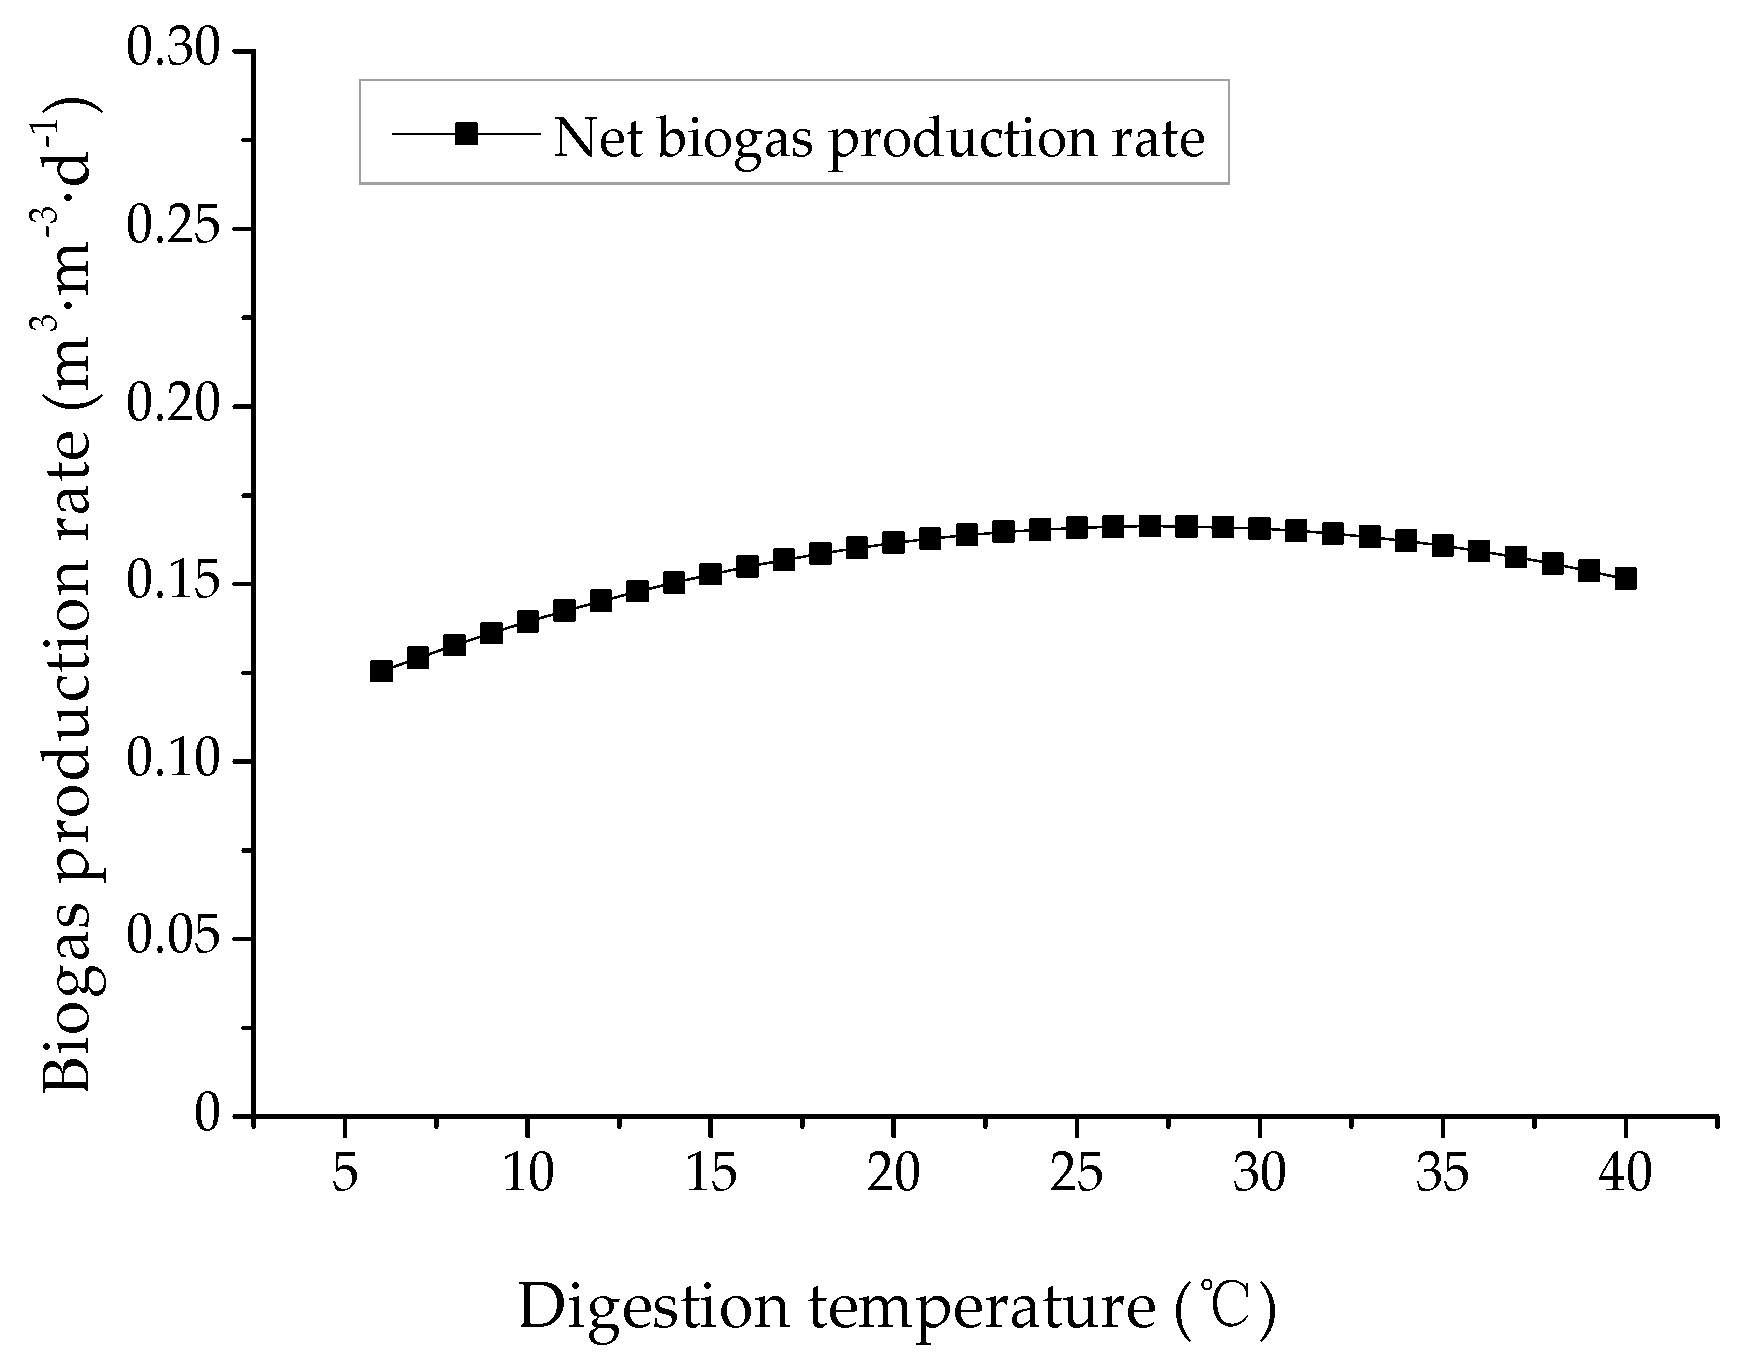
3.1.1. The Relationship Between Temperature and Biogas Production Rate

The biogas production rate is an important indicator of the multiphase flow digester. The continuous feeding digestion experiments were conducted. The slurry temperatures and biogas production rate were averaged over a five-day interval to generate scatter plots that relate the biogas production rate to the temperature, as shown in Figure 3. The lowest temperature was 5.2 °C in February 18, when the biogas production rate was 0.118 m3 m−3 d−1. The highest temperature was 38.5 °C in July 18, when the biogas production rate was 0.515 m3 m−3 d−1.
As determined from a statistical analysis using SPSS 22.0 software, a linear fitting relationship in the form of a highly parabolic curve was found between the slurry temperature and the biogas production rate, as shown in Figure 3. The equation that describes this relationship can be expressed as follows:
Y = 0.000090629 X 2 + 0.01604 X + 0.03032 ( R 2 = 0.95759 , P < 0.001 )
Thus, the biogas production rate was found to increase in accordance with an increase in the slurry temperature throughout the range of test temperatures (5–40 °C). Moreover, d2Y/dX2 < 0, which indicates that there was a decrease in the rate of increase in the biogas production rate in accordance with an increase in temperature. This also indicated that the multiphase flow digester can achieve a high biogas production rate at low digestion temperatures.

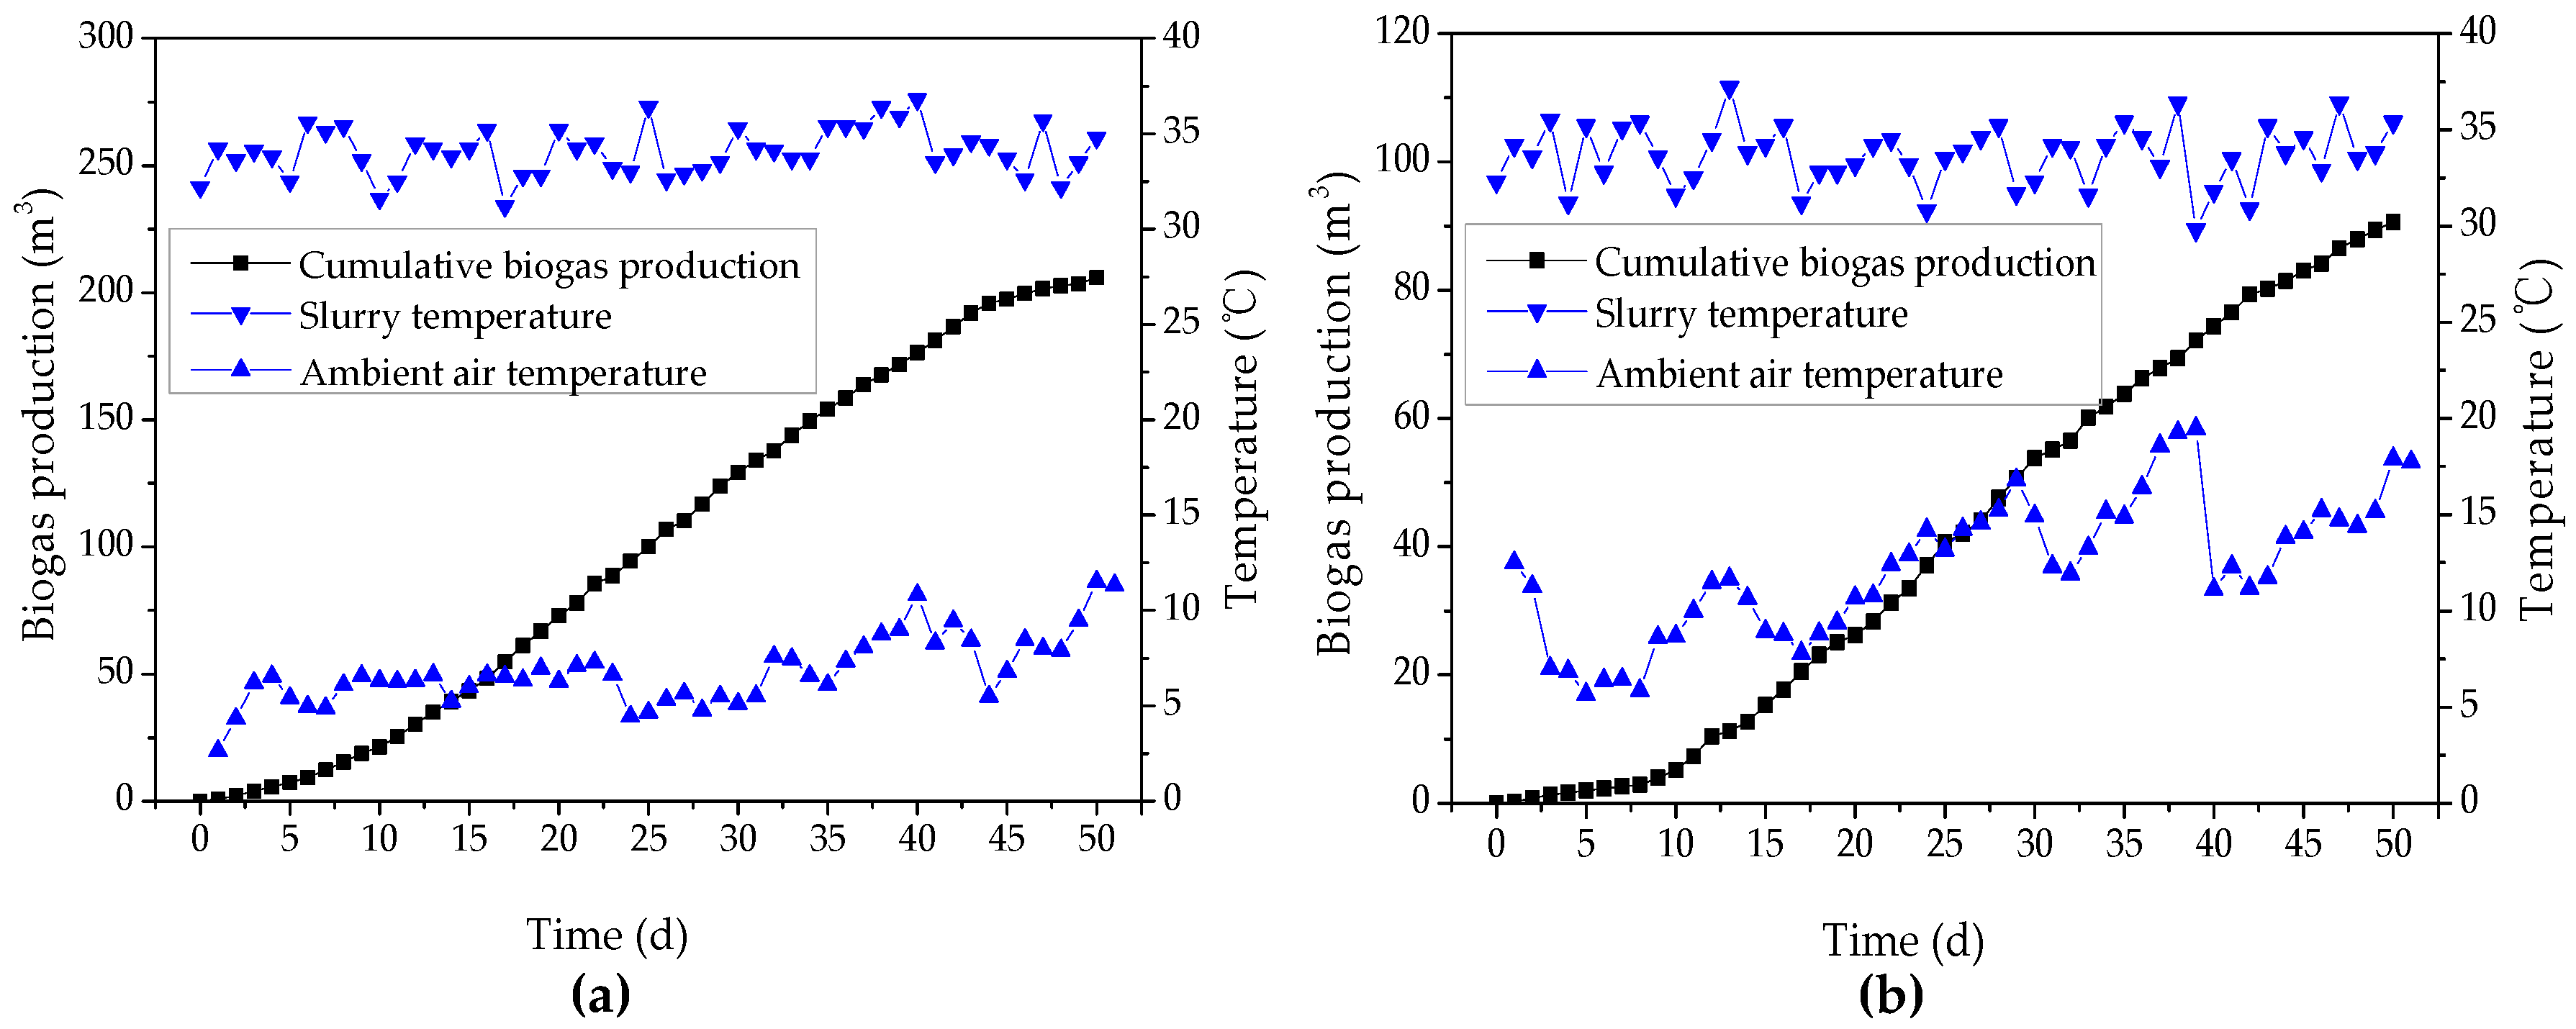
3.1.2. Effect of Dynamic Digestion

In general, there are two gas production peaks during anaerobic digestion: medium temperature (30–38 °C) and high temperature (50–55 °C) [23,24]. For small and medium-sized biogas engineering, the medium temperature digestion process has been found to be more economical with an optimum temperature of 35 °C. Accordingly, 35 °C was selected as the digestion temperature for the evaluation of the effect of dynamic digestion.
Figure 4 presents the cumulative biogas production of the dynamic digestion (DD) and static digestion (SD) throughout the 50-day experiment. From a comparison of Figure 4a,b, it can be seen that both groups were operating under a digestion temperature of 35 °C, irrespective of the difference in the ambient air temperature. A high S-curve fitting relationship was found between the cumulative biogas production and digestion time. Furthermore, the cumulative biogas production of the DD (standard deviation of 70.12 m3) and SD (standard deviation of 30.77 m3) groups were 205.88 m3 and 90.66 m3, respectively, which reveals that the cumulative biogas production for the DD group was significantly higher than that of the SD group. After 50 days of the experiment, the DD group reached the end of digestion. In contrast, the cumulative biogas production maintains the rapid growth in the SD group. This indicated that the digestion period for the DD group was shorter than that of the SD group. Moreover, it indicates that many substrates were not degraded due to the slower mass transfer in the SD group.
Figure 5 presents the biogas production rate of the DD group (standard deviation of 0.151 m3 m−3 d−1) and SD group (standard deviation of 0.173 m3 m−3 d−1). The biogas production rate of the DD group was significantly higher than that of the SD group. The biogas production rate of the DD group increased rapidly from the beginning of the digestion, and then reached the biogas production peak (0.63 m3 m−3 d−1) at day 22; whereas that of the SD group did not increase until the 9th day. The biogas production rate of the SD group then reached the biogas production rate peak (0.3 m3 m−3 d−1) on day 24, which indicates that dynamic digestion can shorten the hydrolysis reaction time and increase the biogas production rate. The energy data of the two groups are shown in Table 3. Assuming that the calorific value of the fresh slurry was 4184 kJ kg−1 [25], the total energy of the slurry of each group was approximately 27614.4 MJ. For convenience, it was assumed that the methane contents of both groups was 60%. Based on these values, the biomass energy conversion efficiency of the slurry calculated for the DD and SD groups were 17.78% and 7.83%, respectively. From a comparison of two groups, the conversion rate of the slurry biomass increased by 127.1% due to the enhancement of the heat and mass transfer rates.
Kinetic studies were also conducted on the cumulative biogas production data from the two groups. The modified Gompertz and Cone equations were adapted for a dynamic description, as shown in Equations (2) and (3). The key kinetic parameters were obtained as shown in Table 3.
The modified Gompertz equation [26,27] can be expressed as follows:
H = H m exp { exp [ R m × e H m ( θ h ) + 1 ] }
The modified Cone equation [28,29] can be expressed as follows:
H = H m 1 + ( k × h ) n
where H is the cumulative biogas production, m3 m−3; Hm is the maximum cumulative biogas production, m3 m−3; Rm is the maximum biogas production rate, m3 m−3 d−1; θ is the lag time of the biogas production, d; h is the digestion time, d; k is the rate constant, d−1; n is the shape factor; and e is natural constant with a value of 2.7183.
By differentiating Equations (2) and (3), the rate of the biogas production can be expressed as follows:
For the modified Gompertz equation, which can be expressed as:
v ( h ) = d H ( h ) d h = R m exp { 2 + R m × e H m ( θ h ) exp [ R m × e H m ( θ h ) + 1 ] }
when dH/dh = 0, the time when the maximum biogas production rate occurred can be described as follows:
h max = θ + H m R m × e
For the modified Cone equation:
v ( h ) = d H ( h ) d h = H m × n × k n h n + 1 × [ 1 + ( k × h ) n ] 2
when dH/dh = 0, the time of occurrence of the maximum biogas production rate can be described as follows:
h max = exp [ ln ( ( n + 1 ) / ( n 1 ) ) n ] k
Figure 5 presents the fitting curves of the biogas production rate obtained using Equations (4) and (6). As shown in Table 4, the DD group had a shorter lag time, a higher biogas production rate, and a greater cumulative biogas production than those of the SD group. On the one hand, the cumulative biogas production calculated using the modified Gompertz equation was lower than that calculated using the modified Cone equation, and it was closer to the measured values. On the other hand, as shown in Figure 5, the hmax values for the DD and SD groups calculated using the modified Gompertz and Cone equations were the 23th day (0.50 m3 m−3 d−1), 22th day (0.476 m3 m−3 d−1), 25th day (0.22 m3 m−3 d−1), and 24th day (0.219 m3 m−3 d−1). The results calculated using the modified Cone equation were found to be closer to the measurements. Therefore, it was concluded that the modified Gompertz and Cone equations were suitable to be used in this study.

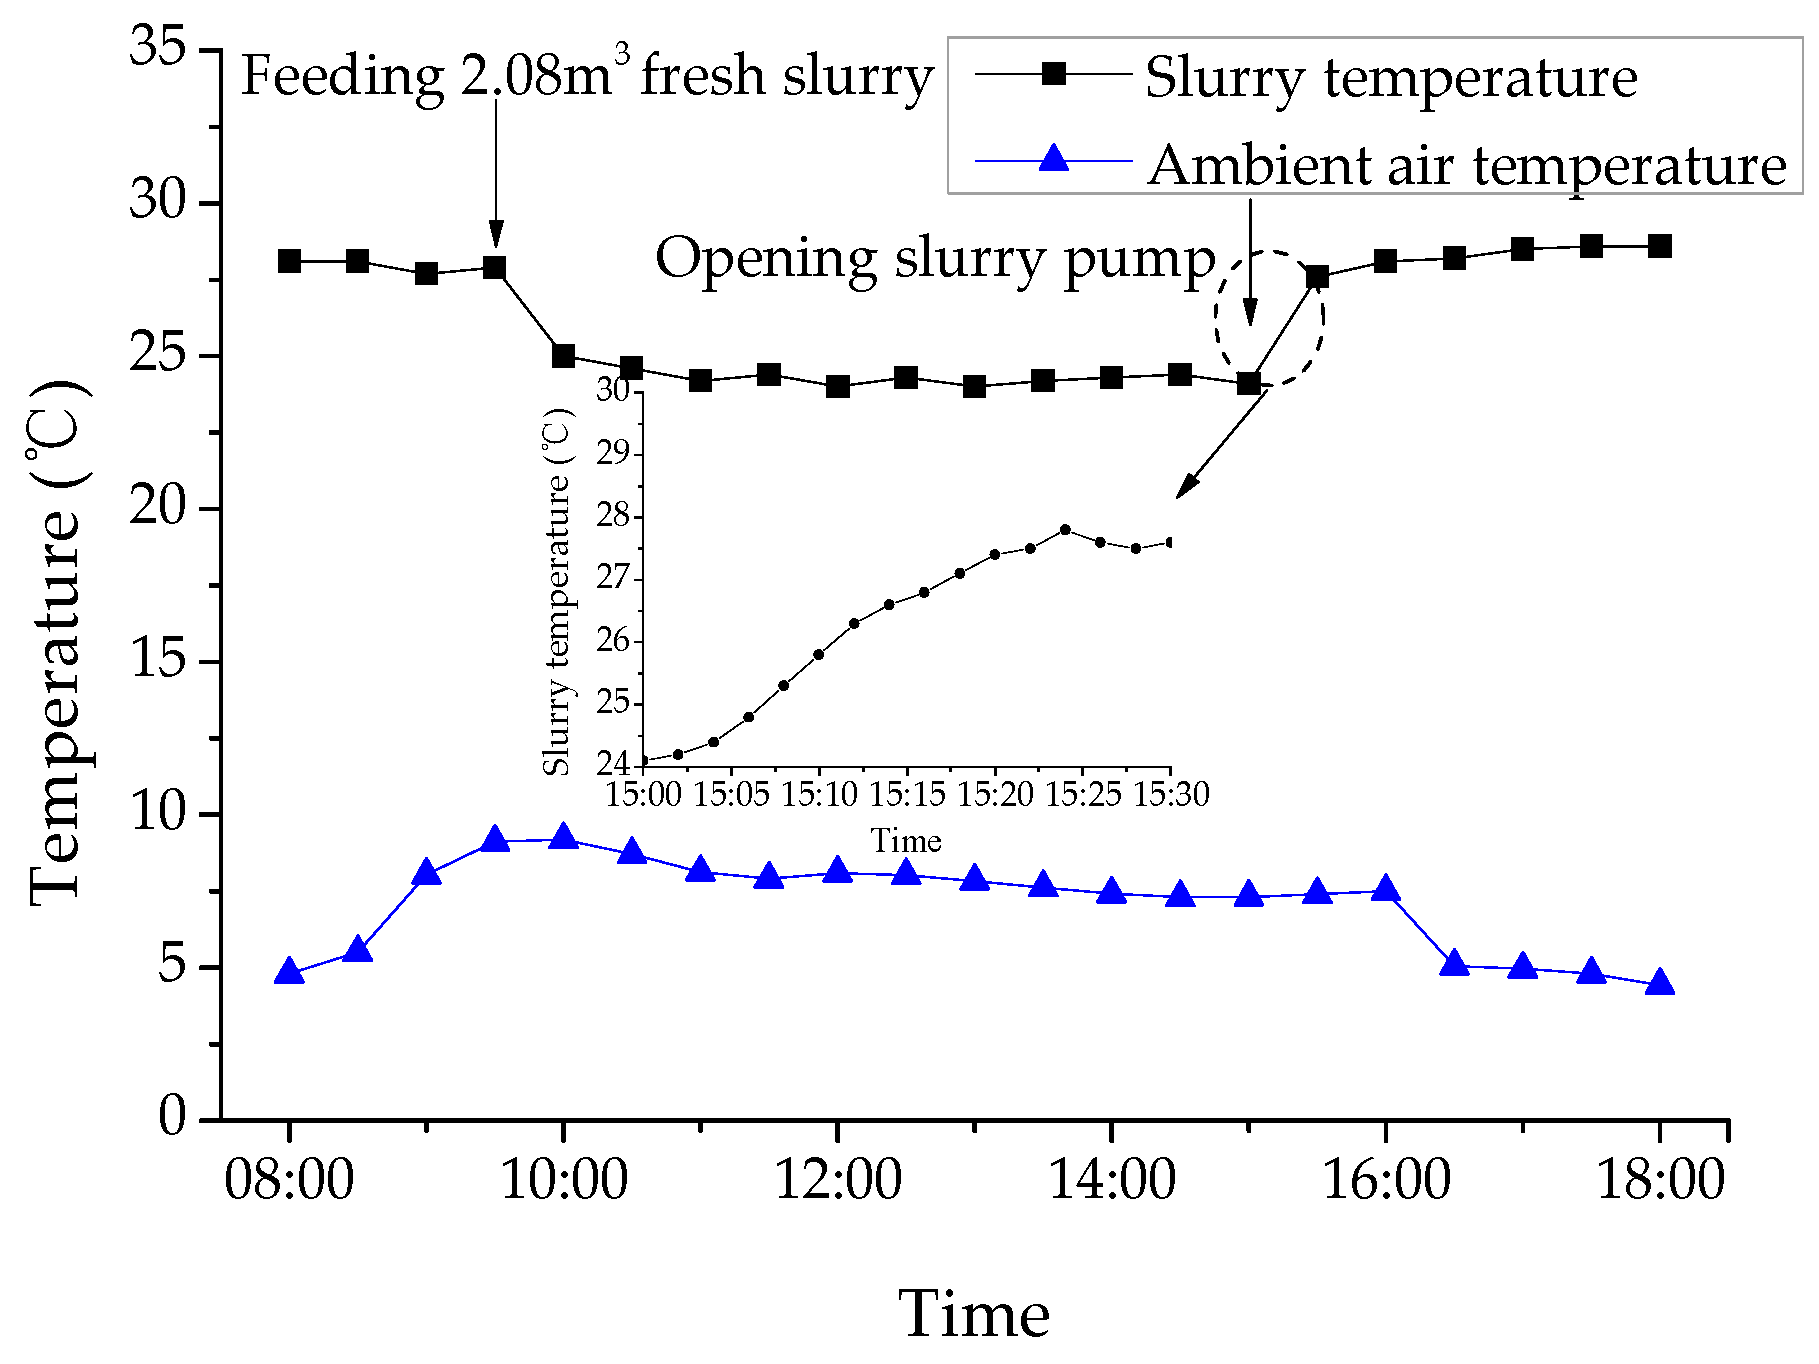
3.2. Heat Transfer Performance of MFD

The variation in temperature has an influence on the bacterial digestion process, and therefore should not exceed 2–3 °C per hour [30]. If the variation in the digestion temperature exceeds 5 °C within a short period of time, this results in significant changes in the biogas production rate; thus, a constant digestion temperature is required [31]. Therefore, to ensure the stability of the digestion system at the beginning of digestion, the change in temperature of the slurry should be controlled.
Figure 6 presents the changes in the slurry temperature with respect to time for the characterization of the dynamic heating influence. Prior to the start of digestion, the initial slurry volume, initial slurry temperature, and ambient air temperature were 9.65 m3, 28 °C, and 8 °C, respectively. At 9:30, 2.08 m3 of the new slurry with an initial temperature of 10.4 °C was added, and an equal amount of digested sludge was discharged, at which instant the slurry temperature immediately dropped to 25 °C. After 5.5 h, the slurry temperature gradually decreased to 24.1 °C. According to Equation (8), the slurry temperature was 24.2 °C after complete mixture, which indicates that the static digestion requires a long time to reach a uniform slurry temperature, which is not conducive to stable biogas production:
T m = c o T o M o + c f T f M f c m ( M o + M f )
where Tm, To, and Tf are the temperatures of the mixed slurry, old slurry, and fresh slurry, respectively, K; Mo and Mf are the masses of the old slurry and fresh slurry, respectively, kg; and cm, co, and cf are the specific heat capacities of the mixed slurry, old slurry, and fresh slurry, respectively, kJ kg−1 K−1. Due to the small variation in the three slurry temperatures; cm, co, and cf were assumed to be 4.18 kJ kg−1 K−1.
At 15:00, the biogas pump and the biogas boiler were opened, and the biogas slurry was immediately heated to 28 °C within 20 min. This indicated that the slurry temperature increased rapidly in the multiphase flow digester. Consequently, it was beneficial to eliminate the voids and accumulation of ammonia nitrogen caused by low temperatures.

3.3. System Optimization Analysis

With a decrease in the winter temperature, the rate of biogas production decreases, which implies that it is necessary to ensure that the biogas system operates stably during the cold season [32]. Therefore, several heating methods are required to ensure the normal operation of the proposed system at the target temperature. A biogas boiler was selected, and self-produced biogas was used as fuel. In addition, with an increase in the digestion temperature of the system, there was an increase in the temperature difference from the outdoor ambient temperature. This indicated that the system required more thermal energy to ensure the maintenance of digestion at the target temperature. Figure 3 reveals that with an increase in the digestion temperature, the biogas production rate increased. However, as can be seen from Equation (1), with an increase in the slurry temperature, there was a decrease in the increase rate of the biogas production rate. Accordingly, an optimal digestion temperature is required to ensure that the dynamic anaerobic digestion system has the largest net biogas production rate at this temperature. This temperature was referred to as the economical digestion temperature. The ambient air temperature of Suining city was recorded from December, 2015 until February, 2016, as shown in Figure 7. The monthly average temperature (5.8 °C) of the coldest month was selected as the outdoor calculated temperature, and the economic digestion temperature and net biogas production rate of the system were calculated.

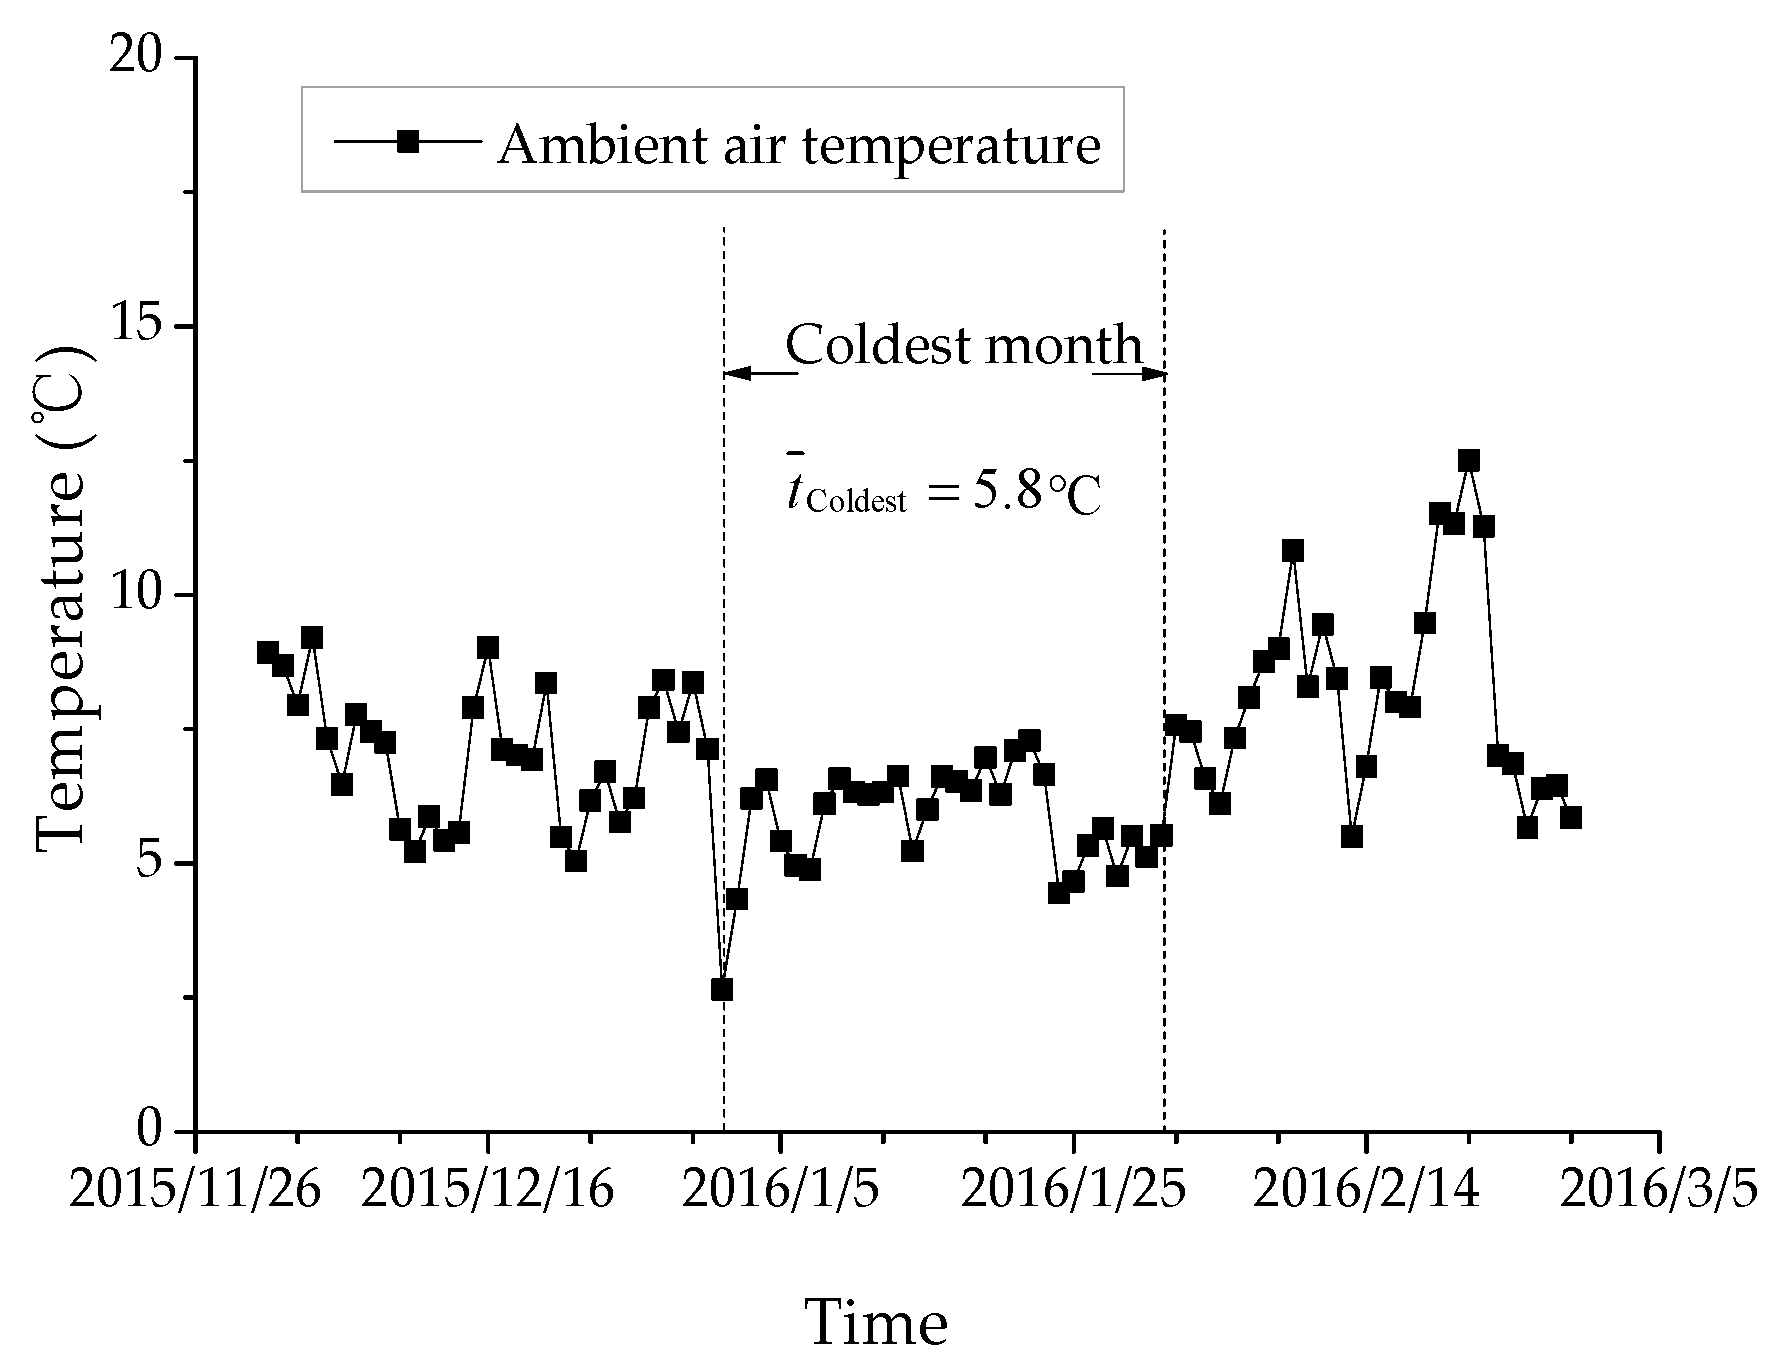
3.3.1. System Heat Load Calculation

The system heat load includes the heat loss of the slurry tank and MFD, and the heat load of slurry, which requires heating to reach the target digestion temperature. By neglecting the bio-heat and the heat removed by the biogas, the total heat demand can be expressed as [33]:
Q S = Q Demand = Q 1 + Q 2
where QS is the heat required by the operation of the dynamic anaerobic digestion system, kW; QDemand is the heat duty from the dynamic anaerobic digestion system, kW; Q1 is the heat required for heating the biomass digestive fluid, kW; and Q2 is the heat loss from the MFD and slurry tank, kW.
The initial temperature of slurry is the critical to the calculation of Q1, which we selected the measured data of a biogas engineering in Chengdu [34]. The Q1 can be calculated using Equation (10):
Q 1 = ρ b v b c b ( t z t i )
where ρb is the density of the biomass digestive fluid in the device, kg m−3, vb is the flow rate of the slurry, m3 s−1; cb is the specific heat capacity of the slurry, kJ kg−1 K−1; tz is the MFD digestion temperature, K; and ti is the initial temperature of slurry, which was 280.95 K. The parameters used in the calculation are listed in Table 2 and Figure 2.
Given that the slurry tank and MFD were cylindrical and the bottoms were connected to the foundation, their heat losses are given by Equations (11)–(13):
Q 2 = Q air + Q bottom
Q air = K air A air × ( t z t 0 )
Q bottom = K bottom A bottom × ( t z t sb )
where Qair represents the total heat loss from the top, side of the MFD, and slurry tank, kW; Qbottom is the heat loss from the bottom of the MFD and slurry tank, kW; Kair represents the heat transfer coefficients at the top and side of the MFD and slurry tank, kW m−2 K−1; Aair represents the areas of the top and side of the MFD and slurry tank, m2; t0 is the calculated ambient air temperature, K; Kbottom represents the heat transfer coefficients at the bottom of the MFD and slurry tank, kW m−2 K−1; Abottom is the area of the bottom of the MFD and slurry tank, m2; and tsb is the bottom temperature of the MFD and slurry tank, which is equal to the soil temperature at the bottom of the tank (281.45 K in this study).
The standard heat resistance equations for a multi-layer flat wall and multi-layer cylindrical wall can be expressed as follows [35]:
K Flat = 1 / ( 1 α 1 + δ 1 λ 1 + δ 2 λ 2 + 1 α 2 )
K Cylinder = 1 / ( 1 α 1 d 1 d 0 + d 1 2 λ 1 ln d 1 d 0 + d 2 2 λ 2 ln d 2 d 1 + 1 α 2 )
where KFlat is the combined heat transfer coefficient of a multi-layer flat wall, kW m−2 K−1; KCylinder is the combined heat transfer coefficient of a multi-layer cylindrical wall, kW m−2 K−1; α1 and α2 are the heat transfer coefficients of the tank internal surface and the external convection, kW m−2 K−1; δ1 and δ2 are the thicknesses of the tank and the external thermal insulation layers, m; d0, d1, and d2 are the diameters of the layers, m; and λ1 and λ2 are the heat conductivity coefficients of the digestion tank and external thermal insulation layer, kW m−1 K−1.

3.3.2. Biogas Boiler Consumption

Given that the system thermal demand was determined, the daily biogas consumption rate of the biogas boiler could also be determined using the principle of heat balance:
Q Demand = ( 1 η T ) Q Boiler = 0.139 r q η G ( 1 η T )
where QBoiler is the heat supplied by the operation of the biogas boiler, kW; r is the daily biogas consumption rate of the boiler, m3 m−3 d−1; q is the calorific value of the biogas, which was assumed to be 60% of the CH4 content, 23.85 MJ m−3; ηT is the heat loss rate of the pipe, 0.05–0.1; and ηG is the thermal efficiency of the biogas boiler, which was set as 0.8 [36].

3.3.3. Economical Digestion Temperature

The relationship between the slurry temperature and biogas production rate can be expressed by Equation (1). Combined with Equations (9)–(16), the value of the economical digestion temperature can be calculated using Equations (17) and (18) below:
r Net = 0.000090629 X 2 + 0.004935 X + 0.099075 ( X [ 5 , 40 ] )
T E = max ( r Net ) ( T E [ 5 , 40 ] )
where rNet is the net biogas production rate, m3 m−3 d−1; TE is the economical digestion temperature, °C; and max (rNet) indicates that when X = TE, the rNet is maximum.
Figure 8 presents the results of the calculation of Equation (18) using the assignment method (standard deviation is 0.011 m3 m−3 d−1). It was selected to assign a digestion temperature in increments of 1 °C. As shown in Figure 8, a linear relationship in the graphical form of a parabolic curve was found between the net biogas production rate and the digestion temperature. The largest net biogas production rate was at the inflection point of the curve, and it was concluded that the economical digestion temperature ranged from 27–28 °C.
The derivation method was used to obtain Equation (18). In particular, the net biogas production rate was selected as the objective function, and the derivative of the net biogas production rate to the digestion temperature was obtained. When ∂rNet/∂X = 0, the rNet is maximum. Using MATLAB software analysis, the value of the economical digestion temperature was found to be 27.2 °C.
From a comparison of the two methods, the result calculated by the derivation method was within the range of 27–28 °C. This also indicated that Equation (17) is accurate.

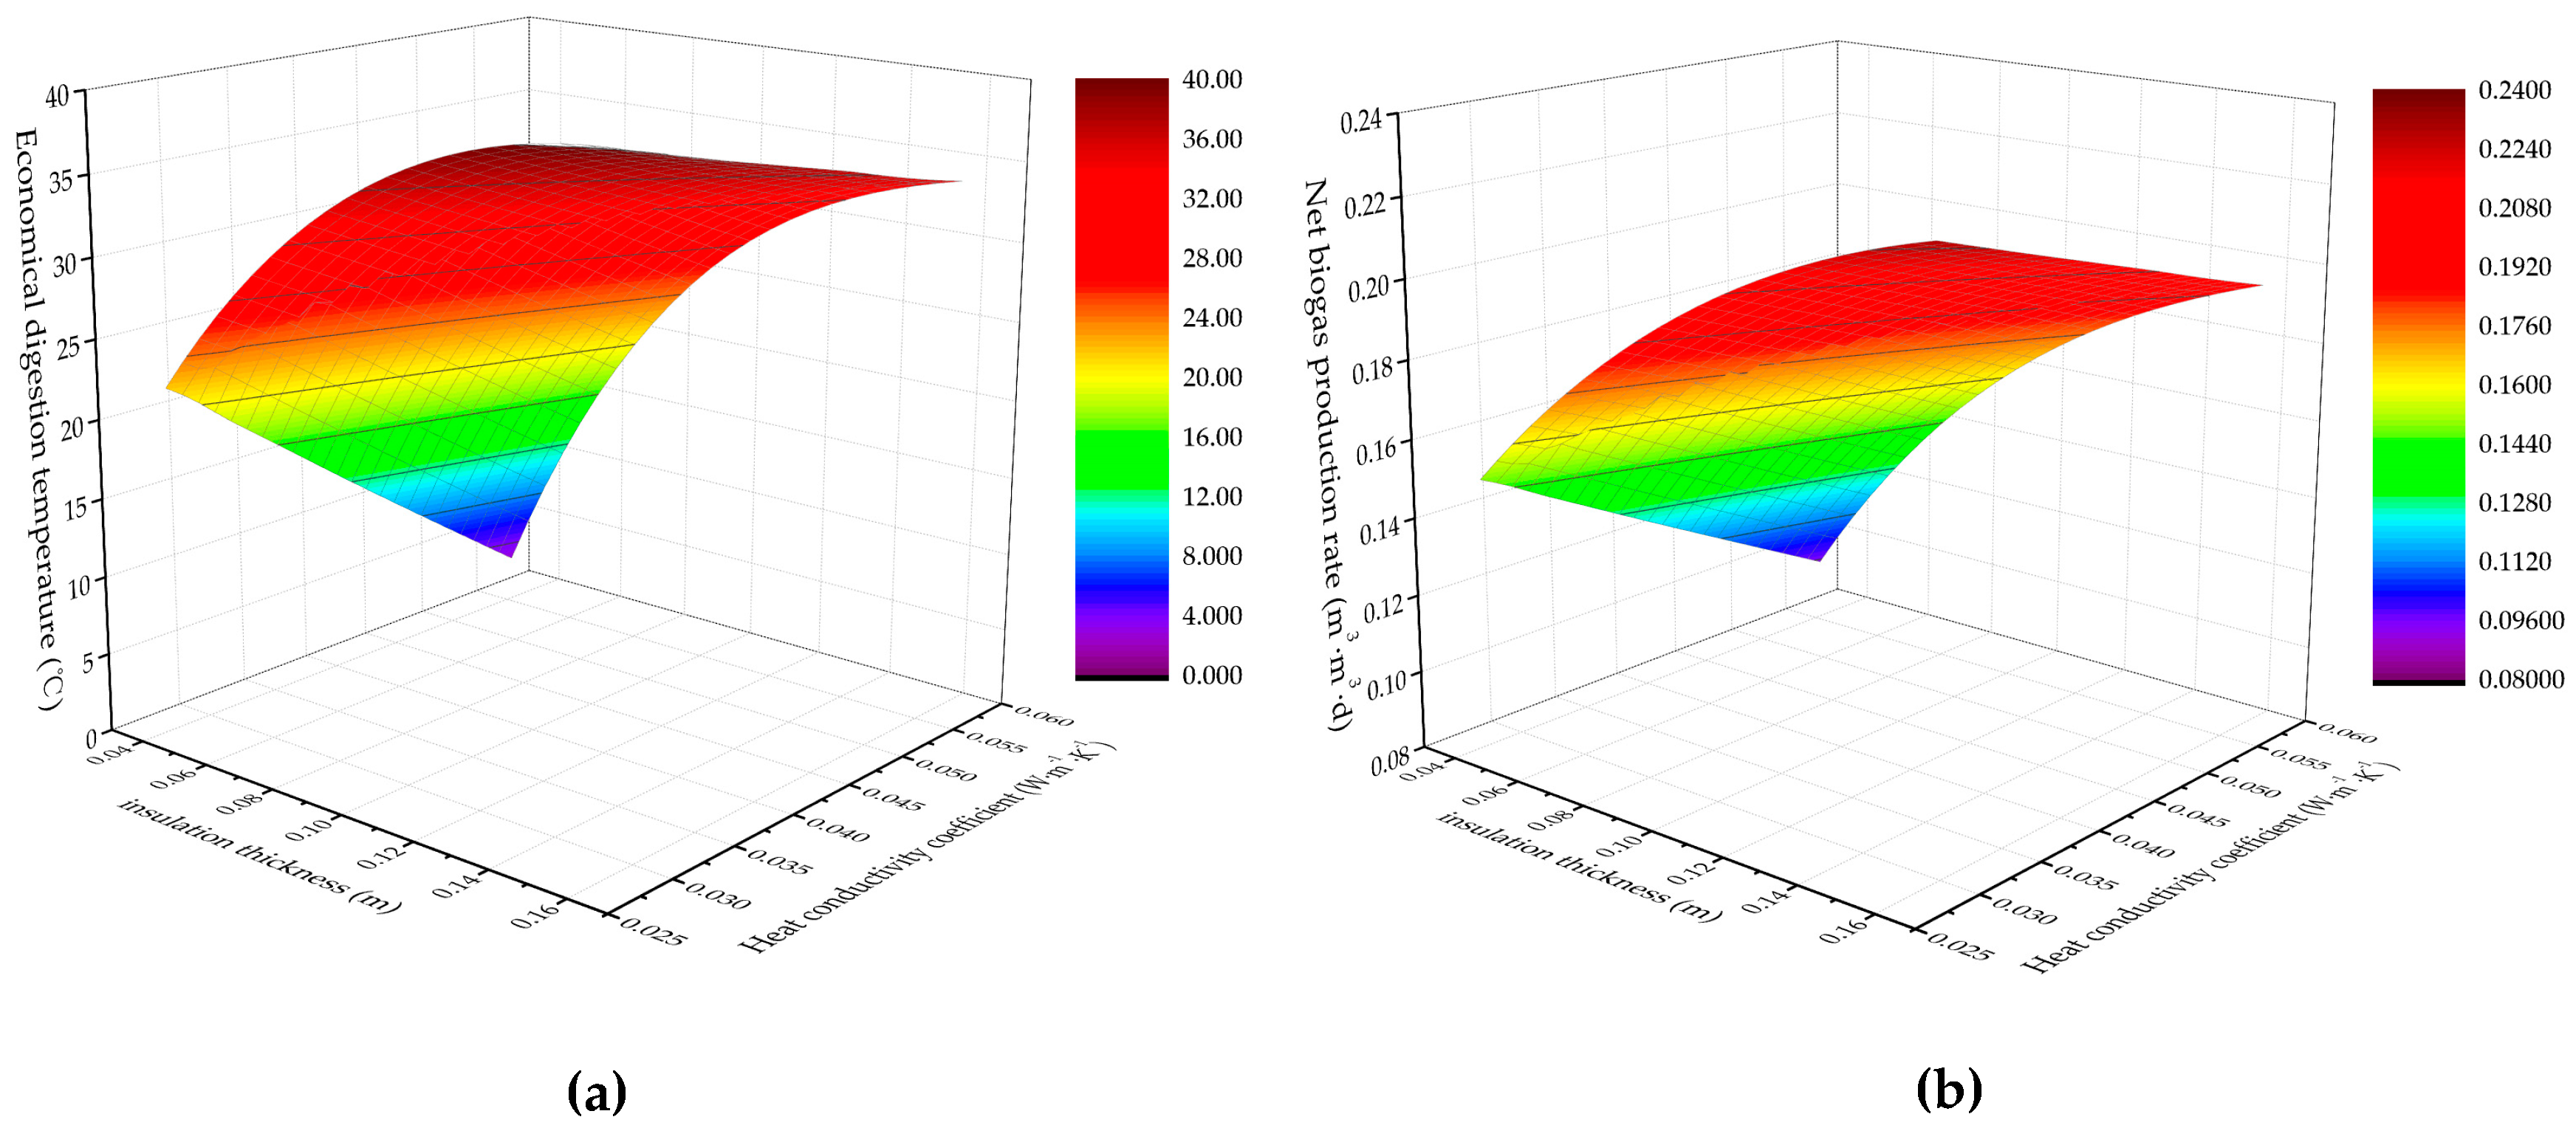
3.3.4. Effects of Insulation Material and Thickness on Economical Digestion Temperature

It is clear that the value of heat transfer coefficient K has a significant influence on the calculation of the system heat loss in Section 3.3.1 and economical digestion temperature in Section 3.3.3. Moreover, different insulation materials and thicknesses have a significant influence on the heat transfer coefficient according to Equations (14) and (15). At present, the common insulation materials mainly include polystyrene, polyurethane, polyvinyl chloride, and phenolic resin, as shown in Table 5.
According to Equations (9)–(18), the effects of different insulation heat conductivity coefficients and thicknesses on the economical digestion temperature can be determined using Equation (19).
T E = 46.98 15.13 λ in 0.26 λ in + δ in 15.13 λ in 0.21 λ in + δ in 10.31 λ in ln ( 1 + 1.23 δ in ) ( T E [ 5 , 40 ] )
where λin is the heat conductivity coefficient of the insulation materials, W m−1 K−1; and δin is the insulation thickness, m.
Figure 9a,b present the surface response of the insulation material heat conductivity coefficient with respect to the thickness to the economical digestion temperature and net biogas production rate, respectively. From a comparison between Figure 9a,b, the former was found to have a steeper slope. This indicated that the interaction between the heat conductivity coefficient and thickness has a more significant influence on the economical digestion temperature than that of the net biogas production rate.
Using the parameters of different insulation materials, the influence of the heat conductivity coefficient and thickness on the economical digestion temperature and the net biogas production rate can be obtained, as shown in Figure 10a,b, respectively. As shown in Figure 10a, when the insulation thickness was 0.09 m, the economical digestion temperature of the polystyrene, polyurethane, polyvinyl chloride, and phenolic resin were 27.2 °C, 33.5 °C, 27.9 °C, and 34.7 °C, respectively. The economical digestion temperature of different insulation materials was found to increase in accordance with an increase in the insulation thickness or a decrease in the heat conductivity coefficient. Moreover, the variations in the net biogas production rate with respect to different insulation materials and insulation thicknesses were as shown in Figure 10b. Though the economic digestion temperature was highest when the phenolic resin was selected, and the net biogas production rate was largest. Therefore, to achieve the optimal operating conditions, different insulation materials and thicknesses should be selected in accordance with the actual requirements of the application process [37,38].

3.4. Comparison of Different Anaerobic Digesters

Table 6 presents the performance parameters of different anaerobic digester. It is clear that MFD has a higher biogas production rate than static digester and a lower biogas production unit cost than general dynamic digester. Furthermore, the advantages and disadvantages of different anaerobic digester were introduced in Table 7.

3.5. System Operating Energy Efficiency Analysis and Key Future Research Points

To evaluate the operating stability of the dynamic anaerobic digestion system, an operating energy efficiency analysis of the MFD was carried out. The energy efficiency ratio (EER) of the system can be calculated using Equation (20):
E E R = Q output Q input
where EER is the energy efficiency ratio of the system; Qinput is the input energy of the system, which includes the operation energy and heating energy consumption, MJ/a; and Qoutput is the output energy of the system, MJ/a.
Figure 11 presents the results of the calculation of Equation (20) using a polystyrene insulation layer with a thickness of 90 mm. As shown in Figure 11, the EER increased and reached a maximum value (1.1) in accordance with an increase in the digestion temperature. When the digestion temperature was 22.3 °C, the EER = 1. Moreover, this indicates that when the digestion temperature is below 22.3 °C, the system requires additional energy. Furthermore, when the digestion temperature was 18.5 °C, the value of the EER was 0.4 in [13]; whereas, it was 0.82 in the dynamic anaerobic digestion system.
Throughout the course of the pilot scale experiments, the system stability decreased when the digestion temperature was lower than 10 °C, and the occurrence of acidification was significantly easier. Moreover, the value of the EER and biogas production rate was low. This was partly due to the high operating energy consumption and low OLR of the substrate. Therefore, the higher TS and OLR digestion experiments, and the circulating velocity optimization experiments should be carried out. Further research is required to determine a more efficient method to improve the biogas production rate while reducing the operating energy consumption.

4. Conclusions

This paper proposes an MFD and a dynamic anaerobic digestion system. In addition, an experimental study was carried out. From a comparison of the DD and SD groups, the biogas production rate of the DD group increased by 127.1% with the use of the dynamic digest, which amounted to a rate of production of 4.12 m3 of biogas per day, and 205.88 m3 over the course of 50 days. At a digestion temperature of 35 °C, the DD group increased the maximum biogas production rate to 0.63 m3 m−3 d−1 and shortened the digestion cycle. By kinetic calculations, the lag times on of the DD and SD groups were found to be 8.22 days and 10.27 days, respectively. Based the dynamic heating experiment, it was concluded that the heat transfer rate can be significantly increased, and the slurry temperature in the multiphase flow digester can be rapidly increased. The system was optimized by applying the biogas production law of the dynamic digestion experiment. The economical digestion temperature was 27.2 °C when the polystyrene insulation layer with a thickness of 90 mm was selected. Moreover, the net biogas production rate and economical digestion temperature were increased in accordance with an increase in the insulation thickness and decrease in the heat conductivity coefficient. Therefore, different insulation materials and thicknesses should be selected in accordance with the actual requirements of the application process. Compering with other anaerobic digester, the MFD has a lower biogas production unit cost and higher heat and mass transfer rate. However, the disadvantage of high operation energy consumption needs further improvement. Moreover, the dynamic digestion achieved an energy efficiency balance when the digestion temperature was 22.3 °C.
However, there are many potential research topics in this study that have not been investigated, such as the development of a more efficient method to improve the biogas production rate while reducing the energy consumption (pre-treatment methods, highly efficient anaerobic agent, etc.), in addition to the evaluation of the influence of different fluidization parameters (flow rate, TS, etc.) on the dynamic digestion, and the influence on the flow field characteristics (velocity distribution, vorticity distribution, etc.) on the dynamic digestion biogas production effect, among others.

Author Contributions

Conceptualization, project administration and funding acquisition, N.Y.; methodology, experiments and data analysis, P.G. and J.Z.; academic guidance, resources and supervision, R.M. and Y.Y.; writing—original draft, P.G.; writing—review and editing, P.G. and J.Z.

Funding

This research were funded by the National Natural Sciences Foundation of China, grant number 51378426, the Youth Science and Technology Innovation Team of Sichuan Province of Building Environment and Energy Efficiency, grant number 2015TD0015 and the Sichuan Science and Technology Support Program, grant number 2016JZ0018.

Acknowledgments

The authors gratefully acknowledge the financial support provided by the National Natural Sciences Foundation of China (No. 51378426), the Youth Science and Technology Innovation Team of Sichuan Province of Building Environment and Energy Efficiency (No. 2015TD0015) and the Sichuan Science and Technology Support Program (No. 2016JZ0018).

Conflicts of Interest

The authors declare no conflict of interest.

References

  1. Forgács, G.; Alinezhad, S.; Mirabdollah, A.; Feuk-Lagerstedt, E.; Horváth, I.S. Biological treatment of chicken feather waste for improved biogas production. J. Environ. Sci. 2011, 23, 747–1753. [Google Scholar] [CrossRef]
  2. Yu, L.; Ma, J.; Chen, S. Numerical simulation of mechanical mixing in high solid anaerobic digester. Bioresour. Technol. 2011, 102, 1012–1018. [Google Scholar] [CrossRef]
  3. Yang, H.; Deng, L.; Liu, Y.; Pu, X.; Zhang, G.; Lei, S.; Shi, G. A review on effects of stirring on biogas production of anaerobic digestion. China Biogas 2010, 28, 3–9. (In Chinese) [Google Scholar]
  4. Latha, K.; Velraj, R.; Shanmugam, P.; Sivanesan, S. Mixing strategies of high solids anaerobic co-digestion using food waste with sewage sludge for enhanced biogas production. J. Clean. Prod. 2019, 210, 388–400. [Google Scholar] [CrossRef]
  5. Ong, H.K.; Greenfield, P.F.; Pullammanappallil, P.C. An operational strategy for improved biomethanation of cattle-manure slurry in an unmixed, single-stage, digester. Bioresour. Technol. 2000, 73, 87–89. [Google Scholar] [CrossRef]
  6. Meister, M.; Rezavand, M.; Ebner, C. Mixing non-Newtonian flows in anaerobic digesters by impellers and pumped recirculation. Adv. Eng. Softw. 2018, 115, 194–203. [Google Scholar] [CrossRef]
  7. Kobayashi, T.; Wu, Y.; Xu, K.; Yu, Y. Effect of mixing driven by siphon flow: Parallel experiments using the anaerobic reactors with different mixing modes. Energies 2013, 6, 4207–4222. [Google Scholar] [CrossRef]
  8. Kitamura, Y.; Paquin, D.; Gautz, L.; Liang, T. A rotational hot gas heating system for bioreactors. Biosyst. Eng. 2007, 98, 215–223. [Google Scholar] [CrossRef]
  9. De Jesus, S.; Moreira Neto, J.; Maciel Filho, R. Hydrodynamics and mass transfer in bubble column, conventional airlift, stirred airlift and stirred tank bioreactors, using viscous fluid: A comparative study. Biochem. Eng. J. 2017, 118, 70–81. [Google Scholar] [CrossRef]
  10. Trad, Z.; Fontaine, J.; Larroche, C.; Vial, C. Multiscale mixing analysis and modeling of biohydrogen production by dark fermentation. Renew. Energy 2016, 98, 264–282. [Google Scholar] [CrossRef]
  11. Scarlat, N.; Dallemand, J.-F.; Fahl, F. Biogas: Developments and perspectives in Europe. Renew. Energy 2018, 129, 457–472. [Google Scholar] [CrossRef]
  12. Gao, K. Some recognitions on the role of stirring in biogas fermentation. China Biogas 2015, 33, 3–9. (In Chinese) [Google Scholar]
  13. Huang, R.; Mei, Z.; Long, Y. Impact of optimized of flow pattern on pollutant removal and biogas production rate using wastewater anaerobic fermentation. BioResources 2015, 10, 4826–4842. [Google Scholar] [CrossRef]
  14. Xiong, X.; Shi, G.; Luo, T.; Kong, C. The cause of scuming during straw biogas fermentation and countermeasures. China Biogas 2014, 32, 51–54. (In Chinese) [Google Scholar]
  15. Karim, K.; Hoffmann, R.; Klasson, T.; AI-Dahhan, M. Anaerobic digestion of animal waste: Effect of mixing. Bioresour. Technol. 2005, 96, 1607–1612. [Google Scholar] [CrossRef] [PubMed]
  16. Chae, K.J.; Jang, A.; Yim, S.K.; Kim, I.S. The effects of digestion temperature and temperature shock on the biogas yields from the mesophilic anaerobic digestion of swine manure. Bioresour. Technol. 2008, 99, 1–6. [Google Scholar] [CrossRef] [PubMed]
  17. Sreekrishnan, T.R.; Kohli, S.; Rana, V. Enhancement of biogas production from solid substrates using different techniques—A review. Bioresour. Technol. 2004, 95, 1–10. [Google Scholar]
  18. Liu, Y.; Chen, Y.; Zhou, Y.; Wang, D. Experimental research on the thermal performance of PEX helical coil pipes for heating the biogas digester. Appl. Therm. Eng. 2019, 147, 167–176. [Google Scholar] [CrossRef]
  19. Kou, W.; Zheng, L.; Qu, J.; Shao, L.; Zhang, D. Engineering design of solar and power waste energy heating system for biogas project. Trans. Chin. Soc. Agric. Eng. 2013, 29, 211–217. (In Chinese) [Google Scholar]
  20. Sun, B.; Guo, Y.; Sun, W.; Gao, Y.; Li, H.; Wang, Z. Multiphase flow behavior for acid-gas mixture and drilling fluid flow in vertical wellbore. J. Pet. Sci. Eng. 2018, 165, 388–396. [Google Scholar] [CrossRef]
  21. Mayerhofer, M.; Fendt, S.; Spliethoff, H.; Gaderer, M. Fluidized bed gasification of biomass–In bed investigation of gas and tar formation. Fuel 2014, 117, 1248–1255. [Google Scholar] [CrossRef]
  22. Wu, Z.; Ma, R.; Wang, Z. Fluidization Technology Foundation and Application; Chemical Industry Press: Beijing, China, 2006; pp. 122–125. [Google Scholar]
  23. Ahring, B.K.; Ibrahim, A.A.; Mladenovska, Z. Effect of temperature increase from 55 °C to 65 °C on performance and microbial population dynamics of an anaerobic reactor treating cattle manure. Water Res. 2001, 35, 2446–2452. [Google Scholar] [CrossRef]
  24. El-Mashad, H.M.; Zeeman, G.; van Loon, W.K.P.; Bot, G.P.A.; Lettinga, G. Effect of temperature and temperature fluctuation on thermophilic anaerobic digestion of cattle manure. Bioresour. Technol. 2004, 95, 191–201. [Google Scholar] [CrossRef] [PubMed]
  25. Dong, F.; Lu, J. Using solar energy to enhance biogas production from livestock residue—A case study of the Tongren biogas engineering pig farm in South China. Energy 2013, 57, 759–765. [Google Scholar] [CrossRef]
  26. Lay, J.; Li, Y.; Noike, T. Effect of moisture content and chemical nature on methane fermentation characteristics of municipal solid wastes. Doboku Gakkai Ronbunshu 1996, 552, 101–108. [Google Scholar] [CrossRef]
  27. Nopharatana, A.; Pullammanappallil, P.; Clarke, W.P. Kinetics and dynamic modelling of batch anaerobic digestion of municipal solid waste in a stirred reactor. Waste Manag. 2007, 27, 595–603. [Google Scholar] [CrossRef]
  28. Zhen, G.; Lu, X.; Kobayashi, T.; Li, Y.; Xu, K. Mesophilic anaerobic co-digestion of waste activated sludge and Egeria densa: Performance assessment and kinetic analysis. Appl. Energy 2015, 148, 78–86. [Google Scholar] [CrossRef]
  29. Li, K.; Liu, R.; Sun, C. Comparison of anaerobic digestion characteristics and kinetics of four livestock manures with different substrate concentrations. Bioresour. Technol. 2015, 198, 133–140. [Google Scholar] [CrossRef] [PubMed]
  30. Alkhamis, T.M.; EI-khazali, R.; Kablan, M.M.; Alhusein, M.A. Heating of a biogas reactor using a solar energy system with temperature control unit. Sol. Energy 2000, 69, 239–247. [Google Scholar] [CrossRef]
  31. Rajendran, K.; Aslanzadeh, S.; Taherzadeh, M. Household biogas digesters—A review. Energies 2012, 5, 2911–2942. [Google Scholar] [CrossRef]
  32. Feng, R.; Li, J.; Dong, T.; Li, X. Performance of a novel household solar heating thermostatic biogas system. Appl. Therm. Eng. 2016, 96, 519–526. [Google Scholar] [CrossRef]
  33. Shi, H.; Wang, T.; Zhu, H.; Zhang, Y.; Meng, X.; Guo, C. Heating system of biogas digester by ground-source heat pump. Trans. Chin. Soc. Agric. Eng. 2010, 26, 268–273. (In Chinese) [Google Scholar]
  34. Lu, Y.; Tian, Y.; Lu, H.; Wu, L.; Li, X. Study of solar heated biogas fermentation system with a phase change thermal storage device. Appl. Therm. Eng. 2015, 88, 418–424. [Google Scholar] [CrossRef]
  35. Zhang, X.; Ren, Z.; Mei, F. Heat Transfer, 5th ed.; China Architecture & Building Press: Beijing, China, 2007; pp. 66–70. [Google Scholar]
  36. Zhang, J.; Tan, Y.; Yang, X. Application design on solar energy and marsh gas boiler combination warming system. Energy Conserv. Technol. 2008, 26, 523–525. (In Chinese) [Google Scholar]
  37. Shi, H.; Huang, C.; Zhu, H.; Pei, X.; Hu, M.; Guo, C. Determination of economical insulation thickness for digester based on heat pump heating system. Chin. Soc. Agric. Eng. 2012, 28, 215–221. (In Chinese) [Google Scholar]
  38. Wu, B.; Bibeau, E.L. Development of 3-D anaerobic digester heat transfer model for cold weather applications. Am. Soc. Agric. Biol. Eng. 2006, 49, 749–757. [Google Scholar]
  39. Gabisaa, E.W.; Gheewala, S.H. Potential, environmental, and socio-economic assessment of biogas production in Ethiopia: The case of Amhara regional stat. Biomass Bioenergy 2019, 122, 446–456. [Google Scholar] [CrossRef]
  40. Zhang, Z.; Wang, Y. The economical efficiency of excrement energy engineering in breeding industry. Sustain. Dev. 2016, 6, 223–230. (In Chinese) [Google Scholar]
Figure 1. The anaerobic digestion system: (a) schematic diagram of multiphase flow digestion system; (b) image of biogas boiler; (c) image of slurry tank; and (d) image of multiphase flow digester.
Energies 12 01960 g001
Figure 2. Structure diagram of multiphase flow digester.
Energies 12 01960 g002
Figure 3. The relationship between slurry temperature and biogas production rate.
Energies 12 01960 g003
Figure 4. Cumulative biogas production of two groups. (a): DD group; (b): SD group.
Energies 12 01960 g004
Figure 5. The experimental results and fitting curves of the biogas production rates of DD and SD groups.
Energies 12 01960 g005
Figure 6. Influence of dynamic heating on the slurry temperature.
Energies 12 01960 g006
Figure 7. The ambient air temperature of Suining city from December 2015 to February 2016.
Energies 12 01960 g007
Figure 8. Effect of economical digestion temperature on net biogas production rate.
Energies 12 01960 g008
Figure 9. The effects of different insulation materials and thicknesses on (a) the economical digestion temperature and (b) net biogas production rate.
Energies 12 01960 g009
Figure 10. The effects of insulation materials and thickness: (a) calculated results of four insulation materials and thicknesses on economical digestion temperature; and (b) calculated results of insulation materials and thicknesses on net biogas production rate.
Energies 12 01960 g010
Figure 11. Effect of digestion temperature on EER.
Energies 12 01960 g011
Table 1. Influence of mixing treatment on CH4 yield.
FeedTemperature (°C)HRT (days)CH4 Yield (m3/kg VS)Mixing MethodMixing IntensityReference
Food waste30300.24M150 rpm[4]
Food waste30300.28G2 L/min[4]
Straw8–29630.25R82.45 L/min[13]
Manure3516.20.26G1 L/min[15]
Manure3516.20.27M275 rpm[15]
Manure3516.20.28R0.82 L/min[15]
G is gas mixed, M is impeller mixed, R is slurry-recirculation.
Table 2. Characterization of the biogas slurry.
GrouppHCOD (mg L−1)BOD5 (mg L−1)TS (%)VS (%)
Fresh pig manure6.225689125869.5363.2
Continuous experiment7.2771944752.8759.9
Batch experimentDD group7.6653732183.2262.6
SD group7.1588935703.1360.5
Table 3. Comparison of dynamic digestion and static digestion.
GroupEnergy of Slurry (MJ)Total Biogas Production (m3)Energy of Biogas (MJ)Energy Conversion (%)
DD group27614.4205.884910.217.78
SD group27614.490.662162.27.83
Δ(DD-SD)/115.2227489.95
Table 4. Model parameters of the modified Gompertz and Cone equations.
EquationParameterDD GroupSD Group
Modified Gompertz equationHm (m3 m−3)20.74 ± 0.189.05 ± 0.10
Rm (m3 m−3 d−1)0.50 ± 0.00350.22 ± 0.0018
θ (d)8.22 ± 0.1210.27 ± 0.13
R20.99950.9993
Modified Cone equationHm (m3 m−3)26.81 ± 0.6211.05 ± 0.20
k (d−1)0.027 ± 0.000660.028 ± 0.00048
n2.05 ± 0.0352.34 ± 0.034
R20.99940.9995
Table 5. Parameters and prices of four insulation materials [37].
Insulation MaterialsHeat Conductivity Coefficient
λin (W m−1 K−1)
Price
P (yuan m−3)
Polystyrene0.05280
Polyurethane0.033675
Polyvinyl chloride0.0481070
Phenolic resin0.03500
Table 6. Performance parameters of different anaerobic digesters.
FeedDigesterDigestion Concentration (%)Temperature (°C)Biogas Production Rate (m3 m−3 d−1)Biogas Production Unit Cost ** (yuan m−3)Reference
ManureStatic digester0.64Ambient temperature0.120.94[39]
StrawSlurry-recirculation digester1.18~290.535.23 *[13]
ManureImpeller mixed digester8.2301.18.37 *[40]
ManureMFD3.22350.482.15 *
* Calculated value; ** include initial investment and operation costs.
Table 7. Advantages and disadvantages of different anaerobic digesters.
DigesterAdvantagesDisadvantages
Static digestersimple structure, easy maintenance, low operation and management costslow biogas production rate, easy clogging and crusting, low digestion stability
General dynamic digesterhigh biogas production rate, digestion completely, long service lifecomplex structure, difficult maintenance, poor operation reliability
MFDhigh biogas production rate, short digestion cycle, high heat and mass transfer rate, difficult clogginghigh operation energy consumption, complex structure

