Article

Mapping Global Environmental Suitability for Sorghum bicolor (L.) Moench

1
State Key Laboratory of Resources and Environmental Information System, Institute of Geographical Sciences and Natural Resources Research, Chinese Academy of Sciences, Beijing 100101, China
2
College of Resources and Environment, University of Chinese Academy of Sciences, Beijing 100049, China
3
Key Laboratory of Carrying Capacity Assessment for Resource and Environment, Ministry of Land & Resources, Beijing 100101, China
*
Author to whom correspondence should be addressed.
These authors contributed equally to this work.
Energies 2019, 12(10), 1928; https://doi.org/10.3390/en12101928
Submission received: 23 April 2019 / Revised: 12 May 2019 / Accepted: 16 May 2019 / Published: 20 May 2019
(This article belongs to the Section A4: Bio-Energy)

Abstract

:
Sorghum bicolor (L.) Moench, called sweet sorghum, is a drought-resistant and heat-tolerant plant used for ethanol bioenergy production, and is able to reduce the competition between growing crops for energy vs. growing crops for food. Quantitatively mapping the marginal lands of sweet sorghum is essential for the development of sorghum-based fuel ethanol production. However, knowledge of the contemporary marginal lands of sweet sorghum remains incomplete, and usually relies on sample data or is evaluated at a national or regional scale based on established rules. In this study, a novel method was demonstrated for mapping the global marginal lands of sweet sorghum based on a machine learning model. The total amount of global marginal lands suitable for sweet sorghum is 4802.21 million hectares. The model was applied to training and validation samples, and achieved high predictive performance, with the area under the receiver operating characteristic (ROC) curve (AUC) values of 0.984 and 0.978, respectively. In addition, the results illustrate that maximum annual temperature contributes more than do other variables to the predicted distribution of sweet sorghum and has a contribution rate of 40.2%.

1. Introduction

Fossil fuels are non-renewable energy resources that continue to be consumed as a driver of social and economic development. This consumption not only depletes fossil fuel reserves but also leads to the intensification of global climate change [1]. At the 21st Conference of the United Nations Framework Convention on Climate Change in December 2015, the Paris agreement was adopted. Its purpose was to limit global warming to below 2 °C and to “pursue efforts” to hold it to no more than 1.5 °C [2,3]. The main strategies to reduce global greenhouse gas emissions measures include reducing energy demands, improving energy efficiency, and developing renewable energy [4,5,6]. Based on Europe’s 2009 Renewable Energy Directive, each member state needs to supply 10% of transport energy from renewable sources—a proportion of which will come from biofuels by 2020 [7]. Therefore, the development of biofuels is imperative.
Several researchers have suggested that bioenergy can play an essential part in reducing long-term carbon dioxide emissions due to the high net energy gain and low production costs of bioenergy [8,9,10]. The technology for producing ethanol from grain crops is mature, but it creates conflict between using cropland to produce energy or food supplies [11]. Sweet sorghum, a bioenergy plant used for ethanol production, could reduce this competition because its seeds can be used for both food and fuel [12,13]. The net energy balance of sweet sorghum is high, and its carbon dioxide balance is more favorable than that of maize, sugar beets, and sugarcane [14,15,16].
Quantitatively mapping the marginal lands of energy plants is key to developing plans for ethanol fuel production [17]. Hao et al. evaluated the marginal lands in China from the standpoint of water resources, which showed that the marginal land resources suitable for sweet sorghum are much larger than those suitable for cassava [18]. Fu et al. analyzed the marginal land resources suitable for developing bioenergy in Asia, which illustrated that China has more development potential in the bioenergy sector than other countries [19]. Tuck et al. mapped the distribution of marginal lands of sweet sorghum in Europe, and revealed that it could potentially be grown in up to 25% of Southern Europe [20]. These studies were carried out on national or regional scales based on a multiple-criteria evaluation method, while knowledge of the global marginal lands of sweet sorghum remains incomplete.
In the multiple-criteria evaluation process, the construction of the rule set was mainly based on the prior knowledge of the experts. However, the multi-factor impact mechanism was so complicated that the expert’s prior knowledge was sometimes not applicable. In this study, a novel method was demonstrated to map the marginal lands of sweet sorghum at the global scale using a machine learning model. The machine learning model is a data-driven method capable of identifying the complex relationships between the related environmental factors and occurrence records of sweet sorghum. Based on the investigated patterns, our model predicted the global potential marginal lands of sweet sorghum at a high spatial resolution for the first time. The technical flowchart is shown in Figure 1.

2. Materials and Methods

The boosted regression trees (BRTs) model adopted in this study is a kind of machine-learning algorithm capable of analyzing complex non-linear relationships such as the probability of the occurrence of a given species and multiple environmental variables [21,22]. To make an accurate map of the marginal lands of sweet sorghum, the BRT model required three types of data sets: (a) a set of high-spatial-resolution global environmental variables affecting the growth of bioenergy plants such as sweet sorghum; (b) a global georeferenced dataset for known sweet sorghum areas; and (c) a set of absence points that define unsuitable environment conditions for sweet sorghum. All data used in this research are based on the WGS-84 geographic coordinate system, and a global environment suitability map with 5 × 5 km2 spatial resolution was produced for sweet sorghum. In this study, C++ programming and GIS software were employed to preprocess the above datasets.

2.1. Land-Cover and Environmental Variables

Previous studies show that the distribution of several bioenergy plants is affected by environmental factors such as climate, soil, and topography conditions [23,24,25]. Land cover was adopted as an additional condition to reduce the risk of competition with existing food crop production. In this research, comprehensive environmental factors were used to obtain gridded maps of the global marginal lands of sweet sorghum. The rationale for our inclusion of each environmental factor is described in the following sections. The datasets adopted in this research are listed in Table 1.

2.1.1. Climate

The WorldClim database (http://www.wclim.org/) contains freely available global climate datasets at a 1 × 1 km2 spatial resolution. The datasets of version 2.0 span the period from 1970–2000 and were derived from world-wide weather stations using ANUSPLIN-SPLINA software [26]. Data for precipitation and air temperature are important for plant growth. Several studies have described the link between precipitation and plant growth [27,28]. High temperature can cause sterility in male sweet sorghum, which significantly compromises crop yields [29]. Leaf expansion in sweet sorghum is severely inhibited by night temperatures below 5 °C [30]. Therefore, this research incorporates mean annual precipitation, as well as maximum and minimum annual temperature layers.

2.1.2. Soil

There is evidence that soil quality affects plant growth [31,32,33]. Soil quality is determined by several parameters, such as effective soil depth, soil type, and soil water content. Map layers for effective soil depth and soil class type were obtained from the World Soil Information website (http://www.isric.org/). The soil water content, which quantifies available soil water for vegetation, was downloaded from the Consortium for Spatial Information (http://www.cgiar-csi.org/).

2.1.3. Topography

Topography plays an important role in the process of vegetation growth. For example, soil moisture is easy to lose in areas with steep slopes, which are not conducive to plant growth. Because the global Digital Elevation Model (DEM) dataset (90 m) provided by the Shuttle Radar Topography Mission (SRTM) (http://srtm.csi.cgiar.org) does not cover regions at high latitudes, a DEM dataset downloaded from NASA’s Earth Observatory Group (https://www.nasa.gov/) that includes high-latitude areas was used. Based on this dataset, the global spatial distribution of land surface slope was obtained.

2.1.4. Land Cover

To ensure the safety of food production, land cover type was used as a limiting condition. The global land use dataset at approximately 5 × 5 km2 spatial resolution, which was derived from the MODIS Terra and Aqua based on supervised decision tree and artificial neural network classification algorithms [34], was downloaded from NASA’s Earth Observatory Group (https://lpdaac.usgs.gov/). There is some literature that uses several land cover types such as shrub land, forest land, and grassland for planning the cultivation of bioenergy plants [17,19]. However, this study takes the opposite approach by regarding some land cover types, including urban, barren, and cropland, as unsuitable for sweet sorghum growth.

2.2. Occurrence Records

The database adopted in this study contains information on the known global occurrences of sweet sorghum (http://doi.org/10.15468/39omei), which include records of sweet sorghum from 1831–2015. This database can be downloaded from the Global Biodiversity Information Facility (http://www.gbif.org), and it contains 45,012 records with georeferenced location (latitude and longitude) information. This study assumed that the existence of sweet sorghum in these locations is reasonable. In other words, the georeferenced occurrence records reflect natural environment conditions suitable for the growth of sweet sorghum. To match the spatial resolution of the other environmental variables, the occurrence records were rasterized. During this process, some occurrence points were merged into a single grid cell because their locations were close to each other. In total, 6052 grid cells for sweet sorghum were assembled.

2.3. Absence Records

The absence records, which correspond to areas where environmental factors are not suitable for this bioenergy plant, are essential for mapping the spatial distribution of sweet sorghum [35]. As mentioned above, the grid cells where the minimum temperature is below 5 °C, or the land cover type belongs to urban, barren, or cropland classes are less likely to grow sweet sorghum. Additional absence points were randomly selected from the limit region, the total number of which was equal to the total quantity of occurrence records.

2.4. Modeling

Version 3.3.1 of the 64-bit version of R language was adopted to tune parameters, build the model, and assess performance. The dismo and gbm packages were used to train the BRT model. To train and test the performance of the BRT, 75% of the sample data were randomly selected as training data, and the remaining data were used as the validation dataset. To evaluate the predictive performance of the BRT model during tenfold cross-validation, the area under the receiver operating characteristic (ROC) curve (AUC) was used, which exhibited a number of desirable properties when compared to overall accuracy [36]. Based on a research experience carried out by Messina et al. [37], the main tuning parameter values were set as follows (tree.complexity = 4, learning.rate = 0.005, bag.fraction = 0.75, step.size = 10, cv.folds = 10, max.trees = 1000), and the other parameters of the BRT model were held at their default values. A detailed description of the BRT model can be found elsewhere [38,39,40].

3. Results

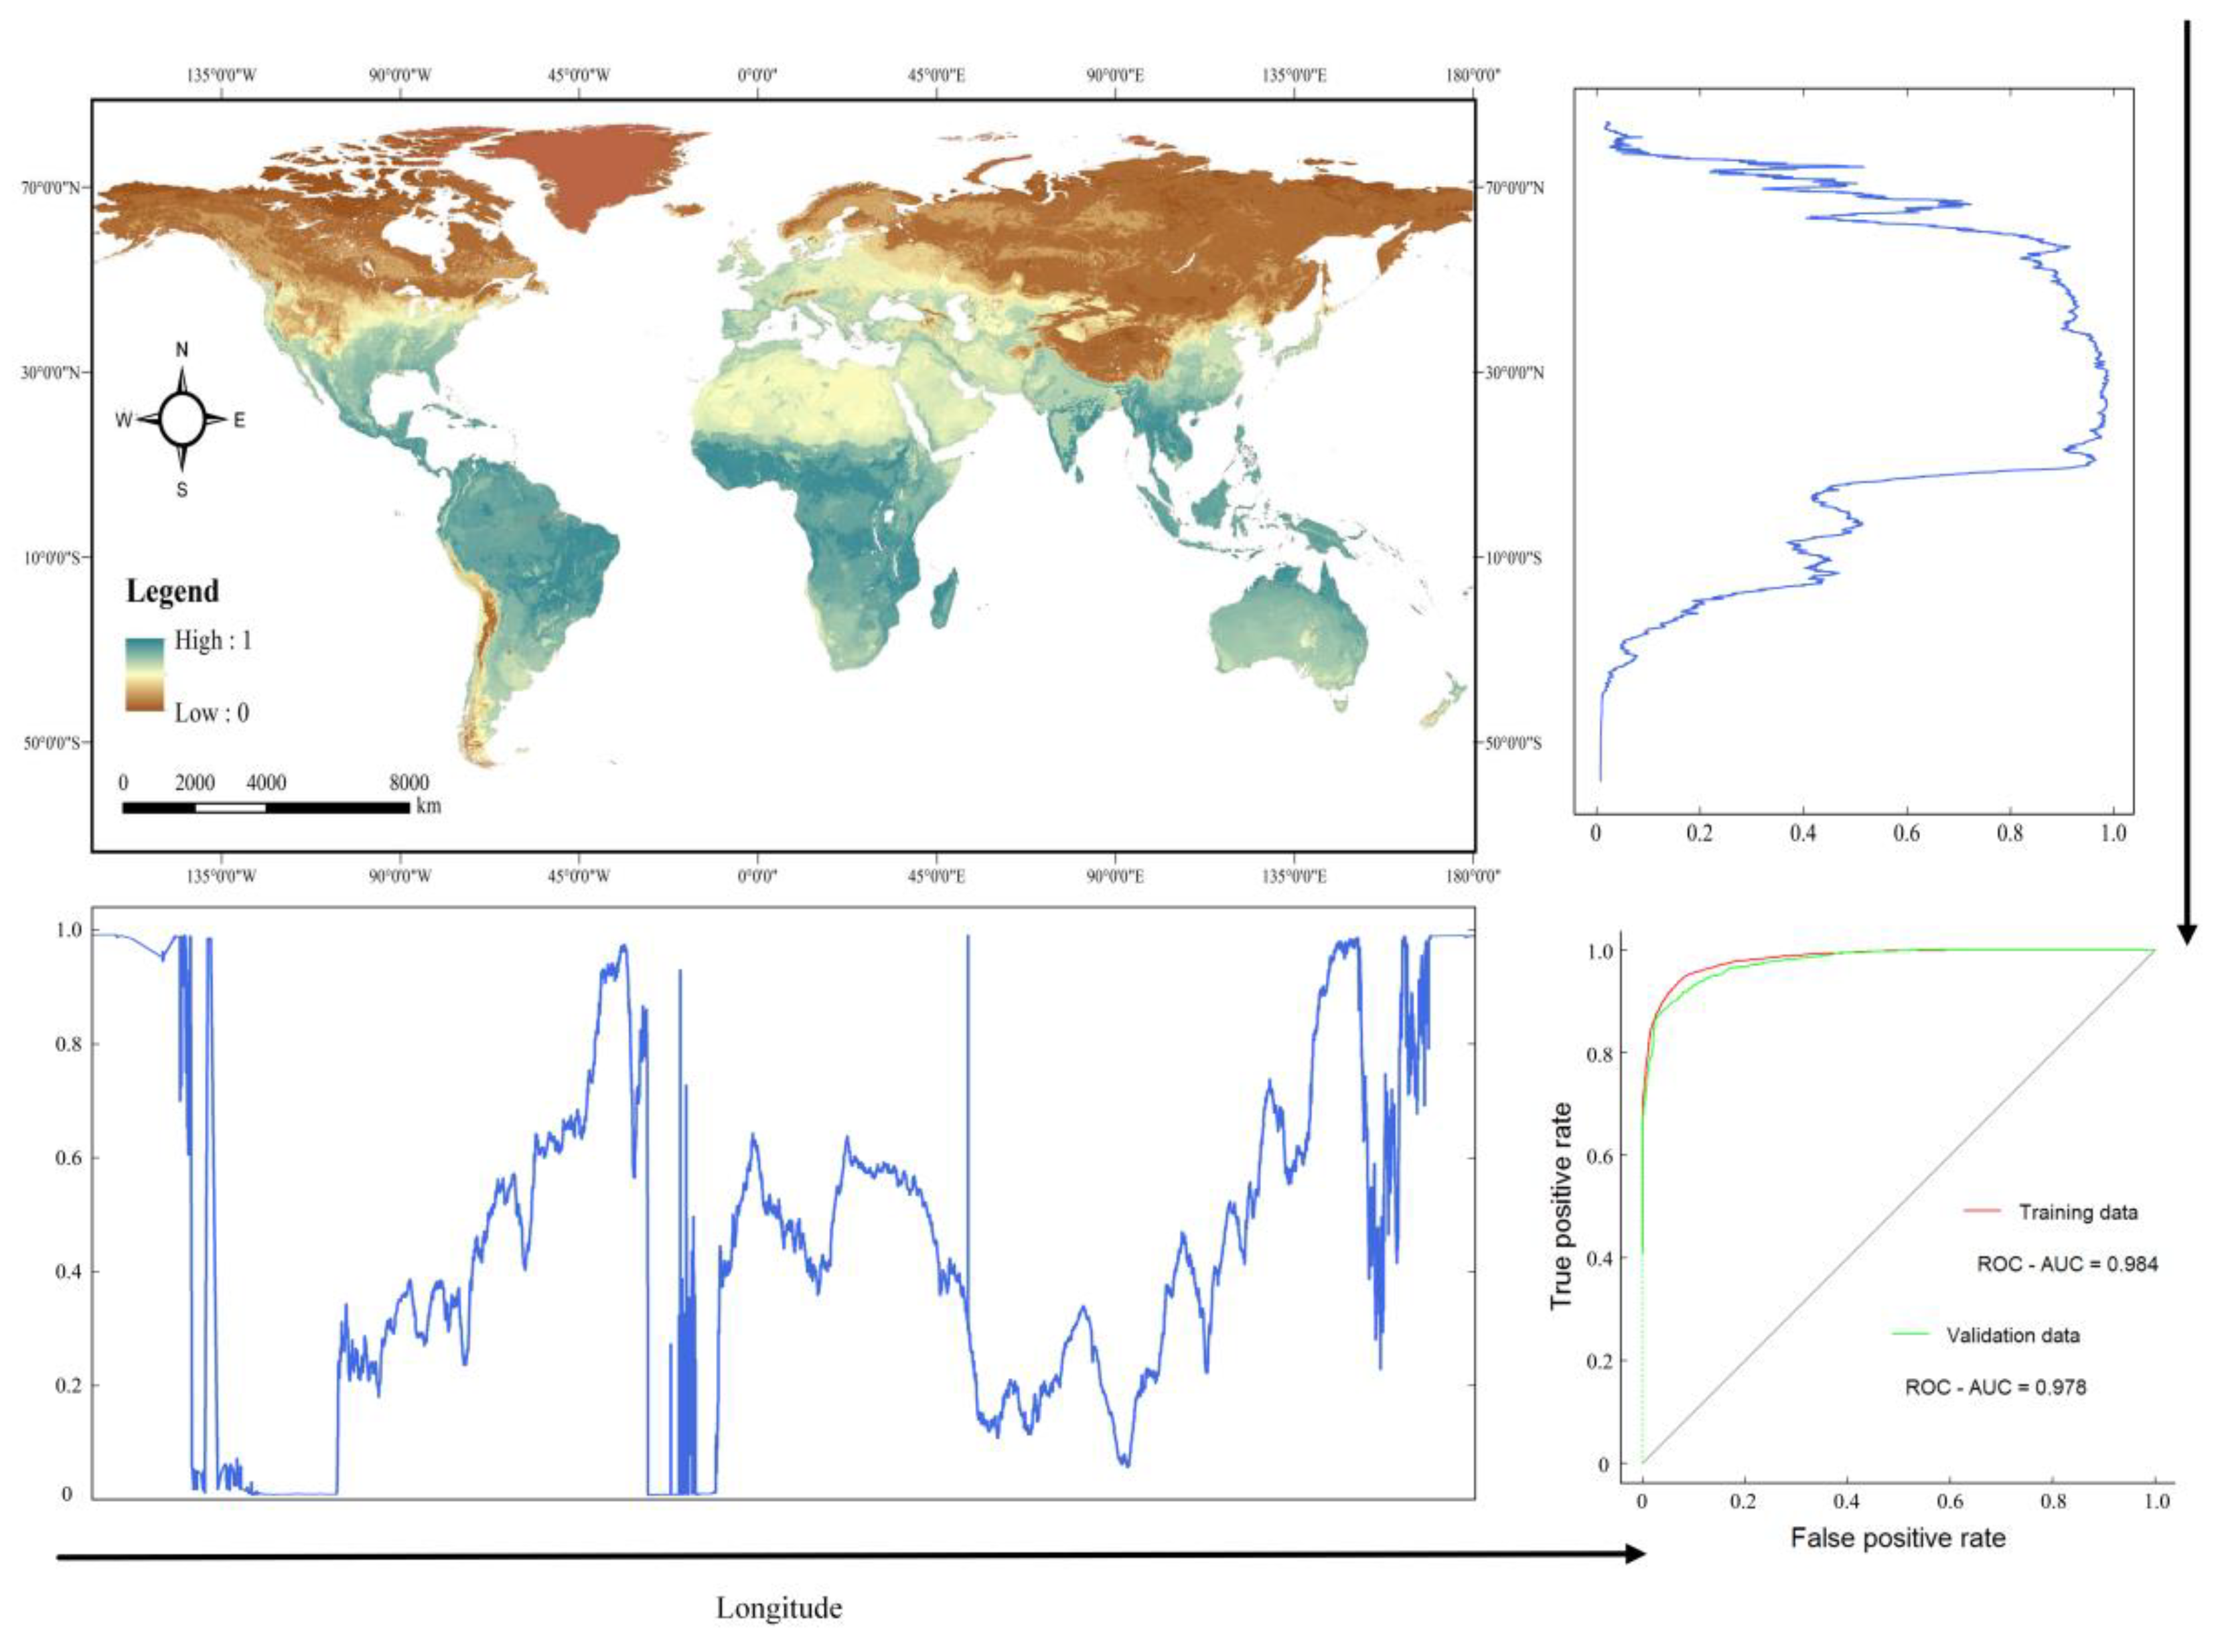
3.1. The Predicted Distribution of Sweet Sorghum

The final map derived from the BRT model, which shows the predicted potential distribution of sweet sorghum, is presented in Figure 2. Sweet sorghum was predicted to grow primarily in the tropics and sub-tropics, with concentrations in southern North America, northeastern South America (Brazil), central Africa (Central African Republic, Guinea, Ivory Coast, and Mozambique), Southeast Asia, and northern Oceania. The areas of highest environmental suitability in Southeast Asia are mainly concentrated in Myanmar, Thailand, Laos, and Cambodia. India is also suitable for sweet sorghum, but only a small amount of land can be used to grow the bioenergy plant because most of the land is needed for food production. In China’s case, the environmental suitability in the southern part of the country is higher than that of the north. In Europe, there are few areas suitable for sweet sorghum growth because the environmental suitability is not high.
Based on occurrence probability, the average level of environmental suitability for sweet sorghum was calculated by latitude and longitude. According to this figure, the change in environmental suitability from south to north is obvious, while the change from west to the east is irregular. For example, Figure 2 shows that the average level of environmental suitability from 60 °S to 70 °N increased and then decreased, and the mean value of environmental suitability from 30 °S to 10 °N was higher than 0.8. Additionally, the magnitude of the rise or fall of environmental suitability was more pronounced for changes in longitude.
Figure 2 also shows that the BRT model applied to training samples and validation samples achieved high predictive performance, with AUC values of 0.984 and 0.978, respectively. The spatial distribution of the validation samples illustrates that sweet sorghum has a wide geographic distribution, mainly concentrated in India and central and southern Africa (Figure 3). Compared with the above two areas, the distribution of validation samples in the remainder of the regions was relatively scattered. The results also reveal that the predicted distribution of sweet sorghum covered the area of the validation samples well. This map reflects the potential land resources for sweet sorghum growth.
A threshold environmental suitability value of 0.5 was used to classify each 5 × 5 km2 unit on our final binary map as suitable or unsuitable for sweet sorghum growth. The total amount of marginal lands suitable for sweet sorghum was 4802.21 million hectares, as shown in Table 2. Africa had the largest marginal land area suitable for the bioenergy plant with 1549.32 million hectares, and South America was second, with 1226.08 million hectares. Europe had the smallest suitable land area, with 121.02 million hectares—less than the Republic of Indonesia. For a single country, Brazil had the largest amount of marginal land resources suitable for sweet sorghum, with 676.86 million hectares, followed by Australia (602.94 million hectares), the United States (260.29 million hectares), the Republic of Congo (188.64 million hectares), and China (159.61 million hectares). The amount of marginal land resources suitable for sweet sorghum in each of the top ten countries was greater than 100.07 million hectares, while the amount of the land resources in each remaining country was below 100 million hectares.

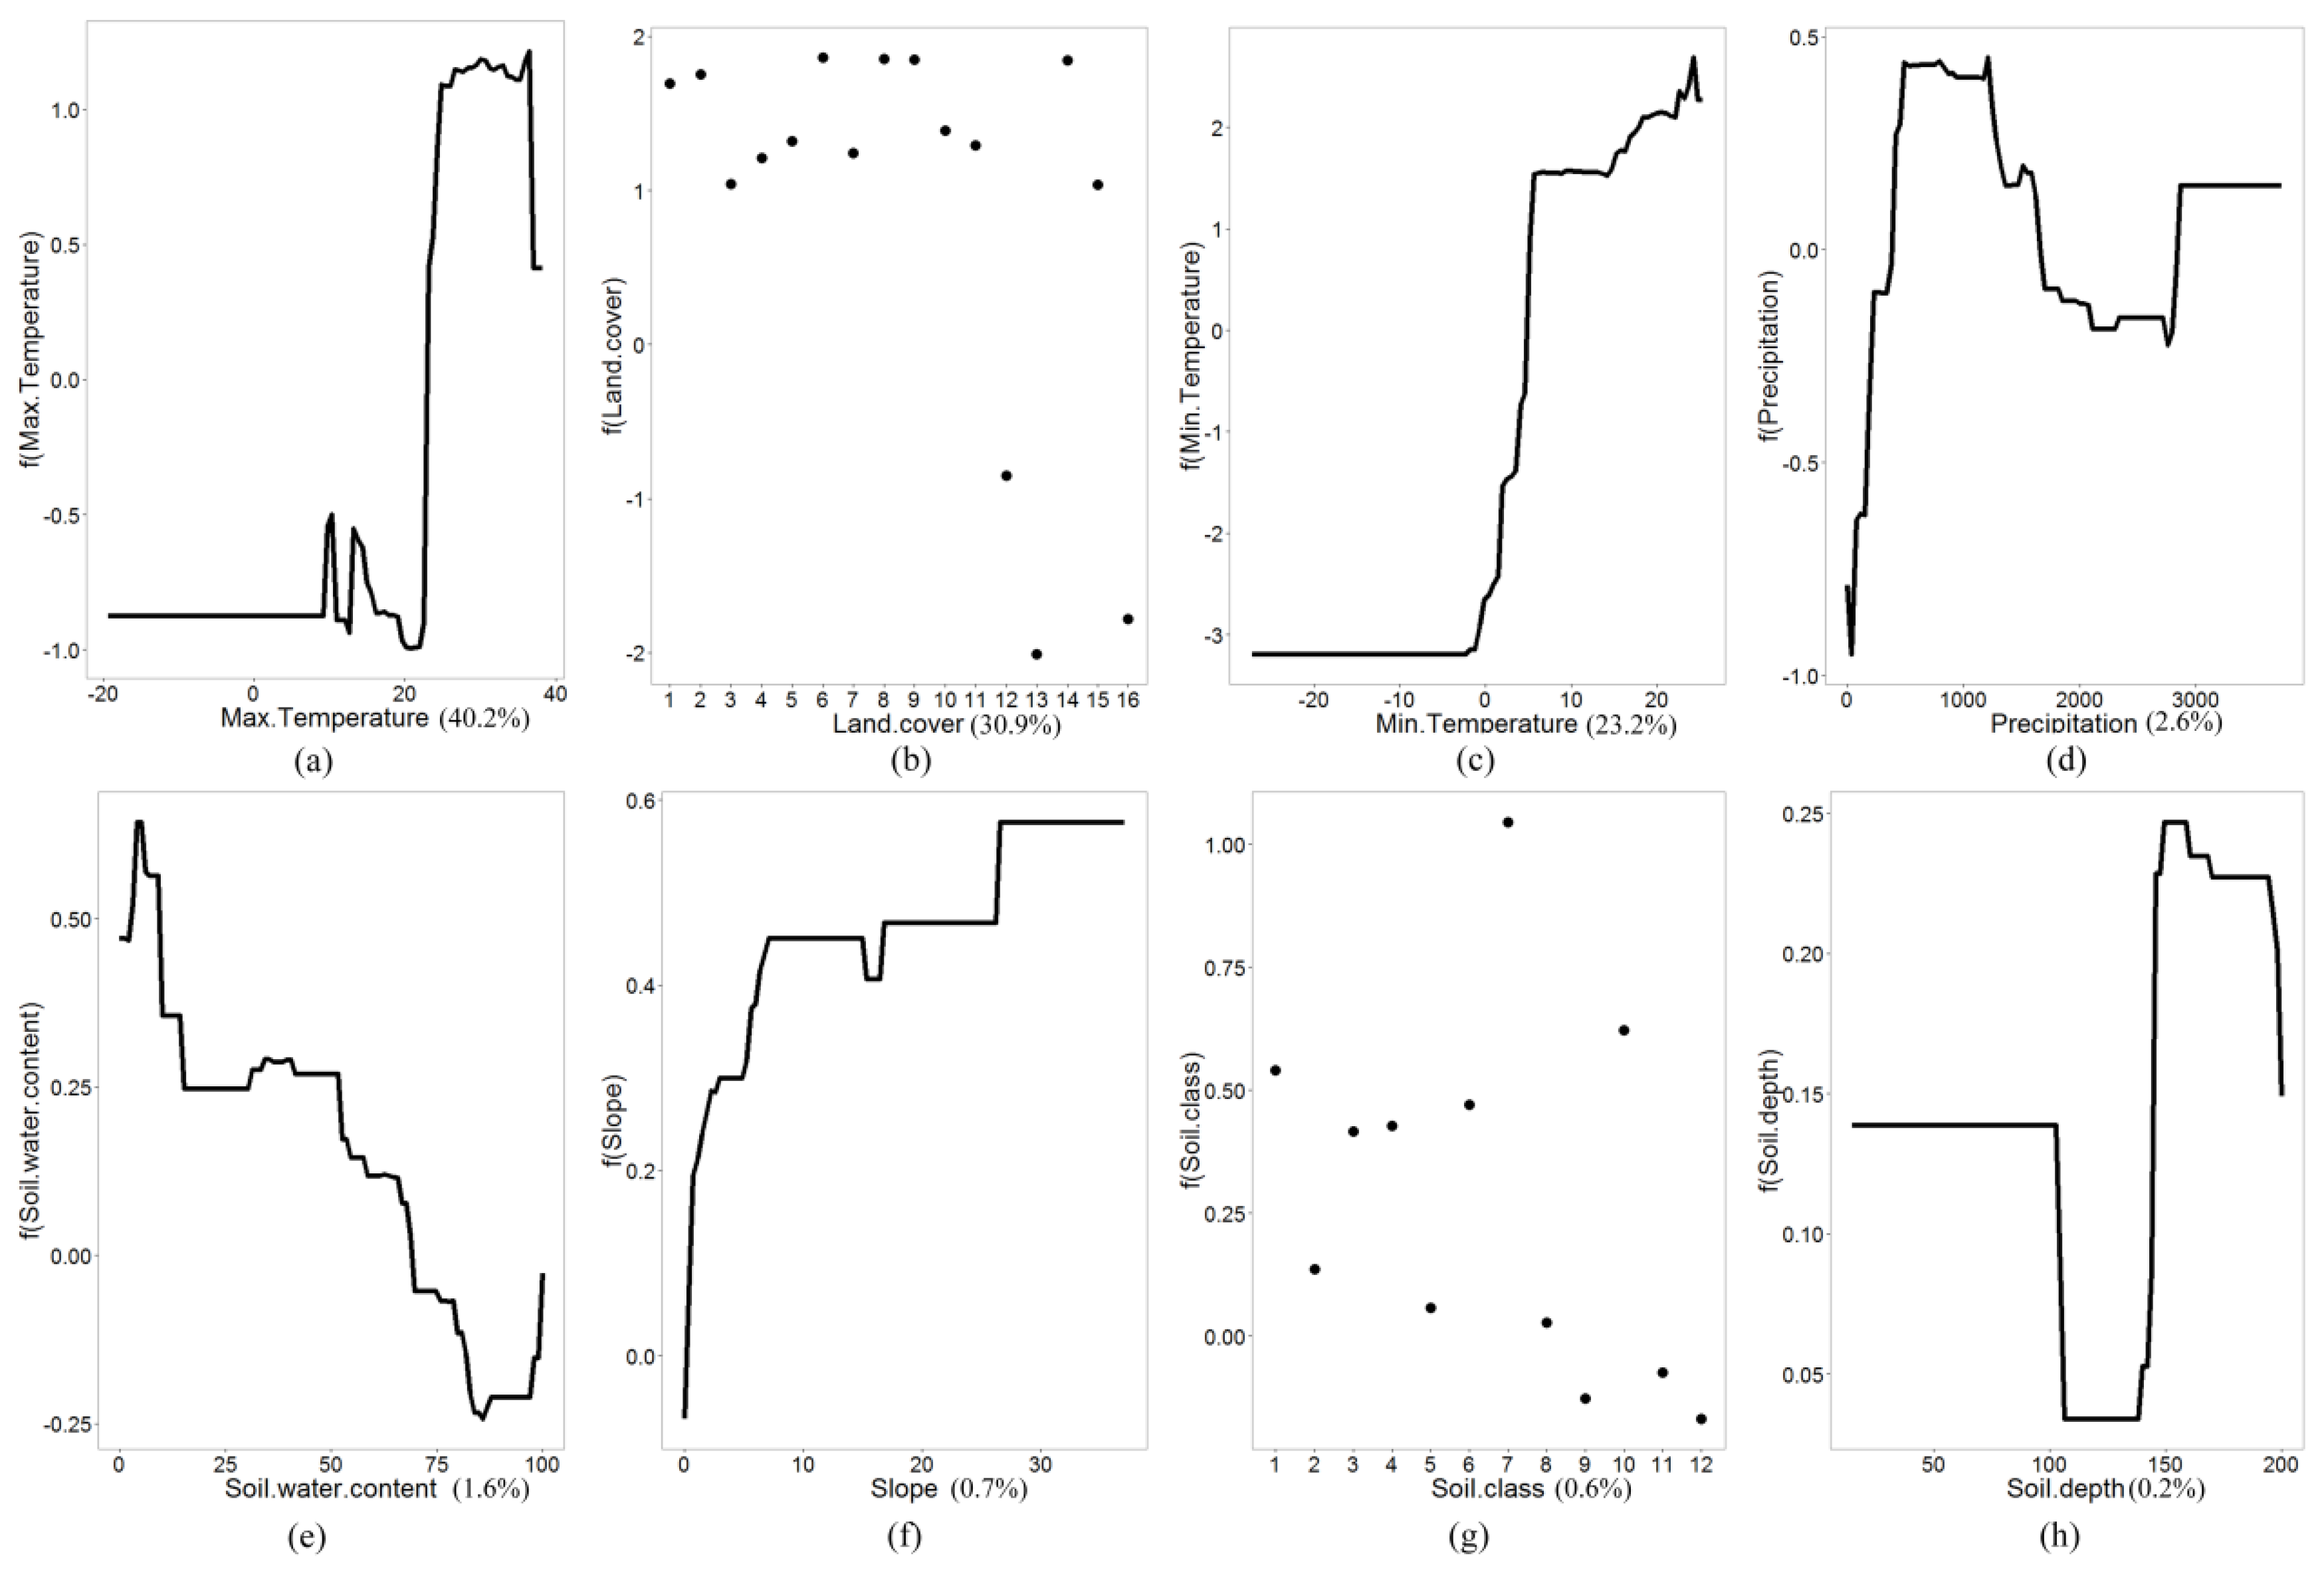
3.2. Relative Influence of Environmental Variables

Figure 4 shows that the most important environmental factor in the BRT model was maximum annual temperature, which contributed 40.2% to the predicted distribution of sweet sorghum. Environmental suitability for sweet sorghum was also influenced by land cover, which contributed 30.9%. The names of the land cover types are described in Table A1. These were followed by minimum annual temperature (23.2%), mean annual precipitation (2.6%), and soil water content (1.6%). Slope (0.7%), soil class (0.6%), and effective soil depth (0.2%) made very little contribution to the BRT model.

4. Discussion and Conclusions

By combining high-dimensional environmental and land-cover factors and a large volume of occurrence records, this study evaluated the global distribution of environmental suitability for sweet sorghum at a 5 × 5 km2 spatial resolution based on the BRT model. It is remarkable that all the data used in this research are available at no charge. This initial map serves as a baseline for understanding the potential marginal lands of sweet sorghum, which is important for forming strategies for developing biomass energy sources.
Previous studies have discussed the distribution of sweet sorghum. For example, sweet sorghum was thought to be mainly distributed in tropical and subtropical regions, which extend from Sierra Leone along the moist belt surrounding the coastal tropical forest to approximately 15 °S, the Mediterranean region, and the islands of Southeast Asia [41,42]. Based on survey data collected in 79 villages spanning the entire cereal growing zone from 1976 to 2003, the change in the diversity and geographical distribution of sweet sorghum were compared at different scales (country, region, and village) in Niger [43]. In Kenya, the ecological and geographical distribution of sweet sorghum was analyzed, and the results derived from the knowledge autecology of wild sweet sorghum and cluster analysis illustrated that crop–wild gene flows are frequently and predominantly found in sweet sorghum growing areas [44]. These studies were mainly based on the sample data, but they did not identify the potential patterns between the sample data and environmental factors. In this study, the relative contribution of different environmental factors was calculated and patterns between related environmental factors and the known occurrences of sweet sorghum were analyzed. For instance, maximum annual temperature and land cover were the main influential factors for evaluating the potential distribution of sweet sorghum, with contribution rates of 40.2% and 30.9%, respectively.
The multiple-criteria evaluation method adopted in previous studies relied mainly on the prior knowledge of experts. The determination of the threshold of the rule set was somewhat arbitrary, and the rationality of the threshold could not be verified, which made the multiple-criteria evaluation method less suitable for global-scale research. The BRT model, which has been used for evaluating the potential distribution of several species (i.e., cassava and fruit bat), can effectively solve the problem [45,46]. In the present study, the BRT model had good predictive performance for both training and test data sets, with AUC values of 0.984 and 0.978, respectively. Therefore, this data-driven method is more reasonable for the assessment of marginal lands when compared with the multiple-criteria evaluation method used in previous works.
The estimated map derived from the BRT model illustrates that global marginal land resources suitable for sweet sorghum are abundant, with 4802.21 million hectares. In terms of potential marginal land resources, Africa (1549.32 million hectares) was found to be the most suitable region for the development of sweet-sorghum-based ethanol fuels, especially in sub-Saharan countries. South America (1226.08 million hectares) was second, followed by Asia (822.75 million hectares), Oceania (623.95 million hectares), North America (459.09 million hectares), and Europe (121.02 million hectares). Note that the development of sweet-sorghum-based ethanol fuels is a complex system, and subsequent research will be further analyzed from the perspectives of economy and technology. Moreover, the potential reduction in emissions and the potential energy savings should be considered in order to analyze the value of the development of fuel ethanol in the areas suitable for sweet sorghum using a biophysical, biogeochemical model in future work.

Author Contributions

F.D. and D.J. contributed to all aspects of this work; F.D. wrote the main manuscript text; T.M. J.F., M.H., Q.W., and S.C. gave some useful comments and suggestions regarding this work. All authors reviewed the manuscript.

Funding

This research was funded by the Ministry of Science and Technology of China, grant numbers 2016YFC0401301 and 2016YFC1201300, and the National Natural Science Foundation of China, grant number 41571509.

Acknowledgments

We thank Qiaoling Zhu for providing valuable suggestions.

Conflicts of Interest

The authors declare no conflict of interest.

Appendix A

Table A1. The names of the land cover types.
ValueLabel
1Evergreen needleleaf forest
2Evergreen broadleaf forest
3Deciduous needleleaf forest
4Deciduous broadleaf forest
5Mixed forests
6Closed shrublands
7Open shrublands
8Woody savannas
9Savannas
10Grasslands
11Permanent wetlands
12Croplands
13Urban and built-up
14Cropland/Natural vegetation
15Permanent snow and ice
16Barren or sparsely vegetated

References

  1. Heede, R. Tracing anthropogenic carbon dioxide and methane emissions to fossil fuel and cement producers, 1854–2010. Clim. Chang. 2014, 122, 229–241. [Google Scholar] [CrossRef]
  2. Rogelj, J.; Elzen, M.D.; Höhne, N.; Fransen, T.; Fekete, H.; Winkler, H.; Schaeffer, R.; Fu, S.; Riahi, K.; Meinshausen, M. Paris Agreement climate proposals need a boost to keep warming well below 2 °C. Nature 2016, 534, 631–639. [Google Scholar] [CrossRef] [Green Version]
  3. Elzen, M.D.; Admiraal, A.; Roelfsema, M.; Soest, H.V.; Hof, A.F.; Forsell, N. Contribution of the G20 economies to the global impact of the Paris agreement climate proposals. Clim. Chang. 2016, 137, 1–11. [Google Scholar] [CrossRef]
  4. Zhou, G.; Chung, W.; Zhang, Y. Carbon dioxide emissions and energy efficiency analysis of China’s regional thermal electricity generation. J. Clean. Prod. 2014, 83, 173–184. [Google Scholar] [CrossRef]
  5. Midilli, A.; Dincer, I. Hydrogen as a renewable and sustainable solution in reducing global fossil fuel consumption. Int. J. Hydrog. Energy 2008, 33, 4209–4222. [Google Scholar] [CrossRef]
  6. Gelfand, I.; Sahajpal, R.; Zhang, X.; Izaurralde, R.C.; Gross, K.L.; Robertson, G.P. Sustainable bioenergy production from marginal lands in the US Midwest. Nature 2013, 493, 514–517. [Google Scholar] [CrossRef]
  7. Parliamentcouncil, E.; Fytroumoschopoulou, A. Directive 2009/28/EC of the European Parliament and of the Council of 23 April 2009 on the Promotion of the Use of Energy from Renewable Sources and Amending and Subsequently Repealing Directives 2001/77/EC and 2003/30/EC. Off. J. Eur. Union 2009, 5, 2009. [Google Scholar]
  8. Yuan, J.S.; Tiller, K.H.; Al-Ahmad, H.; Stewart, N.R.; Stewart, C.N. Plants to power: Bioenergy to fuel the future. Trends Plant Sci. 2008, 13, 421–429. [Google Scholar] [CrossRef] [PubMed]
  9. Tilman, D.; Hill, J.; Lehman, C. Carbon-Negative Biofuels from Low-Input High-Diversity Grassland Biomass. Science 2006, 314, 1598. [Google Scholar] [CrossRef] [PubMed]
  10. McIlveen-Wright, D.R.; Huang, Y.; Rezvani, S.; Mondol, J.D.; Redpath, D.; Anderson, M.; Hewitt, N.J.; Williams, B.C. A Techno-economic assessment of the reduction of carbon dioxide emissions through the use of biomass co-combustion. Fuel 2011, 90, 11–18. [Google Scholar] [CrossRef]
  11. Oliveira, M.E.D.D.; Vaughan, B.E.; Edward, J.R. Ethanol as Fuel: Energy, Carbon Dioxide Balances, and Ecological Footprint. BioScience 2005, 55, 593–602. [Google Scholar] [CrossRef]
  12. Ren, L.T.; Cafferty, K.; Roni, M.; Jacobson, J.; Xie, G.H.; Ovard, L.; Wright, C. Analyzing and comparing biomass feedstock supply systems in China: Corn stover and sweet sorghum case studies. Energies 2015, 8, 5577–5597. [Google Scholar] [CrossRef]
  13. Bowers, J.E.; Bruggmann, R.; Dubchak, I.; Grimwood, J.; Gundlach, H.; Haberer, G.; Hellsten, U.; Mitros, T.; Poliakov, A.; Schmutz, J. The Sorghum bicolor genome and the diversification of grasses. Nature 2009, 457, 551–556. [Google Scholar] [Green Version]
  14. Briand, C.H.; Geleta, S.B.; Kratochvil, R.J. Sweet sorghum (Sorghum bicolor [L.] Moench) a potential biofuel feedstock: Analysis of cultivar performance in the Mid-Atlantic. Renew. Energy 2018, 129, 328–333. [Google Scholar] [CrossRef]
  15. Zegada-Lizarazu, W.; Monti, A. Are we ready to cultivate sweet sorghum as a bioenergy feedstock? A review on field management practices. Biomass Bioenergy 2012, 40, 1–12. [Google Scholar] [CrossRef]
  16. Agostini, A.; Battini, F.; Giuntoli, J.; Tabaglio, V.; Padella, M.; Baxter, D.; Marelli, L.; Amaducci, S. Environmentally sustainable biogas? The key role of manure co-digestion with energy crops. Energies 2015, 8, 5234–5265. [Google Scholar] [CrossRef]
  17. Zhuang, D.; Jiang, D.; Liu, L.; Huang, Y. Assessment of bioenergy potential on marginal land in China. Renew. Sustain. Energy Rev. 2011, 15, 1050–1056. [Google Scholar] [CrossRef]
  18. Hao, M.; Jiang, D.; Wang, J.; Fu, J.; Huang, Y. Could biofuel development stress China’s water resources? Glob. Chang. Biol. Bioenergy 2017, 9, 1447–1460. [Google Scholar] [CrossRef]
  19. Fu, J.; Jiang, D.; Huang, Y.; Zhuang, D.; Ji, W. Evaluating the marginal land resources suitable for developing bioenergy in Asia. Adv. Meteorol. 2014, 2014, 238945. [Google Scholar] [CrossRef]
  20. Tuck, G.; Glendining, M.J.; Smith, P.; House, J.I.; Wattenbach, M. The potential distribution of bioenergy crops in Europe under present and future climate. Biomass Bioenergy 2006, 30, 183–197. [Google Scholar] [CrossRef]
  21. Bhatt, S.; Gething, P.W.; Brady, O.J.; Messina, J.P.; Farlow, A.W.; Moyes, C.L.; Drake, J.M.; Brownstein, J.S.; Hoen, A.G.; Sankoh, O. The global distribution and burden of dengue. Nature 2013, 496, 504–507. [Google Scholar] [CrossRef] [Green Version]
  22. Pigott, D.M.; Golding, N.; Mylne, A.; Huang, Z.; Weiss, D.J.; Brady, O.J.; Kraemer, M.U.G.; Hay, S.I. Mapping the zoonotic niche of Marburg virus disease in Africa. Elife 2014, 3, e04395. [Google Scholar] [CrossRef]
  23. Liu, L.; Zhuang, D.; Jiang, D.; Fu, J. Assessment of the biomass energy potentials and environmental benefits of Jatropha curcas L. in Southwest China. Biomass Bioenergy 2013, 56, 342–350. [Google Scholar] [CrossRef]
  24. Lu, L.; Jiang, D.; Zhuang, D.; Huang, Y. Evaluating the Marginal Land Resources Suitable for Developing Pistacia chinensis-Based Biodiesel in China. Energies 2012, 5, 2165–2177. [Google Scholar] [CrossRef] [Green Version]
  25. Jiang, D.; Hao, M.; Fu, J.; Zhuang, D.; Huang, Y. Spatial-temporal variation of marginal land suitable for energy plants from 1990 to 2010 in China. Sci. Rep. 2014, 4, 5816. [Google Scholar] [CrossRef]
  26. Hijmans, R.J.; Cameron, S.E.; Parra, J.L.; Jones, P.G.; Jarvis, A. Very high resolution interpolated climate surfaces for global land areas. Int. J. Clim. 2005, 25, 1965–1978. [Google Scholar] [CrossRef] [Green Version]
  27. Xie, Y.; Wang, X., Jr.; Silander, J.A. Deciduous forest responses to temperature, precipitation, and drought imply complex climate change impacts. Proc. Natl. Acad. Sci. USA 2015, 112, 13585. [Google Scholar] [CrossRef]
  28. Kardol, P.; Campany, C.E.; Souza, L.; Norby, R.J.; Weltzin, J.F.; Classen, A.T. Climate change effects on plant biomass alter dominance patterns and community evenness in an experimental old-field ecosystem. Glob. Chang. Biol. 2010, 16, 2676–2687. [Google Scholar] [CrossRef]
  29. Jain, M.; Chourey, P.S. Effects of season-long high temperature growth conditions on sugar-to-starch metabolism in developing microspores of grain sorghum (Sorghum bicolor L. Moench). Planta 2007, 227, 67–79. [Google Scholar] [CrossRef] [PubMed]
  30. Wardlaw, I.F.; Bagnall, D. Phloem Transport and the Regulation of Growth of Sorghum bicolor (Moench) at Low Temperature. Plant Physiol. 1981, 68, 411–414. [Google Scholar] [CrossRef] [Green Version]
  31. Wu, W.G.; Huang, J.K.; Deng, X.Z. Potential land for plantation of Jatropha curcas as feedstocks for biodiesel in China. Sci. China 2010, 53, 120–127. [Google Scholar] [CrossRef]
  32. Jones, D.L.; Rousk, J.; Edwardsjones, G.; Deluca, T.H.; Murphy, D.V. Biochar-mediated changes in soil quality and plant growth in a three year field trial. Soil Biol. Biochem. 2012, 45, 113–124. [Google Scholar] [CrossRef]
  33. Ferchaud, F.; Vitte, G.; Bornet, F.; Strullu, L.; Mary, B. Soil water uptake and root distribution of different perennial and annual bioenergy crops. Plant Soil 2015, 388, 307–322. [Google Scholar] [CrossRef]
  34. Strahler, A.; Moody, A.; Lambin, E.; Huete, A.; Justice, C.; Muller, J.; Running, S.; Salomonson, V.; Vanderbilt, V.; Wan, Z. MODIS Land Cover Product: Algorithm Theoretical Basis Document; Boston University: Boston, MA, USA, 1994. [Google Scholar]
  35. Phillips, S.J.; Dudík, M.; Elith, J.; Graham, C.H.; Lehmann, A.; Leathwick, J.; Ferrier, S. Sample selection bias and presence-only distribution models: Implications for background and pseudo-absence data. Ecol Appl. 2009, 19, 181–197. [Google Scholar] [CrossRef]
  36. Bradley, A.P. The use of the area under the ROC curve in the evaluation of machine learning algorithms. Pattern Recognit. 1997, 30, 1145–1159. [Google Scholar] [CrossRef] [Green Version]
  37. Messina, J.P.; Kraemer, M.U.; Brady, O.J.; Pigott, D.M.; Shearer, F.M.; Weiss, D.J.; Golding, N.; Ruktanonchai, C.W.; Gething, P.W.; Cohn, E.; et al. Mapping global environmental suitability for Zika virus. Elife 2016, 5, e15272. [Google Scholar] [CrossRef]
  38. Friedman, J.H. Greedy Function Approximation: A Gradient Boosting Machine. Ann. Stat. 2001, 29, 1189–1232. [Google Scholar] [CrossRef]
  39. Ridgeway, G. gbm: Generalized boosted regression models. R Package Vers. 2006, 1, 55. [Google Scholar]
  40. De’Ath, G. Boosted trees for ecological modeling and prediction. Ecology 2007, 88, 243–251. [Google Scholar] [CrossRef]
  41. Dahlberg, J.; Berenji, J.; Sikora, V.; Latkovic, D. Assessing sorghum [Sorghum bicolor (L) Moench] germplasm for new traits: Food, fuels & unique uses. Maydica 2011, 56. [Google Scholar]
  42. Wet, J.M.J.D.; Huckabay, J.P. The Origin of Sorghum bicolor. II. Distribution and Domestication. Evolution 1967, 21, 787–802. [Google Scholar] [CrossRef] [PubMed]
  43. Bezançon, G.; Pham, J.-L.; Deu, M.; Vigouroux, Y.; Sagnard, F.; Mariac, C.; Kapran, I.; Mamadou, A.; Gérard, B.; Ndjeunga, J.; et al. Changes in the diversity and geographic distribution of cultivated millet (Pennisetum glaucum (L.) R. Br.) and sorghum (Sorghum bicolor (L.) Moench) varieties in Niger between 1976 and 2003. Genet. Resour. Crop Evol. 2009, 56, 223–236. [Google Scholar]
  44. Mutegi, E.; Sagnard, F.; Muraya, M.; Kanyenji, B.; Rono, B.; Mwongera, C.; Marangu, C.; Kamau, J.; Parzies, H.; de Villiers, S.; et al. Ecogeographical distribution of wild, weedy and cultivated Sorghum bicolor (L.) Moench in Kenya: Implications for conservation and crop-to-wild gene flow. Genet. Resour. Crop Evol. 2010, 57, 243–253. [Google Scholar] [CrossRef]
  45. Jiang, D.; Wang, Q.; Ding, F.; Fu, J.; Hao, M. Potential marginal land resources of cassava worldwide: A data-driven analysis. Renew. Sustain. Energy Rev. 2019, 104, 167–173. [Google Scholar] [CrossRef]
  46. Pigott, D.; Golding, N.; Mylne, A.; Huang, Z.; Henry, A.; Weiss, D.; Brady, O.; Kraemer, M.; Smith, D.; Moyes, C. Mapping the zoonotic niche of Ebola virus disease in Africa. eLife 2016, 5, e04395. [Google Scholar] [CrossRef] [PubMed]
Figure 1. A flow chart.
Energies 12 01928 g001
Figure 2. The global map of the predicted potential distribution of sweet sorghum. The map depicts environmental suitability for sweet sorghum from 0 (brown) to 1 (bluish green). ROC: receiver operating characteristic; AUC: area under the ROC curve.
Energies 12 01928 g002
Figure 3. Spatial distribution of the validation samples with 1513 occurrence units: (a) North America; (b) Asia; (c) South America; (d) Africa and Europe; (e) Oceania.
Energies 12 01928 g003
Figure 4. Relative contribution of environmental factors predicting the global distribution of sweet sorghum: (a) annual maximum temperature; (b) land cover; (c) annual minimum temperature; (d) mean annual precipitation; (e) soil water content; (f) slope; (g) soil class; (h) effective soil depth.
Energies 12 01928 g004
Table 1. The land cover and environmental variables.
FactorsParametersFormatData Sources
ClimateMinimum TemperatureGrid (1 × 1 km2)WorldClim database, version 2.0
Maximum TemperatureGrid (1 × 1 km2)
Mean annual precipitationGrid (1 × 1 km2)
SoilEffective Soil DepthGrid (0.25 × 0.25 km2)World Soil Information
Soil ClassGrid (1 × 1 km2)
Soil Water ContentGrid (1 × 1 km2)Consortium for Spatial Information
TopographicalSlopeGrid (90 × 90 m2)The NASA Shuttle Radar Topographic Mission
Land useLand CoverGrid (5 × 5 km2)NASA’s Earth Observatory Group
Table 2. Marginal lands suitable for sweet sorghum within each major world region and the top ten countries.
Region/CountryArea (Million Hectares)
North America459.09
United States260.29
Mexico144.75
South America1226.08
Brazil676.86
Argentina131.64
Asia822.75
China159.61
The Republic of Indonesia139.14
Europe121.02
Africa1549.32
The Republic of Congo188.64
The Republic of Angola101.46
The Republic of South Africa100.07
Oceania623.95
Australia602.94
World4802.21

