Article

Influence of Sampling Delay on the Estimation of Lithium-Ion Battery Parameters and an Optimized Estimation Method

State Key Laboratory of Precision Measurement Technology and Instruments, Department of Precision Instrument, Tsinghua University, Beijing 100084, China
*
Author to whom correspondence should be addressed.
Energies 2019, 12(10), 1878; https://doi.org/10.3390/en12101878
Submission received: 26 April 2019 / Accepted: 13 May 2019 / Published: 16 May 2019

Abstract

:
The equivalent-circuit model (ECM) is widely used in online estimating the parameters and states of lithium-ion batteries. However, the sampling delay between the voltage and current of a battery is generally overlooked, which is unavoidable in a modular battery management system (BMS) and would lead to wrong results in the estimation of battery parameters and states. In this paper, with the first-order resistor–capacitor (RC) model as our battery model, we analyze the influence mechanism of sampling delay and then propose an optimized method for online estimating battery parameters. The mathematical model derived from the first-order RC model and the approximation method of first-order derivative are optimized. The recursive least squares (RLS) algorithm is used for identifying the parameters of the model. In order to verify the proposed method, a modular battery test system with high sampling frequency and high synchronization accuracy is developed. The experiment results indicate that the sampling delay would cause the estimation process to fluctuate, and the optimized method effectively improves the tolerance range of sampling delay.

1. Introduction

With the global problems of fossil energy exhaustion and air pollution becoming more and more serious, the automobile industry, as the major oil consumer and air pollution source, is facing a significant change. Developing new energy vehicles to replace traditional fossil-fueled vehicles has become the consensus of developed countries in the world. The electric vehicle (EV) has gained a lot of attention and has developed promptly in recent years. Lithium-ion batteries have been widely used as the power batteries of EVs due to their high energy density, high power density and long life [1]. Nevertheless, lithium-ion batteries have strict requirements for operating voltage and temperature. The states of batteries, such as state of charge (SOC) [2] and state of health (SOH) [3], are also important for EVs. In order to provide a safe and reliable operation environment, as well as to estimate the battery states online, a battery management system (BMS) is usually employed.
As the parameters of lithium-ion batteries, the internal resistance and open-circuit voltage (OCV) play important roles in estimating battery states. The OCV refers to the stable electrode potential difference of a battery at the condition of open circuit, which monotonically depends upon the Li amount of the positive and negative electrodes [2,4]. Furthermore, this relationship is weakly dependent on the changes in cycle life and environment temperature [5]. Hence, OCV-based SOC estimation can achieve high accuracy. The increase of internal resistance is an important sign of battery aging, which is caused by the structural changes in battery electrodes and the thickness increase of solid electrolyte interphase (SEI) [1]. Therefore, the internal resistance is widely used in SOH estimation [3,6]. Nonetheless, in online applications, the direct measurements of OCV and internal resistance are difficult.
In order to online estimate OCV and internal resistance, an appropriate battery model is needed. The commonly used battery models can be divided into three types, including the electrochemical model [7,8], the machine-learning-based model [9,10] and the equivalent-circuit model (ECM) [11,12]. The electrochemical models can simulate the inner chemical and physical process of a battery and the model accuracy is relatively high, but they are generally complex and require too many inputs [13]. The machine-learning-based models are all black-box models, and the identification results of model parameters strongly depend on the training dataset [9]. Hence, online collecting and online training are required, which needs a lot of memory and computing resources [14]. The ECMs use ideal electric elements, such as voltage source, resistors and capacitors to simulate the external dynamic characteristics of a battery, without considering the chemical reactions inside the battery [11,15,16]. Therefore, in the online estimation of battery states, the ECMs are more suitable due to their fewer parameters and lower computational cost.
There are two technology roadmaps to estimate battery parameters with the ECMs. The essential difference between them is that OCV is regarded as a known variable or an unknown variable. The first method combines SOC estimation and battery parameters estimation and sees OCV as a known variable derided from SOC–OCV curves. Firstly, with a predetermined SOC, the OCV is achieved and the battery terminal voltage can be estimated by the ECMs. Then, by comparing the estimated terminal voltage and the measured one, the estimated SOC is updated [2]. In this method, optimal estimation algorithms, such as adaptive extended Kalman filter (AEKF) [17], sliding-mode observer (SMO) [18] and H-infinity observer [19], are usually required. The second method views OCV as an unknown model parameter to be identified. The OCV and internal resistance are directly estimated by the identification of ECM parameters [20,21,22]. In this method, the estimation process does not require SOC–OCV curves, and the conversion of mathematical models derived by the ECMs is important. In summary, the ECM-based online estimation of battery parameters is becoming more and more developed.
However, the problem of sampling delay between battery current and voltage is generally overlooked, limiting the application of the above ECM-based methods in commercial BMSs. In a modular BMS, the voltage and current of a cell are measured by a slave controller and an electric meter, respectively, which are usually connected together by the controller area network (CAN) [23]. Because of varying network latency, the collected data in the data logger is unsynchronized, which would lead to a wrong result in the online estimation of battery parameters and states [24]. Therefore, it is of great significance to analyze how the sampling delay affects the ECM-based estimation process and propose an optimized method to reduce the influence.
In this paper, the influence of sampling delay on the ECM-based online estimation of battery parameters are analyzed, and then an optimized online estimation method is proposed. In order to avoid the effect of inaccurate SOC–OCV curves, we select the technology roadmap that regards OCV as a model parameter to be identified. Firstly, with a trade-off between accuracy and complexity, the first-order resistor–capacitor (RC) model is selected as our battery model, and the simplified mathematical model of it is derived. Then, we theoretically analyze the influence of sampling delay on the parameters’ identification of the mathematical model. Secondly, to improve the tolerance of sampling delay, we propose an optimized mathematical model and an online estimation method for battery parameters based on the recursive least squares (RLS) algorithm. In the end, using commercial battery management chips, we develop a modular battery test system with high sampling frequency and high synchronization accuracy. The theoretical analysis results and the proposed estimation method are verified by processing the collected data.

2. Influence of Sampling Delay on Battery Parameter Estimation

In this section, a commonly used mathematical battery model derived from the first-order RC model is selected as our research object. The influence of sampling delay on the estimation of battery parameters based on this model is analyzed.

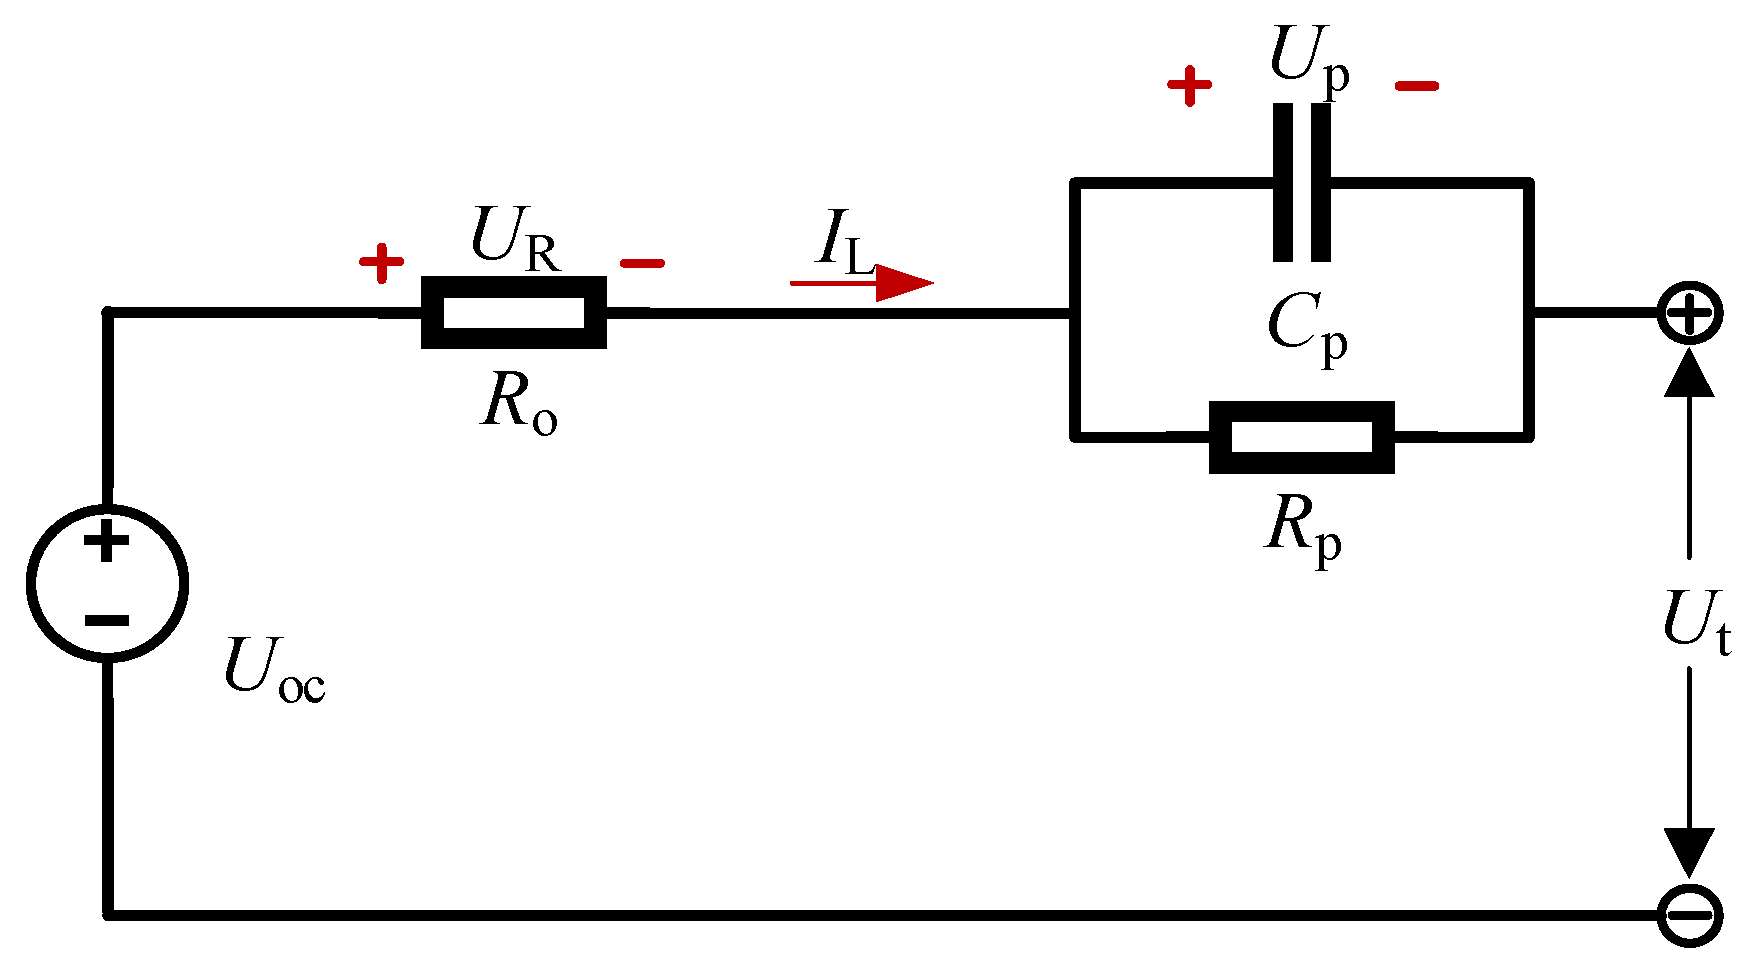
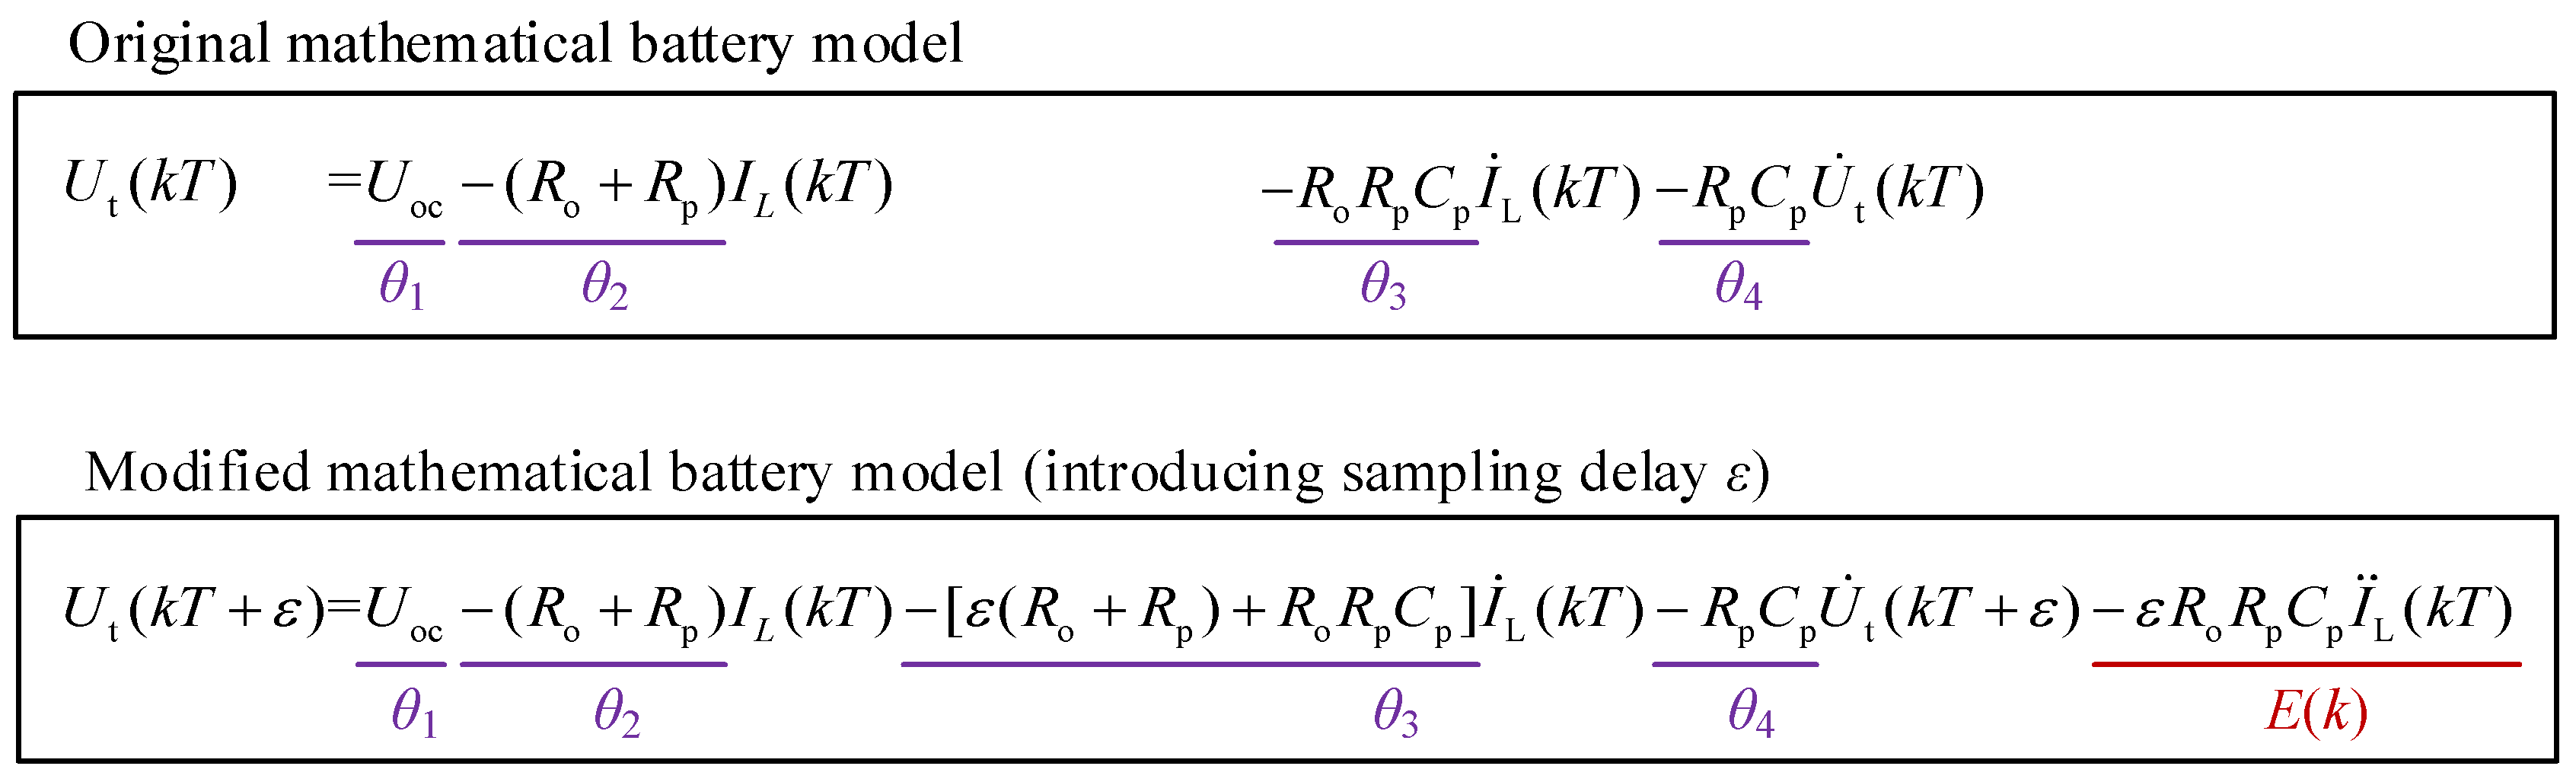
2.1. Mathematical Battery Model

The ECMs are the most commonly used battery models for the online estimation of battery parameters and states. Various ECMs have been presented in the literature, such as Rint model, Randles’ model, PNGV model and RC network models. The selection of the ECM requires a trade-off between accuracy and complexity. In recent years, some studies were carried out to compare these battery models. Hu et al. [25] compared twelve ECMs in terms of model complexity and model accuracy. The results indicate that the first-order RC model is most suitable for lithium nickel–manganese–cobalt oxide (LiNMC) batteries. Nejad et al. [12] conducted an analysis on ten ECMs with respect to the estimation accuracies of SOC and SOP. The results show that both first- and second-order RC models achieve an outstanding SOC estimation accuracy. Lai et al. [11] examined eleven ECMs, focusing on the robustness of these models. The results indicate that the first- and second-order RC models are the optimal choice for LiNMC batteries. Therefore, the first-order RC model is selected as the battery model in this paper.
The first-order RC model is also referred to as the Thevenin model. As shown in Figure 1, the model is composed of a controllable voltage source, an ohmic resistor and a parallel RC network. The voltage source Uoc and the ohmic resistor Ro represent the OCV and the internal resistance of a battery, respectively. The RC network is used to simulate the relaxation effect of the battery [15], and the elements Rp and Cp are described as equivalent polarization resistor and equivalent polarization capacitor, respectively. The IL and Ut are the load current and the terminal voltage of the battery, respectively, and are the only measurable variables in the model. Generally, IL is regarded as the input variable and Ut is regarded as the output variable. Through identifying the parameters Uoc and Ro of the model, the OCV and the internal resistance can be estimated.
Based on Kirchhoff’s law, the mathematical model of the first-order RC model can be derived:
{ U t = U oc I L R o U p U ˙ p = 1 R p C p U p + 1 C p I L
where Up is the terminal voltage across the RC network in Figure 1. In Equation (1), IL and Ut can be measured by sensors, and Uoc, Ro, Rp and Cp are unknown parameters needed to be identified. However, Up in Equation (1) is neither a measurable variable nor an estimated parameter. Transforming Equation (1) is necessary. In general, Uoc is derived by SOC through OCV–SOC curves and is regarded as a known parameter. Then, the transfer function of the subsystem composed of Ro and the RC network can be derived. Using a bilinear transform, the discrete transfer function of the subsystem can be obtained. This method couples model parameters and SOC and is widely used in the combined estimation of battery parameters and states [15,16,26]. The estimation accuracy highly depends on the accuracy of the OCV–SOC curves and the battery parameters cannot be estimated independently.
In order to independently estimate the internal resistance and OCV of a lithium-ion battery with Equation (1), the removal of Up from Equation (1) is necessary. The derivation of Ut in Equation (1) is as follows:
U ˙ t = U ˙ oc I ˙ L R o I L R ˙ o U ˙ p
The OCV and internal resistance of a lithium-ion battery mainly depend on SOC, operating temperature T, and usage history h, and they can be expressed as a function of SOC, T and h. In a BMS, the following assumptions are reasonable [22]: (1) Compared with the totally useable capacity, the consumed or regained energy of the battery in a short period is small. Hence, SOC changes slowly, i.e., ∂SOC/∂t ≈ 0. (2) With the cooling and heating systems of the BMS, the operation temperature of the battery is controlled at a predetermined level and changes slowly, i.e., ∂T/∂t ≈ 0. (3) The usage history h represents a long-term usage history, i.e., ∂h/∂t ≈ 0. As a result, it is also reasonable to assume that the OCV and internal resistance are constant during a short period:
U ˙ oc 0 , R ˙ o 0
Thereby, Equation (2) can be rewritten as:
U ˙ t = U ˙ p I ˙ L R o
With Equations (1) and (4), a simplified mathematical battery model can be obtained:
U t = U oc ( R o + R p ) I L R o R p C p I ˙ L R p C p U ˙ t
Equation (5) makes it possible to identify model parameters without SOC–OCV curves and has been used in many studies. For example, Chiang et al. [22] successfully estimated the internal resistance and OCV of lithium-ion batteries with this mathematical battery model. He et al. [21] identified the parameters of this model based on AEKF algorithm, and then estimated SOC with the estimated OCV. Feng et al. [20] used RLS algorithm to identify the model parameters and then estimated the state-of-power (SOP) of lithium-ion batteries. However, in an actual BMS, there are time delays between the sampling instants of Ut and IL [24]. The relevant research about the influence of sampling delay on the mathematical battery model shown by Equation (5) is lacking.

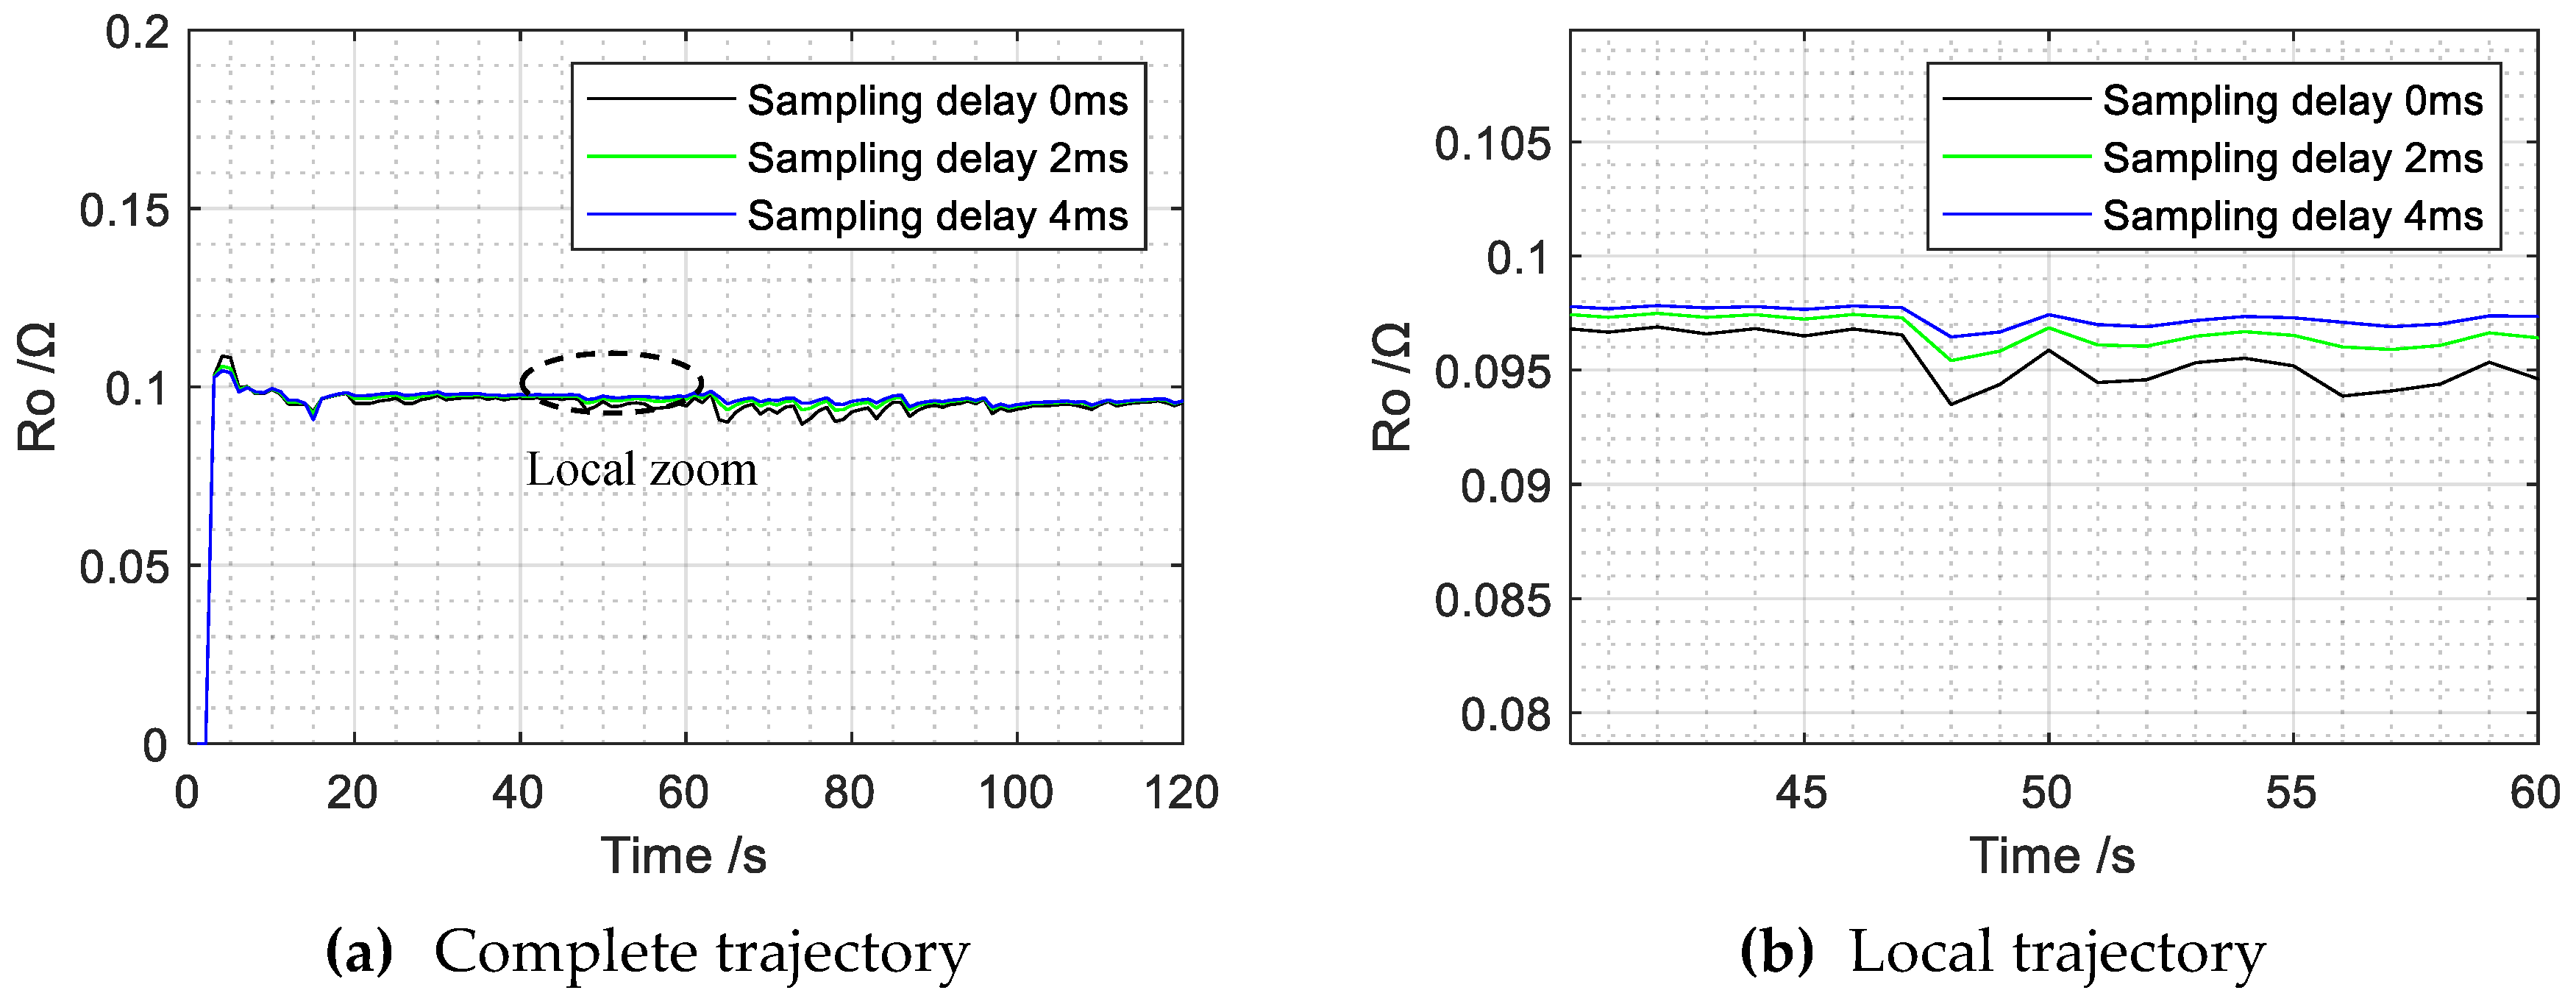
2.2. Influence of Sampling Delay

Generally, Ut and IL are assumed to be measured at time t = kT synchronously and periodically, where T is the sampling period. Accordingly, Equation (5) is converted to:
U t ( k T ) = U oc ( R o + R p ) I L ( k T ) R o R p C p I ˙ L ( k T ) R p C p U ˙ t ( k T )
where Uoc, Ro, Rp and Cp are regarded as unknown parameters. For the convenience of expression, Equation (6) is rewritten as:
z ( k ) = h ( k ) θ
where
z ( k ) = U t ( k T )
h ( k ) = [ 1 I L ( k T ) I ˙ L ( k T ) U ˙ t ( k T ) ]
θ = [ θ 1 θ 2 θ 3 θ 4 ] T = [ U oc ( R o + R p ) R o R p C p R p C p ] T
h(k) is the observation vector, in which IL(kT) is directly measured, dIL(kT)/dt and dUt(kT)/dt are usually approximated by [IL(kT) − IL(kTT)]/T and [Ut(kT) − Ut(kTT)]/T, respectively [20,22], θ is the parameter vector to be identified. With an identification algorithm, parameters in θ can be identified and then the model parameters including Uoc and Ro can be obtained by the following equation:
{ U oc = θ 1 R o = θ 3 θ 4 R p = θ 2 θ 3 θ 4 C p = θ 4 2 θ 2 θ 4 + θ 3
However, the assumption that Ut and IL are sampled synchronously may be unreasonable in some cases. In a modular BMS, the terminal voltage and current of a battery are measured by two CAN nodes, respectively. Assume that there is a time delay ε between the sampling instants of terminal voltage and current, which are sampled at kT + ε and kT, respectively. The actual measured Ut and IL are Ut(kT + ε) and IL(kT), respectively. It is necessary to obtain the mathematical model to describe the relationship between Ut(kT + ε) and IL(kT). Firstly, according to Equation (5), the mathematical relationship between Ut(kT + ε) and IL(kT + ε) is:
U t ( k T + ε ) = U oc ( R o + R p ) I L ( k T + ε ) R o R p C p I ˙ L ( k T + ε ) R p C p U ˙ t ( k T + ε )
Then, assuming that the sampling delay ε is small, IL(kT + ε) and dIL(kT + ε)/dt can be divided into:
{ I L ( k T + ε ) I L ( k T ) + I ˙ L ( k T ) ε I ˙ L ( k T + ε ) I ˙ L ( k T ) + I ¨ L ( k T ) ε
Finally, with Equations (13) and (12), the mathematical model of the actual measured data Ut(kT + ε) and IL(kT) can be obtained:
U t ( k T + ε ) = U oc ( R o + R p ) I L ( k T ) [ ε ( R o + R p ) + R o R p C p ] I ˙ L ( k T ) R p C p U ˙ t ( k T + ε ) + E ( k )
where
E ( k ) = ε R o R p C p I ¨ L ( k T )
In order to clearly express the influence of sampling delay, Equations (6) and (14), named as the original model and the modified model, are drawn in Figure 2. The meanings of the parameters θ1 to θ4 are also signed. Firstly, because of the sampling delay ε, the modified model contains a new term E(k), which can be considered as an error term of the original model. The E(k) includes the second order derivation of IL. This means that when the load current IL changes acutely, the E(k) error term will become large and the identification process of model parameters will be disturbed. Secondly, the sampling delay ε also changes the actual meaning of θ3. Even if IL changes slowly, there are errors in some identified model parameters, including Ro, Rp., and Cp. In summary, the influence of sampling delay on the identification of model parameters based on Equation (6) mainly includes two parts: (1) When load current IL changes drastically, the identification results will fluctuate. (2) Even though IL changes slowly, the identification accuracy of Ro, Rp, and Cp is still influenced by the sampling delay.

3. Optimized Estimation Method for Battery Parameter

In order to reduce the influence of sampling delay, an optimized estimation method for battery parameters is proposed in this section.
Firstly, Equation (14), which takes sampling delay ε into account, is selected as the mathematical battery model instead of Equation (6). For the convenience of expression, Equation (14) is rewritten as:
z opt ( k ) = h opt ( k ) θ opt
where
z opt ( k ) = U t ( k T + ε )
h opt ( k ) = [ 1 I L ( k T ) I ˙ L ( k T ) U ˙ t ( k T + ε ) I ¨ L ( k T ) ]
θ opt = [ θ opt , 1 θ opt , 2 θ opt , 3 θ opt , 4 θ opt , 5 ] T = [ U oc ( R o + R p ) ε ( R o + R p ) R o R p C p R p C p ε R o R p C p ] T
The hopt(k) and θopt are the observation vector and the parameter vector, respectively. Assuming that ε is small, −ε(Ro + Rp) in θopt,4 is close to zero. Then, the model parameters can be obtained with the identified θopt:
{ U oc = θ opt , 1 R o = θ opt , 3 θ opt , 4 R p = θ opt , 2 θ opt , 3 θ opt , 4 C p = θ opt , 4 2 θ opt , 2 θ opt , 4 + θ opt , 3
Secondly, the approximations of dIL(kT)/dt and dUt(kT + ε)/dt in hopt(k) are also optimized. Instead of using the first-order backward difference, the first-order central difference is adopted to improve the approximation accuracy:
I ˙ L ( k T ) I L ( k T + T ) I L ( k T T ) 2 T
U ˙ t ( k T + ε ) U t ( k T + ε + T ) U t ( k T + ε T ) 2 T
The approximation of d2IL(kT)/dt2 in hopt(k) uses the second-order central difference:
I ¨ L ( k T ) I L ( k T + T ) 2 I L ( k T ) + I L ( k T T ) T 2
The disadvantage of this method is that the measured data IL(kT + T) and Ut(kT + ε + T) is required, which would lead to a sampling period delay in the online identification results.
The RLS algorithm with an optimal forgetting factor is used for identifying the parameter vector θopt in Equation (16) as well as θ in Equation (7). The RLS algorithm can meet the requirement of online identification, but data saturation phenomenon will emerge with the data length increasing. In order to increase the weight of recent data and decrease the weight of old data, a forgetting factor λ is employed, which makes it possible to estimate and track time varying parameters [26,27].
The RLS algorithm with an optimal forgetting factor is implemented as follows. Assume that there is a single-input single-output (SISO) system:
z ( k ) = h ( k ) θ + v ( k )
where z(k) is the measured value of the output. The h(k) and θ are the observation vector and the parameter vector, respectively. The v(k) is a stochastic noise variable. The identification of θ is realized as follows:
{ e m = z ( m ) h ( m ) θ ^ m 1 K m = P m 1 h T ( m ) [ λ + h ( m ) P m 1 h T ( m ) ] 1 P m = 1 λ [ I K m h ( m ) ] P m 1 θ ^ m = θ ^ m 1 + K m e m
where θ ^ m is the m-th estimation result of θ, em is the prediction error of the measured value z(m), and λ is the forgetting factor. The Km and Pm are the algorithm gain and the covariance matrix, respectively. The parameters including P0, θ ^ 0 and λ need to be set initially. After each sampling event, the estimation results of θ can be updated according to Equation (25).

4. Data Set of Lithium-Ion Battery for Verification

In this section, a battery test system based on commercial battery management chips is developed to simulate the practical measuring condition in a BMS. With the system, lithium-ion batteries are tested with a special discharge curve, which combines pulse discharge and dynamic discharge. The acquired data set will be used for the verification of the optimized estimation method.

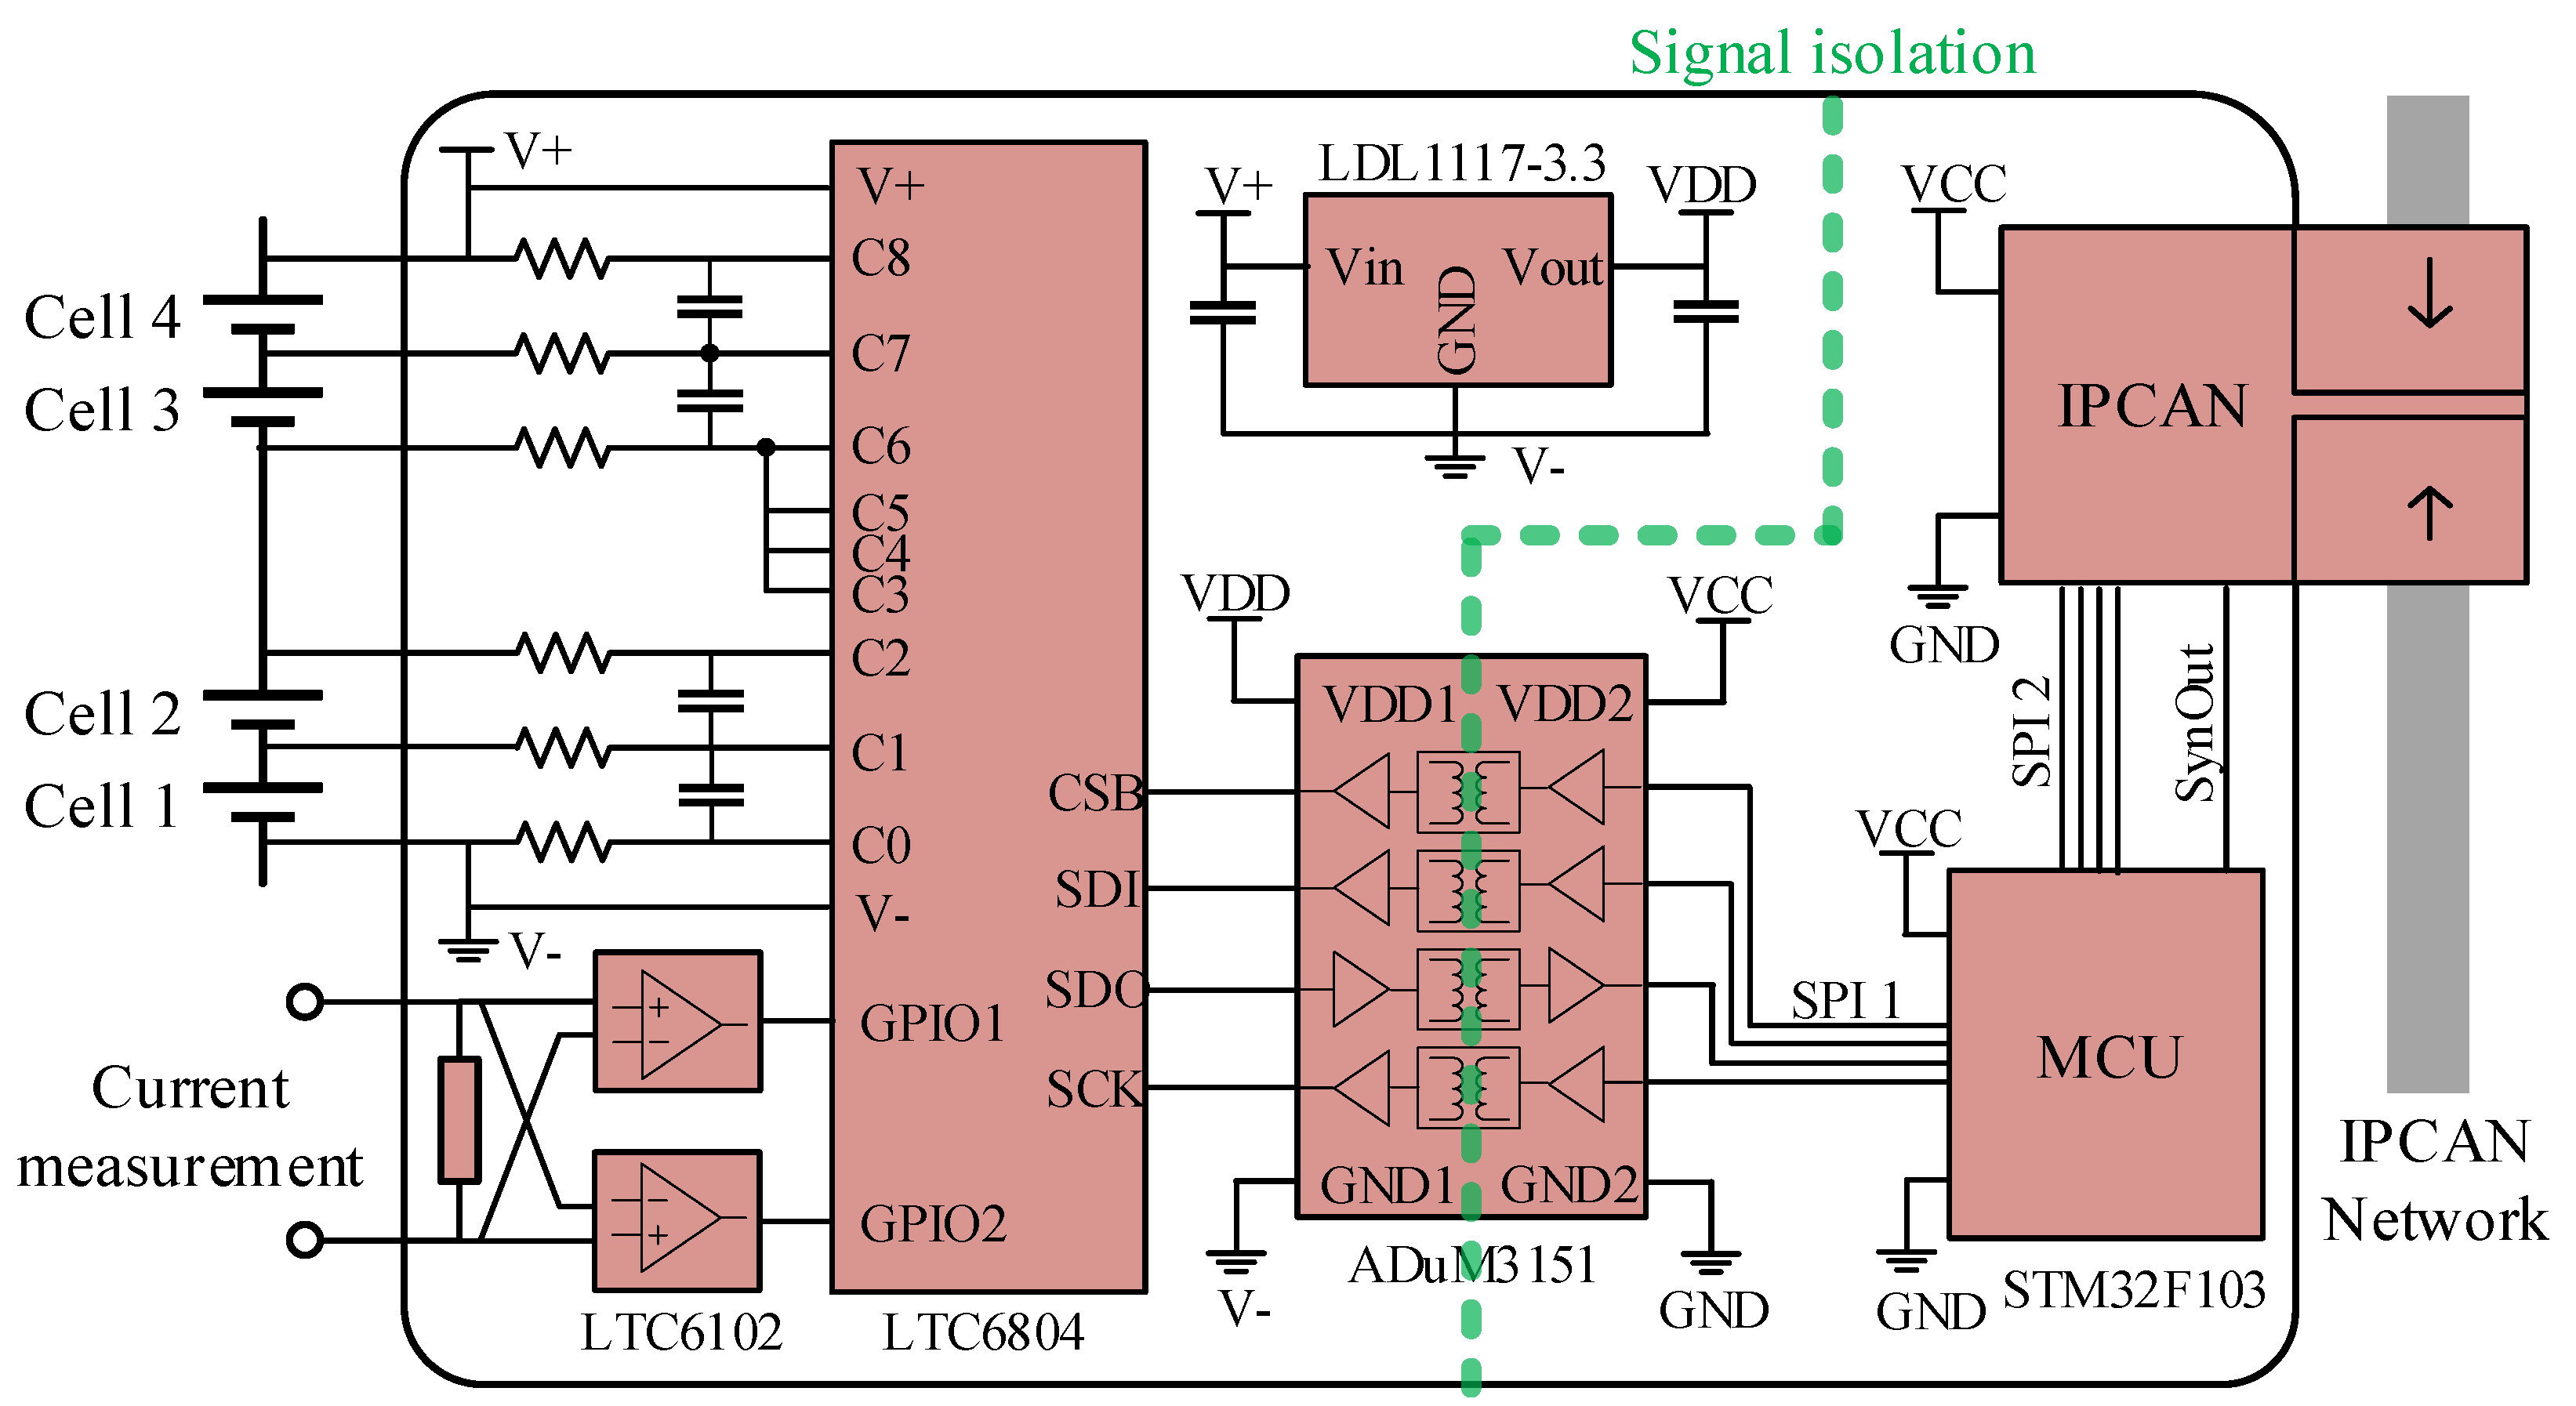
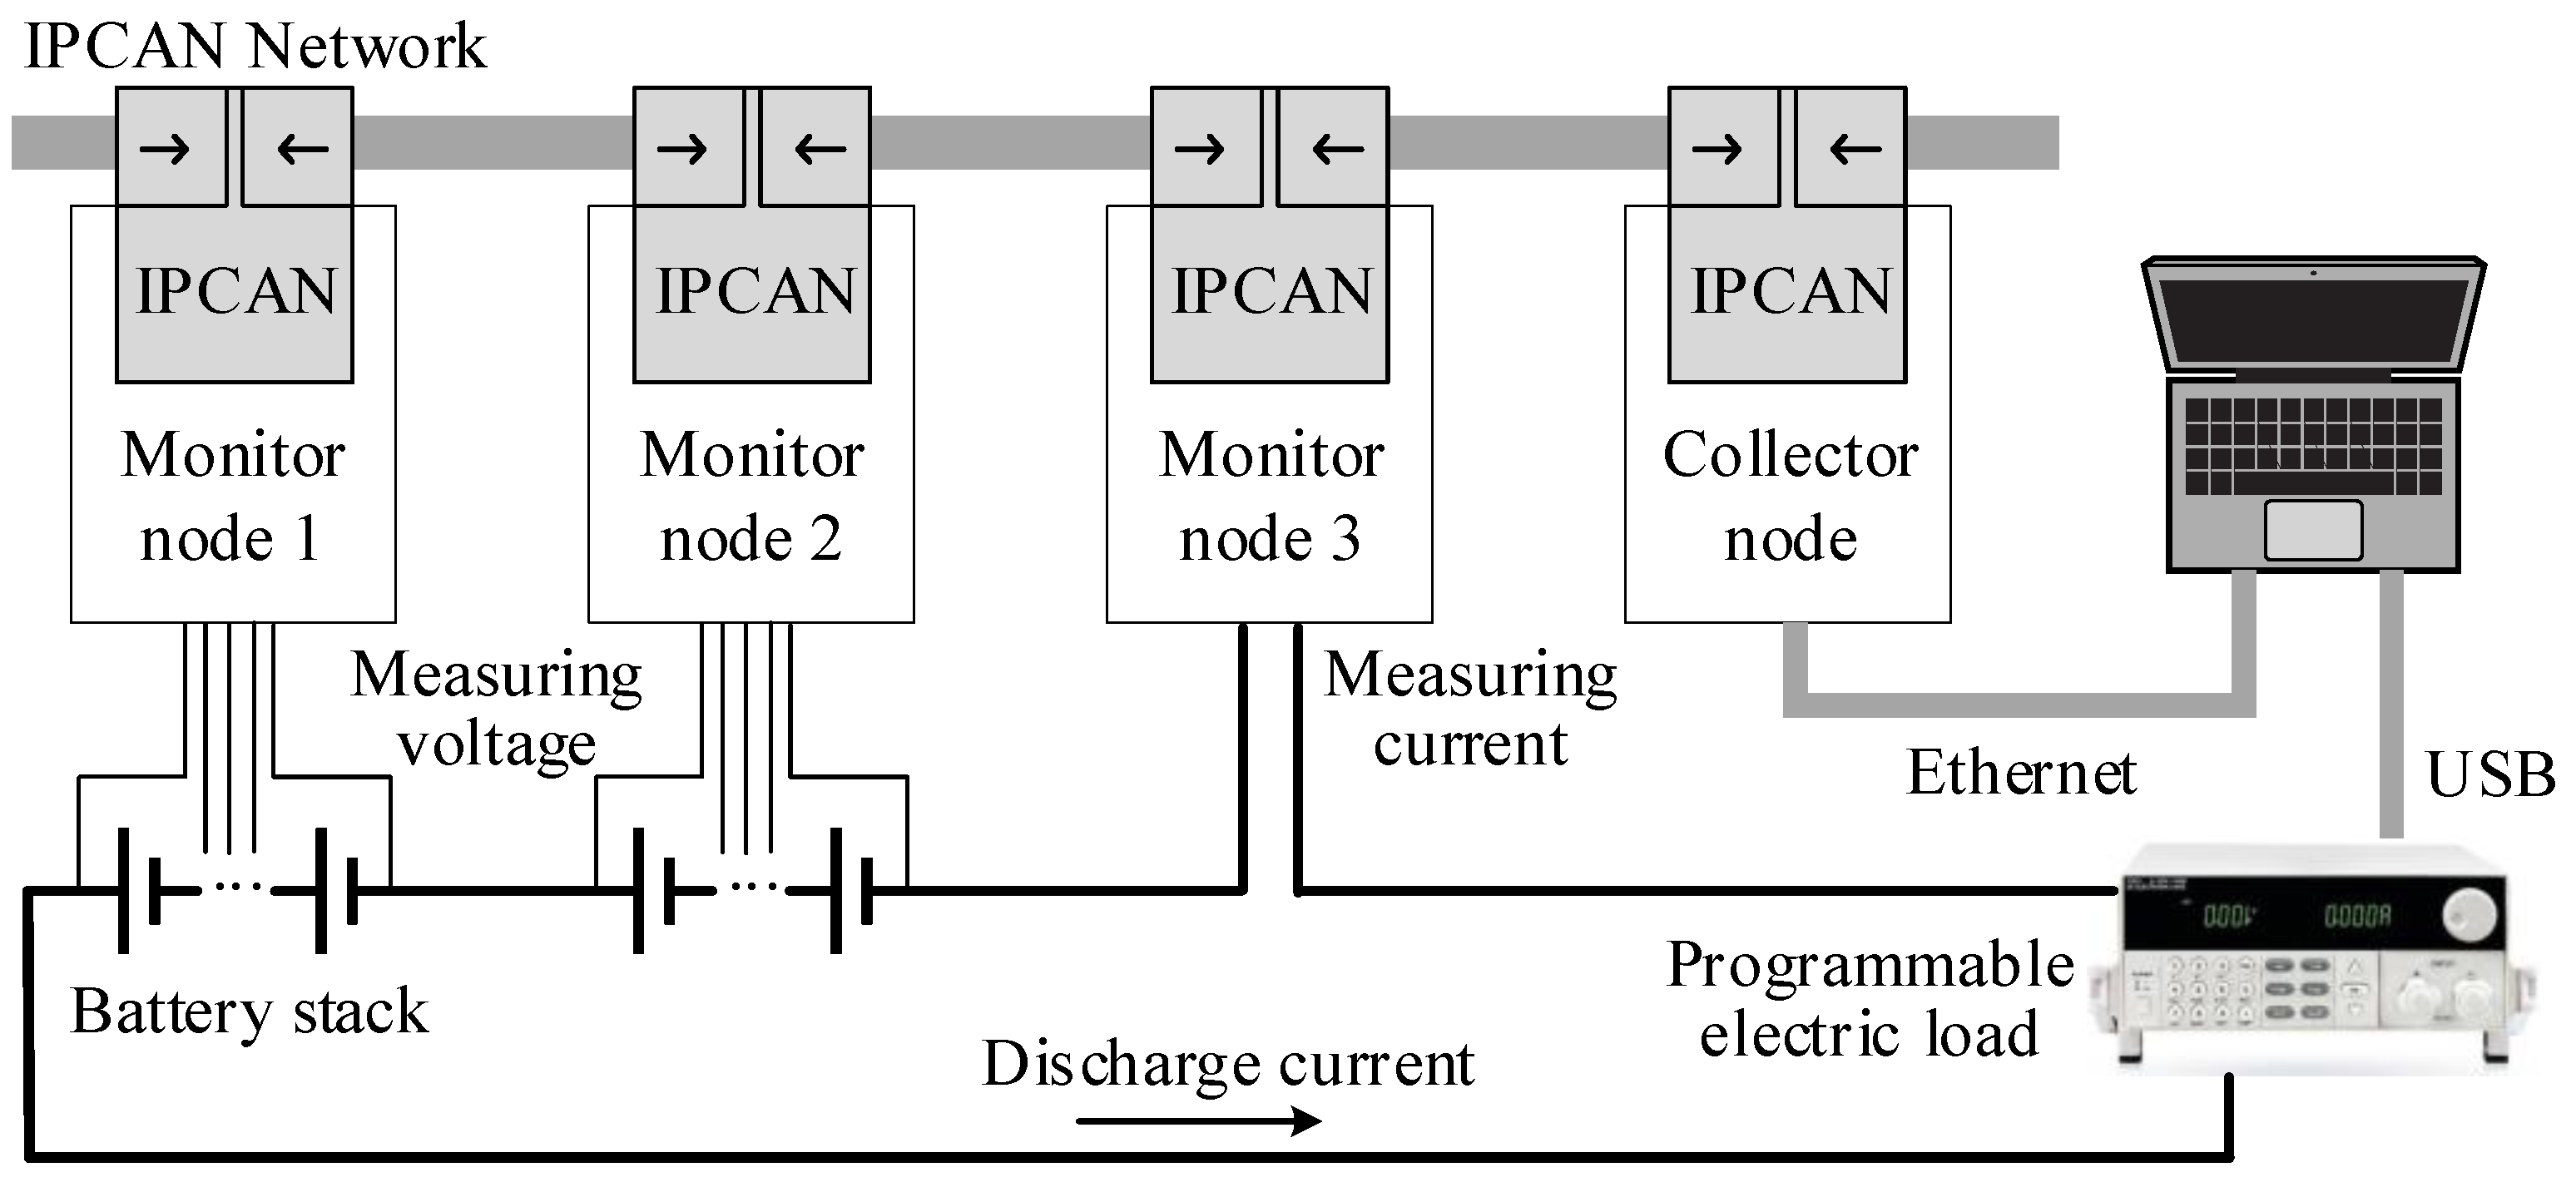
4.1. Experiment Setup
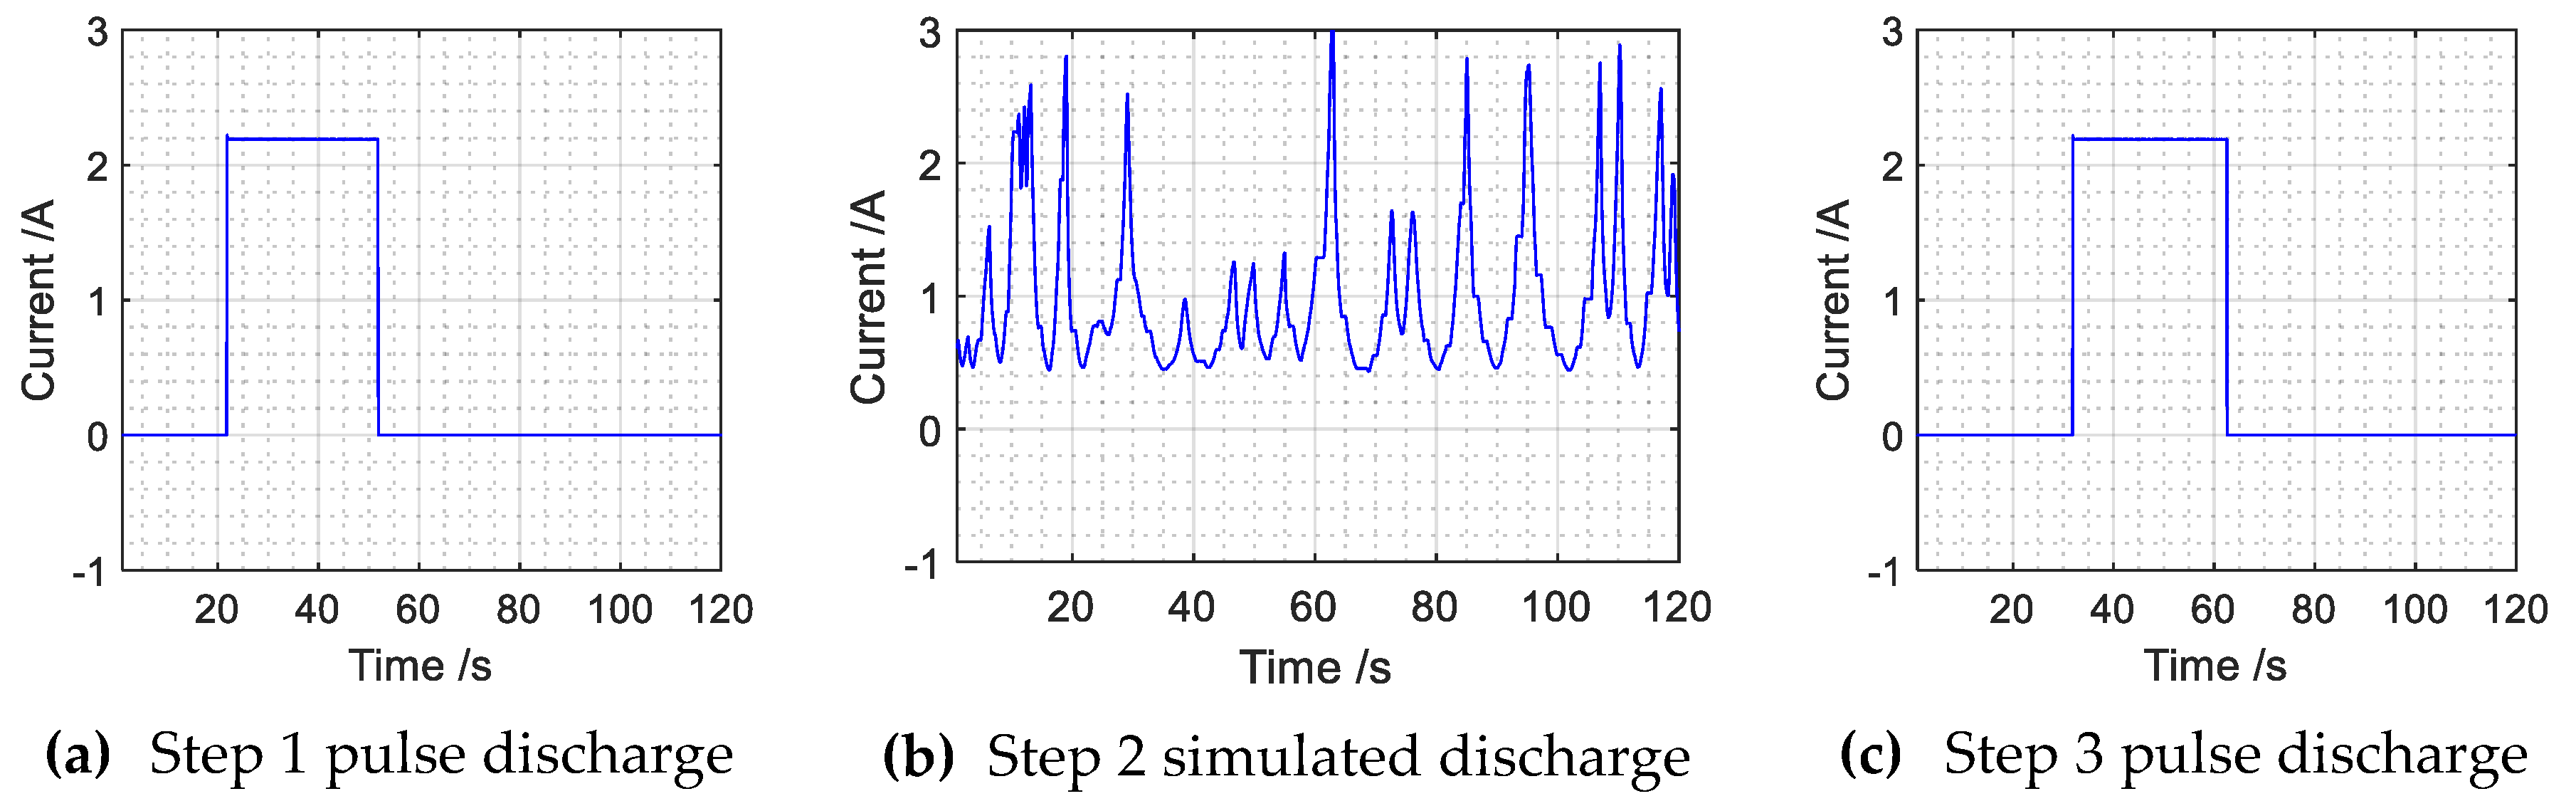
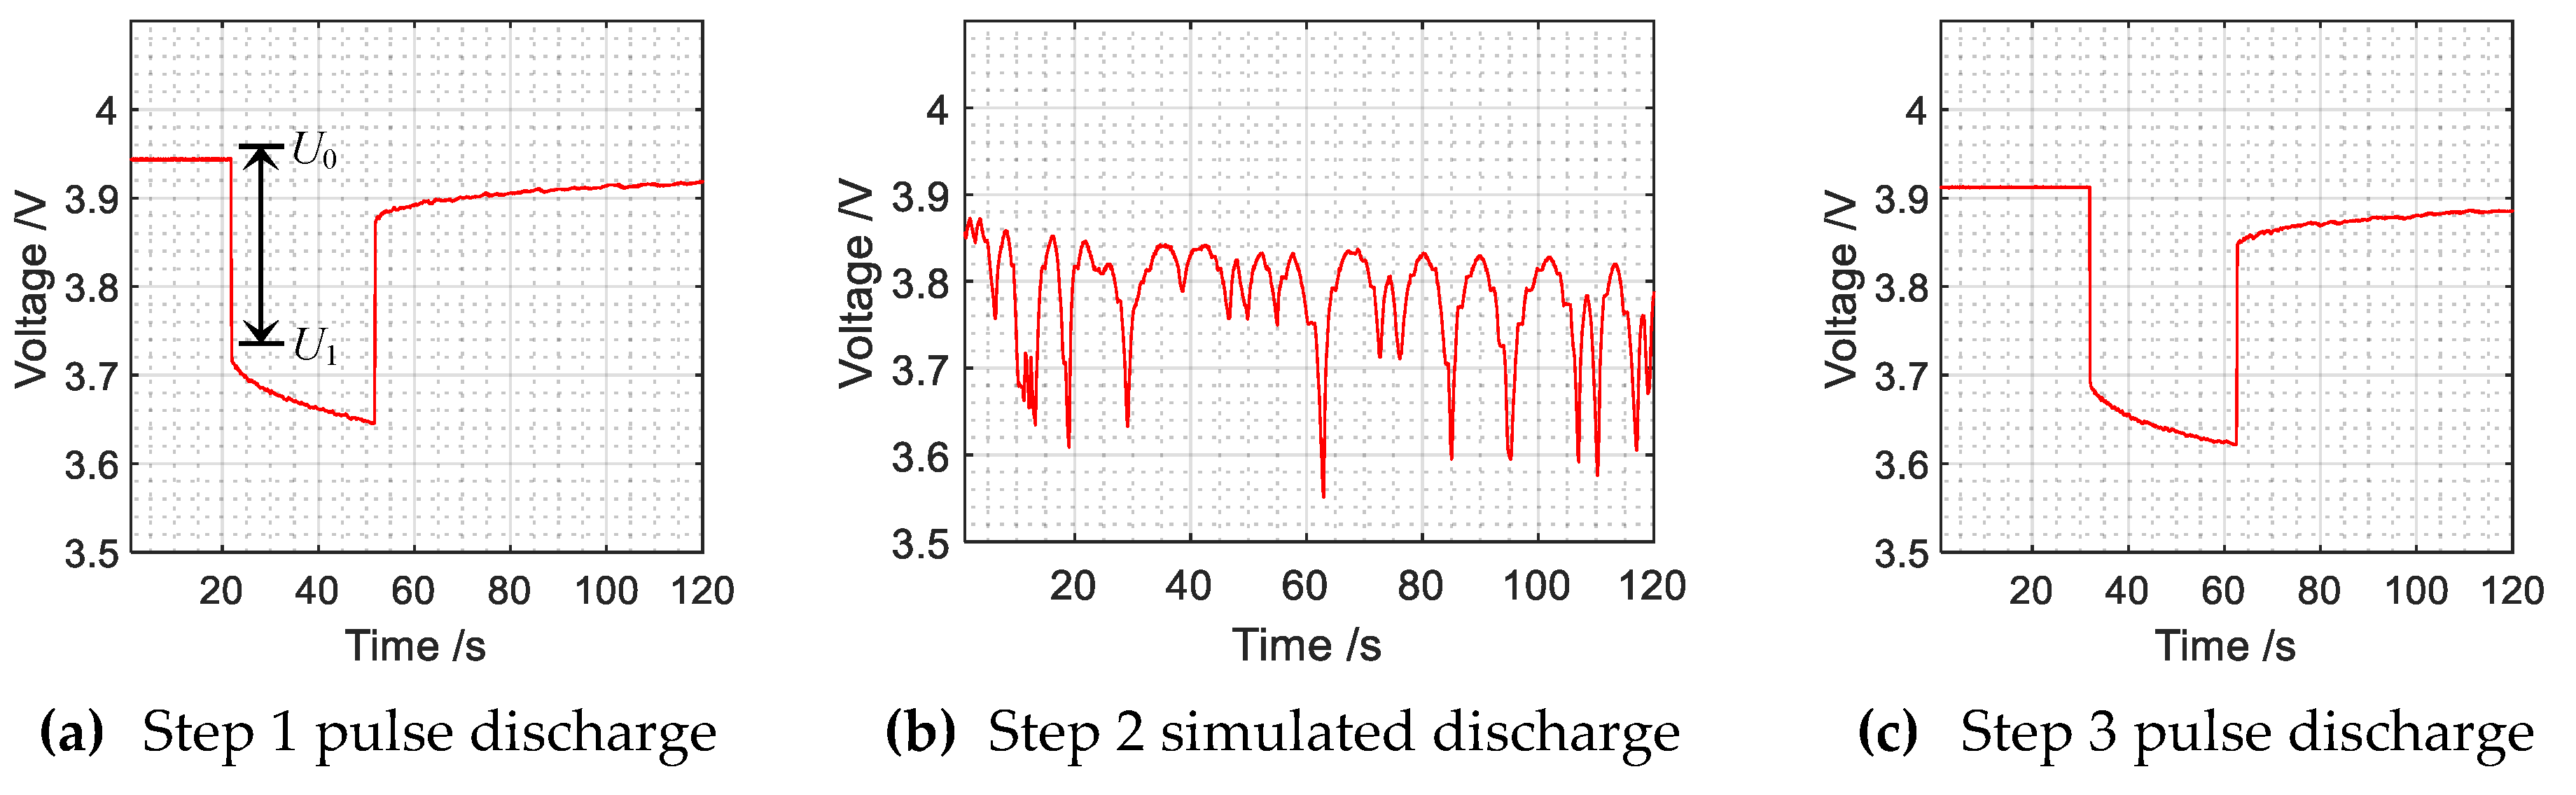
In general, a dedicated battery test system is employed to acquire the data set of lithium-ion batteries, such as Arbin BT2000 system. Inside the system, the measurement inaccuracy of the current and voltage sensors is less than ±0.05%. In our experiment, to simulate the practical measuring condition in a BMS, we developed a battery monitor node with the battery management chip LTC6804, which can measure 12 serially connected battery cells with the total measurement error less than 1.2 mV. In addition, the chip supports the synchronized measurement of voltage and current.
The schematic diagram of the monitor node is shown in Figure 3. With the LTC6804 chip, the voltages of four external cells were monitored. The analog input pins GPIO1 and GPIO2 of the chip were used to measure the charge and discharge currents, respectively. The network transmission of the node was established by a network interface device proposed by us in [28]. The network interface device is based on CAN and is named IPCAN, it can meet the transmission requirement of synchronous acquisition systems and provide synchronization signals through its SynOut pin. The LTC6804 and IPCAN are both controlled by an MCU through SPI (Serial Peripheral Interface). It is noticeable that because the LTC6804 is powered by the external cells and the MCU is powered by the IPCAN network, the signals between the LTC6804 and the MCU should be isolated. In the monitor node, a digital isolator for SPI (ADuM3151) was employed for this purpose.
A battery test system was set up with the monitor nodes, as shown in Figure 4. With the IPCAN, the monitor nodes became modular and reusable. Two monitor nodes were employed to measure the voltages of cells and one monitor node was employed to measure the current of these cells. To collect measurement data from monitor nodes, an IPCAN-based collector node was developed, which transmitted collected data to a computer through Ethernet. The sample frequency of the system can be up as high as 1 KHz. Furthermore, in order to improve the synchronization accuracy of the samplings of voltage and current, a clock drift compensation method for synchronous sampling proposed by us in [29] was also employed. Test results show that, for Cell 1 in Figure 3, the sampling synchronization error of its voltage and current was bellow 10 μs. With the high sample frequency and high synchronization accuracy, it is possible to manually create millisecond delays between the samplings of voltage and current, which is important for analyzing the influence of sampling delay. In the end, a programmable electric load (ITECH IT8510) and a variable resistance load are used for realizing constant current discharge and simulated discharge.

4.2. Battery Test

The cell used in the test was the ICR18650-22P lithium-ion battery produced by Samsung. The typical capacity of the cell is 2150 mAh, and the charging voltage and discharge cut-off voltage of it are 4.2 V and 2.75 V, respectively. Other specifications of the cell are present in Table 1. The cathode material of the cell is LiNixCoyMnzO2 (NCM), which has many advantages including high energy density, excellent consistency, and mild thermal stability [30]. The NCM lithium-ion batteries have been widely used in electric vehicles.
In order to verify the accuracy of the online estimation methods, a battery test method that combines pulse discharge and simulated discharge is proposed. As shown in Figure 5, the battery testing process was divided into three steps: (1) In step 1, the cell was fully rested and then a pulse discharge with current at 2.15 A (1C) was carried out. (2) In step 2, a simulated discharge with varying discharge current was implemented for 120 seconds. (3) In step 3, the cell was again rested to reach cell equilibrium and then a pulse discharge was carried out once more.
The response curve of terminal voltage for the cell in the test is shown in Figure 6. The results of pulse discharges can be used for estimating battery parameters offline. As shown in Figure 6a, because the battery was fully rested, the measured terminal voltage U0 before the pulse discharge was equal to its OCV. When the discharge pulse was applied, the terminal voltage dropped from U0 to U1 suddenly. This phenomenon is mainly caused by the internal resistance of the cell, and the internal resistance can be estimated as follows [31]:
R o = U 0 U 1 I L
With the step 1 and step 3 pulse discharges, the internal resistance and OCV of the cell before and after the step 2 simulated discharge can be estimated offline, which will be used as the evaluation basis of the online estimation results based on step2 simulated discharge.

5. Verification and Evaluation

The measured current and voltage data in step 2 simulated discharge is used for estimating battery parameters online. Because the sampling period is 1 kHz and the sampling synchronization error of voltage and current is bellow 10 μs in the test, the data with sampling delay of several milliseconds can be obtained from the original data measured in step 2. Through comparing the estimation results under different sampling delays and different estimation methods, the influence of sampling delay and the performance of the optimized estimation method can be demonstrated.

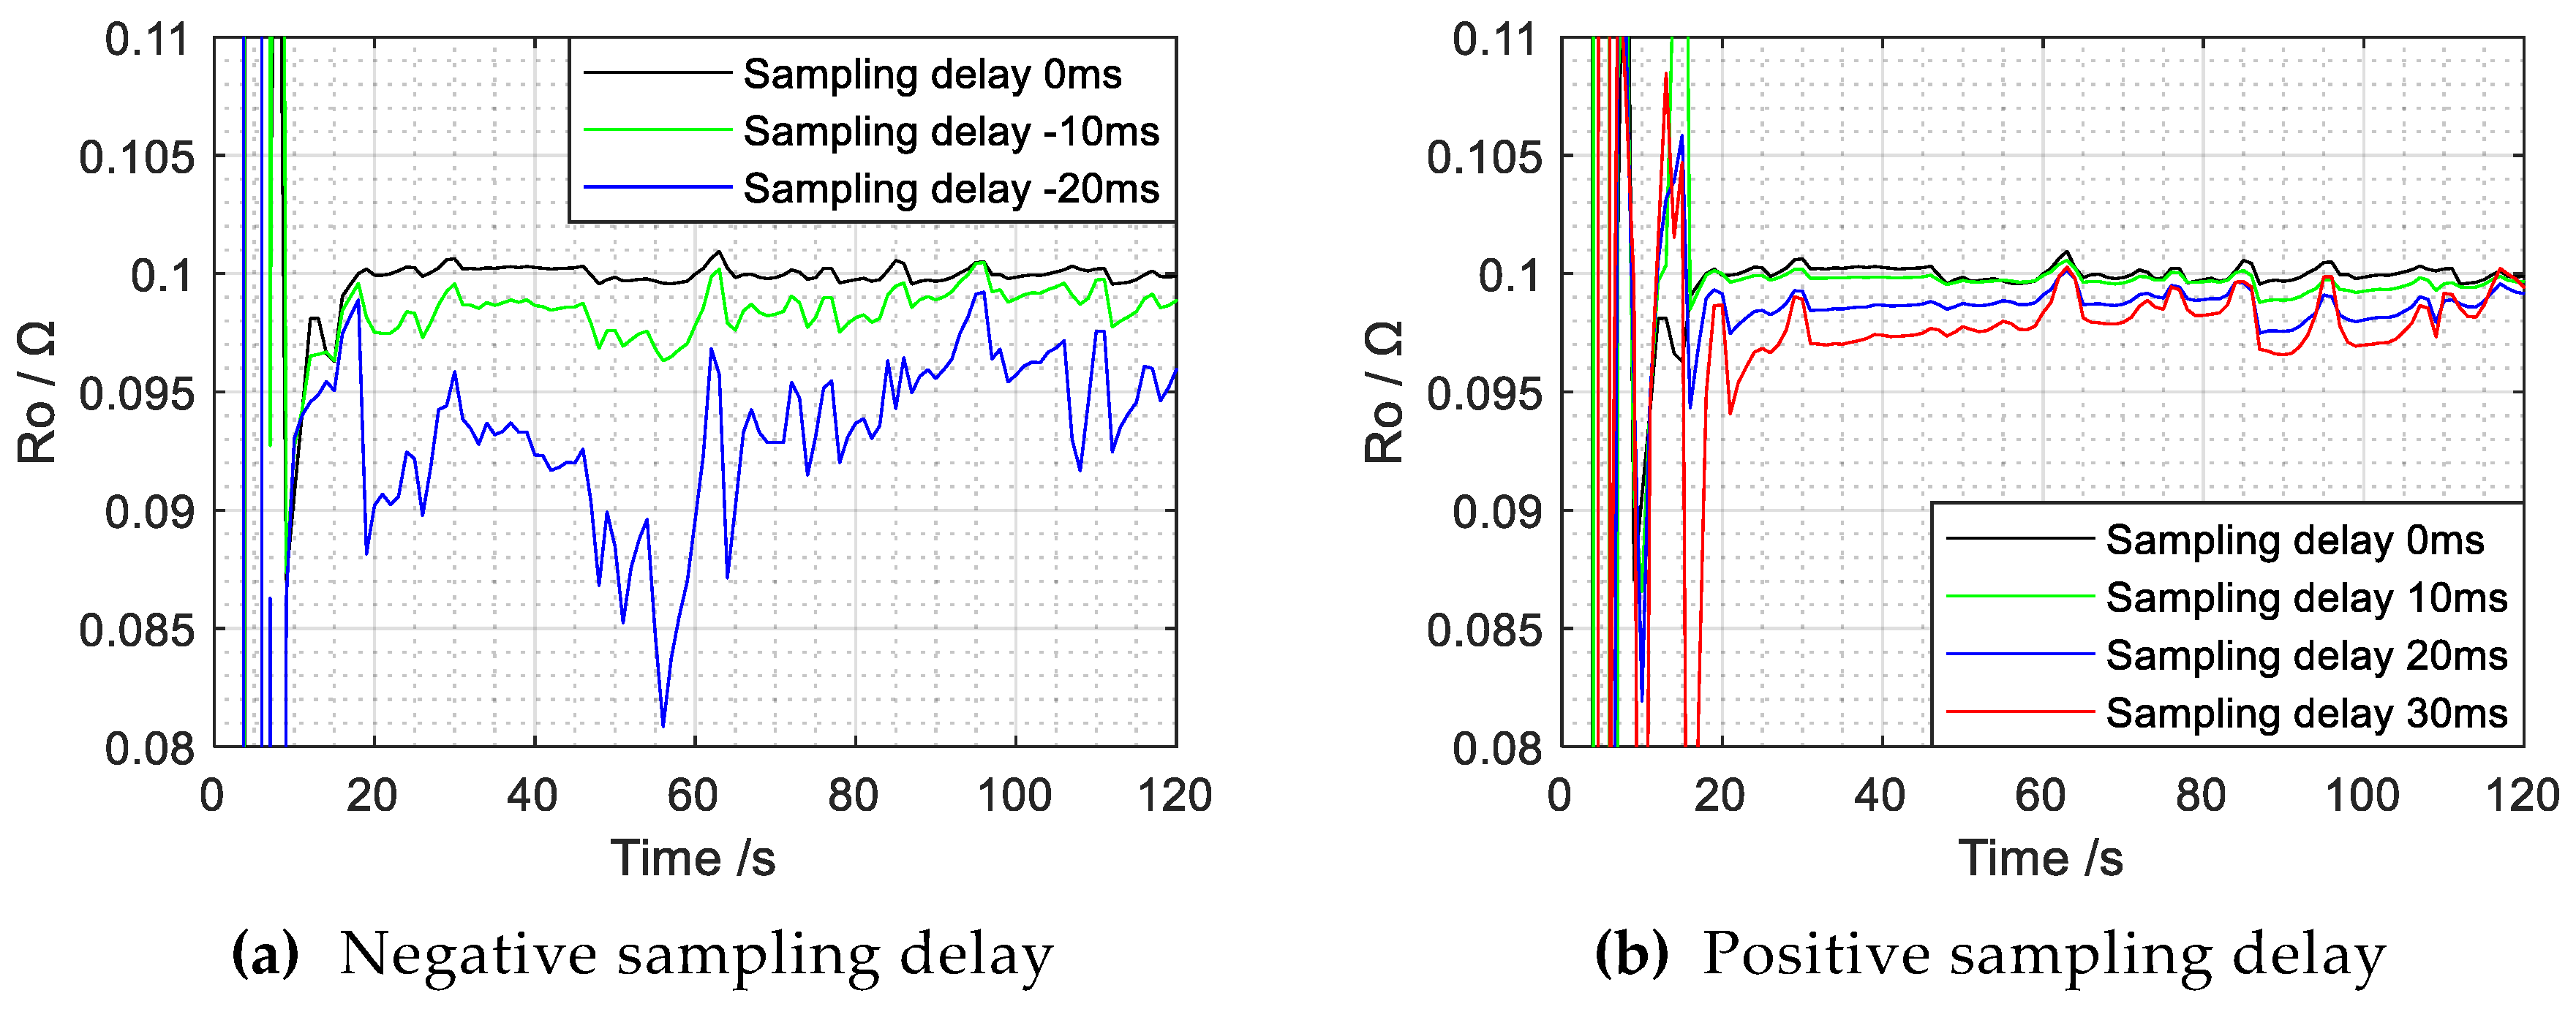
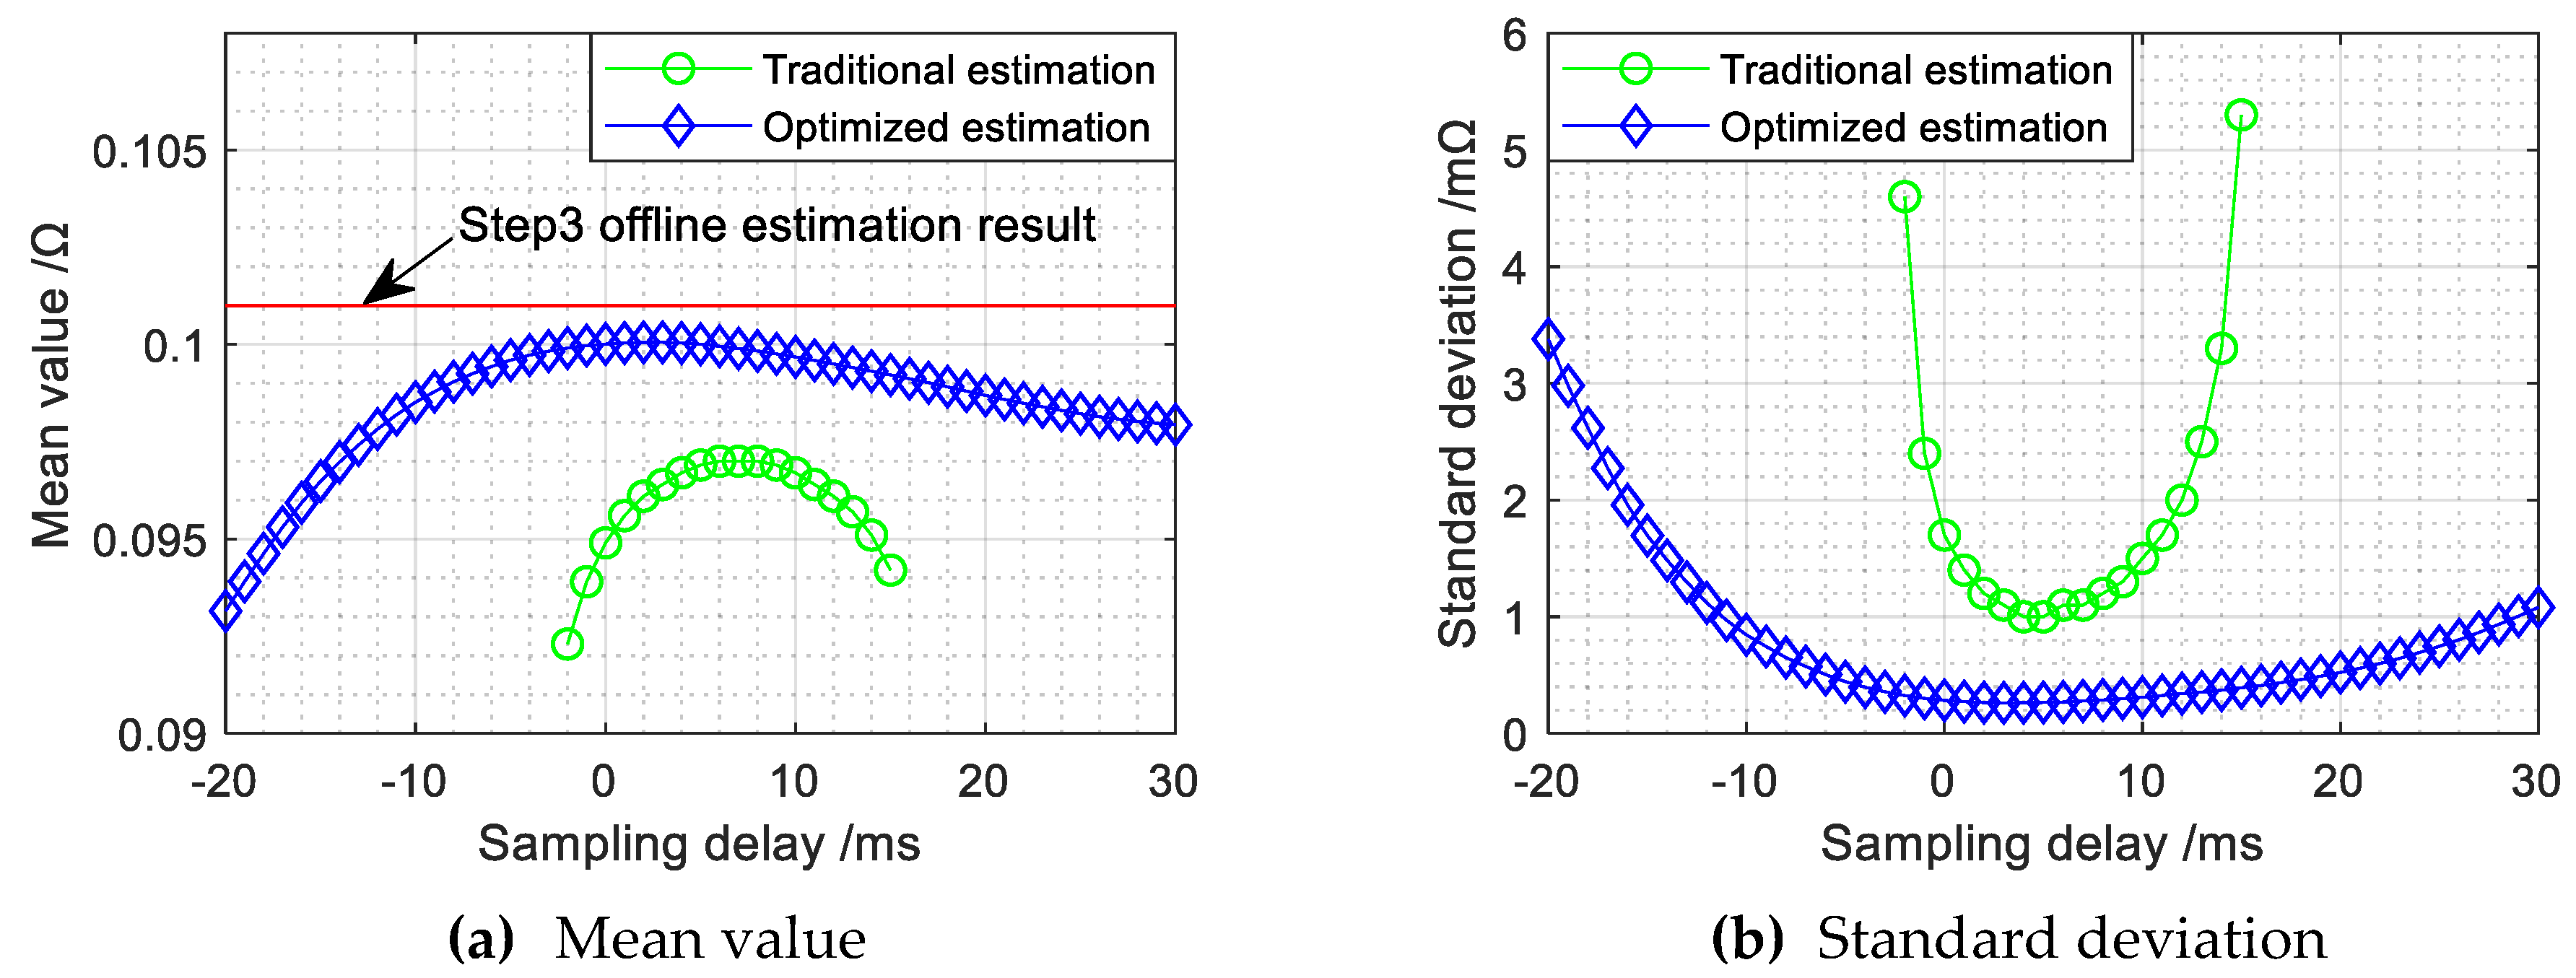
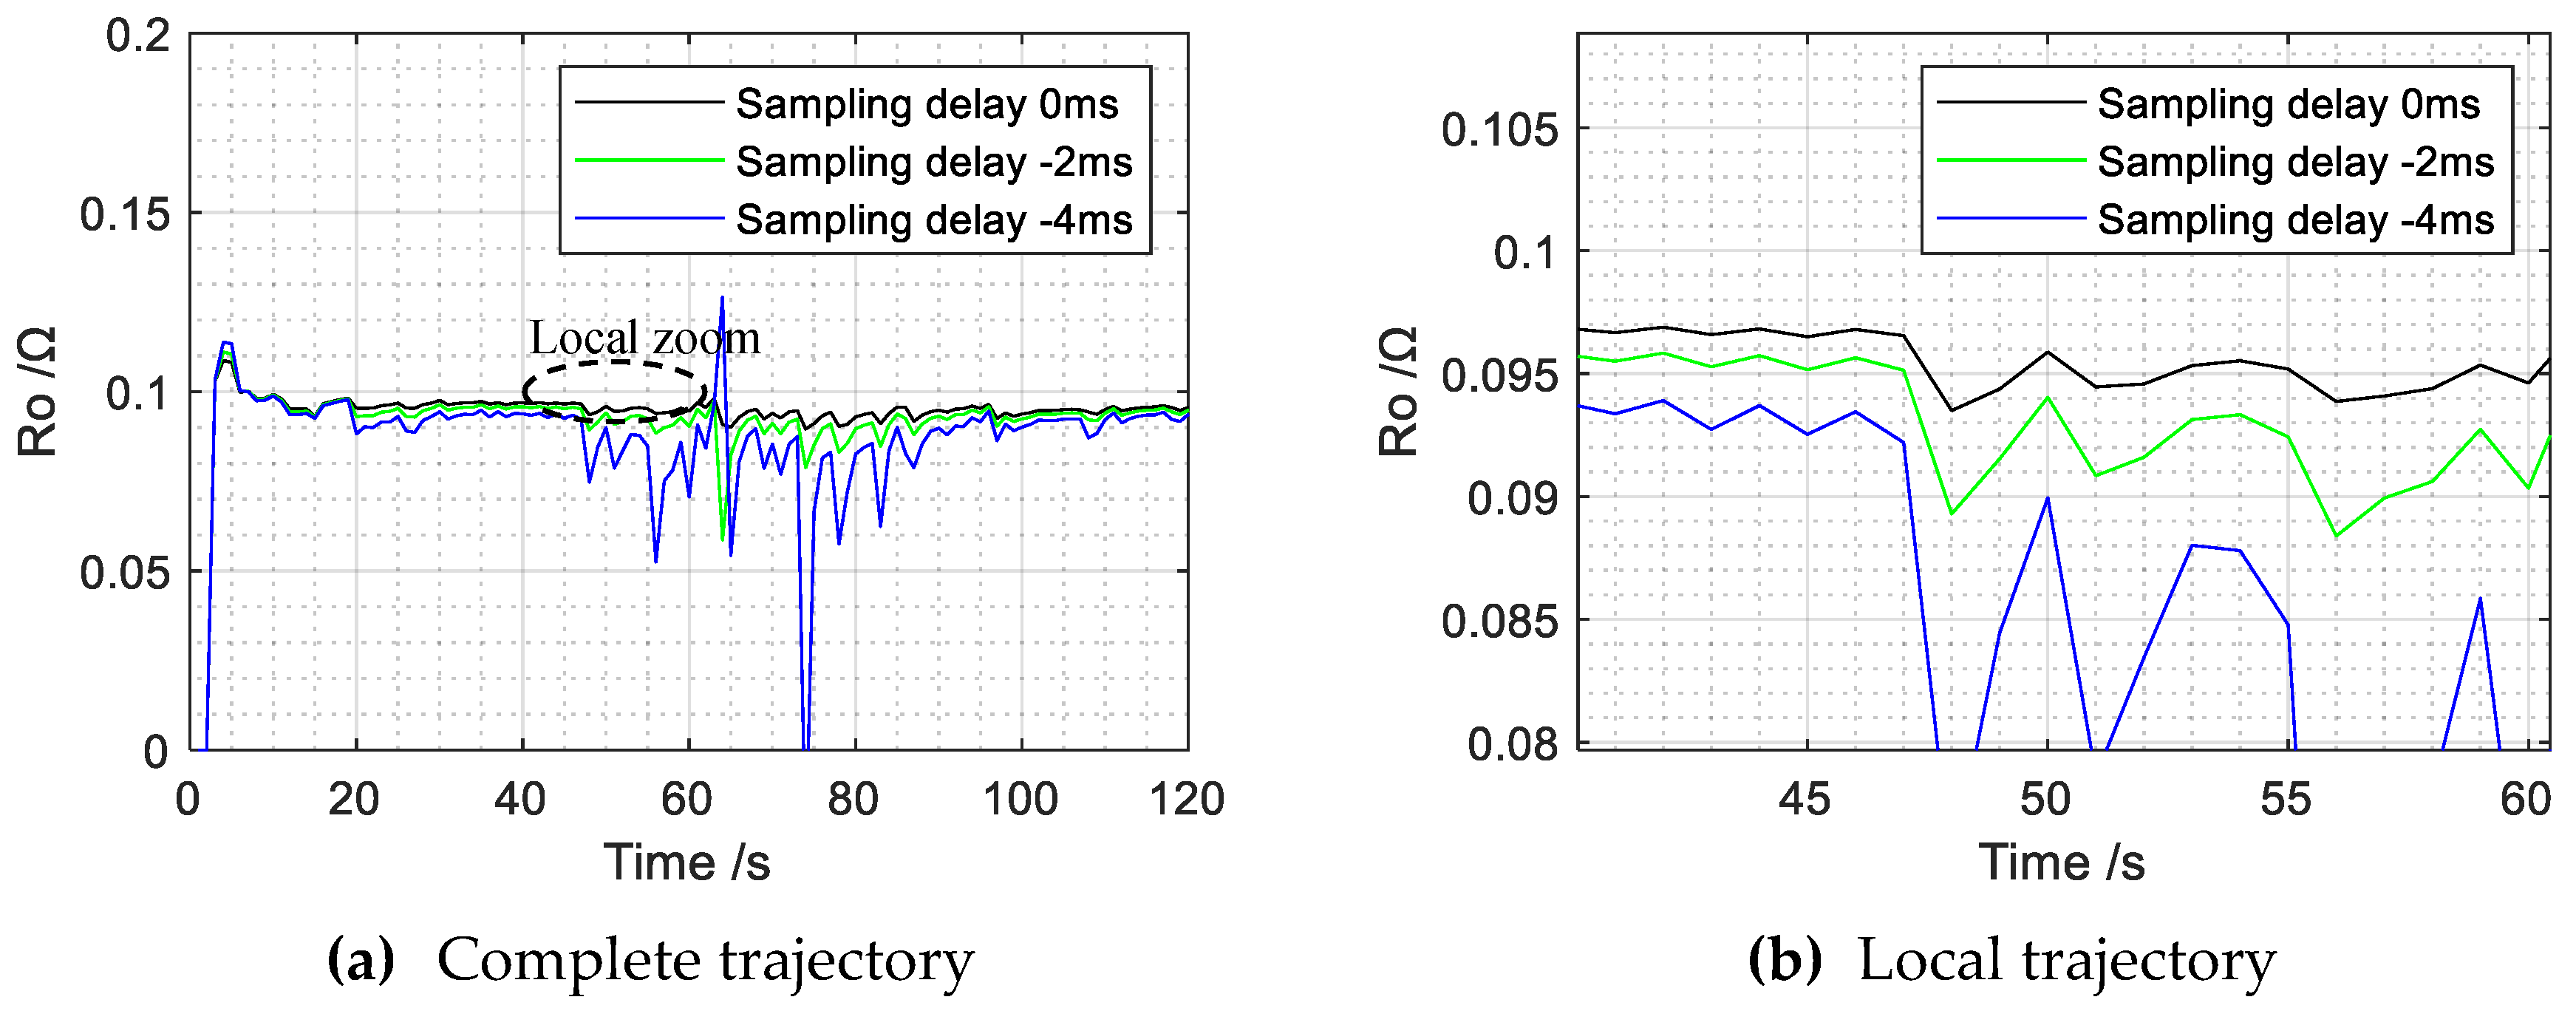
5.1. The Influence of Sampling Delay on Traditional Estimation Method

The offline estimation results of battery parameters are present in Table 2. The OCV drops from 3.945 V in step 1 to 3.913 V in step 3, which is mainly caused by the consumed energy in step 2 simulated discharge. The internal resistance changes slightly from 0.103 Ω in step 1 to 0.101 Ω in step 3, which reflects that the temperature variation and energy consumption are small in the test with a short time. It can be inferred that, in the step 2 simulated discharge process, OCV drops from 3.945 V to 3.913 V and the internal resistance is around 0.101 Ω.
Then, using measured current and voltage data in step 2 simulated discharge, we estimated battery parameters with the traditional online method, which adopts the traditional mathematical battery model, related to Equations (7)–(10), and the RLS algorithm with an optimal forgetting factor, related to Equations (24) and (25). In the estimating process, the sampling period and sampling delay were set at 1 s and 0 ms, respectively. The optimal forgetting factor λ was set to 0.98.
The trajectories of estimated battery parameters in the estimation process are shown in Figure 7. The green dashed line and blue dot-dashed line denote the offline estimation results of step 1 and step 3, respectively. The red line refers to the online estimation result in step 2, showing that the estimated parameters begin to converge after eight seconds. For the OCV shown in Figure 7a, the initial estimated result is 3.922 V, which is 23 mV less than the offline result of step 1. The final estimated result is 3.884 V, which is 29 mV less than the offline result of step 3. For the internal resistance, the mean value and standard deviation of online estimated results is 0.0949 Ω and 1.7 mΩ, which is close to the offline estimation results. In summary, with the traditional estimation method, the estimated OCV is about 29 mV less than its actual value, and the estimated internal resistance is close to its actual value but is fluctuant.
In order to analyze the influence of sampling delay on the traditional online estimation method, the sampling delay of measured current and voltage in the step 2 discharge wa manually changed from −4 ms to 4 ms, and the above online estimation process was repeated. As analyzed in Section 2.2, the sampling delay will cause the estimation results to fluctuate. Besides, the offline estimation results indicate that the internal resistance is basically unchanged in the step 2 discharge. Hence, the estimation accuracy of internal resistance can be used for showing the influence of sampling delay.
According to the definition of the sampling delay ε in Section 2.2, negative sampling delays mean that the sampling instant of voltage is ahead of that of current. The trajectories of estimated internal resistance with negative sampling delays are shown in Figure 8. With the absolute value of sampling delay increasing, the fluctuation range of estimated internal resistances becomes large. When the sampling delay reaches −4 ms, the estimated result is difficult to converge. However, as shown in Figure 9, the trajectories of estimated internal resistance with positive sampling delays indicate that when the sampling delay changes from 0 ms to 4 ms, the estimated internal resistances become more and more accuracy. In summary, negative sampling delay has a bad effect on parameter estimation, and a little positive sampling delay is beneficial.
In order to show the influence of sampling delay more clearly, we changed the sampling delay from −20 ms to 20 ms, repeated the traditional online estimation process again, and then calculated the mean and standard deviation of estimated internal resistances between 20 s and 120 s. The results are shown in Figure 10, where the standard deviation is presented by the error bar. Two conclusions can be drawn: (1) When the sampling delay is 6 ms instead of 0 ms, the estimation accuracy is the highest, but there is still 4 mΩ error in the mean value. (2) With the sampling delay deviating from 6 ms, the average error and fluctuation range become larger and larger. When the sampling delay is shorter than −2 ms or larger than 15 ms, the convergence of estimated parameters becomes difficult.

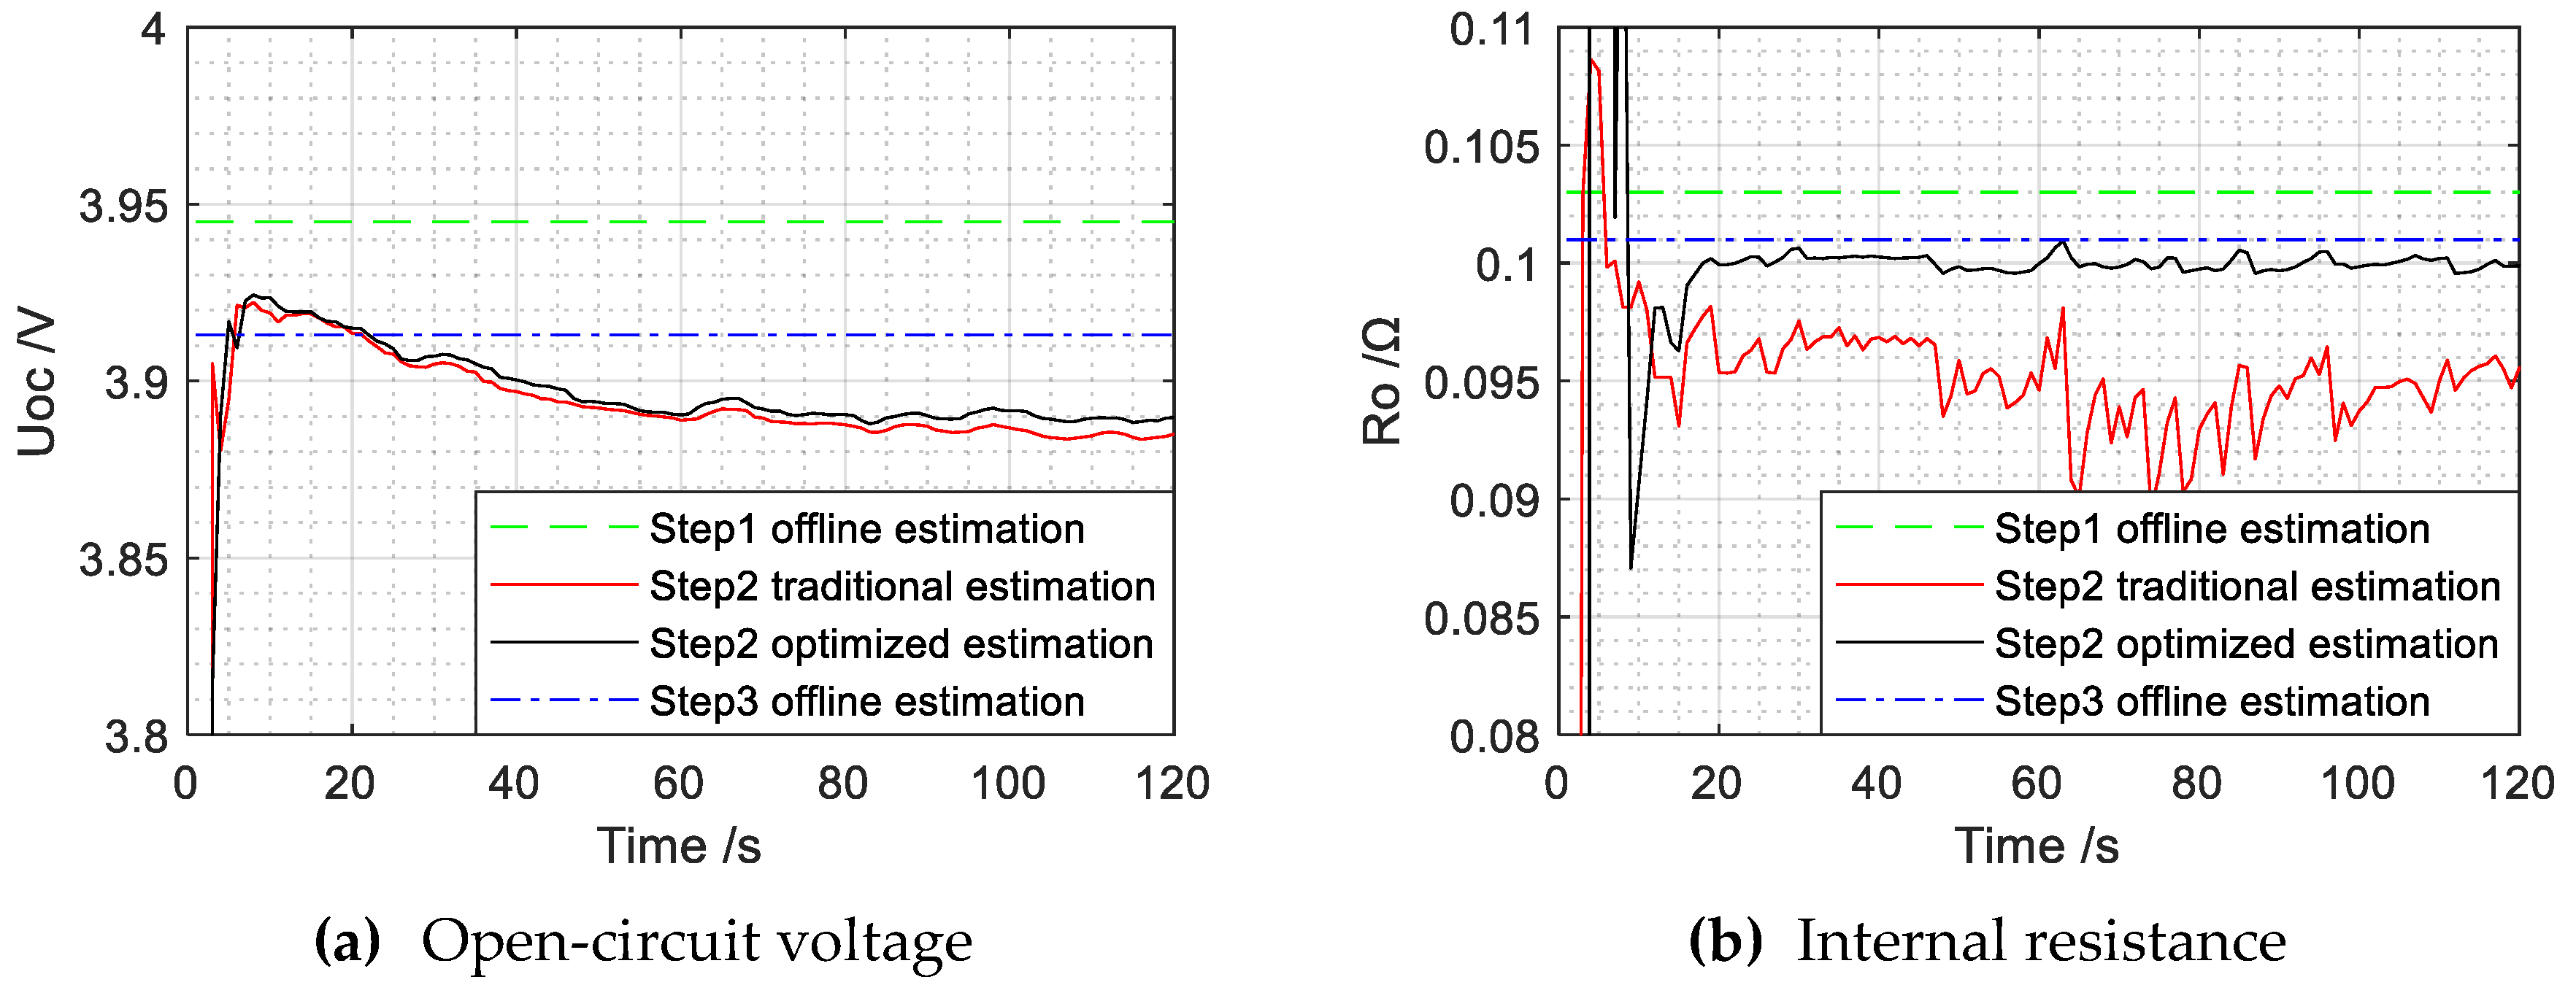
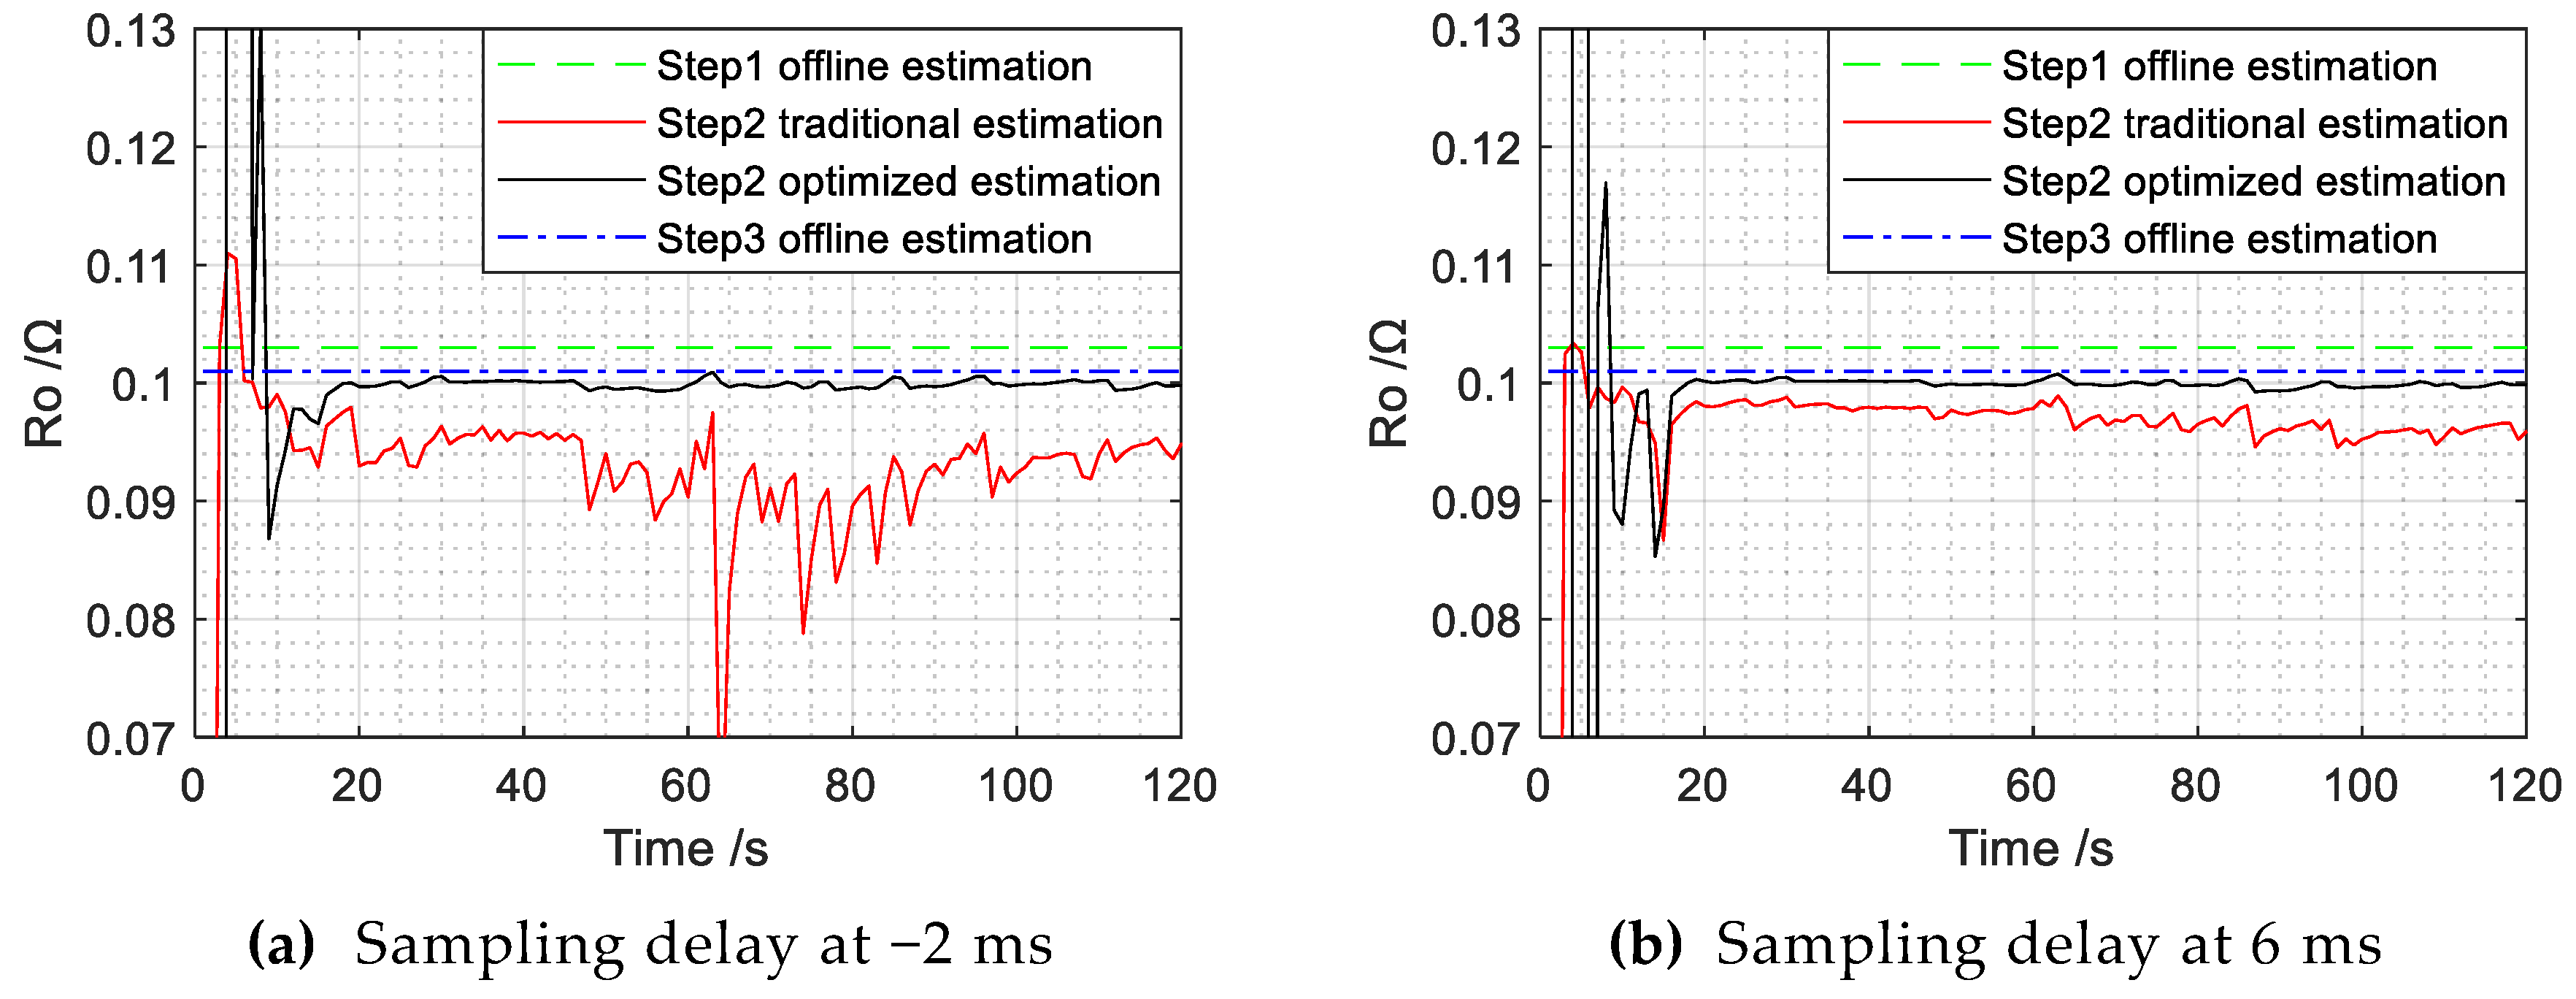
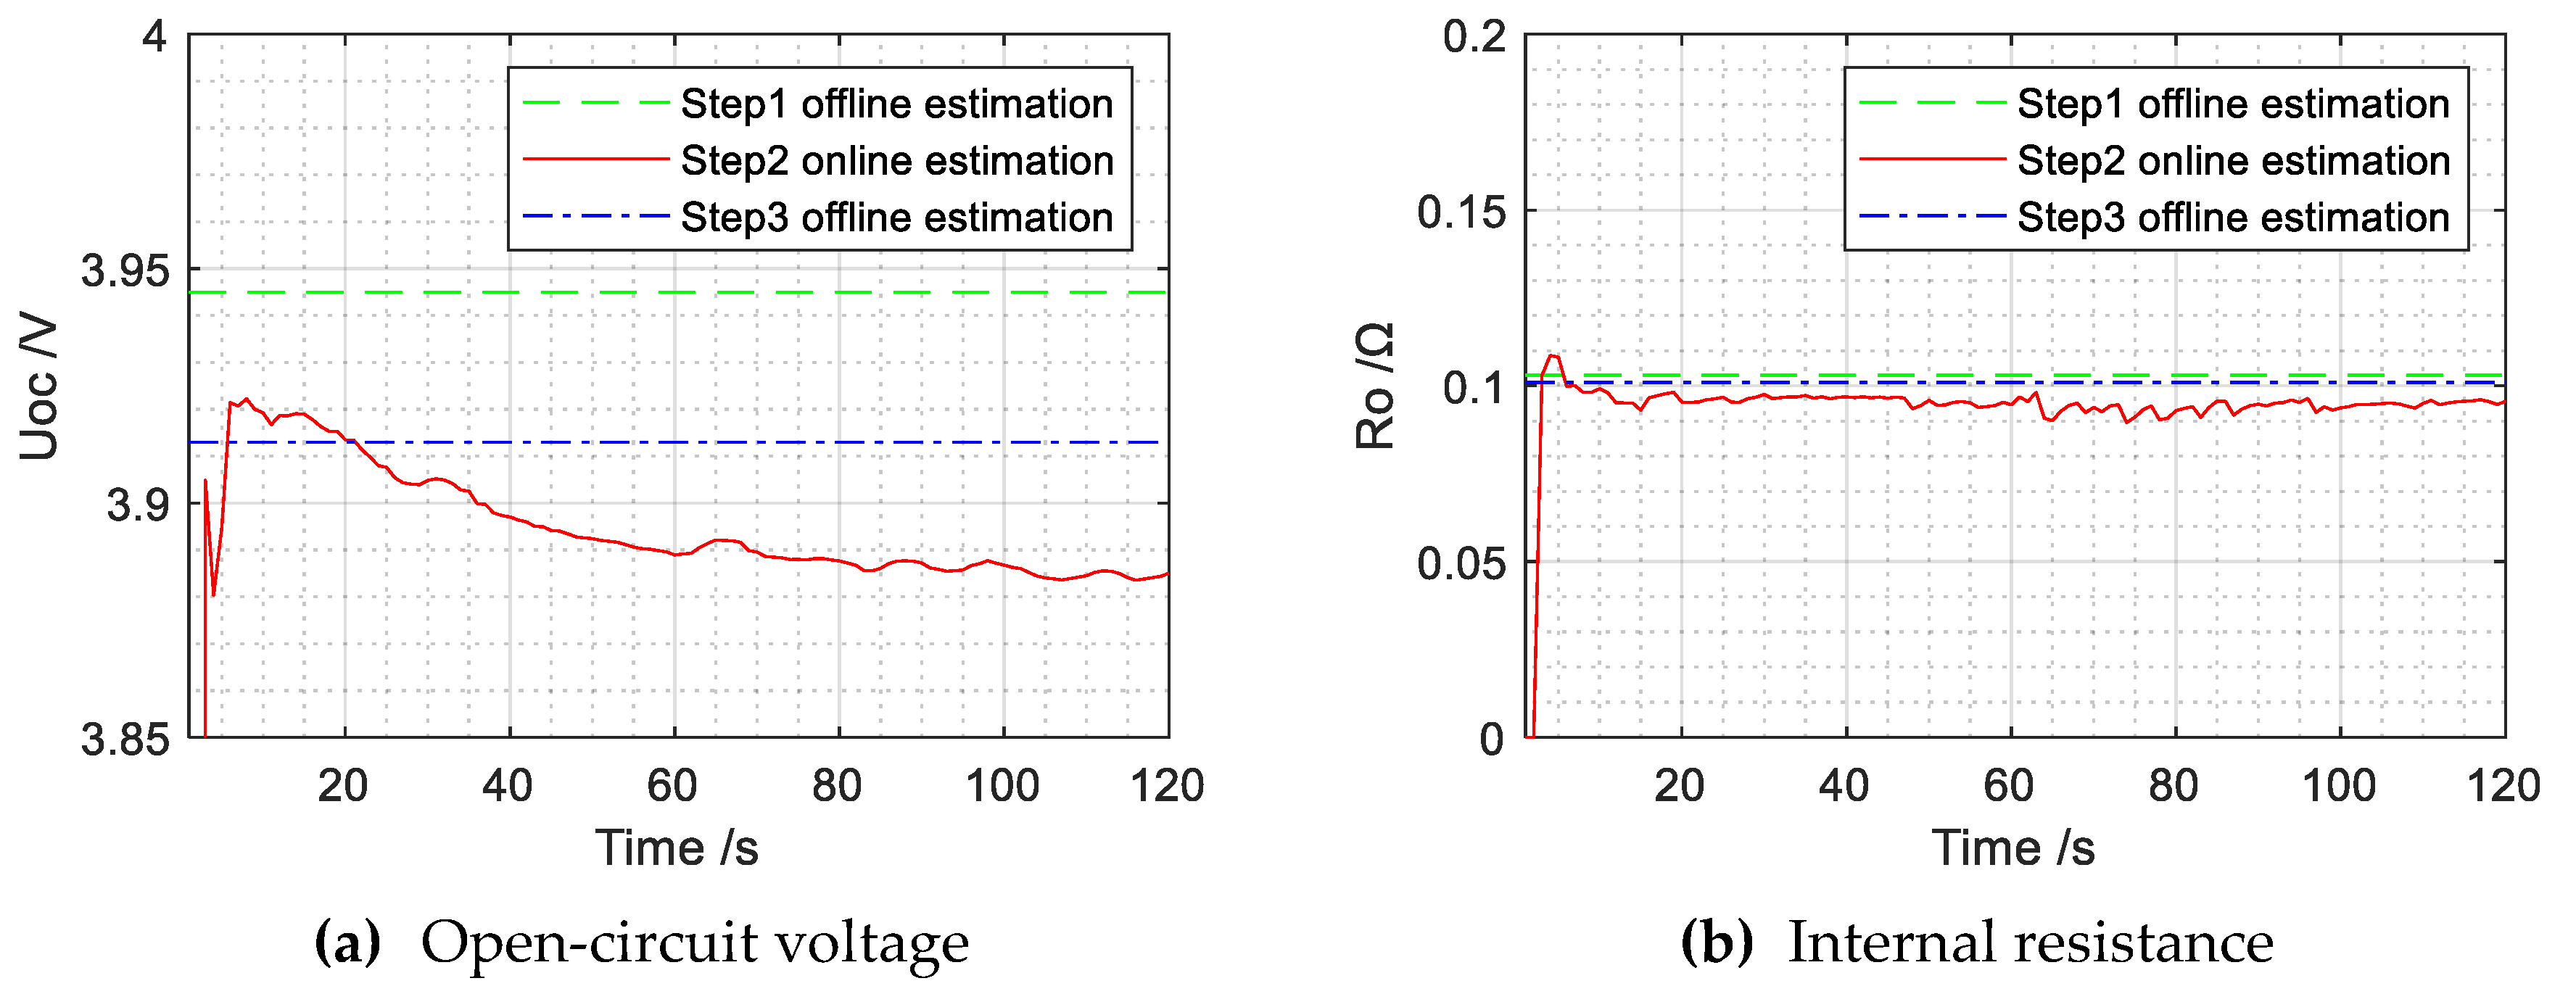
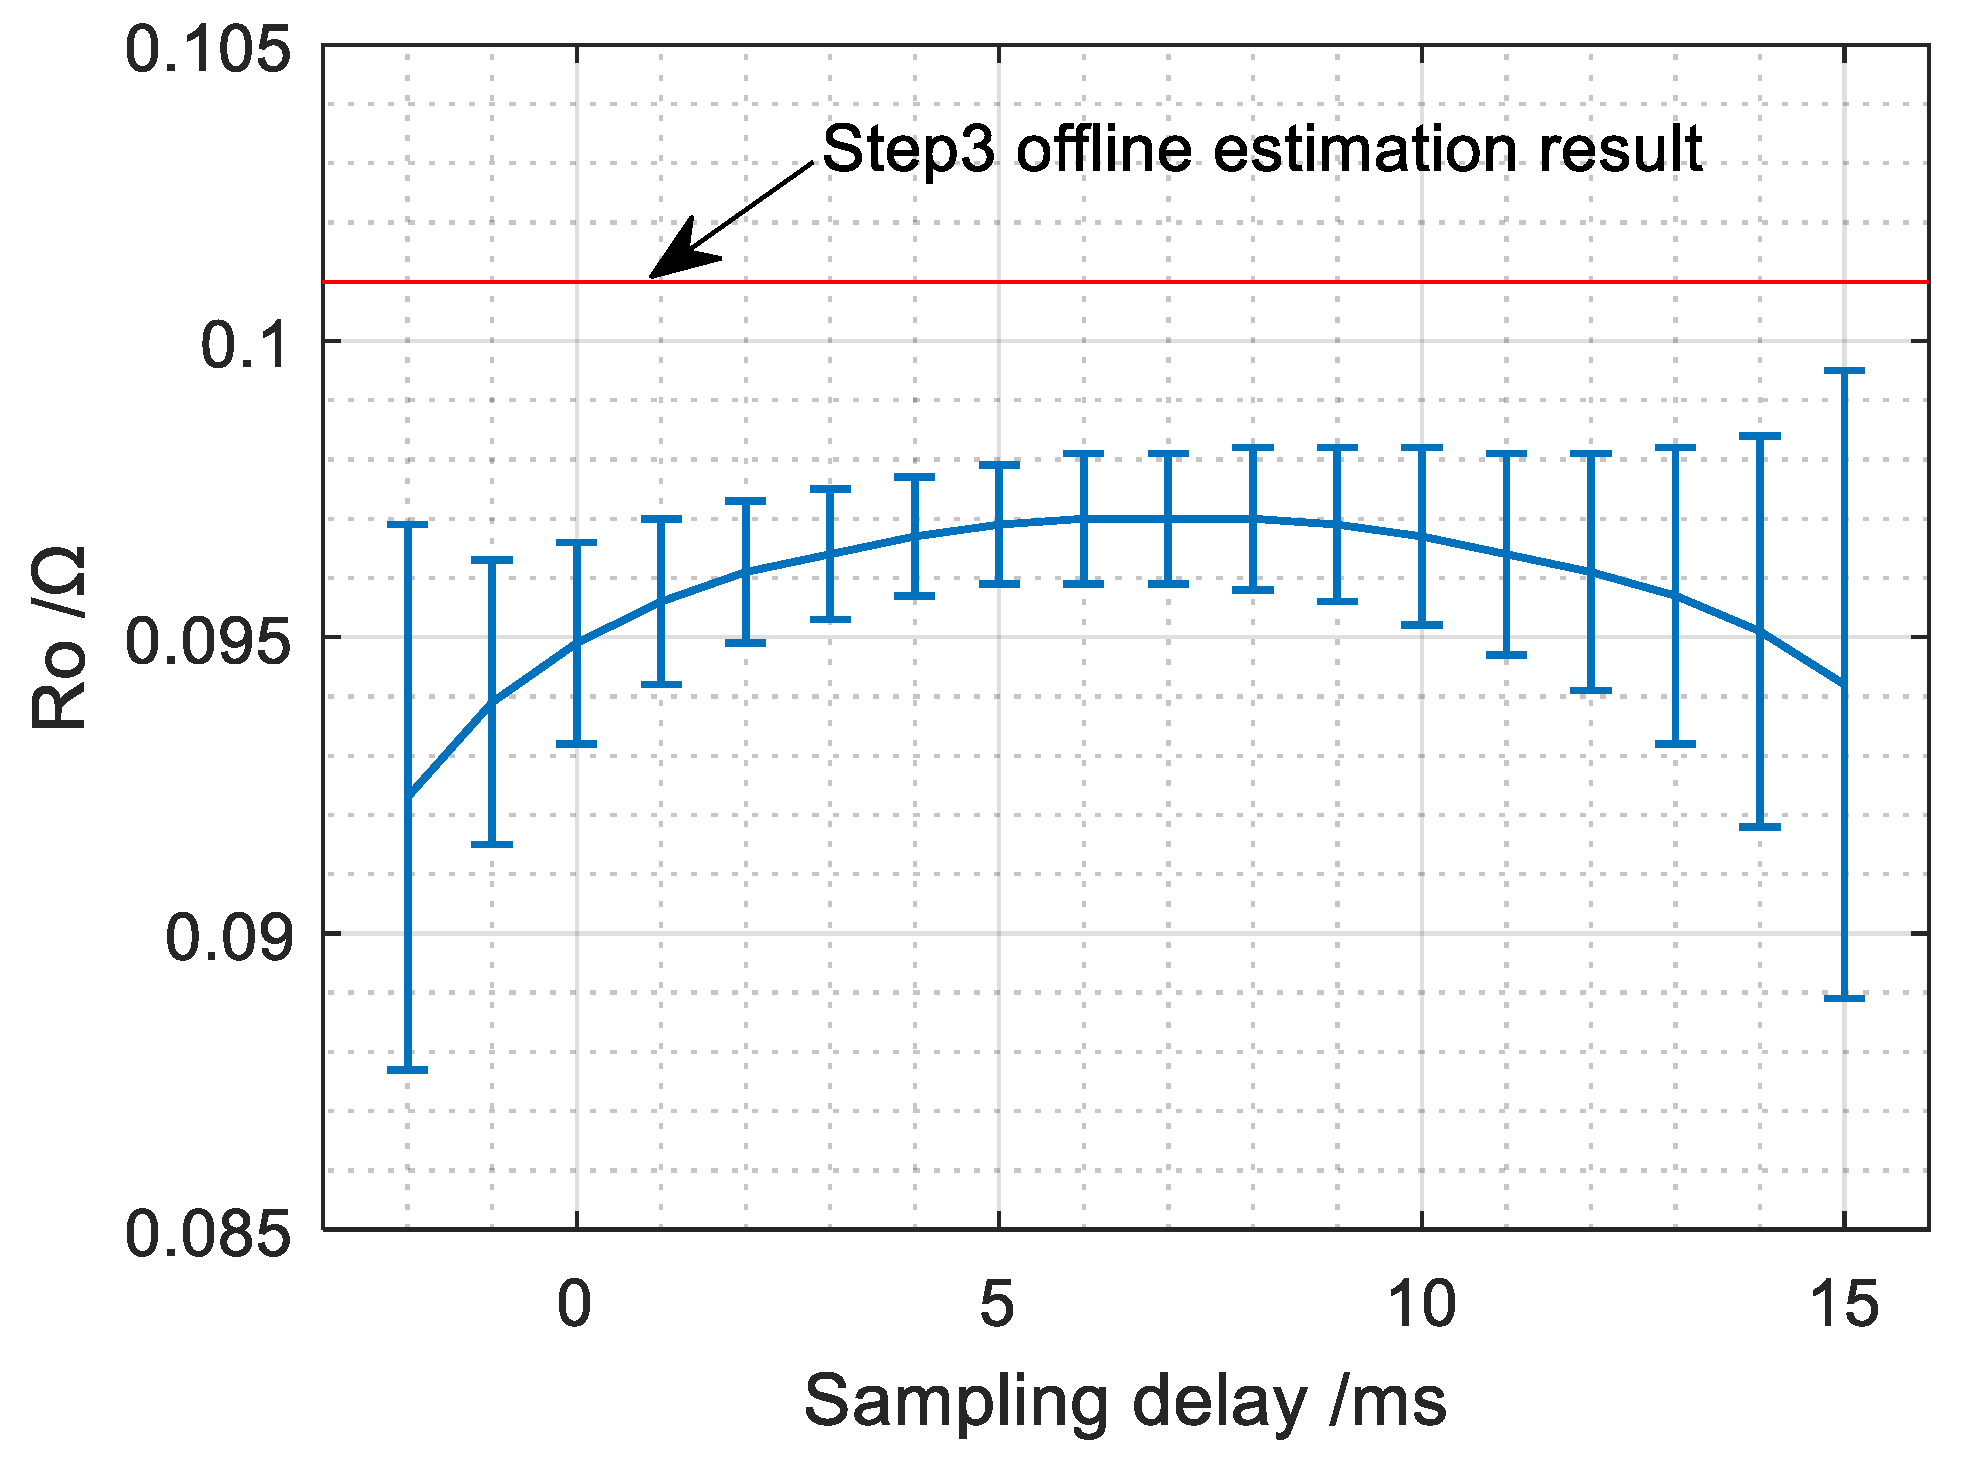
5.2. The Performance of the Optimized Estimation Method

Using the same data measured in step 2 simulated discharge, we online estimated battery parameters with the optimized estimation method described in Section 3. The sampling period, sampling delay and optimal forgetting factor λ were also set at 1 s, 0 ms and 0.98, respectively. The trajectories of estimated battery parameters are shown in Figure 11, in which the results of traditional estimation method are also present. For the OCV, the estimated results of the optimized method are similar to that of the traditional method, and estimation errors still exist. For the internal resistance, the estimation accuracy is significantly improved, and the fluctuation range is greatly reduced. The mean value and standard deviation of estimated internal insistences between 20 s and 120 s are 0.1 Ω and 0.28 mΩ, respectively, which are much better than that of traditional estimation method. Because the sampling delay is set at 0 ms, the optimized battery model shown by Equation (14) is equal to the traditional model shown by Equation (6). Hence, the improvement of estimation accuracy is mainly caused by optimizing the approximation of dIL(kT)/dt and dUt(kT + ε)/dt. It is necessary to adopt the first-order central difference instead of the first-order backward difference to improve the approximation accuracy.
Then, in order to compare the influence of sampling delay on optimized and traditional estimation methods, we changed the sampling delay of the data measured in step 2 to −2 ms and 6 ms, and then repeated the optimized estimation process. The estimation results are shown in Figure 12, in which the results of the traditional method under the same condition are also shown. The estimation results of the optimized estimation method are closer to the offline estimation results and their fluctuations are lower. This indicates that, with the optimized estimation method, the influence of sampling delay is reduced.
For the purpose of analyzing the influence of larger sampling delays on the optimized method, the sampling delay was set at −20 ms, −10 ms, 10 ms, 20 ms, and 30 ms. Then we repeated the optimized estimation method again. The results are shown in Figure 13. Although the sampling delay increased to −10 ms and 30 ms, the estimated internal resistance still converged well, reflecting that the tolerance range of sampling delay was increased. In addition, the influence of negative sampling delays was more serious than that of positive sampling delays. The reason is that negative sampling delays mean that the voltage sampling is ahead of current sampling, but the load current in the battery model is regarded as the excitation signal and the battery voltage is seen as the response signal. Sampling the response signal ahead has more effect on the parameter estimation.
Finally, we changed the sampling delay from −20 ms to 30 ms, repeated the optimized estimation process again and then calculated the mean and standard deviation of estimated internal resistances between 20 s and 120 s. The mean value and standard deviation are shown in Figure 14a,b, respectively, in which the results of traditional estimation method are also present. Three conclusions can be drawn: (1) For optimized estimation method, when the sampling delay is 3 ms, the estimation accuracy is the highest. The mean value and standard derivation of estimated internal resistances are 0.1001 Ω and 0.26 mΩ, which is much closer to the offline result in step 3. (2) Under the same sampling delay condition, the estimation accuracy of the optimized method is higher than that of the traditional method. The mean value of the estimated internal resistances is closer to offline results and the fluctuation range is smaller. (3) The tolerance range of sampling delay of the optimized method is much larger than that of the traditional method. While the sampling delay reaches −10 ms or 30 ms, the estimation accuracy is still higher than what can be achieved by the traditional method. In summary, the optimized method for online estimating battery parameters has higher estimation accuracy and effectively improves the tolerance range of sampling delay.

6. Conclusions

In this paper, we analyzed the influence of sampling delay on the online estimation of battery parameters based on the first-order RC model, and proposed an optimized estimation method with an optimized mathematical battery model. A modular battery test system with sampling frequency at 1 KHz and with synchronization accuracy below 0.5 μs was developed. Through processing the data set acquired from NCM lithium-ion batteries, the theoretical analysis results and the proposed estimation method were verified. The results show that, with the sampling delay increasing, the average error and fluctuation range of estimated results would become larger. For the traditional estimation method, when the sampling delay is shorter than −2 ms or larger than 15 ms, the convergence of estimated results would be difficult. The negative sampling delay means that the sampling instant of voltage is ahead of that of current. With the proposed optimized estimation method, the estimation accuracy is improved, and the tolerance range of sampling delay is increased from [−2 ms, 15 ms] to [−10 ms, 30 ms].

Author Contributions

Conceptualization, B.J. and F.C.; methodology, B.J. and F.C.; software, B.J.; validation, B.J.; formal analysis, B.J.; investigation, B.J. and Z.C.; resources, B.J. and F.C.; writing—original draft preparation, B.J. and Z.C.; writing—review and editing, B.J. and Z.C.; supervision, F.C.

Funding

This research received no external funding.

Acknowledgments

The authors gratefully acknowledge the helpful comments and suggestions of the reviewers which have improved the presentation.

Conflicts of Interest

The authors declare no conflict of interest.

References

  1. Lu, L.; Han, X.; Li, J.; Hua, J.; Ouyang, M. A Review on the Key Issues for Lithium-Ion Battery Management in Electric Vehicles. J. Power Sources 2013, 226, 272–288. [Google Scholar] [CrossRef]
  2. Zheng, Y.; Ouyang, M.; Han, X.; Lu, L.; Li, J. Investigating the Error Sources of the Online State of Charge Estimation Methods for Lithium-Ion Batteries in Electric Vehicles. J. Power Sources 2018, 377, 161–188. [Google Scholar] [CrossRef]
  3. Berecibar, M.; Gandiaga, I.; Villarreal, I.; Omar, N.; Van Mierlo, J.; Van den Bossche, P. Critical Review of State of Health Estimation Methods of Li-Ion Batteries for Real Applications. Renew. Sustain. Energy Rev. 2016, 56, 572–587. [Google Scholar] [CrossRef]
  4. Lee, S.; Kim, J.; Lee, J.; Cho, B.H. State-Of-Charge and Capacity Estimation of Lithium-Ion Battery Using a New Open-Circuit Voltage Versus State-Of-Charge. J. Power Sources 2008, 185, 1367–1373. [Google Scholar] [CrossRef]
  5. Pattipati, B.; Balasingam, B.; Avvari, G.V.; Pattipati, K.R.; Bar-Shalom, Y. Open Circuit Voltage Characterization of Lithium-Ion Batteries. J. Power Sources 2014, 269, 317–333. [Google Scholar] [CrossRef]
  6. Remmlinger, J.; Buchholz, M.; Meiler, M.; Bernreuter, P.; Dietmayer, K. State-Of-Health Monitoring of Lithium-Ion Batteries in Electric Vehicles by On-Board Internal Resistance Estimation. J. Power Sources 2011, 196, 5357–5363. [Google Scholar] [CrossRef]
  7. Ramadesigan, V.; Northrop, P.W.; De, S.; Santhanagopalan, S.; Braatz, R.D.; Subramanian, V.R. Modeling and Simulation of Lithium-Ion Batteries from a Systems Engineering Perspective. J. Electrochem. Soc. 2012, 159, R31–R45. [Google Scholar] [CrossRef]
  8. Li, J.; Wang, L.; Lyu, C.; Wang, H.; Liu, X. New Method for Parameter Estimation of an Electrochemical-Thermal Coupling Model for LiCoO2 Battery. J. Power Sources 2016, 307, 220–230. [Google Scholar] [CrossRef]
  9. Kang, L.; Zhao, X.; Ma, J. A New Neural Network Model for the State-Of-Charge Estimation in the Battery Degradation Process. Appl. Energy 2014, 121, 20–27. [Google Scholar] [CrossRef]
  10. Charkhgard, M.; Farrokhi, M. State-Of-Charge Estimation for Lithium-Ion Batteries Using Neural Networks and EKF. IEEE Trans. Ind. Electron. 2010, 57, 4178–4187. [Google Scholar] [CrossRef]
  11. Lai, X.; Zheng, Y.; Sun, T. A Comparative Study of Different Equivalent Circuit Models for Estimating State-Of-Charge of Lithium-Ion Batteries. Electrochim. Acta 2018, 259, 566–577. [Google Scholar] [CrossRef]
  12. Nejad, S.; Gladwin, D.T.; Stone, D.A. A Systematic Review of Lumped-Parameter Equivalent Circuit Models for Real-Time Estimation of Lithium-Ion Battery States. J. Power Sources 2016, 316, 183–196. [Google Scholar] [CrossRef]
  13. Wang, S.; Verbrugge, M.; Wang, J.S.; Liu, P. Power Prediction from a Battery State Estimator that Incorporates Diffusion Resistance. J. Power Sources 2012, 214, 399–406. [Google Scholar] [CrossRef]
  14. Kalawoun, J.; Biletska, K.; Suard, F.; Montaru, M. From a Novel Classification of the Battery State of Charge Estimators toward a Conception of an Ideal One. J. Power Sources 2015, 279, 694–706. [Google Scholar] [CrossRef]
  15. Rahimi-Eichi, H.; Baronti, F.; Chow, M. Online Adaptive Parameter Identification and State-Of-Charge Coestimation for Lithium-Polymer Battery Cells. IEEE Trans. Ind. Electron. 2014, 61, 2053–2061. [Google Scholar] [CrossRef]
  16. Xiong, R.; He, H.; Sun, F.; Zhao, K. Online Estimation of Peak Power Capability of Li-Ion Batteries in Electric Vehicles by a Hardware-In-Loop Approach. Energies 2012, 5, 1455–1469. [Google Scholar] [CrossRef]
  17. Gao, W.; Zou, Y.; Sun, F.; Hu, X.; Yu, Y.; Feng, S. Data Pieces-Based Parameter Identification for Lithium-Ion Battery. J. Power Sources 2016, 328, 174–184. [Google Scholar] [CrossRef]
  18. Chen, X.; Shen, W.; Cao, Z.; Kapoor, A. A Novel Approach for State of Charge Estimation Based on Adaptive Switching Gain Sliding Mode Observer in Electric Vehicles. J. Power Sources 2014, 246, 667–678. [Google Scholar] [CrossRef]
  19. Lin, C.; Mu, H.; Xiong, R.; Shen, W. A Novel Multi-Model Probability Battery State of Charge Estimation Approach for Electric Vehicles Using H-Infinity Algorithm. Appl. Energy 2016, 166, 76–83. [Google Scholar] [CrossRef]
  20. Feng, T.; Yang, L.; Zhao, X.; Zhang, H.; Qiang, J. Online Identification of Lithium-Ion Battery Parameters Based on an Improved Equivalent-Circuit Model and Its Implementation on Battery State-Of-Power Prediction. J. Power Sources 2015, 281, 192–203. [Google Scholar] [CrossRef]
  21. He, H.; Xiong, R.; Guo, H. Online Estimation of Model Parameters and State-Of-Charge of LiFePO4 Batteries in Electric Vehicles. Appl. Energy 2012, 89, 413–420. [Google Scholar] [CrossRef]
  22. Chiang, Y.; Sean, W.; Ke, J. Online Estimation of Internal Resistance and Open-Circuit Voltage of Lithium-Ion Batteries in Electric Vehicles. J. Power Sources 2011, 196, 3921–3932. [Google Scholar] [CrossRef]
  23. Stuart, T.A.; Zhu, W. Modularized Battery Management for Large Lithium Ion Cells. J. Power Sources 2011, 196, 458–464. [Google Scholar] [CrossRef]
  24. Kong, X.; Zheng, Y.; Ouyang, M.; Li, X.; Lu, L.; Li, J.; Zhang, Z. Signal Synchronization for Massive Data Storage in Modular Battery Management System with Controller Area Network. Appl. Energy 2017, 197, 52–62. [Google Scholar] [CrossRef]
  25. Hu, X.; Li, S.; Peng, H. A Comparative Study of Equivalent Circuit Models for Li-Ion Batteries. J. Power Sources 2012, 198, 359–367. [Google Scholar] [CrossRef]
  26. He, H.; Zhang, X.; Xiong, R.; Xu, Y.; Guo, H. Online Model-Based Estimation of State-Of-Charge and Open-Circuit Voltage of Lithium-Ion Batteries in Electric Vehicles. Energy 2012, 39, 310–318. [Google Scholar] [CrossRef]
  27. Xiong, R.; Sun, F.; Gong, X.; Gao, C. A Data-Driven Based Adaptive State of Charge Estimator of Lithium-Ion Polymer Battery Used in Electric Vehicles. Appl. Energy 2014, 113, 1421–1433. [Google Scholar] [CrossRef]
  28. Jiang, B.; Chen, M.; Chen, F. A Network Interface Device for Networked Control System with Time-Driven Mode. Microprocess. Microsyst. 2019, 64, 1–11. [Google Scholar] [CrossRef]
  29. Jiang, B.; Chen, M.; Chen, F. A Clock Drift Compensation Method for Synchronous Sampling in Sensor Networks. Meas. Sci. Technol. 2019, 30, 25103. [Google Scholar] [CrossRef]
  30. Pan, C.; Banks, C.E.; Song, W.; Wang, C.; Chen, Q.; Ji, X. Recent Development of LiNixCoyMnzO2: Impact of Micro/Nano Structures for Imparting Improvements in Lithium Batteries. Trans. Nonferr. Met. Soc. 2013, 23, 108–119. [Google Scholar] [CrossRef]
  31. Sun, F.; Xiong, R.; He, H.; Li, W.; Aussems, J.E.E. Model-Based Dynamic Multi-Parameter Method for Peak Power Estimation of Lithium–Ion Batteries. Appl. Energy 2012, 96, 378–386. [Google Scholar] [CrossRef]
Figure 1. The schematic diagram of the first-order resistor–capacitor (RC) model.
Energies 12 01878 g001
Figure 2. The influence of sampling delay on the mathematical battery model.
Energies 12 01878 g002
Figure 3. The schematic diagram of the monitor node for lithium-ion battery pack.
Energies 12 01878 g003
Figure 4. The block diagram of the battery test system.
Energies 12 01878 g004
Figure 5. The self-defined outflow current curve of the cell being tested.
Energies 12 01878 g005
Figure 6. The terminal voltage curve of the cell being tested.
Energies 12 01878 g006
Figure 7. The trajectories of estimated battery parameters with sampling delay at 0 ms.
Energies 12 01878 g007
Figure 8. The trajectories of estimated internal resistance with negative sampling delays.
Energies 12 01878 g008
Figure 9. The trajectories of estimated internal resistance with positive sampling delays.
Energies 12 01878 g009
Figure 10. The mean value and standard deviation of estimated internal resistance under different sampling delays.
Energies 12 01878 g010
Figure 11. The parameter trajectories obtained by the optimized estimation method with sampling delay at 0 ms.
Energies 12 01878 g011
Figure 12. The trajectories of estimated internal resistance obtained by the optimized estimation method with sampling delay at −2 ms and 6 ms.
Energies 12 01878 g012
Figure 13. The trajectories of estimated internal resistance under larger sampling delays.
Energies 12 01878 g013
Figure 14. The mean value and standard deviation of estimated internal resistances under different sampling delays.
Energies 12 01878 g014
Table 1. The specifications of ICR18650-22P lithium-ion battery.
ItemSpecification
CathodeLithium-ion NCM (active material)
Polyvinylidene fluoride (binder)
Carbon black (conductive material)
AnodeGraphite (active material) Polyvinylidene fluoride (binder)
ElectrolyteOrganic solvents, lithium salt
Typical capacity2150 mAh (0.2C, 2.75 V discharge)
Maximum discharge current10 A (Continuous discharge)
Maximum charge current2.15 A (1C)
Nominal voltage3.62 V (1C discharge)
Charging voltage4.2 V ± 0.05 V
Discharge cut-off voltage2.75 V
Table 2. The offline estimation results of battery parameters.
Data SourceBattery ParameterEstimation Result
Step 1 pulse dischargeUoc3.945 V
Ro0.103 Ω
Step 3 pulse dischargeUoc3.913 V
Ro0.101 Ω

