Article

Market and Technological Perspectives for the New Generation of Regional Passenger Aircraft

by
Anita Prapotnik Brdnik
*,†,
Rok Kamnik
,
Maršenka Marksel
and
Stanislav Božičnik
Faculty of Civil Engineering, Transportation Engineering and Architecture, University of Maribor, 2000 Maribor, Slovenia
*
Author to whom correspondence should be addressed.
These authors contributed equally to this work.
Energies 2019, 12(10), 1864; https://doi.org/10.3390/en12101864
Submission received: 17 April 2019 / Revised: 9 May 2019 / Accepted: 10 May 2019 / Published: 16 May 2019

Abstract

:
This article describes the extent to which hybrid aircraft and all-electric aircraft can present a solution for reducing HC, CO, and NO x emissions and noise in the vicinity of airports, in the category of regional passenger aircraft. The goal of the article is to identify, basing on aircraft technical characteristics and market demands, in which sectors of air transport can all-electric or hybrid aircraft be most feasibly introduced. Firstly, a simple theoretical model based on a connection between the aircraft mass and aircraft energy consumption is used to calculate basic technical characteristics and limitations of hybrid and all-electric aircraft. Second, market demands for regional aircraft are presented and discussed, with the intention of recognising the possibilities of replacing conventional aircraft with all-electric and hybrid aircraft models in regional air transport in the near future. Third, quantity of HC, CO, and NO x , CO gas emissions of regional aircraft in Europe was calculated to recognise the possible reduction of gas emissions if hybrid and all-electric aircraft would be implemented.

1. Introduction

Air passenger transport is rapidly growing. The associated revenue, based on the calculation of passenger kilometres (RPKs), is projected to grow annually, at a rate over of 4%, within the next 20 years. Although the fastest growth rates are expected in regions with emerging economies, such as Pacific Asia, the Middle East, Africa, and Latin America, RPKs in the more mature European market are still expected to grow at rate of 3.7% [1]. Likewise, the world fleet is expected to increase by 25,000 units from 2018 to 2037, leading to the total number of 53,600 aircraft at the end of 2037 [2]. On the other hand, main European airports are expected to reach their full capacity by 2030 [3]. If airports do not grow to meet the demand, this can lead to significant economical and other deficits [4]. One of the main obstacles preventing the growth of large-airport hubs is the environmental impact of air transport to the local environment. Larger European hubs are already inducing flight restrictions, such as disallowing take-off and landing during night hours or charging fees for gas emissions [3]. Moreover, the Advisory Council for Aeronautical Research in Europe (ACRE) has set a target to reduce NO x emissions in air transport by 80% by the end of 2020 and by 90% by the end of 2050. Likewise, the target for noise reduction is 50% by the end of 2020 and 65% by the end of 2050 [5]. Therefore, new aircraft designs should focus on solutions that can significantly reduce noise and emissions for the new generation of aircraft in the vicinity of airports.
One of the possible solutions would be aircraft electrification. Although electrification of land transport has experienced huge progress in recent years, the same outcome cannot be expected in the aircraft industry. The main reason for this is a low specific energy of batteries, of only 0.1–0.25 kWh/kg [6], compared to the energy density of kerosene, 12 kWh/kg (or 4 kWh/kg, if the efficiency of an inner combustion engine is also taken into account [7]). Moreover, the specific energy of batteries is not expected to increase significantly in the near future [6]. Consequently, all-electric aircraft would be significantly heavier and larger than conventional aircraft, due to batteries, and would reach notably shorter ranges. The possible impact of all-electric aircraft on the environment, in the case that the specific energy of batteries could be significantly increased, is studied in [8]. Apart form all-electric aircraft, a concept of more electric propulsion system is also proposed in [9] and compared with convectional and hydrogen aircraft in [10].
A hydrogen fuel-cell aircraft would be the key to bridle the low specific energy problem of batteries. Unlike batteries, hydrogen has a higher energy density than kerosene. Moreover, as the abundance of fossil fuels is limited, hydrogen is expected to be one of the major future fuels [11,12]. Such aircraft would use hydrogen in fuel-cells to provide an electric current, which would, among other things, drive an electro-motor connected to a propeller. This would present an emission-free ( H 2 O only), low noise solution. The first prototype of a hydrogen fuel-cell ultralight aircraft has already been built by Deutsches Zentrum für Luft und Raumfahrt (DLR) [13]. Nevertheless, fuel-cell technology is still under development and commercial hydrogen fuel-cell passenger aircraft are not expected in the near future [14,15]. Moreover, as discussed in Section 2.3, due to the high mass of the hydrogen tanks, fuel-cell technology could present a disadvantage for small passenger aircraft. General concepts of hydrogen usage in aircraft industry are discussed in [16,17,18]. Technical details of fuel-cell aircraft and expected performance can be found in [19,20], while mass and shape optimisation of hydrogen aircraft for different ranges can be found in [21,22].
A feasible, medium-term solution would be hybrid aircraft. A hybrid aircraft is a propeller-driven aircraft with a combined propulsion system. Two types of hybrid aircraft are possible: parallel and serial. In a parallel hybrid aircraft, the propeller can be rotated by either a battery-driven electro-motor or by an inner-combustion engine [23,24]. During take-off and the first stages of ascent, the propeller would be driven solely by the electro-motor and, afterwards, the inner-combustion engine would take over the traction. Moreover, during descent, the battery would be partially refilled and would provide enough energy for taxiing. In a serial hybrid aircraft, the propeller is driven solely by the electro-motor. The electricity is provided either by a battery or by a generator that produces electricity from conventional fuel. The advantage of a serial hybrid aircraft is that it does not require mechanical power transfer between the electro-motor and the combustion engine, and that the generator can provide additional power during take-off, if needed. As pollutants such as HC, CO, and NO x as well as noise are problematic only in the vicinity of airports, hybrid aircraft can present a good solution by reducing minimal emissions near airports. Nevertheless, they cannot significantly reduce the overall emission of the greenhouse gases CO 2 and NO x . A hybrid ultra-light aircraft Panthera has already been developed by the Slovenian company Pipistrel [25]. Some of the potential benefits of hybrid aircraft are presented in [23,26].
In this article, the possibilities of introducing all-electric and/or hybrid aircraft in the segment of regional air transport services in the near future will be discussed. It is assumed that the technical characteristics and performance of the aircraft components, such as specific energy of batteries and energy efficiency of components, are equal to what can be achieved today in ultralight aircraft. As all-electric, fuel-cell, and hybrid aircraft are propeller-driven, their technological characteristics and flight performances are similar to conventional turboprop aircraft. As turboprop technology is used only in regional aircraft, this article concentrates on the regional air transport segment. In Section 2, the basic technical characteristics and requirements of regional all-electric and hybrid aircraft are studied and presented. Based on these requirements, it is identified if, and to what extent, the solutions and technologies which have already been successfully implemented and tested in the ultra-light aircraft segment can be applied to the segment of regional commercial passenger (up to 100-seater) aircraft. Due to the technical complexity of fuel-cell technology and the current high prices of hydrogen (when compared to kerosene), fuel-cell aircraft would not be considered as a feasible near-future solution. Nevertheless, some remarks on fuel-cell aircraft sizing characteristics are made at the end of Section 2. In Section 3, an overview of the regional aircraft passenger transport market in Europe is presented, with the intention of identifying the most feasible segments for all-electric and hybrid aircraft. In Section 4, a calculation of the emissions of the HC, CO, and NO x gas pollutants is presented to identify to what extent all-electric or hybrid aircraft could reduce environmental impacts in the EU. The concluding remarks are given in Section 5.

2. Technological Characteristics of Regional Electric and Hybrid Aircraft

In this section, technological characteristics, such as energy consumption and required power output during take-off, are calculated. In Section 2.1, the energy consumption of an aircraft is estimated. From this estimation, the maximal range of an all-electric aircraft is deduced. For ranges that cannot be covered by all-electric aircraft, either hybrid or fuel-cell aircraft can be used. In Section 2.2, we calculate the power output required for take-off and and ascent, and estimate the size of battery which can provide this requirement. Finally, in Section 2.3, a rough estimation of hydrogen fuel consumption is discussed, taking into account that more a precise estimation can be given only after the exact shape of the fuel-cell aircraft is known.

2.1. An All-Electric Aircraft

To estimate energy consumption and the range of an all-electric aircraft, a procedure similar to the one described in [7] is followed, with a slight difference due to the fact that the mass of the electric aircraft does not change with the flight, due to fuel consumption.
The total mass of a conventional passenger aircraft at take-off (m) comprises the mass of the empty aircraft ( m e ); the mass of the crew and passengers, including luggage ( m p ); and the mass of the fuel ( m f ). In the electric aircraft, fuel is replaced with batteries ( m b ):
m = m e + m p + m b .
An average passenger has a mass of 80 kg and can carry about 20 kg of luggage [7]. The crew usually travels lighter but, for simplicity, an average total on-board mass of passengers, crew, and luggage of 100 kg per person is assumed. The exact estimation of m e can be troublesome, but the data on existing aircraft show that the ratio m e / m for a turboprop aircraft is 0.62, and does not vary significantly for different models (see Figure 8.1 in [7]). For larger aircraft, the ratio slightly decreases with an increase in aircraft mass, but is still around 0.5 for an aircraft with a hundred-fold larger mass (see Figure 9.27 in [7]). Moreover, the ratio m e / m is 0.62 for all three versions of the ultralight aircraft Panthera—conventional, hybrid, and electric [27]. The mass of fuel depends on the total energy consumed in all flight stages: take-off, climb, cruise, descent, and taxi. As cruise represents the major portion of an average commercial passenger flight, for simplicity, the energy consumption is calculated based only on this flight phase. Below, the energy consumption in other flight stages is evaluated and discussed as well.
During cruise at constant altitude, energy is consumed to overcome a drag force. As drag is composed of a lift-induced drag that decreases with speed and a parasitic drag force that increases with speed, an aircraft flies with the cruise speed v c , where the sum of the drag forces is minimal
v c = 2 ( m g / S W ) ρ C l ,
where g is gravitational acceleration ( g = 9.81 m/s), S W is the wing surface, ρ is the air density at flying altitude, and C l is a lift coefficient that depends on the wing shape. At this speed, the total drag force is proportional to the lift, which, on the other hand, equals the weight of the aircraft. Therefore, the energy needed to overcome the drag is
E 0 = m g s ( L / D ) m a x ,
where m is the mass of the aircraft, ( L / D ) m a x is the maximal lift-to-drag coefficient, and s is travelled distance (range). For small passenger aircraft, a typical value of ( L / D ) m a x achievable today is 20 [28]. The energy consumption of an aircraft is therefore
E = m g s ( L / D ) m a x μ p μ e
where μ p is the efficiency of propeller and μ e is the efficiency of power-train. By taking μ p = 0.8 [7] and μ e = 0.8 [29], the energy consumption of an aircraft can be estimated as
E m s = w s = 0.22 kWh / km t .
The mass of the batteries is, therefore,
m b m = g s ( L / D ) m a x μ p μ e ρ E ,
where ρ E is the specific energy of the batteries, g is defined in Equation (2), ( L / D ) m a x and s are defined in Equation (3) and μ p and μ e are defined in Equation (4). Note that the above equation slightly differs from the similar equation for a fuel mass of conventional aircraft, where, instead of m b m , one has ln m f m . This difference occurs due to the fact that, during flight, fuel is used up and the aircraft becomes lighter, while the mass of the batteries stays constant. Combining Equations (1) and (6) yields the equation of range:
s = ρ E 1 . 6 w s 0.61 N · 100 kg m e ,
where N is the number of passengers, ρ E is defined in Equation (6), w s is defined in Equation (5) and m e is defined in Equation (1). The specific energy of lithium-ion batteries varies within 0.1–0.25 kWh/kg [6], depending on the specific type of battery. Although it is appealing to use batteries with maximal specific energy, other factors, such as specific power, life-cycle, and safety, have to be taken into account as well. Therefore, if specific energies are allowed to vary in this range, and by taking w s = 0.22 kWh/km t, one can obtain the results presented in Figure 1. Figure 1 shows the estimated empty mass of a battery-driven aircraft that is needed to carry a given payload to a given distance. The green area represents an aircraft with a 500 kg payload (e.g., pilot and four passengers), the blue area represents an aircraft with a 2000 kg payload (e.g., one pilot and 19 passengers), and the orange area represents an aircraft with a 7000 kg payload. The upper line represents a solution when the batteries with a specific energy of 0.25 kWh/kg are used, while the lower line represents a solution when batteries with a specific energy of 0.1 kWh/kg are used. As shown in Figure 1, none of the aircraft, with 500 kg, 2000 kg, or 7000 kg payload (including crew), can reach a range beyond 400 km. Furthermore, the mass of an aircraft needed to carry a given payload to a given range increases much faster with increasing range for larger aircraft; therefore, batteries are more convenient for aircraft in an ultralight category (up to eight passengers).
Next, energy consumption during take-off and ascent is estimated. To reach the final altitude h and a certain cruise speed v c , an aircraft has to gain kinetic and potential energy, while overcoming the drag force:
E 0 , t = 1 2 m v c 2 + m g h + F D s ,
where m is the mass of the aircraft, F D is the drag force, and s is the distance covered by the aircraft during ascent. As the take-off distance is relatively short, the impact of the drag force is only taken into account during the climb. During the climb, the aircraft is rotated by a climb angle φ from the horizontal position. As the drag force F D points in the opposite direction of a flight, while the lift force F L stays vertical, F D and F L are no longer perpendicular. Therefore, the aircraft uses flaps to maximise the L / D ratio in this position. Furthermore, the aircraft flies with a somewhat higher speed than what would be the optimal cruise speed for that given height. Consequently, L / D during ascent is lower than ( L / D ) m a x , and we assume that L / D = 15 . As the energy loss term, due to the drag in Equation (8), is small compared to the terms for kinetic and potential energy gain, we expect to reach a reasonably good approximation of energy consumption during ascent, even though the precise value of L / D is not known. Therefore, the total energy consumption of the aircraft during ascent can be estimated as
E t = m g μ e μ p v c 2 2 g + h + s ( L / D ) = m g μ e μ p v c 2 2 g + h 1 + 1 sin ϕ ( L / D ) .
From Equation (8), it can be concluded that, to reach a cruise speed of around 500 km/h or to gain 1 km in altitude, an aircraft will use approximately the same amount of energy as that used for flying 25 km during cruise. As typical turboprop aircraft have cruise speeds between 400 km/h and 600 km/h and a ceiling at around 7600 m, for electric aircraft with similar characteristics, approximately 200 km could be deduced from the ranges given in Figure 1. With a lower ceiling, all-electric aircraft would gain on range, but would fly with a reduced cruise speed. In addition, energy has to be used for other functions as well, such as heating of the pilot cabin and passenger section. Likewise, for safety reasons, some additional energy has to be kept in reserve, triggering an even larger reduction in range.
A range of the electric aircraft could be somewhat extended by expanding the wing surface. Taking into account that wings represent one quarter of the aircraft empty weight [30], and assuming that only the mass of the wings and power-train increases by increasing the mass of the aircraft, while the mass of the fuselage stays the same, a vague estimation can be reached that the electric aircraft could achieve ranges of around 300 km, if only the wing area is increased by factor of four and the ratio between wing surface and surface of entire aircraft (wetted surface) is increased by a factor of two. However, this would cause a speed decrease of the electric aircraft during cruise, by a factor of two, as well (see Equation (2)).

2.2. A Hybrid Aircraft

In this subsection, the battery power and energy requirements for hybrid aircraft are discussed, with the intention of identifying the size of a battery needed to allow for all-electric take-off and ascent, according to a classical landing and take-off (LTO) cycle (see Section 4).
In hybrid aircraft, the battery has to provide enough power for the take-off and ascent. The required power is [7]
P = m g μ p μ e v c ( L / D ) m a x + v r . o . c ,
where m denotes a mass of an aircraft, v c denotes a cruise speed, v r . o . c denotes the rate of climb, and μ p and μ e denote the efficiencies of the propeller and the power-train, respectively. The battery power required by an aircraft to achieve specific cruise speeds ( v c ) and rates of climbs ( v r . o . c . ) is presented in Figure 2. Figure 2 (left) presents the power needed to maintain an aircraft at given speed at level flight (first term in Equation (10)) and therefore defines the maximal speed (and height) at witch aircraft can fly. Figure 2 (right) presents the excess power needed to achieve the wanted rate of climb—a rate at which aircraft gains height (second term in Equation (10)) and therefore determines the aircraft’s agility. The technical data of the hybrid aircraft, Panthera [27], agree with the power estimations presented in Figure 2. As a typical turboprop aircraft has a cruise speed between 400 km/h and 600 km/h and rate of climb between 6 m/s and 10 m/s, comparable hybrid aircraft would need a battery pack capable of providing 150–300 kW of power per tonne of aircraft mass. A LiFePo 4 battery pack with the required power output, a specific power of 2 kW/kg, and specific energy of 0.12 kWh/kg [31] would take up 7.5–15% of the overall aircraft mass, which is an acceptable solution, taking into account that the consumption in a serial hybrid aircraft can be further reduced, due to the better efficiency of a generator and electrical motor system, in comparison with the inner-combustion engine [29]. Moreover, such a battery pack would provide 9–18 kWh of energy per tonne of aircraft mass, enough for take-off and at least the first kilometre of the ascent, as presented in Figure 3.

2.3. Fuel-Cell Aircraft

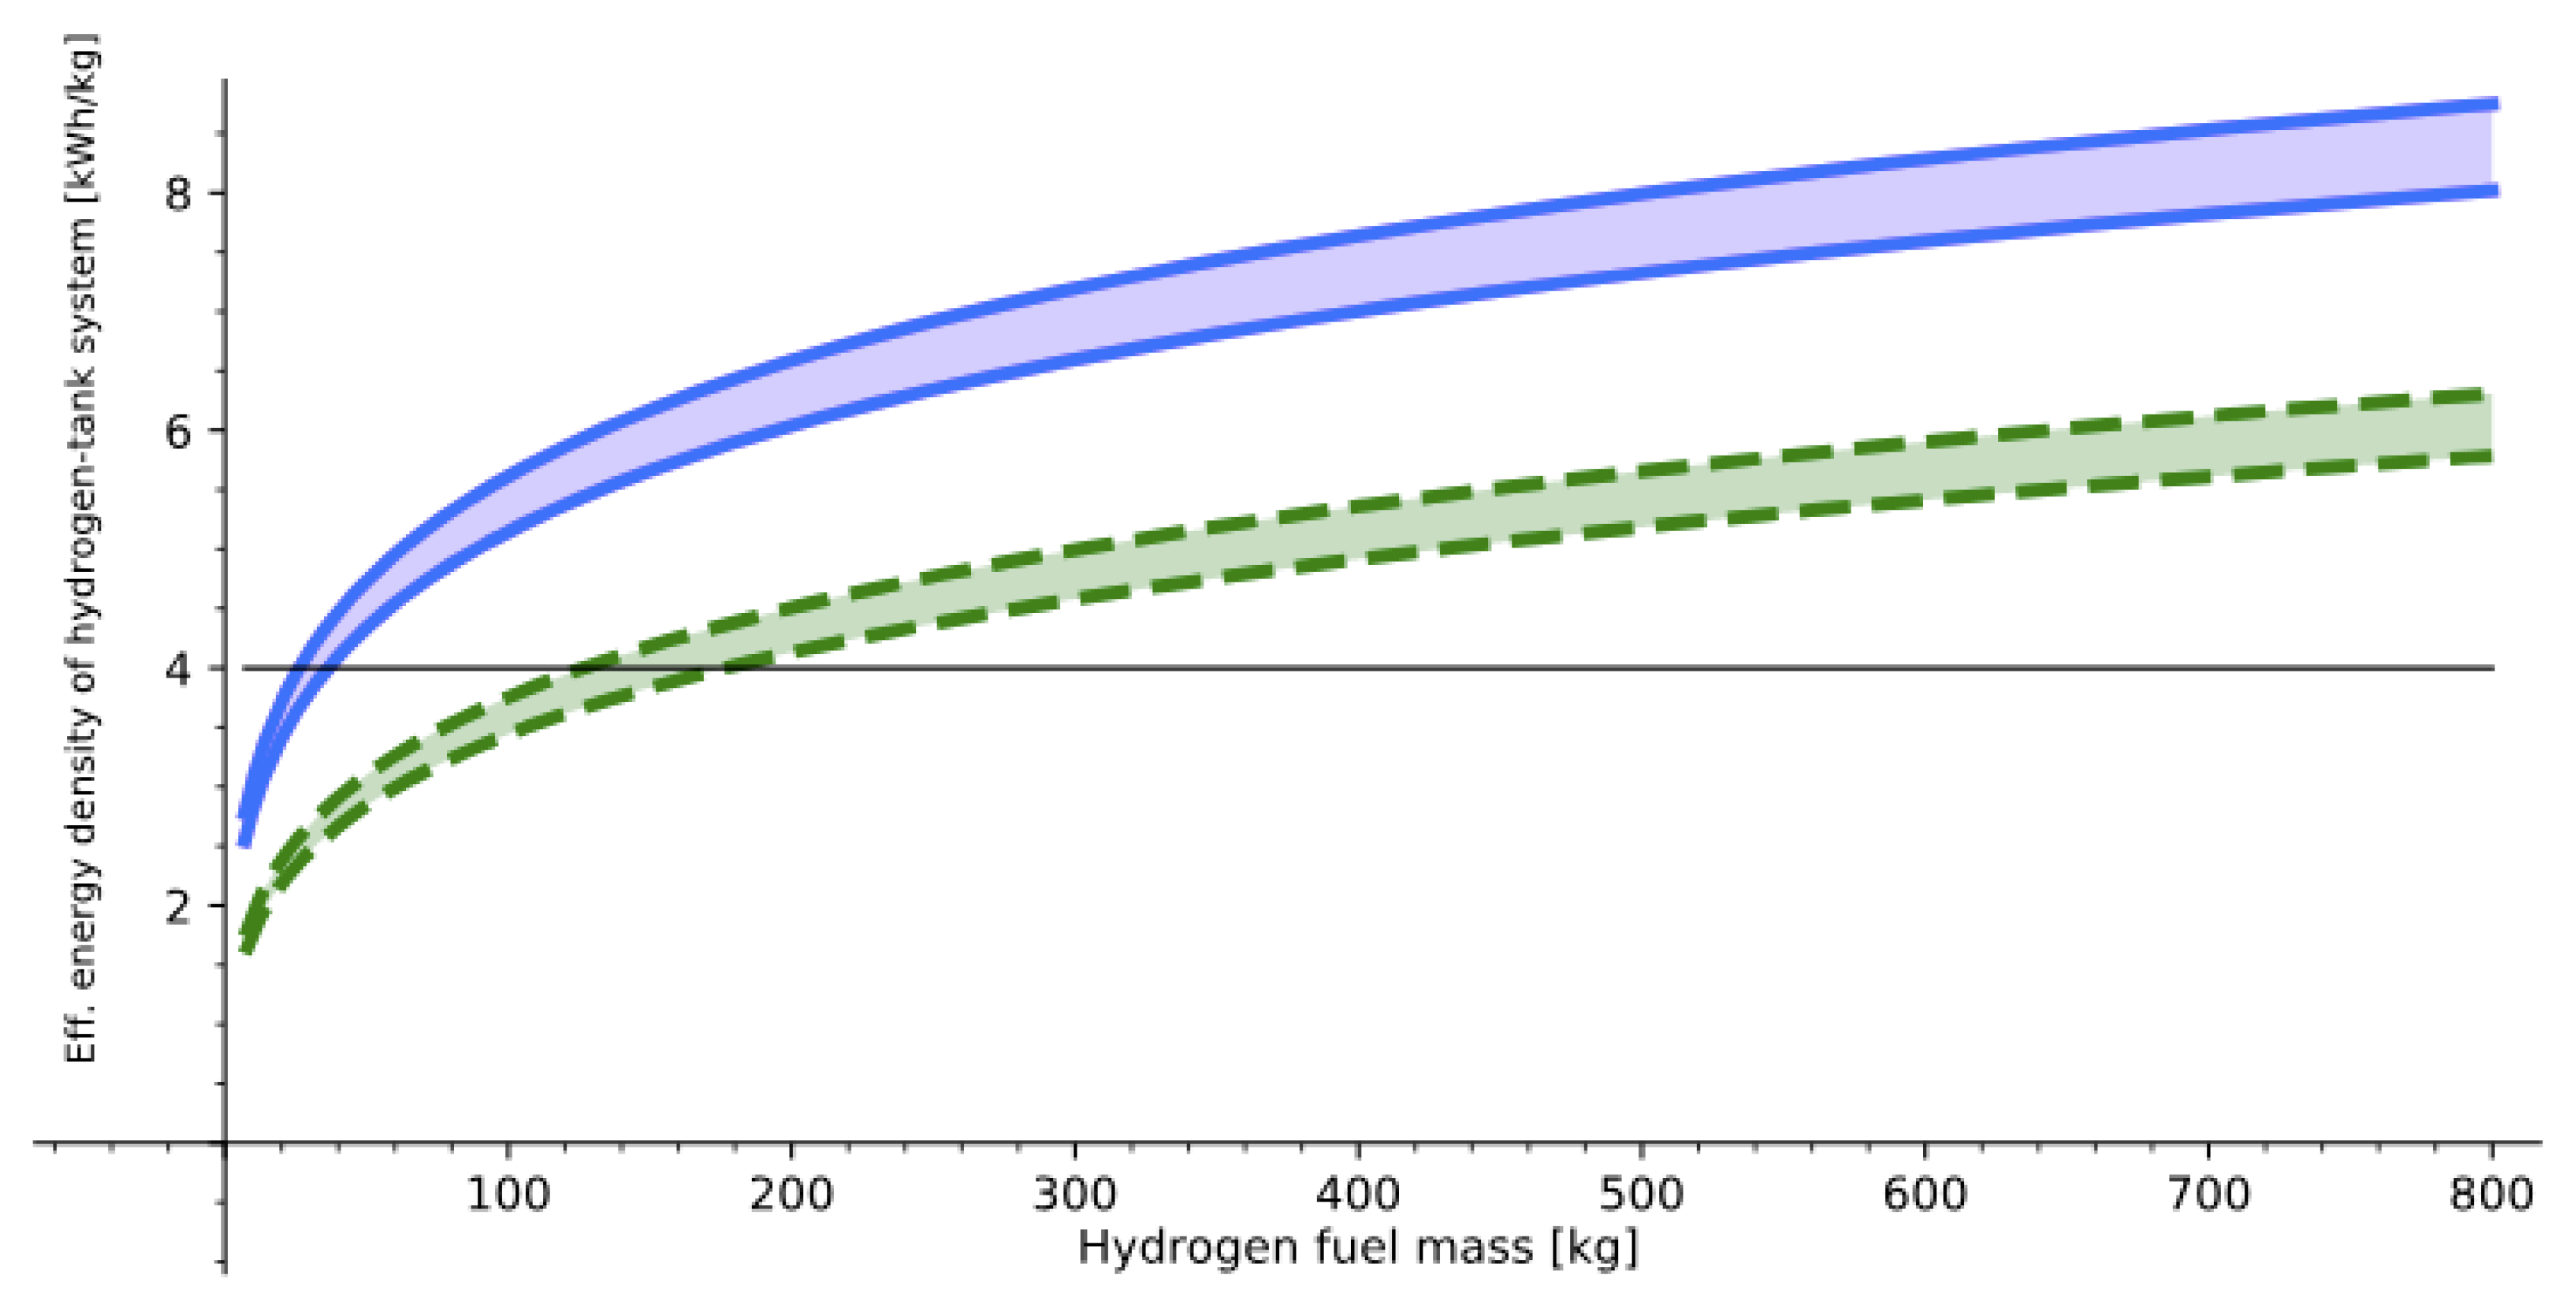
Using hydrogen as a fuel in the aircraft industry presents an advantage, due to its high energy density of 33 kWh/kg. Including fuel-cell [11] and power-train [29] efficiencies, this leads to 14–16 kWh/kg of effective energy density, which is four times higher than that of kerosene. Unfortunately, hydrogen is also very light, and can only be used compressed or liquefied; therefore, it requires dedicated tanks. A tank that would keep 4 kg of hydrogen, compressed to 700 bar, has a mass of 50 kg. Likewise, a tank that would keep 6.4 kg of liquefied hydrogen has a mass of 40 kg [32]. Therefore, an effective energy density of hydrogen and tank system is approximately 1 kWh/kg for compressed hydrogen, and 2 kWh/kg for liquefied hydrogen, which is (at present) 2–4 times lower than the energy density of kerosene. Fortunately, by expanding the tank, the volume over surface ratio grows. As the mass of a tank grows with the surface area of a tank and mass of a fuel grows with its volume, the effective density of a hydrogen-tank system would grow as the tank is enlarged, as shown in Figure 4. For comparison, a 19-seater aircraft with the same aerodynamic properties as a conventional aircraft would need approximately 200 kg of liquid hydrogen for a 500 km range.
Furthermore, the density of hydrogen compressed to 700 bar is 40 g/L and the density of liquid hydrogen is 71 g/L [11], meaning that liquid hydrogen and compressed hydrogen tanks would be three and five times larger than the kerosene tanks, respectively. On the other hand, this would lead to an increase of overall surface area to wing area ratio and, consequently, a reduction of the aerodynamic characteristic of the aircraft. The maximal lift-over-drag ratio ( L / D ) m a x could be reduced from 20 to 17 [22]. Therefore, in a best-case scenario, a 19-seater aircraft could have a similar mass to a conventional aircraft, while larger aircraft could be even lighter.

3. Estimation of Potential Number of Aircraft That Could Be Replaced with All-Electric or Hybrid Aircraft in Near Future

In this section, the potential number of aircraft that could be replaced with all-electric or hybrid aircraft in near future is discussed.
Conventional passenger aircraft are usually classified into three categories: single-aisle (narrow-body), twin-aisle (wide-body), and regional aircraft. Regional aircraft are the smallest type of aircraft, which can typically carry up to 100 passengers. Depending on the engine type, regional aircraft can be further divided into regional jets and turboprops. In turboprop engines, the energy released from combustion is used to rotate a propeller. The propeller then provides the thrust that drives the aircraft. On the other hand, the energy released by combustion in jet engines is used to accelerate exhaust gases backwards, providing the thrust that pushes the aircraft forwards. Due to the difference in mechanism, turboprop engines can provide less thrust than jet engines, but can use fuel more efficiently. Consequently, turboprop aircraft fly at lower attitudes and with lower speeds than regional jets, and are more suited for shorter ranges. As all-electric and hybrid aircraft are also driven by a propeller, their flight performance is very similar to turboprop aircraft. Therefore, it can be assumed that hybrid aircraft could replace turboprop aircraft, but not necessarily jet aircraft. The latter would occur only if the ecological impact prevails over the speed advantages of jet aircraft. According to FlightGlobal [2], it has been predicted that, in the period from 2018 to 2037, over 45,000 new aircraft will enter the flight service, either as a replacement for old models or due to the increase in passenger aircraft traffic; furthermore, 16% of these aircraft will be used in Europe. Around 4000 of all new aircraft will be regional jets and around 3000 turboprops. Therefore, potentially, around 40% of newly-produced regional aircraft could be exchanged for hybrid aircraft without any loss in flight performance (around 500 being in the EU).
Furthermore, the International Civil Aviation Organization (ICAO) divides commercial air passenger transport services into scheduled and non-scheduled flights. Scheduled flights are defined as flights that are scheduled and performed according to a published timetable, or flights that are so regular that they can establish a recognisably systematic series. In either case, they are open to direct booking by the public. Non-scheduled flights, on the other hand, do not operate according to a published schedule, and are sold to public individuals. Non-scheduled flights can be further divided into charter and on-demand flights, the latter including air-taxi, commercial business aviation, and other similar services.
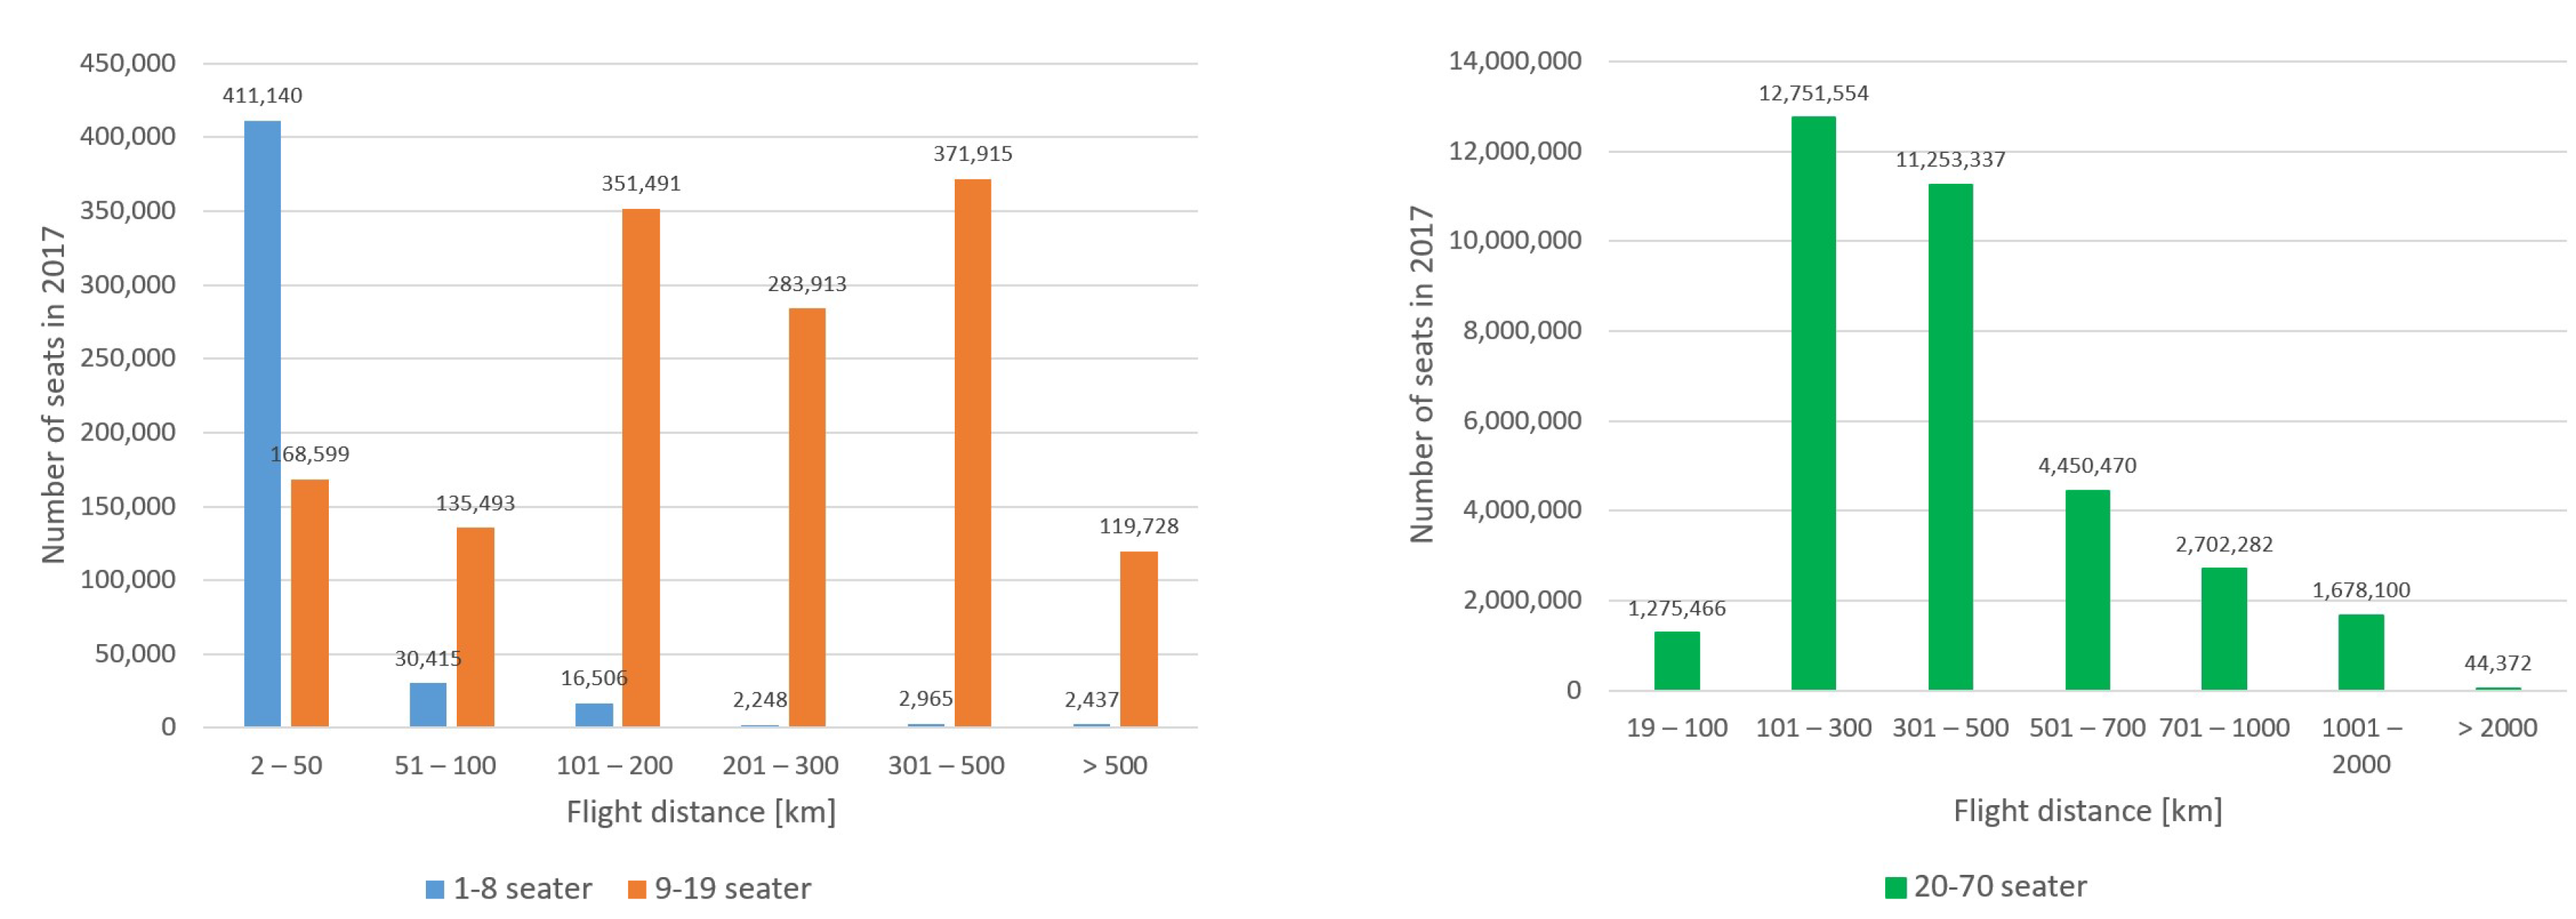
All records of scheduled flights are kept in databases, such as Official Airline Guide (OAG). According to the OAG demo database [33], in 2017, 51 airports in the EU operated regular flights with 1–8 seater aircraft; 150 airports operated regular flights with 9–19 seater aircraft; and 484 airports operated regular flights with 20–70 seater aircraft. Figure 5 represents a summary of the number of passengers in 2017, classified by the flight range. According to Figure 5, a vast majority of flights using 1–8 seater aircraft were operated over ranges shorter than 50 km. These flights can be efficiently covered with small, all-electric aircraft. Furthermore, 9–70 seater aircraft covered ranges up to 500 km, and could therefore be replaced with hybrid aircraft without a considerable loss in flight performance.
Nevertheless, apart from scheduled flights, the number of on-demand business flights in EU is constantly growing and can present an important aircraft service potential in the near future. In general, on-demand business aviation is growing rapidly. For example, for the eight city areas in Europe which were considered in an European Business Aviation Association (EBAA) study [34], in 2016, the number of direct connections had increased by more than 450% on average, compared to regular scheduled commercial flights. The key locations where business flights operate best are Germany, the U.K., Switzerland, Italy, and France. Moreover, on-demand flights covered 25,280 city or area pairs in Europe which were not connected by non-stop scheduled direct flights, representing approximately 31% of the total city pairs analysed in [34]. To sum up, around one in every three connections is not connected by any direct scheduled flight, meaning that the connection would not exist without on-demand business flights. According to the PrivateFly report [35], the business aviation fleet, servicing on-demand flights in EU in 2017, was comprised of 955 light jets (26.7% of the fleet) and 2177 turboprops (34.2% of the fleet). The rest were heavy and mid-sized jets. Nevertheless, as shown in Figure 6, light jets seem to be replacing turboprop aircraft, leading to a conclusion that, in the on-demand flight sector, speed is treated as more important than cost. Furthermore, unlike scheduled flights, on-demand flights tended to cover higher ranges (above 500 km). Therefore, it is questionable whether hybrid aircraft (based on propeller propulsion) would be a suitable option for covering this section, as well.

4. Emission Analysis of Regional Air Transport in EU

Aircraft emit particles and gases, such as carbon dioxide ( CO 2 ), water vapour, hydrocarbons (HC), carbon monoxide (CO), nitrogen oxides ( NO x ), sulphur oxides ( SO x ), lead, and black carbon [36]. Carbon dioxide and water vapour are normal combustion by-products, while carbon monoxide and hydrocarbons are products of incomplete combustion. Nitrogen oxides, on the other hand, are produced by nitrogen binding with oxygen at high temperatures and high pressures. Carbon monoxide is a toxic gas that binds to haemoglobin and, therefore, reduces its ability to carry oxygen. CO is deadly at high concentrations while, at lower concentrations, a human body naturally recovers from poisoning in a couple of hours or days (depending on severity of poisoning). Hydrocarbons are major contributors to smog, and prolonged exposure to HC can cause lung and liver diseases, as well as cancer. Nitrogen oxides contribute to the formation of smog and acid rain and can cause lung and heart diseases. Furthermore, NO x (including N 2 O ) gases have a significant greenhouse effect. Carbon dioxide is not toxic, but is a major greenhouse gas. Therefore, HC, CO, and NO x can be considered as local pollutants and their concentrations should be regulated in the vicinity of airports, while CO 2 and NO x (including N 2 O ) should be considered as global pollutants and contributors to the greenhouse effect. In the section, only local pollution is considered.
Aircraft emissions of HC, CO, and NO x in the vicinity of airports can be estimated, according to the classical landing and take-off cycle (LTO) [37], which is divided into four phases: take-off, ascent, approach and idle (taxiing). The idle phase is further divided into taxi-in and taxi-out. During taxi-out, the aircraft approaches a runway. The take-off phase involves acceleration along the runway, while the aircraft is still in contact with ground, and lasts on average t 1 = 42 s. The ascent lasts from the moment when the aircraft is airborne, until it reaches a height of 3000 ft (approximately 1000 m); on average, it lasts t 2 = 132 s. The landing procedure starts when the aircraft is at 3000 ft height; it lasts approximately t 3 = 240 s. Landing is followed by taxi-in. The idle phase (taxi-in and taxi-out combined), on average, lasts about t 4 = 1560 s.
The total emissions, E I (in grams), of an aircraft can be calculated, using the equation
E I = m = 1 4 E i m t m W f 6 m ,
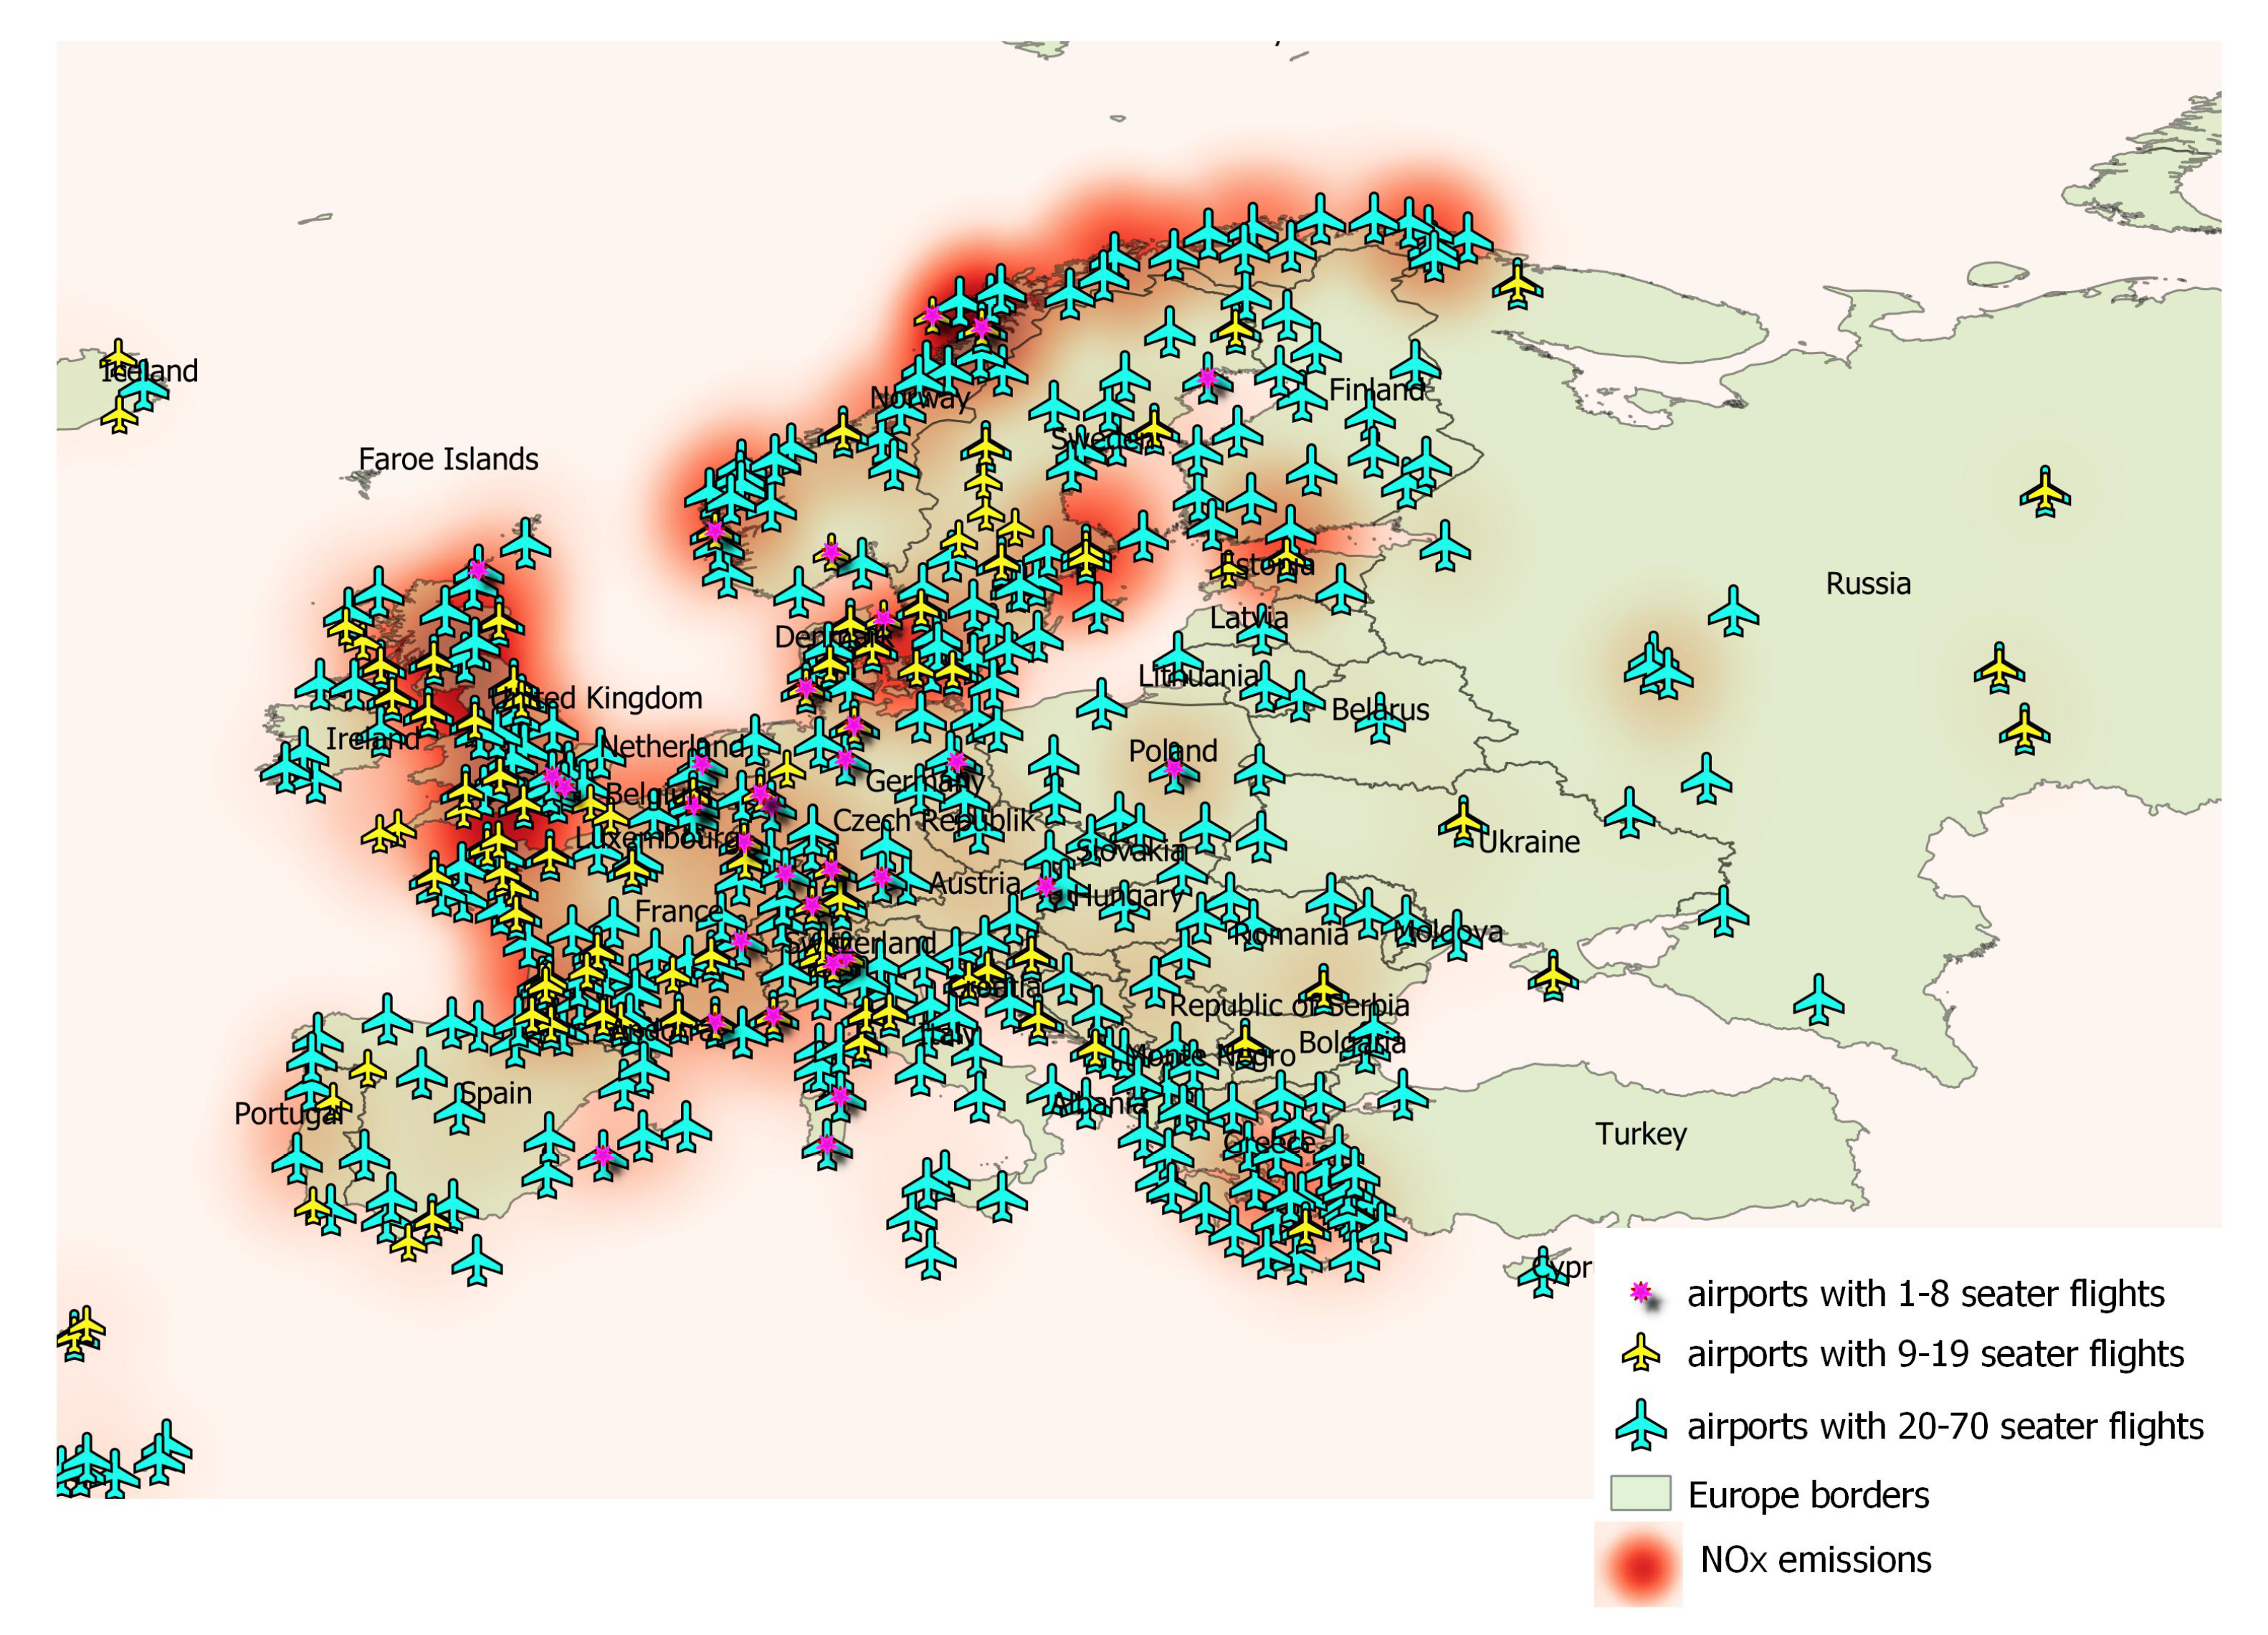
where E i m denotes an emission index at a mth phase, t m is an average time duration of the mth phase, and W f 6 m is the fuel flow during the mth phase. The sum is taken over all four LTO phases, as described above. It is assumed that the fuel flow represents 100% of the maximal fuel flow at take-off, 85% during ascent, 30% at approach, and 7% at idle [38].The data on emission indexes and fuel flows were taken from the ICAO Aircraft Engine Emissions Databank, measured according to the procedures in the ICAO Annex 16, Volume II, and certified by the States of Design of the engines, according to their national regulations [39]. Unfortunately, in the ICAO database, there are no emission data concerning engines used in 1–8 seater aircraft. Furthermore, the engine emission data are available only for three of 21 total engines used in the 9–19 seater aircraft, and only for 12 of 38 total engines used in the 20–70 seater aircraft, operating in EU airspace. Therefore, only an estimation of the total quantities of HC, CO, and NO x emissions could be done on the basis of the available data. First, a weighted average, based on an actual number of flights, was calculated only for flights for which the engine emission data were available. Calculation was done separately for both categories (9–19 and 20–70 seater aircraft). The average emissions were then multiplied by the total number of flights in each category. Both scheduled and on-demand flights were taken into account. The results for 2017 are presented in Table 1. Taking into account that the RPKs for EU are growing at rate of 3.7% [1], it can be estimated that the calculated gas emissions will double by 2035, if aircraft technology does not change. The geographical distribution of gas emissions for scheduled flights is presented in Figure 7.
Based on the calculations presented in Section 2, it can be concluded that hybrid aircraft can be equipped with a battery/batteries that could provide enough energy for the take-off procedure of a classical LTO cycle ( E o u t ). Similar conclusions can be reached from the fuel flow data and time durations of the LTO phases:
E o u t = t 1 + 0.85 t 2 + 0.07 t 4 2 E 0 t 1 = 5 kWh / t < 9 kWh / t ,
where E 0 is the energy used during the take-off phase, estimated from Equation (9). For a take-off speed of v t a k e o f f = 250 km/h, one yields E 0 = 1.03 kWh/km. Moreover, during descent, the battery could be partially refilled to provide energy for the landing procedure as well. Therefore, the implementation of hybrid aircraft would significantly reduce the HC, CO, and NO x emissions calculated in Table 1.

5. Conclusions

It may be concluded that hybrid (battery–conventional fuel) aircraft can provide a good solution for the reduction of NO x , HC, and CO emissions in the vicinity of airports. Hybrid aircraft also produce significantly less noise during take-off and, therefore, contribute to the reduction of noise pollution as well. The substitution of convectional regional aircraft with hybrid or all-electric aircraft would be most beneficial for the Scandinavian countries and the UK as they have the highest gas pollution caused by regional aircraft in EU, as shown in Figure 7. As an ultralight hybrid aircraft has already been developed, similar concepts can be used for regional aircraft. Hybrid aircraft could be equipped with batteries large enough to enable all-electric take-off and landing. On the other hand, all-electric aircraft could be successfully used, but only for aircraft with up to eight seats and short ranges. Such aircraft could be used for scheduled flights replacing conventional 1–8 seater aircraft, and for services such as panoramic sight-seeing. On the other hand, for services where long ranges with high speeds are expected, such as on-demand flight services, neither all-electric nor hybrid aircraft of current design could meet the demands. Therefore, it would be convenient to design a hybrid aircraft model that could combine a battery-driven propeller with a jet engine. Moreover, a further development can be expected in optimisation of aircraft shape and in the improvement of battery technology. Nevertheless, neither all-electric nor hybrid aircraft could significantly reduce the overall emissions of the greenhouse gases CO 2 and NO x . The latter can be reduced by using fuel-cell aircraft, but only if hydrogen could be produced from renewable sources. Moreover, a fuel-cell aircraft will be economically feasible only when the price of hydrogen fuel (compared to price of kerosene) is competitive enough, which is not the case, at present.

Author Contributions

Conceptualisation, A.P.B. and S.B.; methodology, A.P.B.; formal analysis, A.P.B.; investigation, R.K.; writing–original draft preparation, A.P.B.; writing–review and editing, R.K., S.B. and A.P.B.; visualisation, A.P.B. and R.K.; supervision, S.B.; project administration, M.M.; and funding acquisition, M.M. and S.B.

Funding

The research has been done within project MAHEPA that have received funding from European Union’s Horizon 2020 research and innovation programme under grant agreement No. 723368. The article reflects only the author’s view and the European Union is not liable for any use that may be made of the information contained therein.

Acknowledgments

The authors would like to thank T. Letnik for sharing his opinion about the article and giving some useful advice, and M. Dernovšek for language check of the article.

Conflicts of Interest

The authors declare no conflict of interest. The funders had no role in the design of the study; in the collection, analyses, or interpretation of data; in the writing of the manuscript, or in the decision to publish the results.

Abbreviations

The following abbreviations are used in this manuscript:
EUEuropean Union
U.K.United Kingdom
ACREAdvisory Council for Aeronautical Research
EBAAEuropean Business Aviation Association
DLRDeutsches Zentrum für Luft und Raumfahrt (German Aerospace Center)
ICAOInternational Civil Aviation Organization
OAGOfficial Aviation Guide
RPKRevenue Passenger Kilometres
L/Dlift over drag ratio
r. o. c.rate of climb
LiFePO 4 Lithium iron phosphate battery
LTOlanding and take-off cycle
NO x nitrogen oxides
COcarbon monoxide
HChydrocarbons
CO 2 carbon dioxide
N 2 O nitrous oxide
H 2 O water vapour
SO x sulphur oxides
ttonne (1000 kg)

References

  1. European_Commission. Annual Analyses of the EU Air Transport Market; Technical Report; Mott MacDonald: Croydon, UK, 2017. [Google Scholar]
  2. FlightGlobal. Flight Fleet Forecast 2018–2037; Technical Report. Available online: https://www.flightglobal.com/products/flight-fleet-forecast/ (accessed on 16 May 2019).
  3. European_Commission. Airport Policy in the European Union—Addressing Capacity And Quality to Promote Grow, Connectivity and Sustainable Mobility; Technical Report COM(2001) 823 Final; European Commission: Brussels, Belgium, 2011. [Google Scholar]
  4. TASK_FORCE. European Observatory on Airport Capacity and Quality; Technical Report. Available online: https://ec.europa.eu/transport/sites/transport/files/modes/air/airports/doc/tf3_final_report.pdf (accessed on 16 May 2019).
  5. Argüelles, P.; Bischoff, M.; Busquin, P.; Droste, B.A.C.; Evans, R.; Kröll, W.; Lagardère, J.L.; Lina, A.; Lumsden, J.; Ranque, D.; et al. European Aeronautics: A Vision for 2020, Meeting Society’s Needs and Winning Global Leadership; Technical Report. Available online: https://www.acare4europe.org/sites/acare4europe.org/files/document/Vision%202020_0.pdf (accessed on 16 May 2019).
  6. Buchmann, I. Batteries in a Portable World, 4th ed.; Cadex Electronics Inc.: Richmond, BC, Canada, 2016; p. 360. [Google Scholar]
  7. Anderson, J.D. Aircraft Performance and Design, 5th ed.; Tata McGraw-Hill: New Delhi, India, 1999. [Google Scholar]
  8. Schäfer, A.W.; Barrett, S.R.H.; Doyme, K.; Dray, L.M.; Gnadt, A.R.; Self, R.; O’Sullivan, A.; Synodinos, A.P.; Torija, A.J. Technological, economic and environmental prospects of all-electric aircraft. Nat. Energy 2019, 4, 160–166. [Google Scholar] [CrossRef]
  9. Gohardani, A.S.; Doulgeris, G.; Singh, R. Challenges of future aircraft propulsion: A review of distributed propulsion technology and its potential application for the all electric commercial aircraft. Prog. Aerosp. Sci. 2011, 47, 369–391. [Google Scholar] [CrossRef]
  10. Baharozu, E.; Soykan, G.; Ozerdem, M.B. Future aircraft concept in terms of energy efficiency and environmental factors. Energy 2017, 140, 1368–1377. [Google Scholar] [CrossRef]
  11. Adolf, J.; Balzer, C.; Louis, J.; Schabla, U. Shell Hydrogen Study: Energy of the Future; Technical Report; Shell Deuchland Oil GmbH: Hamburg, Germany, 2017. [Google Scholar]
  12. Sørensen, B.; Spazzafumo, G. Hydrogen and Fuel Cells, Emerging Technologies and Applications, 3rd ed.; Elsevier Ltd.: London, UK, 2018; p. 501. [Google Scholar]
  13. HY4—Delivering the Future. Available online: http://hy4.org/ (accessed on 16 May 2019).
  14. Godula-Jopek, A.; Westenberger, A. Hydrogen-Fueled Aeroplanes. Compend. Hydrogen Energy 2016, 4, 67–85. [Google Scholar] [CrossRef]
  15. Keim, M.; Kallo, J.; Friedrich, K.A.; Werner, C.; Saballus, M.; Gores, F. Multifunctional fuel cell system in an aircraft environment: An investigation focusing on fuel tank inerting and water generation. Aerosp. Sci. Technol. 2013, 29, 330–338. [Google Scholar] [CrossRef] [Green Version]
  16. Khandelwal, B.; Karakurt, A.; Sekaran, P.R.; Sethi, V.; Singh, R. Hydrogen powered aircraft: The future of air transport. Prog. Aerosp. Sci. 2013, 60, 45–59. [Google Scholar] [CrossRef]
  17. Romeo, G.; Borello, F.; Correa, G.; Cestino, E. ENFICA-FC: Design of transport aircraft powered by fuel cell & flight test of zero emission 2-seater aircraft powered by fuel cells fueled by hydrogen. Int. J. Hydrogen Energy 2013, 38, 469–479. [Google Scholar] [CrossRef] [Green Version]
  18. Schmidtchen, U.; Behrend, E.; Pohl, H.W.; Rostek, N. Hydrogen Aircraft and Airport Safety. Renew. Sustain. Energy Rev. 1997, 1, 239–269. [Google Scholar] [CrossRef]
  19. Gong, A.; Verstraete, D. Fuel cell propulsion in small fixed-wing unmanned aerial vehicles: Current status and research needs. Int. J. Hydrogen Energy 2017, 42, 21311–21333. [Google Scholar] [CrossRef]
  20. Sehra, A.K.; Whitlow, W. Propulsion and power for 21st century aviation. Prog. Aerosp. Sci. 2004, 40, 199–235. [Google Scholar] [CrossRef]
  21. Verstraete, D. Long range transport aircraft using hydrogen fuel. Int. J. Hydrogen Energy 2013, 38, 14824–14831. [Google Scholar] [CrossRef]
  22. Verstraete, D. On the energy efficiency of hydrogen-fuelled transport aircraft. Int. J. Hydrogen Energy 2015, 40, 7388–7394. [Google Scholar] [CrossRef]
  23. Pascarella, C.; Marinaro, G.; Senatore, A.; Di Lorenzo, G.; Frosina, E.; Caputo, C. Modelling of a Hybrid-Electric Light Aircraft. Energy Procedia 2017, 126, 1155–1162. [Google Scholar] [CrossRef]
  24. Pornet, C.; Isikveren, A.T. Conceptual design of hybrid-electric transport aircraft. Prog. Aerosp. Sci. 2015, 79, 114–135. [Google Scholar] [CrossRef]
  25. Pipistrel—Pipistrel Official Web Page. Available online: https://www.pipistrel-aircraft.com/ (accessed on 16 May 2019).
  26. Voskuijl, M.; van Bogaert, J.; Rao, A.G. Analysis and design of hybrid electric regional turboprop aircraft. CEAS Aeronaut. J. 2018, 9, 15–25. [Google Scholar] [CrossRef]
  27. Technical Data | Panthera. Available online: https://www.panthera-aircraft.com/technical-data (accessed on 16 May 2019).
  28. Martinez-Val, R.; Perez, E.; Palacin, J. Historical Perspective of Air Transport Productivity and Efficiency. In 43rd AIAA Aerospace Sciences Meeting and Exhibit; American Institute of Aeronautics and Astronautics: Reston, VA, USA, 2005. [Google Scholar] [CrossRef]
  29. Righetti, A.P.; Falger, A.C.; Flade, S.D.; Perkan, I.P. Performance and Energy Efficiency Trade of Study; Technical Report. Available online: https://mahepa.eu/wp-content/uploads/2017/12/D1.1-Concept-of-Modular-Architecture-fro-Hybrid-Electric-Propulsion-of-Aircraft.pdf (accessed on 16 May 2019).
  30. Dababneh, O.; Kipouros, T. A review of aircraft wing mass estimation methods. Aerosp. Sci. Technol. 2018, 72, 256–266. [Google Scholar] [CrossRef]
  31. Atmaja, T.D. Energy storage system using battery and ultracapacitor on mobile charging station for electric vehicle. Energy Procedia 2015, 68, 429–437. [Google Scholar] [CrossRef]
  32. Sirosh, N. Hydrogen Composite Tank Program. In Proceedings of the 2002 U.S. DOE Hydrogen Program Review, San Ramon, CA, USA, 9–11 May 2000; pp. 1–7. [Google Scholar]
  33. OAG_Organization. OAG Schedules Analyser. Available online: https://www.oag.com/schedules-analyser (accessed on 16 May 2019).
  34. EBAA. European Business Aviation—Economic Value and Business Benefits; European Business Aviation Association: Brussels, Belgium, 2018. [Google Scholar]
  35. PRIVATEFLY. Private Jet Charter Trends. Available online: https://www.privatefly.com/privatejet-services/privatefly-private-jet-charter-trends-report.html (accessed on 16 May 2019).
  36. Brasseur, G.P.; Gupta, M.; Anderson, B.E.; Balasubramanian, S.; Barrett, S.; Duda, D.; Fleming, G.; Forster, P.M.; Fuglestvedt, J.; Gettelman, A.; et al. Impact of Aviation on Climate: FAA’s Aviation Climate Change Research Initiative (ACCRI) Phase II. Bull. Am. Meteorol. Soc. 2016, 97, 561–583. [Google Scholar] [CrossRef]
  37. Filippone, A.; Bojdo, N. Statistical model for gas turbine engines exhaust emissions. Transp. Res. Part D Transp. Environ. 2018, 59, 451–463. [Google Scholar] [CrossRef]
  38. EASA. Commercial Air Transport Aeroplane Operations at Night or in IMC Using Single-Engined Turbine Aeroplane. Available online: https://www.easa.europa.eu/sites/default/files/dfu/NPA%202014-18.pdf (accessed on 16 May 2019).
  39. EASA. ICAO Aircraft Engine Emissions Databank. Available online: https://www.easa.europa.eu/easa-and-you/environment/icao-aircraft-engine-emissions-databank (accessed on 16 May 2019).
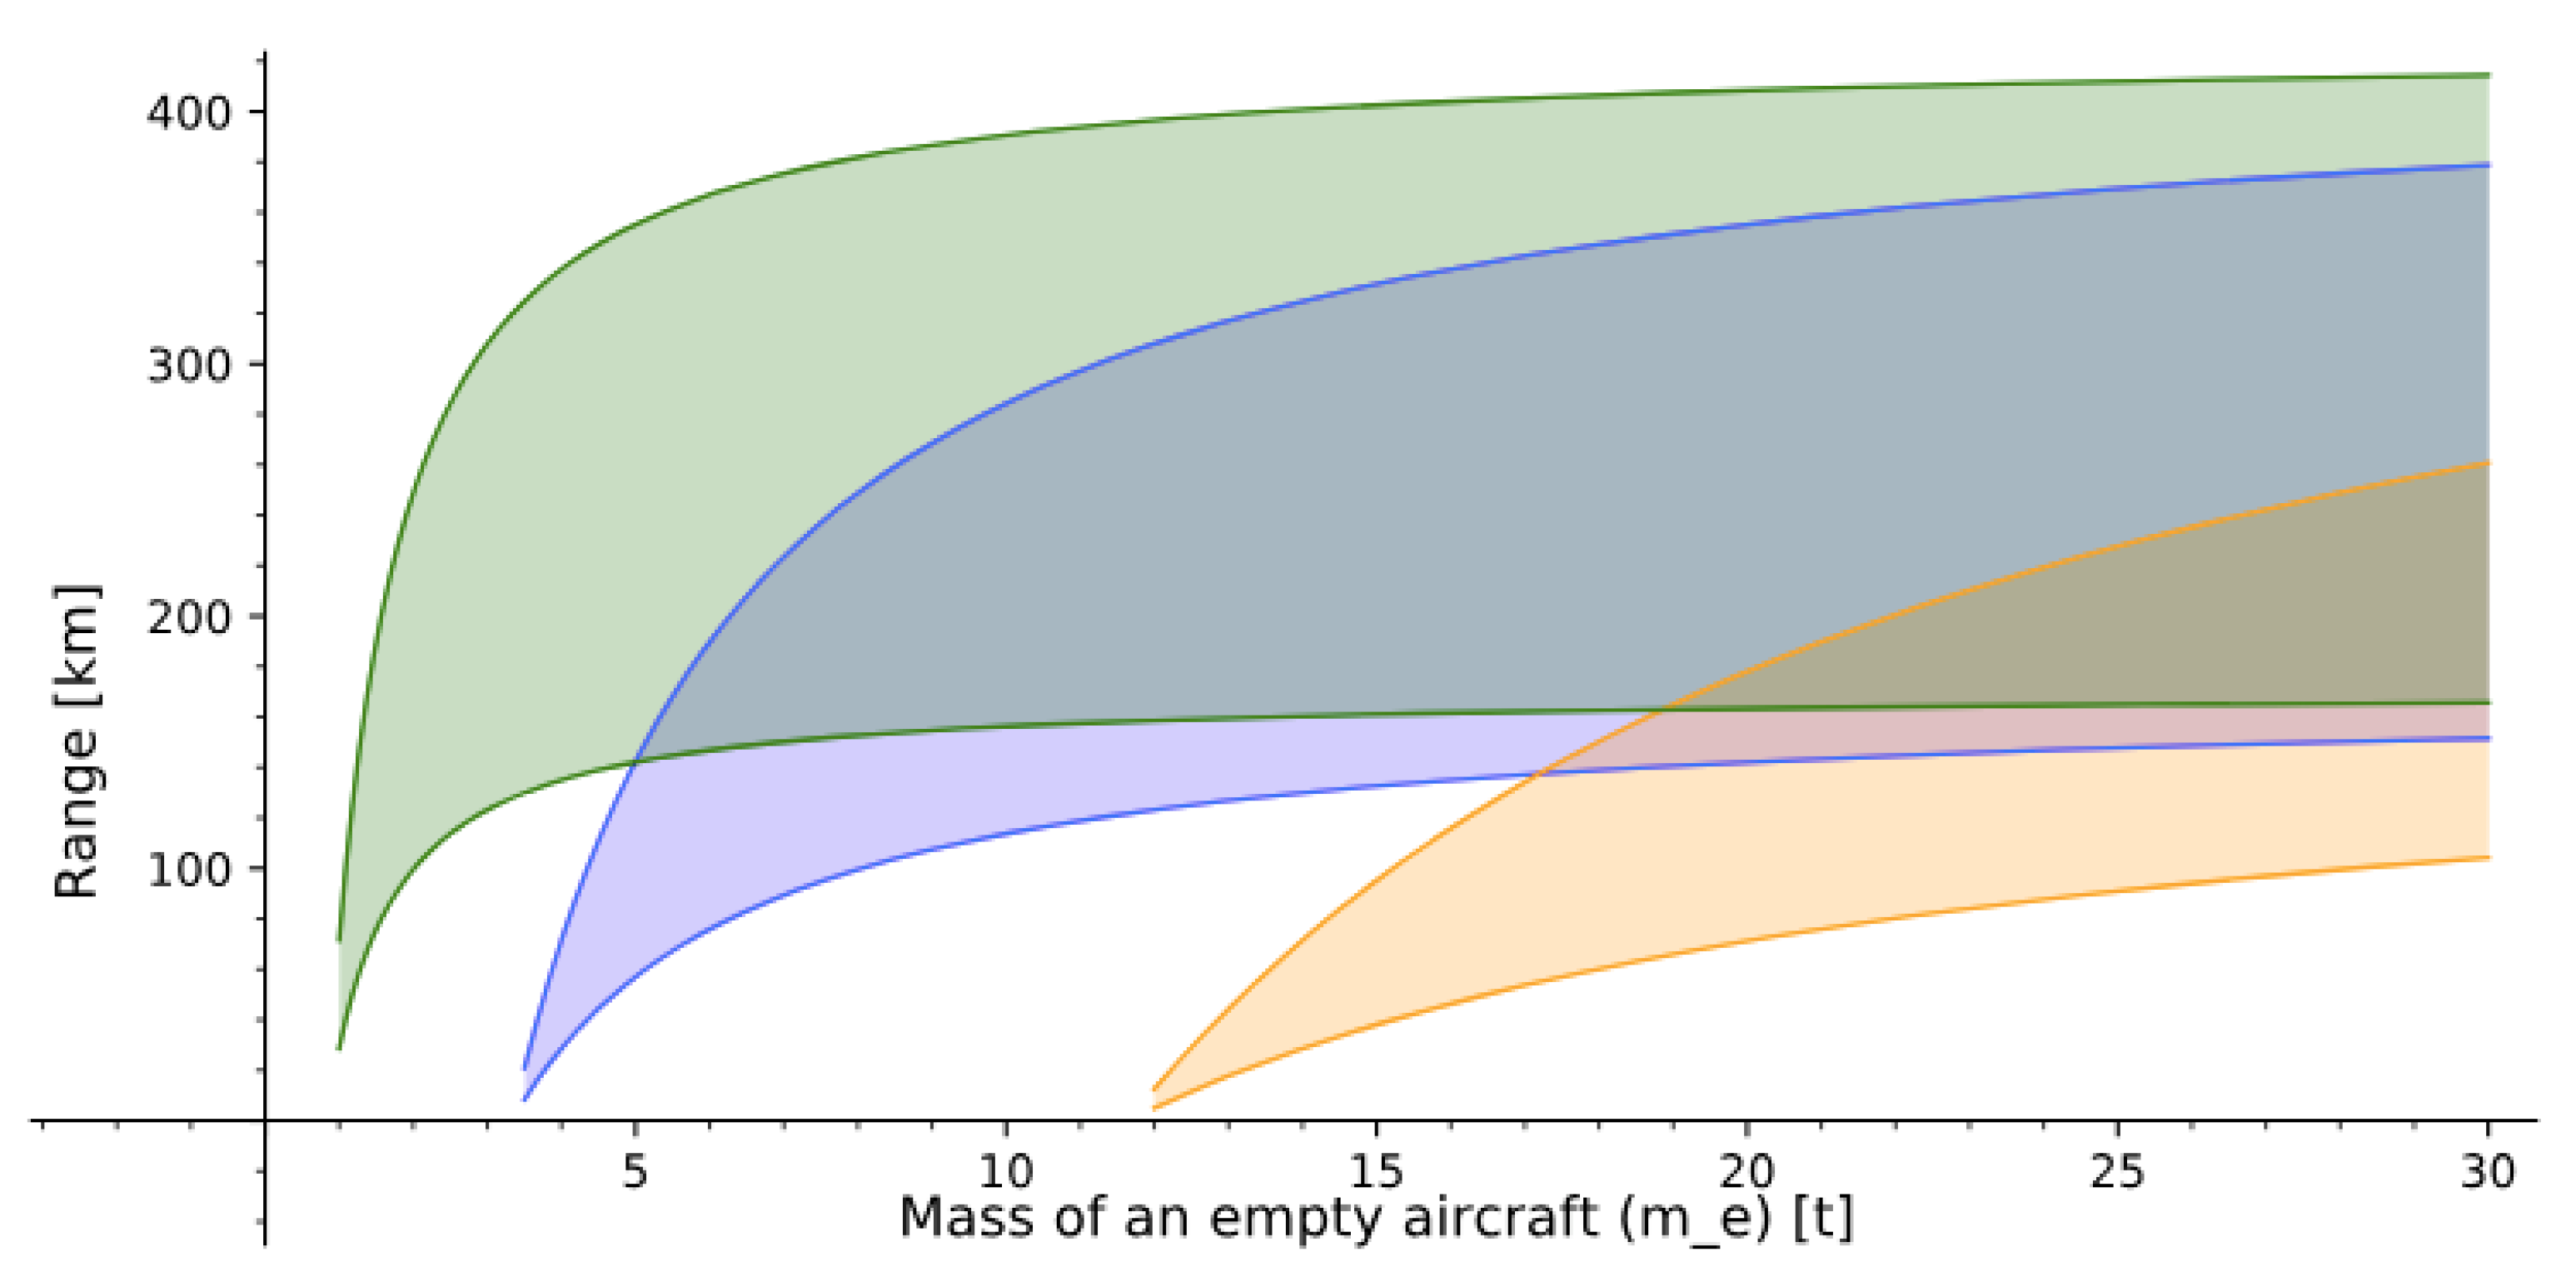
Figure 1. Estimated empty mass of an a battery-driven electric aircraft, in dependence of its achievable range, with similar design concept as a conventional aircraft and with: (green) 500 kg of payload and crew; (blue) 2000 kg of payload and crew; and (orange) 7000 kg of payload and crew. The shaded area represents the solution for batteries with a specific energy in range of 0.1–0.25 kWh/kg, with the assumption that all energy is used only for cruise.
Energies 12 01864 g001
Figure 2. Battery power per tonne of aircraft mass required by an aircraft; (left) to maintain a certain speed; and (right) to achieve a specific rate of climb.
Energies 12 01864 g002
Figure 3. Energy consumption per tonne of aircraft mass required by an aircraft to achieve a specific: (left) speed; and (right) altitude.
Energies 12 01864 g003
Figure 4. Effective energy density of a hydrogen-tank system, in dependence of its capacity for: (blue area, full-line) liquid hydrogen; and (green area, dashed-line) compressed hydrogen. For comparison, the black (thin) line presents the effective energy density of kerosene.
Energies 12 01864 g004
Figure 5. Number of passengers for 1–8 (blue), 9–19 (orange), and 20–70 (green) seater aircraft in the European region in 2017.
Energies 12 01864 g005
Figure 6. Share in on-demand flights for turboprop (blue) and small jets (orange) for 2017–2018 in the EU [34]. Number of city pairs covered with 1–8 and 9–19 seater aircraft, by distance [34].
Energies 12 01864 g006
Figure 7. Geographical distribution of NO x gas emissions due to regional aircraft in the EU. The distributions of HC and CO gas emissions are almost identical and are, therefore, not shown as separate figures.
Energies 12 01864 g007
Table 1. Calculation of gas emissions for different aircraft sizes in 2017.
Aircraft SizeNo. ofWeighted Average (g)for Year 2017 (Tonnes)
(Seats)FlightsHCCONOxHCCONOx
1–884,326nananananana
9–1979,887115.42504.21364.09.2200.1109.0
20–70676,57793.32672.81589.263.2 1808.31075.2
72.42008.31184.2