Lattice Boltzmann Simulation for the Forming Process of Artificial Frozen Soil Wall

Abstract
1. Introduction
2. Heat Conduction Model of Soil Freezing
2.1. Assumptions
2.2. Mathematical Model
2.3. Phase Change Treatment
2.4. Dimensionless Treatment
3. Lattice Boltzmann Model
3.1. Lattice Boltzmann Equation
3.2. Boundary Conditions
3.3. Unit Conversion
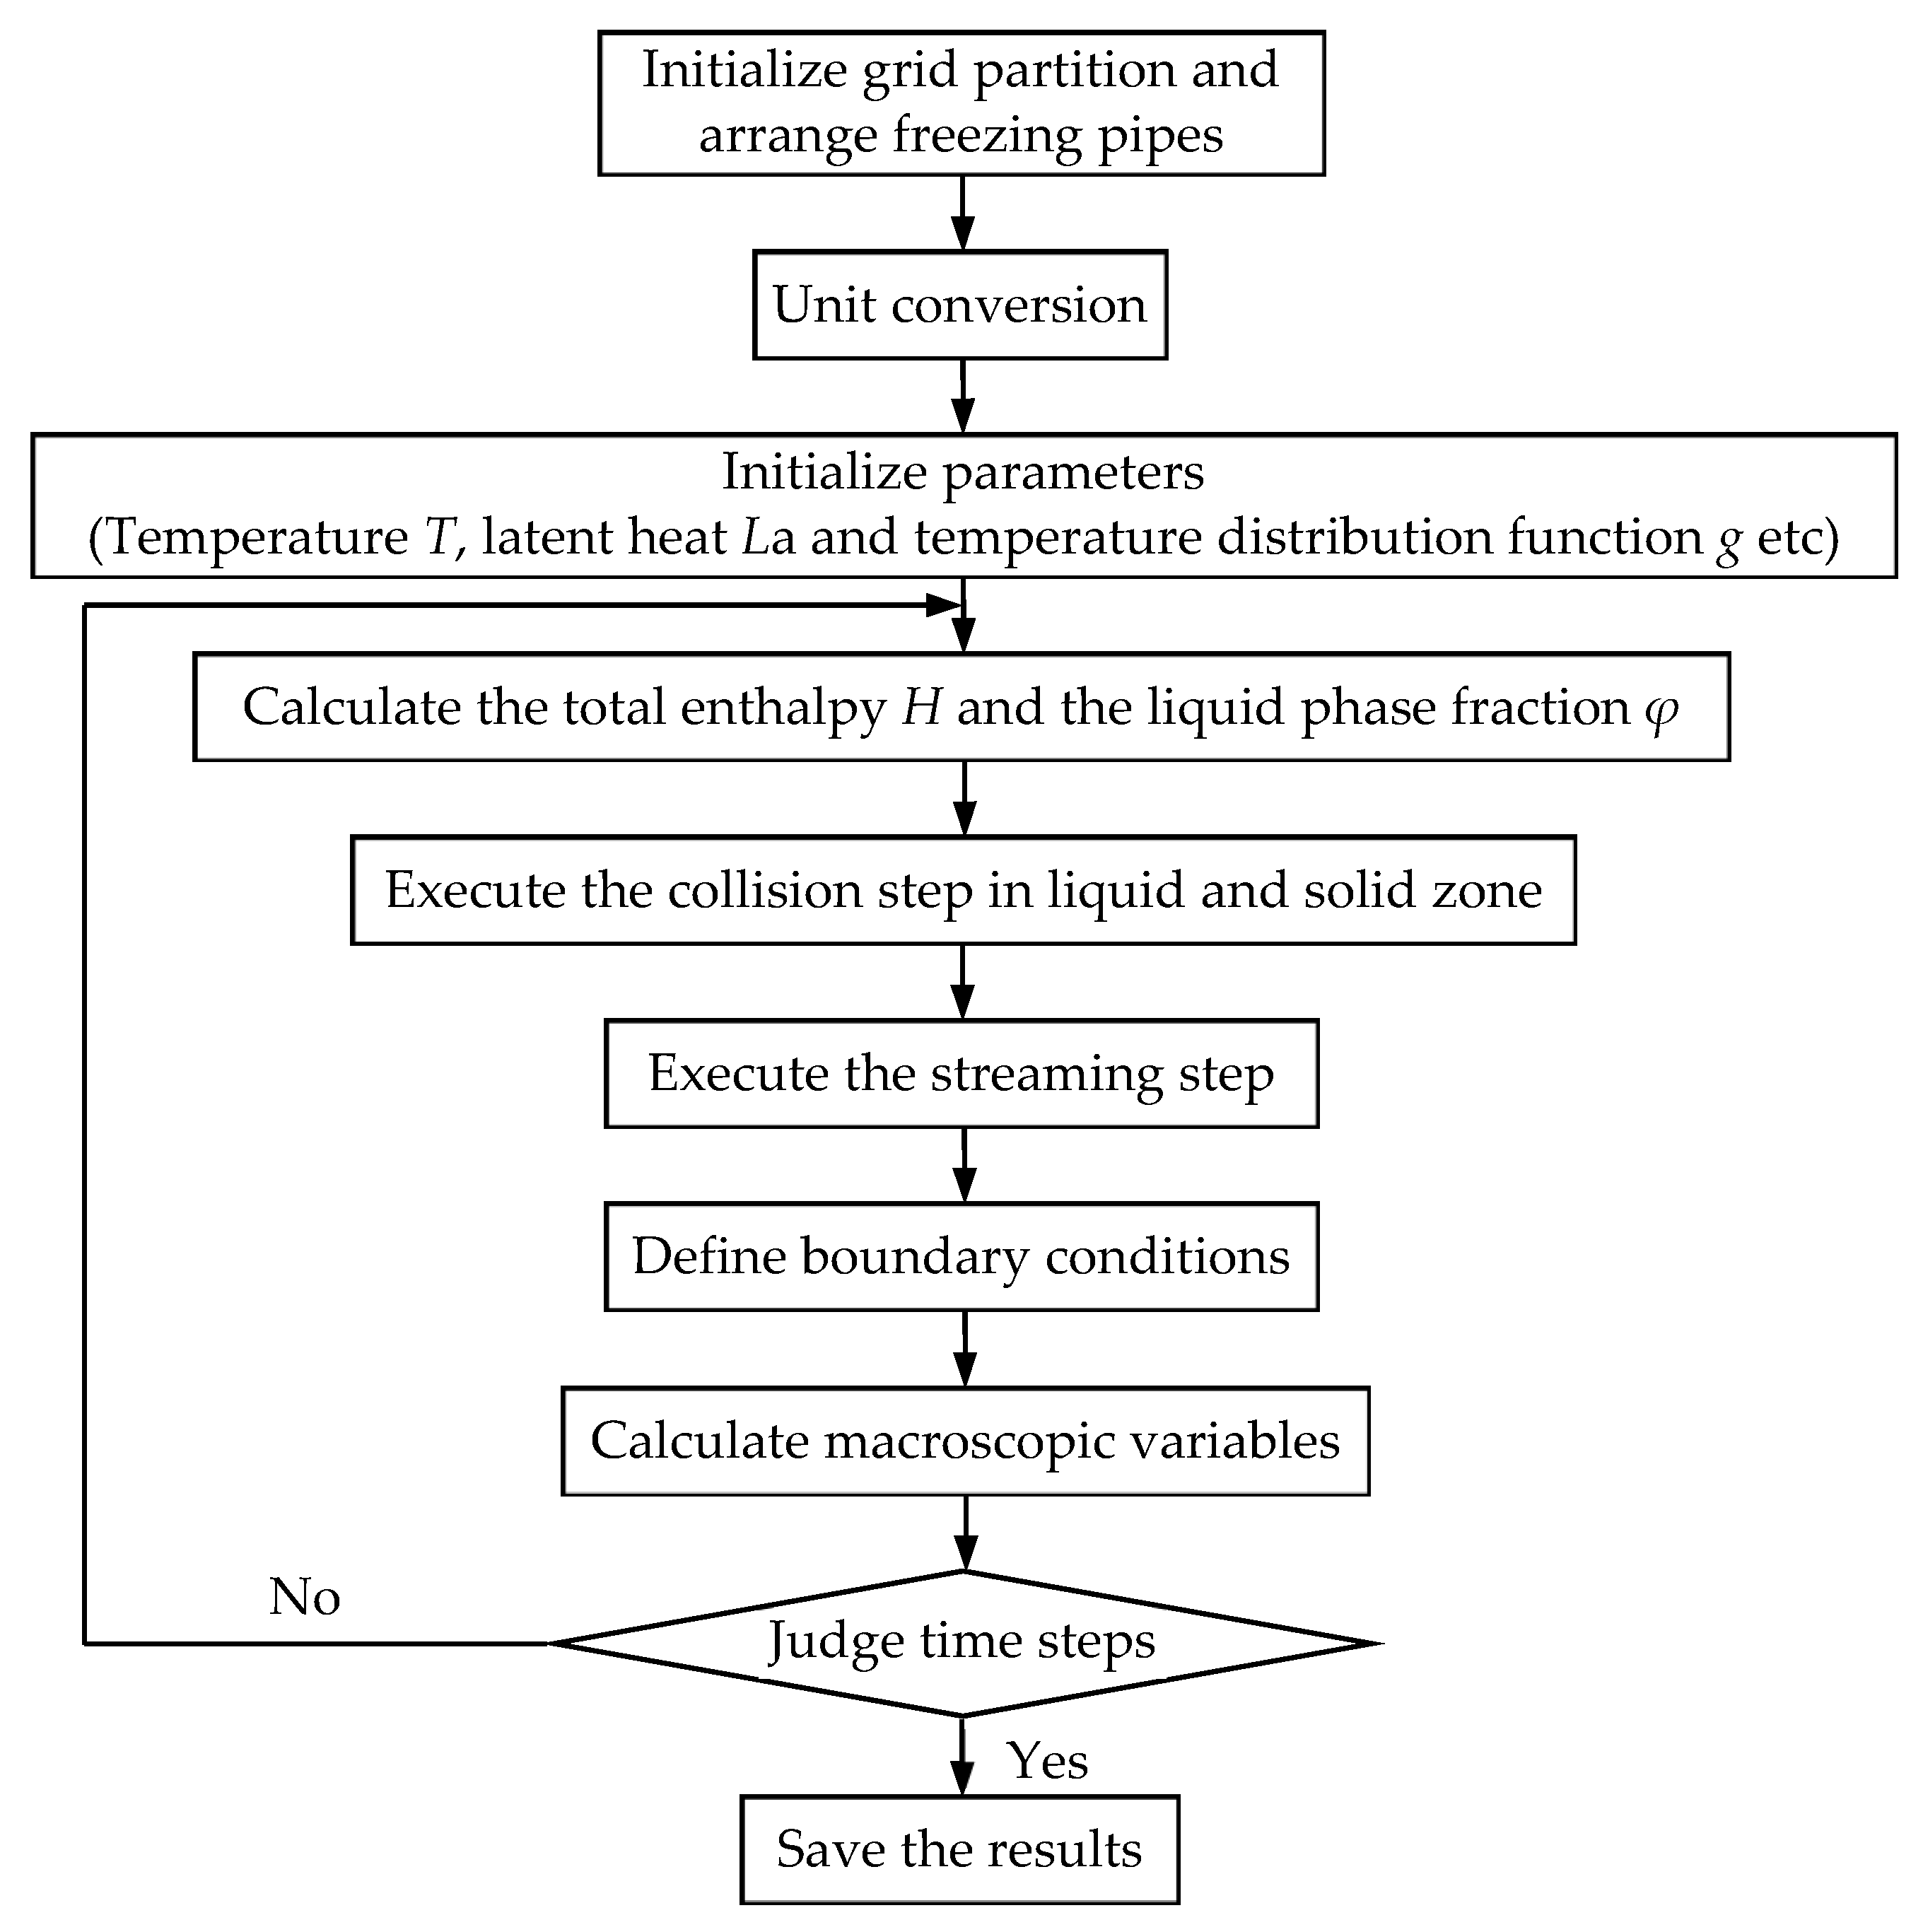
3.4. Flowchart of Program Realization
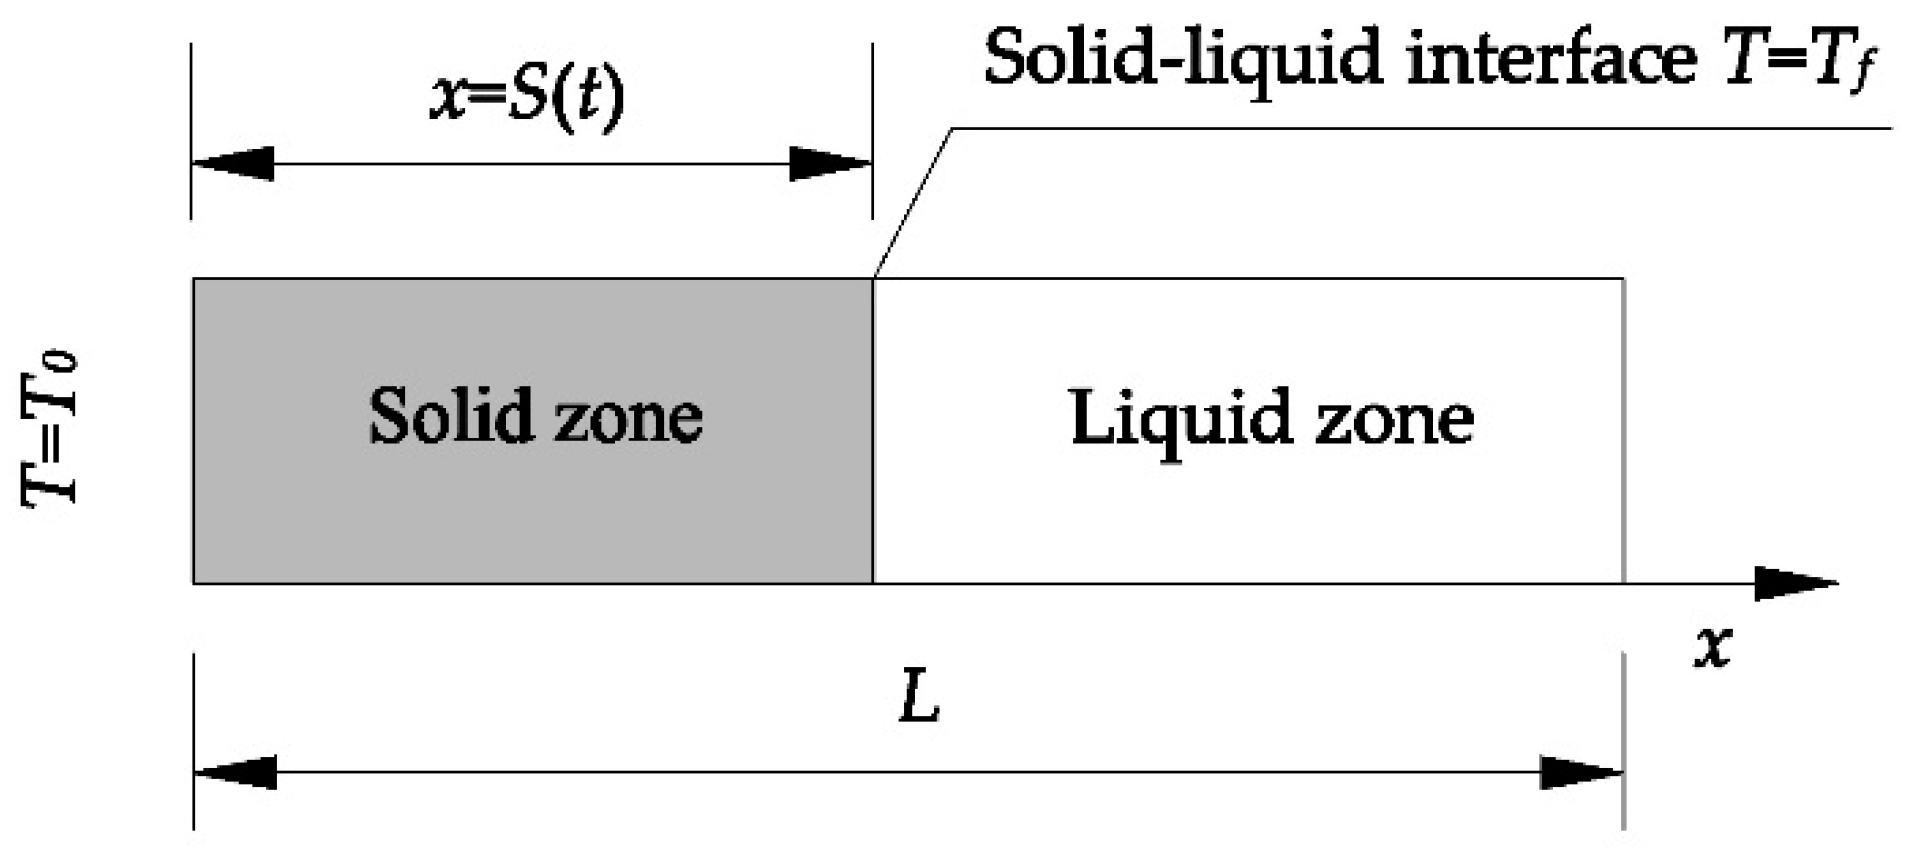
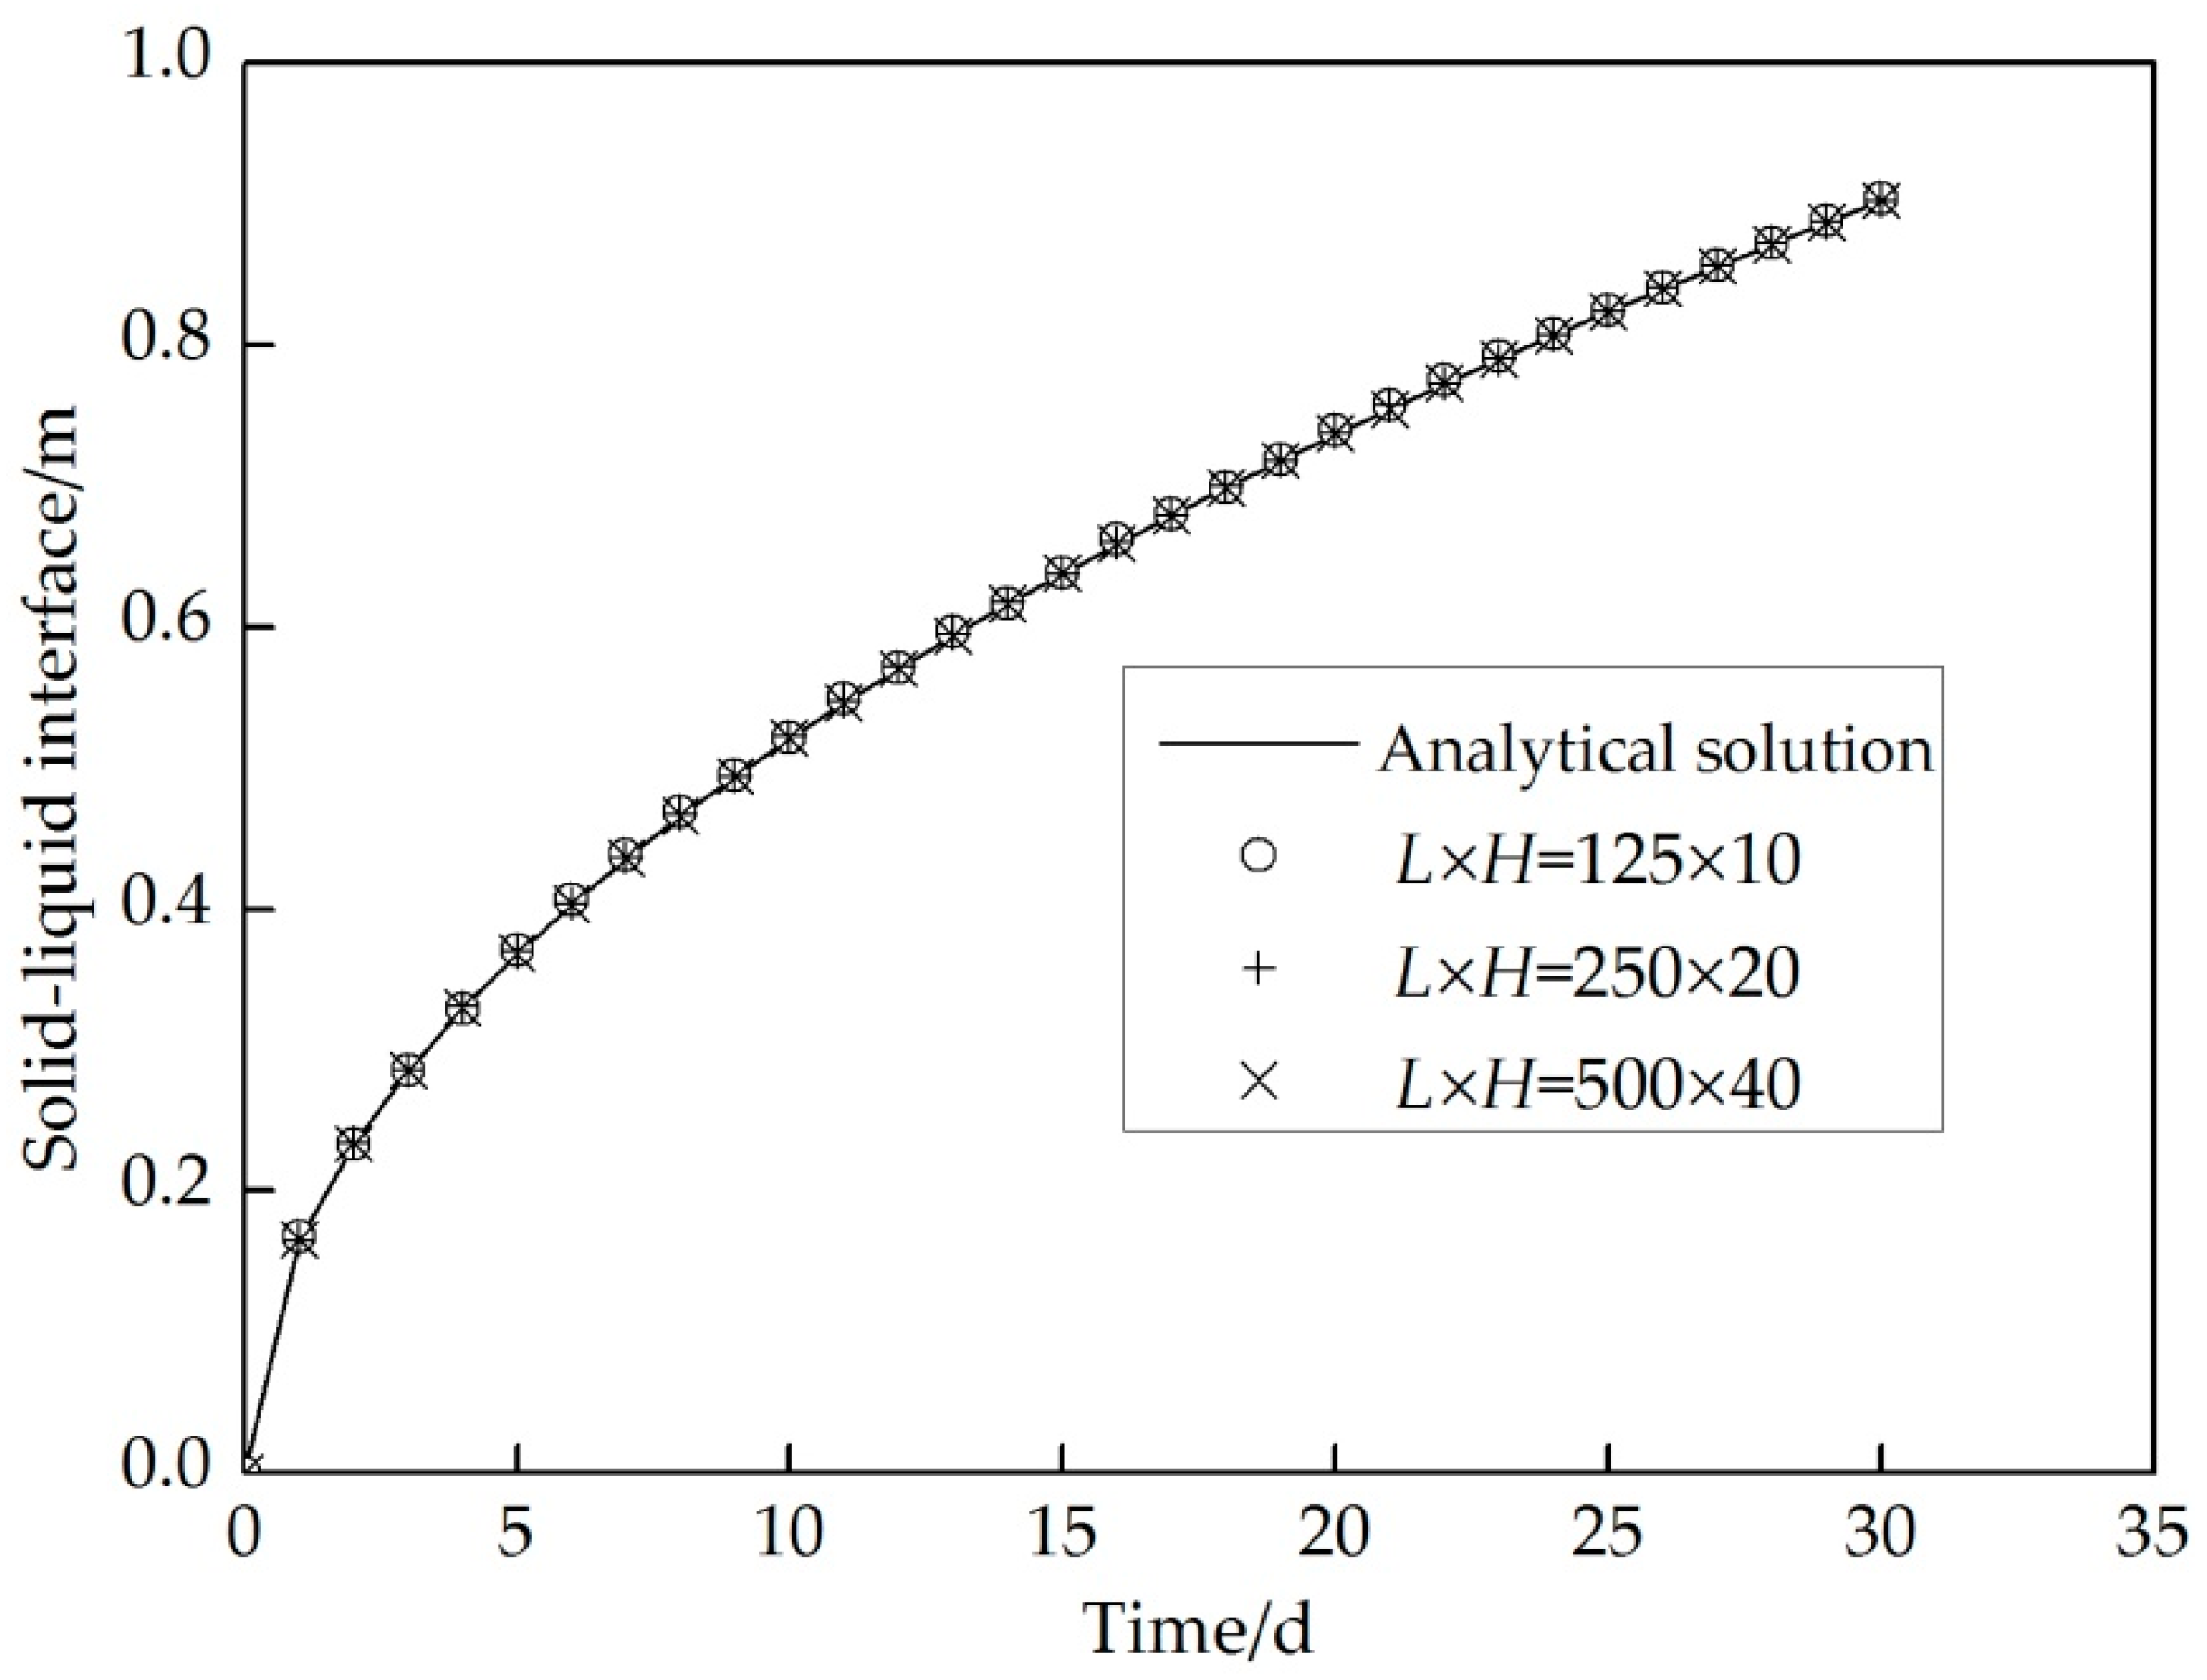
3.5. Verification
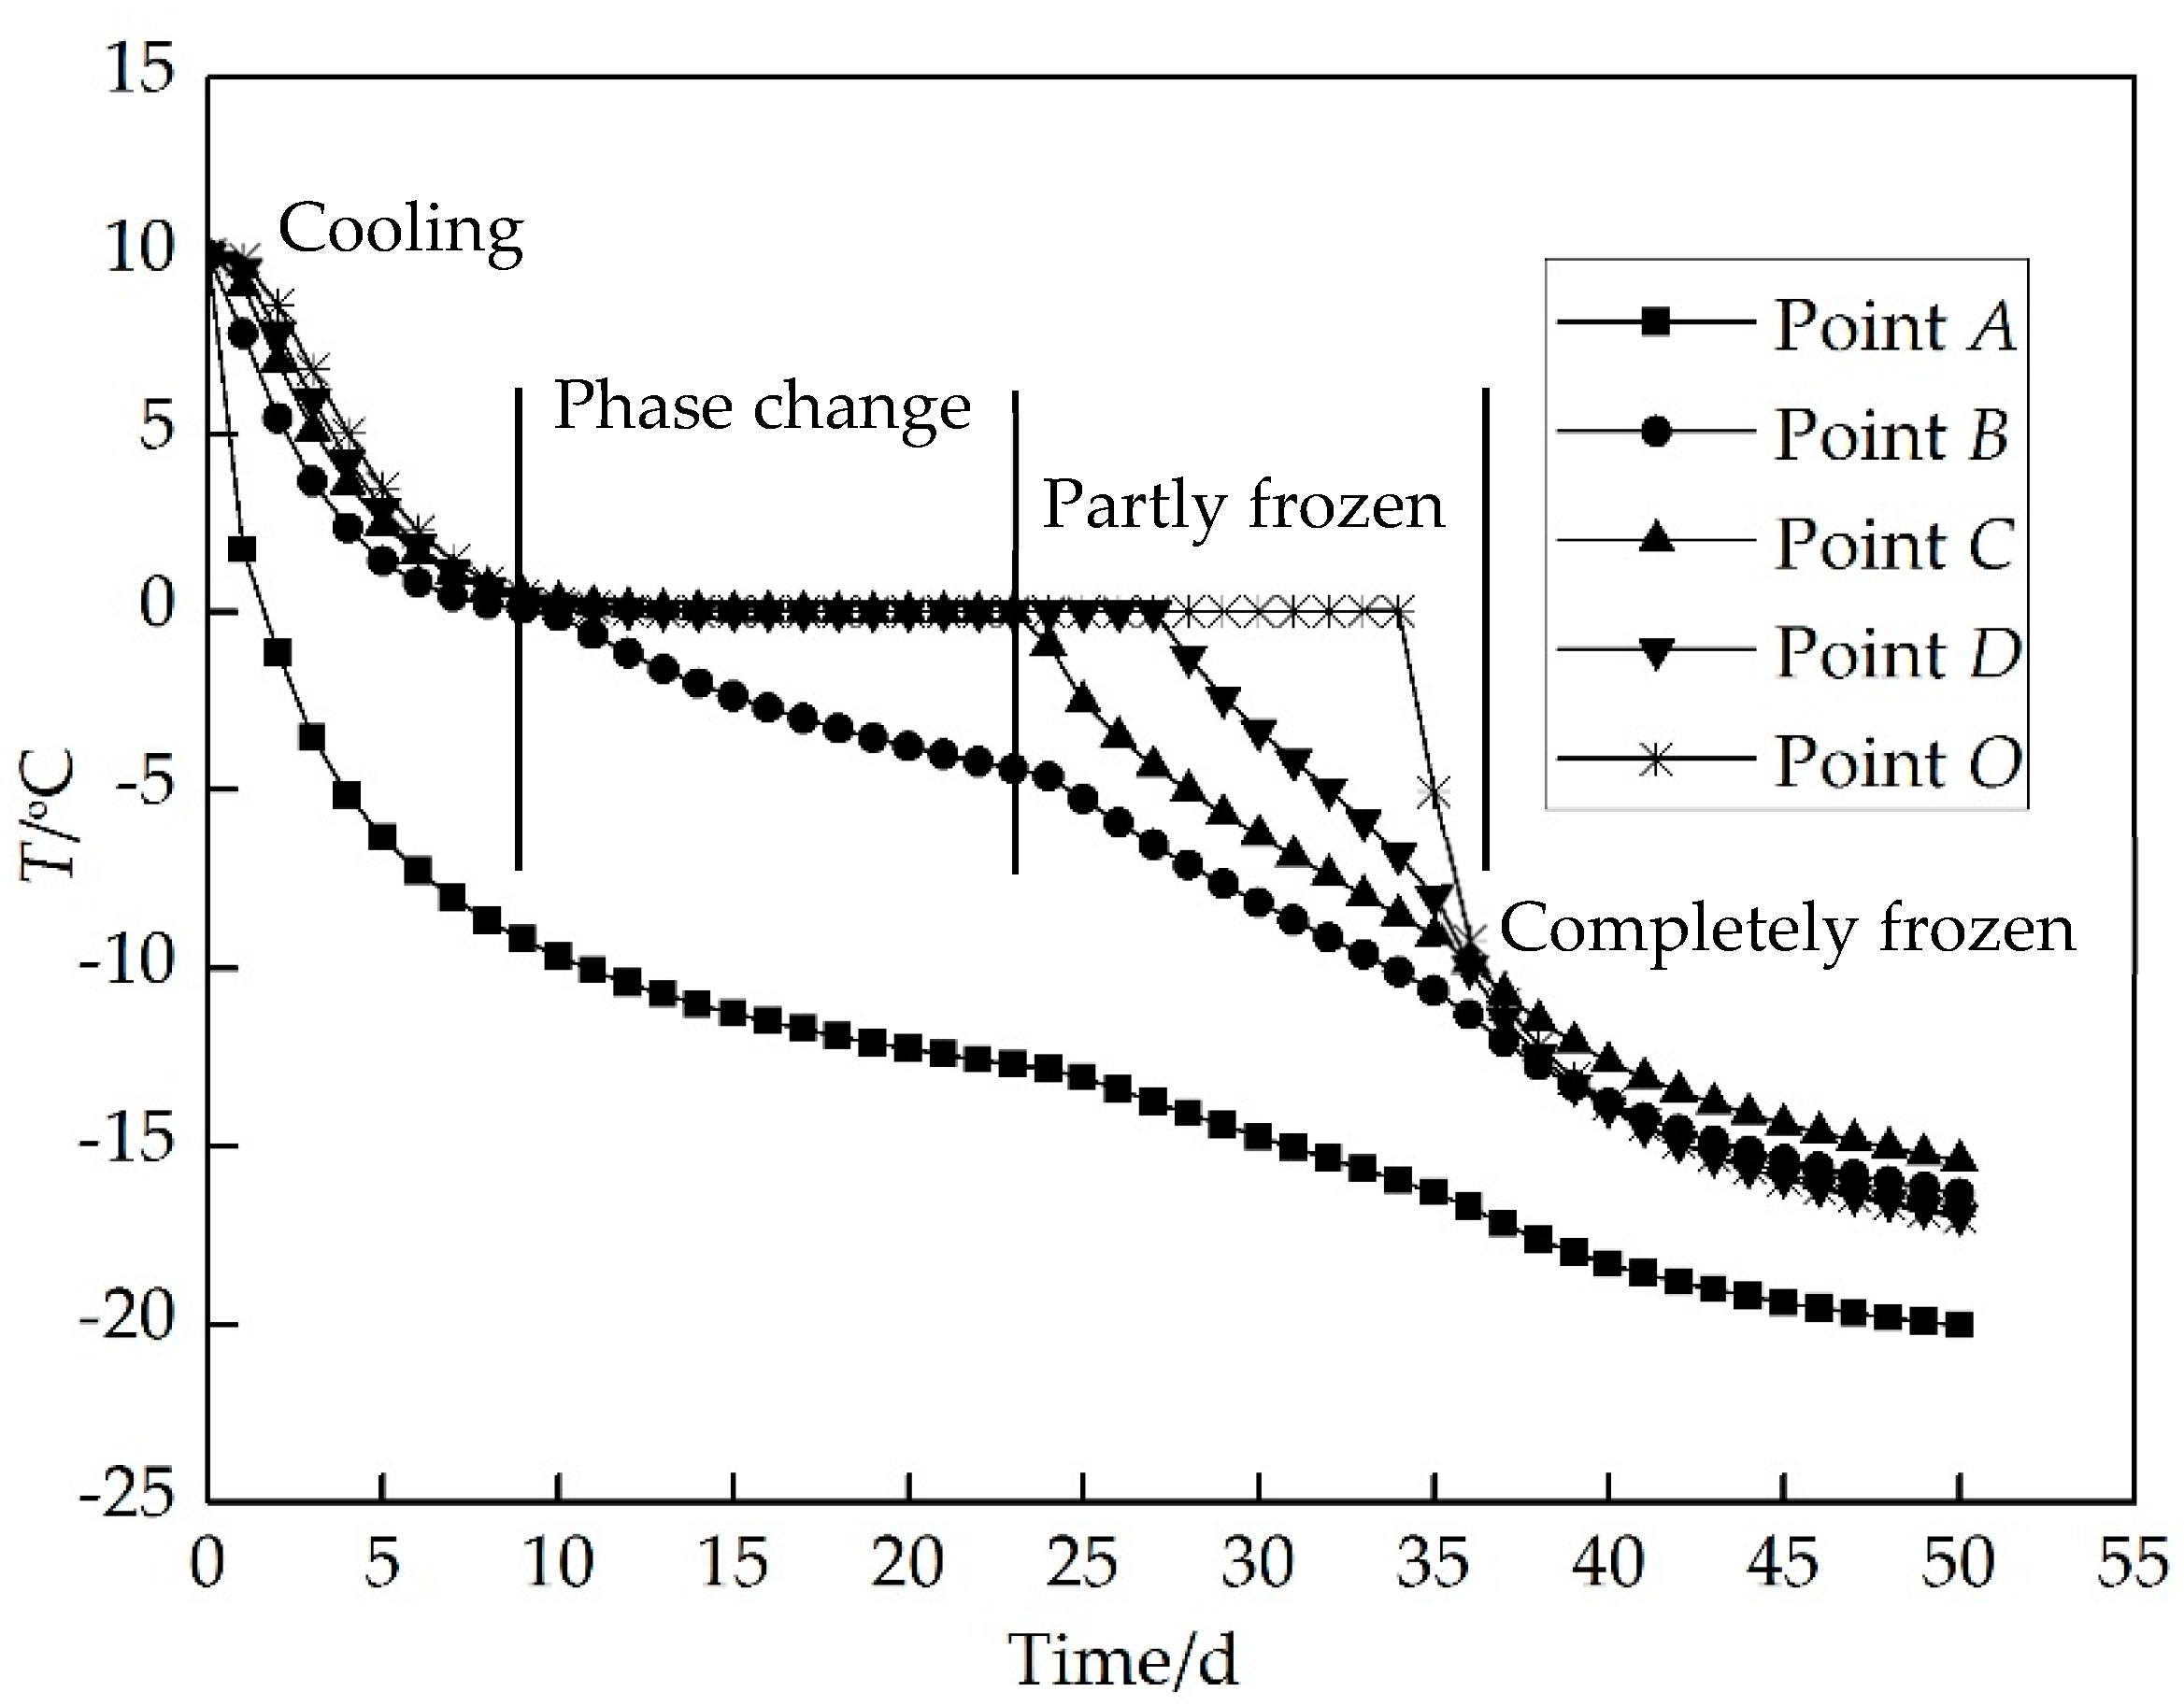
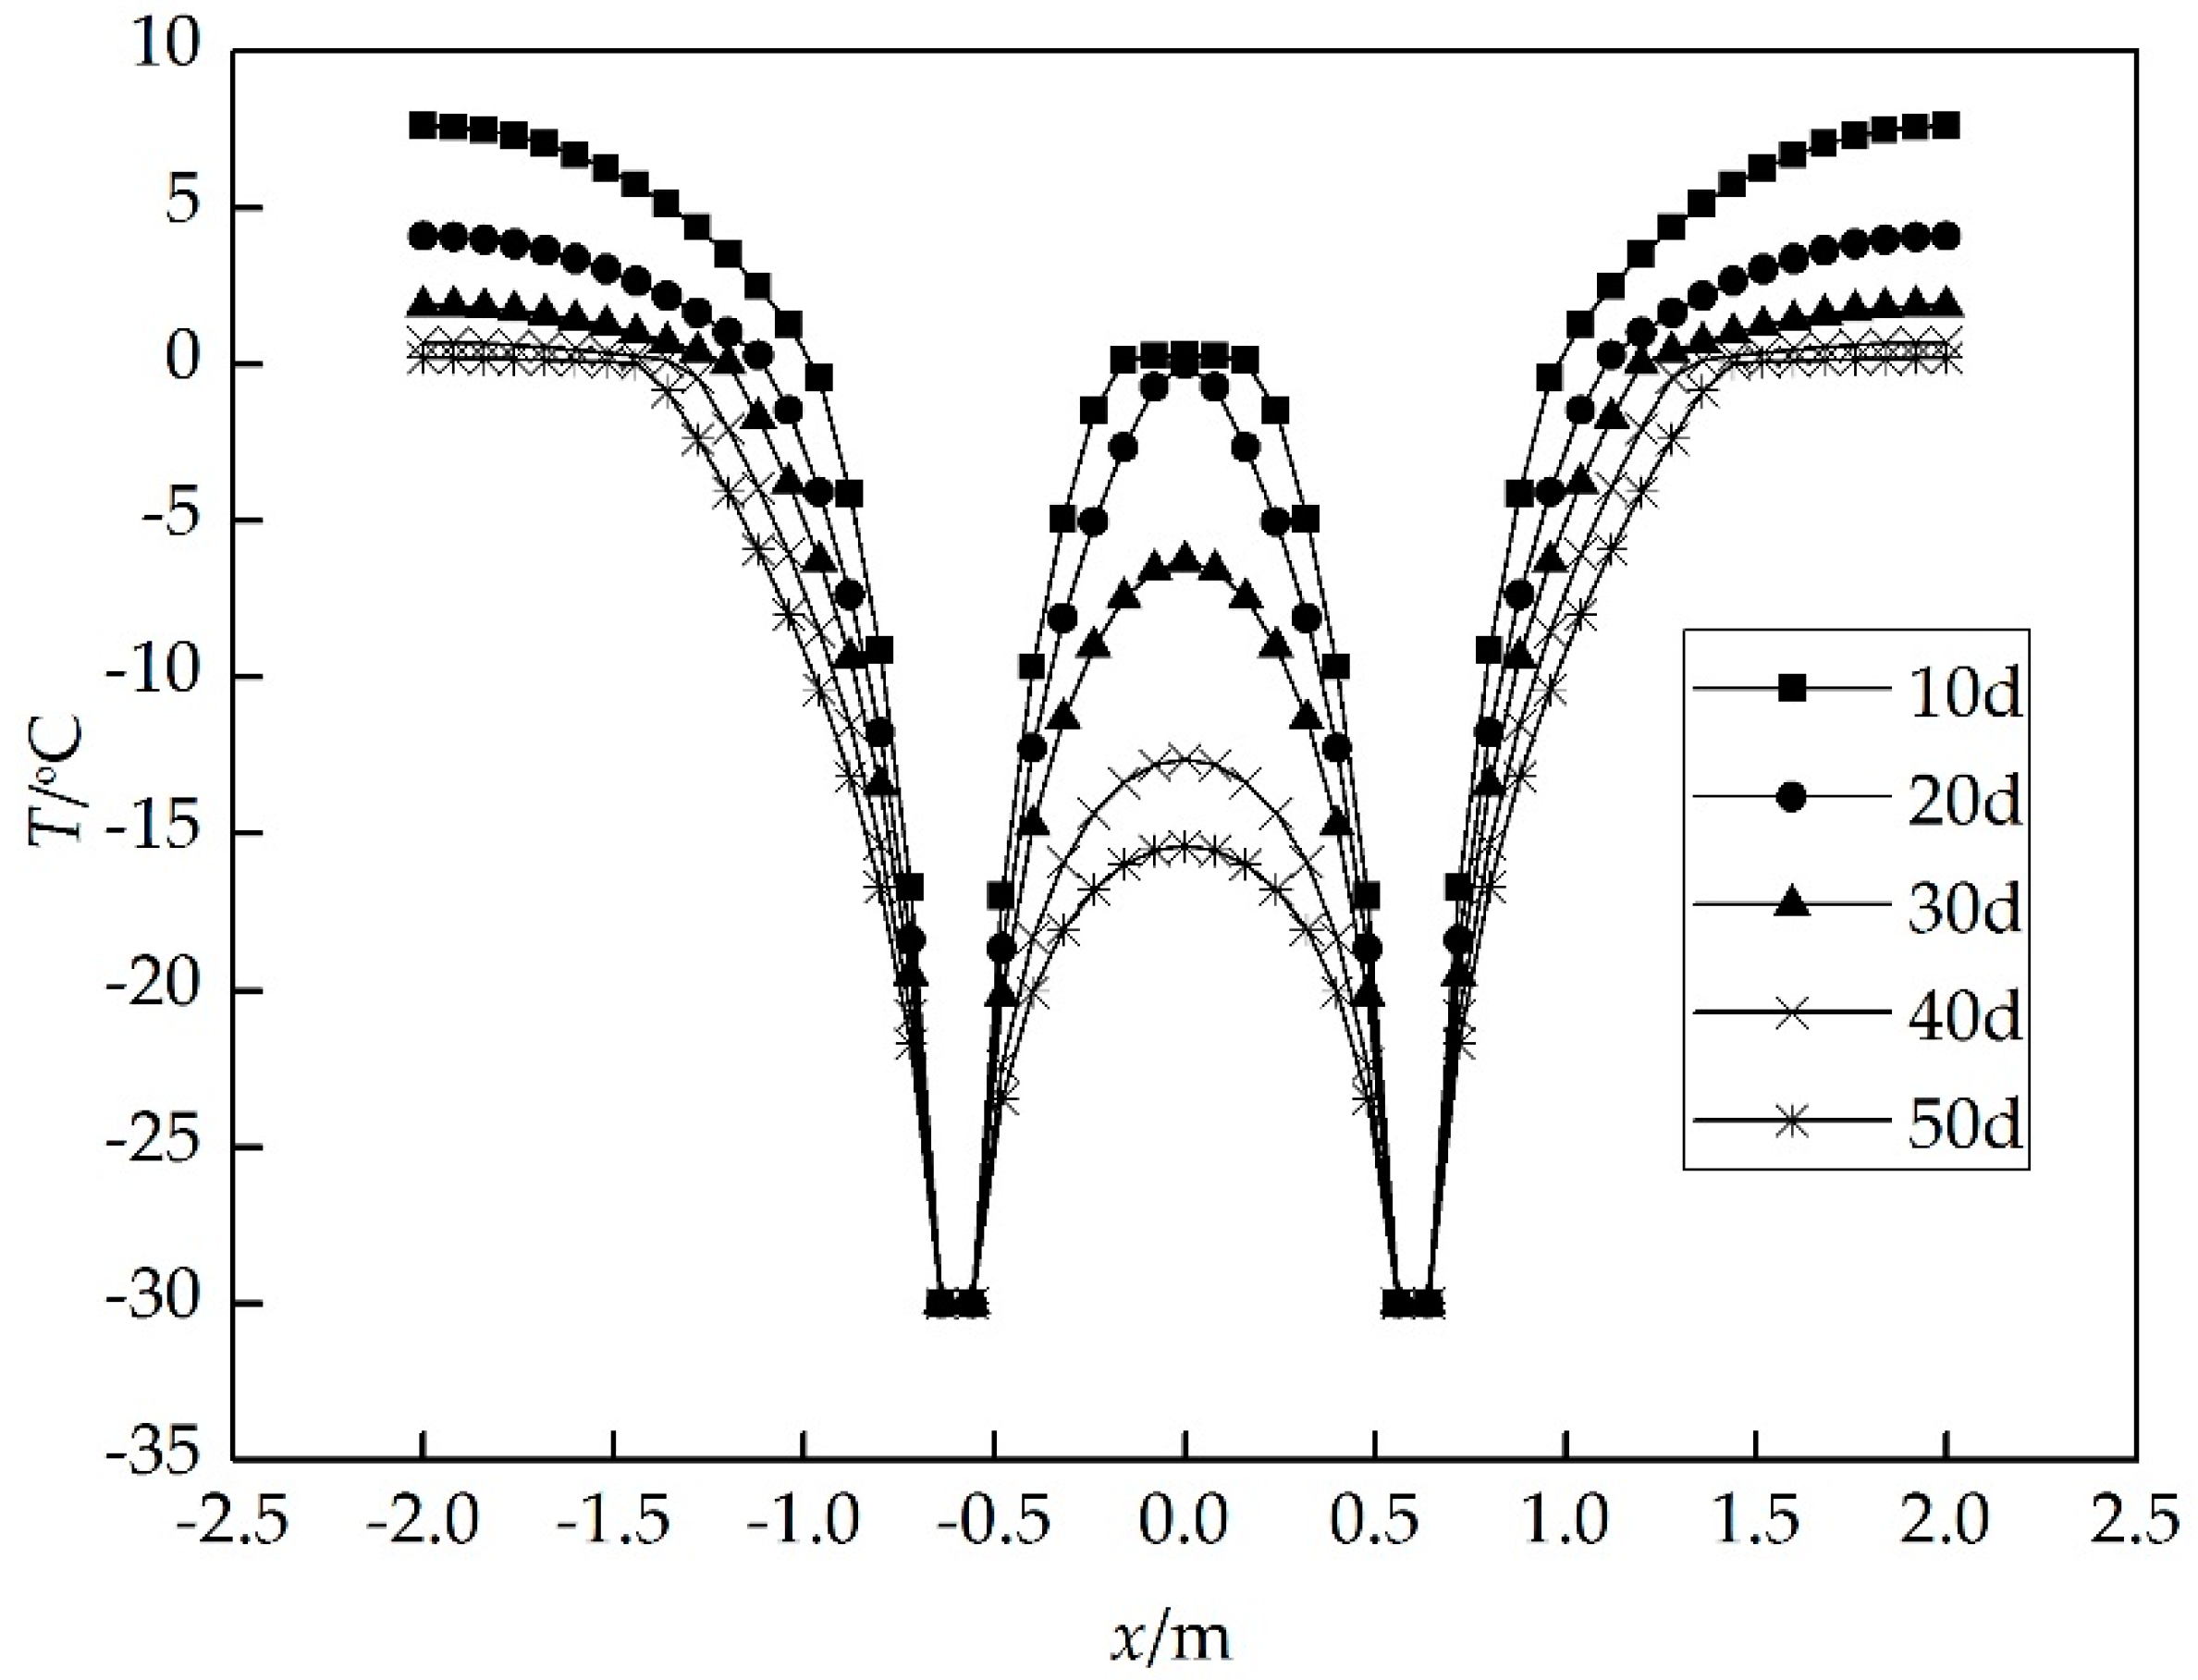
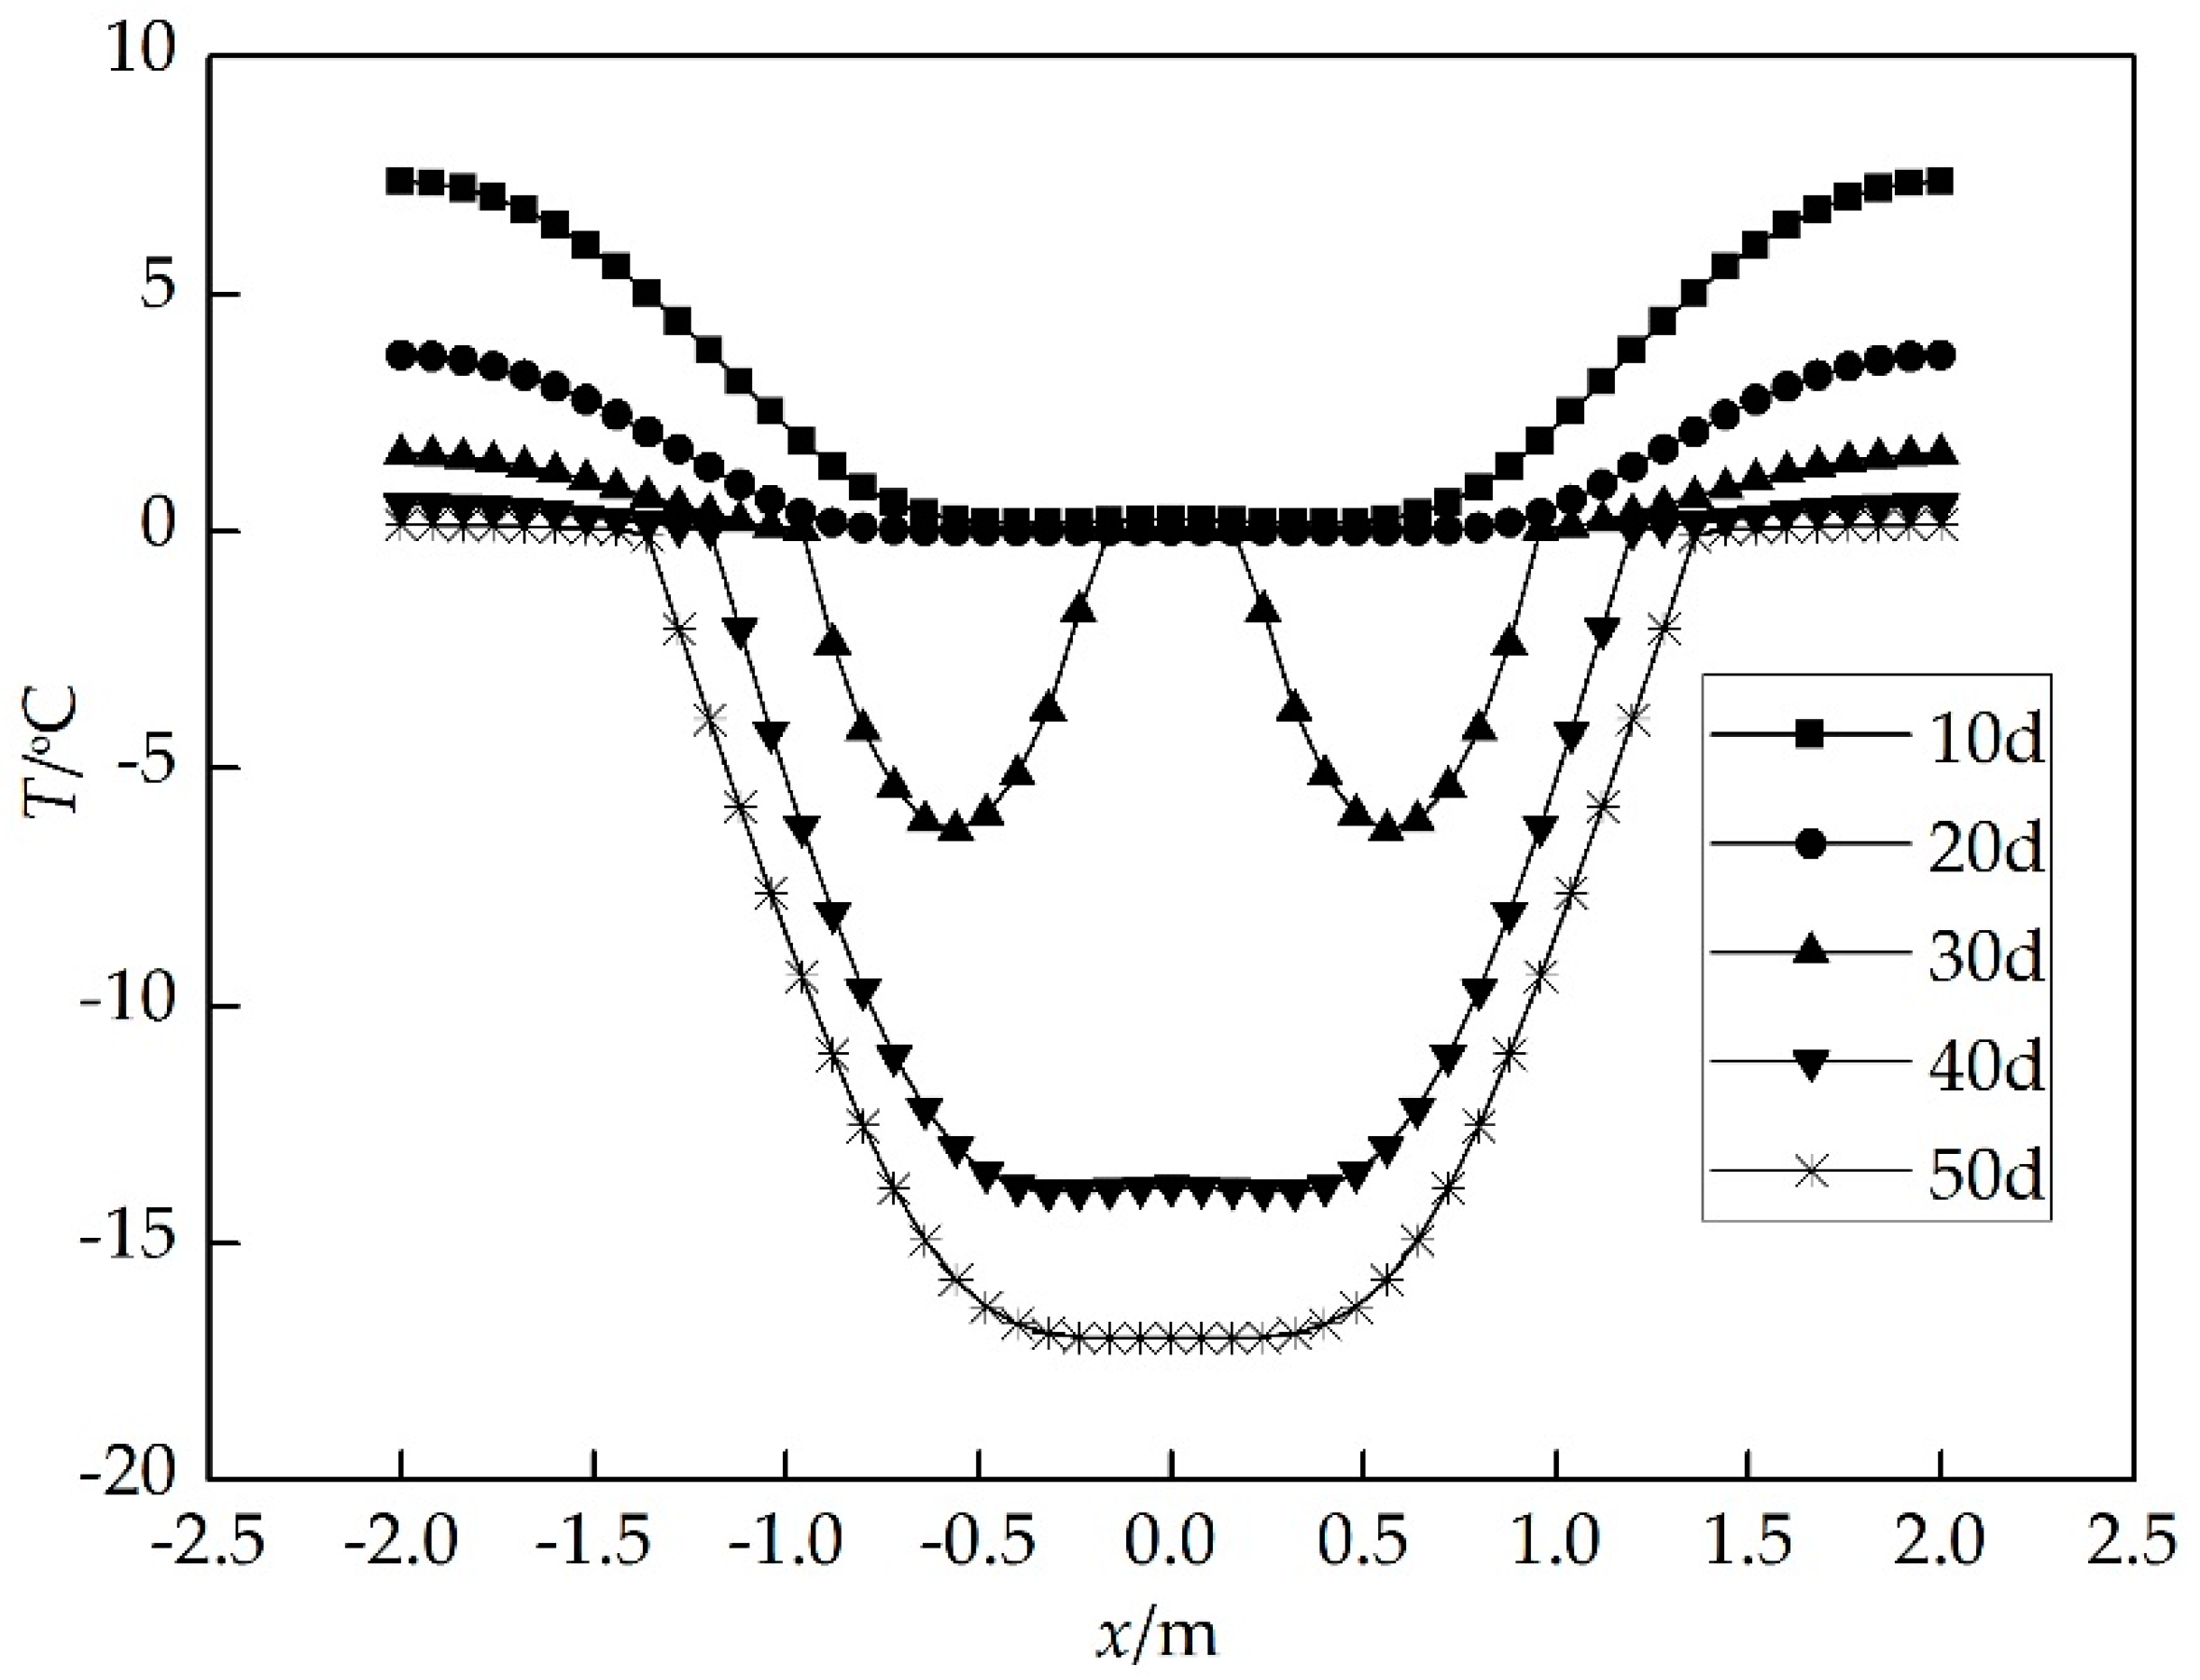
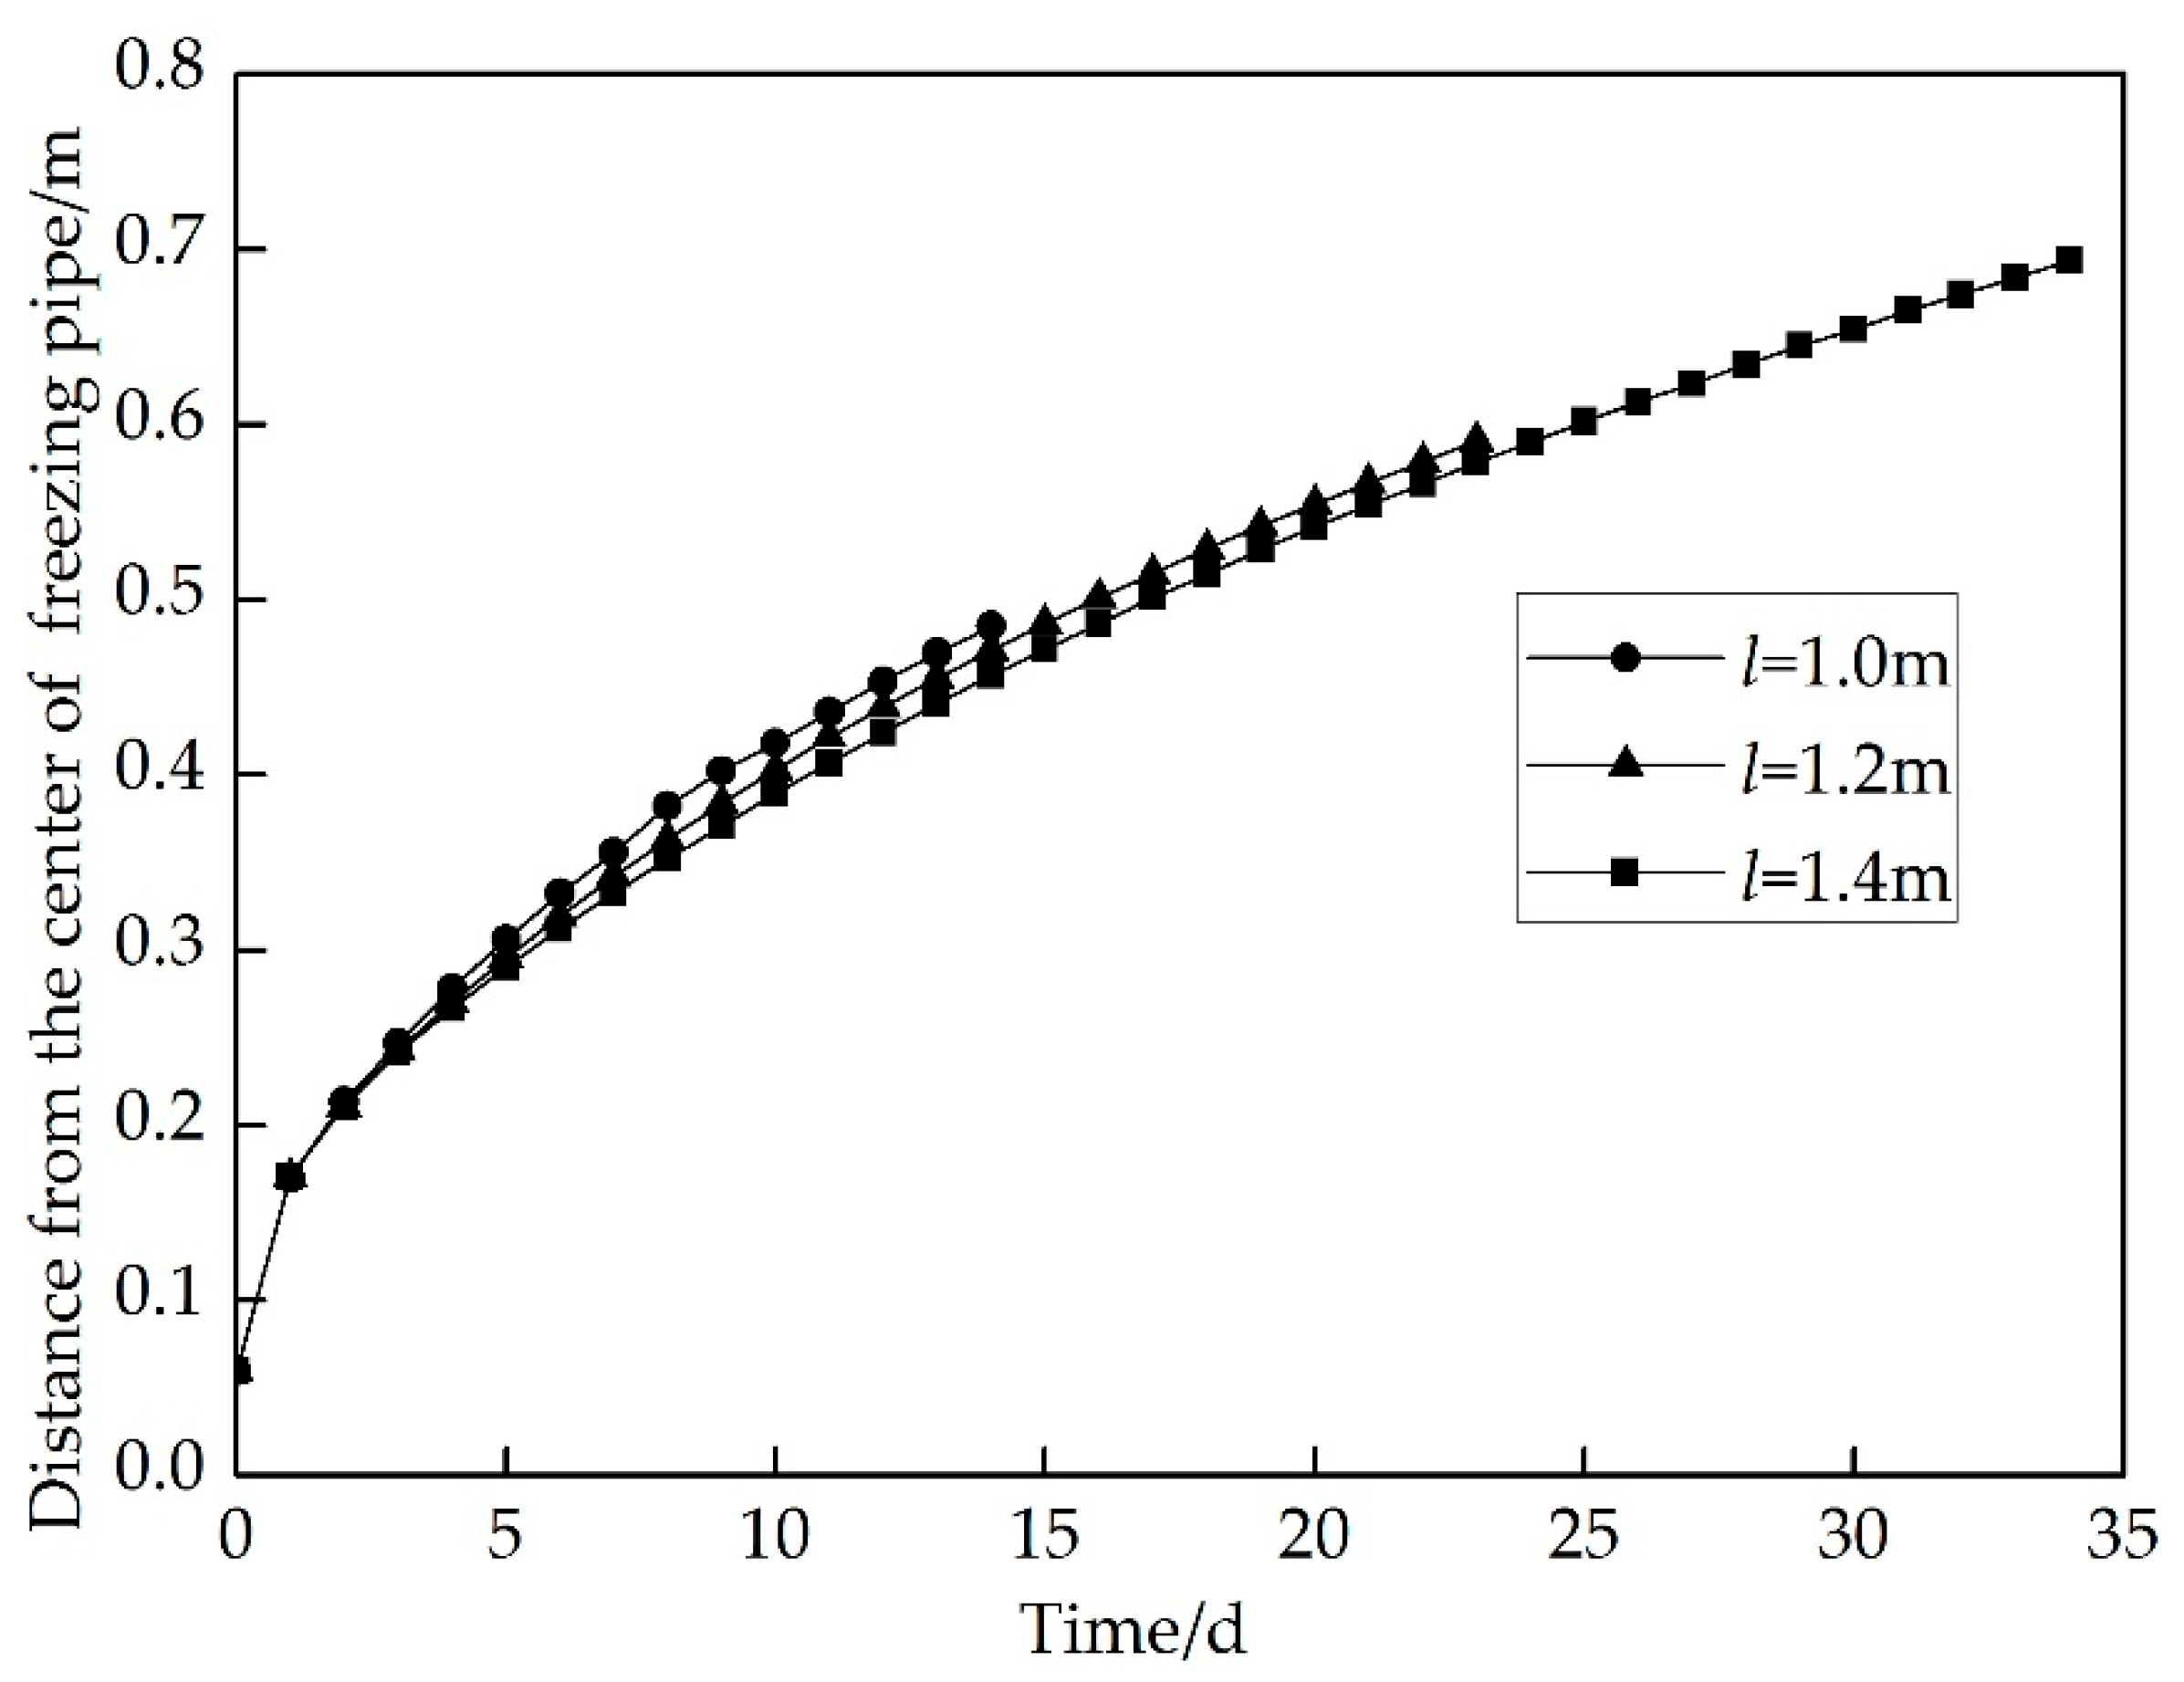
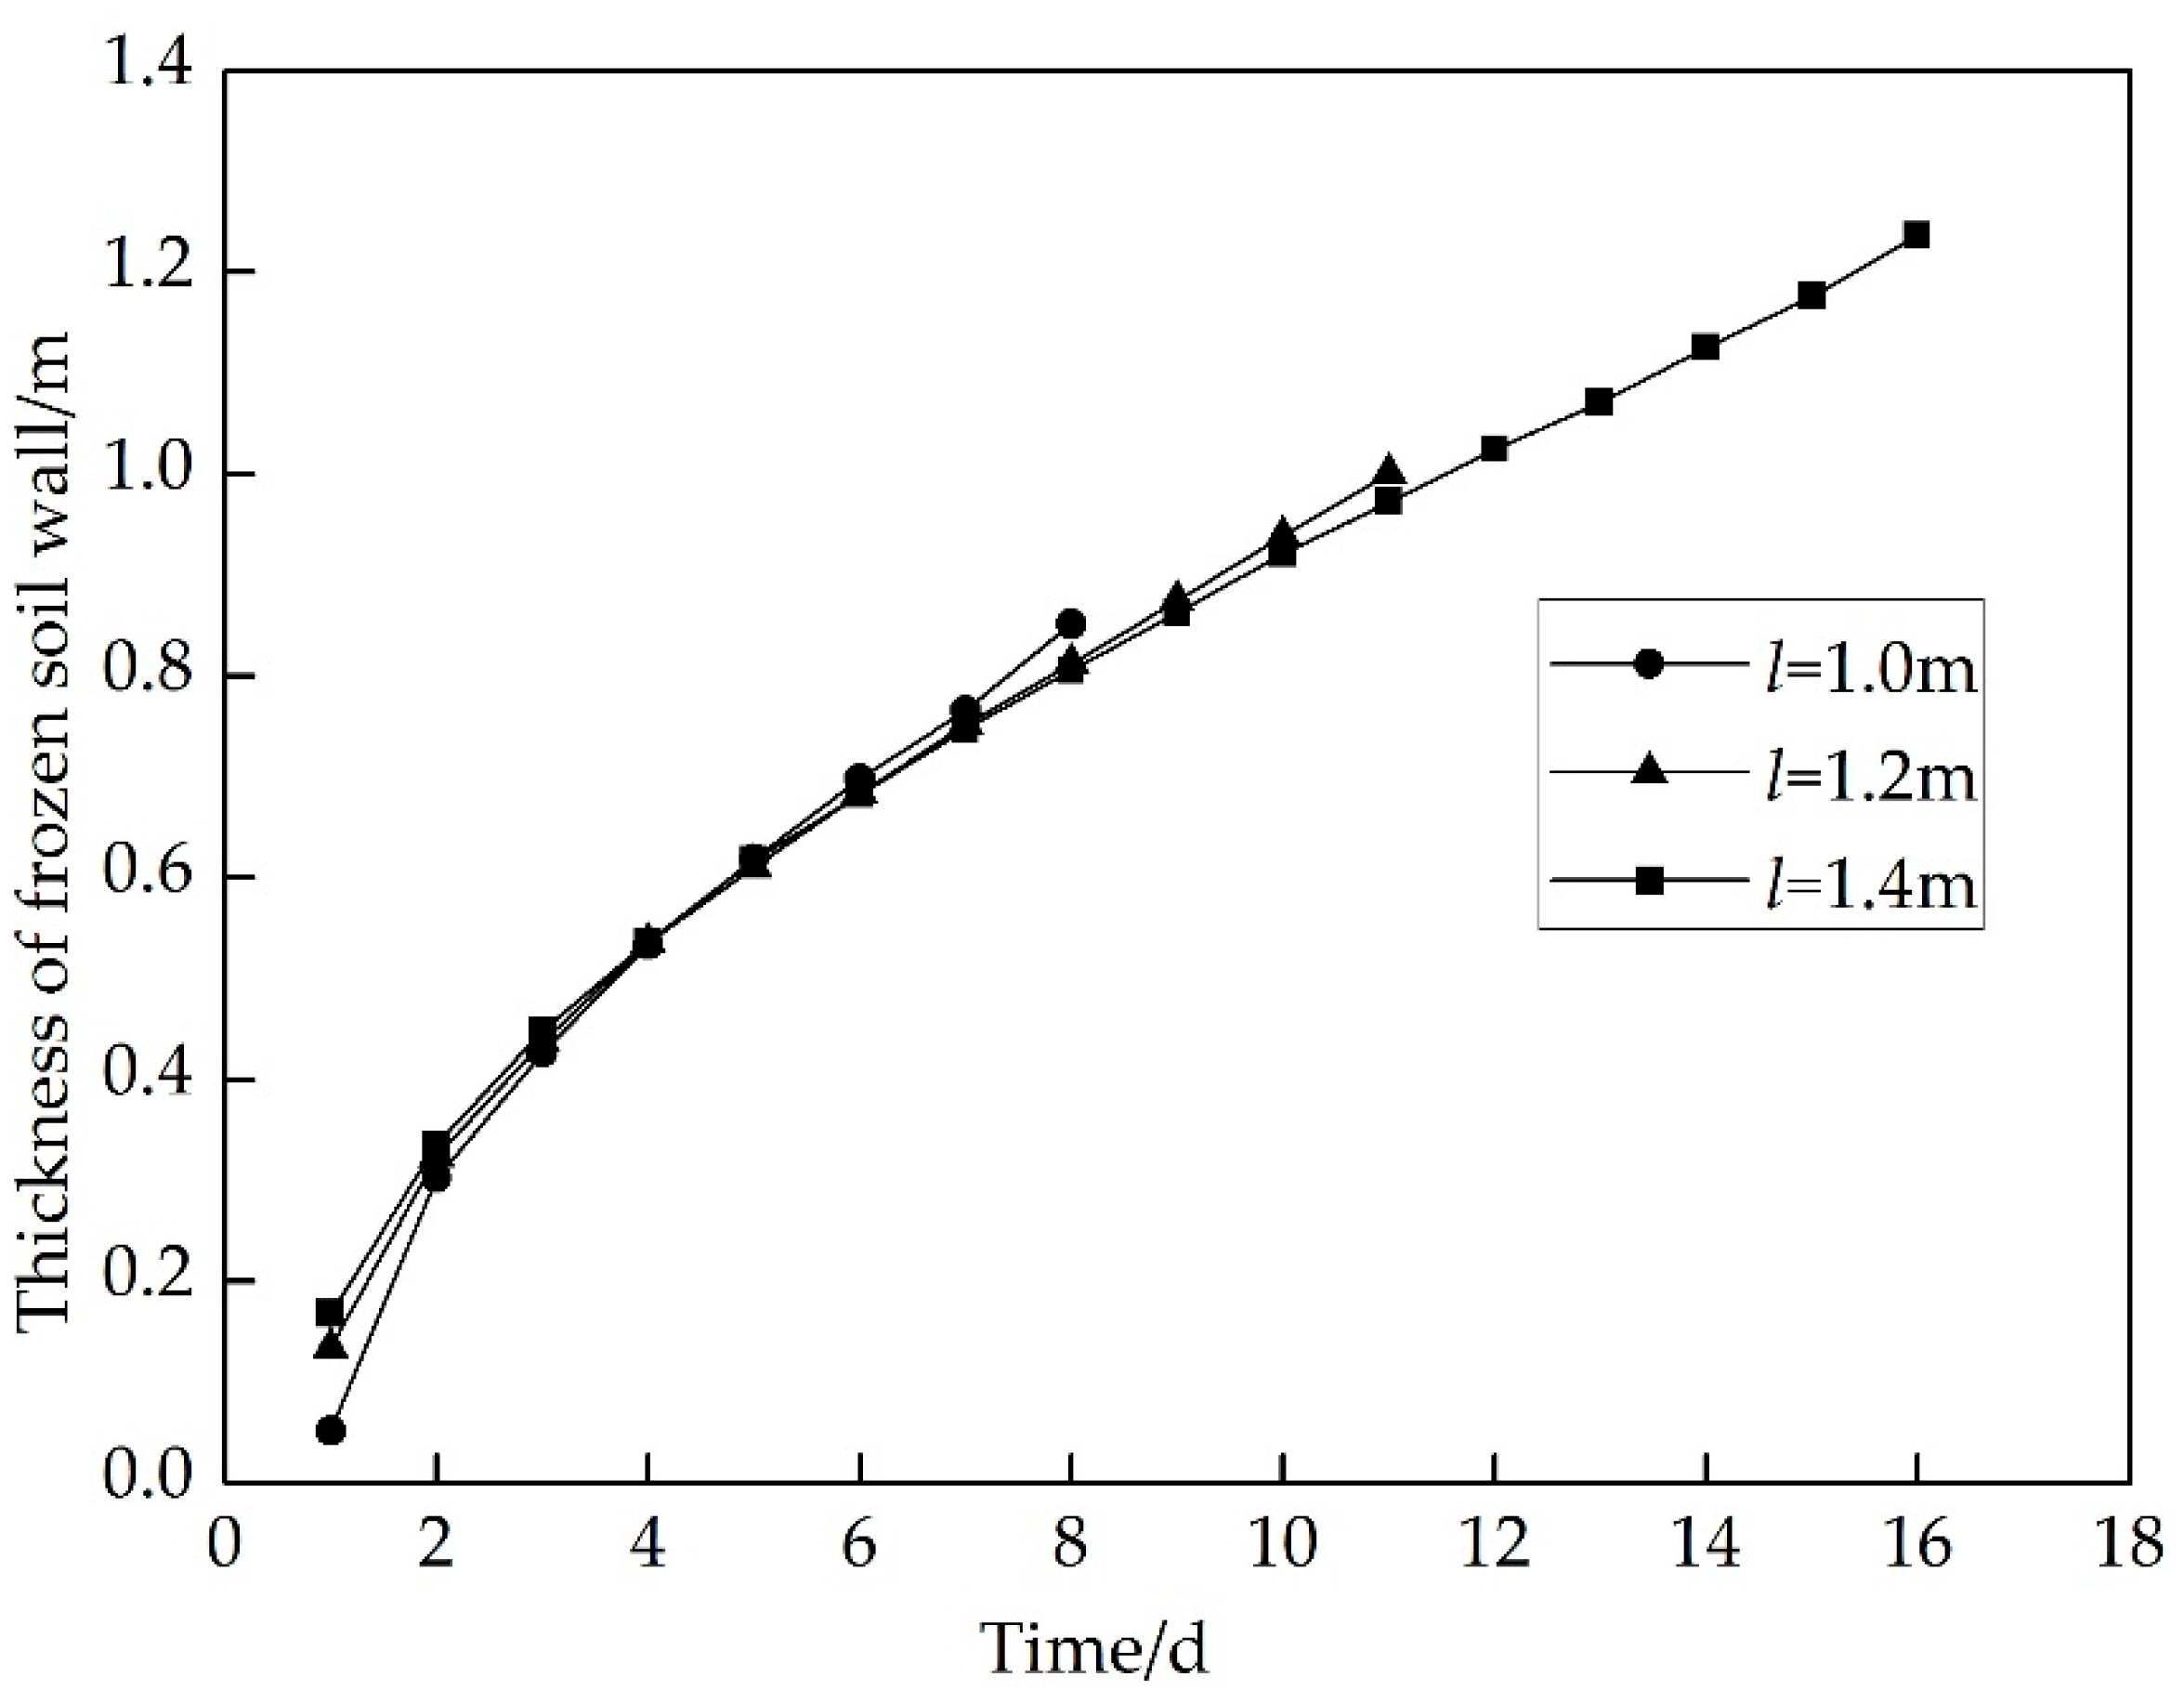
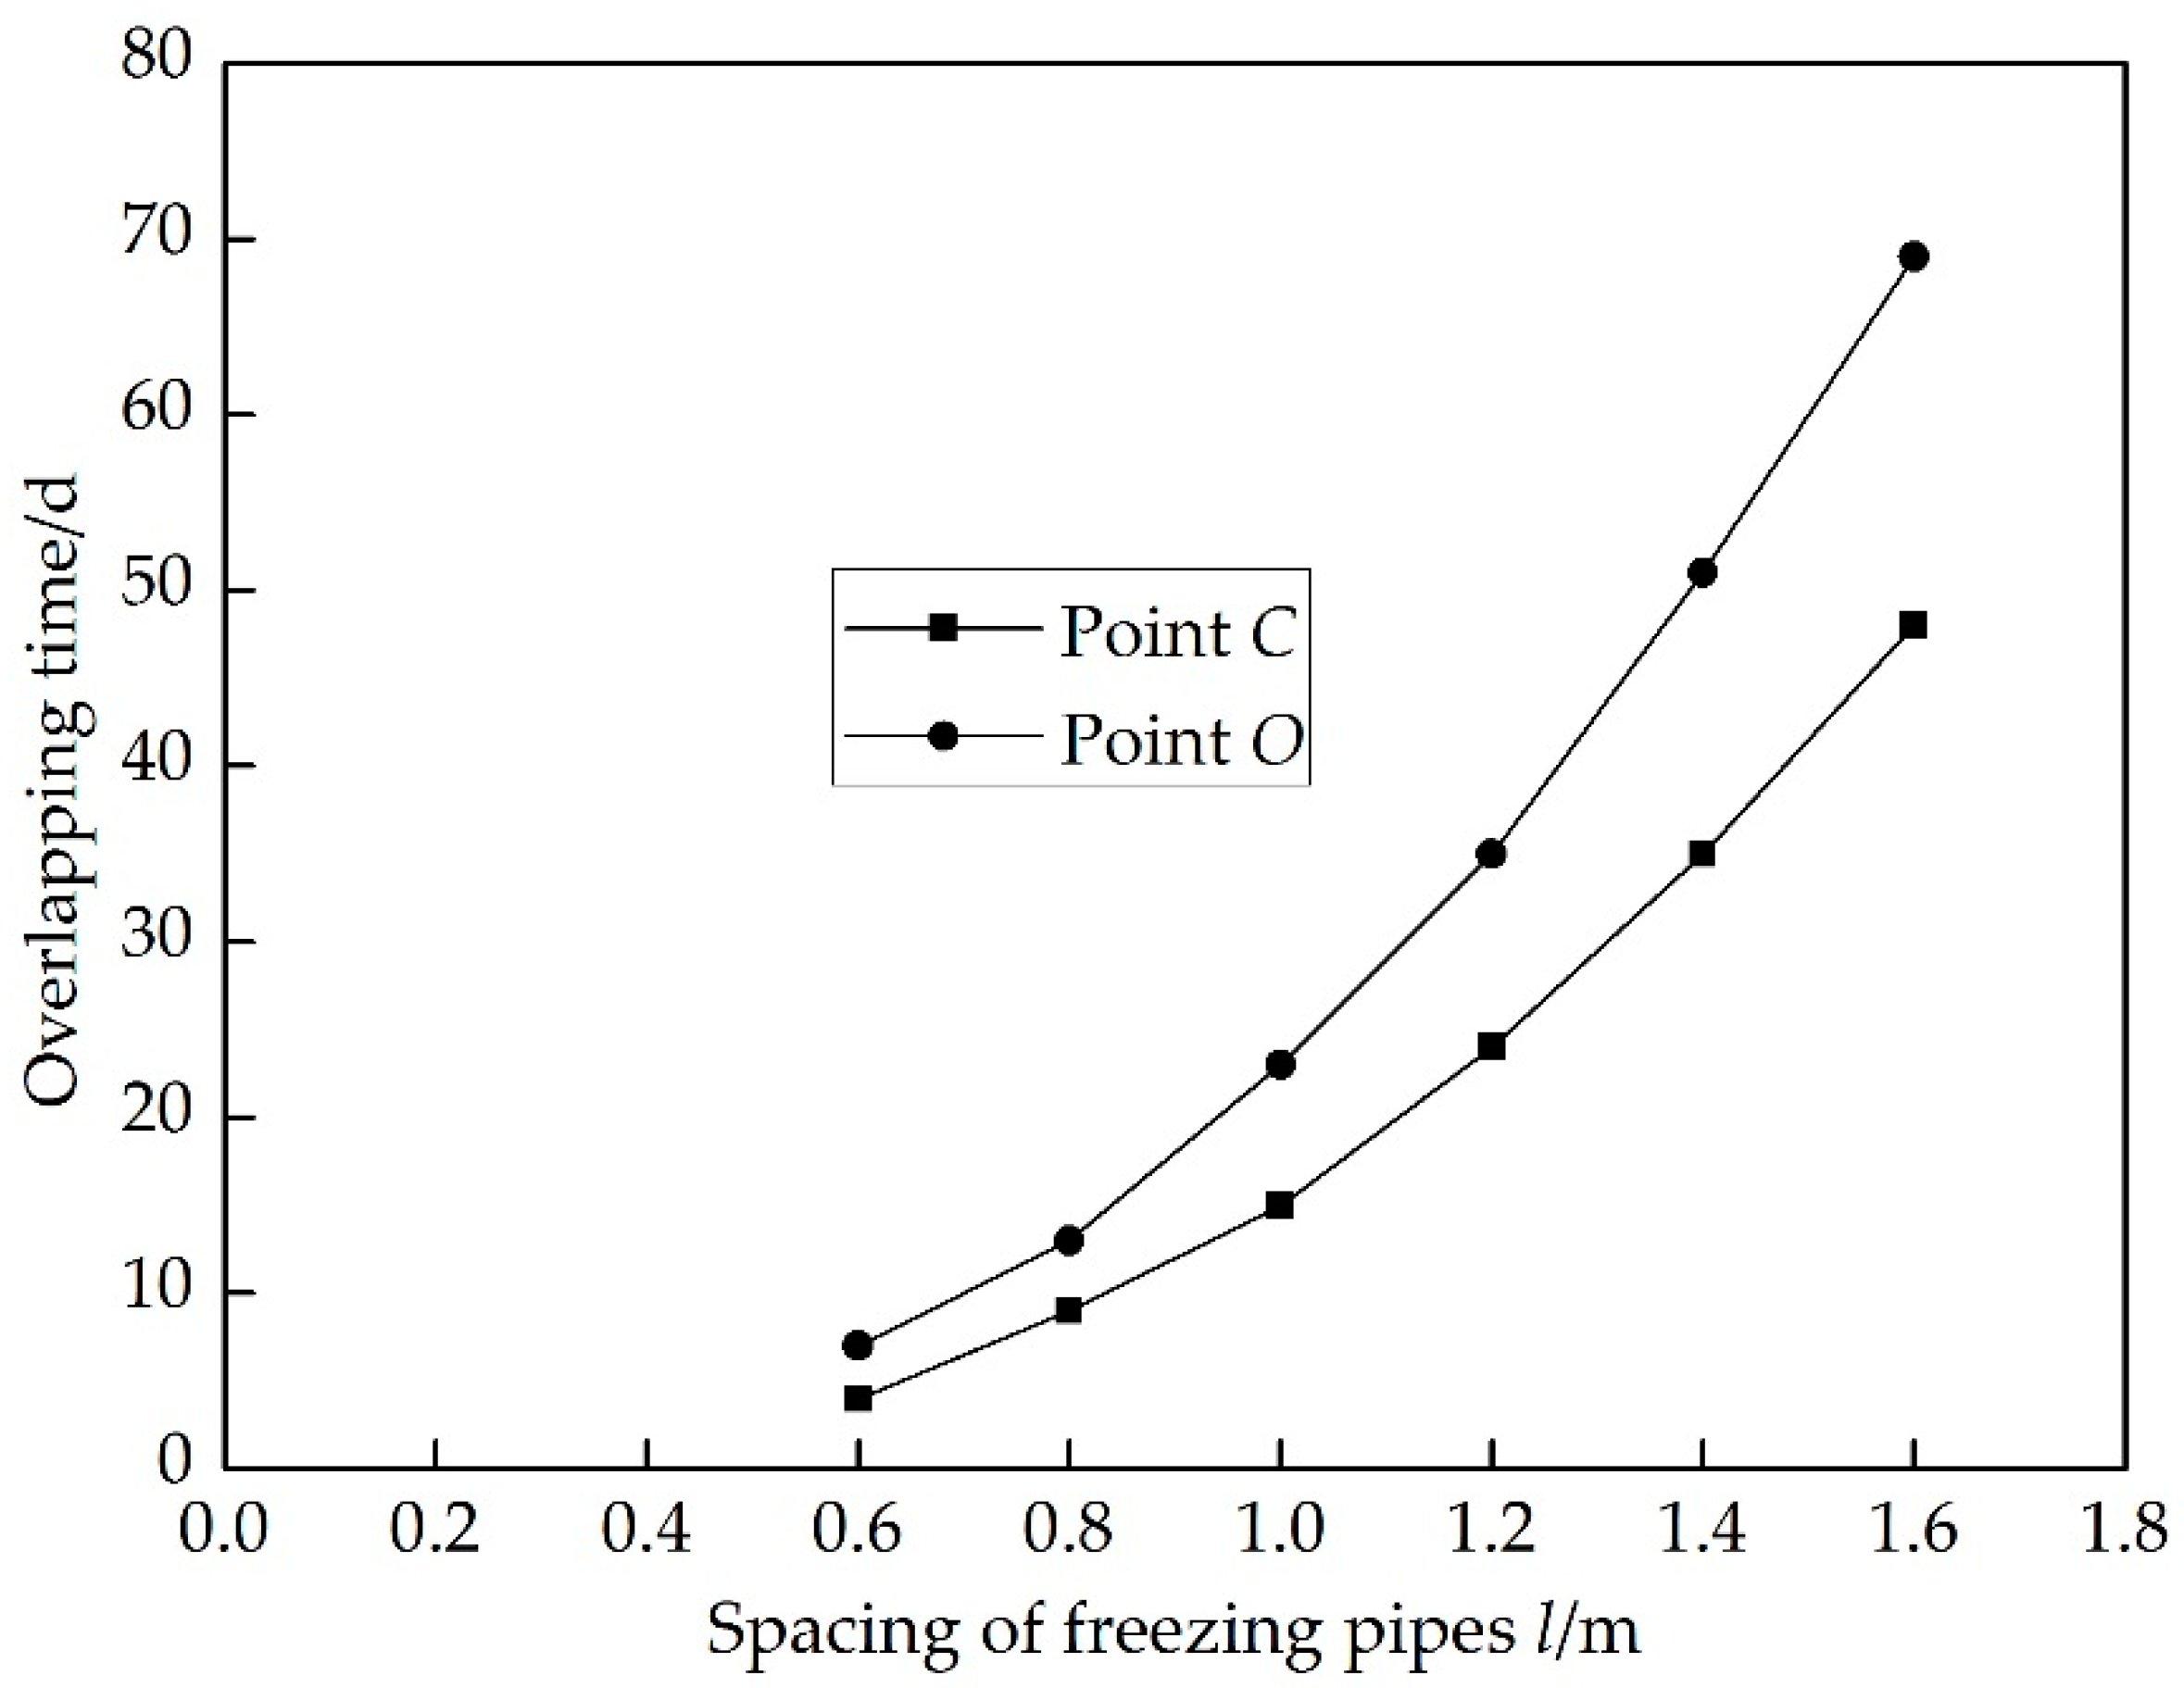
4. Results and Discussion
5. Conclusion
Author Contributions
Funding
Conflicts of Interest
References
- Marwan, A.; Zhou, M.M.; Abdelrehim, M.Z.; Meschke, G. Optimization of artificial ground freezing in tunneling in the presence of seepage flow. Comput. Geotech. 2016, 75, 112–125. [Google Scholar] [CrossRef]
- Pimentel, E.; Sres, A.; Anagnostou, G. Large-scale laboratory tests on artificial ground freezing under seepage-flow conditions. Géotechnique 2012, 62, 227–241. [Google Scholar] [CrossRef]
- Hu, X.D.; Zhang, L.Y. Analytical solution to steady-state temperature field of two freezing pipes with different temperatures. J. Shanghai Jiaotong Univ. Sci. 2013, 18, 706–711. [Google Scholar] [CrossRef]
- Li, F.; Xia, M. Study on analytical solution of temperature field of artificial frozen soil by exponent-integral function. J. Southeast Univ. 2004, 34, 469–473. (In Chinese) [Google Scholar]
- Zhou, Y.; Zhou, G.Q. Analytical solution for temperature field around a single freezing pipe considering unfrozen water. J. China Coal Soc. 2012, 37, 1649–1653. (In Chinese) [Google Scholar]
- Singh, S.; Bhargava, R. Numerical simulation of a phase transition problem with natural convection using hybrid FEM/EFGM technique. Int. J. Numer. Methods Heat Fluid Flow 2015, 25, 570–592. [Google Scholar] [CrossRef]
- Santos, M.V.; Lespinard, A.R. Numerical simulation of mushrooms during freezing using the FEM and an enthalpy: Kirchhoff formulation. Heat Mass Transf. 2011, 47, 1671–1683. [Google Scholar] [CrossRef]
- Farrokhpanah, A.; Bussmann, M.; Mostaghimi, J. New smoothed particle hydrodynamics (SPH) formulation for modeling heat conduction with solidification and melting. Numer. Heat Transf. Part B Fundam. 2016, 71, 299–312. [Google Scholar] [CrossRef]
- Furenes, B.; Lie, B. Using event location in finite-difference methods for phase-change problems. Numer. Heat Transf. Part B Fundam. 2006, 50, 143–155. [Google Scholar] [CrossRef]
- Sukop, M.C., Jr.; Thorne, D.T. Lattice Boltzmann Modeling: An Introduction for Geoscientists and Engineers; Springer: Berlin, Germany, 2010; ISBN 9783540279815. [Google Scholar]
- Guo, Z.; Shu, C. Lattice Boltzmann method and its applications in engineering. World Sci. 2013. [Google Scholar] [CrossRef]
- Mohamad, A.A. Lattice Boltzmann Method: Fundamentals and Engineering (Applications with Computer Codes); Springer: London, UK, 2011; ISBN 978-0-85729-454-8. [Google Scholar]
- Chen, L. Numerical Investigation of Multiscale Multiple Physicochemical Coupled Reactive Transport Processes in Energy and Environmental Discipline. Ph.D. Thesis, Xi’an Jiaotong University, Xi’an, China, September 2013. [Google Scholar]
- Krüger, T.; Kusumaatmaja, H.; Kuzmin, A.; Shardt, O.; Silva, G.; Viggen, E.M. The lattice Boltzmann Method: Principles and Practice; Springer: London, UK, 2017; ISBN 978-3-319-44649-3. [Google Scholar]
- Miller, W.; Succi, S.; Mansutti, D. Lattice Boltzmann model for anisotropic liquid-solid phase transition. Phys. Rev. Lett. 2001, 86, 3578. [Google Scholar] [CrossRef] [PubMed]
- Jiaung, W.S.; Ho, J.R.; Kuo, C.P. Lattice Boltzmann Method for the heat conduction problem with phase change. Numer. Heat Transf. Part B Fundam. 2001, 39, 167–187. [Google Scholar] [CrossRef]
- Huber, C.; Parmigiani, A.; Chopard, B.; Manga, M.; Bachmann, O. Lattice Boltzmann model for melting with natural convection. Int. J. Heat Fluid Flow 2008, 29, 1469–1480. [Google Scholar] [CrossRef]
- Chatterjee, D.; Chakraborty, S. An enthalpy-source based lattice Boltzmann model for conduction dominated phase change of pure substances. Int. J. Therm. Sci. 2008, 47, 552–559. [Google Scholar] [CrossRef]
- Huo, Y.; Rao, Z. Lattice Boltzmann simulation for solid-liquid phase change phenomenon of phase change material under constant heat flux. Int. J. Heat Mass Transf. 2015, 86, 197–206. [Google Scholar] [CrossRef]
- Eshraghi, M.; Felicelli, S.D. An implicit lattice Boltzmann model for heat conduction with phase change. Int. J. Heat Mass Transf. 2012, 55, 2420–2428. [Google Scholar] [CrossRef]
- Huang, R.; Wu, H.; Cheng, P. A new lattice Boltzmann model for solid-liquid phase change. Int. J. Heat Mass Transf. 2013, 59, 295–301. [Google Scholar] [CrossRef]
- Sadeghi, R.; Shadloo, M.S. Three-dimensional numerical investigation of file boiling by the lattice Boltzmann method. Numer. Heat Transf. Part A Appl. 2017, 71, 560–574. [Google Scholar] [CrossRef]
- Sadeghi, R.; Shadloo, M.S.; Jamalabadi, M.Y.A.; Karimipour, A. A three-dimensional lattice Boltzmann model for numerical investigation of bubble growth in pool boiling. Int. J. Heat Mass Transf. 2016, 79, 58–66. [Google Scholar] [CrossRef]
- Chatterjee, D.; Chakraborty, S. An enthalpy-based lattice Boltzmann model for diffusion dominated solid–liquid phase transformation. Phys. Lett. A 2005, 341, 320–330. [Google Scholar] [CrossRef]
- Li, D.; Tong, Z.X.; Ren, Q.; He, Y.L.; Tao, W.Q. Three–dimensional lattice Boltzmann models for solid–liquid phase change. Int. J. Heat Mass Transf. 2017, 115, 1334–1347. [Google Scholar] [CrossRef]
- Latif, M.J. Heat Conduction, 2nd ed.; Springer: Berlin, Germany, 2009; ISBN 9783642012662. [Google Scholar]
- Côté, J.; Konrad, J.M. A generalized thermal conductivity model for soils and construction materials. Can. Geotech. J. 2005, 42, 443–458. [Google Scholar] [CrossRef]
- Chen, P.P.; Bai, B. SPH numerical simulation of moisture migration caused by temperature in unsaturated soils. Eng. Mech. 2016. [Google Scholar] [CrossRef]
- Shamsundar, N.; Sparrow, E.M. Analysis of multidimensional conduction phase change via the enthalpy Model. ASME Trans. J. Heat Transf. 1975, 97, 333–340. [Google Scholar] [CrossRef]
- Guo, K. Numerical Heat Transfer; Anhui Science and Technology Publishing House: Hefei, China, 1987. (In Chinese) [Google Scholar]
- Qian, Y.H.; D’Humières, D.; Lallemand, P. Lattice BGK model for Navier-Stokes equation. Eur. Lett. 2007, 17, 479. [Google Scholar] [CrossRef]
- Wang, M.; Pan, N.; Wang, J.; Chen, S. Mesoscopic simulations of phase distribution effects on the effective thermal conductivity of microgranular porous media. J. Colloid Interface Sci. 2007, 311, 562–570. [Google Scholar] [CrossRef] [PubMed]
- Zhaoli, G.; Chuguang, Z.; Baochang, S. Non-equilibrium extrapolation method for velocity and pressure boundary conditions in the lattice Boltzmann method. Chin. Phys. 2002, 11, 366–374. [Google Scholar] [CrossRef]
- Qiu, F. Studies on Basic Theories and Technologies for Artificial Thawing of Artificial Frozen Soil. Master’s Thesis, Tongji University, Shanghai, China, March 2011. [Google Scholar]


| Unit | Latent Heat La | Thermal Diffusivity α | Heat Capacity Cp | Initial Temperature Ti | Freezing Temperature Tf | Temperature of Cold Source T0 | |
|---|---|---|---|---|---|---|---|
| Solid Phase αs | Liquid Phase αl | ||||||
| Physical unit | 121.09 kJ/kg | 5.97 × 10⁻⁷ m2/s | 4.86 × 10⁻⁷ m2/s | 1.449 kJ/(kg·°C) | 10 °C | 0 °C | −30 °C |
| Lattice unit | 1.0 | 0.125 | 0.10176 | 0.47865 | 1.0 | 0.75 | 0.0 |
© 2018 by the authors. Licensee MDPI, Basel, Switzerland. This article is an open access article distributed under the terms and conditions of the Creative Commons Attribution (CC BY) license (http://creativecommons.org/licenses/by/4.0/).
Share and Cite
Shen, L.; Wang, Z.; Wang, P.; Xin, L. Lattice Boltzmann Simulation for the Forming Process of Artificial Frozen Soil Wall. Energies 2019, 12, 46. https://doi.org/10.3390/en12010046
Shen L, Wang Z, Wang P, Xin L. Lattice Boltzmann Simulation for the Forming Process of Artificial Frozen Soil Wall. Energies. 2019; 12(1):46. https://doi.org/10.3390/en12010046
Chicago/Turabian StyleShen, Linfang, Zhiliang Wang, Pengyu Wang, and Libin Xin. 2019. "Lattice Boltzmann Simulation for the Forming Process of Artificial Frozen Soil Wall" Energies 12, no. 1: 46. https://doi.org/10.3390/en12010046
APA StyleShen, L., Wang, Z., Wang, P., & Xin, L. (2019). Lattice Boltzmann Simulation for the Forming Process of Artificial Frozen Soil Wall. Energies, 12(1), 46. https://doi.org/10.3390/en12010046