Article

An Analysis of the Multi-Criteria Decision-Making Problem for Distributed Energy Systems

1
School of Economics and Management, North China Electric Power University, Beijing 102206, China
2
Beijing Key Laboratory of New Energy and Low-Carbon Development, North China Electric Power University, Beijing 102206, China
*
Author to whom correspondence should be addressed.
Energies 2018, 11(9), 2453; https://doi.org/10.3390/en11092453
Submission received: 8 August 2018 / Revised: 12 September 2018 / Accepted: 13 September 2018 / Published: 15 September 2018

Abstract

:
Choosing a distributed energy system (DES) is a multi-criteria decision-making problem. Decision-makers should not only consider the cost of the system, but also consider the energy efficiency and environmental protection of the system. In order to help decision-makers choose the best DES, this paper designs seven different DESs based on specific examples, using five criteria: investment cost, operation cost, primary energy consumption, primary energy utilization, and yearly CO2 emission. Additionally, three methods of super-efficiency Data Envelopment Analysis (DEA), Technique for Order Preference by Similarity to an Ideal Solution (TOPSIS), and Complex Proportional Assessment (COPRAS) are used to evaluate the system priority and analyze the sensitivity under different decision-making scenarios. The results show that when decision-makers only consider cost factors, traditional systems are the best choice. However, renewable energy systems are the best choice when decision-makers consider energy efficiency and environmental protection rather than cost. Among them, the photovoltaic storage system is the best system in many decision-making scenarios, because of its comprehensive advantages in cost, energy efficiency, and environmental benefit. Simultaneously, the system’s prioritization of different decision-making methods is different. In this paper, according to the Spearman correlation index test, the results achieved from TOPSIS and COPRAS are relevant and feasible.

1. Introduction

A distributed energy system (DES) is based on the concept of energy cascade utilization, distributed on the demand side to achieve the comprehensive utilization of resources and renewable energy. According to the different needs of the demand-side energy-users, a DES aims to achieve the effective supply of energy, minimize the loss of transportation links, and maximize the efficiency of energy utilization.
China has a vast territory, and increasingly more power users are scattered around the country. The centralized supply of energy is difficult and the cost is high; however, a DES can effectively achieve demand-side management, reduce load peak-valley difference, reduce power supply costs, and bring about a revolutionary impact on the traditional way to supply energy [1]. Thus, DESs have a broad developmental prospect. However, with the development and maturity of different energy technologies, increasingly more technology is becoming available. For decision-makers, choosing the best DES is a complex and key issue. The traditional decision-making using cost as the single decision criterion cannot adapt to the purpose of sustainable development [2,3]. Therefore, it is necessary to consider a variety of factors comprehensively, to evaluate the DES with multiple criteria, and to ensure that the needs of the decision-makers are met.
The multi-criteria decision-making (MCDM) model provides effective ideas and methods for decision-makers. Kavvadias and Maroulis applied the multi-criteria optimization method to the cold and heat triple energy system of a hospital, and selected technology, economy, energy saving, and the environmental protection index as the optimization criteria. They obtained the optimal device capacity and operation strategy [4]. Piacentino and Cardona took a large hotel in Italy as the research object, combining the optimization of the economic standards and energy environmental standards to optimize the optimal configuration design of the system [5]. Similarly, Wang et al. made a detailed summary of the multiple attribute evaluation and decision-making methods in aspects of technology, economy, environment, and society [6]. Ren Hongbo et al., taking the distributed residential energy system in Japan as an example, integrated linear programming and the MCDM model. They evaluated the economics, energy efficiency, and environmental protection of the scheme selection of the energy system. However, the optimal solutions of different evaluation objectives and criteria and different evaluation methods are often uncertain. Therefore, further optimization and analysis of the evaluation results are needed [7]. Fetanat A et al. combined the fuzzy MCDM model, network analysis, decision-making, and evaluation test to find the best construction site for an offshore wind farm in southwestern Iran and to optimize the decision result robustly [8]. Mousavi-Nasab Seyed Hadi and Sotoudeh-Anvari [9] proposed a rank reversal model as a complement to the MCDM model. There are many evaluation methods for the MCDM model, including AHP (Analytic Hierarchy Process), VIKOR (VlseKriterijumska Optimizacija I Kompromisno Resenje), Technique for Order Preference by Similarity to an Ideal Solution (TOPSIS), Elimination and Choice Translating Reality (ELECTRE), Simple Additive Weighting (SAW), Preference Ranking Organization Method for Enrichment Evaluation (PROMETHEE), Data Envelopment Analysis (DEA), Complex Proportional Assessment (COPRAS), etc. A comparison between various methods is given in References [10,11,12]. The main methods chosen in this paper are DEA, TOPSIS, and COPRAS.
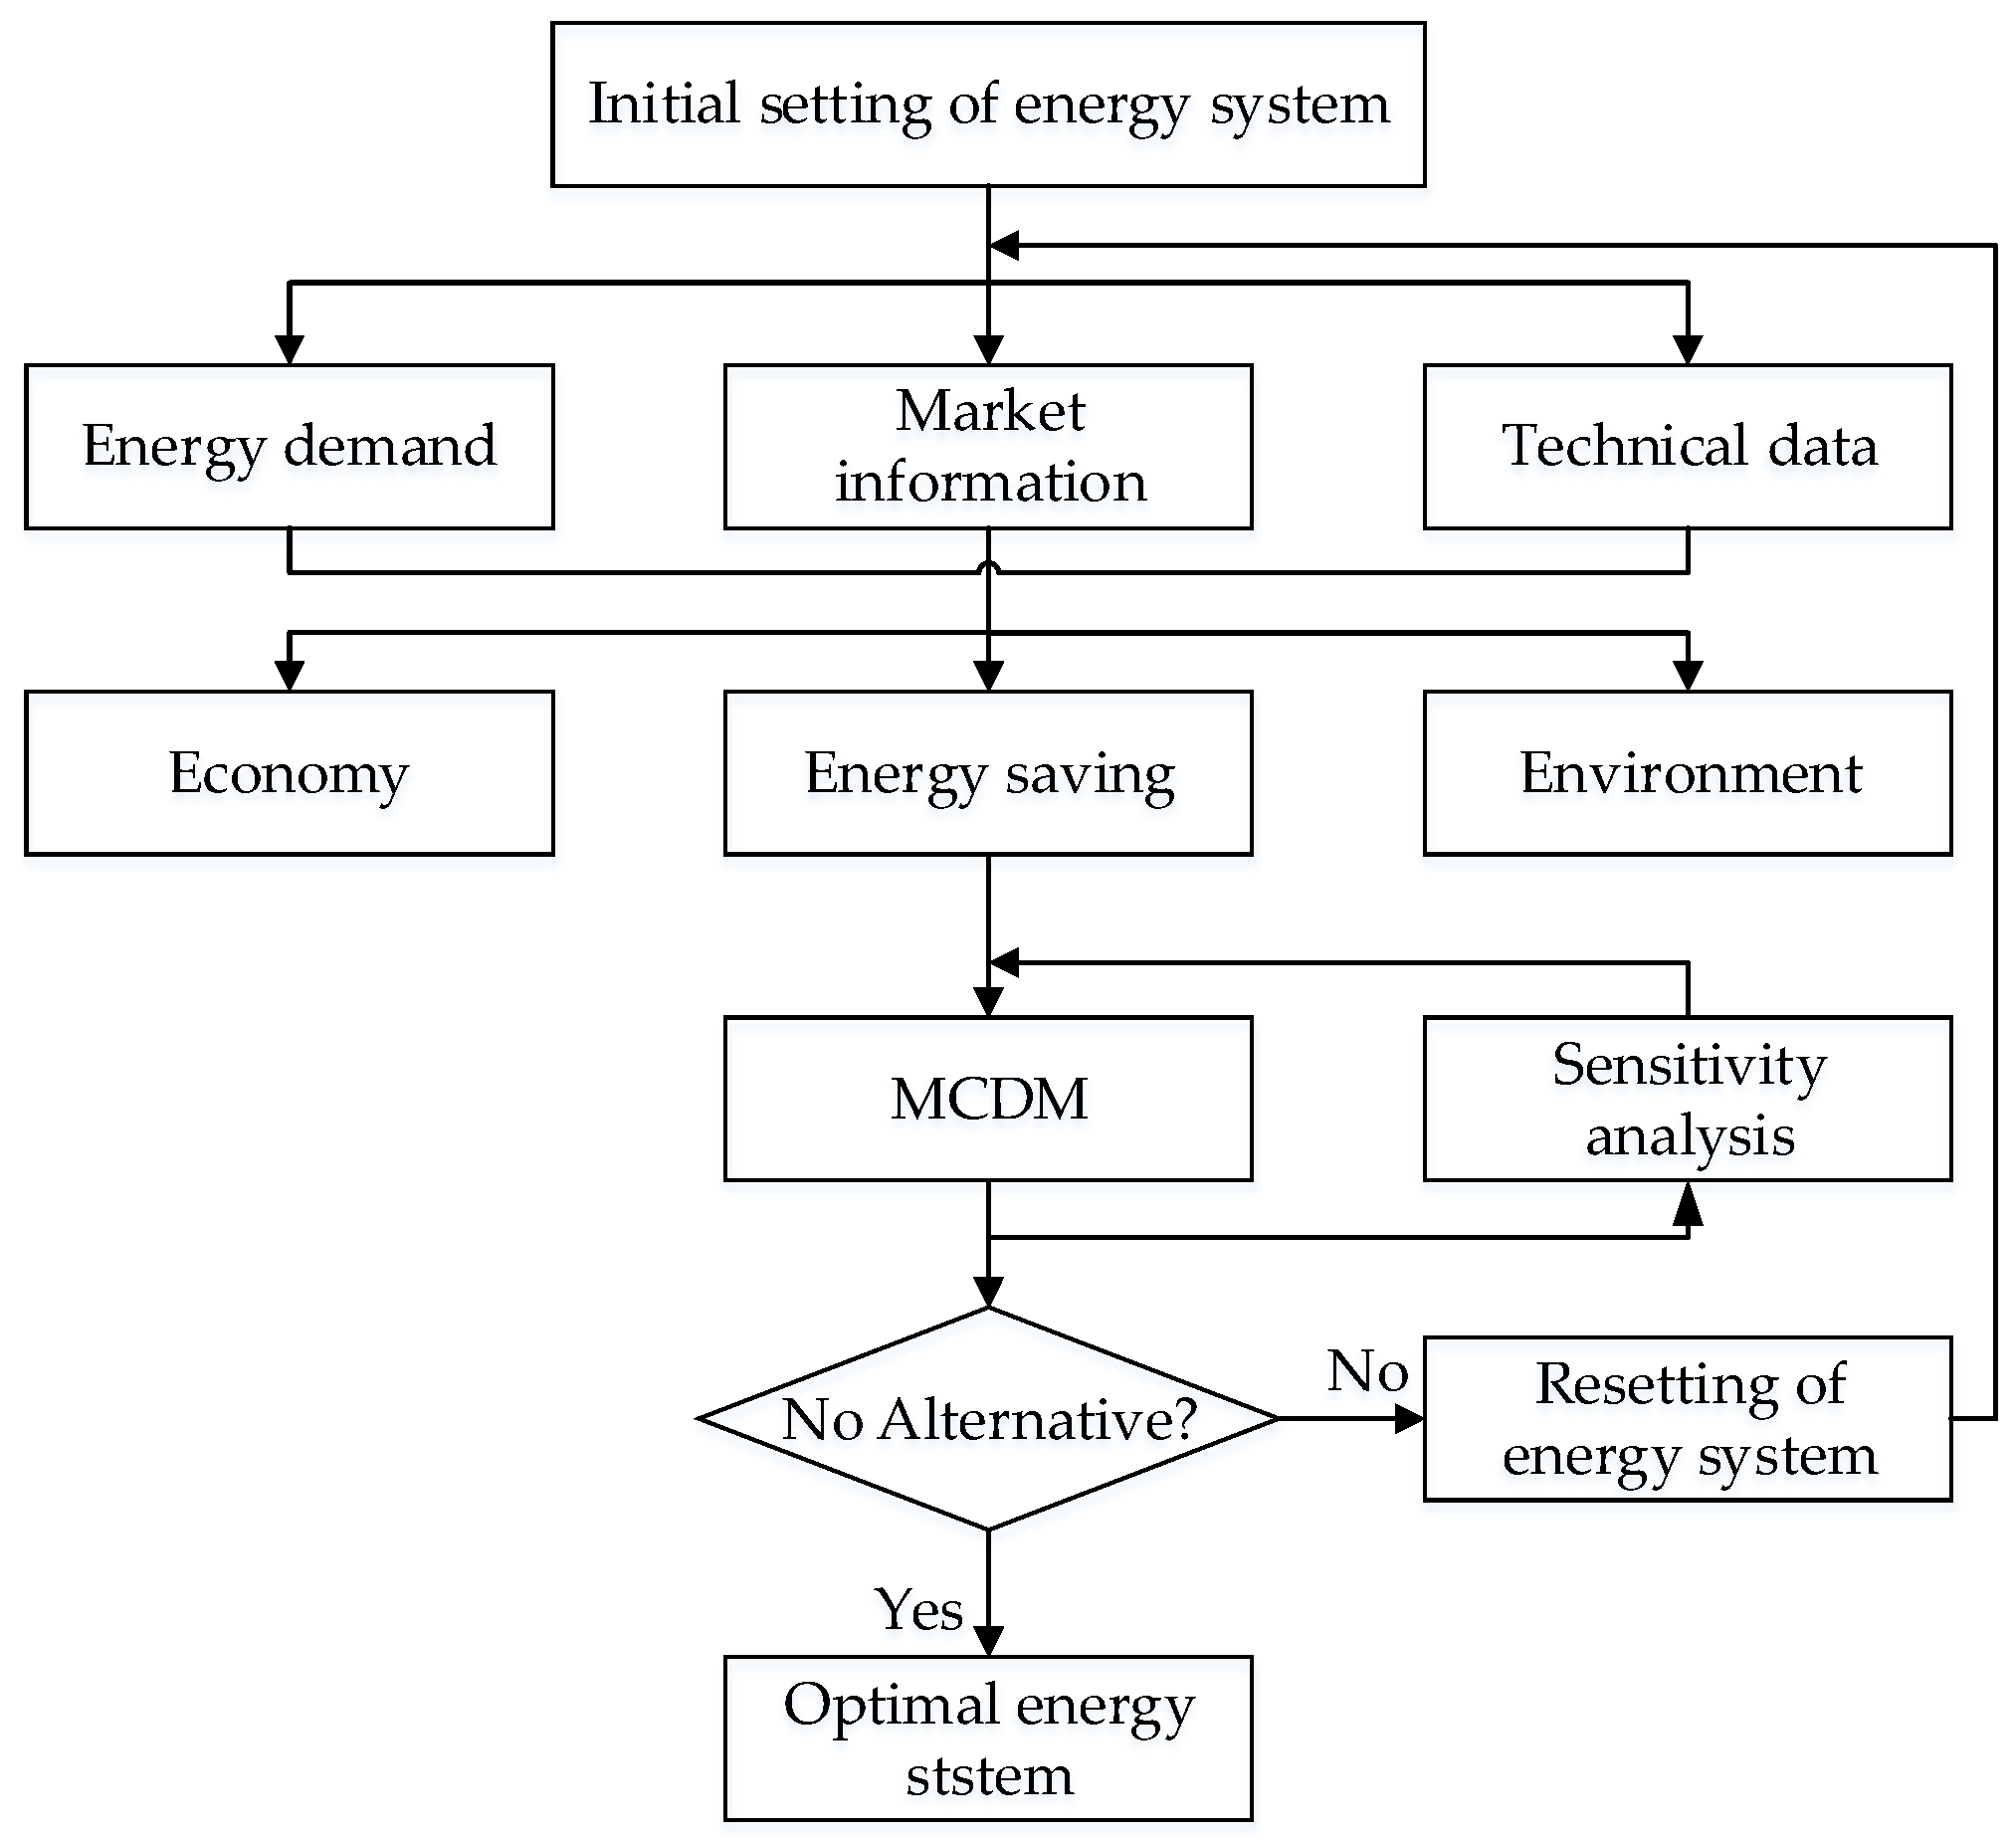
The decision-making of a DES can be regarded as a multi-criteria decision-making problem. The decision-making criteria are considered inthree aspects of economy, energy efficiency, and environmental protection. The basic outline of the whole decision-making process can be illustrated in Figure 1. Following the initial information and data of the local condition, some system alternatives can be designed to take economy, energy, and environment into consideration. Subsequently, according to the basic data of system alternatives, and by using a specific MCDM method, the overall evaluation is achieved. In order to account for the uncertainty of decision-making criteria, the sensitivity analysis is executed. Thus, all alternative energy systems are evaluated, and the ranking of the optimal energy systems can be determined.
According to the literature [13,14,15,16], the main evaluation criteria for DESs include investment cost (IC), operating cost (OC), primary energy consumption (EC), primary energy utilization (EU), and CO2 emissions (CE).

2. The Introduction of System Alternatives and Evaluation Methods

2.1. Design of System Alternatives

For this paper, a small commercial building in a province of central China was studied, which is an area with rich solar energy resources and relatively low wind energy resources. The annual average temperature is 14 °C, the annual average wind speed is 2.4 m/s, and the annual average solar radiation is 5000 MJ/m2.
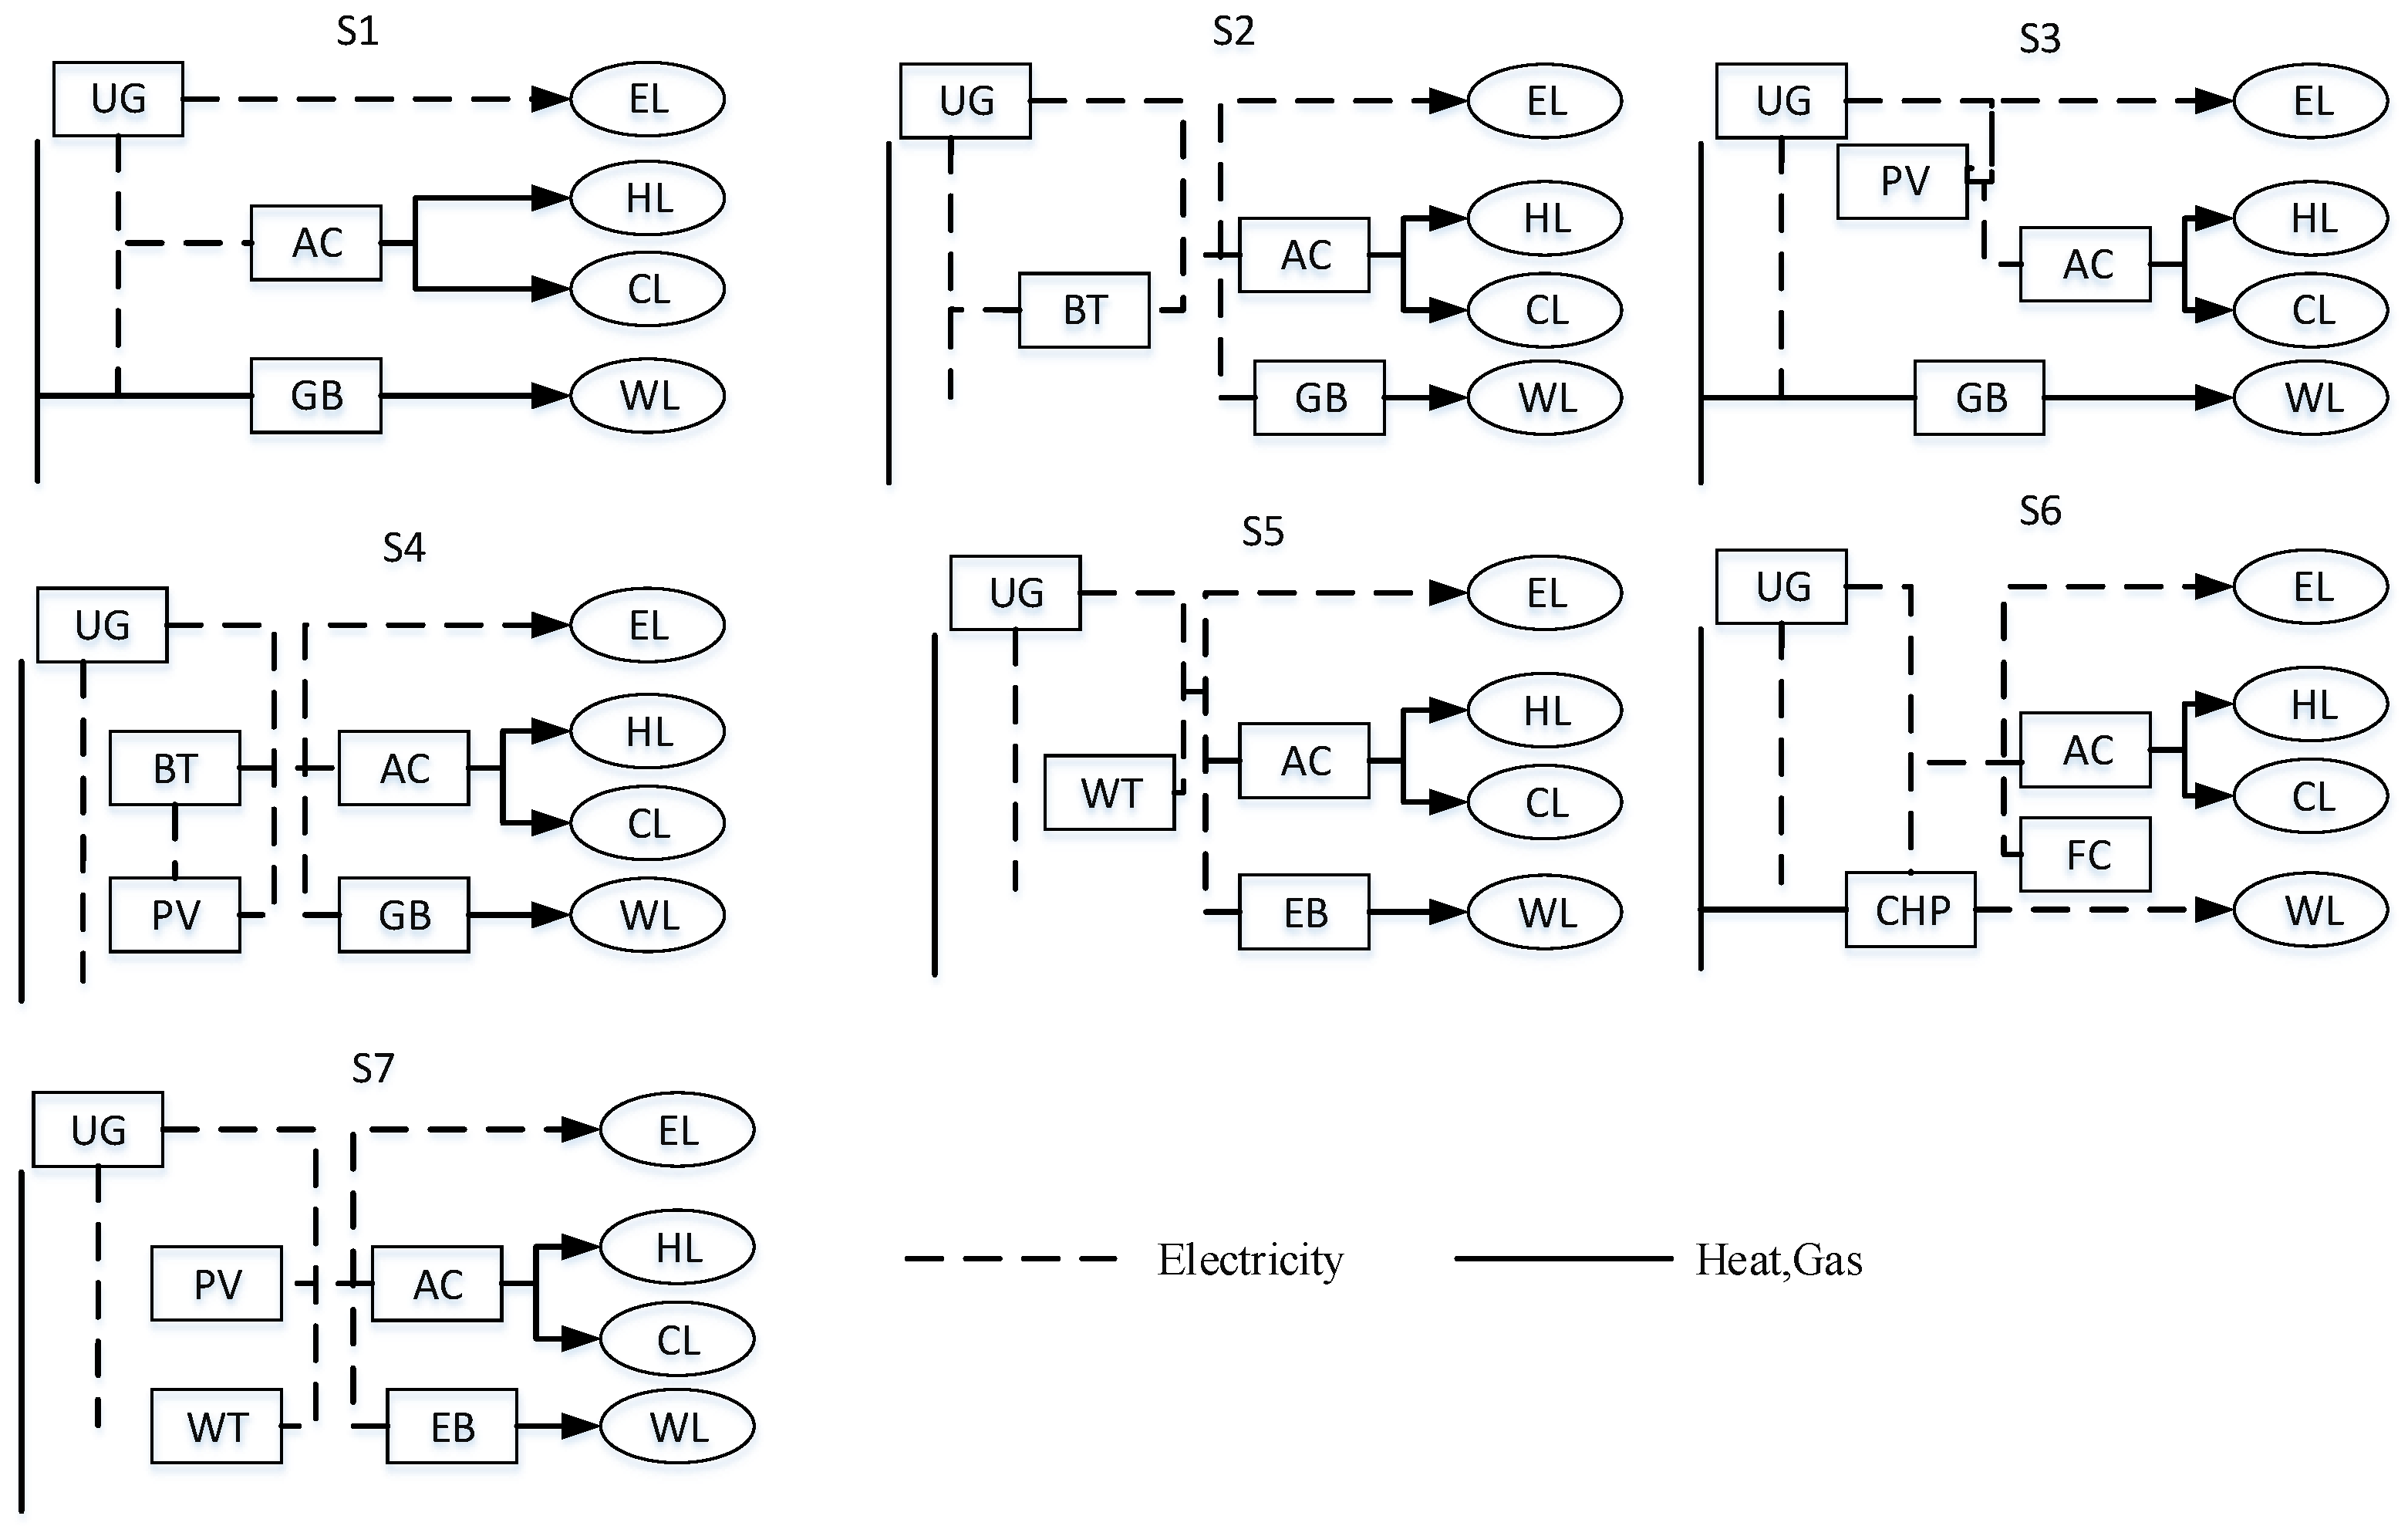
In order to optimize the energy system of the building, seven energy supply schemes [17], including the traditional energy system and the distributed renewable energy system, are selected for the comprehensive consideration of local resources, which are shown in Table 1. The choice of these system schemes is mainly determined by the local resource conditions, market conditions, and government policy trends. Moreover, traditional systems, photovoltaic systems, and wind power systems are also widely used in China. The seven alternatives provide users with cold water, hot water, and electricity needs through different technologies, as shown in Figure 2.
The main equipment and technology selected in this paper are Utility Grid (UG), Photovoltaic (PV), Wind Turbine (WT), Battery (BT), Fuel Cell (FC), Air Conditioner (AC), Gas Boiler (GB), and Electric Boiler (EB). The basic data of the seven alternatives are shown in Table 2.

2.2. The Introduction of Evaluation Methods

2.2.1. Super-Efficiency DEA

The super-efficiency DEA (SE-DEA) method is a supplement and perfection of the DEA method. The DEA method is a relative effectiveness evaluation method based on input-output data. The decision-making scheme is considered to be a decision-making unit (DMU). The indices under each decision-making unit are divided into an input index and output index, where the greater the value, the better the output index, and the opposite is true for the input index. These DMUs have certain characteristics: (1) having the same objectives; (2) having the same external environment; (3) having the same input and output indicators [18]. When evaluating the effectiveness of decision-making units, the DEA evaluation method can be used. However, in many cases, multiple decision-making units will be effective at the same time (the efficiency value is 1); hence, it is difficult to sort out alternatives. The super-efficiency DEA can effectively solve the problem of the DEA method not being able to sort out multiple effective decision units. By excluding the effective decision units outside the linear combination, the decision scheme of the efficiency value equal to 1 is further differentiated. Without changing the invalid schemes, the SE-DEA can avoid multiple decision-making units being effective at the same time, and thus make sure which system is more effective.
The basic idea of the model [19] is: suppose there are n decision-making units D M U i   ( i = 1 , 2 , , n ) , and an m evaluation index. For each decision-making unit, there are k input indices and l output indices. The corresponding input and output are X i = ( x 1 i , x 2 i , , x k i ) T , Y i = ( y 1 i , y 2 i , , y k i ) T , k + l = 1 , X i > 0 , Y i > 0 . At the same time, suppose the input weight of input indices is V = ( v 1 , v 2 , , v s , v k ) T , and the output weight of output indices is U = ( u 1 , u 2 , , u s , u l ) T . Taking the efficiency evaluation of the i decision unit as an example, the efficiency index is regarded as the target variable, and the constraint conditions include the efficiency index of all decision-making units. Both target variable and constraint conditions can form the most optimal model. Adding remaining variables S = ( s 1 , s 2 , , s k ) T , slack variables S + = ( s 1 + , s 2 + , , s l + ) T , and non-Archimedean infinitesimal quantity ε , the expression of the super-efficiency DEA model is as follows:
min [ θ ε ( e ^ T s + e T s + ) ] s . t . { i = 1 n X i λ i + s = θ x 0 i = 1 n Y i λ i s + = y 0 λ i 0 , i = 1 , 2 , n s + 0 , s 0  
In Formula (1), θ is super-efficiency and x 0 , y 0 are the input and output of decision units to be evaluated.

2.2.2. TOPSIS Method

TOPSIS uses the “ideal solution” and the “negative ideal solution” of MCDM to sort out the advantages and disadvantages of each plan. The basic idea of the model is [20] as follows.
(1) The decision matrix of a multiple-objective decision-making problem is A = ( y i j ) n × m , where y i j is the j value of the i solution. A can form a normative decision matrix: Z = ( z i j ) n × m ), among which
  z i j = y i j / i = 1 n y i j  
(2) Weighting the normalized matrix:
X = ( x i j ) n × m ,   x i j = z i j × w j   ( i   =   1 , 2 , , n ;   j   =   1 , 2 , , m )  
w j is the weight of the j index.
(3) Determining the ideal solution X * and the negative ideal solution X :
X * = { ( m a x i x i j | j J ) , ( m i n i x i j | j J ) |   i = 1 , 2 , , n } = { x 1 * , x 2 * , , x m * } X = { ( m i n i x i j | j J ) , ( m a x i x i j | j J ) |   i = 1 , 2 , , n } = { x 1 , x 2 , , x m }  
(4) Calculating the distances; the distance from each solution to the ideal solution is:
  s i * = j = 1 m ( x i j x j * ) 2     ( i   =   1 , 2 , , n )  
The distance from each solution to the negative ideal solution is:
s i = j = 1 m ( x i j x j ) 2   ( i   =   1 , 2 , , n )  
(5) Calculating the relative closeness of each solution to the ideal solution:
  c i * = s i / ( s i + s i * ) ,     0 c i * 1 ( i   = 1 , 2 , , n )    
The c i * values will be ranked from large to small: a bigger c i * value is better.

2.2.3. COPRAS Method

The COPRAS method combines the importance and utility of attributes to evaluate the scheme, which has the characteristics of a simple calculation, a wide application range, and a good evaluation effect [21]. The main evaluation process is as follows.
(1) Normalizing the matrix:
  f i j = y i j / i = 1 n y i j  
(2) Weighting the normalized matrix:
  R = ( r i j ) n × m ,     r i j = f i j × w j         ( i = 1 , 2 , , n ;   j = 1 , 2 , , m )  
(3) For the benefit index, its comprehensive benefit value is p i b ; for the cost index, its comprehensive cost value is p i c :
  p i b = j = 1 n r + i j         p i c = j = 1 n r i j         i = 1 , 2 , , m  
(4) Determining the comprehensive evaluation value:
  Q i = p i b + p m i n c × i = 1 m p i c p i c × i = 1 m p m i n c p i c = p i b + i = 1 m p i c p i c × i = 1 m 1 p i c       i = 1 , 2 , , m  
The greater the Q i value, the better the scheme.
(5) Calculating utility rate:
  U i = Q i Q m a x × 100 %       i = 1 , 2 , , m  
The utility of the optimal scheme is 100%.

3. System Scheme Evaluation

Hypothesis 1.
Decision-makers take investment cost as the most important decision criterion.

3.1. Super-Efficiency DEA Application

In the initial evaluation of each system, it was assumed that the investment cost was the most important criterion. In the original data, the primary energy utilization rate was the benefit criterion for the output index and the other was the cost criterion for the input index. In order to realize this hypothesis, the data needed to be converted to some extent; the investment cost was converted to the output index and the other to the input index. The reciprocal transformation method was used to carry out numerical conversion, and LINGO software (LINGGO12.0, Lindo System Inc, Chicago, IL, USA) used for super-efficiency DEA analysis.
The results of the analysis are shown in Table 3.
When decision-makers only consider investment cost, the traditional energy system is the best choice, while the fuel cell system is the worst choice of system. This is mainly because the traditional system has had to time to be explored and developed. Thus, the key technology has been mastered, and this can then greatly reduce the cost of investment. However, for the fuel cell system, the development cost of the battery group is high, thus its investment cost is far higher than that of the traditional system.

3.2. TOPSIS and COPRAS Application

We used the other two methods to do the same evaluation. Before evaluating via TOPSIS and COPRAS, we first needed to determine the weight of each index. This paper uses AHP to determine the weight. When more attention is paid to the investment cost criterion, the weight of investment cost is largest. The 1–9 scale method [22] was used to quantify the comparison value, and the above five criteria were compared in pairs. We used a value of 5 (obviously important) to characterize the importance of the investment cost criterion over other criteria. The importance of the other criteria is the same, and was stated as a value of 1. The layer comparison matrix of criteria is shown in Table 4 and the weights of the criteria are shown in Table 5.
Among them, the consistency test Consistency Ratio (CR) value was 0 < 0.1, making sure that the judgment matrix had better satisfaction.
According to Equations (2)–(12), we evaluated the system in two ways, using TOPSIS and COPRAS. The results of the calculations are shown in Table 6.
Similarly, under the TOPSIS and COPRAS methods, the traditional system had the highest priority value and became the optimal system only when the investment cost was paid more attention. The priority values of the fuel cell system and the energy storage system were the lowest, and thus these were the least ideal options. However, for increasingly more investors, merely considering the cost of investment in decision-making cannot meet the economic development requirements and policy constraints. Therefore, more decision-making elements need to be considered. In this paper, six different decision-making scenes were set up to analyze the sensitivity of the optimal system and to detect the least ideal system under different decision criteria. This is to ensure that the multi-criteria decision-making problem of the DES can be studied more comprehensively.

4. Discussion

4.1. Sensitivity Analysis

The above analysis was based on the hypothesis that the investment cost criterion is the most important. The six scenarios in Table 7 denote the importance of different criteria. In the table, “>” means that the decision-maker attaches more importance to the criterion before “>”, and the criteria before and after “=” are equally important to the decision-maker.
Under different decision-making scenarios, the weights corresponding to each criterion were different. Using the AHP method, we can determine the criteria weight under different scenarios, as shown in Table 8.
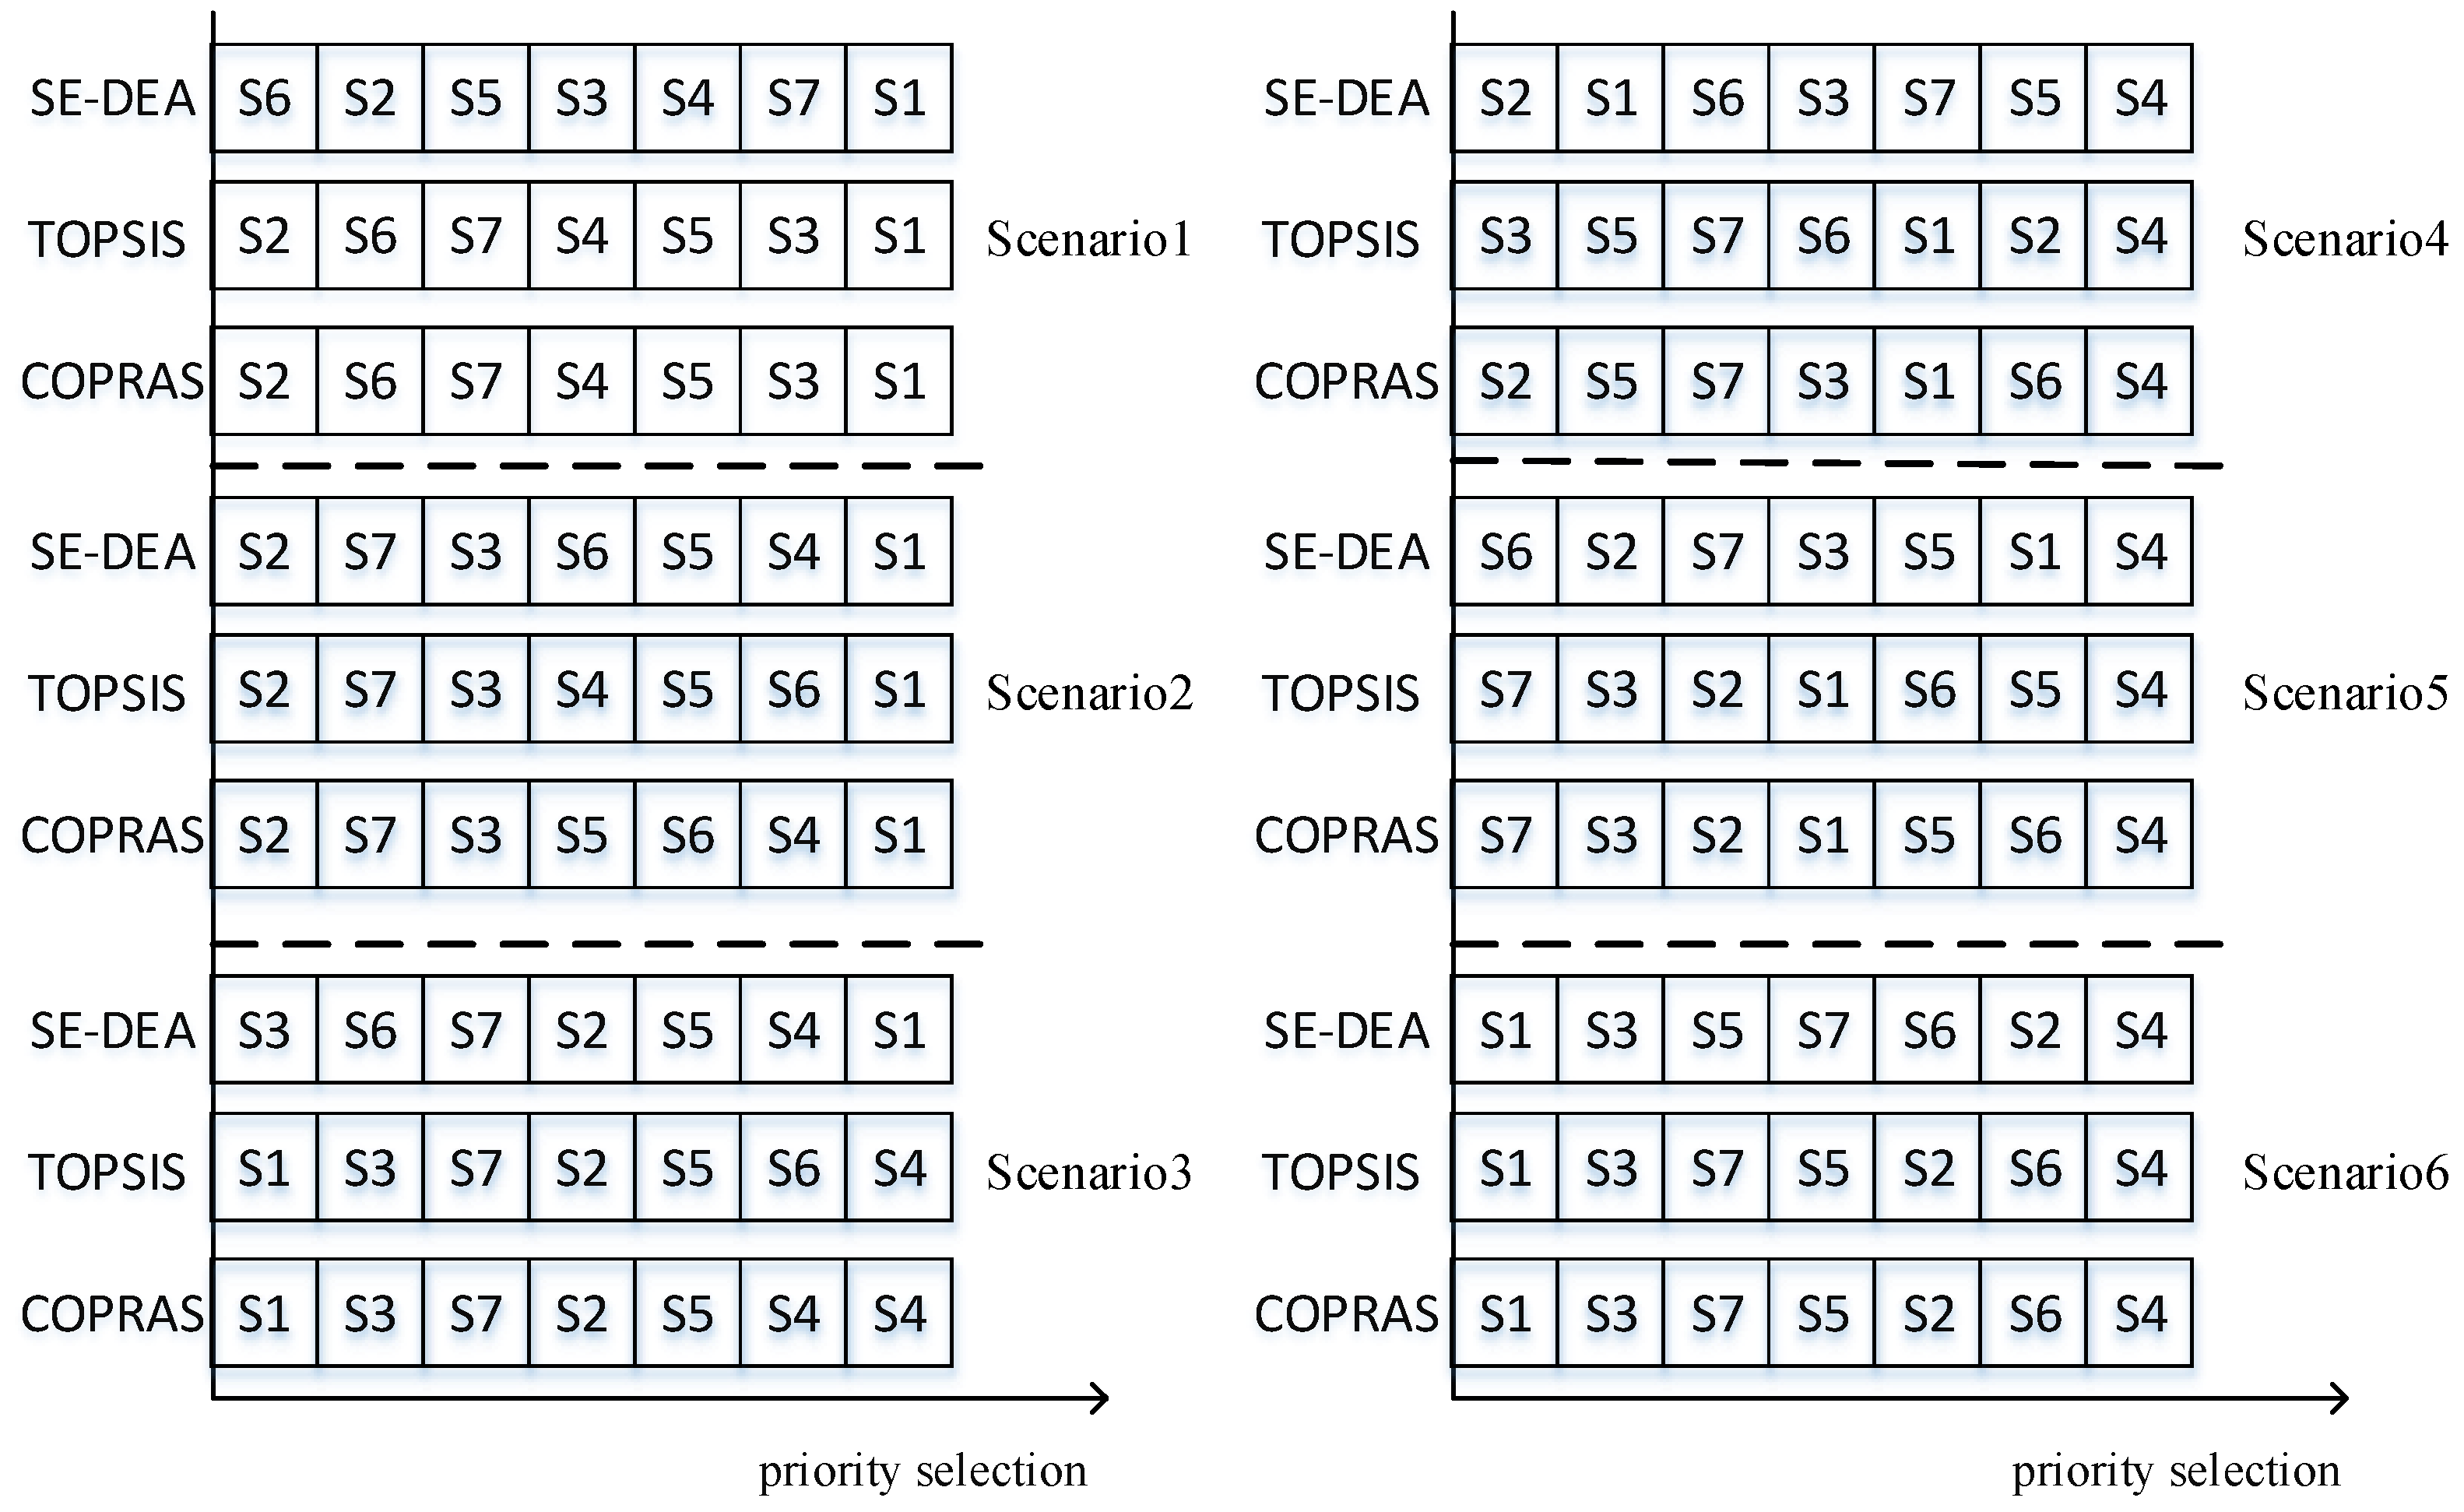
The priority values of each system under the three methods of super-efficiency DEA, TOPSIS, and COPRAS are shown in Table 9 and the priority ranking comparison is shown in Figure 3.
As can be seen from Figure 3, the evaluation results obtained by different evaluation methods were quite different. When taking the investment cost as the decision-making objective, the traditional system was the best option out of the three methods. The energy storage system was the least ideal option due to its lowest priority value. When considering the life cycle of the systems, renewable energy systems such as photovoltaic and wind power systems did not have an advantage in terms of cost. When decision-makers not only consider cost factors, the ranking of system priority will change greatly. The photovoltaic energy storage system had the highest priority value (although its priority value was second under the super-efficiency DEA method, it was the first under the TOPSIS and COPRAS methods, thus it was still considered the highest value. This refers to the choice of decision-making methods, which will be explained later) when considering the energy efficiency and the environmental criteria, which is the optimal choice for decision-makers. Generally speaking, the priority value of renewable energy systems was higher than the other systems, while the traditional system had the lowest priority value, which caused it to be the least ideal option. When the cost and energy efficiency criteria were considered in scenario four, the highest priority of the photovoltaic storage system was considered to be the best system, while the priority value rank of the traditional system will be reduced to a certain extent. Under the two methods of super-efficiency DEA and COPRAS, the photovoltaic system had the lowest priority value and was the least ideal option for decision-making. This was mainly related to the high cost of the photovoltaic system. The PV storage system was the best option for decision-makers who considered the cost and environmental criteria to be more important. The PV storage system was also the best option with comprehensive consideration for the cost, energy efficiency, and environmental criteria.
Although PV storage systems do not have an advantage in cost, the cost factor is no longer the only factor for an increasingly larger number of investors, who decide to instead take energy efficiency and environmental factors into consideration. Therefore, the photovoltaic storage system is ideal in multi-criteria decision-making because of its advantages in cost, energy efficiency, and environment. Additionally, the overall priority of fuel cells is higher, second only to the photovoltaic storage system; however, the investment cost of fuel cells is high, which is one of the key factors that restrict many investors.
As far as this article is concerned, the photovoltaic system was superior to the wind power system, which was related to the relatively less abundant wind resources and the abundant photovoltaic resources in the studied area. However, photovoltaic systems are not necessarily the best option: the energy storage system was not feasible because of its huge cost. However, the combination of photovoltaic power and energy storage technology can greatly improve the economy, energy efficiency, and environmental benefit of the DES, and thus it has become the main option for DESs.

4.2. The Selection of Evaluation Methods

There are many methods for multi-criteria decision-making, and the decision results obtained by different decision-making methods vary. In this paper, only three methods were selected to evaluate the priority values of these six energy systems. As can be seen in Figure 3, the ranking results obtained by these three methods were different in many decision-making scenarios, and some results even differ greatly. In this paper, the Spearman correlation index was used to analyze the correlation of ranking results under different decision-making methods, to provide tool for the decision-makers to find the appropriate decision-making methods [23].
  ρ = 1 6 i = 1 n d i n ( n 2 1 )  
d i is the rank difference of the two decision methods, and n is the number of ranks. The range of the value of ρ was [−1, 1]; the closer to 1, the higher the consistency of the conclusions of the two methods; however, the closer to −1, the greater the difference between the conclusions of the two methods. Zero indicated that the conclusions obtained by the two methods did not have relevance. For the evaluation results of Table 9, we used Formula (13) to calculate the index of the three methods under six scenarios, as shown in Table 10.
As can be seen in Table 10, the conclusions of super-efficiency DEA and COPRAS were the most relevant to scenario two, while in the other scenarios the Spearman correlation index of TOPSIS and COPRAS was close to +1, or even 1. This shows that TOPSIS and COPRAS were relatively better decision-making methods for the case in this paper.
TOPSIS and COPRAS both consider the weight of the criteria; however, in the super-efficiency DEA analysis, there was no constraint in the weight, which in some cases leads to a greater difference compared to the previous two methods. In scenarios three and four, the correlation coefficient between the super-efficiency DEA, TOPSIS, and COPRAS methods was negative, which shows that the conclusion obtained by using the super-efficiency DEA method was very different from the other two methods. However, this does not mean that the super-efficiency DEA method was invalid. For specific problems, it should be analyzed concretely. Moreover, the weight constraint can be introduced into the DEA model, so that it can solve the problem more accurately.
5. Conclusions

In this paper, the decision problems of DESs, including renewable energy systems, were discussed. Combined with three multi-criteria decision-making methods of super-efficiency DEA, TOPSIS, and COPRAS, we discussed the priority values of different DESs under six decision-making scenarios from three perspectives of economy, energy efficiency, and environmental protection. The following conclusions are drawn:
(1)
The decision of which DES to choose is a multi-criteria decision-making problem. Considering the economy, energy efficiency, and environmental protection of the system, the system can be evaluated using five criteria: investment cost, operating cost, primary energy consumption, primary energy utilization rate, and yearly CO2 emission.
(2)
When decision-makers only consider cost criteria, the traditional system has great advantages. However, increasingly more investors take into account the cost, energy efficiency, environmental protection, and other aspects of the system. Compared to the traditional energy system, the distributed renewable energy system is a better choice for decision-makers because of its higher energy efficiency and lower emissions.
(3)
For the small commercial buildings in this paper, the PV energy storage system has the highest priority value in multiple decision scenarios, which is the best option for decision-makers. The cost of photovoltaic and energy storage is one of the important factors that affect the distributed photovoltaic energy storage system. The development of the distributed photovoltaic energy storage project still needs national policy and incentive support.
(4)
The decision results obtained by different decision-making methods are often different or even very different. Under the Spearman correlation index analysis, among the three methods of super-efficiency DEA, TOPSIS, and COPRAS, the sorting results of TOPSIS and COPRAS have more positive correlation, thus, it is considered a relatively superior decision-making method. For different decision-making problems, different decision-making methods should be analyzed in detail.

Author Contributions

Conceptualization, Methodology and Funding Acquisition: Y.L.; Formal Analysis, Investigation, Writing—Original Draft Preparation and Writing—Review & Editing: S.S.; Resources, Data Curation, Validation and Supervision: F.Z.

Funding

This paper is supported by “Natural Science Foundation of China Project” (Grant No. 71471058), Beijing social science foundation research base project (Grant No. 17JDGLA009), and Beijing Key Laboratory of New Energy and Low-Carbon Development (North China Electric Power University), Beijing.

Acknowledgments

First of all, I would like to extend my sincere gratitude to my supervisor, Yanbin Li, for his instructive advice and useful suggestions on my thesis. I am deeply grateful of his help in the completion of this thesis. Second, I would like to express my heartfelt gratitude to the anonymous reviewers and referees, which gave me inspiration and suggestions for this paper. Last but not least, I owe much to my friends, especially Feng Zhang for his valuable suggestions and critiques which were of help and importance in making this thesis a reality.

Conflicts of Interest

The authors declare that they have no competing interests.

References

  1. Somma, M.D.; Yan, B.; Bianco, N.; Graditi, G.; Luh, P.B. Operation optimization of a distributed energy system considering energy costs and exergy efficiency. Energy Convers. Manag. 2015, 103, 739–751. [Google Scholar] [CrossRef]
  2. Jaber, J.O.; Jaber, Q.M.; Sawalha, S.A.; Mohsen, M.S. Evaluation of conventional and renewable energy sources for space heating in the household sector. Renew. Sustain. Energy Rev. 2008, 12, 278–289. [Google Scholar] [CrossRef]
  3. Catrinu, M. Decision Aid for Planning Local Energy Systems: Application of Multi-Criteria Decision Analysis. Ph.D. Thesis, Fakultet for Informasjonsteknologi Matematikk Og Elektroteknikk, Norwegian University of Science and Technology, Trondheim, Norway, 2006. [Google Scholar]
  4. Kavvadias, K.C.; Maroulis, Z.B. Multi-objective optimization of a trigeneration plant. Energy Policy 2010, 38, 945–954. [Google Scholar] [CrossRef]
  5. Piacentino, A.; Cardona, F. An original multi-objective criterion for the design of small-scale polygeneration systems based on realistic operating conditions. Appl. Therm. Eng. 2008, 28, 2391–2404. [Google Scholar] [CrossRef]
  6. Wang, J.J.; Jing, Y.Y.; Zhang, C.F.; Zhao, J.H. Review on multi-criteria decision analysis aid in sustainable energy decision-making. Renew. Sustain. Energy Rev. 2009, 13, 2263–2278. [Google Scholar] [CrossRef]
  7. Ren, H.; Gao, W.; Zhou, W.; Nakagami, K.I. Multi-criteria evaluation for the optimal adoption of distributed residential energy systems in Japan. Energy Policy 2009, 37, 5484–5493. [Google Scholar] [CrossRef]
  8. Fetanat, A.; Khorasaninejad, E. A novel hybrid MCDM approach for offshore wind farm site selection: A case study of Iran. Ocean Coast. Manag. 2015, 109, 17–28. [Google Scholar] [CrossRef]
  9. Mousavi-Nasab, S.H.; Sotoudeh-Anvari, A. A new multi-criteria decision making approach for sustainable material selection problem: A critical study on rank reversal problem. J. Clean. Prod. 2018, 182, 466–484. [Google Scholar] [CrossRef]
  10. Kumar, A.; Sah, B.; Singh, A.R.; Deng, Y.; He, X.; Kumar, P.; Bansal, R.C. A review of multi criteria decision making (MCDM) towards sustainable renewable energy development. Renew. Sustain. Energy Rev. 2017, 69, 596–609. [Google Scholar] [CrossRef]
  11. Jin, S.; Marjanovic-Halburd, L.; Nasiri, F.; Bell, S. Assessment of building-integrated green technologies: A review and case study on applications of Multi-Criteria Decision Making (MCDM) method. Sustain. Cities Soc. 2016, 27, 106–115. [Google Scholar] [Green Version]
  12. Mardani, A.; Zavadskas, E.K.; Khalifah, Z.; Zakuan, N.; Jusoh, A.; Nor, K.M.; Khoshnoudi, M. A review of multi-criteria decision-making applications to solve energy management problems: Two decades from 1995 to 2015. Renew. Sustain. Energy Rev. 2017, 71, 216–256. [Google Scholar] [CrossRef]
  13. Khalili, N.R.; Duecker, S. Application of multi-criteria decision analysis in design of sustainable environmental management system framework. J. Cleaner Prod. 2013, 47, 188–198. [Google Scholar] [CrossRef]
  14. Cavallaro, F. An Integrated Multi-Criteria System to Assess Sustainable Energy Options: An Application of the Promethee Method. Soc. Sci. Electron. Publ. 2005, 182. [Google Scholar] [CrossRef]
  15. Akorede, M.F.; Hizam, H.; Pouresmaeil, E. Distributed energy resources and benefits to the environment. Renew. Sustain. Energy Rev. 2010, 14, 724–734. [Google Scholar] [CrossRef] [Green Version]
  16. Li, H.; Nalim, R.; Haldi, P.A. Thermal-economic optimization of a distributed multi-generation energy system—A case study of Beijing. Appl. Therm. Eng. 2006, 26, 709–719. [Google Scholar] [CrossRef]
  17. Zhou, Z.; Liu, P.; Li, Z.; Ni, W. An engineering approach to the optimal design of distributed energy systems in China. Appl. Therm. Eng. 2013, 53, 387–396. [Google Scholar] [CrossRef]
  18. Bouyssou, D. Using DEA as a tool for MCDM: Some remarks. J. Oper. Res. Soc. 1999, 50, 974–978. [Google Scholar] [CrossRef]
  19. Zhu, J. Super-efficiency and DEA sensitivity analysis. Eur. J. Oper. Res. 2001, 129, 443–455. [Google Scholar] [CrossRef]
  20. Yazdani, M.; Payam, A.F. A comparative study on material selection of microelectromechanical systems electrostatic actuators using Ashby, VIKOR and TOPSIS. Mater. Des. 2015, 65, 328–334. [Google Scholar] [CrossRef]
  21. Podvezko, V. The Comparative Analysis of MCDA Methods SAW and COPRAS. Eng. Econ. 2011, 22, 134–146. [Google Scholar] [CrossRef]
  22. Pedrycz, W. Analytic Hierarchy Process (AHP) in Group Decision Making and its Optimization with an Allocation of Information Granularity. IEEE Trans. Fuzzy Syst. 2011, 19, 527–539. [Google Scholar] [CrossRef]
  23. Rao, R.V. Decision Making in Manufacturing Environment Using Graph Theory and Fuzzy Multiple Attribute Decision Making Methods; Springer: London, UK, 2012. [Google Scholar]
Figure 1. Flow chart of the multi-criteria decision-making (MCDM) model of energy systems.
Energies 11 02453 g001
Figure 2. Energy flow of various systems.
Energies 11 02453 g002
Figure 3. Comparison of the priority value rank for various scenarios with different methods.
Energies 11 02453 g003
Table 1. Description of distributed energy system (DES) alternatives.
SystemsTypesSystem Composition
S1Conventional systemUG + AC + GB
S2Energy storage systemUG + BT + AC + EB
S3PV systemUG + PV + AC + GB
S4PV energy storage systemUG + PV + BT
S5Wind systemUG + WT + AC + EB
S6Fuel systemUG + FC + AC
S7Wind solar hybrid systemUG + PV + WT + AC + EB
Table 2. Basic data of the seven systems.
SystemsInvestment Cost (10,000 Yuan)Operation Cost (10,000 Yuan)Primary Energy Consumption (MWh)Primary Energy Utilization (%)CO2 Emissions (t)
S1277189528366.6153.84
S280117747129588.4
S35971672622124.273.6
S48751472106103.545.6
S56221533272131.479.3
S68291393024116.381.3
S77671602970106.6151.1
Table 3. Priority value and rank of systems with super-efficiency DEA (SE-DEA).
SystemsS1S2S3S4S5S6S7
Priority Value1.8150.7210.9631.0220.8790.6271.033
Rank1643572
Table 4. Pair-wise comparison matrix for the five criteria.
CriteriaICOCECEUCE
IC15555
RC0.21111
EC0.21111
EE0.21111
CE0.21111
Table 5. Weight of five criteria determined using Analytic Hierarchy Process (AHP).
CriteriaICOCECEUCE
Weight0.560.110.110.110.11
Table 6. Priority value and rank of systems determined using Technique for Order Preference by Similarity to an Ideal Solution (TOPSIS) and Complex Proportional Assessment (COPRAS).
MethodsS1S2S3S4S5S6S7
TOPSISPriority Value0.7630.1410.2950.2260.2690.1930.221
Rank1724365
COPRASPriority Value0.2110.1110.1480.1330.1420.1240.132
Rank1724365
Table 7. Scenarios setting for sensitivity analysis.
ScenariosCriteria Priority
Scenario oneIC > OC = EC = CE
Scenario twoIC = OC > EC = CE
Scenario threeEC = CE > IC = OC
Scenario fourIC = OC = EC > CE
Scenario fiveEC > IC = OC = CE
Scenario sixIC = OC = EC = CE
Table 8. Weight of five criteria under six scenarios.
ScenariosICOCECEUCE
Scenario one0.560.110.110.110.11
Scenario two0.385 0.385 0.077 0.077 0.077
Scenario three0.056 0.056 0.219 0.219 0.451
Scenario four0.2380.238 0.238 0.238 0.048
Scenario five0.2190.219 0.056 0.056 0.451
Scenario six0.20.20.20.20.2
Table 9. Priority values for various scenarios with different methods.
MethodsSystemsScenario oneScenario twoScenario threeScenario fourScenario fiveScenario six
SE-DEAS11.8151.5641.4170.7191.4330.807
TOPSIS0.7630.6650.0890.4580.3070.376
COPRAS0.2110.1820.0850.14740.1300.106
SE-DEAS20.7210.9390.9840.5270.9371.066
TOPSIS0.1410.2120.4270.4780.3050.556
COPRAS0.1110.1270.1470.14710.1270.149
SE-DEAS30.9630.9860.8050.9710.9770.853
TOPSIS0.2950.2640.2570.2310.2680.431
COPRAS0.1480.1330.1130.12260.1230.127
SE-DEAS41.0221.3731.3731.871.871.226
TOPSIS0.2260.3070.9090.5360.6910.621
COPRAS0.1330.1480.2160.16540.1900.175
SE-DEAS50.8791.3041.0161.0190.980.907
TOPSIS0.2690.3150.5500.2760.5620.537
COPRAS0.1420.1400.1480.13060.1580.145
SE-DEAS60.6271.10.8590.7740.9090.933
TOPSIS0.1930.3260.6030.4440.5170.574
COPRAS0.1240.1410.1630.14780.1550.157
SE-DEAS71.0330.9540.9140.9970.9760.92
TOPSIS0.2210.2360.3150.4060.2220.497
COPRAS0.1320.1290.1280.13910.1180.139
Table 10. Spearman correlation index of paired methods.
ScenariosDEA-TOPSISDEA-COPRASTOPSIS-COPRAS
Scenario one0.4280.4281
Scenario two0.7710.9420.829
Scenario three−0.542−0.5421
Scenario four−0.828−0.60.771
Scenario five0.1430.1431
Scenario six0.8860.8861