1. Introduction
Recent rapid intensification of climate change has motivated governments to discuss the possibility of introducing renewable energy sources in the transport sector. One of the theories claims that greenhouse gases emitted largely by transport are responsible for global warming and smog in cities [
1]. On this basis, far-reaching steps have been taken to limit the emission of toxic substances by vehicles used in road transport [
2]. These activities are aimed at the development of vehicles powered by electricity. However, the limitations of electric energy storage systems cause such vehicles have a relatively short range and the charging time is rather long—it typically ranges from several minutes to hours. To address these disadvantages, several different approaches were proposed to use various types of technological solutions, such as assembly of overhead traction lines supplying vehicles over the road on which they are moving [
3] or construction of roads with a layer of photovoltaic panels with devices for wirelessly transferring energy directly to the vehicles [
4]. Other proposals involve the use of electric drive systems [
5,
6,
7,
8,
9,
10] supported by an internal combustion engine (ICE) (a hybrid electric vehicle or HEV) [
11], fuel cells (fuel cell electric vehicles or FCEVs) [
12,
13], supercapacitors [
14], hydraulic [
15] or pneumatic systems, as well as various types of electric batteries [
16] with the possibility of charging them (plug-in hybrid electric vehicles or PHEVs) (
Figure 1). The purpose of these technologies is to increase the range of vehicles while simultaneously minimizing greenhouse gas emissions. The impact analysis of using hybrid electric-combustion drive systems on the pollutants emitted by the vehicle has been presented in [
17,
18,
19].
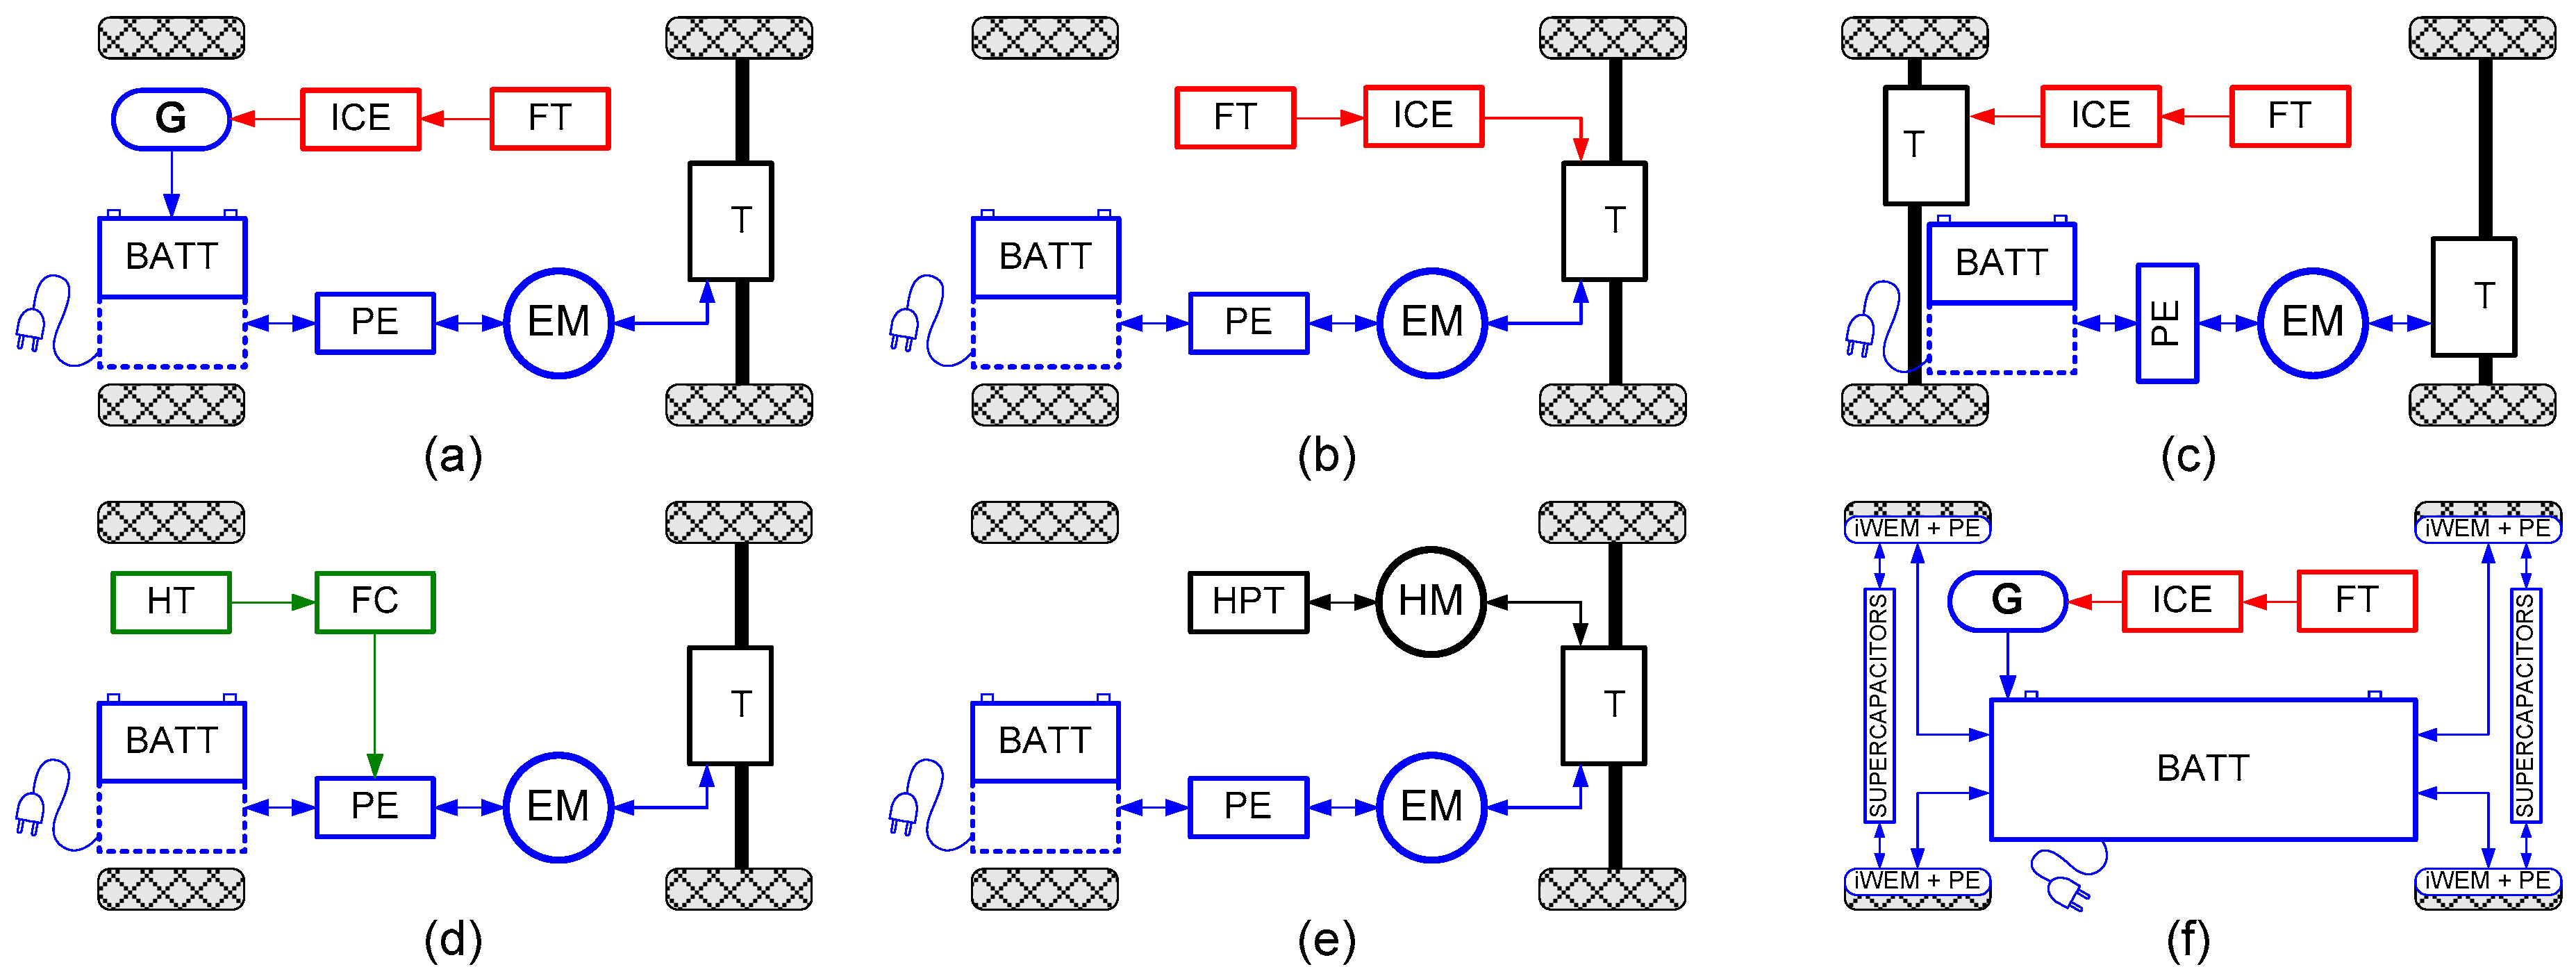
The ideal car should be emission-free, quiet, environmentally friendly, with a driving range of around 1000 km (620 miles) and inexpensive in daily operation. Most of these requirements could be met by various electric vehicle configurations (
Figure 2), however obstacles are caused by the current energy storage devices.
The list of shortcomings is long, and includes low energy density in comparison to liquid fuels, limits on charging/discharging current values (power density), limited power available from the public electrical distribution grid (available connection power, connection capacity to receive energy for bi-directional chargers mounted on the vehicle) [
20,
21], and finally, limited operating temperature. The solution could be to develop batteries with very high energy density of up to 1–1.5 kWh/kg, or employ a miniature nuclear reactors operating, for example, on a thorium-uranium cycle (Th-U) [
22]. Unfortunately, neither technology is yet available and therefore alternative solutions are desired. The use of an additional source of electricity on the vehicle or attached trailer can be a solution to this issue. One of the first technologies that was commercially introduced to increase coverage and reduce CO
2 emissions at the same time was the hybrid drive (HEV) technique, in serial or parallel configuration (
Figure 1), combining the capabilities of the ICE and the electric motor. This concept assumed the placement of an additional source of energy on board the vehicle in addition to the battery pack.
At the end of the nineties, hybrid vehicles could be found in the offerings of automotive manufacturers. Currently, these designs are modified to increase the capacity of the battery pack with the possibility of simultaneous charging from the power grid (PHEV). With the development of hybrid vehicle technology (HEV, PHEV, FCEV), vehicles powered exclusively from the battery pack (BEV) were also developed. The tendencies of the governments that have recently been observed aim at elimination of the ICE from the propulsion systems. Following this line of reasoning, and knowing that according to statistics, more than 80% of drivers do not travel more than 65 km per day [
23], it would be possible to completely remove the ICE from the hybrid vehicle and install an additional battery pack or supercapacitor bank in its place, or a hydrogen tank feeding a fuel cell [
24]. Bearing in mind constraints in the form of proposals related to the phase out of conventional ICE propulsion units from vehicles, and the low range of BEV vehicles, it was suggested to attach a trailer with a generator set or other energy source [
25] to the xEV vehicle (
Figure 3). Such a solution called range extender (RE, REX), or alternatively range extending trailer-generator, long ranger, gen set trailer, etc., allows one to operate an electric vehicle over long distances, for example when traveling between cities. In built-up areas, however, it is always possible to detach the range extender range (REX) and use the battery pack installed in the vehicle. In the world literature, one can also find REs in which reduction of greenhouse gas (GHG) emissions caused by the ICE used to increase the range of an electric vehicle is accomplished by powering them with liquefied petroleum gas (LPG), liquified natural gas (LNG), hydrogen, alcohol or biofuels [
26].
The generator sets of these types can be placed directly on the xEV vehicle or onto an attached trailer. One of the first actual designs using ICE-powered generators on a trailer was developed in 1992 by Gage from AC Propulsion (San Dimas, CA, USA) and Alan Cocconi (RXT) [
27], the creator of the technology currently used by Tesla, Inc.(Palo Alto, CA, USA) In 2011 at the Geneva Auto Show, the Swiss company Rinspeed (Zurich, Swiss) presented a conceptual solution named Dock + Go which were colloquially called “backpacks” for small city cars [
28].
A similar solution was introduced by EP Tender (Poissy, France) in 2013. The developed REX is equipped with a petrol engine driving a 25 kW generator to allow an increase of range of approx. 600 km (375 miles) for an A and B segment electric car [
29].
In 2017 BVB INNOVATE GmBH (Blackesville, Swiss) has presented a solution using a trailer with a package of batteries up to 85 kWh that can power up the EV. Batteries on the trailer can be charged at fast charging stations [
30] and can also be used as emergency energy sources, (just like the 13.5 kWh Powerwall by Tesla). In this work, the author presents the results of research related to the application of a RE (placed upon a trailer) for an BEV. In order to reduce fuel consumption and cut down emissions of toxic gases, the technique of adding steam and oxyhydrogen gas (HHO) to the intake manifold of engine was applied.
3. Modeling
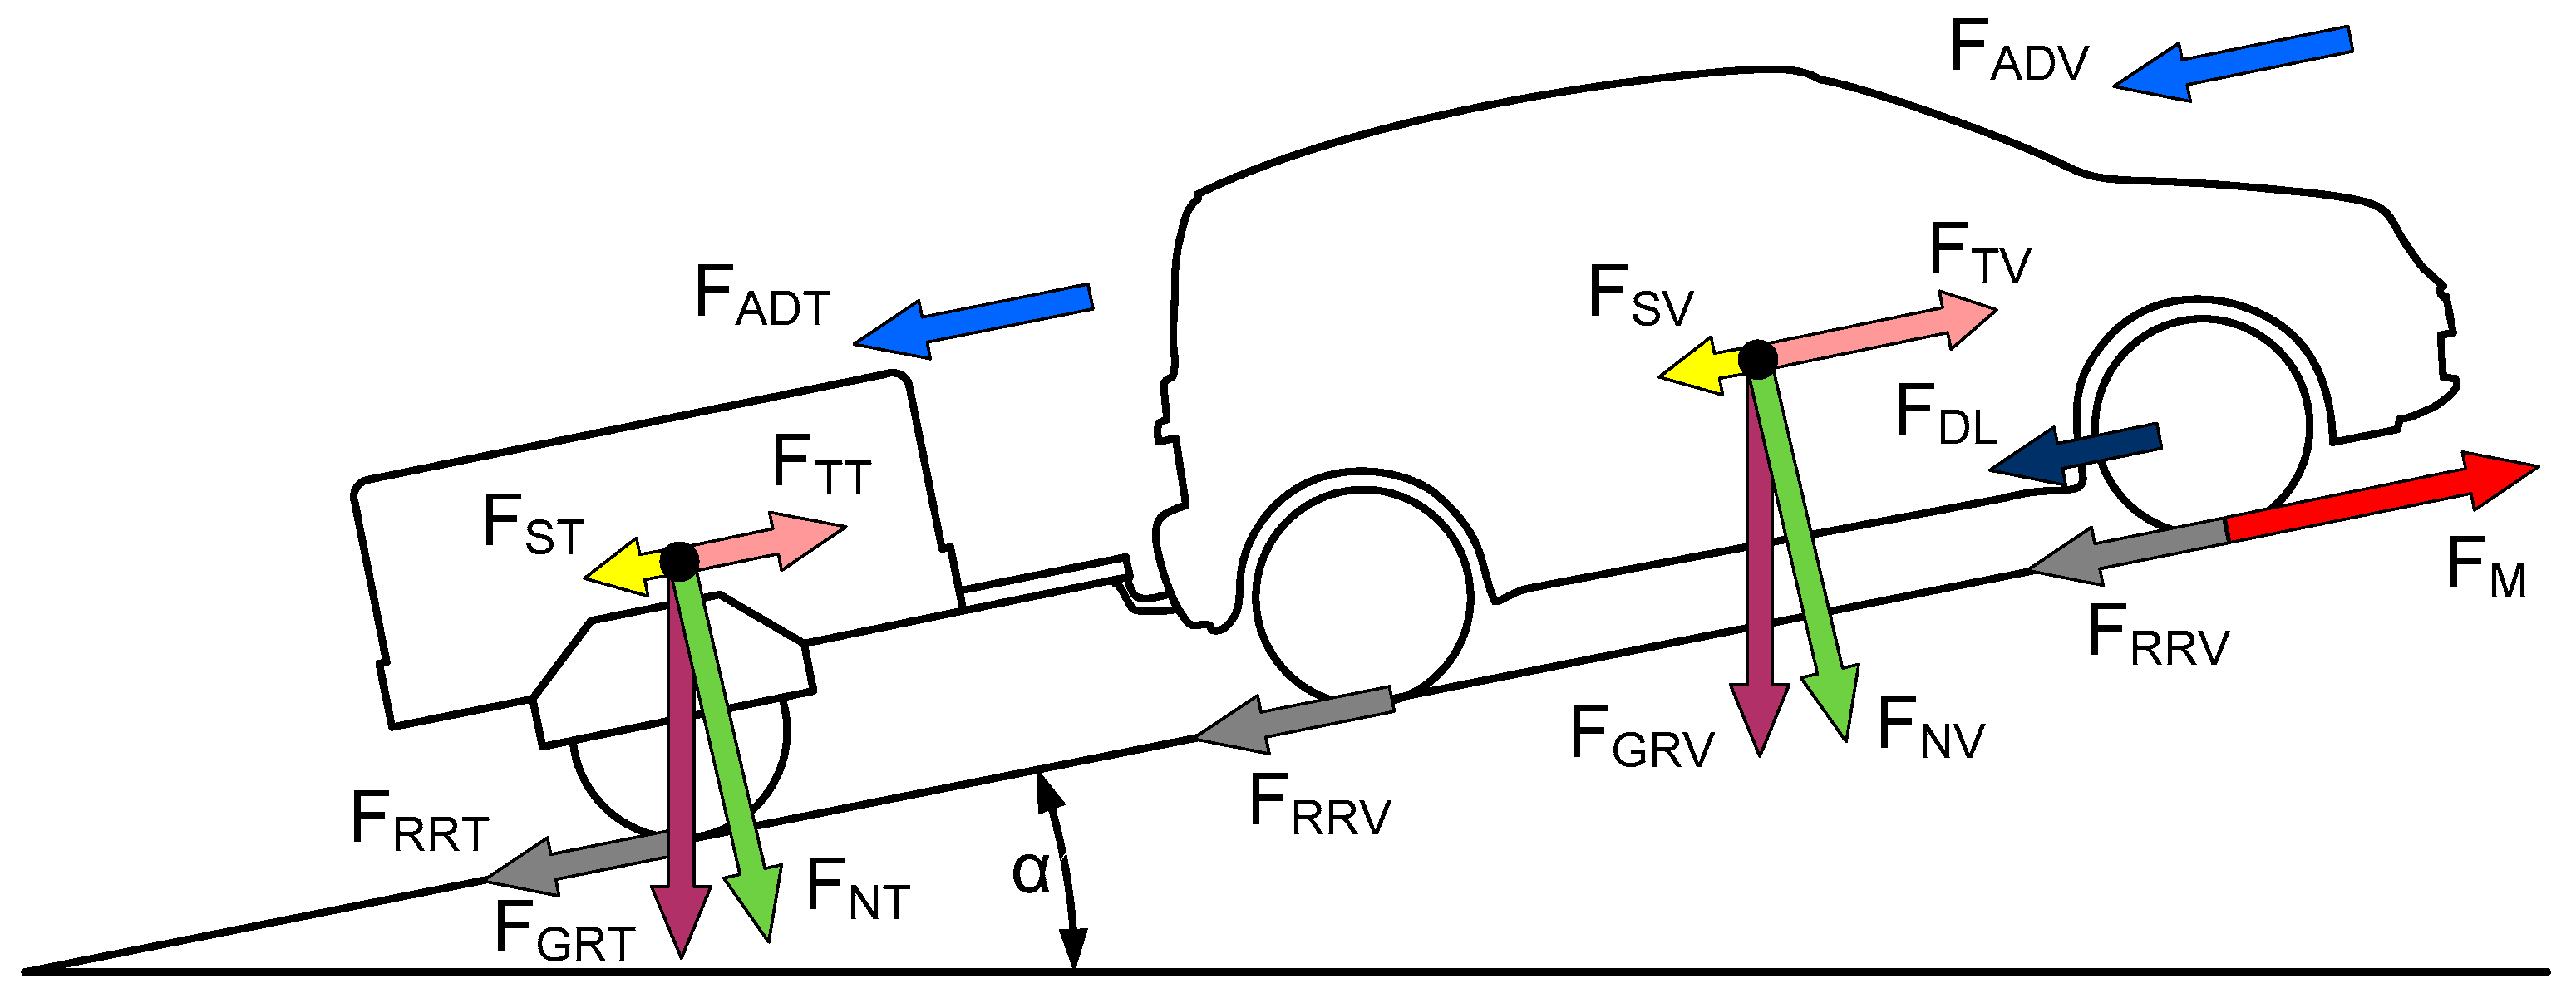
In order to model a vehicle with a trailer in motion, the forces acting on both constructions during their movement should be taken into account (
Figure 9).
The basic forces include those that are related to aerodynamic resistance, rolling resistance, sliding resistance, inertia resistance and resistances of the mechanisms in the propulsion system. For the vehicle to be able to move, the sum of forces associated with the resistances must be less than the force generated by the propulsion system.
Table 1 gives a description of the symbols used and their meaning.
The forces acting on the vehicle combination can be expressed on the basis of the relationship:
The aerodynamic drag forces for the vehicle combination were determined from the equations:
The rolling resistance forces for the vehicle combination were determined based on the dependence:
The sliding forces for the vehicle combination are based on:
The resistance forces of the transmission system related to the movement of the vehicle combination were determined basing on:
wherein:
Inertia resistance forces related to the acceleration and braking of the vehicle combination were obtained based on:
The source of the driving force is the torque generated by the electric motor driving the wheels through: clutch, gearbox, differential and drive axles:
The driving power on the wheels is equal to the product of the linear speed
v and the driving force
FM:
Since the losses of the transmission are taken into account in the description of the
FDL force, it can be assumed that the propulsive power on the wheels is equal to the driving power generated by the vehicle’s engine:
The power of the electric drive motor is equal to the power generated by the inverter minus the efficiency of the motor at a given operating point. The motor power is equal to the product of the engine torque and its rotational speed:
The power generated by the inverter is equal to the power taken from the battery pack and generators decreased by the efficiency factor of the inverter:
The power drawn from the battery pack is equal to the product of the current flowing through the battery and its voltage reduced by the efficiency coefficient:
The power generated by the generator sets is equal to the product corresponding to the power of the fuel consumed and the efficiency of the generating set:
By generating electricity, the RE consumes fuel-petrol or diesel. Depending on the type of fuel selected, the parameters of the efficiency of fuel-energy conversion and the calorific value of a kilogram of fuel are defined.
The chemical power flow for petrol and diesel fuel, PFP and PFD, respectively, is defined as the product of the weight of fuel burned over time of mFD’(t) and mFP’(t) respectively and the corresponding calorific value of fuel HsD and HsP.
The mass of fuel consumed and energy produced from it by RE is determined by the equation:
The calorific value
H for diesel fuel equals:
HsD = 38 MJ/kg, and for unleaded petrol equals:
HsP = 32 MJ/kg. Based on the mass of fuel consumed and the CO
2 emission factor for diesel fuel (
EFD) and petrol (
EFP), the mass of emitted carbon dioxide generated by the generating set (diesel—
mCO2D), petrol—
mCO2P) is calculated as well as the total mass of the emitted carbon dioxide (
mCO2).
The modeling of the emission of other gases—carbon monoxide and nitrogen oxides, is based on the volume of emissions recorded during real road tests, measured using an exhaust gas analyzer. The basis for calculating the CO and NOx emissions of each generating set is the mass of carbon dioxide emitted multiplied by the mass CO/CO2 emission factor named kCx and the mass NOx/CO2 emission factor named kNx. The kCx and kNx values take into account the effect of additions given to the intake manifold of the ICE of the generating sets. The index of x coefficients defines the type of fuel, D for diesel and P for gas, respectively.
The total mass of emitted
mCO is the sum of the masses of carbon monoxide emitted by the diesel generator set (
mCOD) and the petrol generating set (
mCOP):
3.1. Description of Test Vehicle Parameters
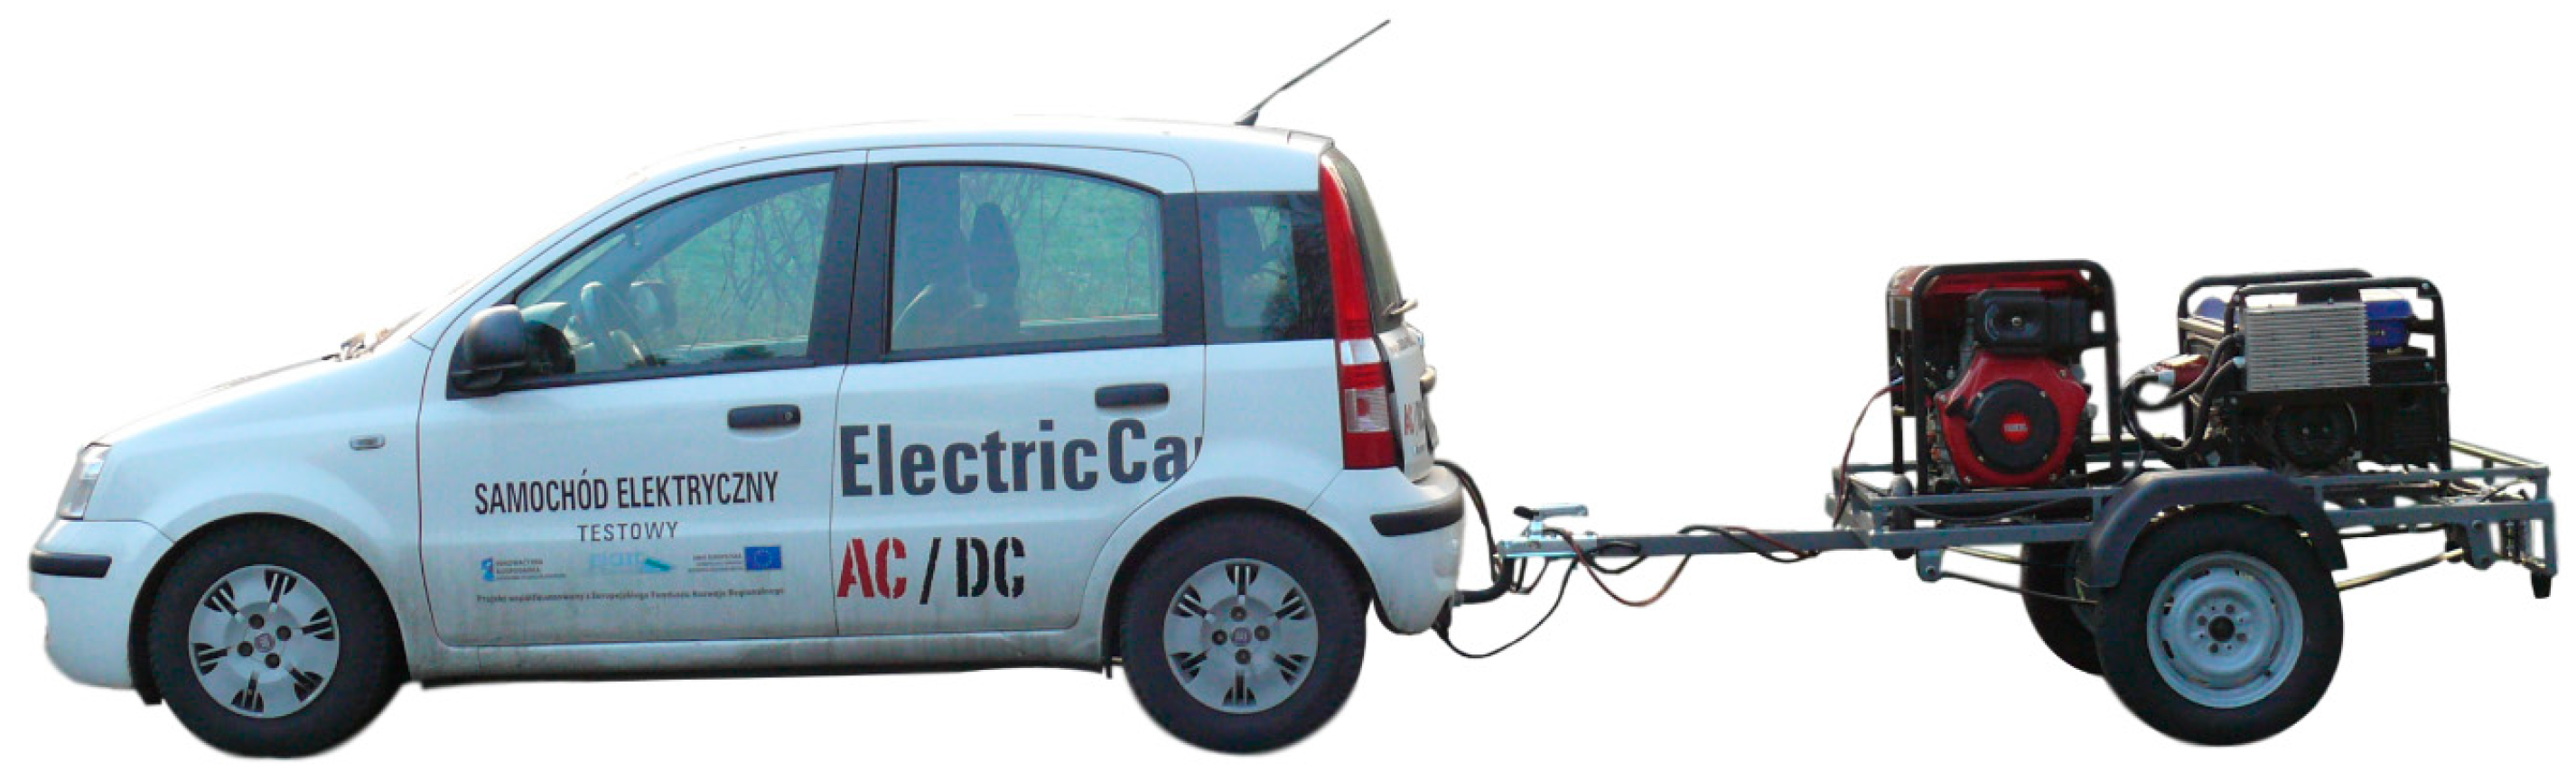
For research purposes, a mathematical model has been developed that describes the properties of a set of vehicles consisting of an electric Fiat Panda EV car with a trailer towed by it, equipped with diesel and petrol generators adapted for additives supply in the form of water steam and HHO (
Figure 10).
The mathematical model was developed on the basis of measurement data recorded in real road conditions during the operation of a vehicle set of an electric car with a towed RE. The electric propulsion system of the vehicle consisted of a PMSM synchronous motor with a rated power of 50 kW powered by an IGBT inverter from a 19 kWh battery pack. The average energy consumption of a vehicle without a RE at an average speed of 50 kph (30 mph) was approximately 120 Wh/km (195 Wh/miles). The weight of the vehicle during the tests, including the driver, passengers and luggage was 1300 kg. The weight of the trailer with gensets and fuel was approximately 350 kg. The developed mathematical model of the vehicle assembly involves two configurations of generators. The first one consists of a 5 kW petrol generator and a 6.5 kW diesel generator, and the second one consisting of a single 20 kW diesel generator. The actual fuel consumption of the petrol unit was 2.34 dm3/h, and for the diesel unit 1.28 dm3/h. The fuel consumption for the 20 kW genset was 3.93 dm3/h.
3.2. Vehicle Architecture and Description of the Model
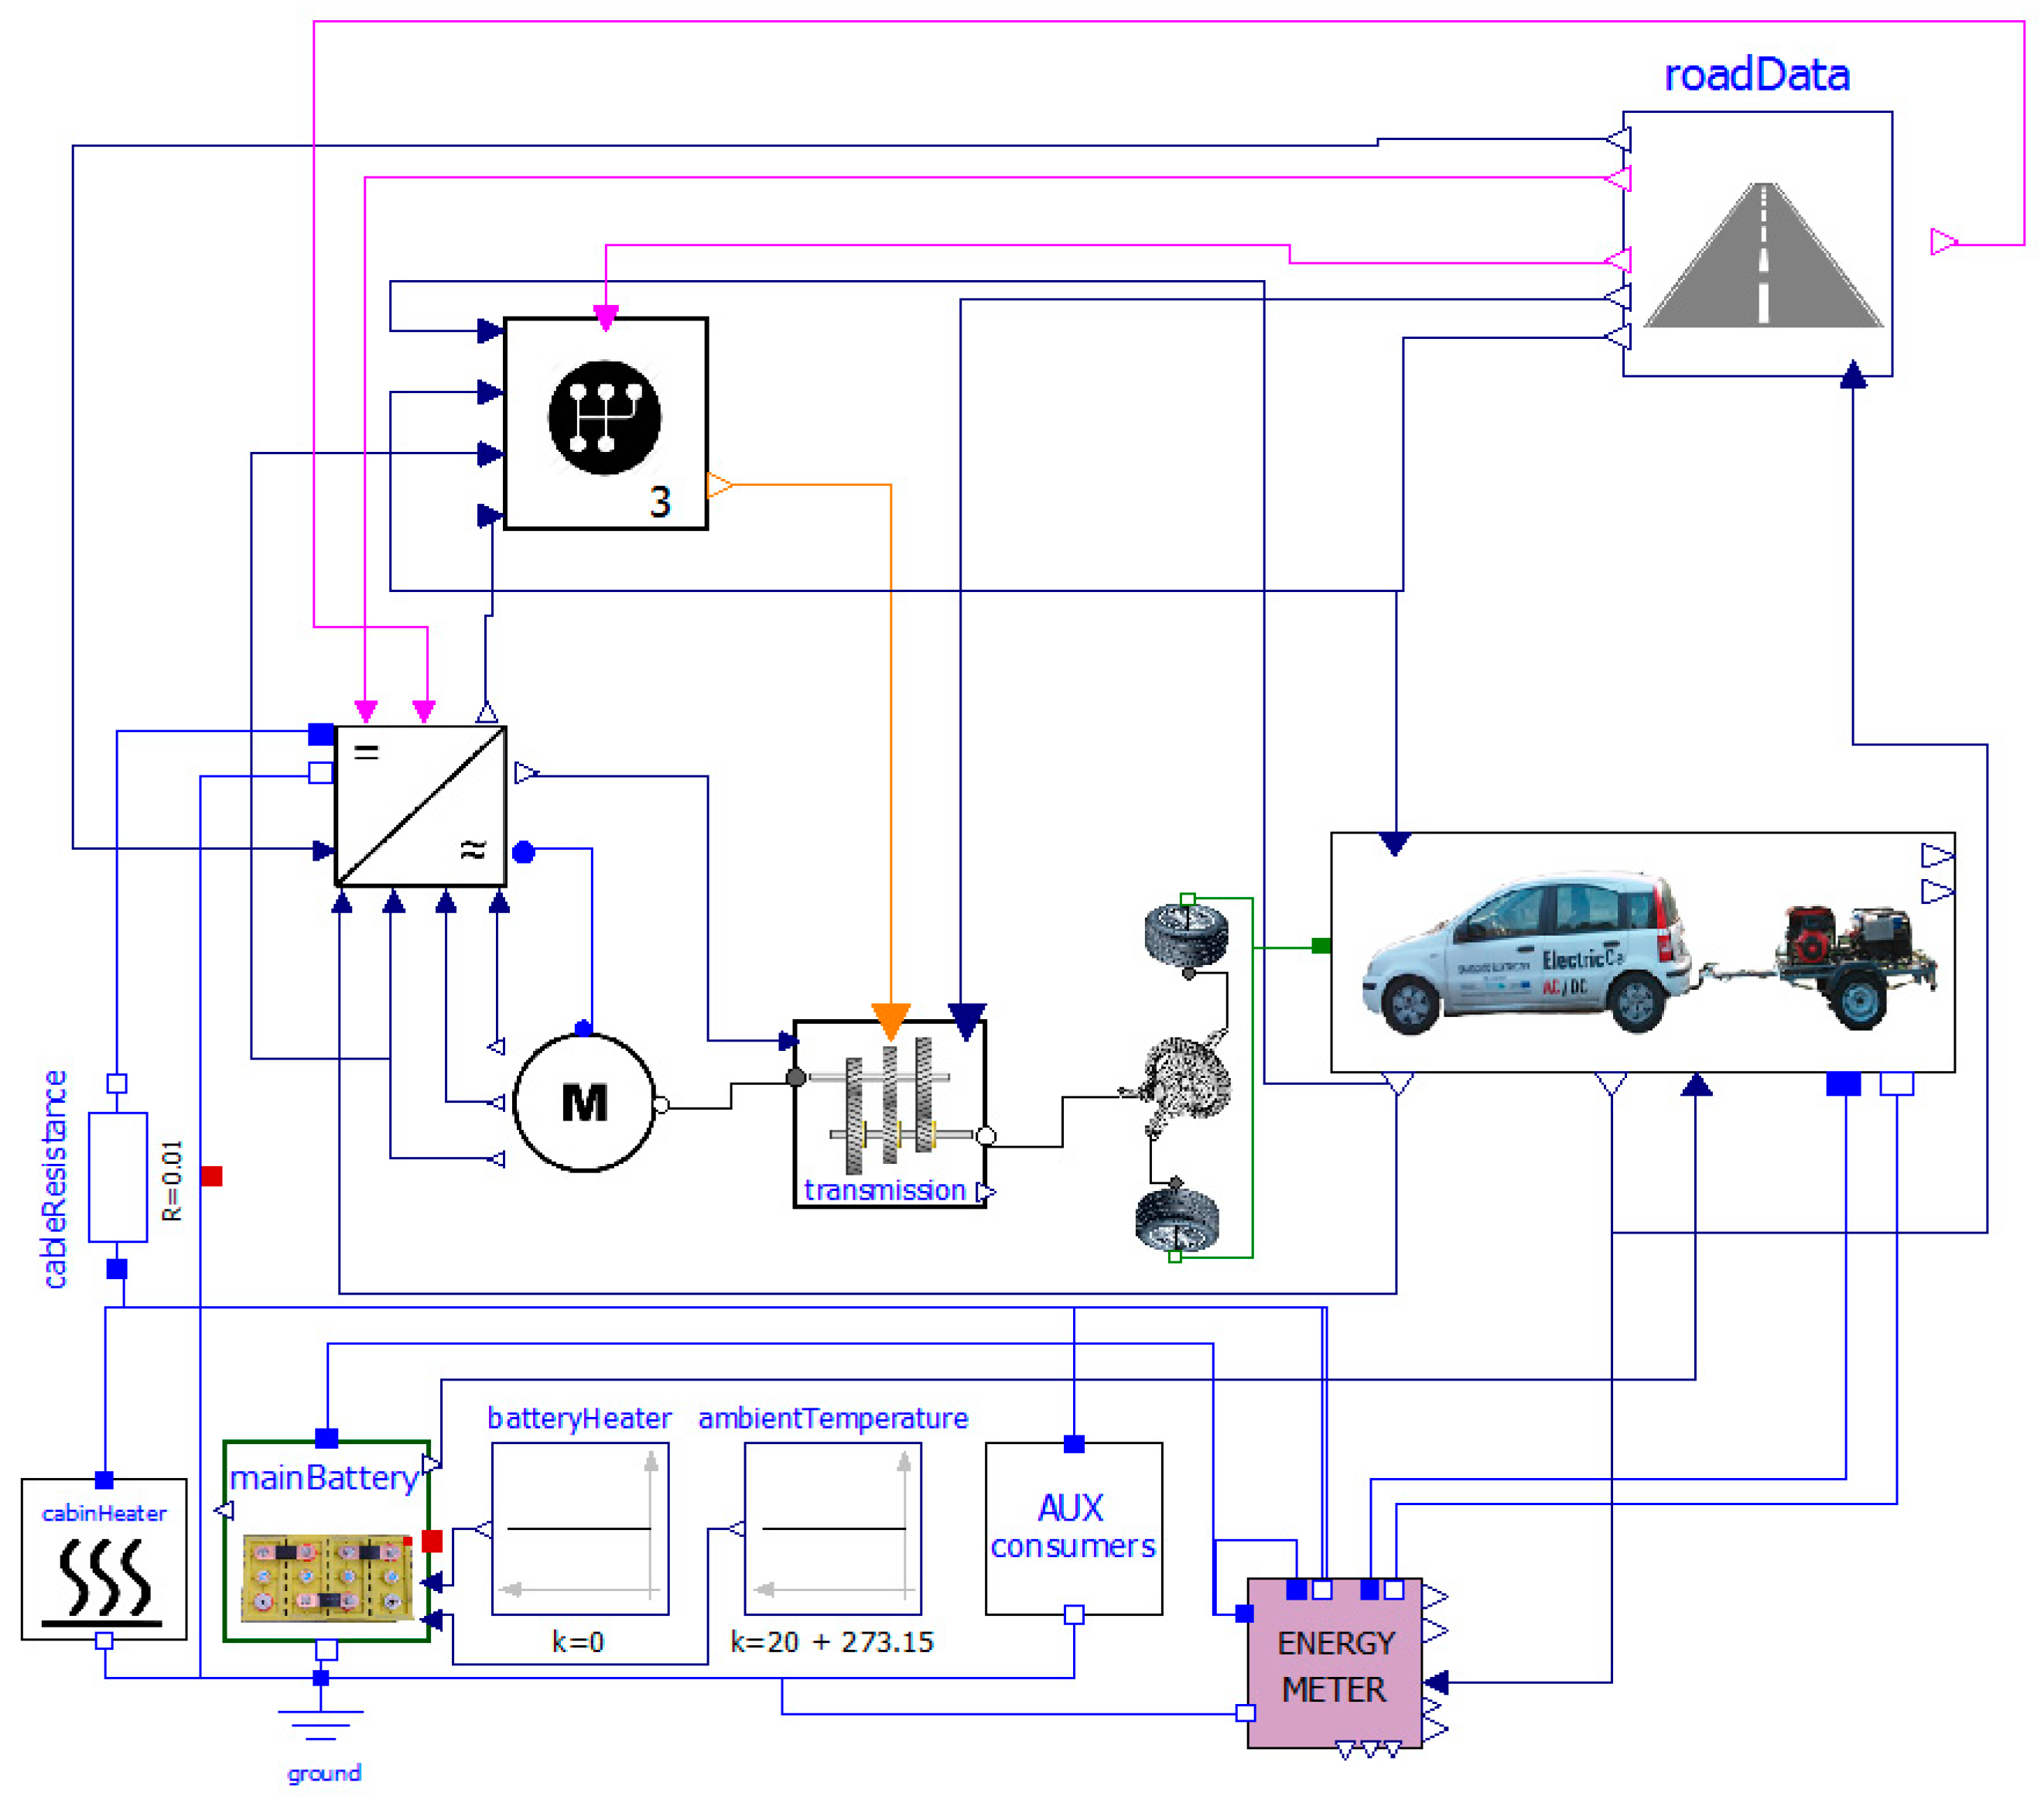
The OpenModelica software package was used to model the influence of water steam and oxyhydrogen additives on the quality of exhaust gases emitted by gensets used to increase the range of vehicles with electric drive [
39]. The developed mathematical model of the vehicle assembly (
Figure 11) describes an electric car with a RE towed on a trailer.
The car contains subsystems, such as: electric drive system (motor, inverter, battery pack), gearbox, torque transmission system. Additionally, model contains a block which represents resistance acting on the moving vehicle and a block tasked with specifying the route parameters like: speed profile and route elevation profile. In the resistance block, the forces acting during the movement of the vehicle combination—an electric car with a trailer RE are modeled. In the resistance block, there are modeled 3 of 4 resistance sources acting on the vehicle combination:
aerodynamic resistance—common for the vehicle set,
rolling resistance of the vehicle wheels, and rolling resistance of the trailer wheels,
resistance related to the sliding force acting on a set of vehicles when the vehicle set travels on an inclined road section.
The fourth and last source of resistance, i.e., one that arises in the drive transmission system, is modeled in the transmission block.
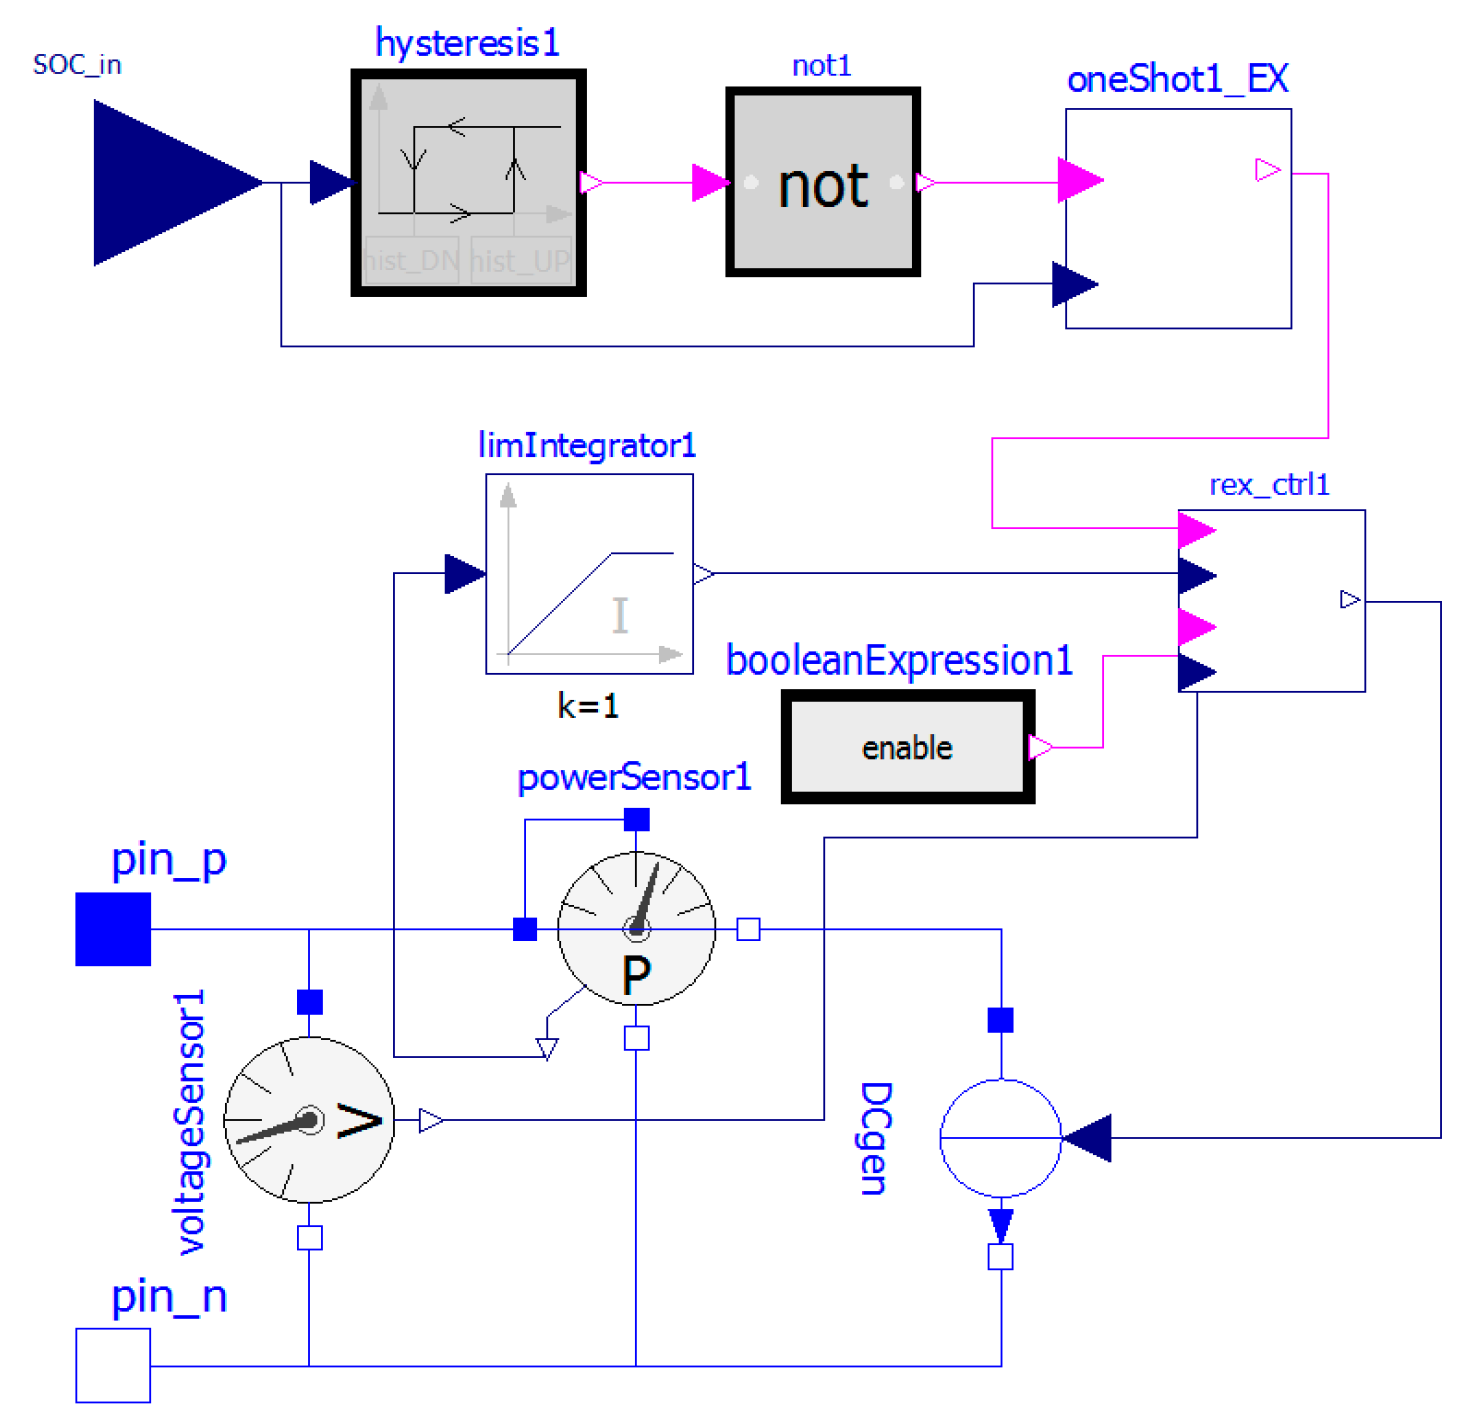
The range extender block (
Figure 12) models one generator set consisting of an ICE coupled with an electrical generator. The generating set is switched ON and OFF depending on the state of charge (SOC) of the traction battery. The generator set is switched ON and OFF after the SOC drops below/rises above the thresholds set by the operator. At the same time, the amount of fuel burned, depending on the load, type of fuel and additives: steam and/or HHO is calculated, along with the emitted amount of toxic gases: CO, CO
2, NO
x.
The developed model of the traction battery pack (
Figure 13), mirrors the behavior of the actual battery pack in the vehicle along with the accompanying thermal phenomena (self-heating, increase of internal resistance with temperature drop) and the thermal conditioning system of the battery pack (cooling/heating battery pack).
The battery pack is modeled using three main components: an adjustable voltage source block, a variable resistance block, and a heat capacity block. The adjustable voltage source block symbolizes the electromotive force (EMF) of the battery that changes with the state of charge (SOC) of the battery pack. The variable resistance block characterizes changes in the internal resistance of the cells of the battery pack, and is the place where the thermal losses emerge. The resistance change takes place in accordance with the temperature characteristic defined for the type of cells from which the battery pack is built. The heat capacity block represents the heat capacity of all cells in the battery pack. The battery pack block has the ability to configure parameters defining: number of single cells connected in parallel, number of cells connected in series, thermal capacity of a single cell in J/K, thermal conductivity between cells and the environment in W/K, initial temperature of the battery pack in degrees K and the initial state of charge (SOC). The last parameter contains a name of parameter record which characterizes the cells which the battery pack is built with. The record includes, among others, characteristics of EMF as a function of the cells state of charge, dependence of battery internal resistance as a function of cell temperature and single cell capacity in ampere-hours.
In addition to the main elements mentioned above, the traction battery package model also includes auxiliary blocks that affect the operation of the battery model as a whole. The ammeter block, acts together with the cell calculator block, whose task is to monitor the currents flowing through the battery pack, to calculate the value of the actual state of charge of the battery pack. Another block is the heat flow block between the battery pack, the thermal conditioning system, and the surrounding ambient air.
The road parameter block is responsible for modeling the route parameters that the vehicle is travelling. Route details are stored in two text files. The first one contains the current value of the road slope and the elevation profile as a function of distance from the starting point. The second file describes the speed at which the vehicle is to drive on a given section of the route. For modeling purposes, two formats of vehicle speed description were developed. The first one describes the speed depending on time and is adapted to work with standard speed profiles used in fuel consumption tests on vehicles with conventional drive, carried out by US agencies (e.g., EPA Federal Test Procedure also known as FTP-75) and European (New European Driving Cycle—NEDC—and the Worldwide harmonized Light vehicles Test Procedure or WLTP). The second data format describes the target speed of the vehicle depending on the distance traveled.
The input signal for the road parameter block is information about the current distance from the starting point expressed in kilometers. On its basis, values related to the vehicle speed at a given moment, the current slope of the road in degrees and information about the parking brake activation or deactivation are calculated and transmitted to the transmission control block, which cooperates with the predictive reference model of vehicle position. The predictive reference model block, basing on information about the altitude profile of the route, has the task of controlling the vehicle speed by taking into account changes in the slope of the terrain so as to optimally use the kinetic energy of the vehicle during hill descents and subsequent ascents.
4. Simulations Results
The traction results in the Modelica package were made for a 609 km (380 miles) route between the cities of Gdynia and Cracow, which elevation profile shown on
Figure 14 was obtained from the Google Earth service, and takes into account the route type and speed limits set on a given section of the route.
Thus, roads in built-up areas have a speed limit of 50 kph (30 mph), roads outside built-up areas have speed limits up to 70, 90, 100, 120 and 140 kph (45, 55, 60, 75 and 85 mph).
4.1. Emission of CO2, CO, NOx
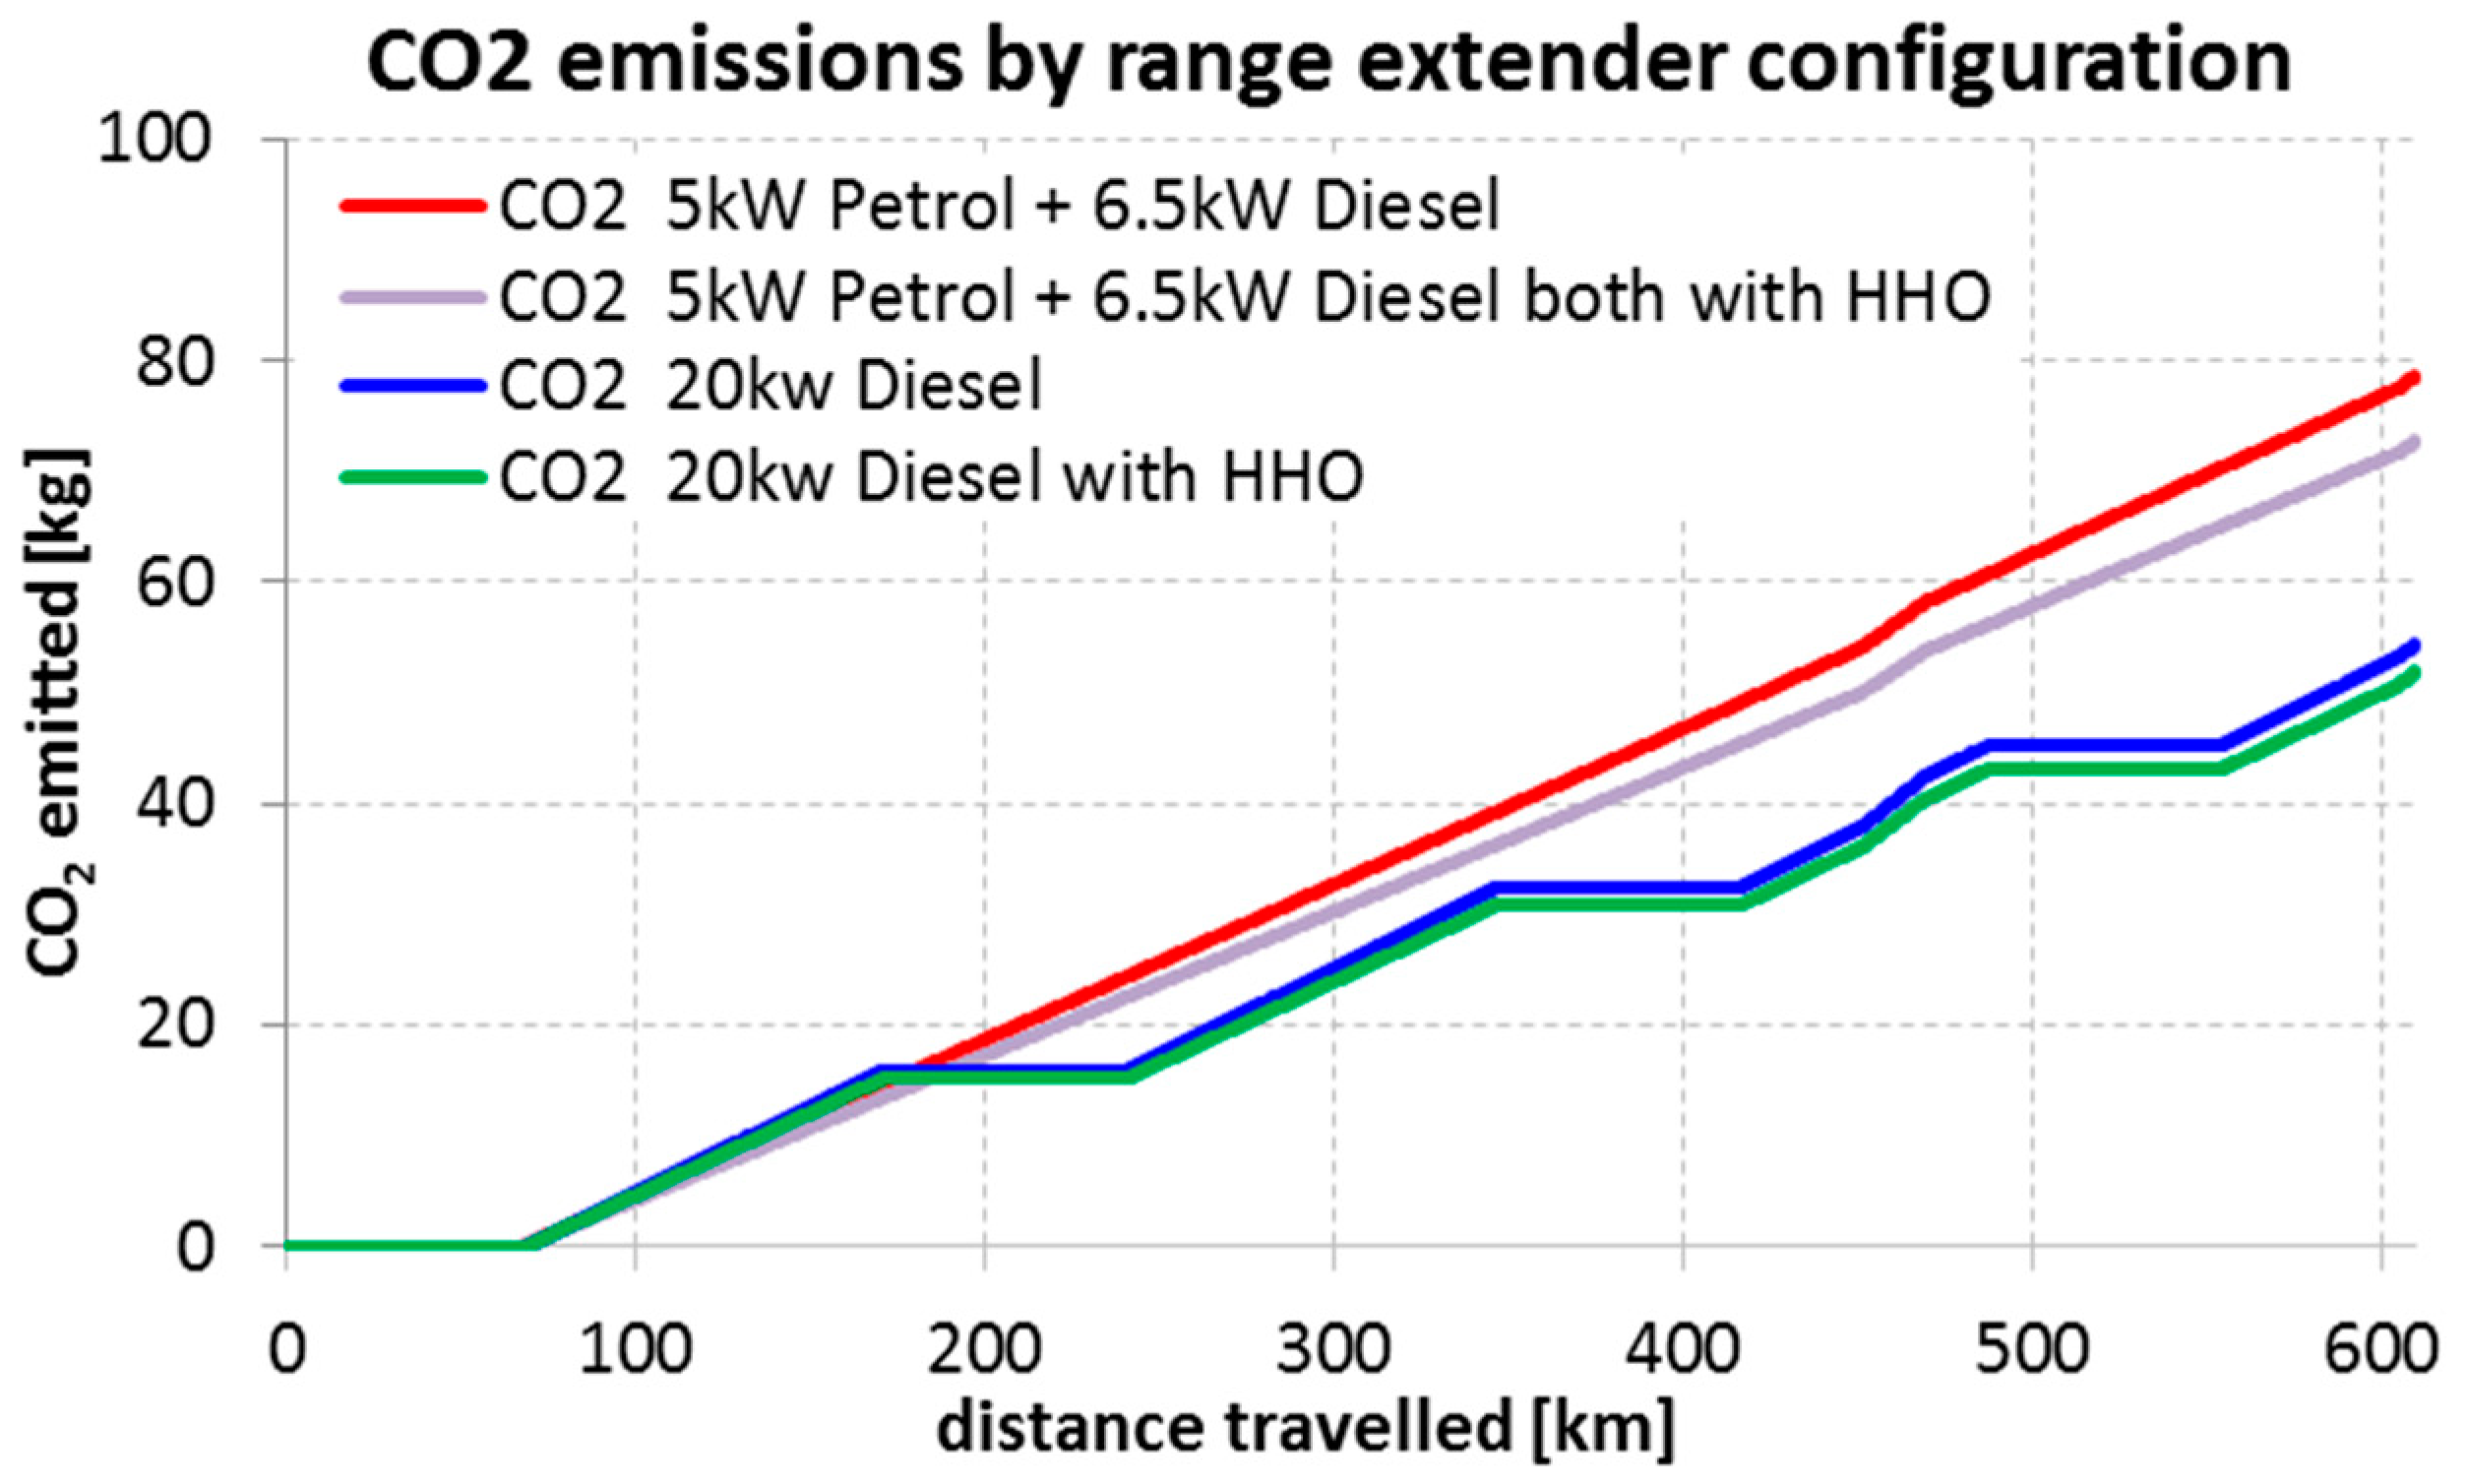
The lowest CO
2 emission level was obtained for the RE equipped with a 20 kW diesel generator with HHO gas supplied to the intake manifold of its engine, and the largest emission was obtained for the RE equipped with two generators: one 5 kW petrol and second 6.5 kW diesel, both without any additives (
Figure 15).
The CO
2 emissions for petrol and diesel generators with HHO gas were 4.6% lower than without addition of HHO, and for single 20kW diesel generator the CO
2 emissions with HHO were lower by 8% than without it. For the same route, an electric vehicle powered from a RE equipped with a 20 kW diesel generator would emit about 42% less CO
2 in relation to the RE powered by 5 kW petrol generator and 6.5 kW diesel generator, both HHO assisted. An increase in the speed of travel by 10 kph (6 mph) contributed to the increase in CO
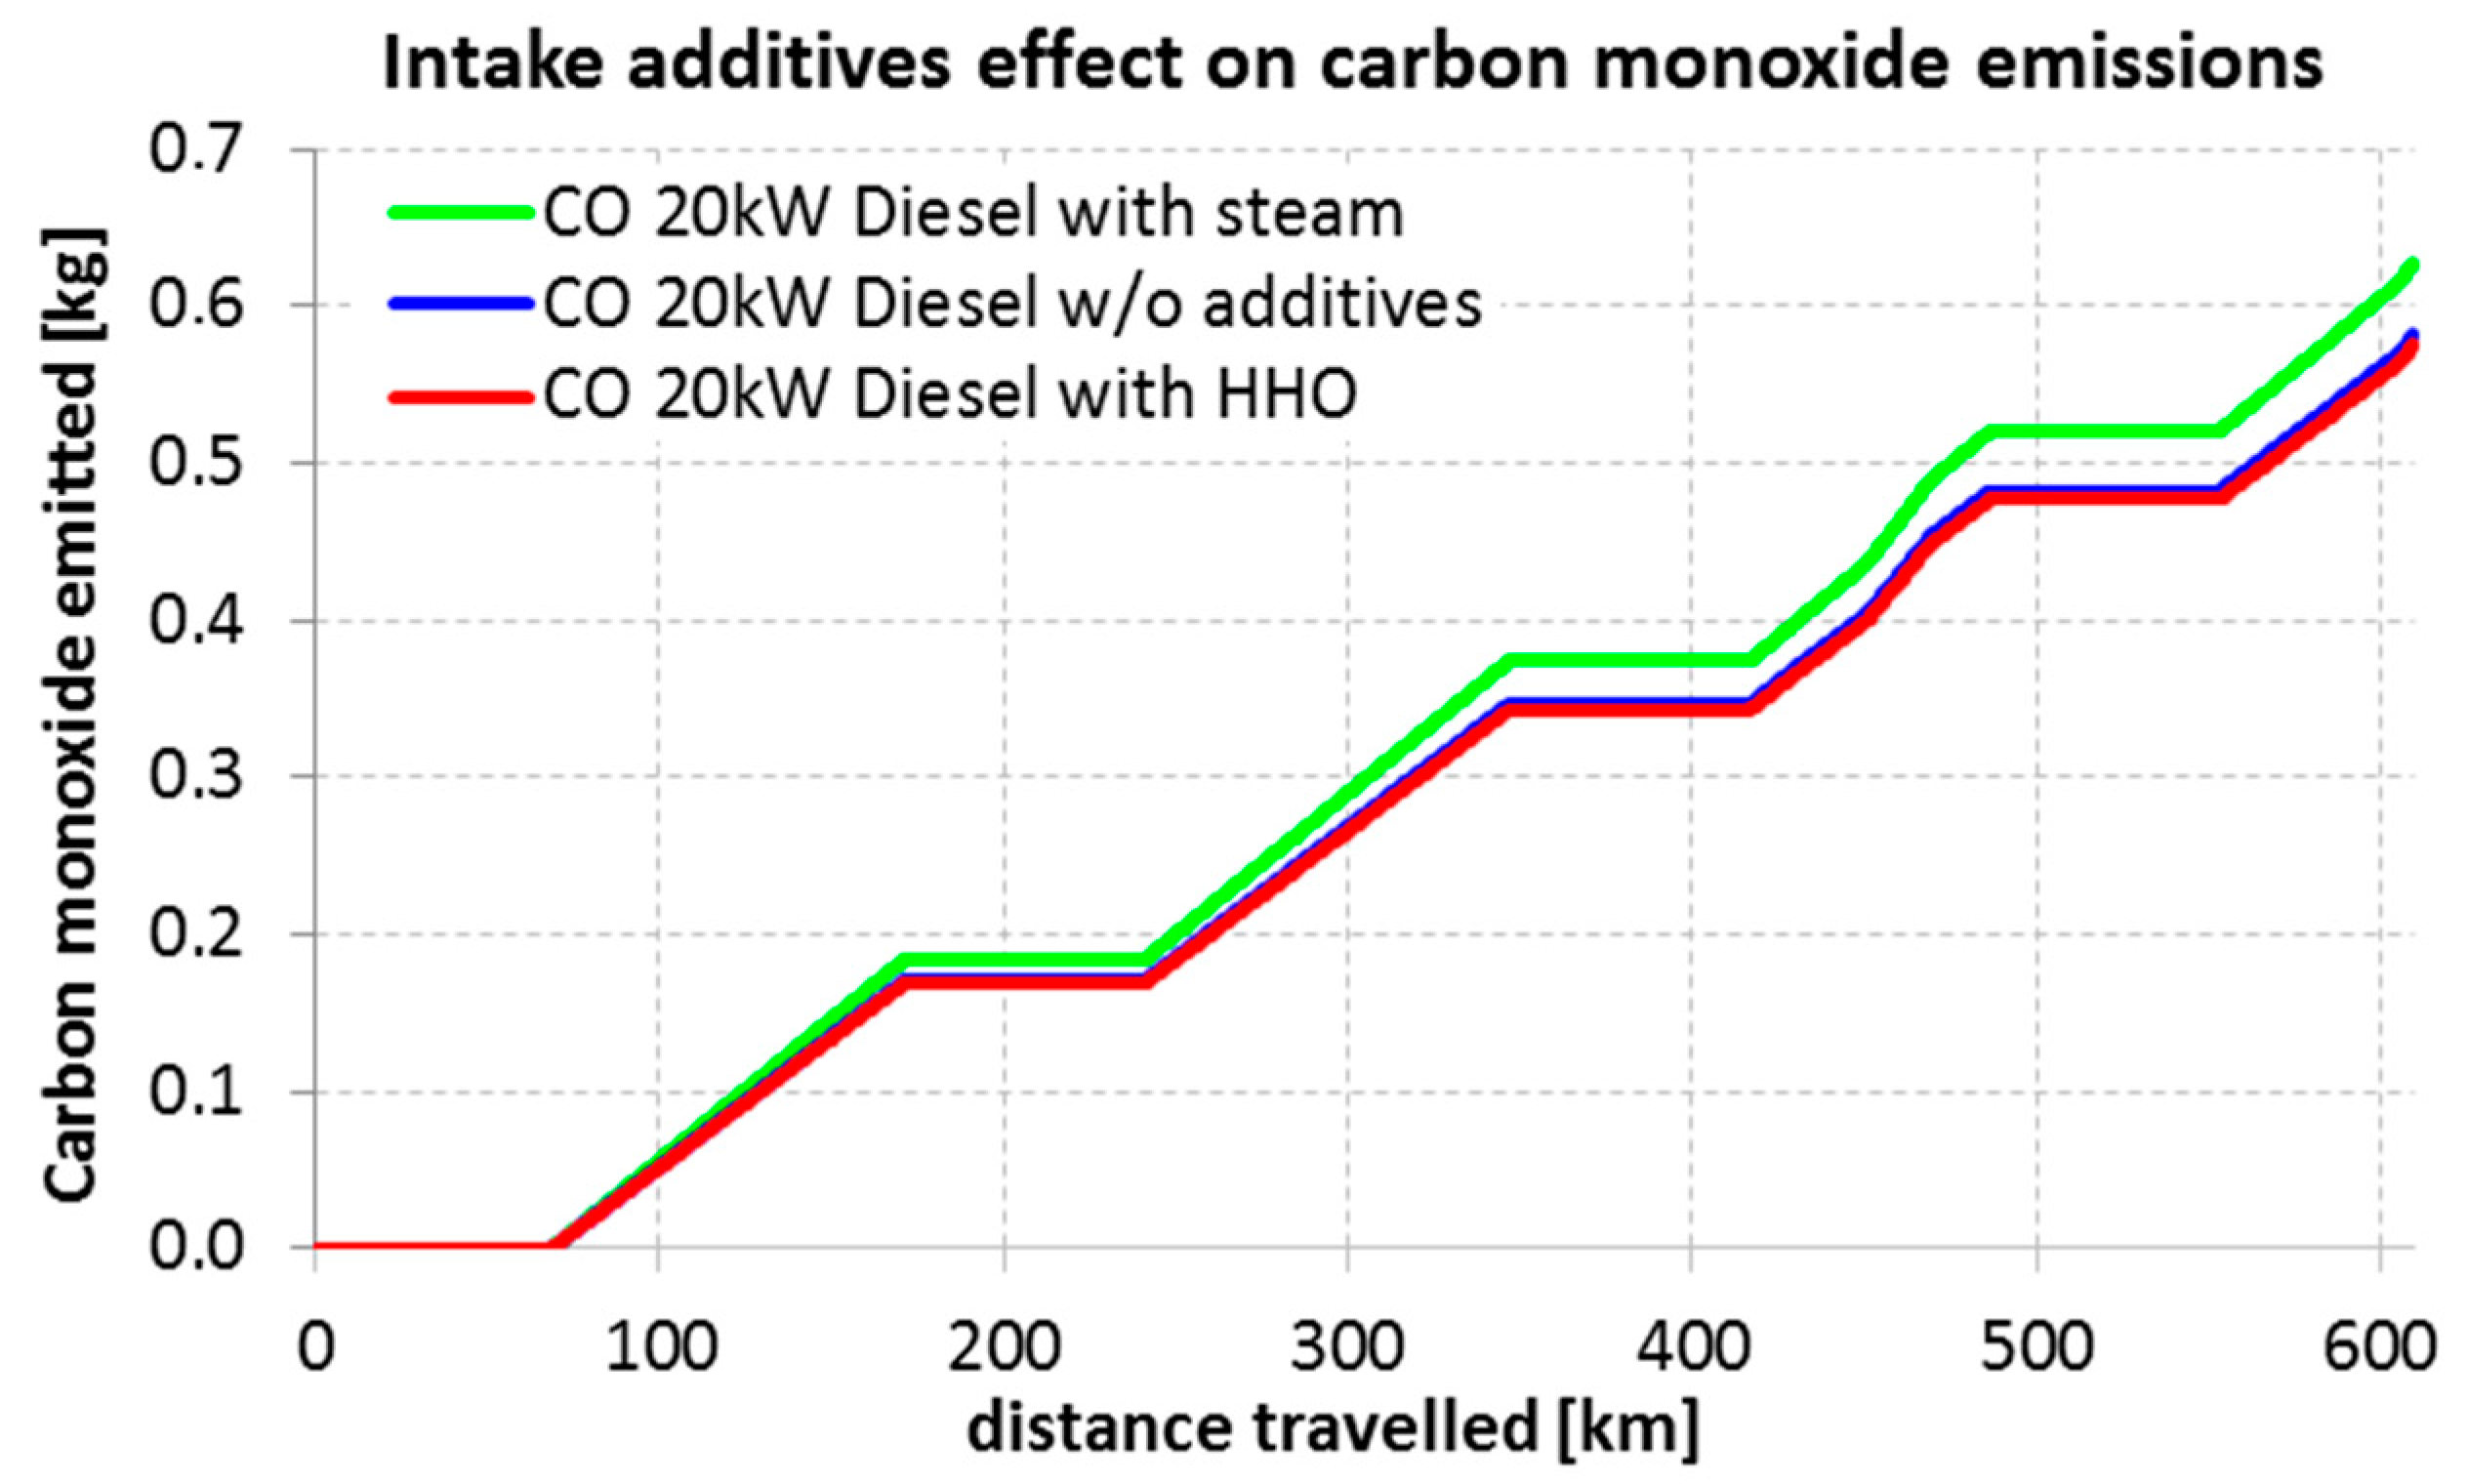
2 emissions on the test section of 609 km (380 m) by about 6.5%. The amount of CO emitted for a 20 kW diesel generator was lower by 3.2% when HHO was injected into the intake manifold and 6% higher when water steam was fed, in relation to engine operating without any additives (
Figure 16).
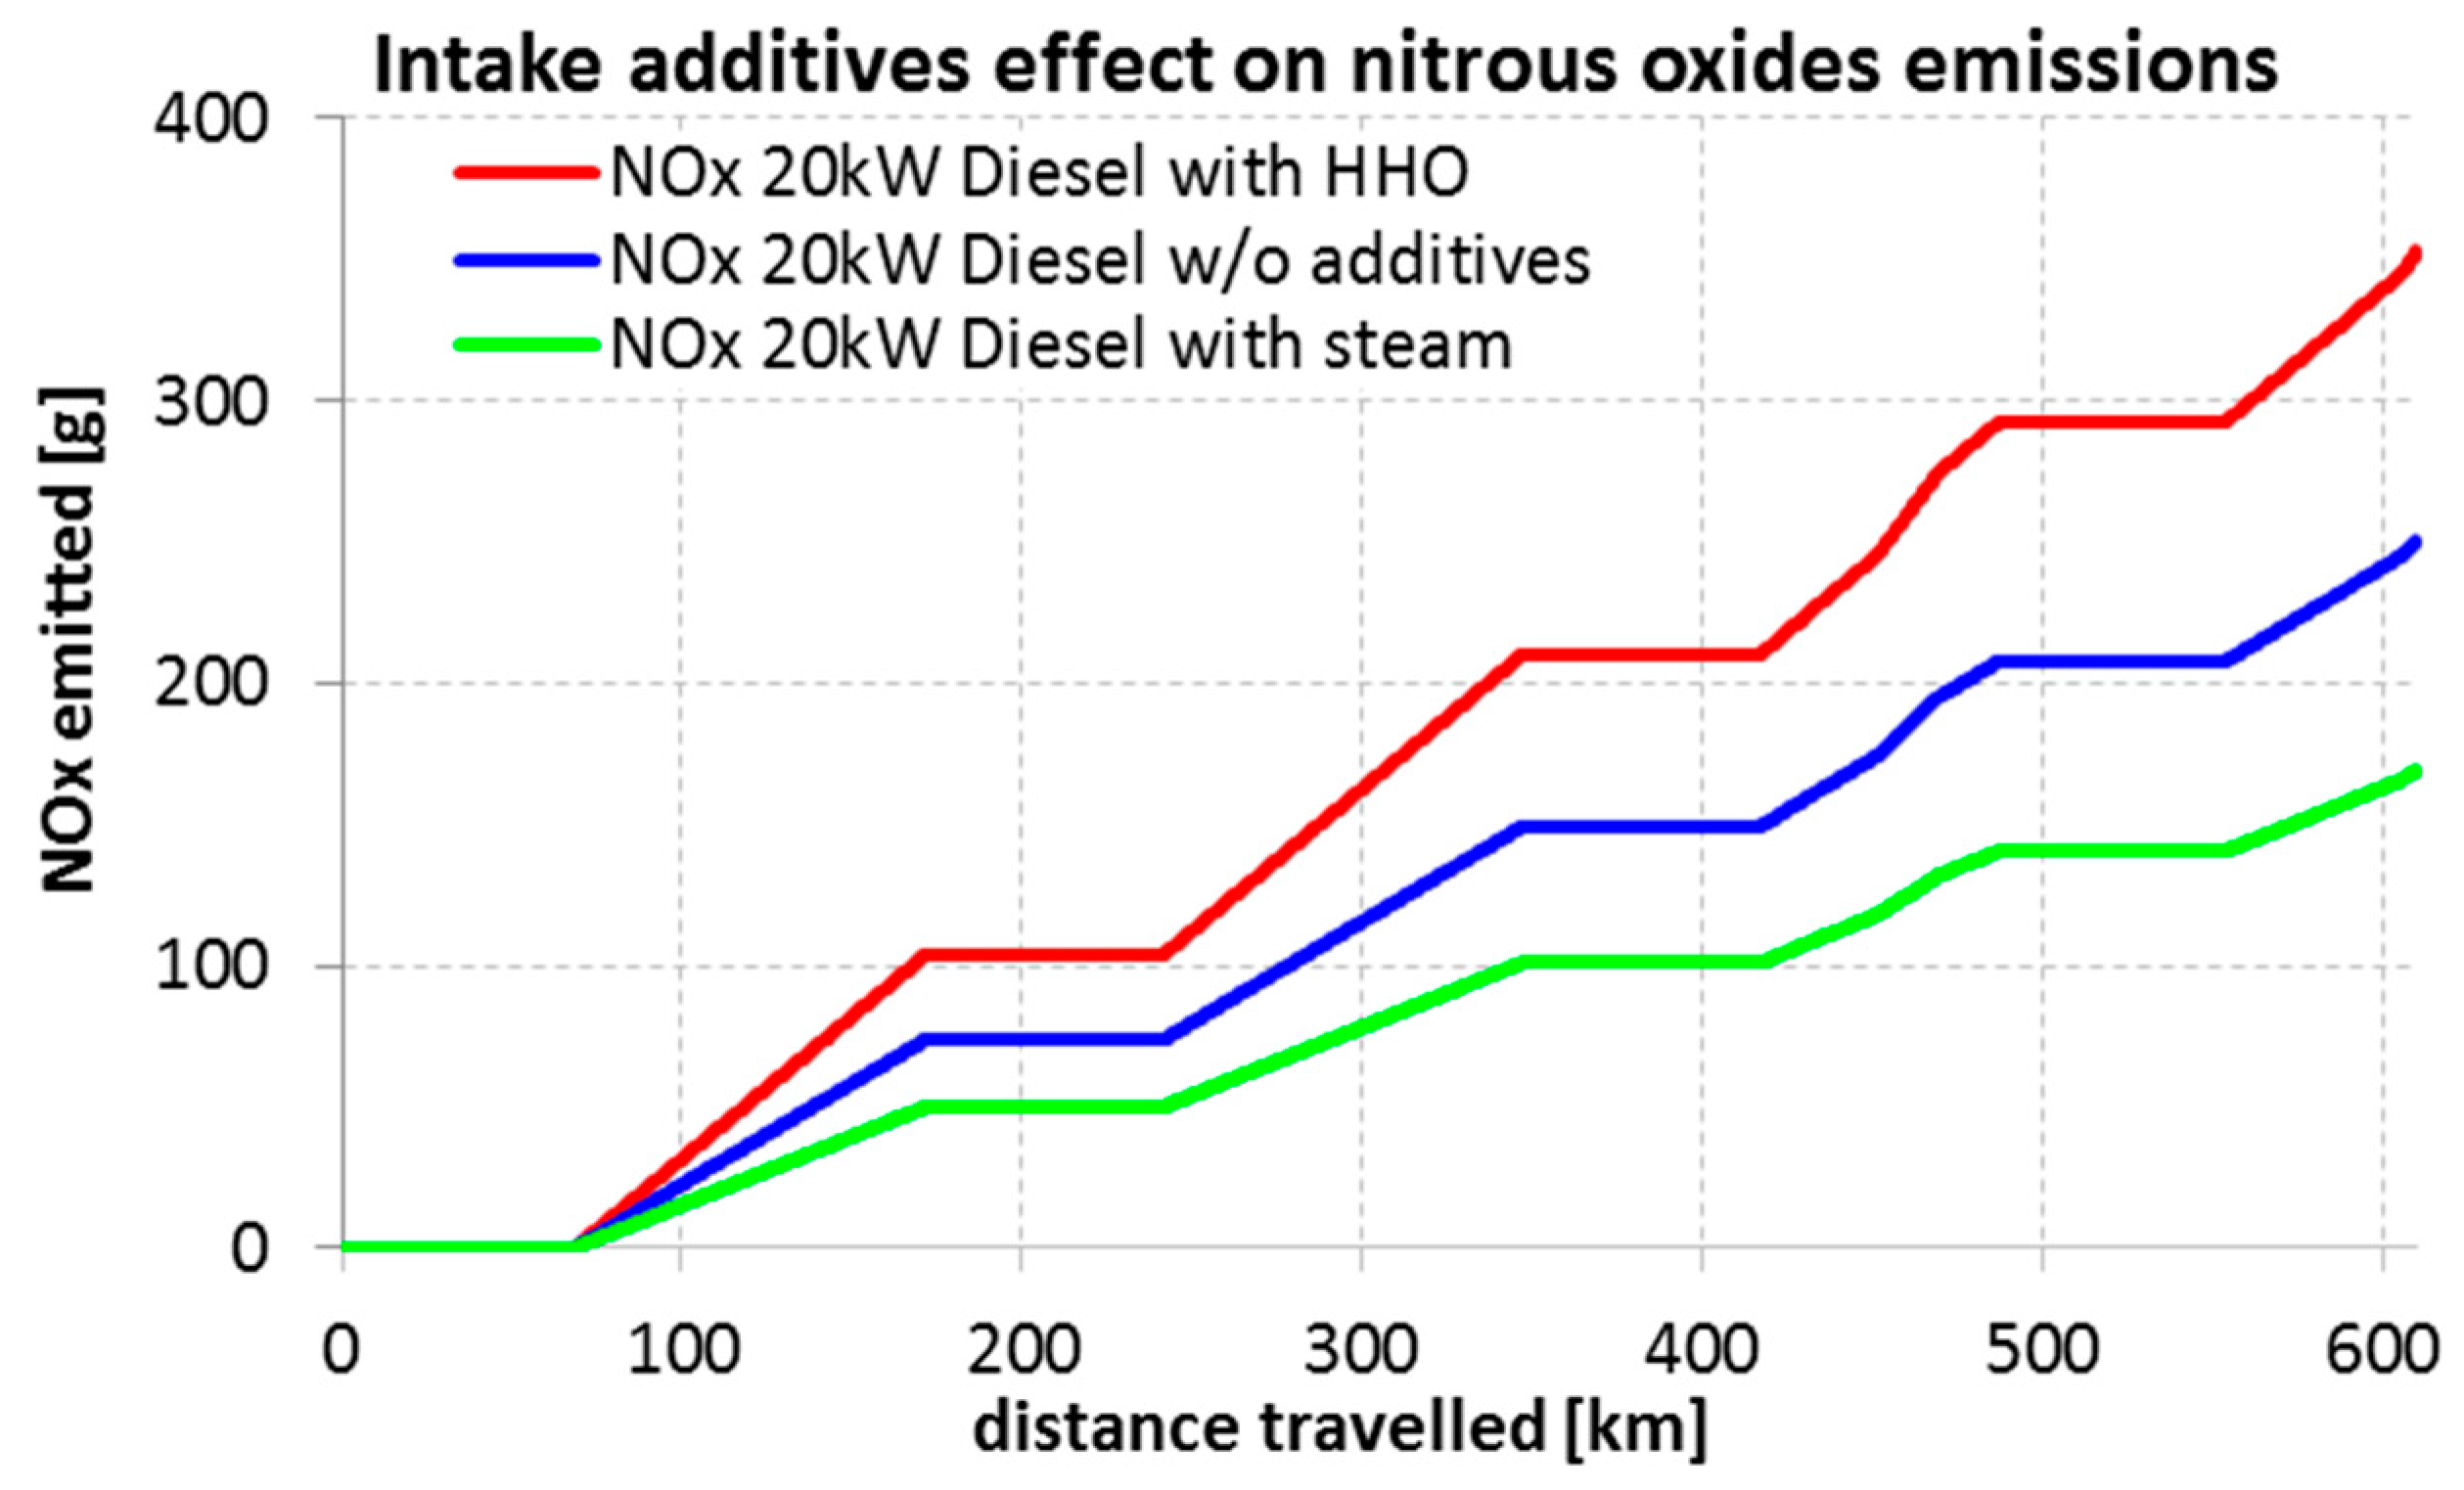
For a 20 kW diesel genset, about 48% lower NO
x emissions compared to normal emissions were reported when water steam was injected into the engine intake manifold and about 42% higher emissions were present when HHO was delivered (
Figure 17).
4.2. Energy Consumption
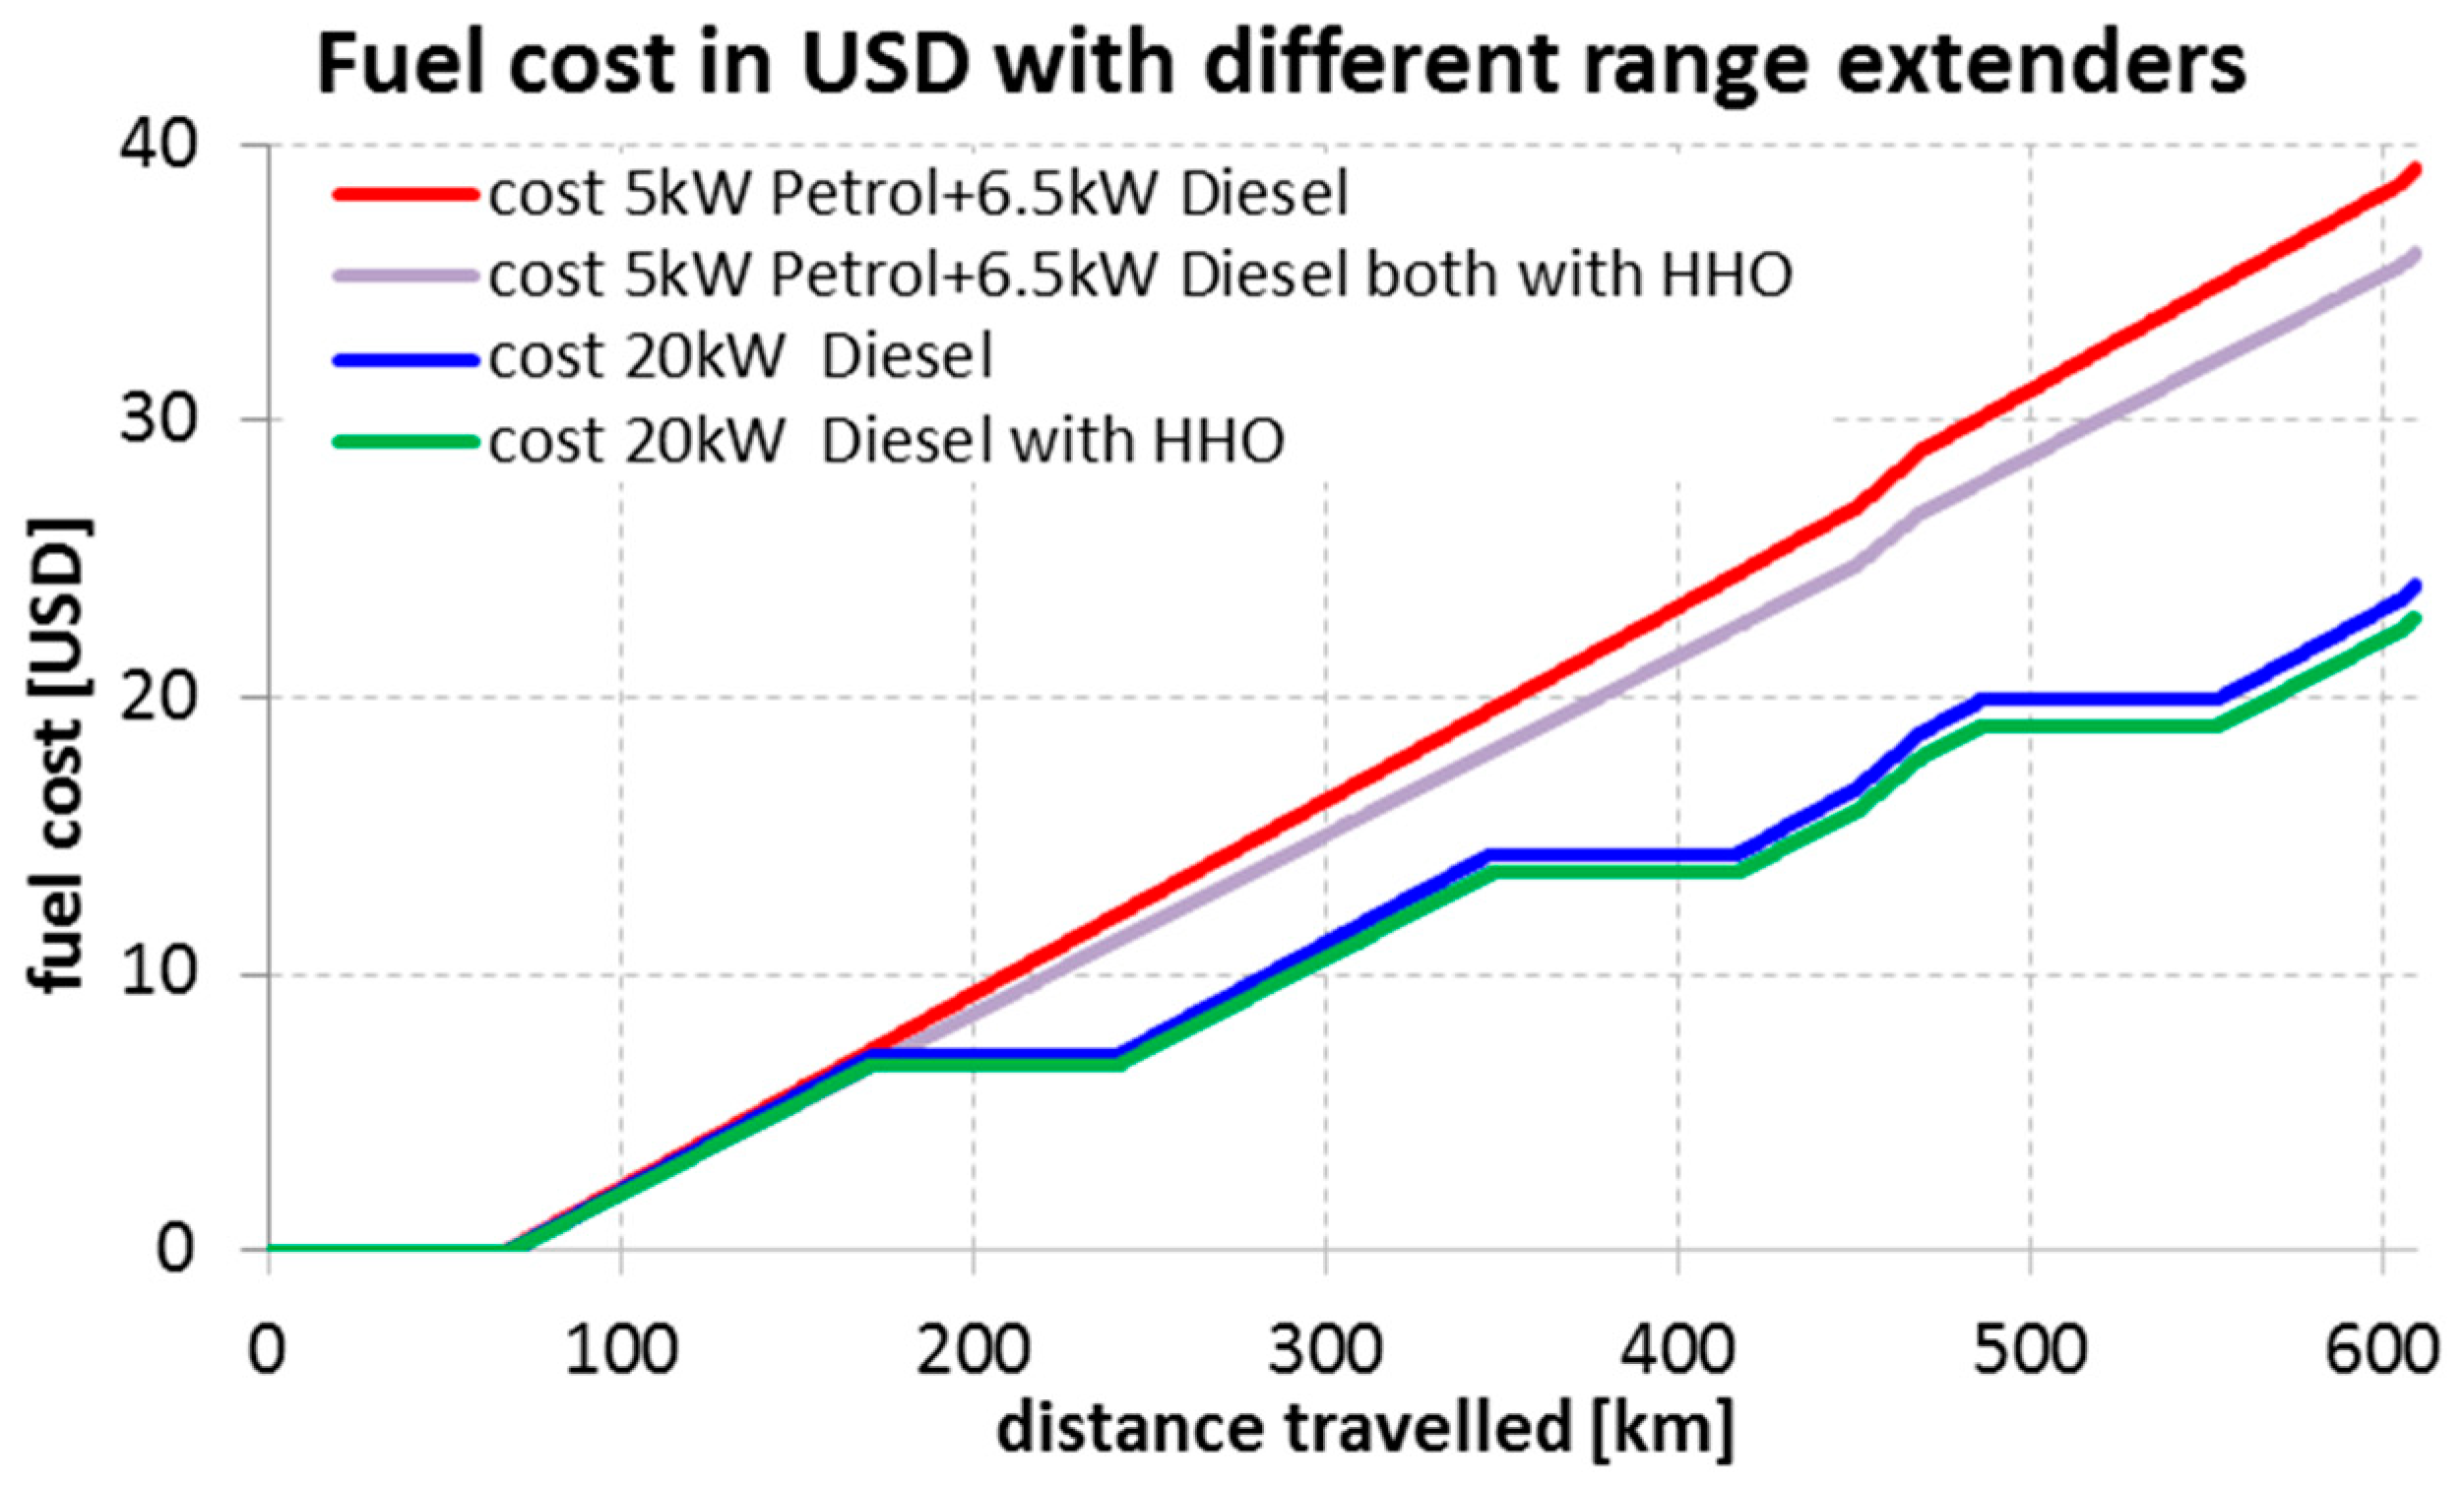
The addition of water steam or HHO gas to the intake manifolds of ICE, resulted in the change in the amount of fuel consumed by them. The lowest travel costs on the test route (the lowest fuel consumption) were obtained for the RE with a 20 kW diesel engine assisted by HHO (
Figure 18). The use of HHO reduced the travel costs by approx. 5%.
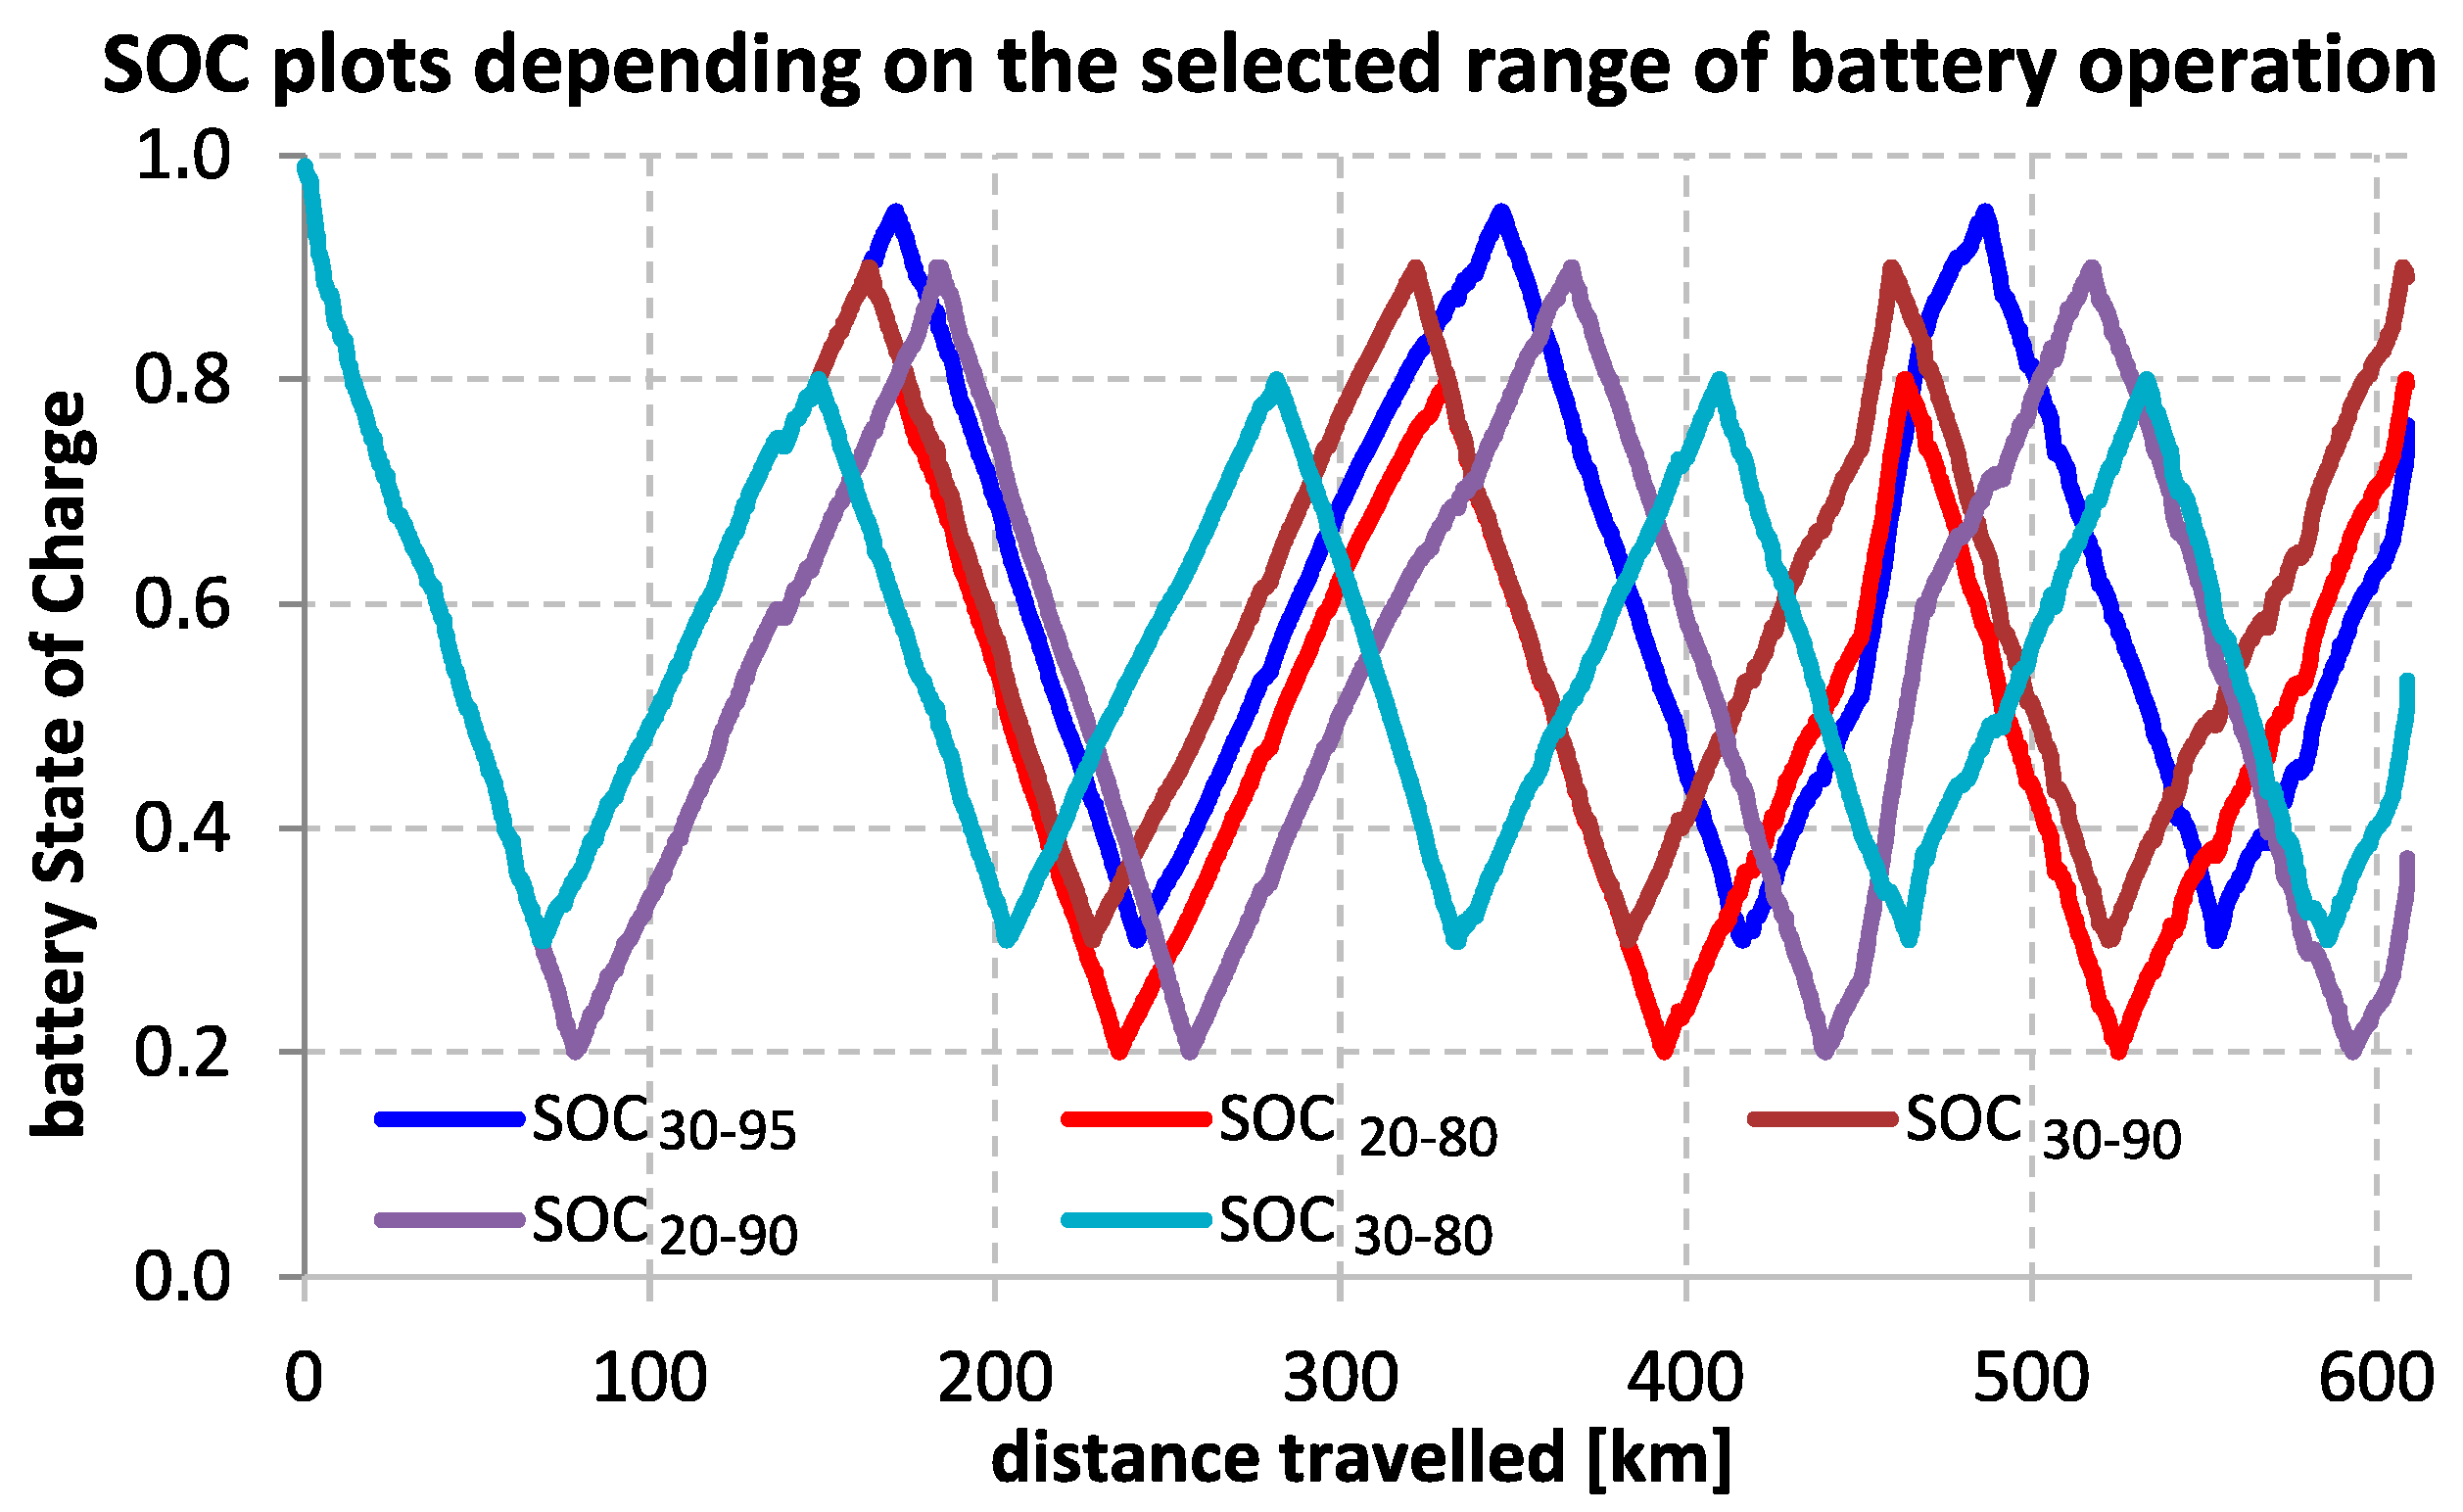
Vehicle travel costs using a RE equipped with a 5 kW petrol genset and 6.5 kW diesel genset fed with HHO were lower by 8.5% compared to the same setup without HHO. Travel costs with a RE equipped with a 20 kW diesel generator supplied with HHO were lower by approx. 60% compared to similarly assisted 5 kW petrol and 6.5 kW diesel generators. Such large differences in travel costs result mainly from higher efficiency of diesel engines (about 40%) compared to petrol engines (about 18%). During the research, the influence of the SOCON–OFF coefficient on the amount of fuel consumed was analyzed. The coefficient describes the level of charge of the battery pack, at which the generators are switched ON and turned OFF. The studies were carried out for SOC30–95, SOC30–90, SOC30–80, SOC20–80, and SOC20–90. The obtained test results revealed that the value of the adopted SOCON–OFF coefficient affects the fuel consumption of power units powered by an electric vehicle, but for a strictly defined distance of the route.
This dependence obviously translates into the amount of toxic substances emitted. By choosing the right value of the SOC
ON–OFF coefficient for a given distance, one can reduce the fuel consumption consumed by the gensets. For a 609 km (380 m) long route, the lowest fuel consumption was recorded for SOC
20–90 and the highest for SOC
30–90 (
Figure 19).
At the same time, it should be borne in mind that for lithium batteries, narrowing the SOC
ON–OFF operating area or increasing the SOC
ON value (turning the generator before the battery discharges too deep) contributes to extending their service life (SOH) [
40].
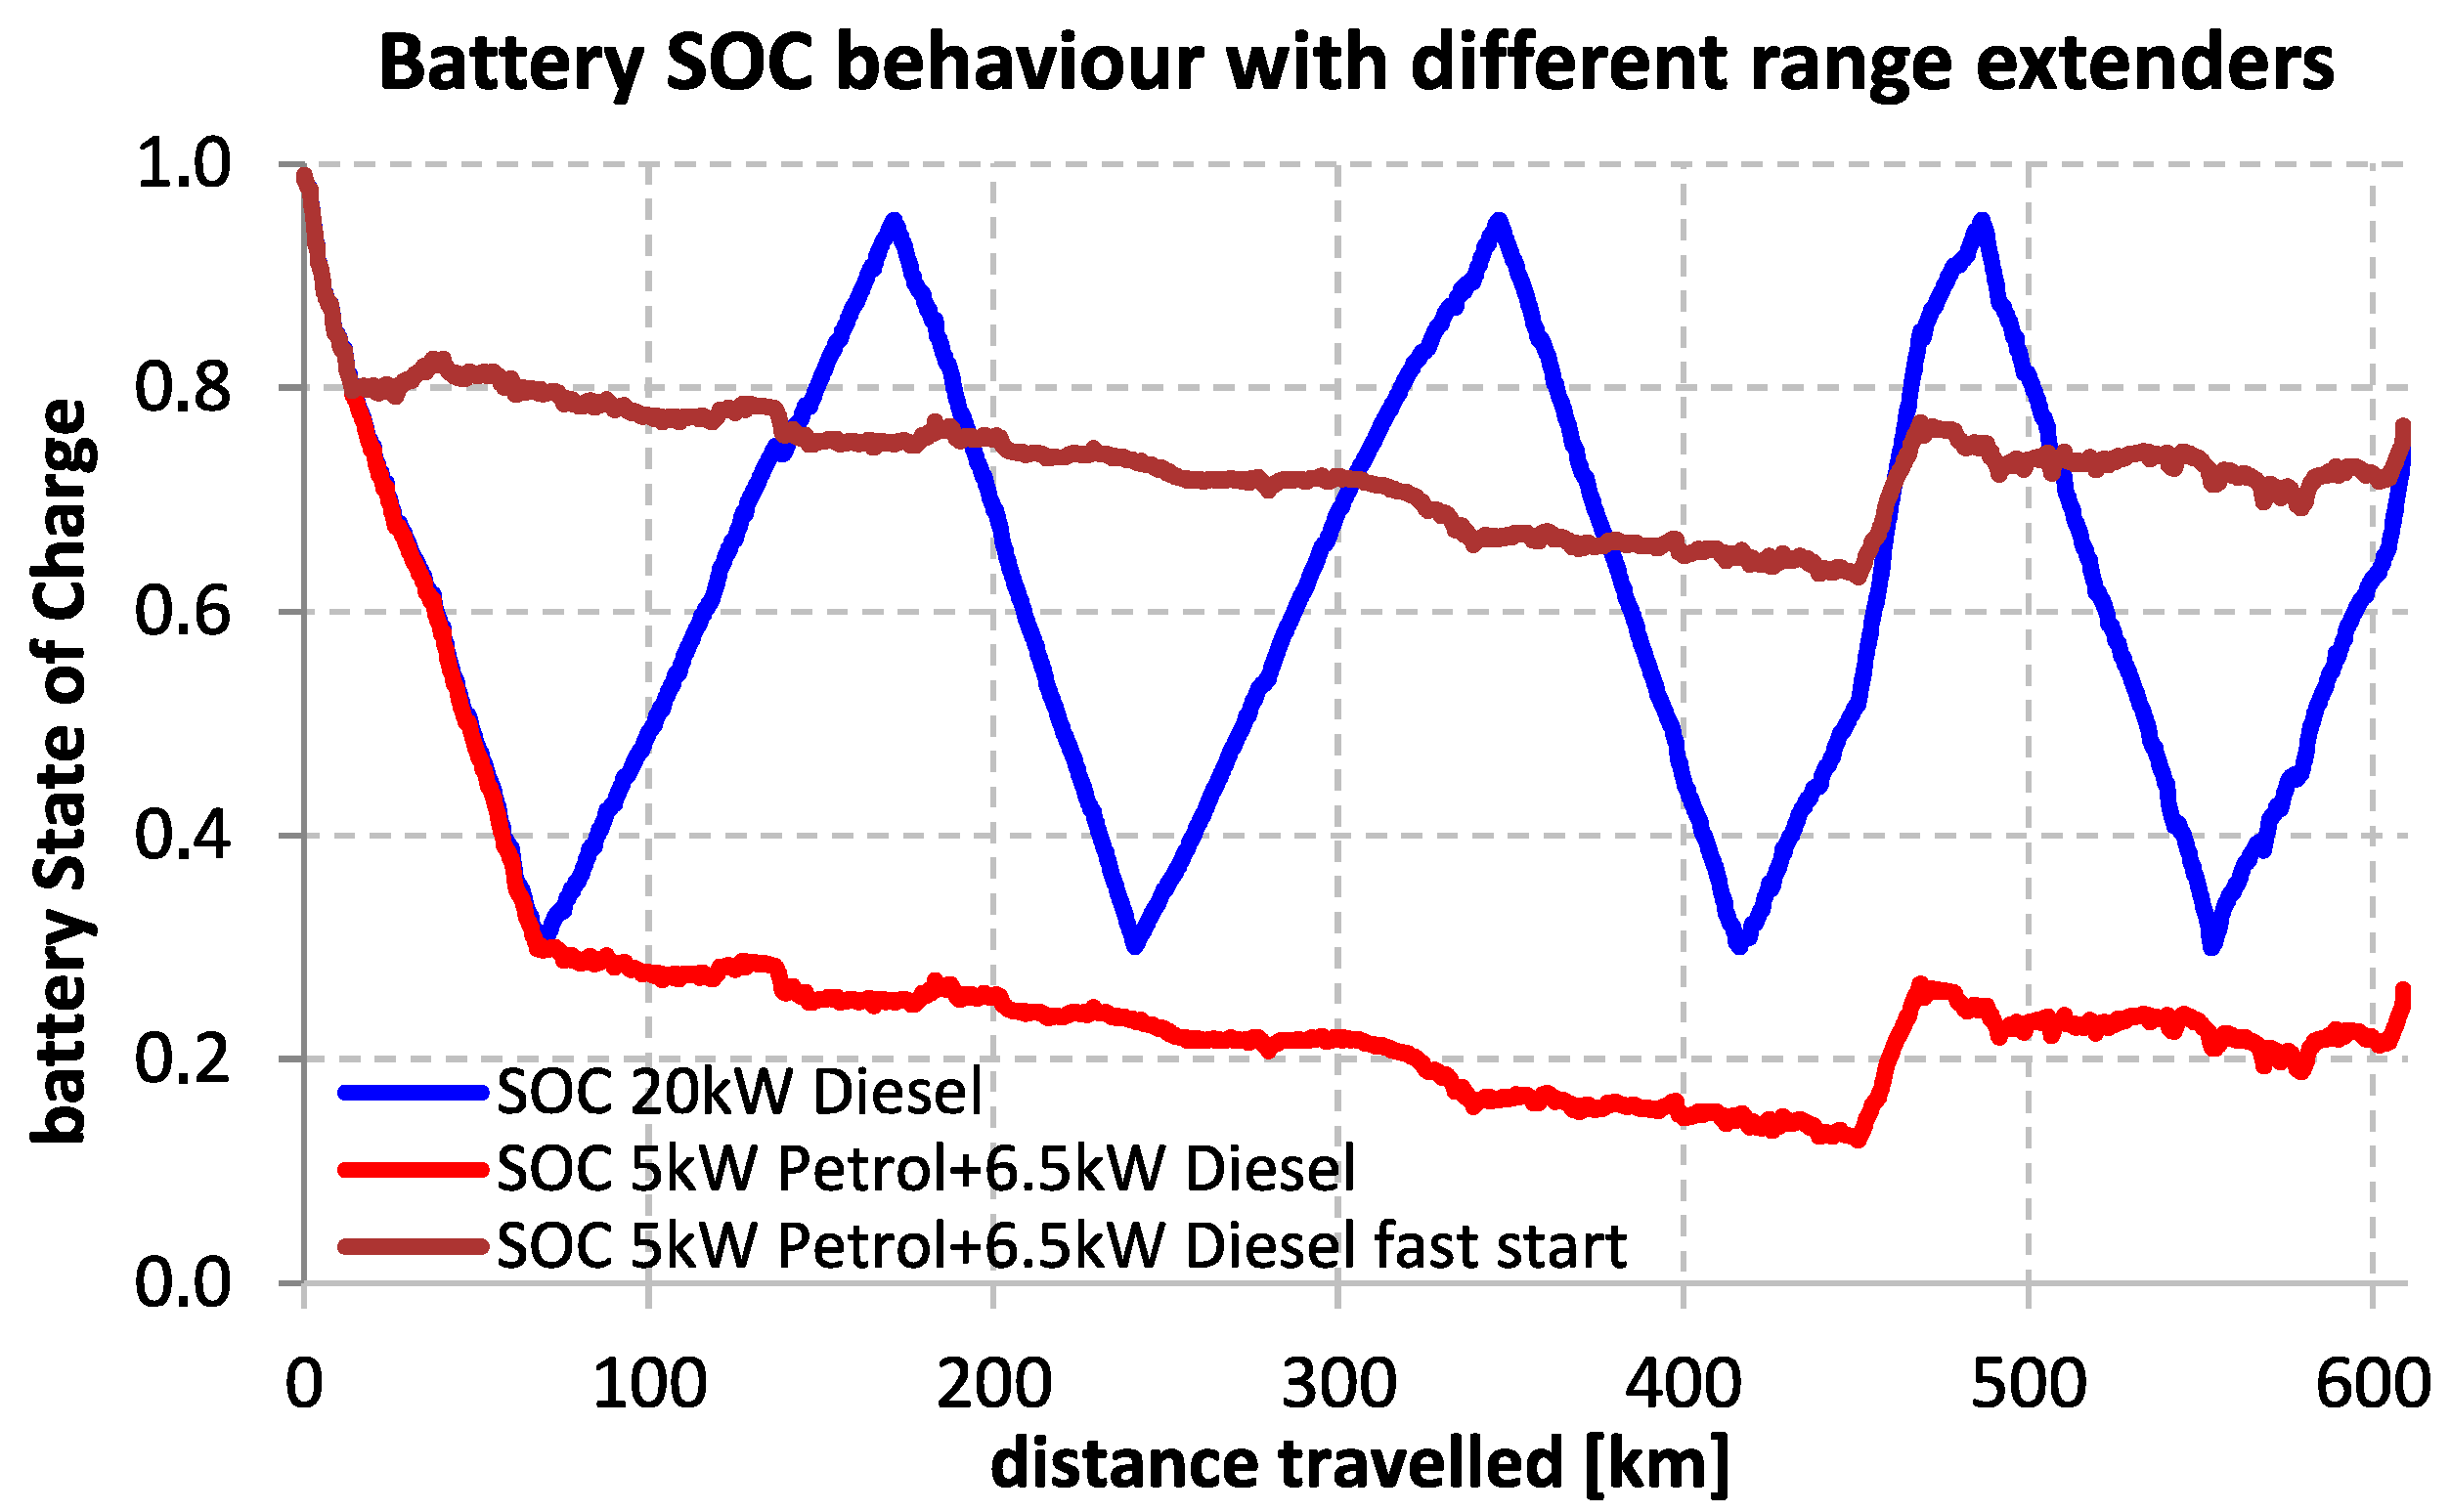
Figure 20 shows the SOC comparison for two different sets of generator sets installed on the RE. The SOC plot for a 20 kW diesel generator operating in the SOC
30–95 range is shown in blue. From the presented plot it can be inferred that the power of the genset is a bit too high and there are periods in which the generator is turned OFF. The generator should not stop for extended periods of time which may cause excessive cooling of the engine and its inefficient operation. The SOC for 5 kW petrol and 6.5 kW diesel aggregates working in the first case for SOC
30–95 and the second SOC
80–95 are shown in red and brown.
From the presented chart it can be seen that assuming too low level of SOC
ON (
Figure 20, labeled “5 kW Petrol + 6.5 kW Diesel”), can cause the battery pack to become discharged too deeply at generators with low power which can cause vehicle immobilization due to the lack of electricity in the battery pack. Therefore, a better setting in a situation where generators do not have enough power to cover the whole vehicle’s demanded energy is to set a higher level of SOC
ON (
Figure 20, labeled “5 kW Petrol + 6.5 kW Diesel fast start”).
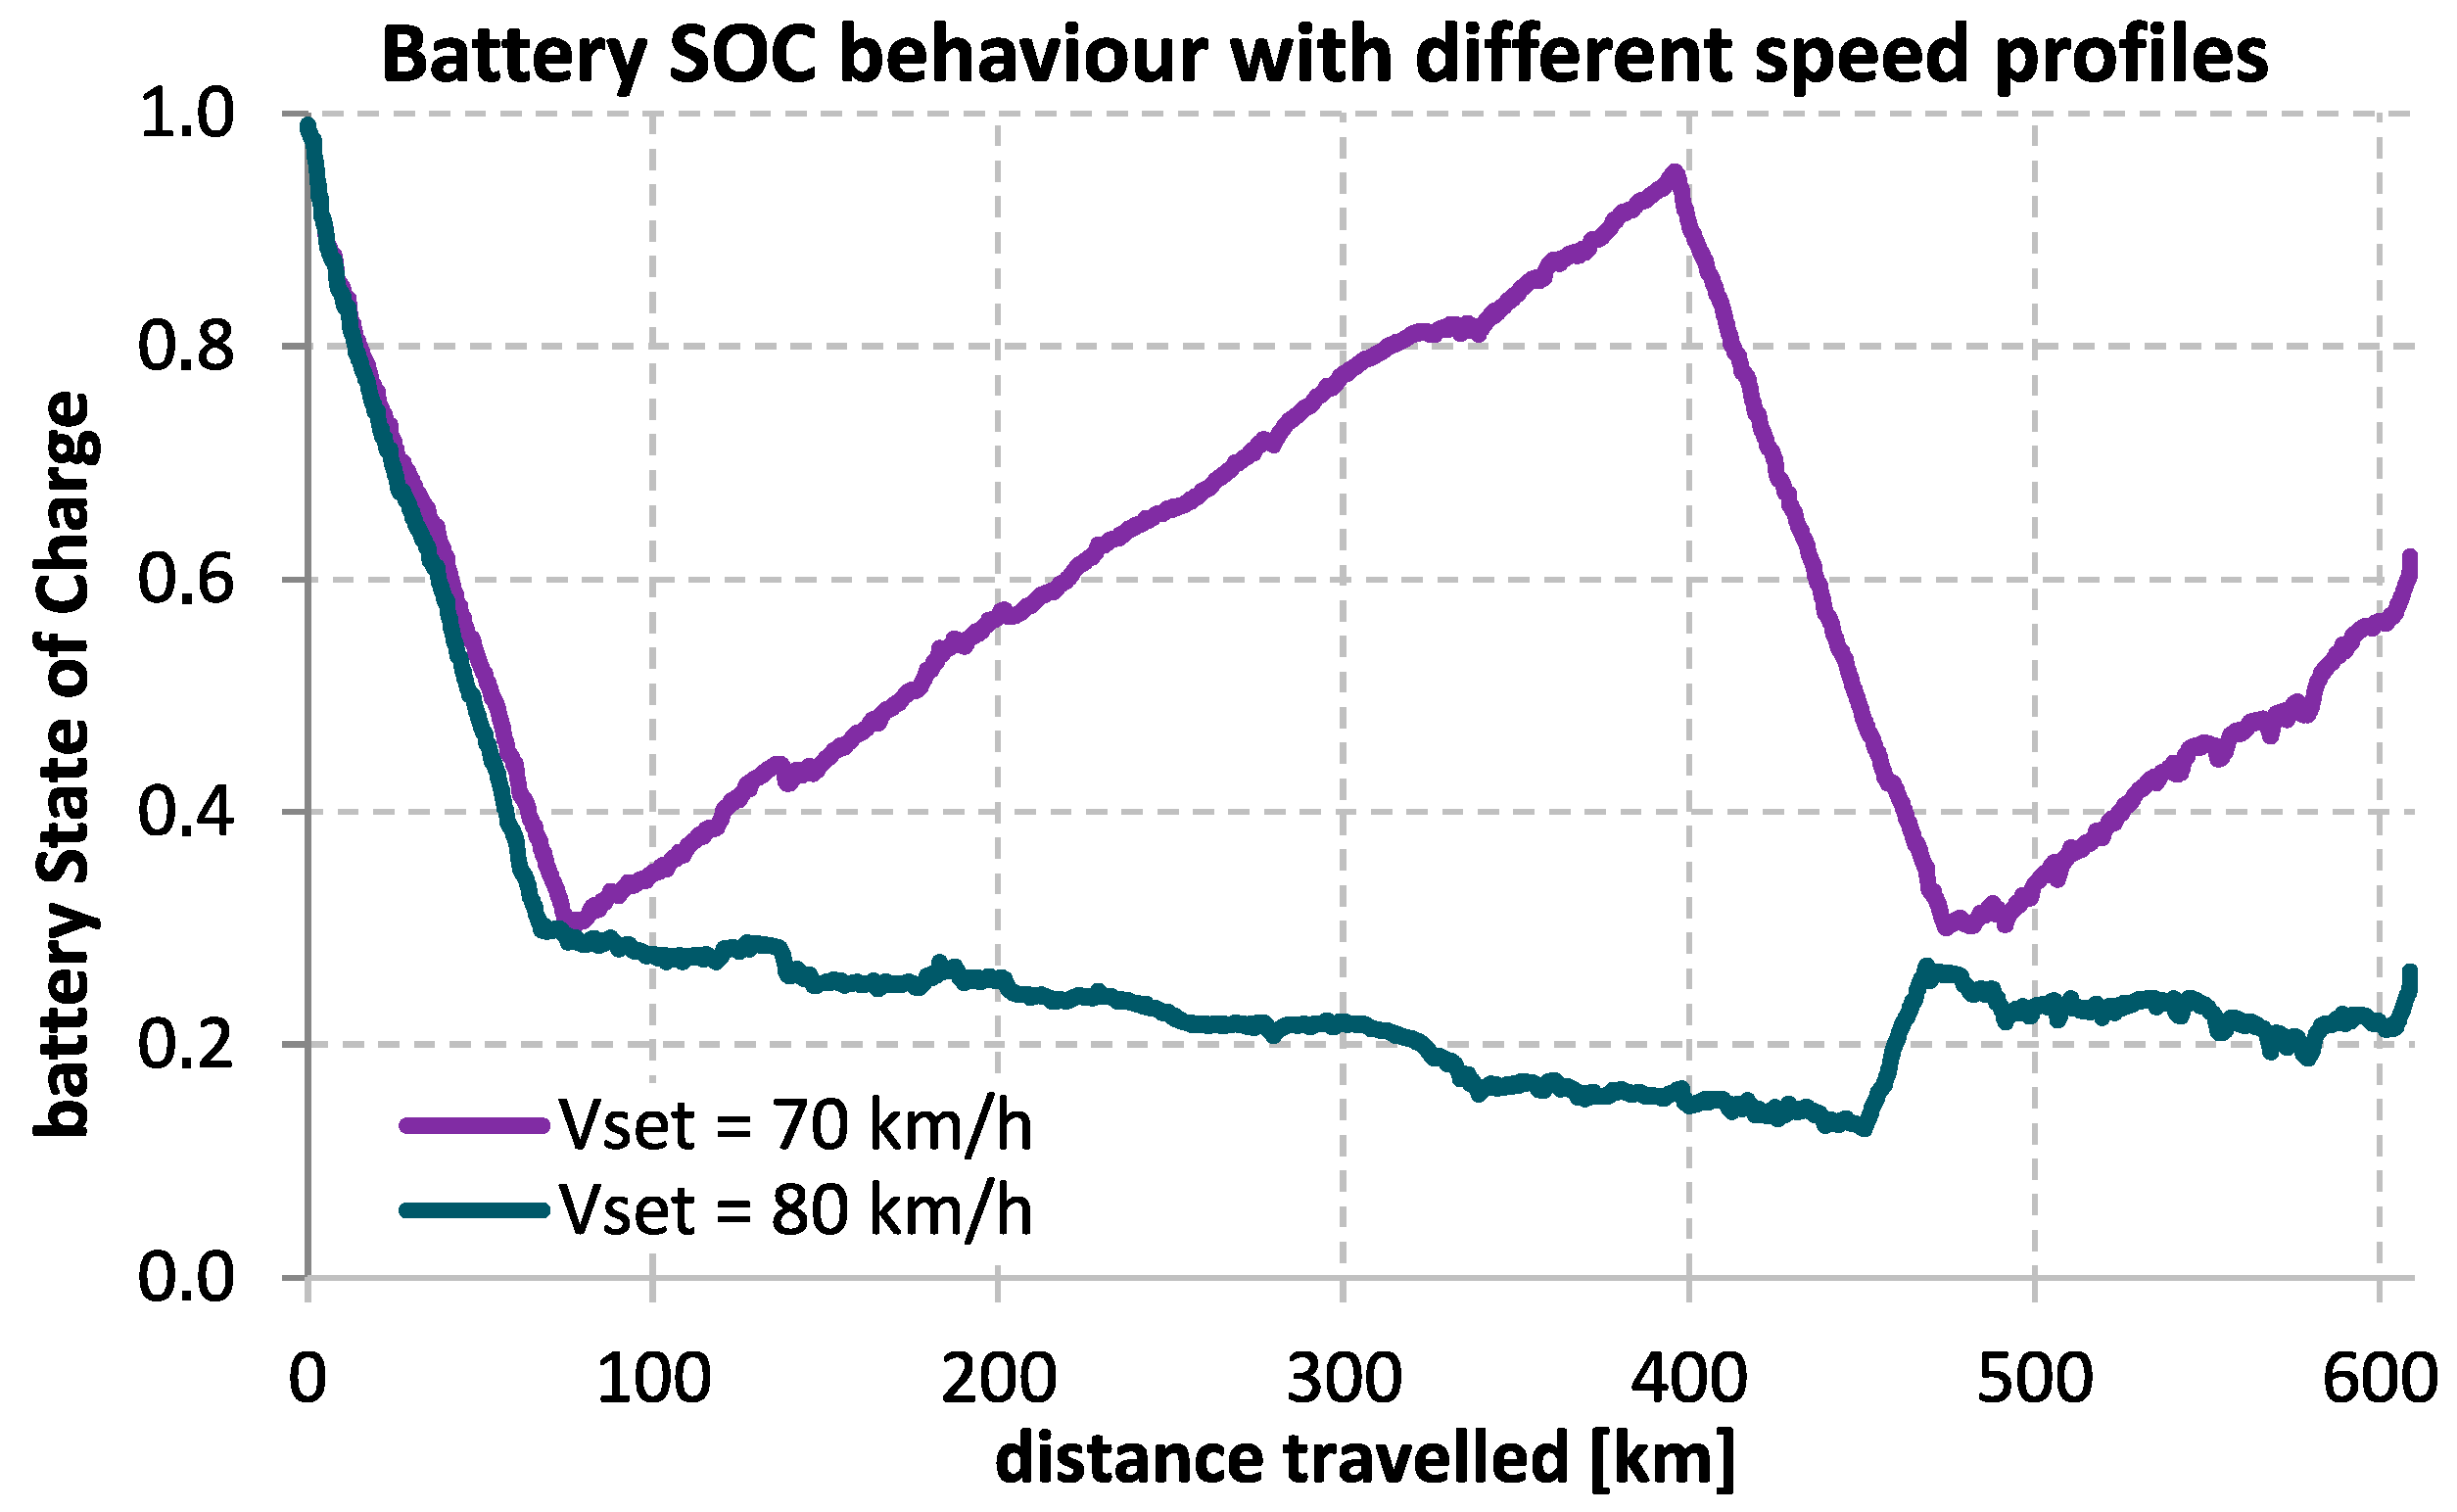
Figure 21 shows the charge level of the battery pack for a 609 km (380 miles) distance traveled at a constant operating speed of 70 kph (45 mph) for one case and 80 kph (45 mph) for the other at SOC
30–95.
As shown in
Figure 21, an increase in vehicle speed by 10 kph (6 mph) caused a significantly different course of battery charge status, which is obviously associated with spent fuel and the amount of pollutants emitted to the atmosphere. Bearing in mind the presented research results, it should be stated that the selection of a particular SOC
ON–OFF value should be subject to optimize taking into account a number of physical factors (ambient temperature, route height profile, route speed profile) as well as information that the vehicle user could provide (route length, level charge the battery pack after reaching the destination). Such a way of operation of RE contributes to both reducing the costs of operating an electric vehicle (as electricity produced in gensets is more expensive than electricity consumed from the power grid), and toxic gas emissions to the atmosphere by exploiting the possibility of covering the last section of the route without switching on generators.
5. Conclusions
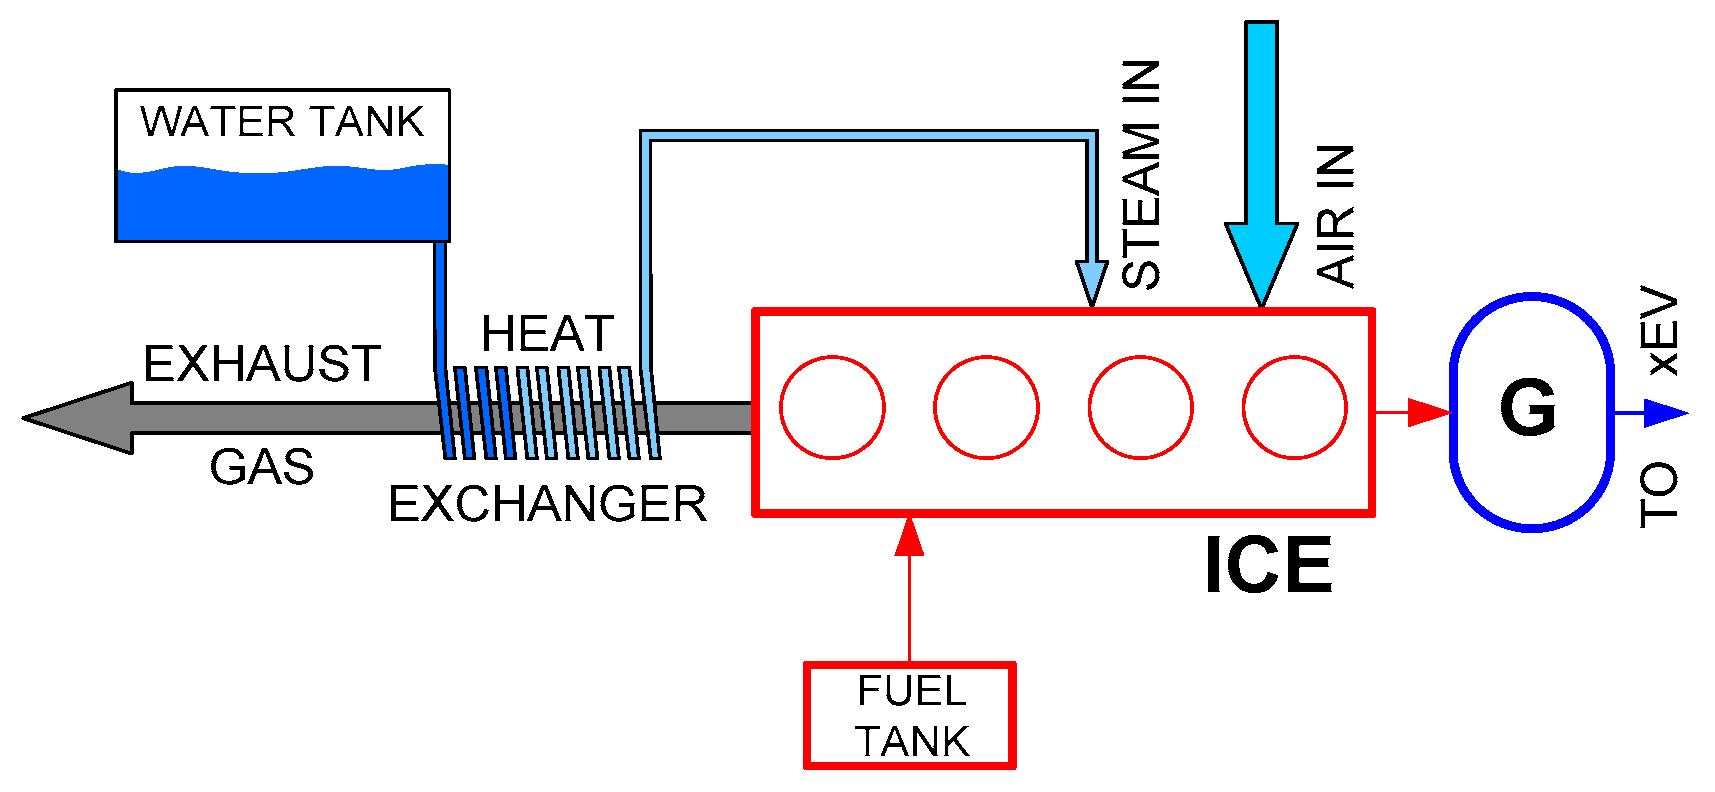
On the basis of real traction tests of a set of vehicles consisting of an electric car and a trailer with generating sets, a mathematical model was developed in the Modelica environment, for which many research scenarios were carried out. The conducted simulation tests have shown that it is possible to reduce the emission of some toxic gases to the atmosphere produced by ICE of electrical generator sets when steam or HHO gas is fed into the intake air manifold (
Figure 7 and
Figure 8).
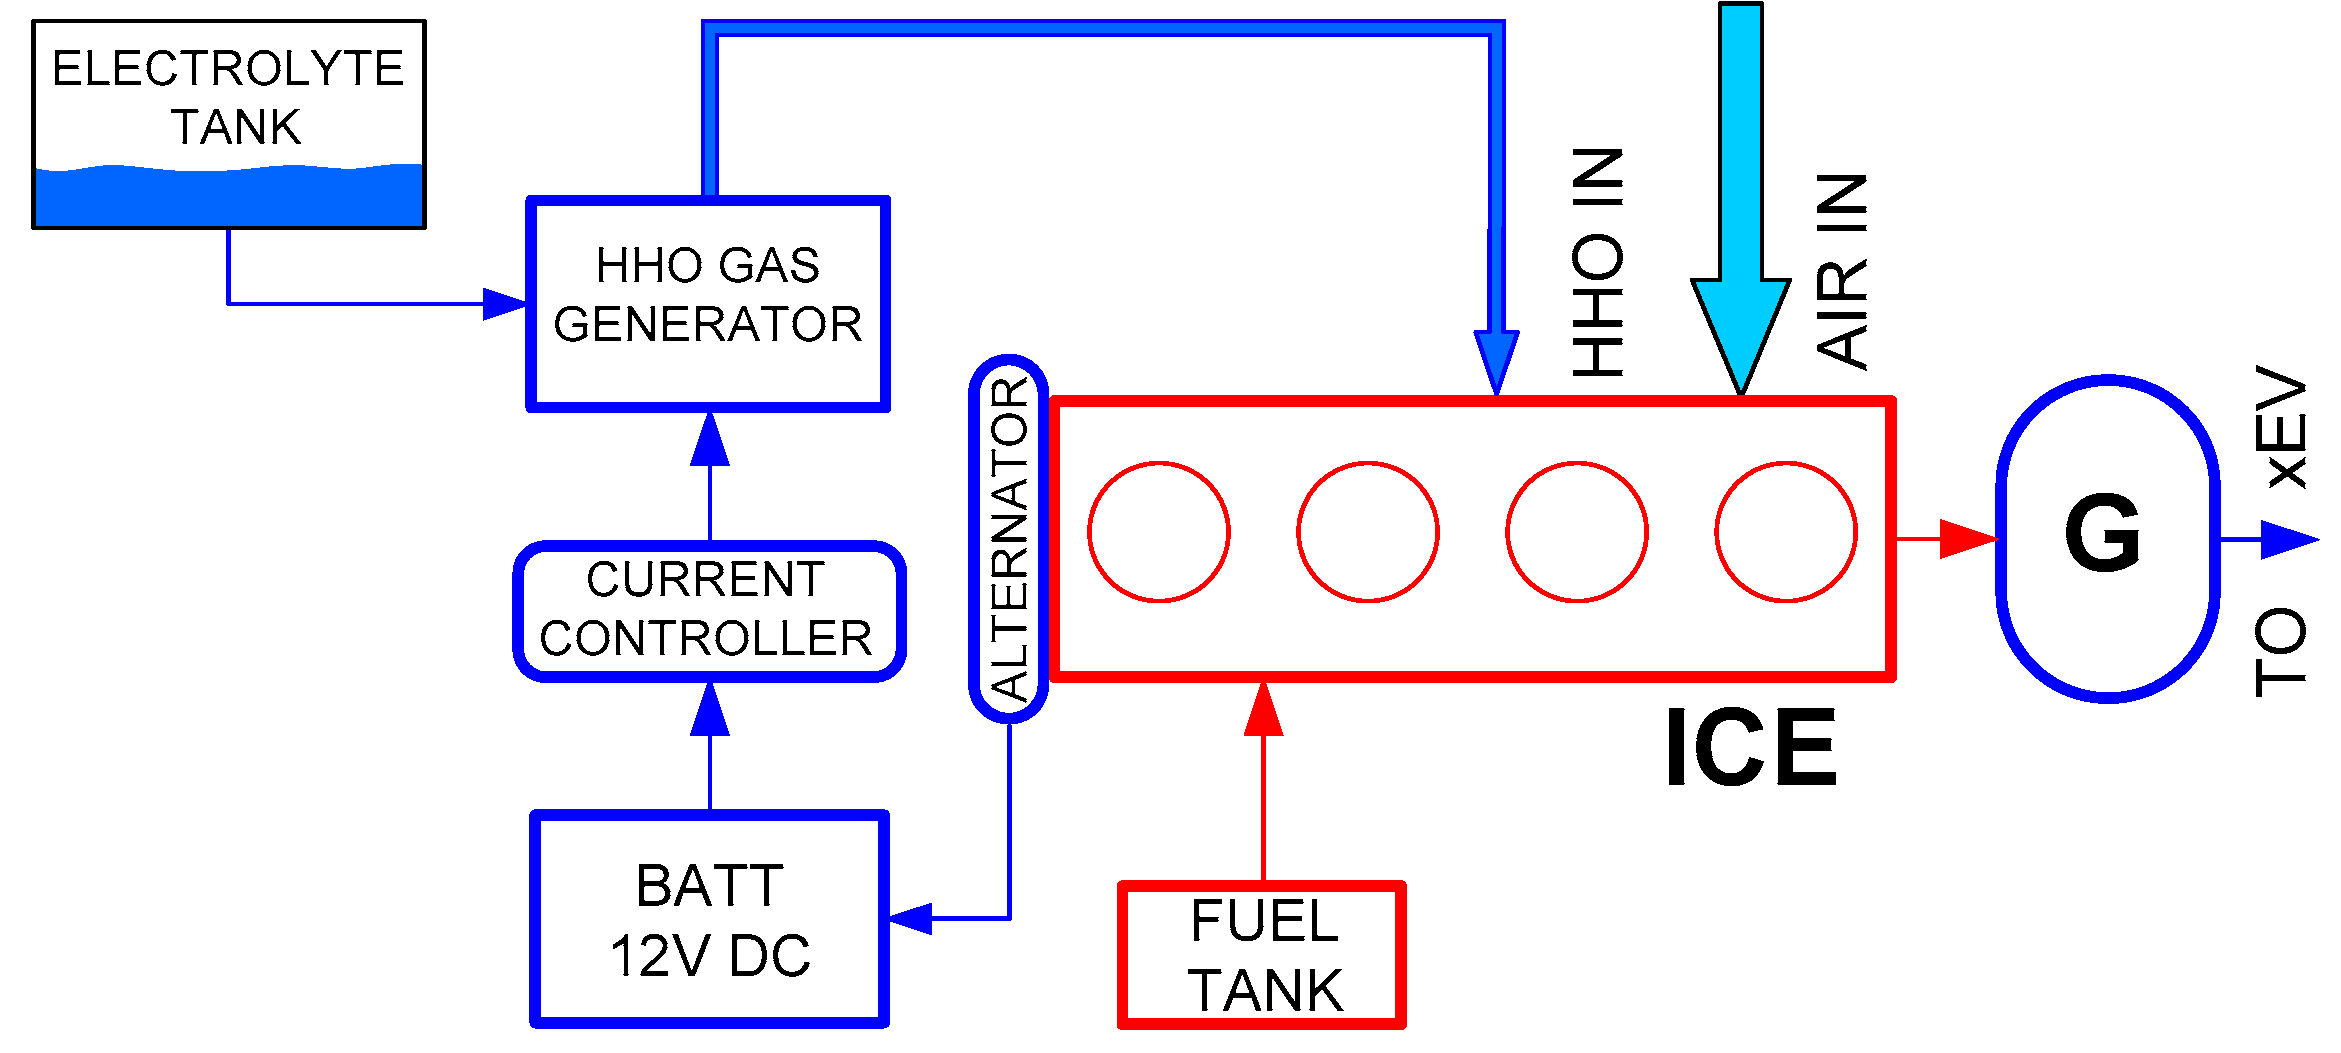
For a gasoline engine assisted with the addition of HHO to the air intake manifold, a decrease of CO and CO2 emissions by approx. 3% was noted, as well as an increase of NOx content by around 15%. At the same time, the petrol engine supplied with HHO additives showed a 10% reduction in fuel consumption.
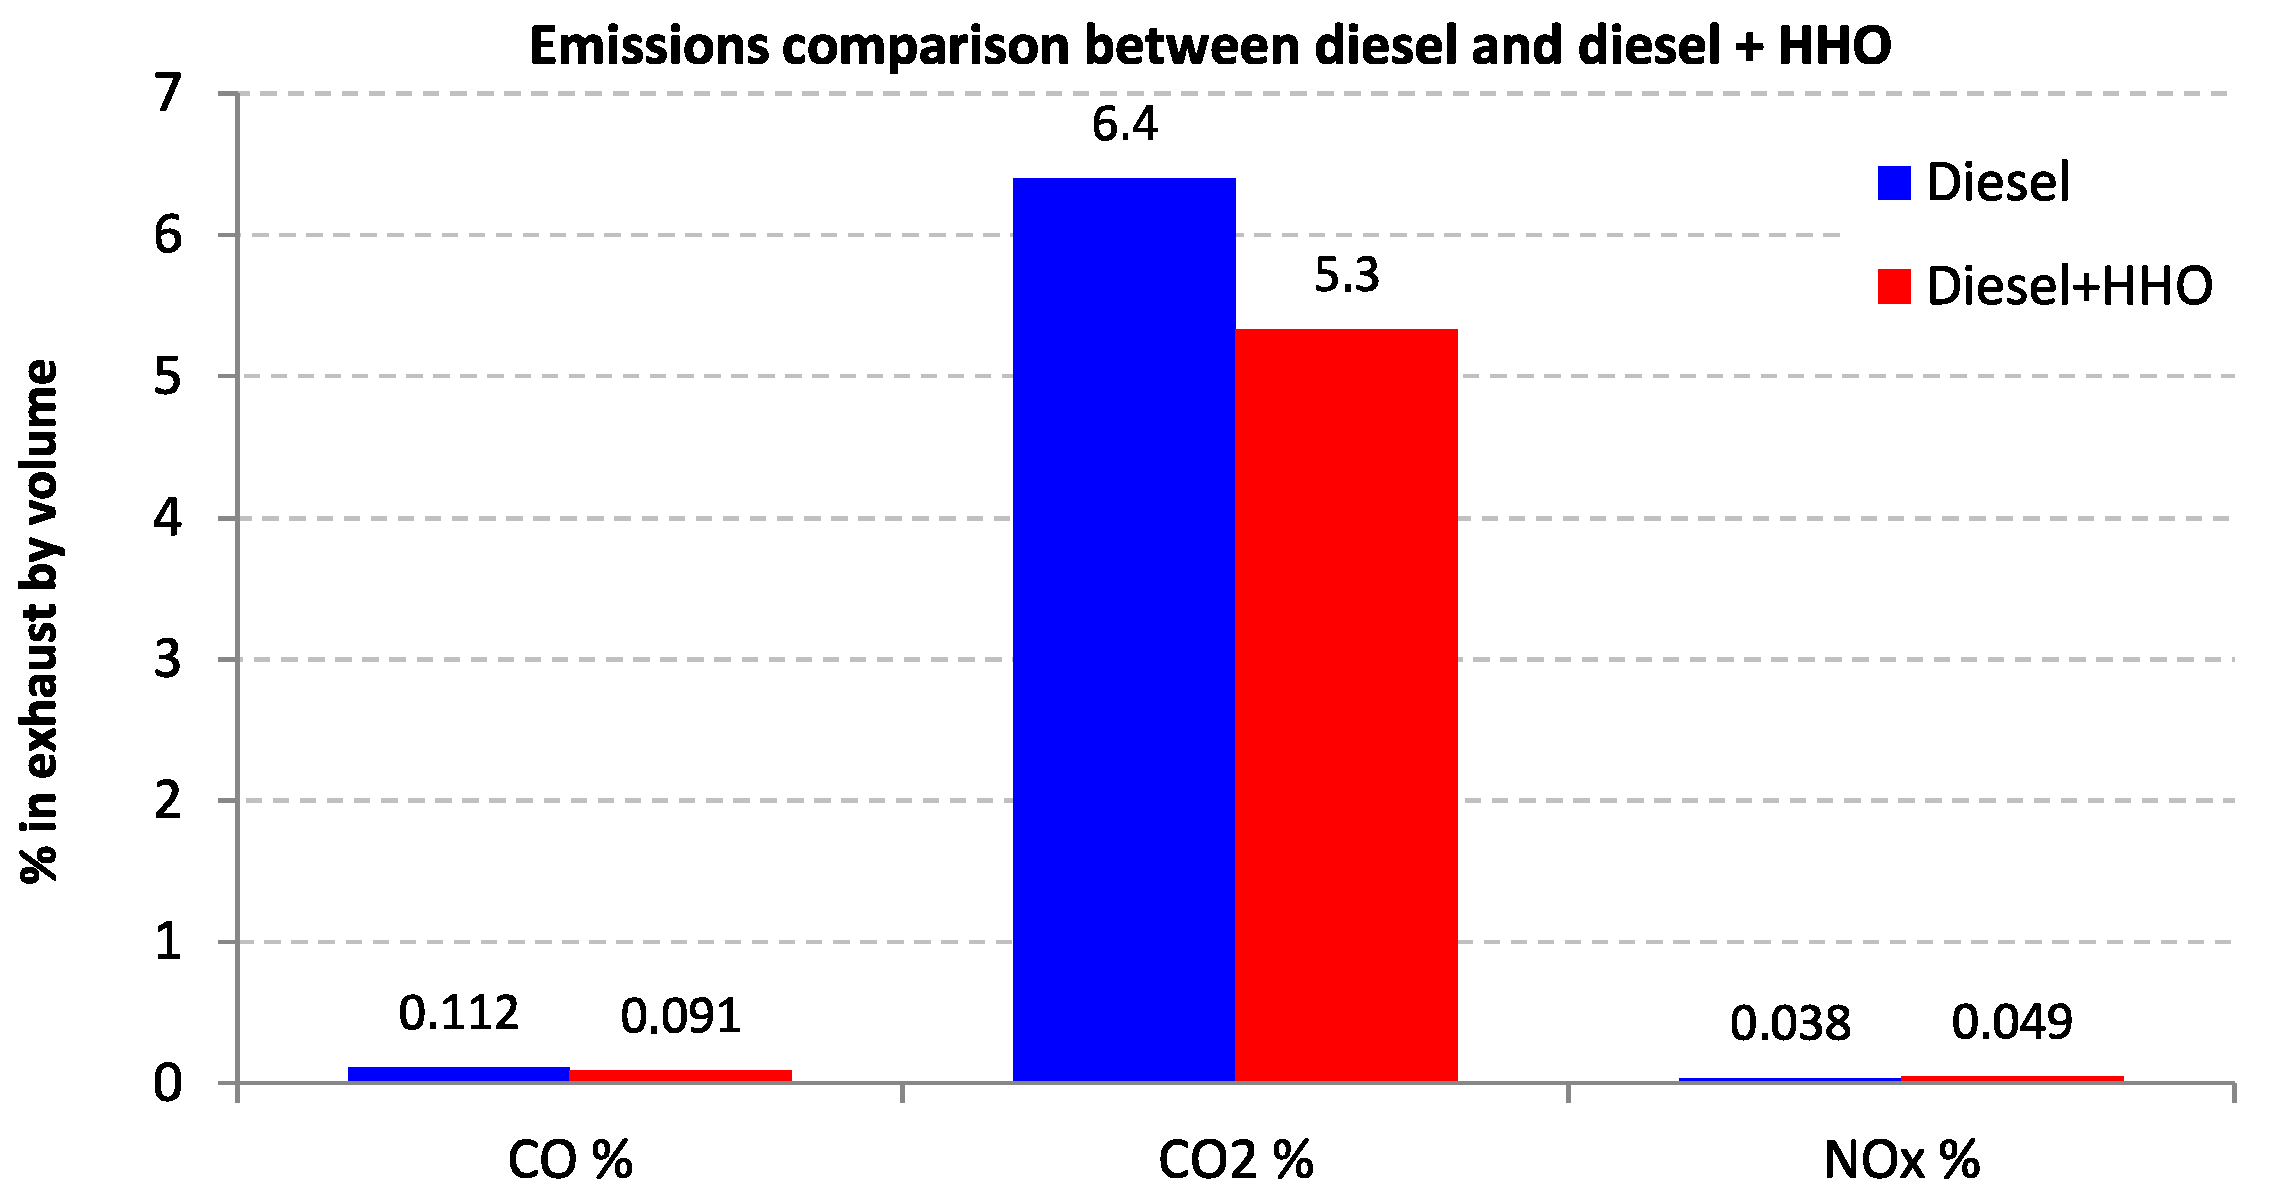
The diesel engine assisted by the addition of HHO to the air intake manifold showed a decrease in CO emissions by approx. 19%, a decrease in CO2 emissions by approx. 17%, and an increase in NOx emissions by approx. 22%. Adding additives to the engine intake manifold in the form of HHO gas contributed to a 5% reduction in fuel consumption.
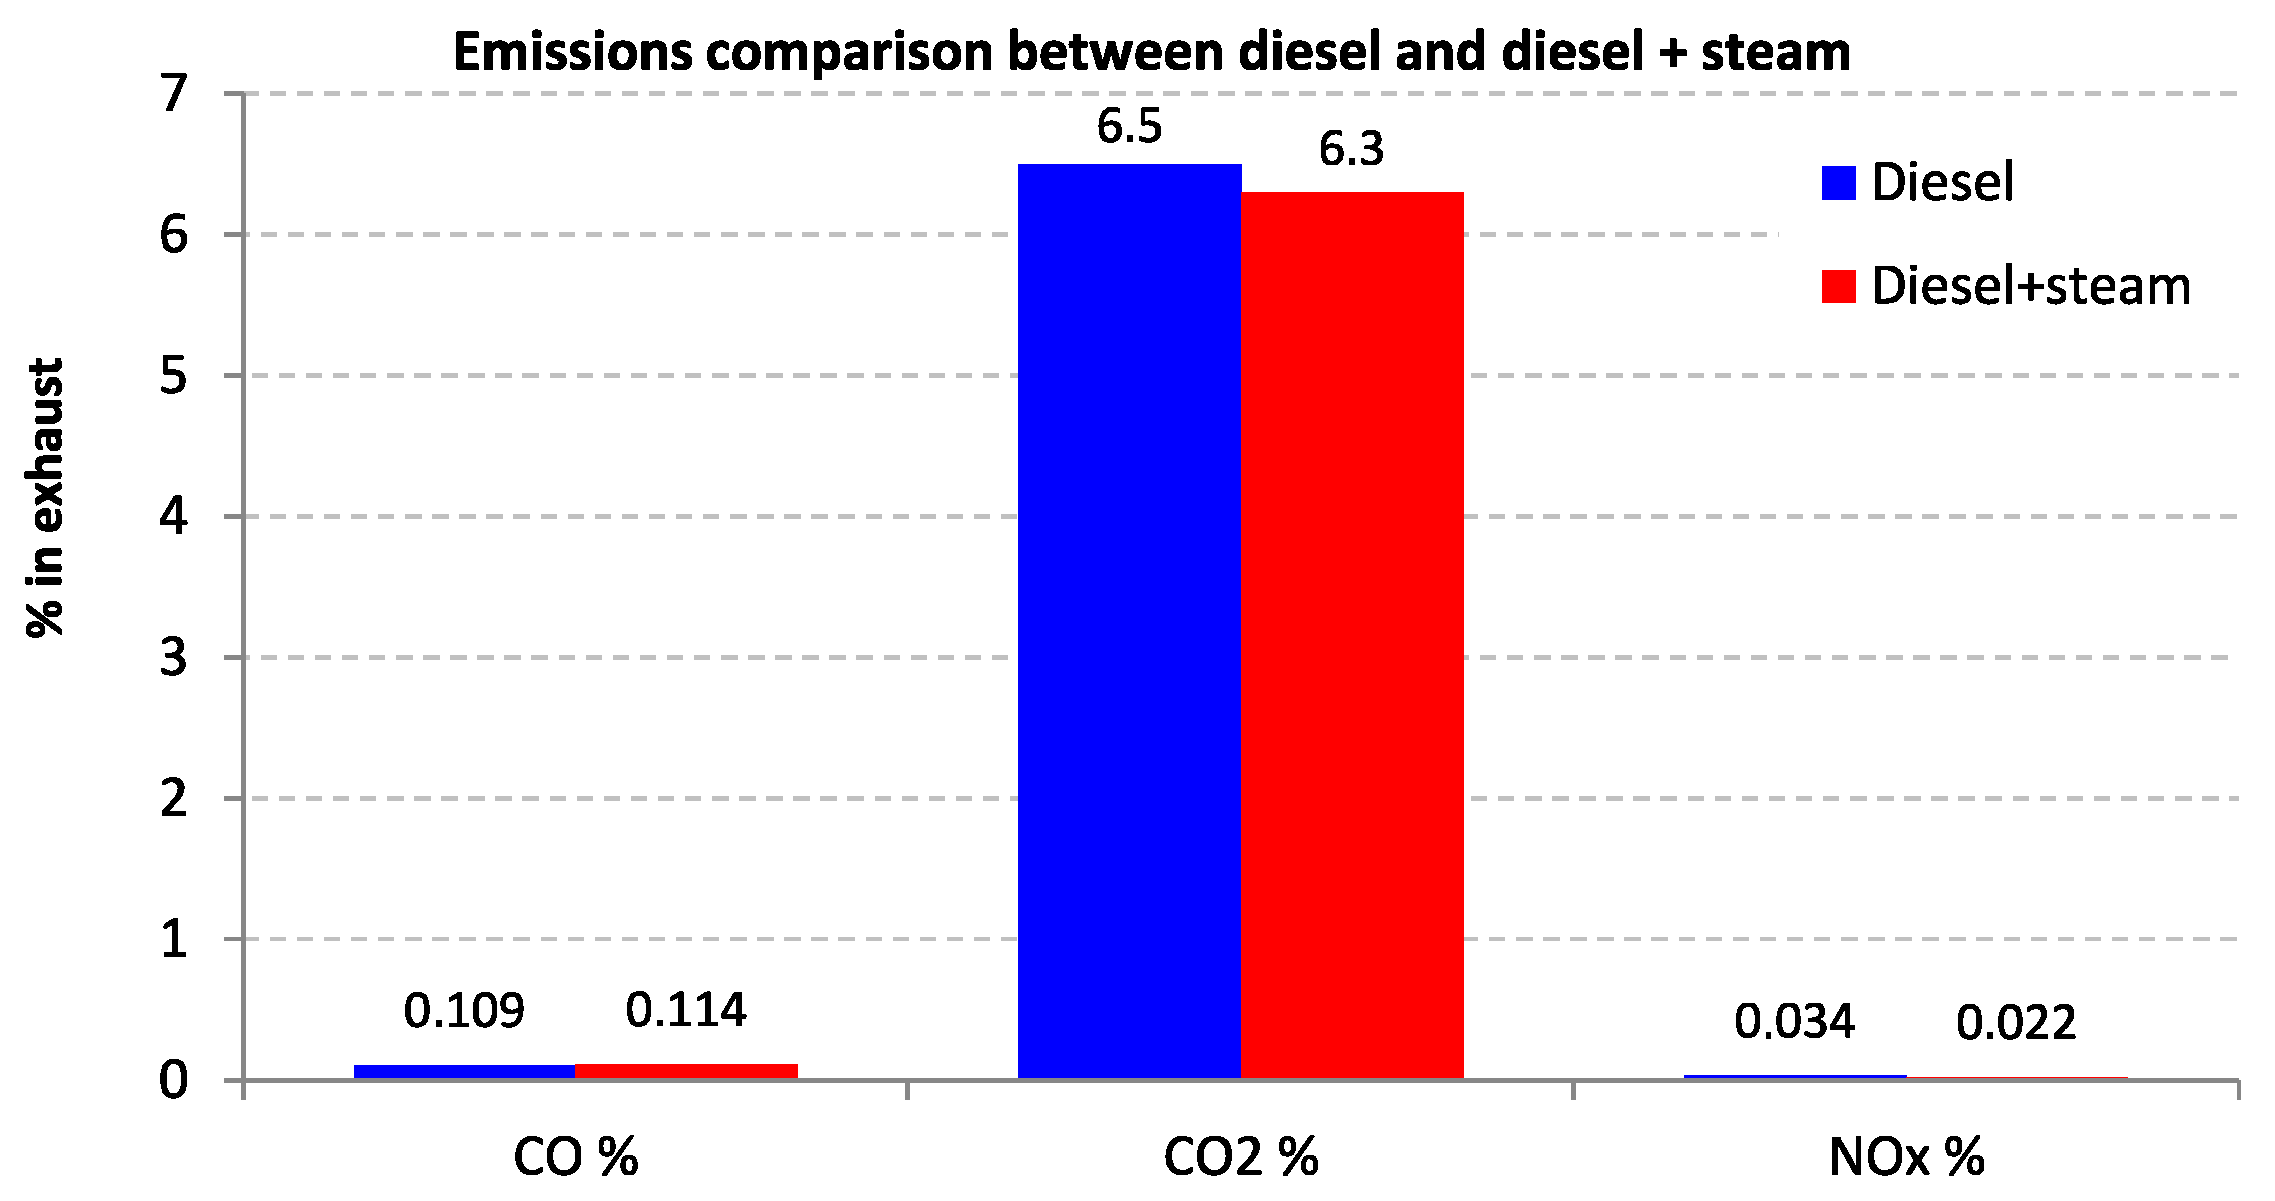
Diesel engine assisted by the addition of water steam to the air intake manifold, showed an increase in CO emission by approx. 4%, a decrease in CO2 emissions by approx. 3%, and a decrease in NOx emissions by approx. 35%. At the same time, when using water steam for a diesel generator, a slight increase in fuel consumption of 0.35% was observed.
The effect of water steam and HHO gas additives on the durability and service life of pistons, cylinders, valves, intake and exhaust systems was not analyzed in this research. Waste heat from gensets could be used in the future to heat the battery pack and vehicle cabin, if such need arises. The amount of gases emitted during the operation of an electric car with a RE is influenced by the assumed level of charge of the SOCON–OFF battery pack, for which the generator set is switched ON/OFF. The SOCON–OFF value should be set for the assumed distance to be traveled. Not without significance is also the impact of the travel speed of an electric vehicle equipped with towed RE.
The conducted research has demonstrated the benefits of development and application of trailer mounted range extenders with modules optimizing the fuel consumption for support of electric drive systems.


