Article

On Small Signal Frequency Stability under Virtual Inertia and the Role of PLLs

1
Electric Energy Systems, Center of Energy, Austrian Institute of Technology, 1210 Vienna, Austria
2
Institute for Energy Systems and Electrical Drives, Vienna University of Technology, 1040 Vienna, Austria
*
Author to whom correspondence should be addressed.
Energies 2018, 11(9), 2372; https://doi.org/10.3390/en11092372
Submission received: 24 August 2018 / Revised: 3 September 2018 / Accepted: 7 September 2018 / Published: 8 September 2018
(This article belongs to the Special Issue Electric Power Systems Research 2018)

Abstract

:
This paper presents a methodology that aims at identifying virtual inertia (VI) gain limitations from virtual synchronous generators (VSGs) while maintaining the frequency stability considering the delay associated with the frequency measurement process. The phase-locked loop (PLL) is typically used for frequency estimation that is used to calculate the rate of change of frequency (RoCoF) and it drives the VI loop. The PLL is generally accompanied by a low-pass filter that aims to suppress the impact of harmonics. This filter introduces a delay that when used with the VI control loop causes stability issues for high values of VI gain. A comparison of various PLL approaches suggests that certain variants tend to permit higher value of cut-off frequencies which can be utilized to increase the VI gain limit from VSG. This study presents a method by which the upper limit on VI gain can be quantified and related to the cut-off frequency of the PLL low pass filter that is indirectly representing the delay. It is performed using small signal frequency stability analysis on the frequency domain model of the grid with virtual inertia emulating VSG. The effective maximum VI gain from VSG is explored while satisfying the frequency measurement accuracy specification considering harmonics. The results show that the requirements of reaching a stable operation with sufficient stability margins can still be met with a faster PLL-based system and the potential increases in VI support from VSG can be quantified using the proposed method. The study has been first performed on a single machine single inverter bus (SMSIB) system and is generalized to the multi-machine and multi-inverter system.

1. Introduction

The climate change impacts have necessitated the need of transition from traditional combustion based generation to environmentally friendly sources of energy. In relation, recent decades have experienced an increasing trend towards distributed generation from wind and solar energy [1]. This trend has important consequences on system stability. The power system is stable if mechanical power provided to synchronous generators is in balance with the electrical demand. An imbalance causes a shift in the frequency as rotor of the generator tend to slow down (speed up) depending on the torque experienced by the rotor resulting in frequency decrease (increase). The inertia response of the machines acts instantaneously and the kinetic energy in the rotor is converted to electrical power, limiting the RoCoF. The phenomenon is termed as inertia response from the generator. In addition, the frequency variation is sensed by the governor and the mechanical input of the generator is controlled accordingly. This action is termed as the primary frequency response. The mechanical inertia in the rotor of synchronous generators has been instrumental in limiting the RoCoF leading to reduced oscillations and peaks in the frequency termed as “frequency nadir”. The frequency settles to a new steady-state value with the generator output power determined by the droop gain of the power-frequency governor loop. As synchronous generators are replaced with inverter interfaced generation, the mechanical inertia is replaced by a limited amount of energy available at DC link capacitors in case of PV, and in the rotors of wind turbines [2]. Additionally, in the inverter dominated generation, there is a delay associated with the frequency measurement process. The decline in inertia and delayed response has direct consequence on the frequency stability resulting in increased RoCoFs and more extreme frequency nadirs that can cause undesired load-shedding, cascading failures or large-scale blackouts.
Recently, the impact on frequency stability due to a decline in system inertia has become a matter of significant importance as reflected by different reports and studies [3]. The report of electricity reliability council of Texas (ERCOT) [4] discusses the reduction in inertia caused by the economic displacement of synchronous generators in meeting the inertia requirements when wind generation is serving the highest share of load. In the European network of transmission system operators (ENTSO-E) framework, the primary reserve needs to be activated when the frequency deviation exceeds ± 10 mHz from the nominal frequency of 50 Hz. In recent years, ENTSO-E has experienced increasing levels of deterministic frequency deviations resulting in the activation of a significant share of primary frequency control reserves that have been initially intended and dimensioned for large generation and load outages [5] The synchronous area continental Europe has experienced RoCoF of up to 1 Hz/s in some control areas having the highest risk of imbalance accounting to a 20% difference between supply and demand. This level is expected to rise to 2 Hz/s with a 40% imbalance ratio [6]. Along with the high dynamics of the frequency transients, a significant drop in frequency can lead to triggering of under frequency relays that can cause load shedding. Some case studies are an exception, such as a study of the RoCoF in Austrian grid reported in [7] that suggests that no critical increase in RoCoF has been observed in the first quarter of 2018 despite 74% share of instantaneous non-synchronous generation. The result cannot be generalized and is possibly due to the conventional generation running at partial loading or in idle mode, thus the inertia is still available. However, when the conventional generation is dominantly replaced by non-synchronous generation, the RoCoF is expected to increase.
Various steps have been taken to counteract the declining inertia situation. In several countries, the inertia response from wind farms has been made mandatory [8,9]. In addition a new product called enhanced frequency response (EFR) has been introduced in the UK [10] that requires a response time of under 1 s. Among market participants, energy storage systems (ESS) have emerged as a key player [11]. The control system of ESS provides the inertia support by emulating the response of a synchronous generator. However, the main limiting factors of the inertia support from ESS are their stored energy and the capability to respond to the fast frequency transients. In this context, the estimation and processing of frequency from the time domain voltage signal is the most critical part during the inertia response [12].
In this paper, the inertia emulating source under current control is termed as virtual synchronous generator (VSG). It operates in grid following mode in terms of frequency control and can represent an energy storage system, PV, wind turbine or other inverter interfaced generation. The virtual inertia emulation from a VSG requires calculation of RoCoF, for which the frequency measurement is central. The best frequency measurement method should ideally be accurate, easy to implement, converge quickly to the expected value, reject noise and harmonics and require low computational power [13]. Several frequency measurement methods have been proposed in the literature. Some of them without being exhaustive include zero-crossing [14], least squares [15], demodulation methods [13], Kalman filtering [16,17] and the phase-locked loop (PLL) [18]. Each method either applied to single phase or preferably to three phases must deal with the harmonics, voltage imbalance, phase angle jump and non-stationary environments [16]. This paper focuses on the frequency estimation using PLL due to its wide spread application in practical inverters. From the application perspective, authors in [19] have explored the fast frequency response potential from a offshore multi-terminal high voltage direct current scheme where a real time digital simulator based PLL module has been used that introduced a delay of 120 ms in detection of voltage variations. Similarly in [20], the synthetic inertia contribution from electric vehicles is explored. The frequency estimation introduces a delay of 200 ms during signal propagation and filtering in the PLL. This delay plays an important role in limiting the virtual inertia support while studying the stability of the power system. In literature, the quantification of virtual inertia support and its relevance with the delay in frequency estimation has not received significant attention. Authors in [3] reviews new stability analysis methods that consider delays inherently using delay differential-algebraic equations (DDAEs) representing converters in low inertia studies. This approach aims to reduce the large scale DDAEs into low-frequency and critical eigen-values whose influence on the stability margin can be studied [21,22]. This approach needs further extension to consider multiple and time varying delays while considering the virtual inertia gains of the VSGs.
This motivates the presented study that models the influence of delays in frequency measurement as the cut-off frequency of the PLL low-pass filter and relates it to the eigen-value based stability analysis of the system. The damping criterion determines the virtual inertia support limitations from a VSG. The contributions from this work can be classified into two categories: firstly, a parametric study is performed to investigate the influence of low-pass filter cut-off frequency ( f c ) on the frequency estimation accuracy using various PLL approaches. A comparative study of PLL variants suggests that the second order generalized integrator frequency locked loop (SOGI-FLL) approach with the low-pass filter provides a good estimate of frequency. A parametric study identifies the maximum value of f c that satisfies the frequency estimation accuracy requirements while considering harmonics in reference to EN50160 guidelines [23]. SOGI-FLL allows to increase the f c and thus increasing the bandwidth of the VI loop. The second part of paper focus on the quantification of maximum provision of the VI gain given the higher value of the f c . The limits are identified using small signal stability analysis of the equivalent frequency domain model of the grid having VSGs. The most relevant paper to this study has been [24], where authors have performed the small signal analysis of a microgrid using aggregate models. The impact of f c and the effective virtual inertia gain are separately studied. This paper extends the study in quantifying the increase in maximum virtual inertia gain from the VSG for a given range of f c . The result is crucial to quantify the increase in inertia support that can realized if a fast and robust frequency estimation and processing technique is used. The frequency stability is assessed with a conservative damping ratio taken as a reference. Analysis of the proposed approach is performed for a SMSIB system and is generalized to a system having multiple synchronous machines and VSGs.
Following this introduction, the paper is organized as follows: Section 2.1 presents the frequency estimation methods. A parametric study of finding the f c limits and a harmonic sweep analysis is performed to explore the impact of filtering on harmonic reduction in Section 2.2. It is followed by the discussion on inertia from VSG and small signal frequency stability model of the VSG and grid in Section 2.3. The models are used in the case studies for single and multi-inverters providing virtual inertia in Section 3.1 and Section 3.2, respectively. The paper ends with an conclusion and outlook in Section 4.

2. Modeling and Analysis of PLL and Virtual Inertia in Grid

This section provides a comparison of the various PLL-based frequency estimation approaches under a step event. The delay introduced by filtering is studied and subsequently a parametric study is performed to study the influence of PLL low-pass filter cutoff frequency on the frequency measurement accuracy. The objective is to maximize the overall bandwidth by increasing the cut-off frequency in order to support higher levels of the VI gain while limiting the impact of harmonics in the frequency measurement process. This is followed by the discussion about inertia concept and virtual inertia provision from VSG. A small signal stability model of the aggregate system is derived combining frequency domain model of VSG with its PLL, dynamic loads and the grid frequency response.

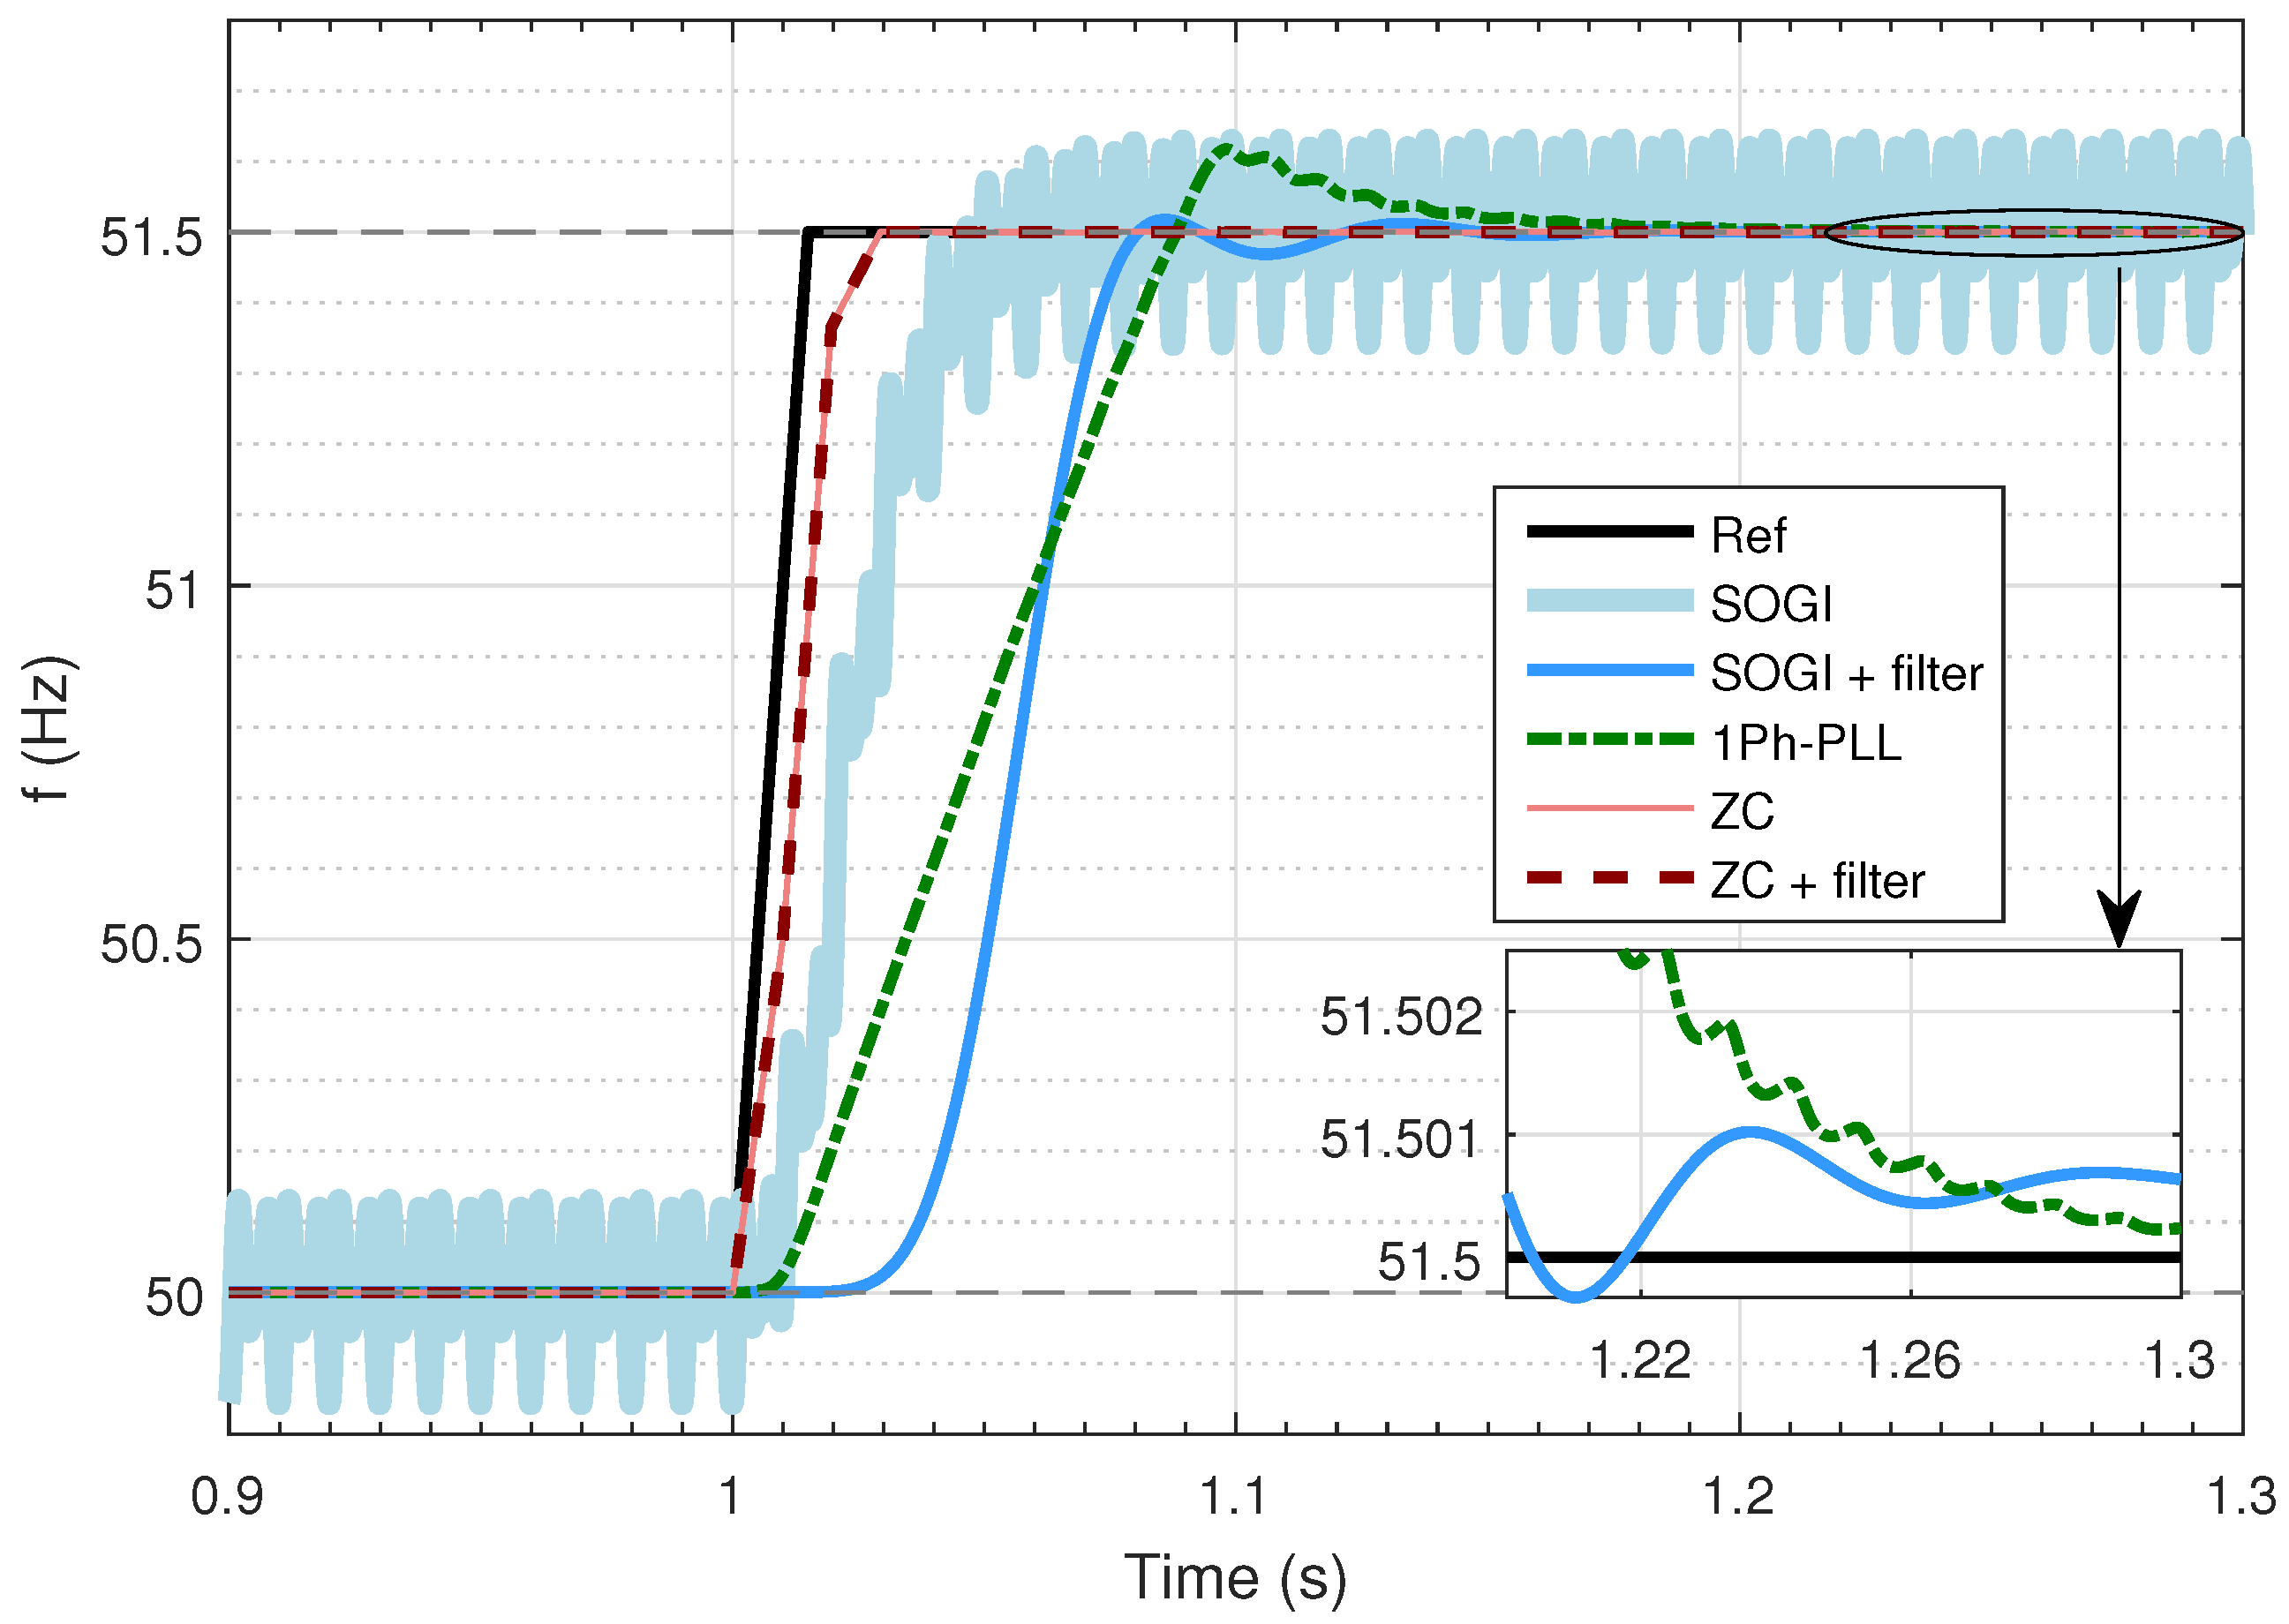
2.1. Frequency Estimation Methods

A typical process of frequency estimation using PLL starts with the monitoring of time domain voltage signal. Since the voltage measurement is accompanied by harmonics and noise, a filtering process is necessary. Typically a low-pass filter is used at the output of PLL in order to suppress the impact of harmonics on the frequency estimation [24,25]. This filtering introduces some delay, which plays, as shown in the next sections, a decisive role in the system stability. In order to get an insight in the delay introduced by the filtering process, a frequency step function is considered. It is to note that a characteristic frequency response function is not used here as the objective is not to test the behavior of PLL across the spectrum of frequency measurement but rather is to study the limiting factors of obtaining accurate frequency measurements while considering harmonics. A step function also provides basis for comparison of various PLL techniques (with and without filter) in order to observe the delay introduced due to the filtering process. Three variants of PLL have been used in this work to assess the performance of frequency measurement from PLL:
  • Single phase PLL with automatic gain control as discussed in [26] with its implementation referred here as Matlab function [27].
  • SOGI-FLL introducing a control loop to auto-adapt the center frequency of SOGI to the input frequency [28]. It operates on the single phase voltage signal.
  • SOGI-FLL with a sixth order low-pass Butterworth filter at its output.
The comparison of three models is shown in Figure 1, where SOGI-FLL based model with the low-pass filter gives comparatively improved results in terms of settling time while satisfying the 1 mHz accuracy requirement [5,29]. SOGI-FLL is selected and referred to as PLL in rest of the paper.

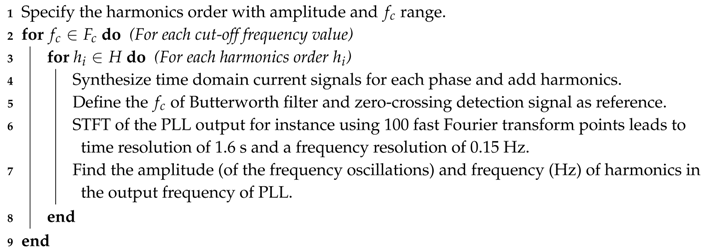
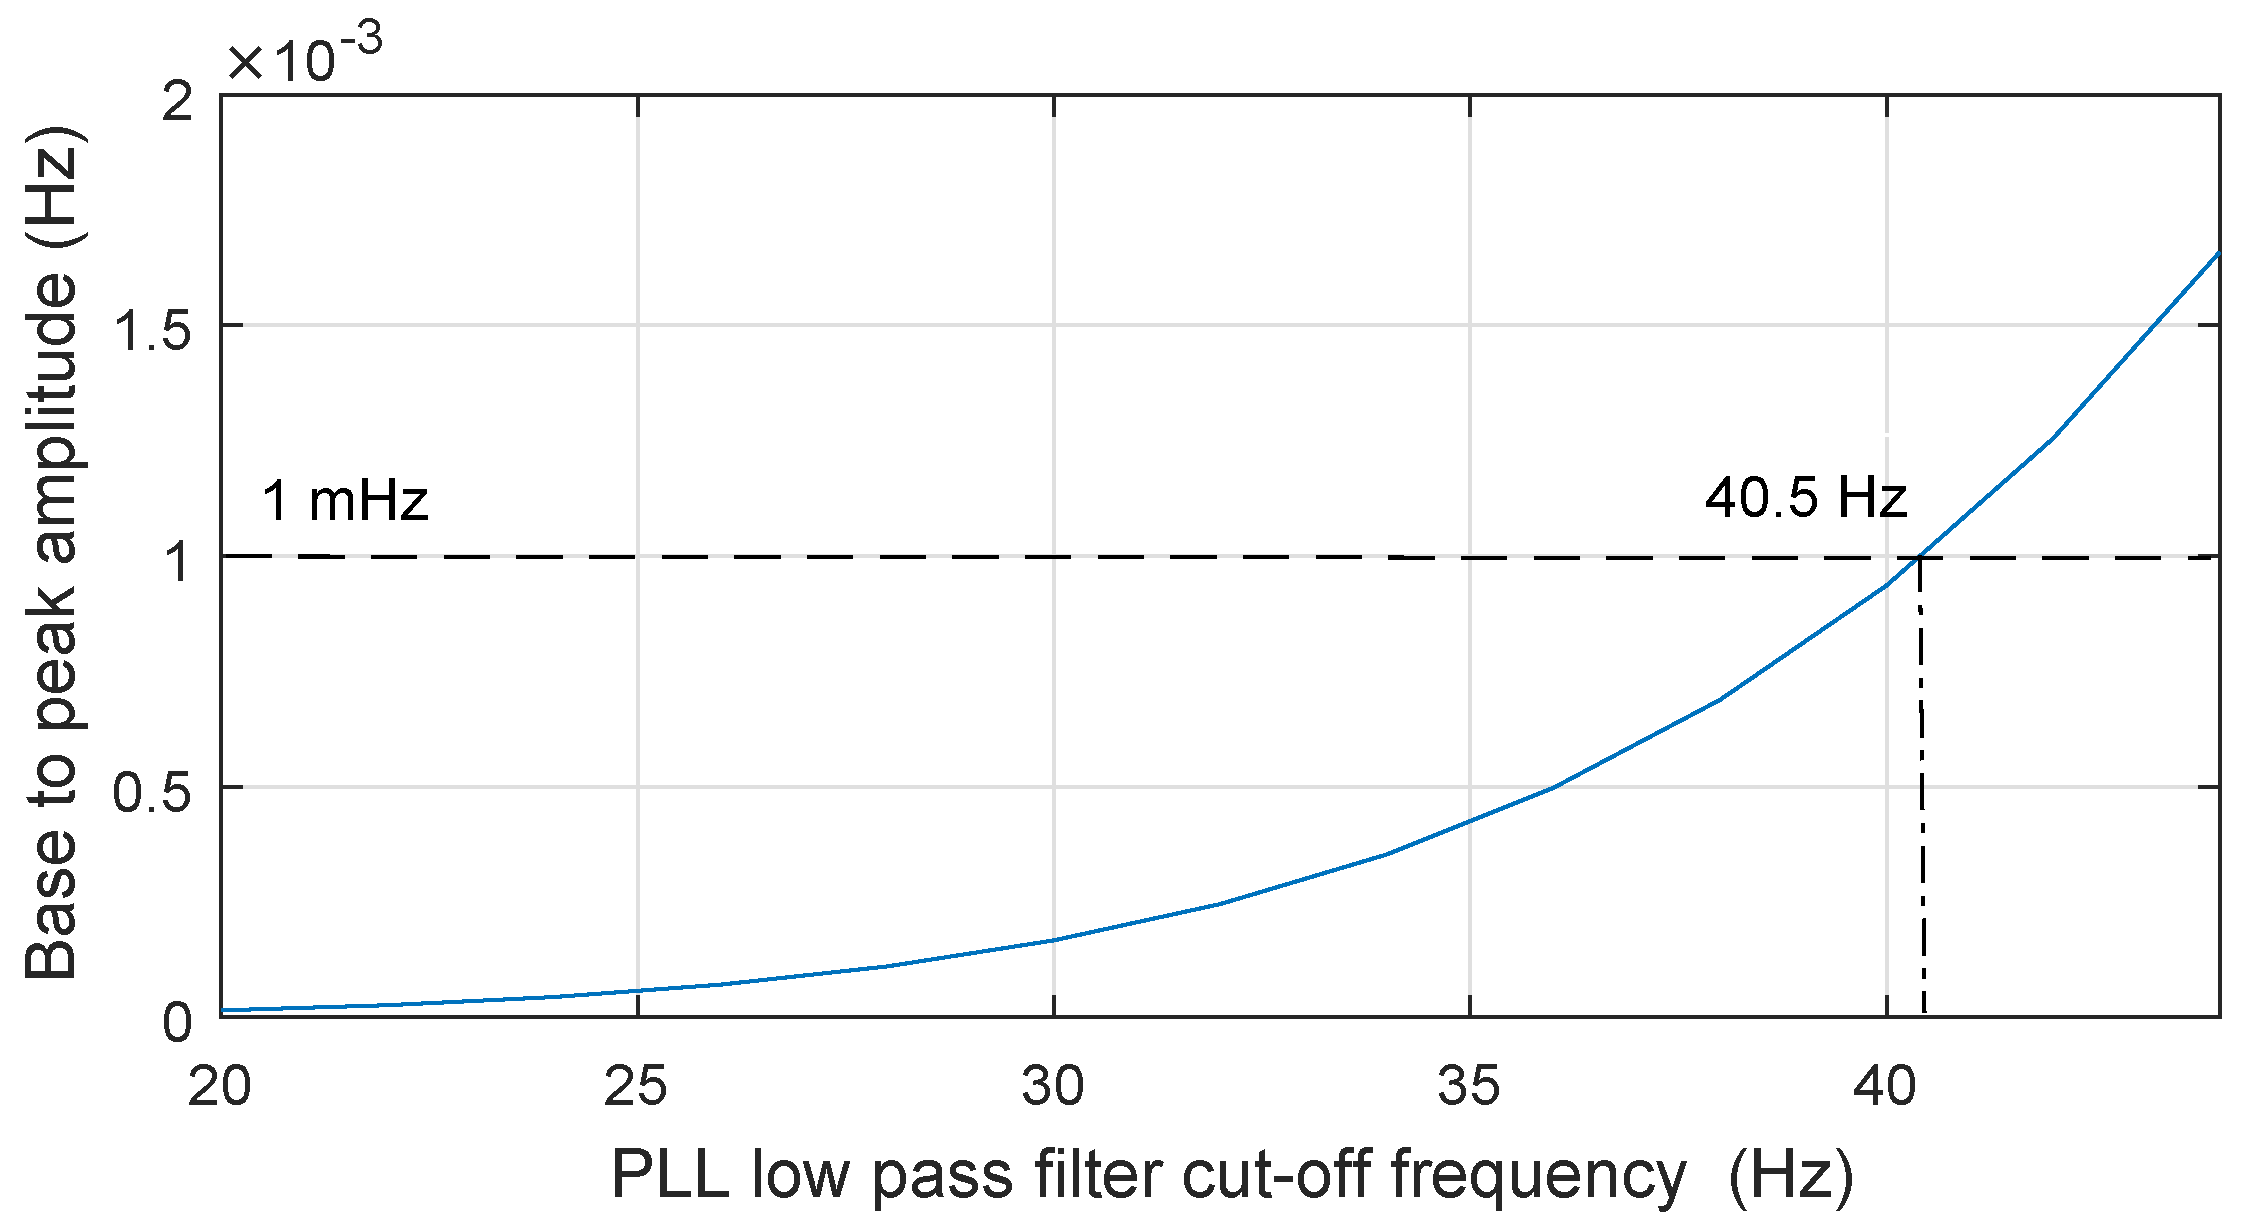
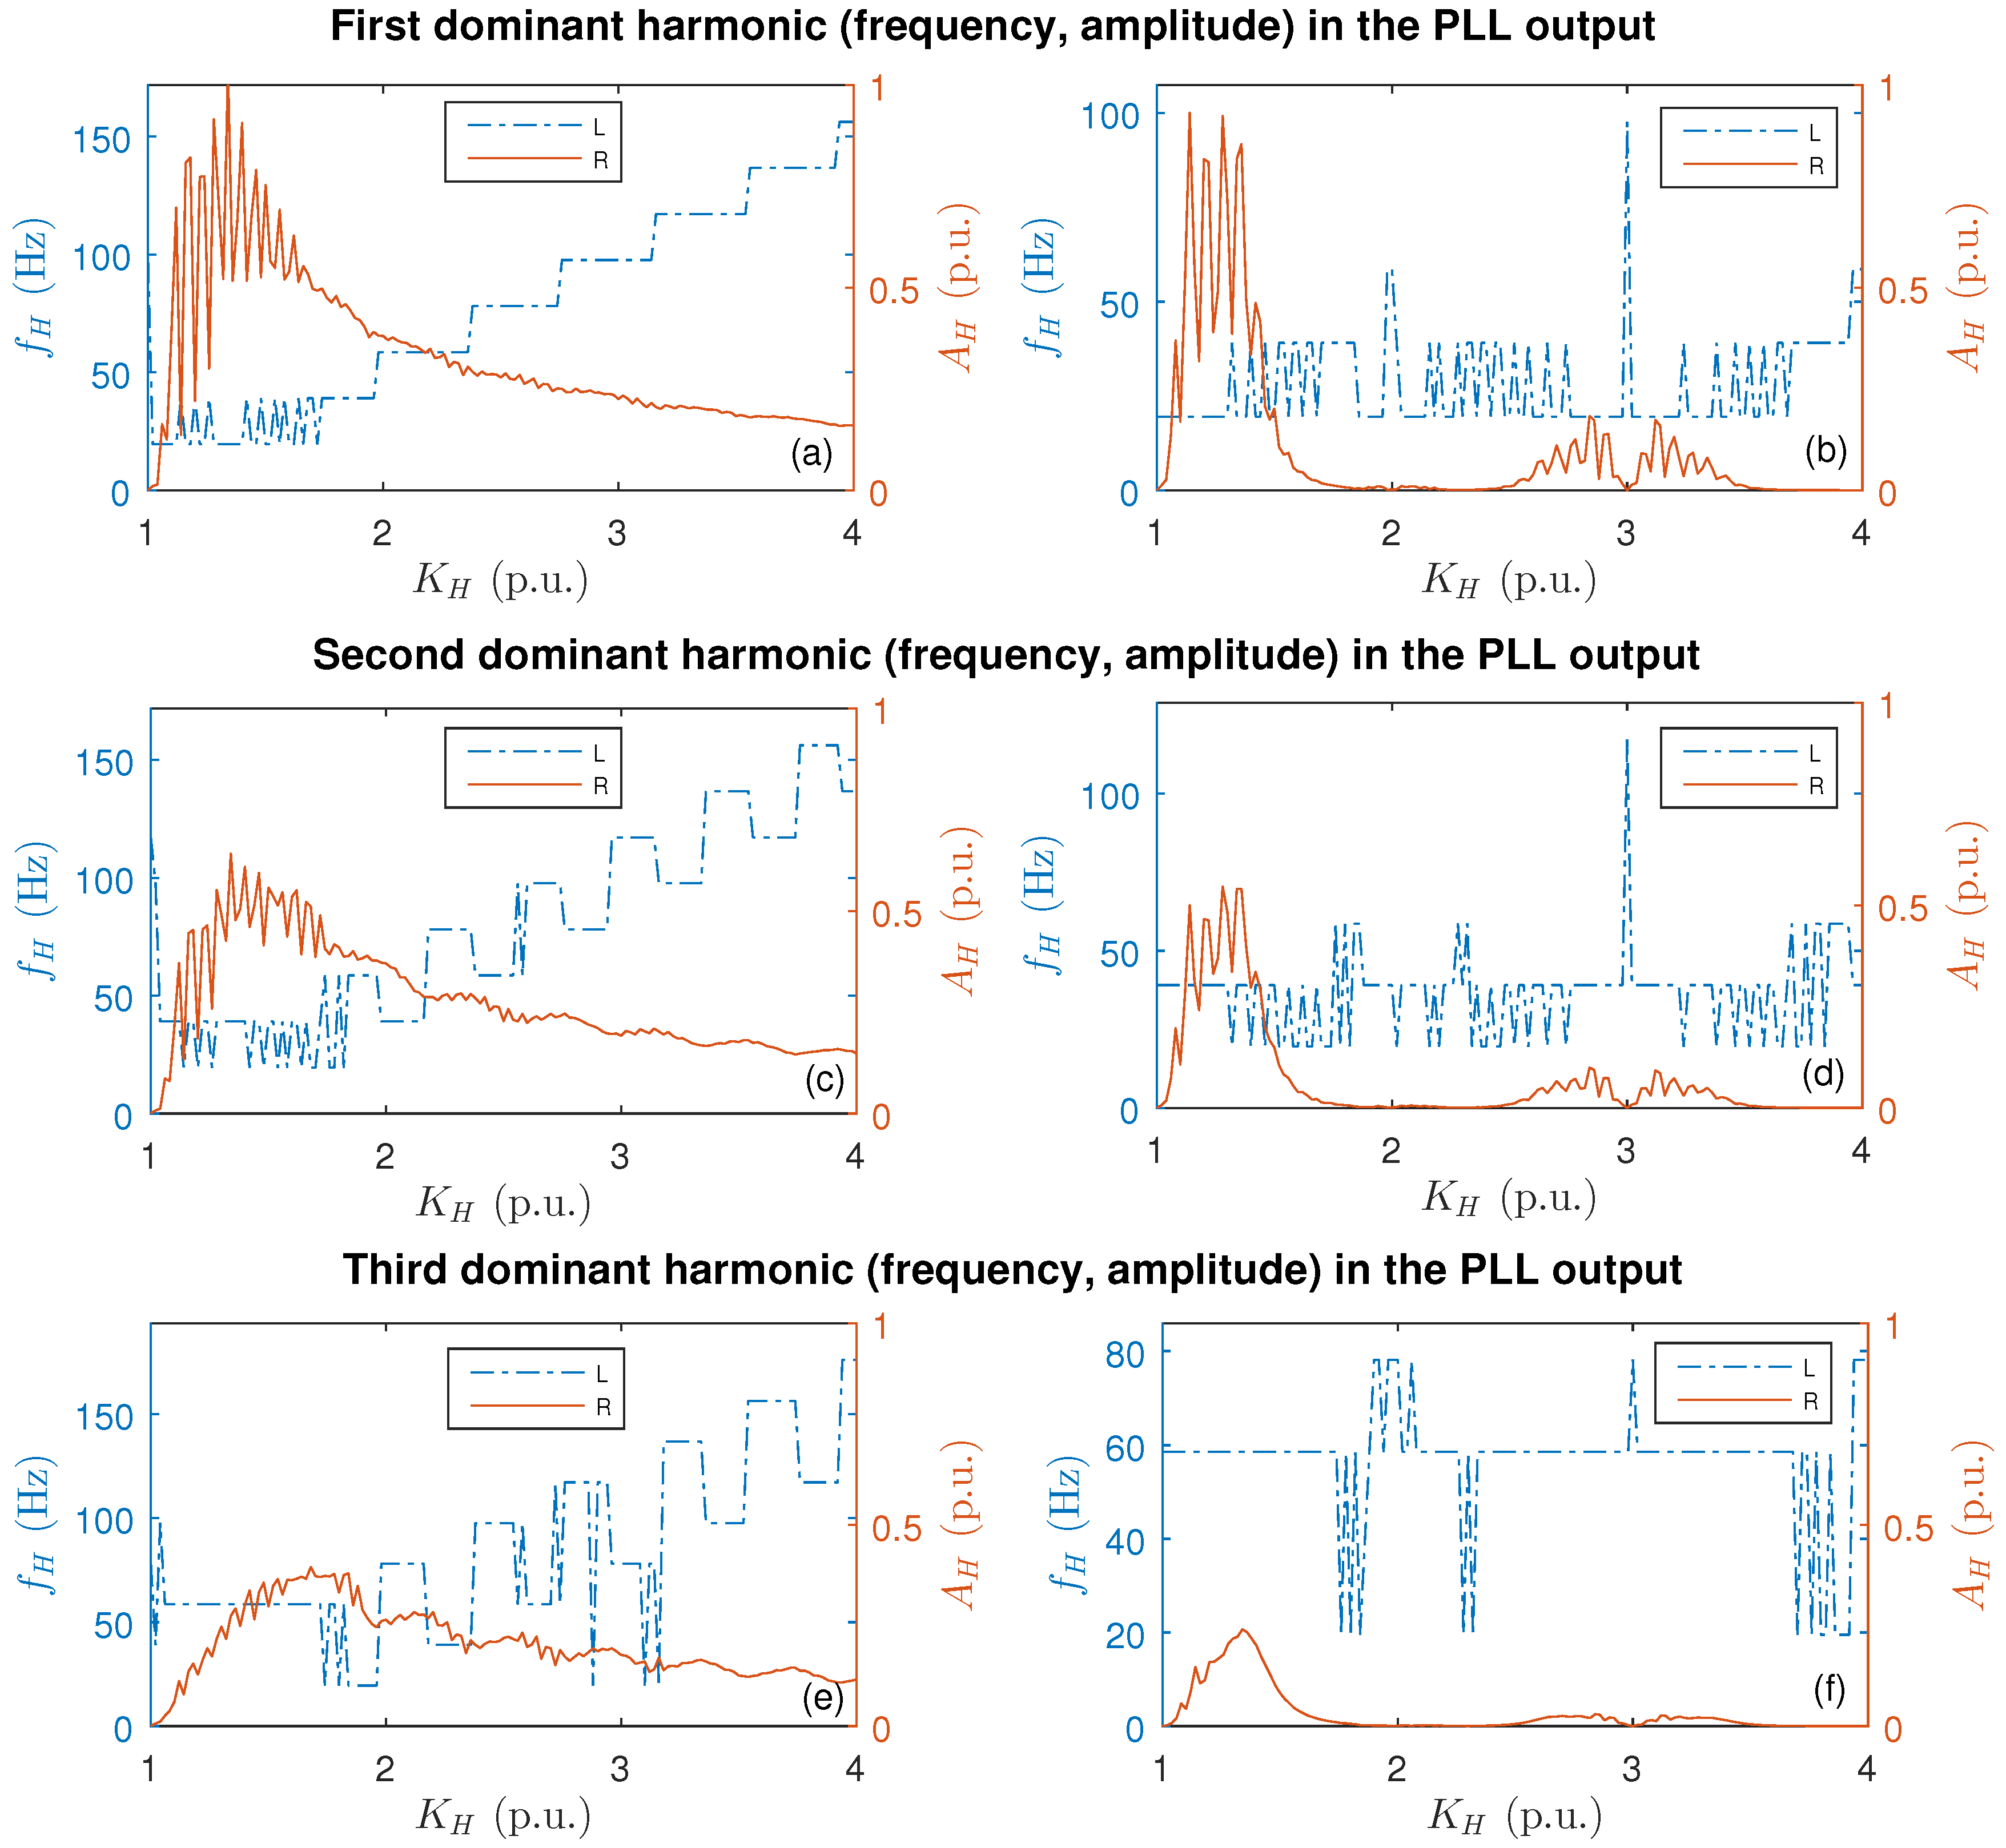
2.2. Impact of the PLL Cut-Off Frequency on the Robustness against Harmonics

In this section, harmonics are added to the time domain voltage signal and PLL is used to track the frequency, moreover the influence of f c is explored. In order to investigate the impact of disturbances, a range of harmonics are added to the frequency signal. The standard EN 50160 provides guidance on the harmonic levels that are not expected to be exceeded (basically 95% percentiles) in Europe [23]. The harmonic order and levels are given in Table 1.
The instantaneous value of the voltage signal for the subsequent examination is generated for the given target frequency signal. The phase voltage signal is calculated for a given frequency and harmonics level as,
u p 1 ( t ) = s i n T s 2 π f + A H i s i n T s K H i 2 π f ,
where, T s is the sampling time while K H i and A H i are the per-unit harmonic order and amplitude of respectively. Time domain signal is shifted by 120 and 240 degrees to make three phase voltage signals.
The f c of PLL impacts the delay in frequency measurements and hence the achievable accuracy. It should be sufficiently low to suppress the harmonics in the acceptable range (minimal measurement accuracy) and should be as high as possible in order to decrease the delay in the frequency measurement process. This leads to a parametric study in which f c is sequentially increased, while considering the harmonics. The harmonics according to the levels from Table 1 are added to the time domain voltage signal collectively. Subsequently, the PLL is used to measure the frequency from this time domain signal. Figure 2 shows the measurement error (base to peak amplitude of frequency signal) after the frequency step event. The measurement error increases as f c is increased. It can be observed that a value of 40.5 Hz leads to the violation of the maximum error limit (±1 mHz). Based on the result, the maximum permissible value f c is taken as 40 Hz for the stability studies.
In order to study the impact of PLL input signal harmonics on its output and how filter can suppress them, a frequency sweep of harmonic content is performed. The frequency of harmonic signal is varied between 50 and 200 Hz. During this process, the amplitude of harmonic is set to 8% corresponding to maximum value mentioned in Table 1 and in par with other standards. The procedure for harmonic sweep and subsequent analysis of frequency measurement using PLL is outlined in Algorithm 1. This analysis is performed with the step change in the input frequency and the output frequency is analyzed as the response reaches a steady-state. Short time Fourier transform (STFT) of the output frequency signal is used to study its harmonics contents. The analysis yields to the results shown in Figure 3. It can be observed that harmonic content in range of 60 to 120 Hz impacts the PLL frequency measurement most significantly, while the low-pass filter effectively suppresses the harmonics content in the PLL output if the input signal harmonic order is more than 2.
Algorithm 1: Algorithm for PLL performance analysis considering harmonics.
Energies 11 02372 i001

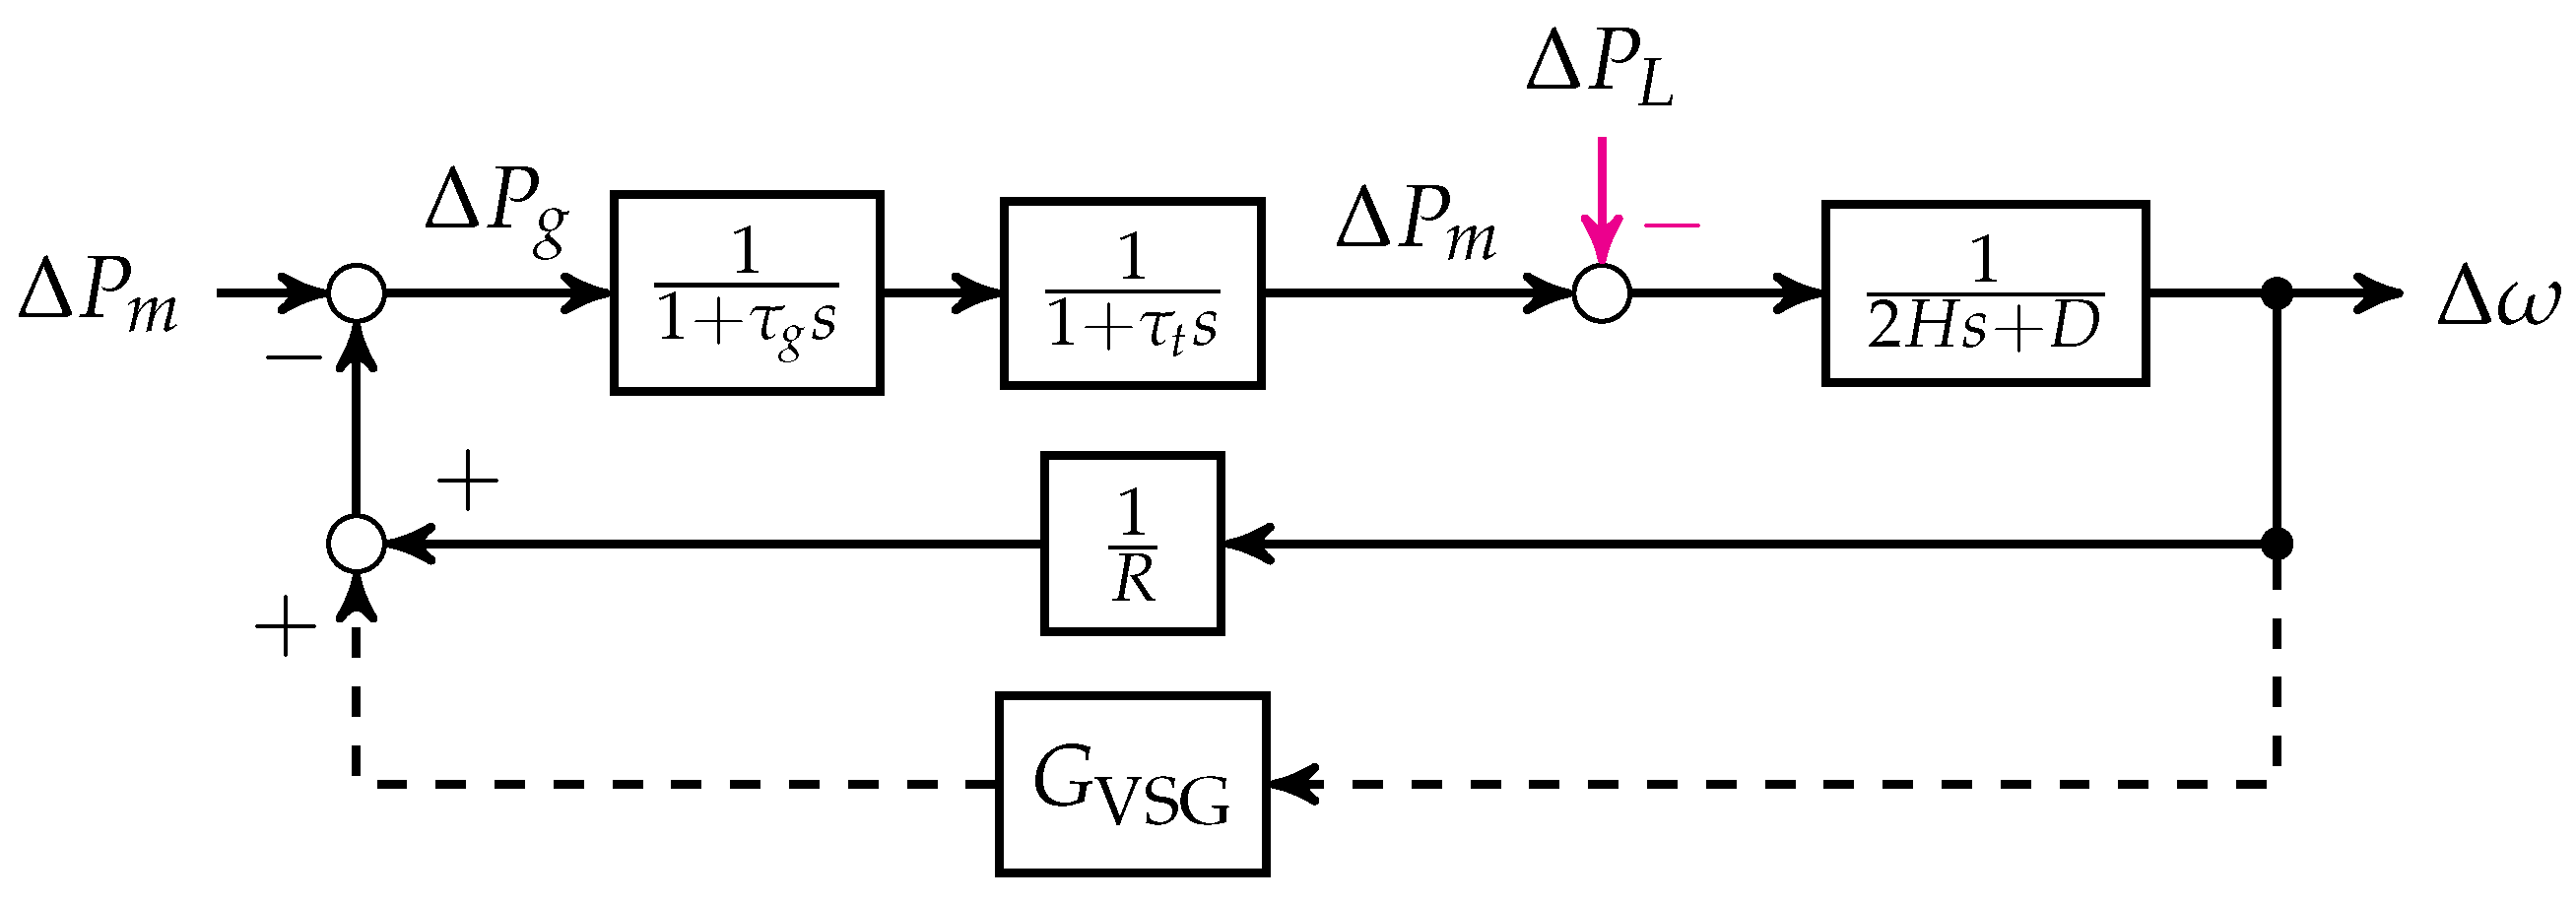
2.3. Virtual Inertia from VSG and Small Signal Stability Model

In order to understand the concept of inertia, it is fundamental to discuss the determining factors for frequency stability. The frequency is established by the generator with primary energy source rotating the turbine. The dynamics of frequency are governed by the classical swing equation [30],
M d ω d t = P m P e D g ω ,
where, P m and P e are the mechanical input and electrical output power of the generator, D g is the generator damping torque coefficient due to windage and friction, ω is the frequency and M is the angular momentum. The angular momentum of the rotor ( M = J ω m ) is related to the inertia constant (H) as,
M = 2 H S n ω .
The inverters that aim to generate similar behavior as synchronous machines emulates the inertia analogous to angular momentum of the generator rotor. This is achieved by various inertial control topologies, a summary of which can be referred to Table 1 of [31]. Among them, the most straightforward approach is the frequency-power response based inertia emulation method. The inverters employing such a method are generally referred to as VSGs. In this method, the VSG emulates the behavior of a synchronous generator by releasing/absorbing energy while responding to the magnitude and dynamics of the frequency given as,
Δ P VSG = K D Δ ω + K I d Δ ω d t .
One can observe a striking similarity between Equation (4) and (2). Here, P 0 VSG denotes the primary output power of VSG, K D acts like frequency droop and emulates the damping of synchronous machine, while K I is the inertia emulating gain. The VSG measures frequency deviation ( Δ ω ) and acts as a dispatch-able current source regulating its output energy. The aggregate small signal stability model of virtual inertia emulating VSG integrated in the power grid requires modeling of grid dynamics, frequency dependent loads and VSG. The following sub-sections formulate the aggregate analytical model of the frequency response of the system.

2.3.1. Frequency Dependent Load Model

A portion of the system load consists of rotating machines whose energy consumption is influenced by the input power frequency. Such that, if the frequency decreases due to an increase of load in the system, it reduces the load torque and thus their power consumption. As a result the load is reduced by the factor Δ P f . This counteracts naturally the load increase and is therefore referred in literature as self-regulating effect of loads. It is a common way to model frequency dependency of loads with a reference parameter D. It is expressed as ratio of normalized change in load to the frequency,
Δ P e = Δ P L + Δ P f = Δ P L + D Δ ω .
The swing equation of synchronous generator given by Equation (2) for a small perturbation while neglecting the machine damping torque is given as,
M d Δ ω d t = Δ P m Δ P e ,
On substituting the inertia constant ( H ) from Equation (3) in (5) and converting to per-unit values of ω , P m and P e , the swing equation transforms to,
2 H d Δ ω d t = Δ P m Δ P L D Δ ω .

2.3.2. Frequency Domain Model of Power Grid

If the system is considered in the steady-state condition and change in the reference mechanical power ( Δ P m ) is zero, then a change in the frequency ( Δ ω ) can be directly related to a change in load ( Δ P L ) as shown in Figure 4. The frequency domain model of the power grid from Equation (7) is given as,
G sys = 1 2 H s + D = Δ ω Δ P L .
The system is influenced by the generator whose droop gain ( R ) is given as,
R = Δ ω / ω Δ P / P .
The primary load frequency control (LFC) loop of the generator is modeled as,
H LFC = 1 R ( 1 + τ g s ) ( 1 + τ t s ) .
Here, τ g and τ t are the governor and turbine time constants. LFC changes the active power output of the generator with respect to the change in measured frequency, where power output of a generator is modeled by the time constants influencing the output of governor droop. The overall grid transfer function without G VSG is given as,
G grid = Δ ω Δ P L = G sys 1 + H LFC G sys .

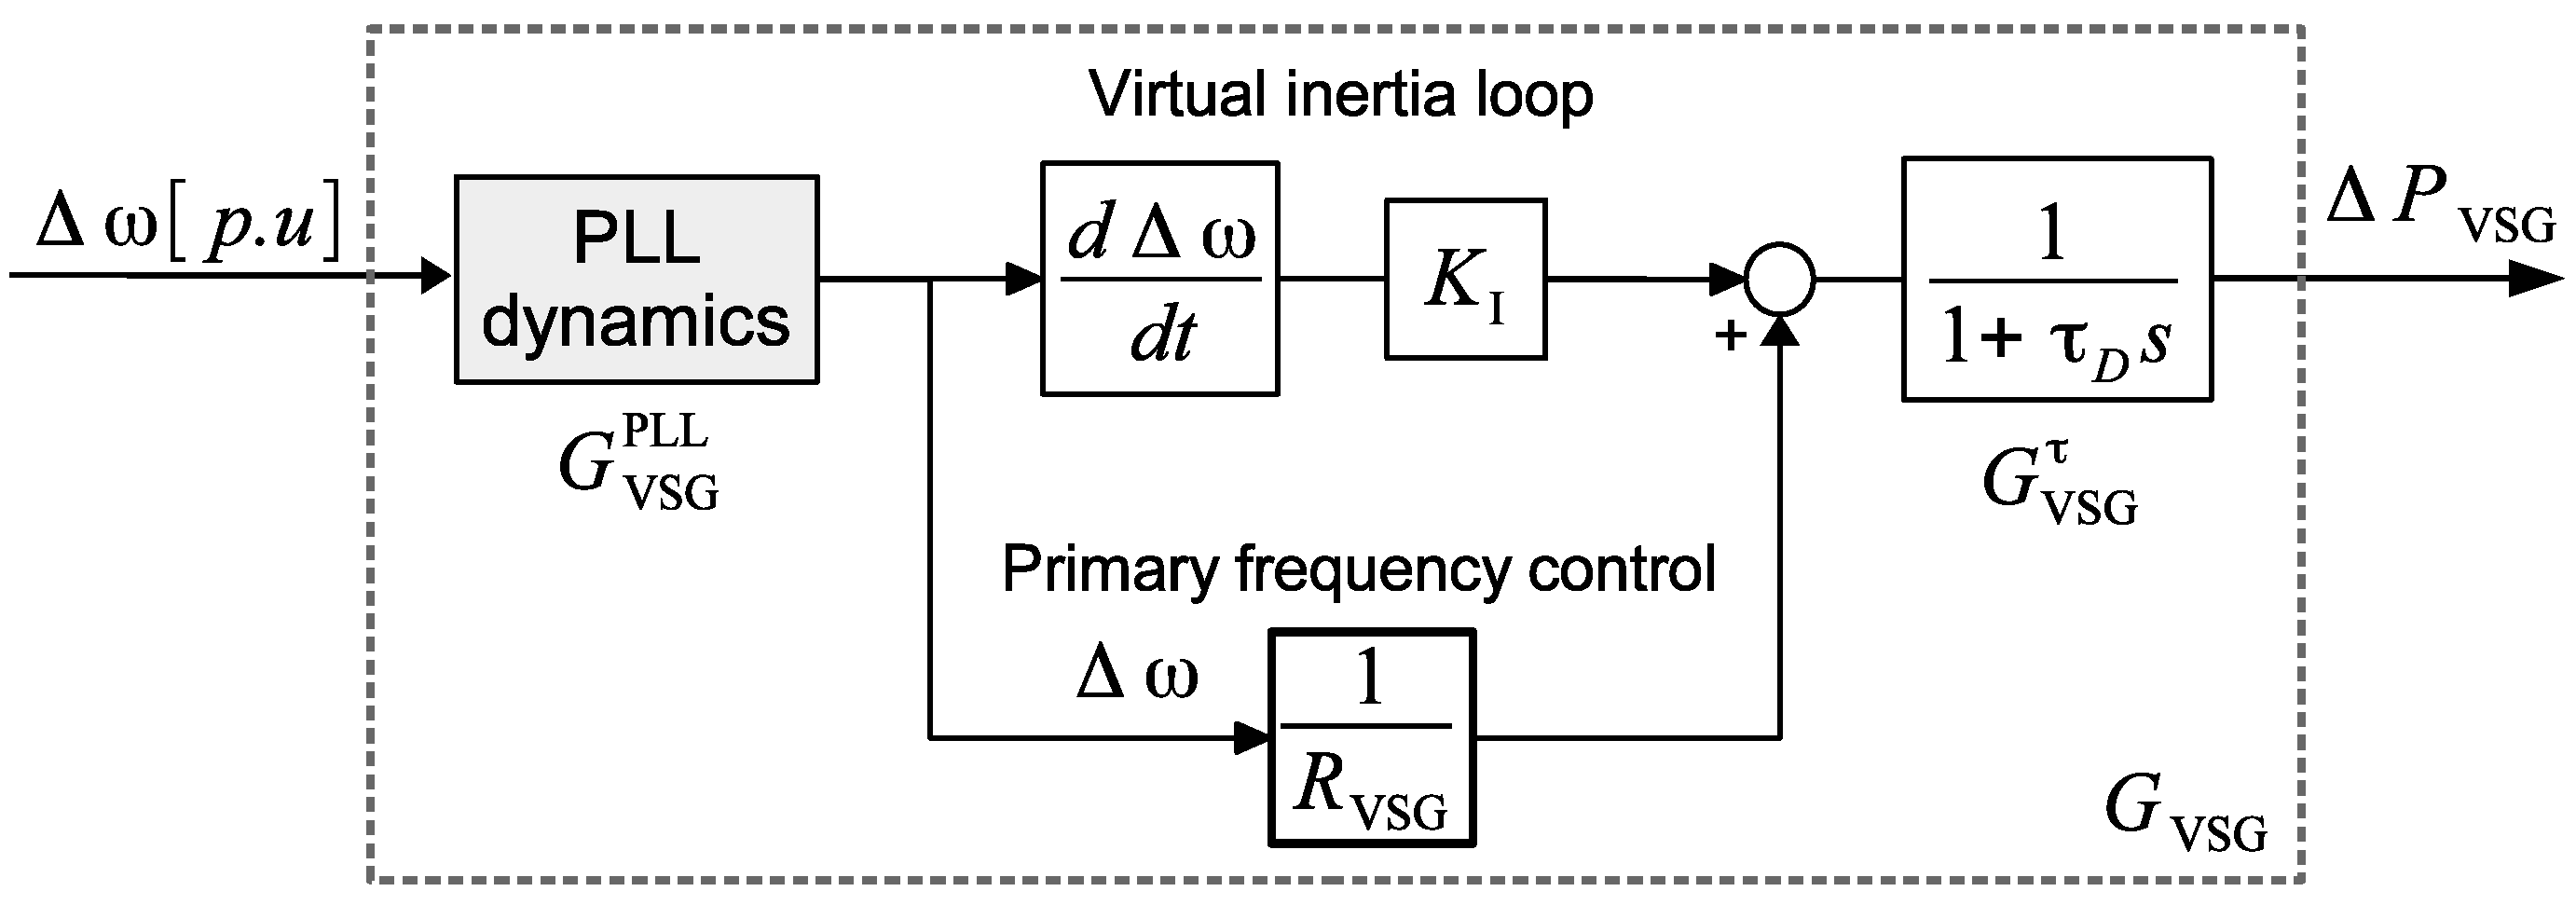
2.3.3. Frequency Domain Model of Virtual Inertia and Primary Response from VSG

The frequency domain model for the VSG is shown in Figure 5 where frequency measurement is carried out using PLL. Typically a rate limiter and saturation block are added to the output of frequency domain block. However, they are neglected while deriving the aggregate frequency domain model in order to assess the effective limit of virtual inertia gain. The evaluated value of K I is termed as maximum effective virtual inertia gain K I ¯ .
The small signal model for PLL is defined by phase tracking dynamics and is typically expressed by a second order transfer function [24],
G PI PLL = K p PLL s + K i PLL s 2 + K p PLL s + K i PLL e ρ s .
Here, the K p PLL and K i PLL represents the proportional and integral gains of PLL, while ρ indicates an exponential delay term associated with the signal propagation delay.
The low pass filter associated with the PLL is taken as a sixth order low-pass Butterworth filter as discussed in Section 2.1 to remove the disturbances caused by harmonics. The control variable for the filter is its cut-off frequency ( ω c = 2 π f c ) and transfer function is given as,
G f = ω c 6 ω c 2 + 0.5176 ω c s + s 2 ω c 2 + 1.4142 ω c s + s 2 ω c 2 + 1.9319 ω c s + s 2 .
The dynamic response of PLL involves the measurement delay due to essential preprocessing of frequency identification and filtering, therefore these delays are to be considered properly for the small signal stability analysis. For this purpose, a Padé equivalent [32] has been used that combines both the signal propagation delay of PLL ( ρ ) and the low pass filter associated delay. In the Padé model, the time delay is represented by the transfer function of the nth order, i.e.,
G Pad n = 1 k 1 s + k 2 s 2 ± k n s n 1 + k 1 s + k 2 s 2 ± k n s n , For n = 2 , G Pad 2 = 12 6 ( T s ) + ( T s ) 2 12 + 6 ( T s ) + ( T s ) 2 .
The overall transfer function of PLL is therefore given as,
G VSG PLL = G PI PLL G f G Pad 2 .
Once the frequency is measured, it is fed to the LFC loop given as,
G VSG LFC = 1 R VSG + K I s .
The VSG time delay can be modeled as a cumulative time constant as,
G VSG τ = 1 1 + τ D s .
This leads to the overall transfer function of VSG,
G VSG = G VSG PLL G VSG LFC G VSG τ .
The VSG transfer function ( G VSG ) and of the grid ( G grid ) are combined to formulate the aggregate transfer function,
G AGG = G grid 1 + G VSG G grid .

3. Use Cases and Results

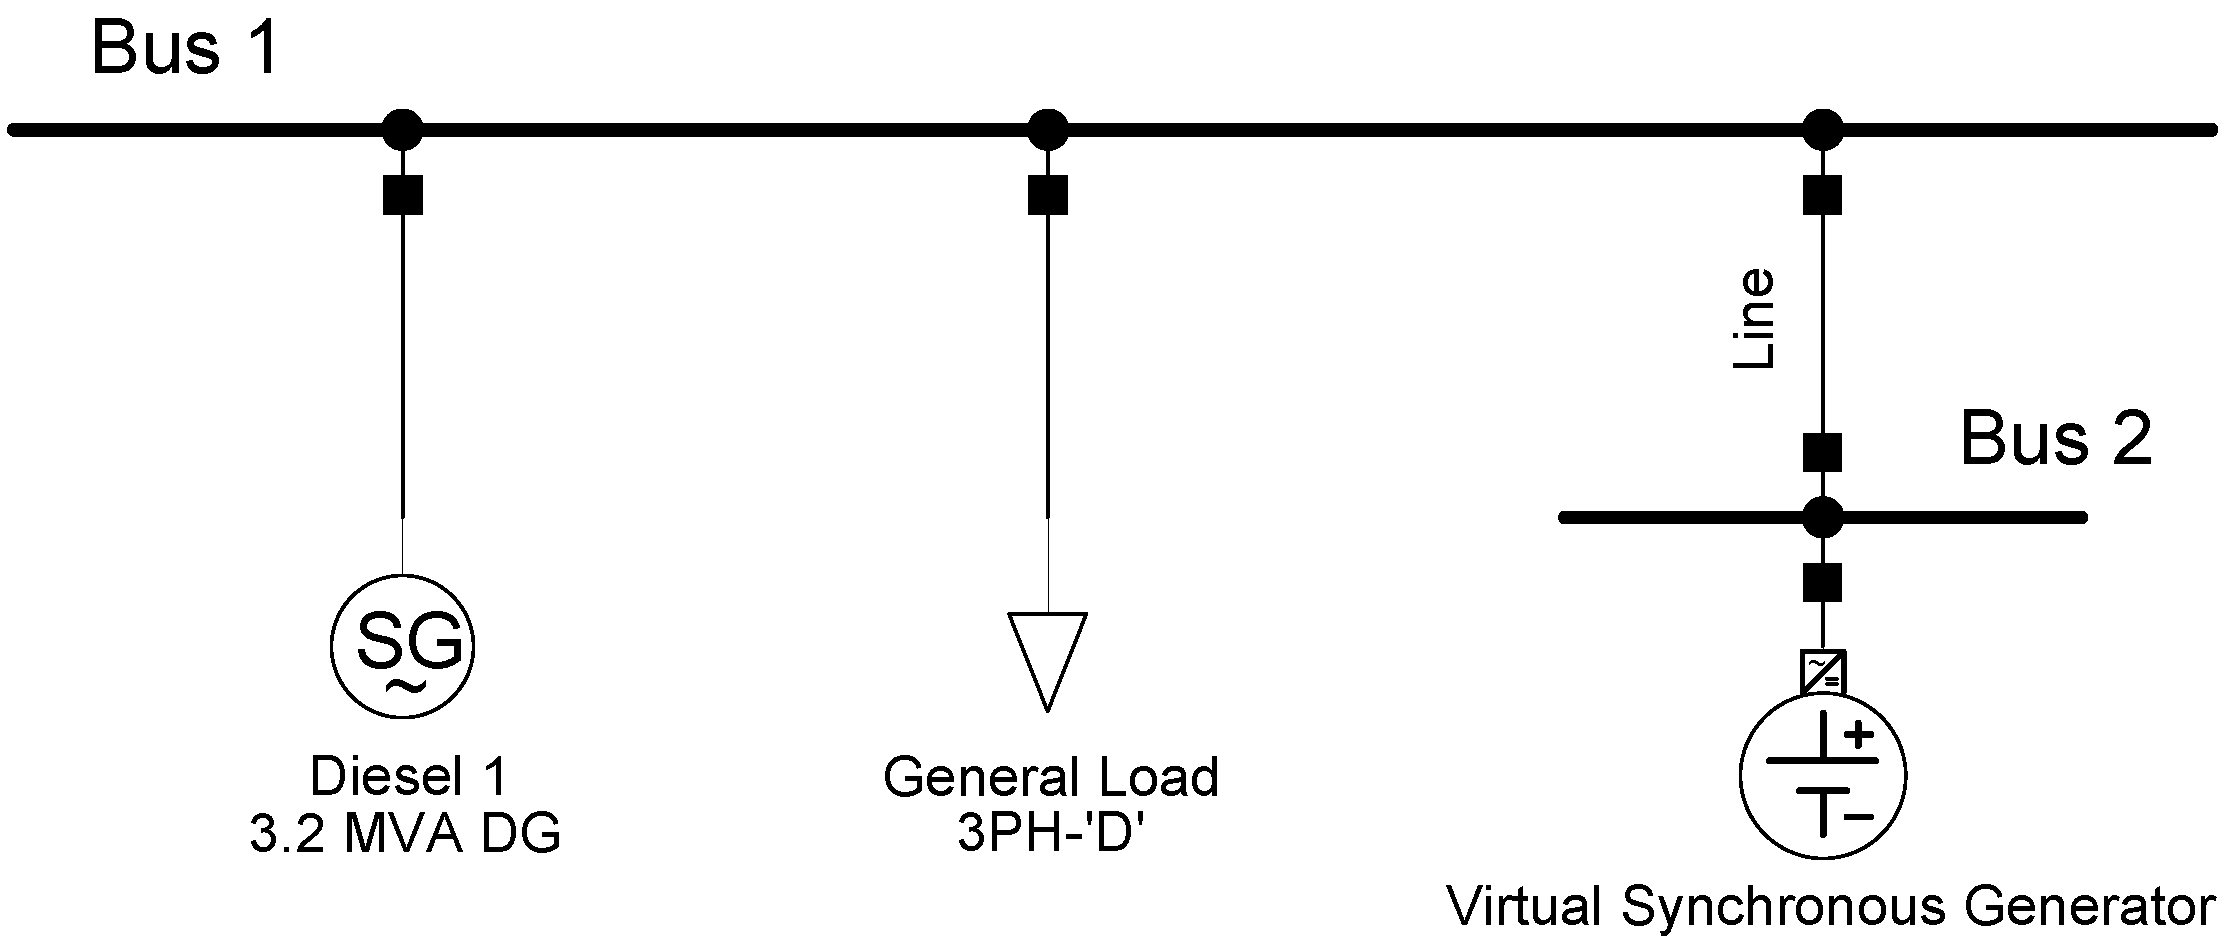
3.1. Single Machine Single Inverter Bus System

The single machine single inverter bus system (SMSIB) consists of a VSG with virtual inertia provision, generator and a load. The line diagram is shown in Figure 6 and the system parameters are given in Table 2. The frequency stability is evaluated for the step increase in the load from the initial value of 1 MW to 1.2 MW. The small signal stability analysis are performed for the Δ P ref mentioned in Table 2, however the stability results obtained are based on the system pole locations and are independent of Δ P ref .
The frequency domain model of the network in reference to Equation (11) is given as,
G grid = 1 H LFC + d + 2 h s where , H LFC = 1 r 1 + s τ t 1 + s τ g .
The actual and per unit quantities are represented by the capital and small letters, respectively. The per-unit quantities are calculated as,
r = R P base P gen nom , h = H P gen nom P base , d = D P L final P base , P L final = P load + Δ P ref .
The VSG transfer function is evaluated according to Equation (18) where the parameters K p PLL and K i PLL are set to 10. The transfer function of the LFC loop is given as,
G VSG LFC = 1 r VSG + K I s , where , r VSG = R P base P VSG nom .
A frequency response analysis is performed on the aggregate frequency domain model of the test case. During parametric study, the f c is varied between 20 to 40 Hz and K I is increased from 5 to 40. Meanwhile, the most critical pole is identified as the one having minimum damping ratio. The minimum damping ratio of 0.05 is required by many utilities as criteria for stability [33,34]; this value has been therefore taken as target. During the process, it is assumed that the VSG internal time constant is taken as 0.02 s. The results of this study are shown in Figure 7, where, for the cut-off frequency of 40 Hz the virtual inertia gain can be increased to 36 s (without violating the stability limit) from the value of 27 s calculated for f c of 20 Hz. The higher value of the upper limit of virtual inertia corresponds to more inertia capability that can be derived from the VSG. Alternatively, if the virtual inertia gain is set to 27 and 36, one can find the upper limit of f c , the result of which is shown in Figure 8. Here the objective is to find the minimum value of the cut-off frequency satisfying the 0.05 damping criterion, the lower f c is, the better harmonic rejection becomes. The minimum level of f c is identified as 20 and 40 Hz respectively, verifying the results from Figure 7.
In the next step, we observe the influence of generator nominal power ( P gen nom ) , VSG nominal power ( P VSG nom ) and f c on the maximum effective virtual inertia gain of VSG for the reference event. If the generator nominal power is increased, it is anticipated that more virtual inertia gain could be used for a given cut-off frequency of PLL as the generator is able to stabilize the system due to increased inertia impact (H is expressed normalized to S n ). Similarly, greater the nominal power of virtual inertia source implies lesser inertia gain limit as shown in the Figure 9.
Figure 10a shows the influence of f c on the virtual inertia gain limit of the VSG. From this comparison, we observe that K I can be increased by 33% if we increase f c from 20 to 40 Hz, due to reduction of delay. Further increase in the upper limit of K I is possible by increasing f c but as discussed in Section 2.1, it cannot be increased above 40 Hz in order to meet the harmonics rejection requirements. The maximum inertia contribution from VSG increases as the generator nominal power is increased as shown in Figure 10b. However, this trend saturates when the VSG capacity is less than 10% of generation capacity.

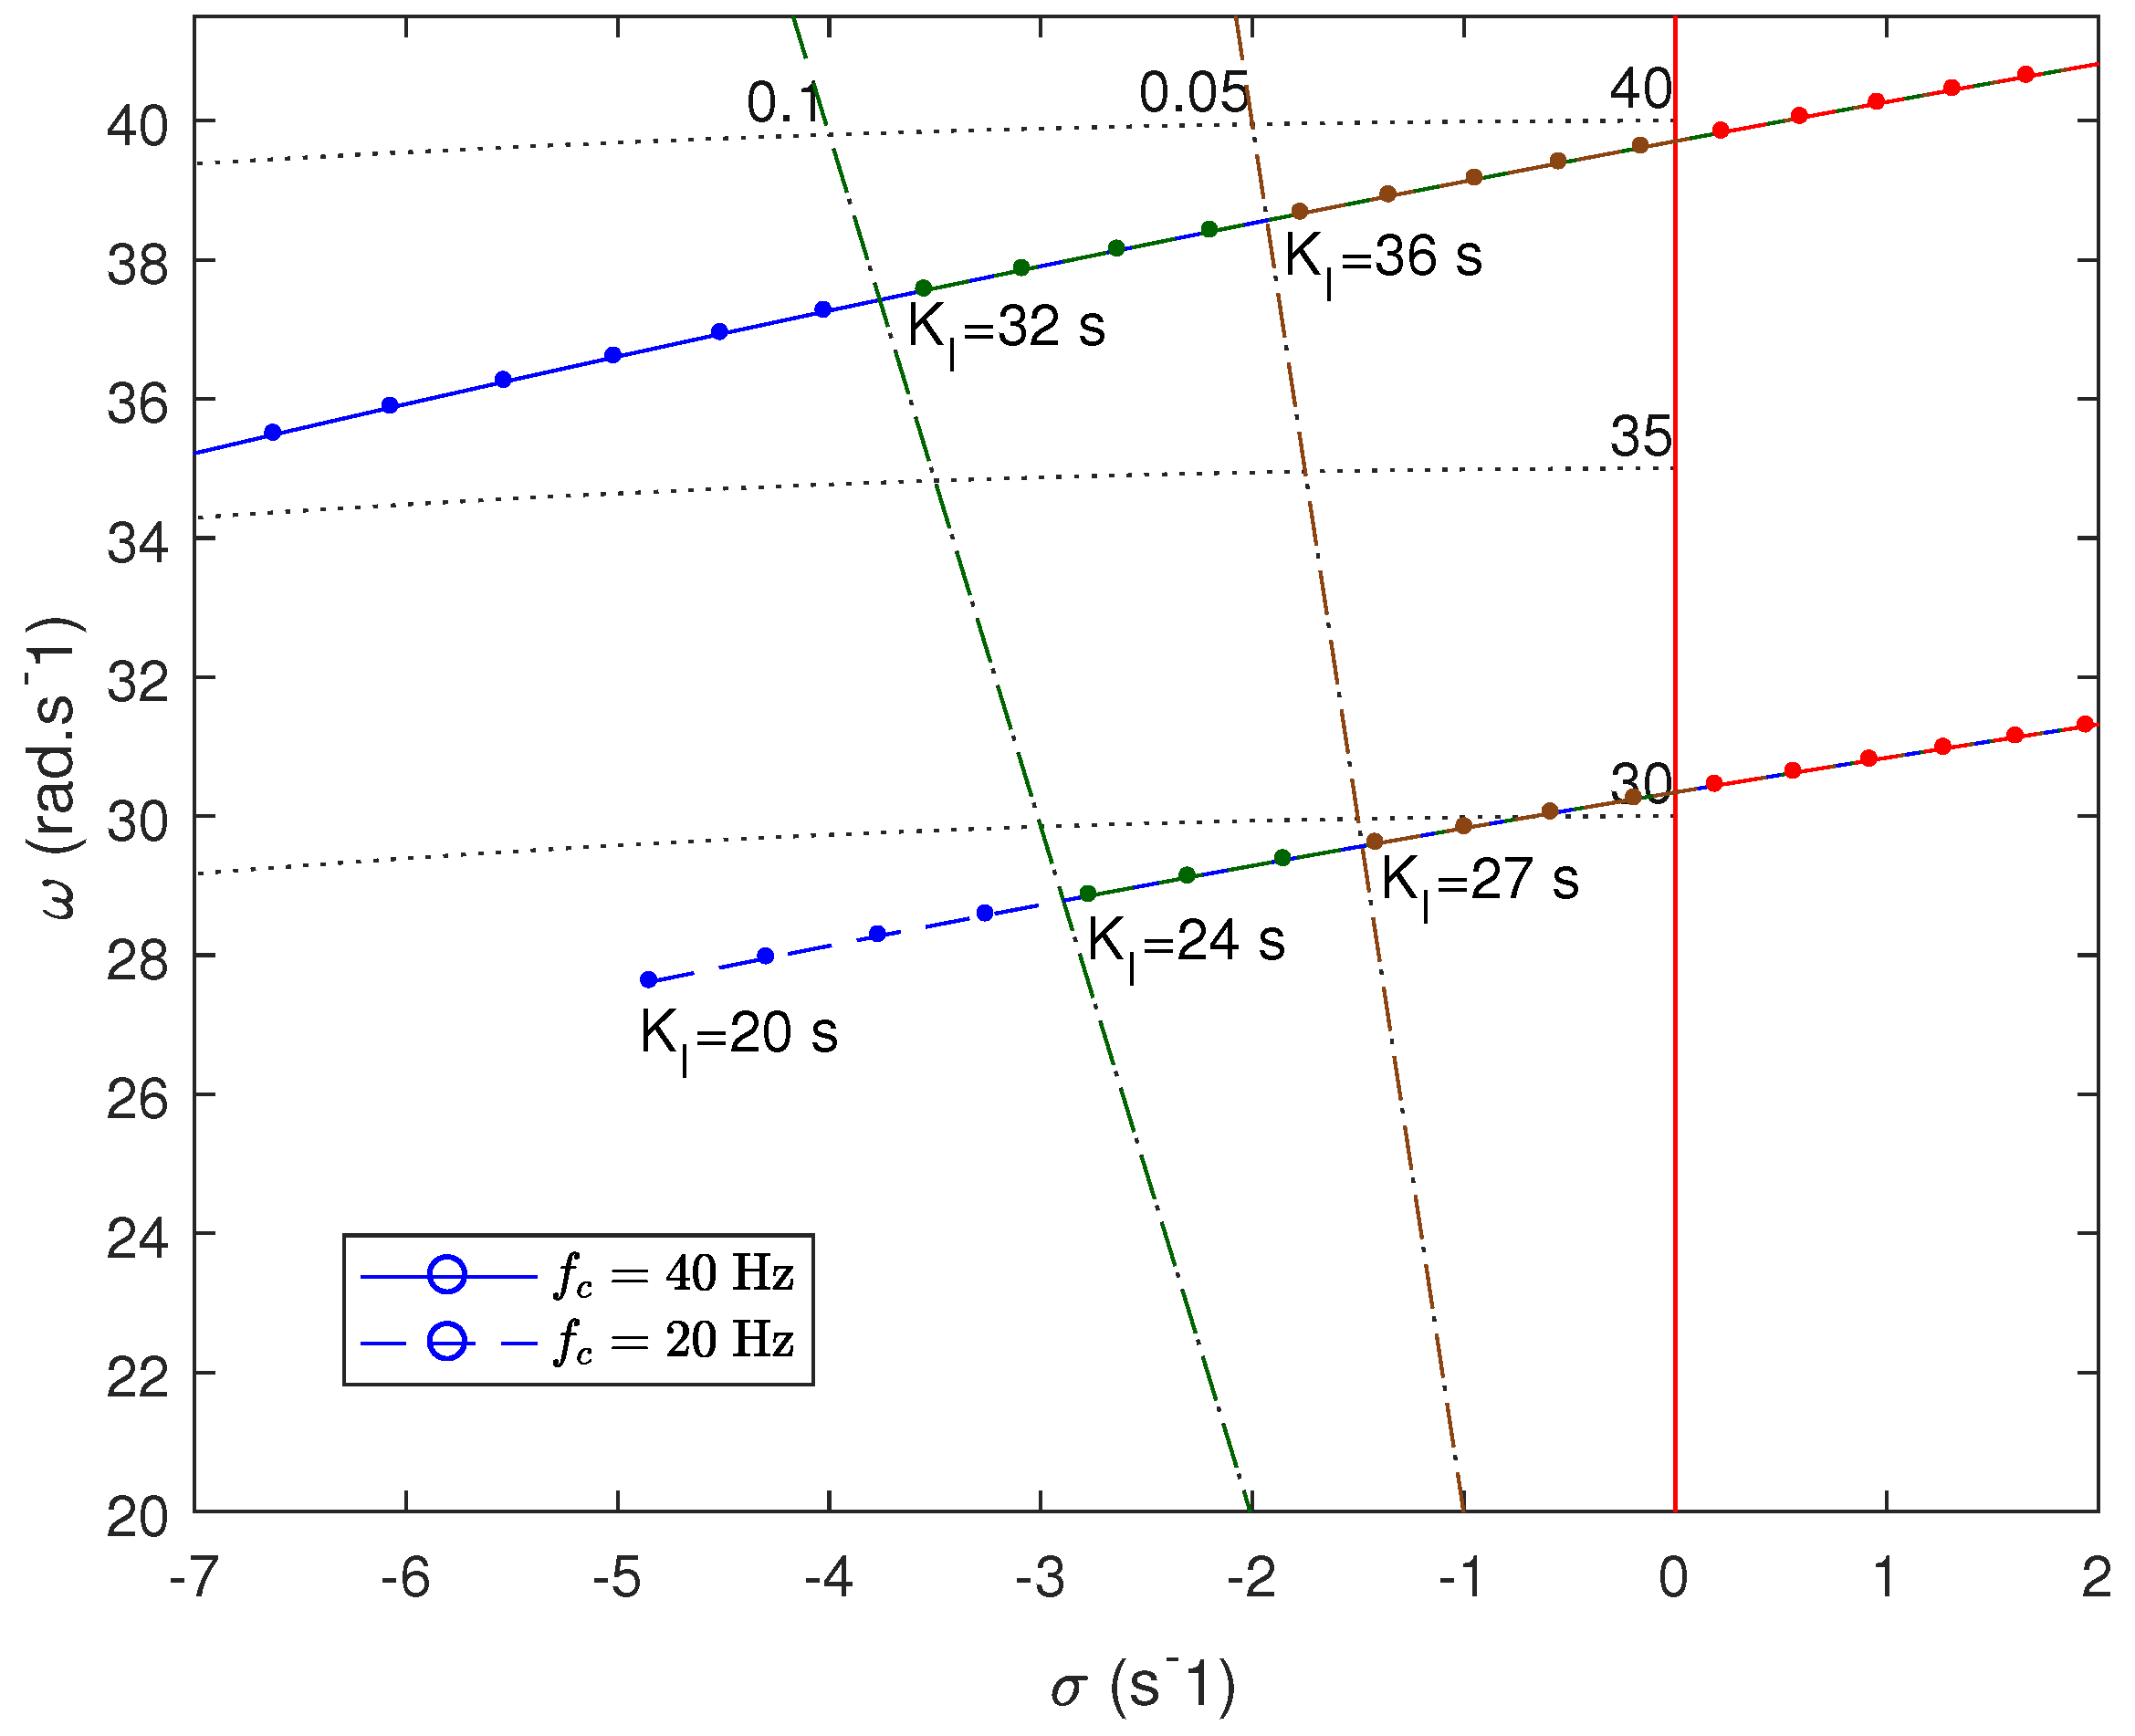
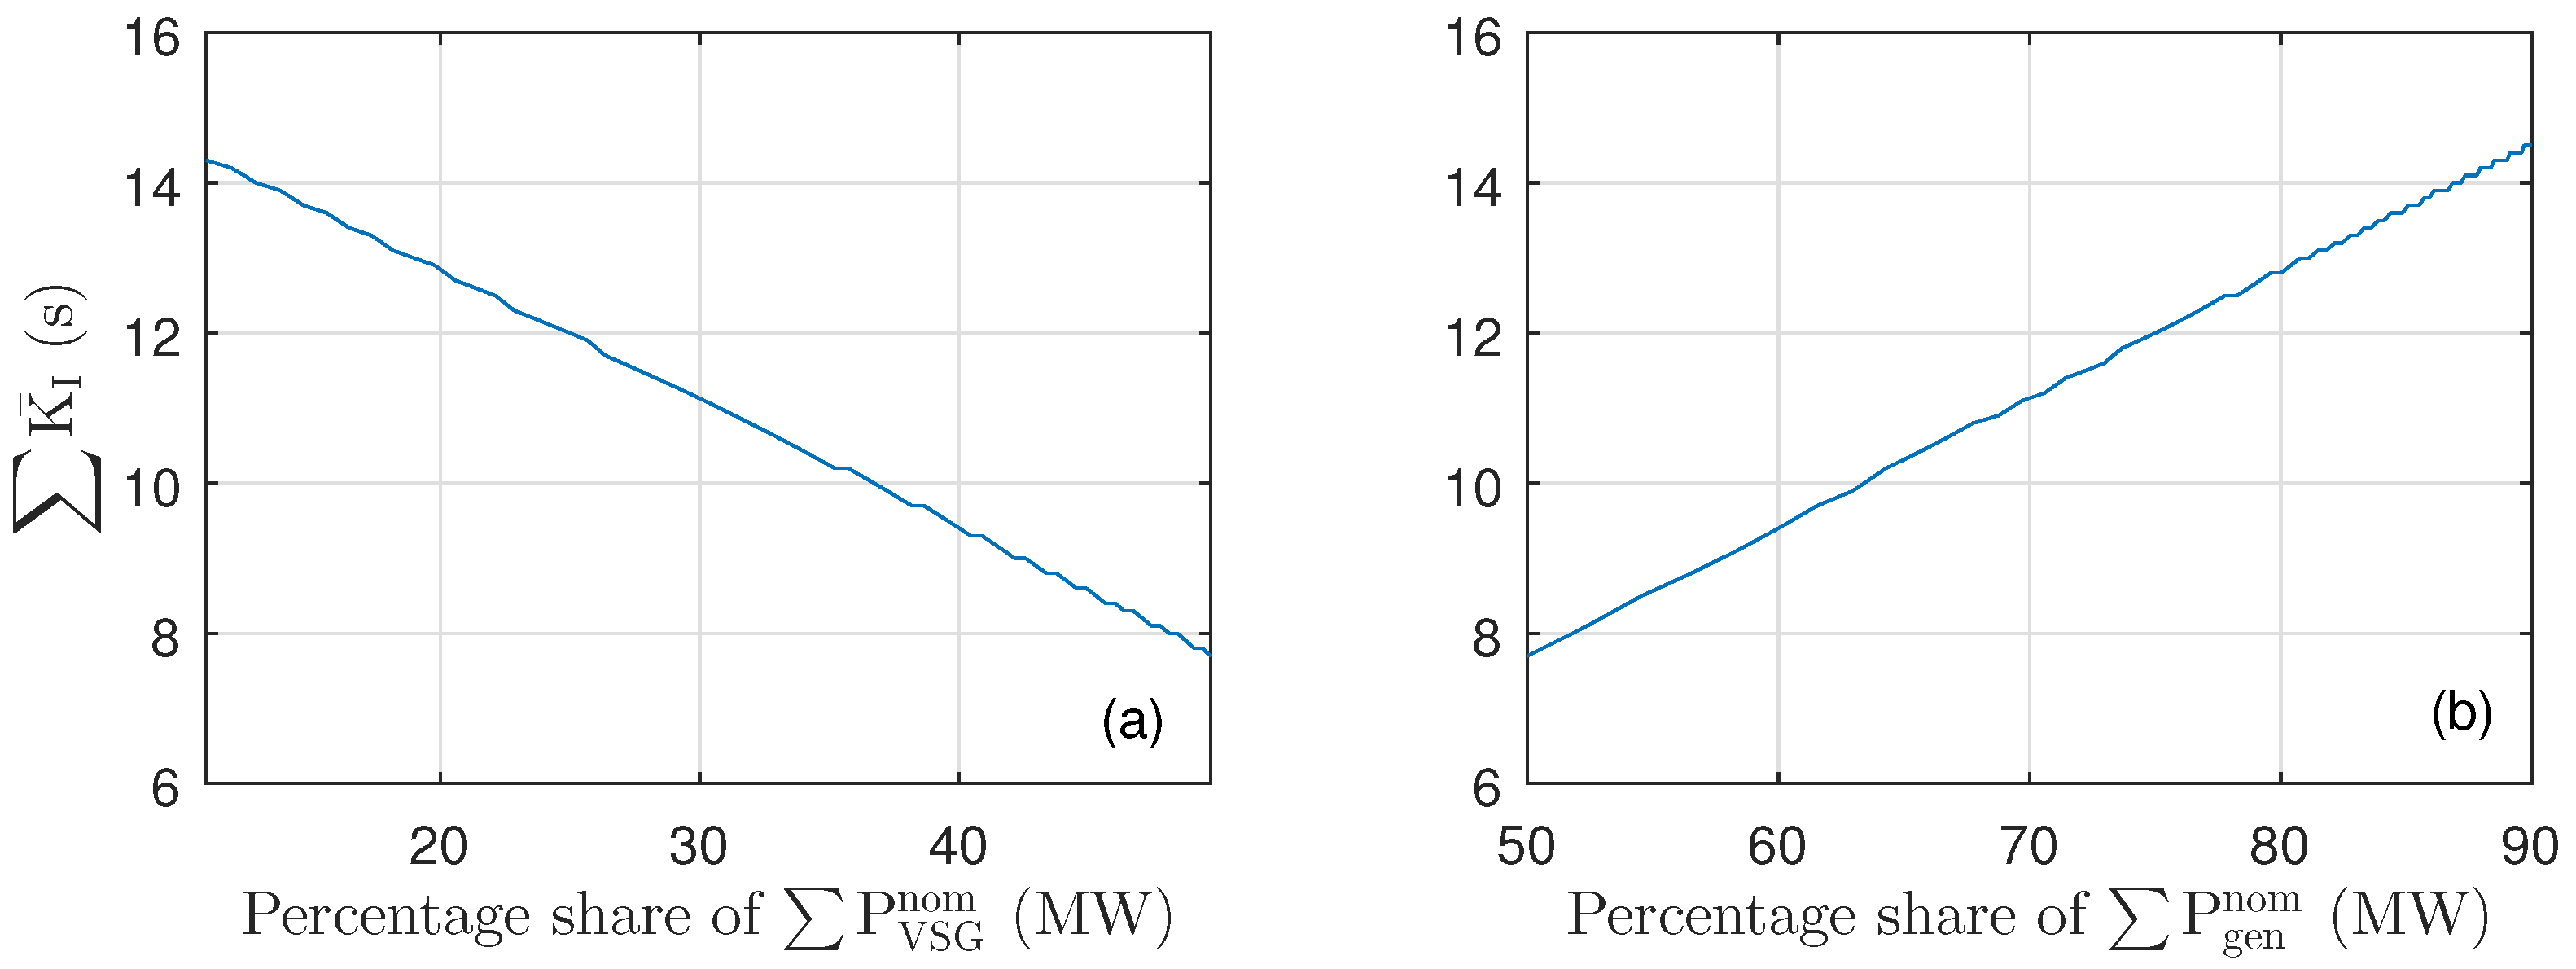
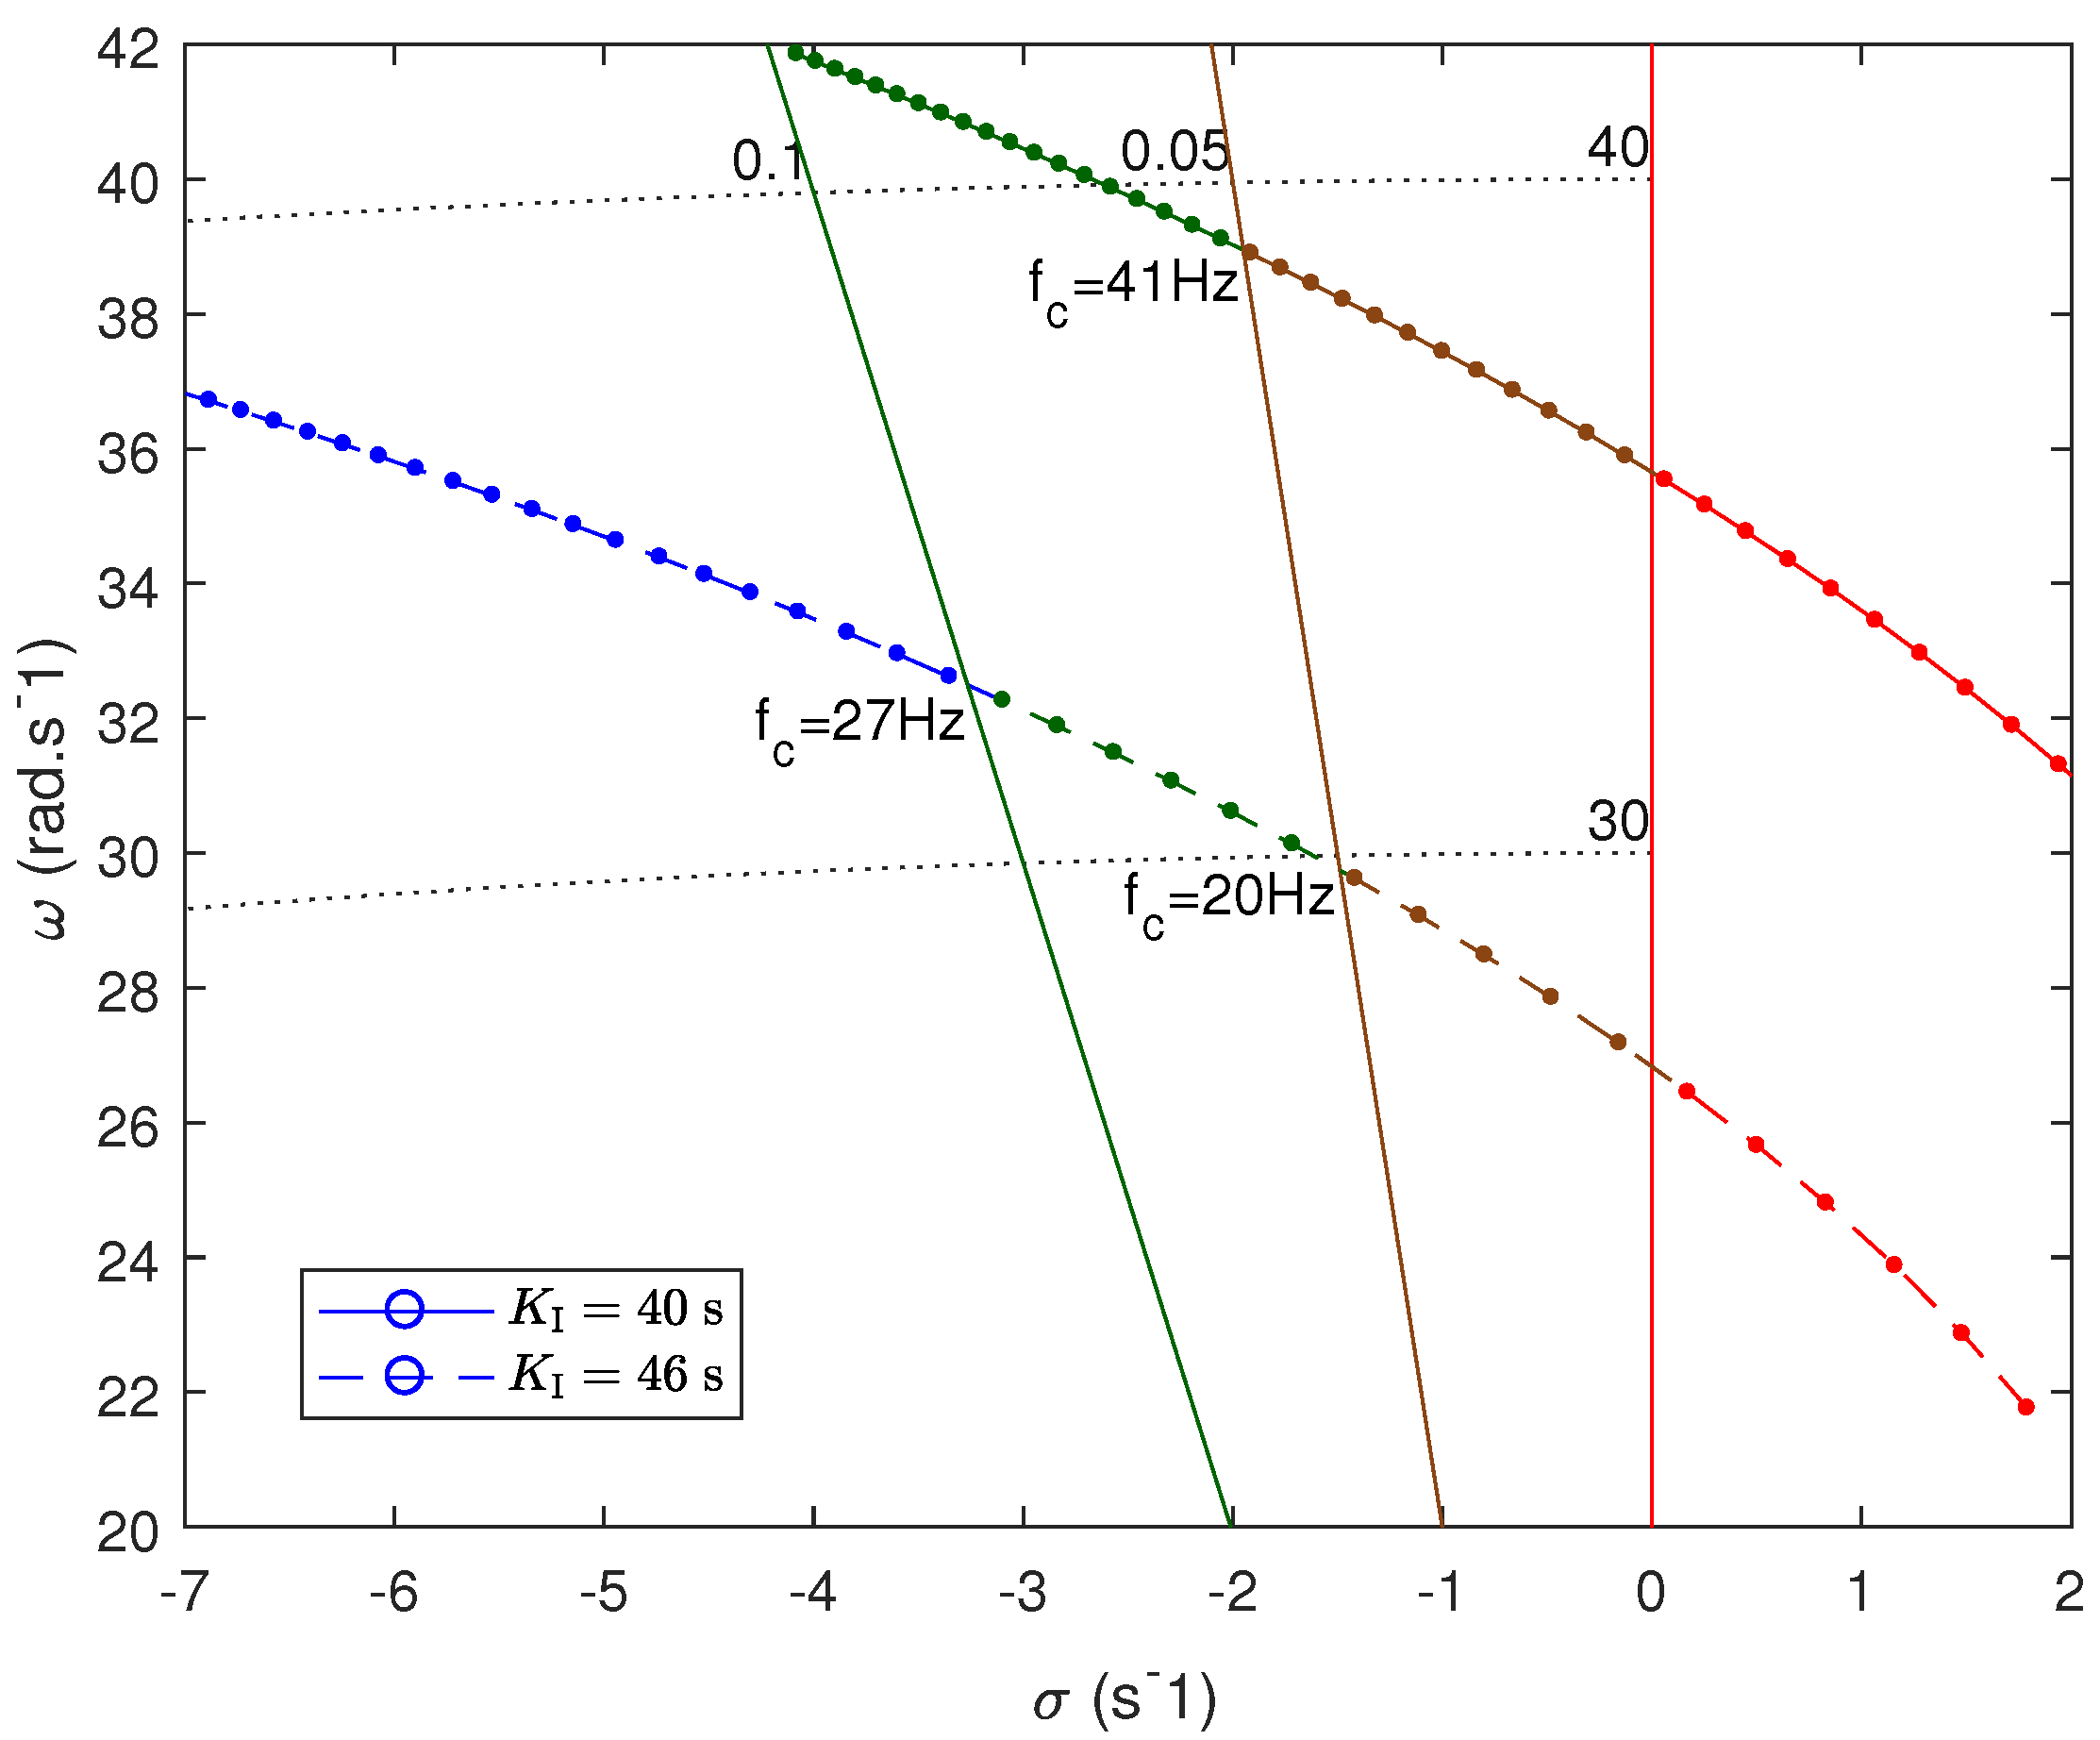
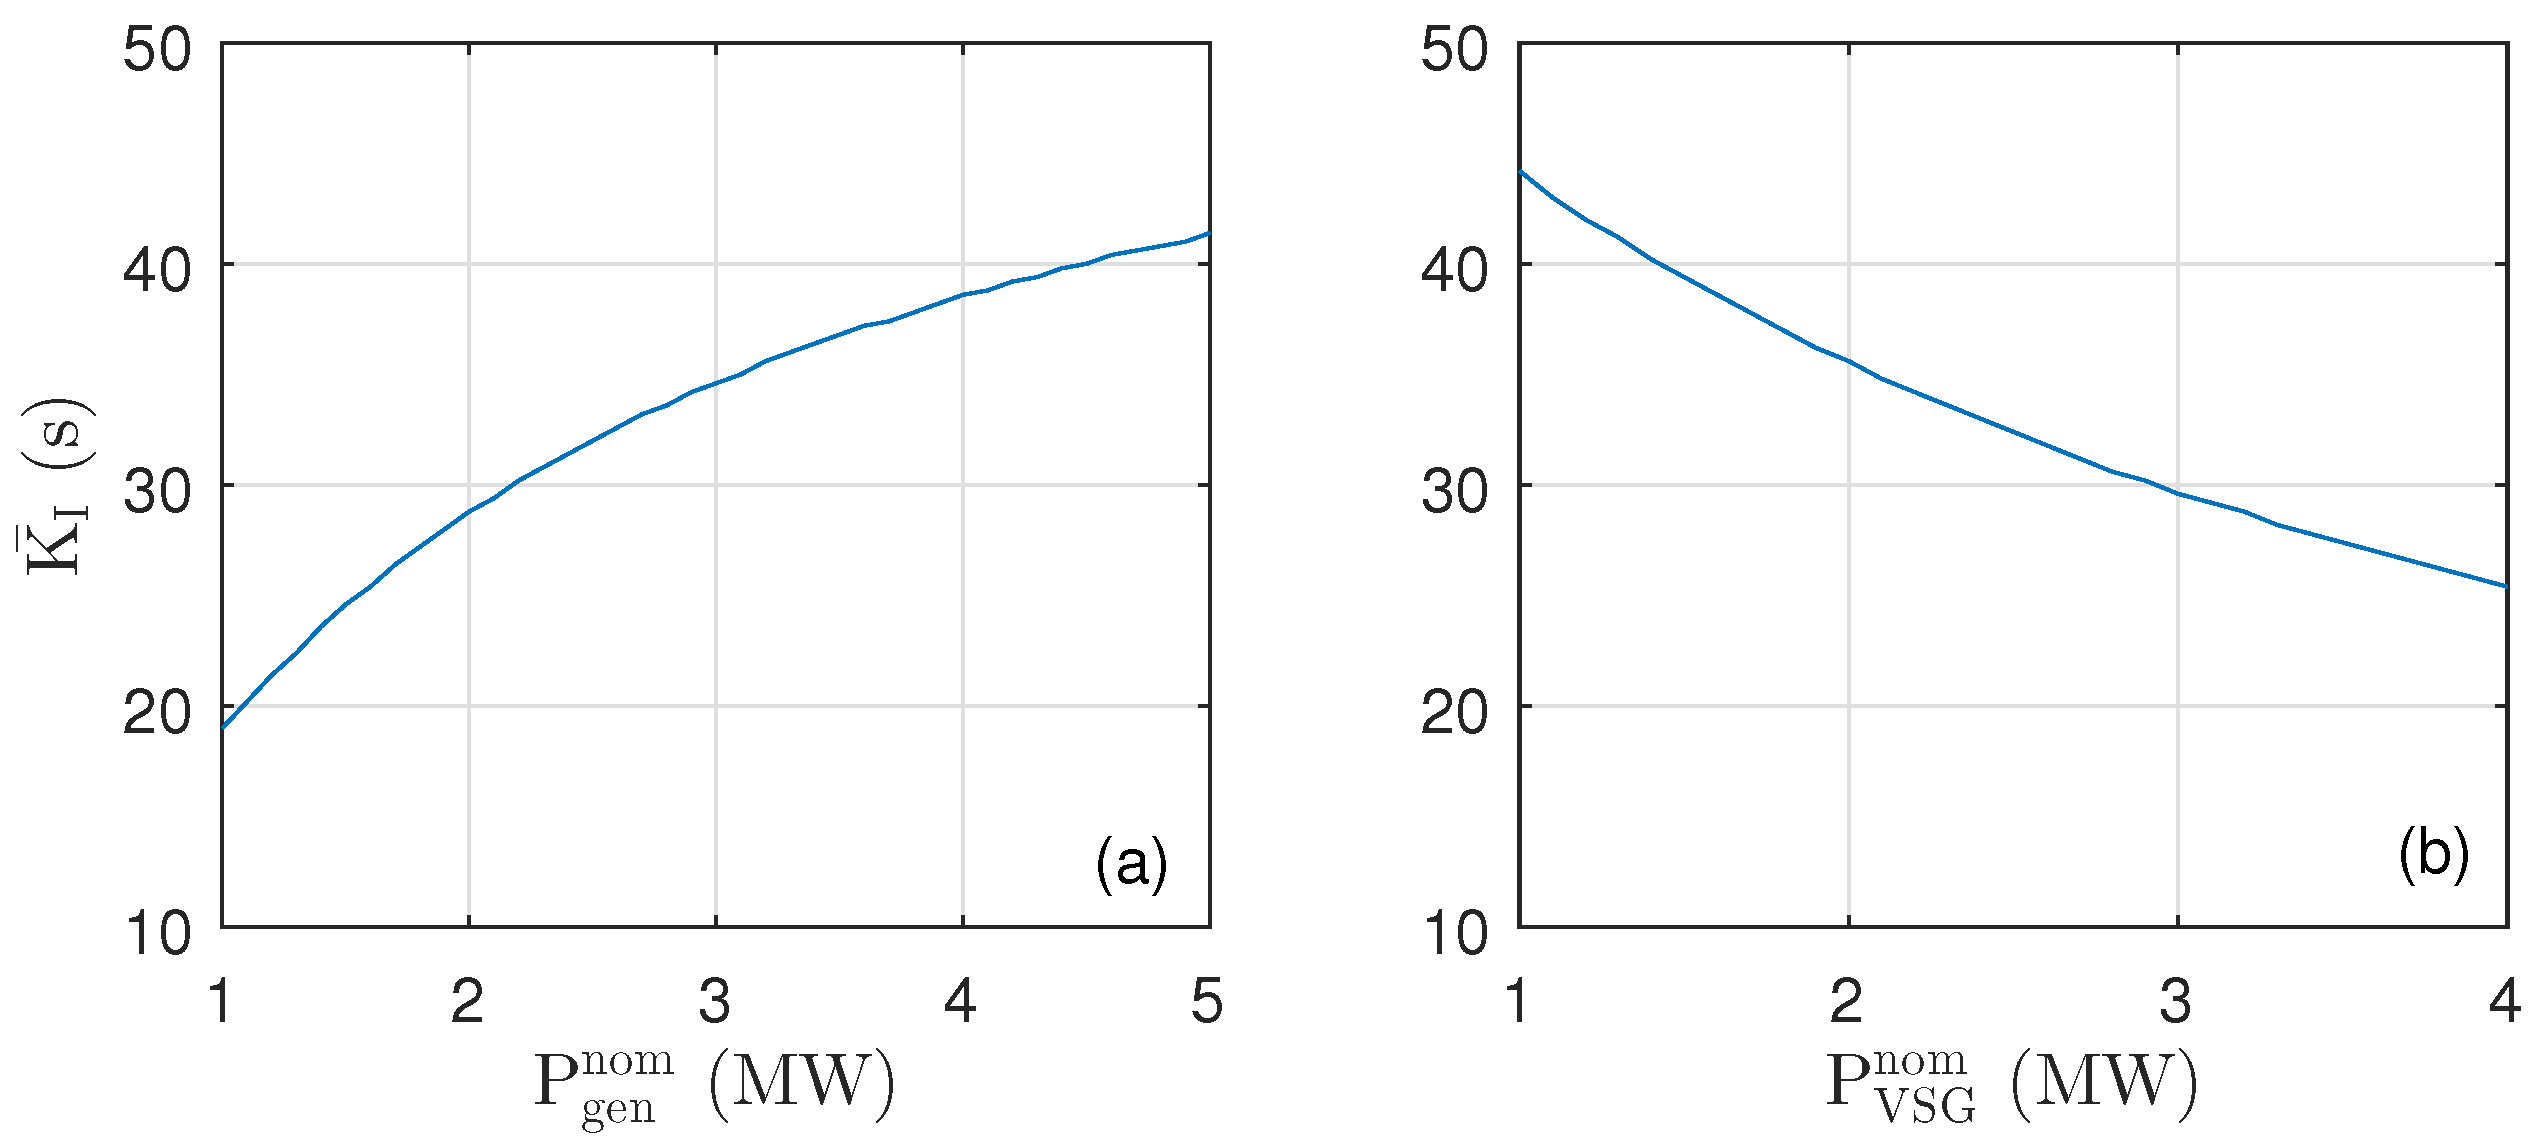
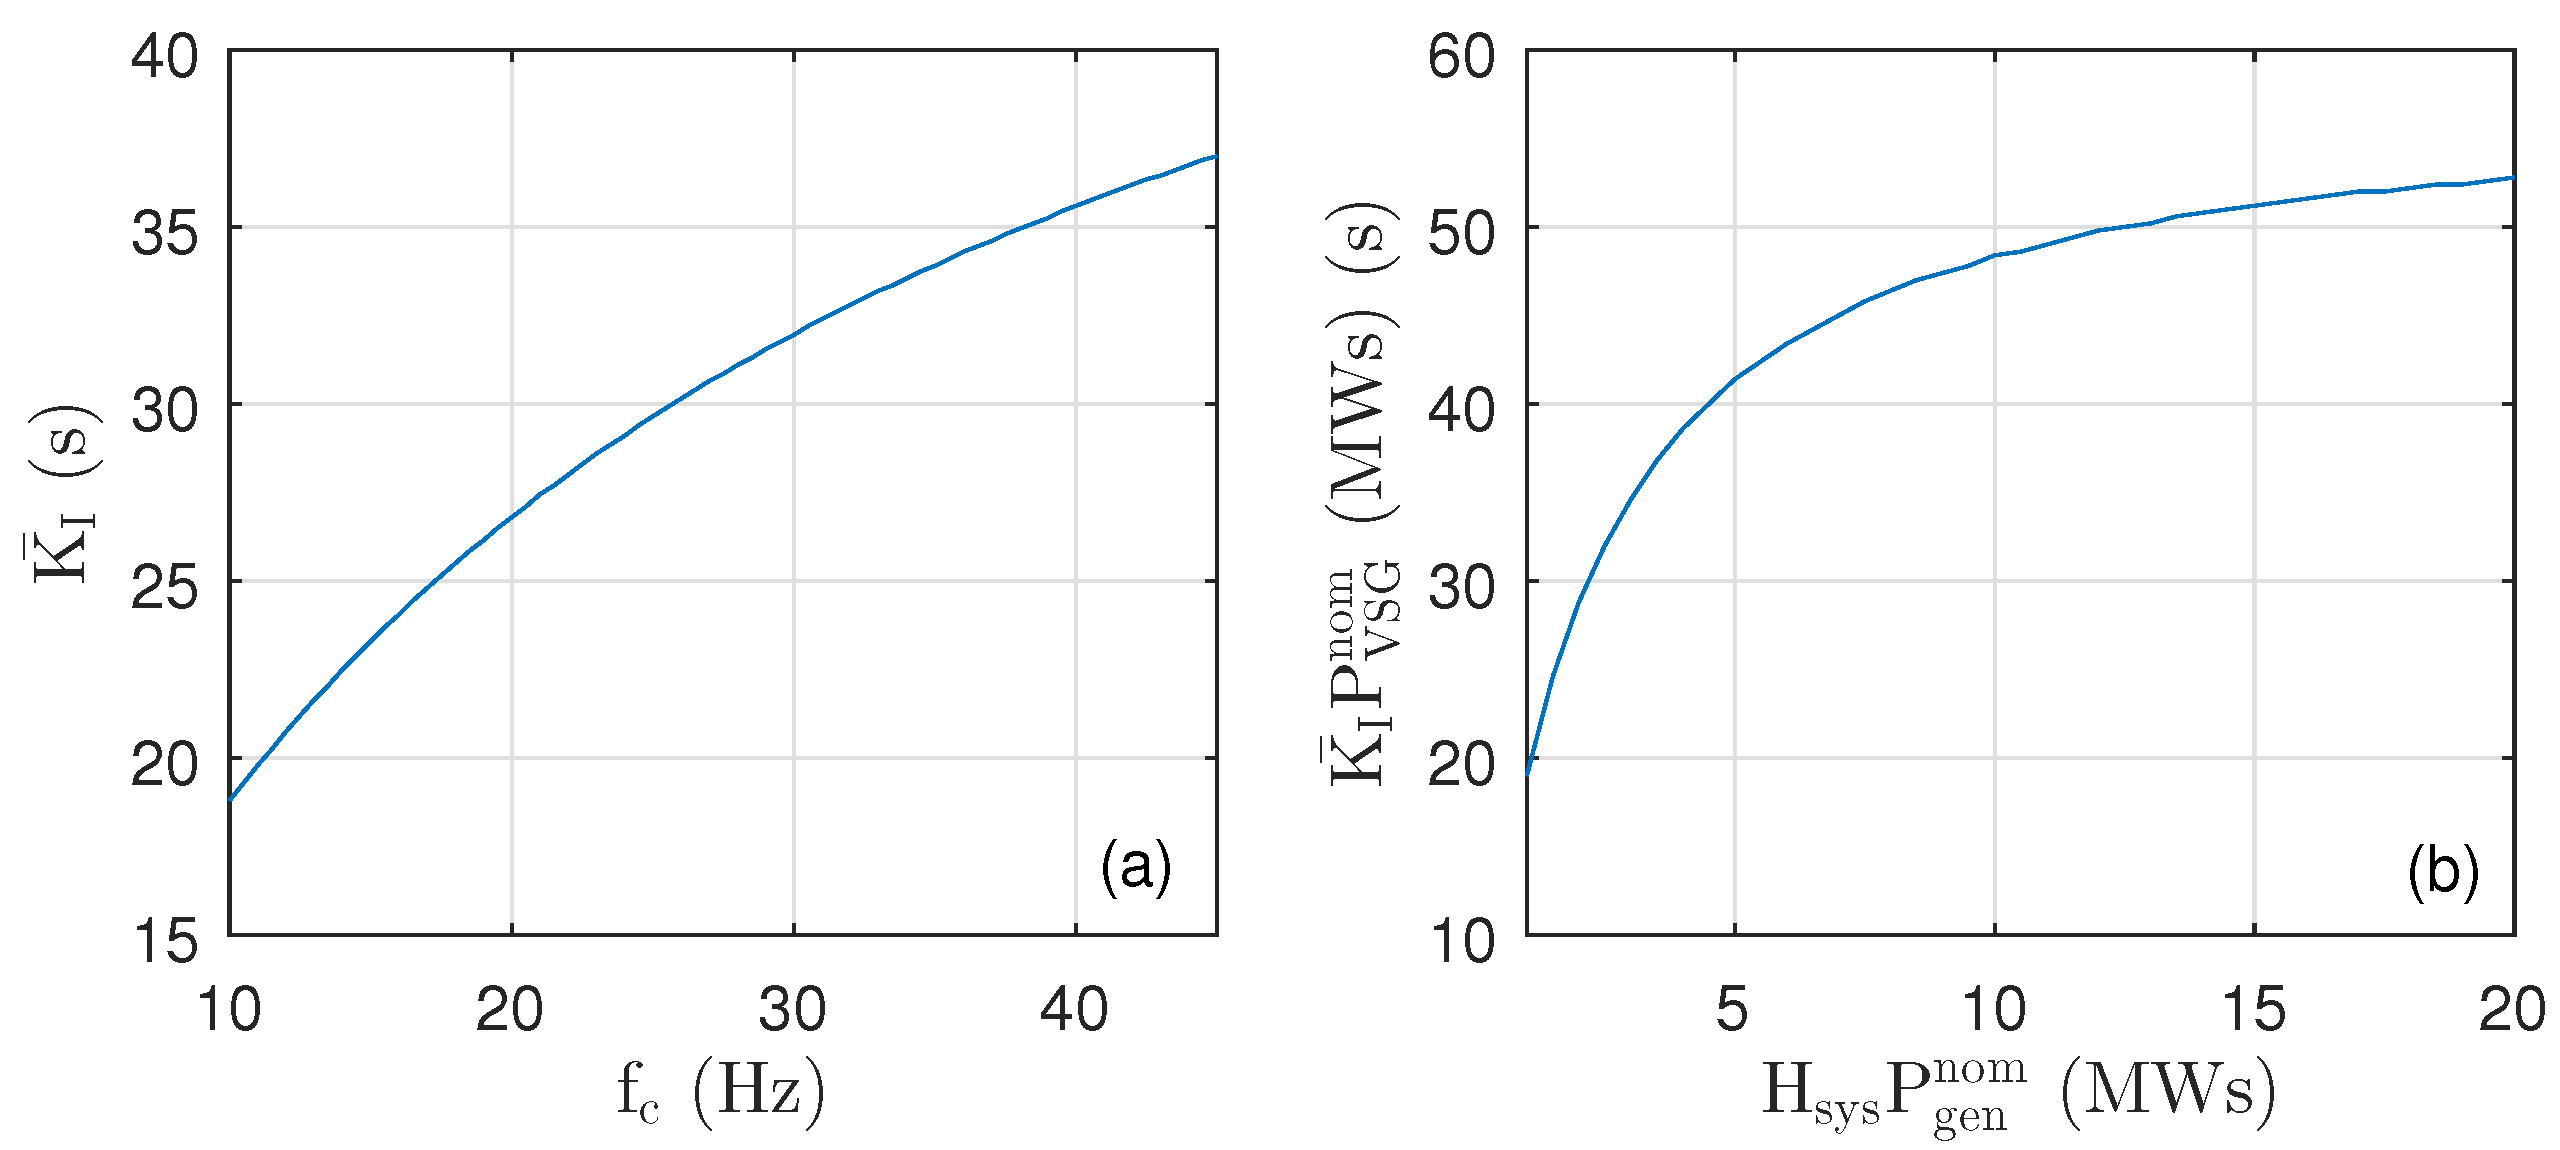
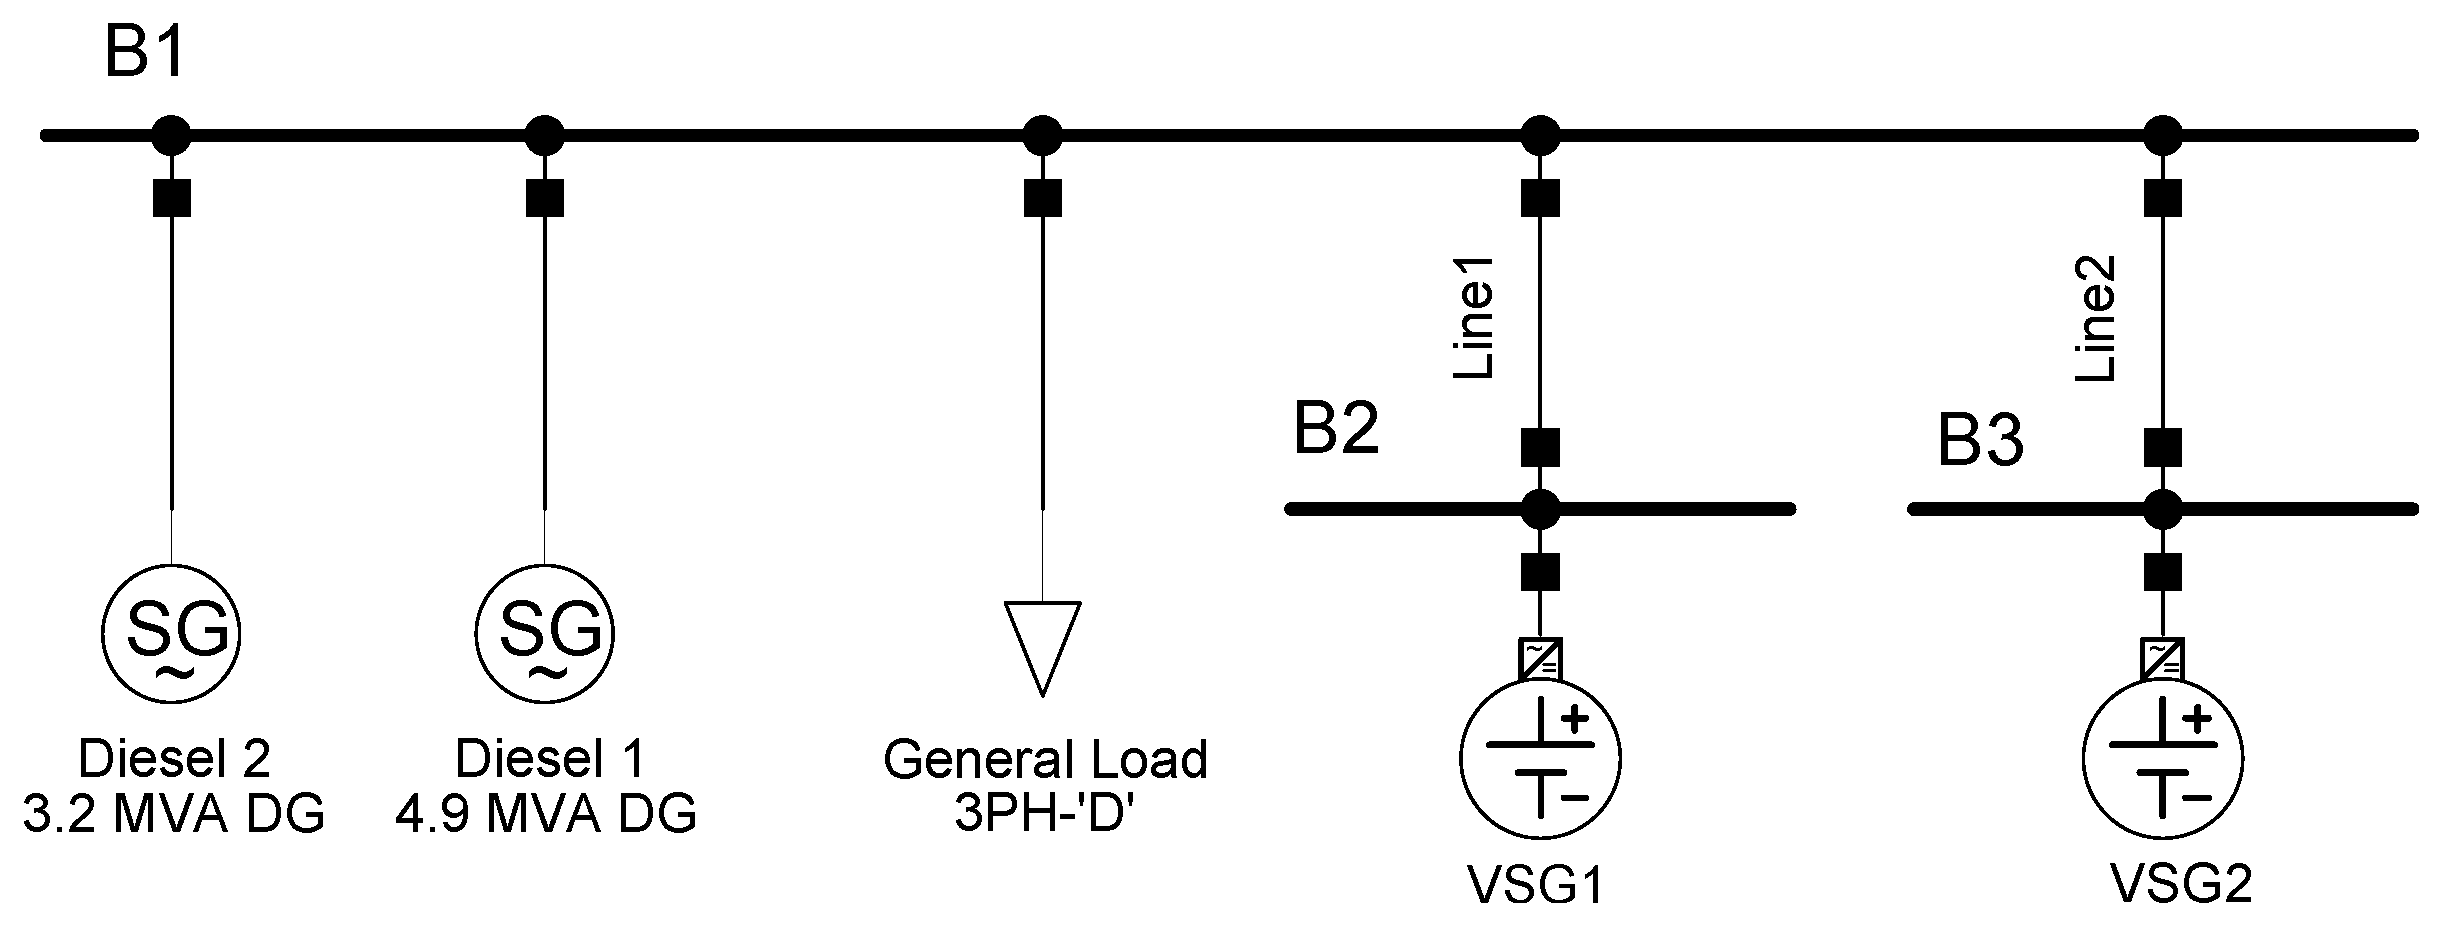
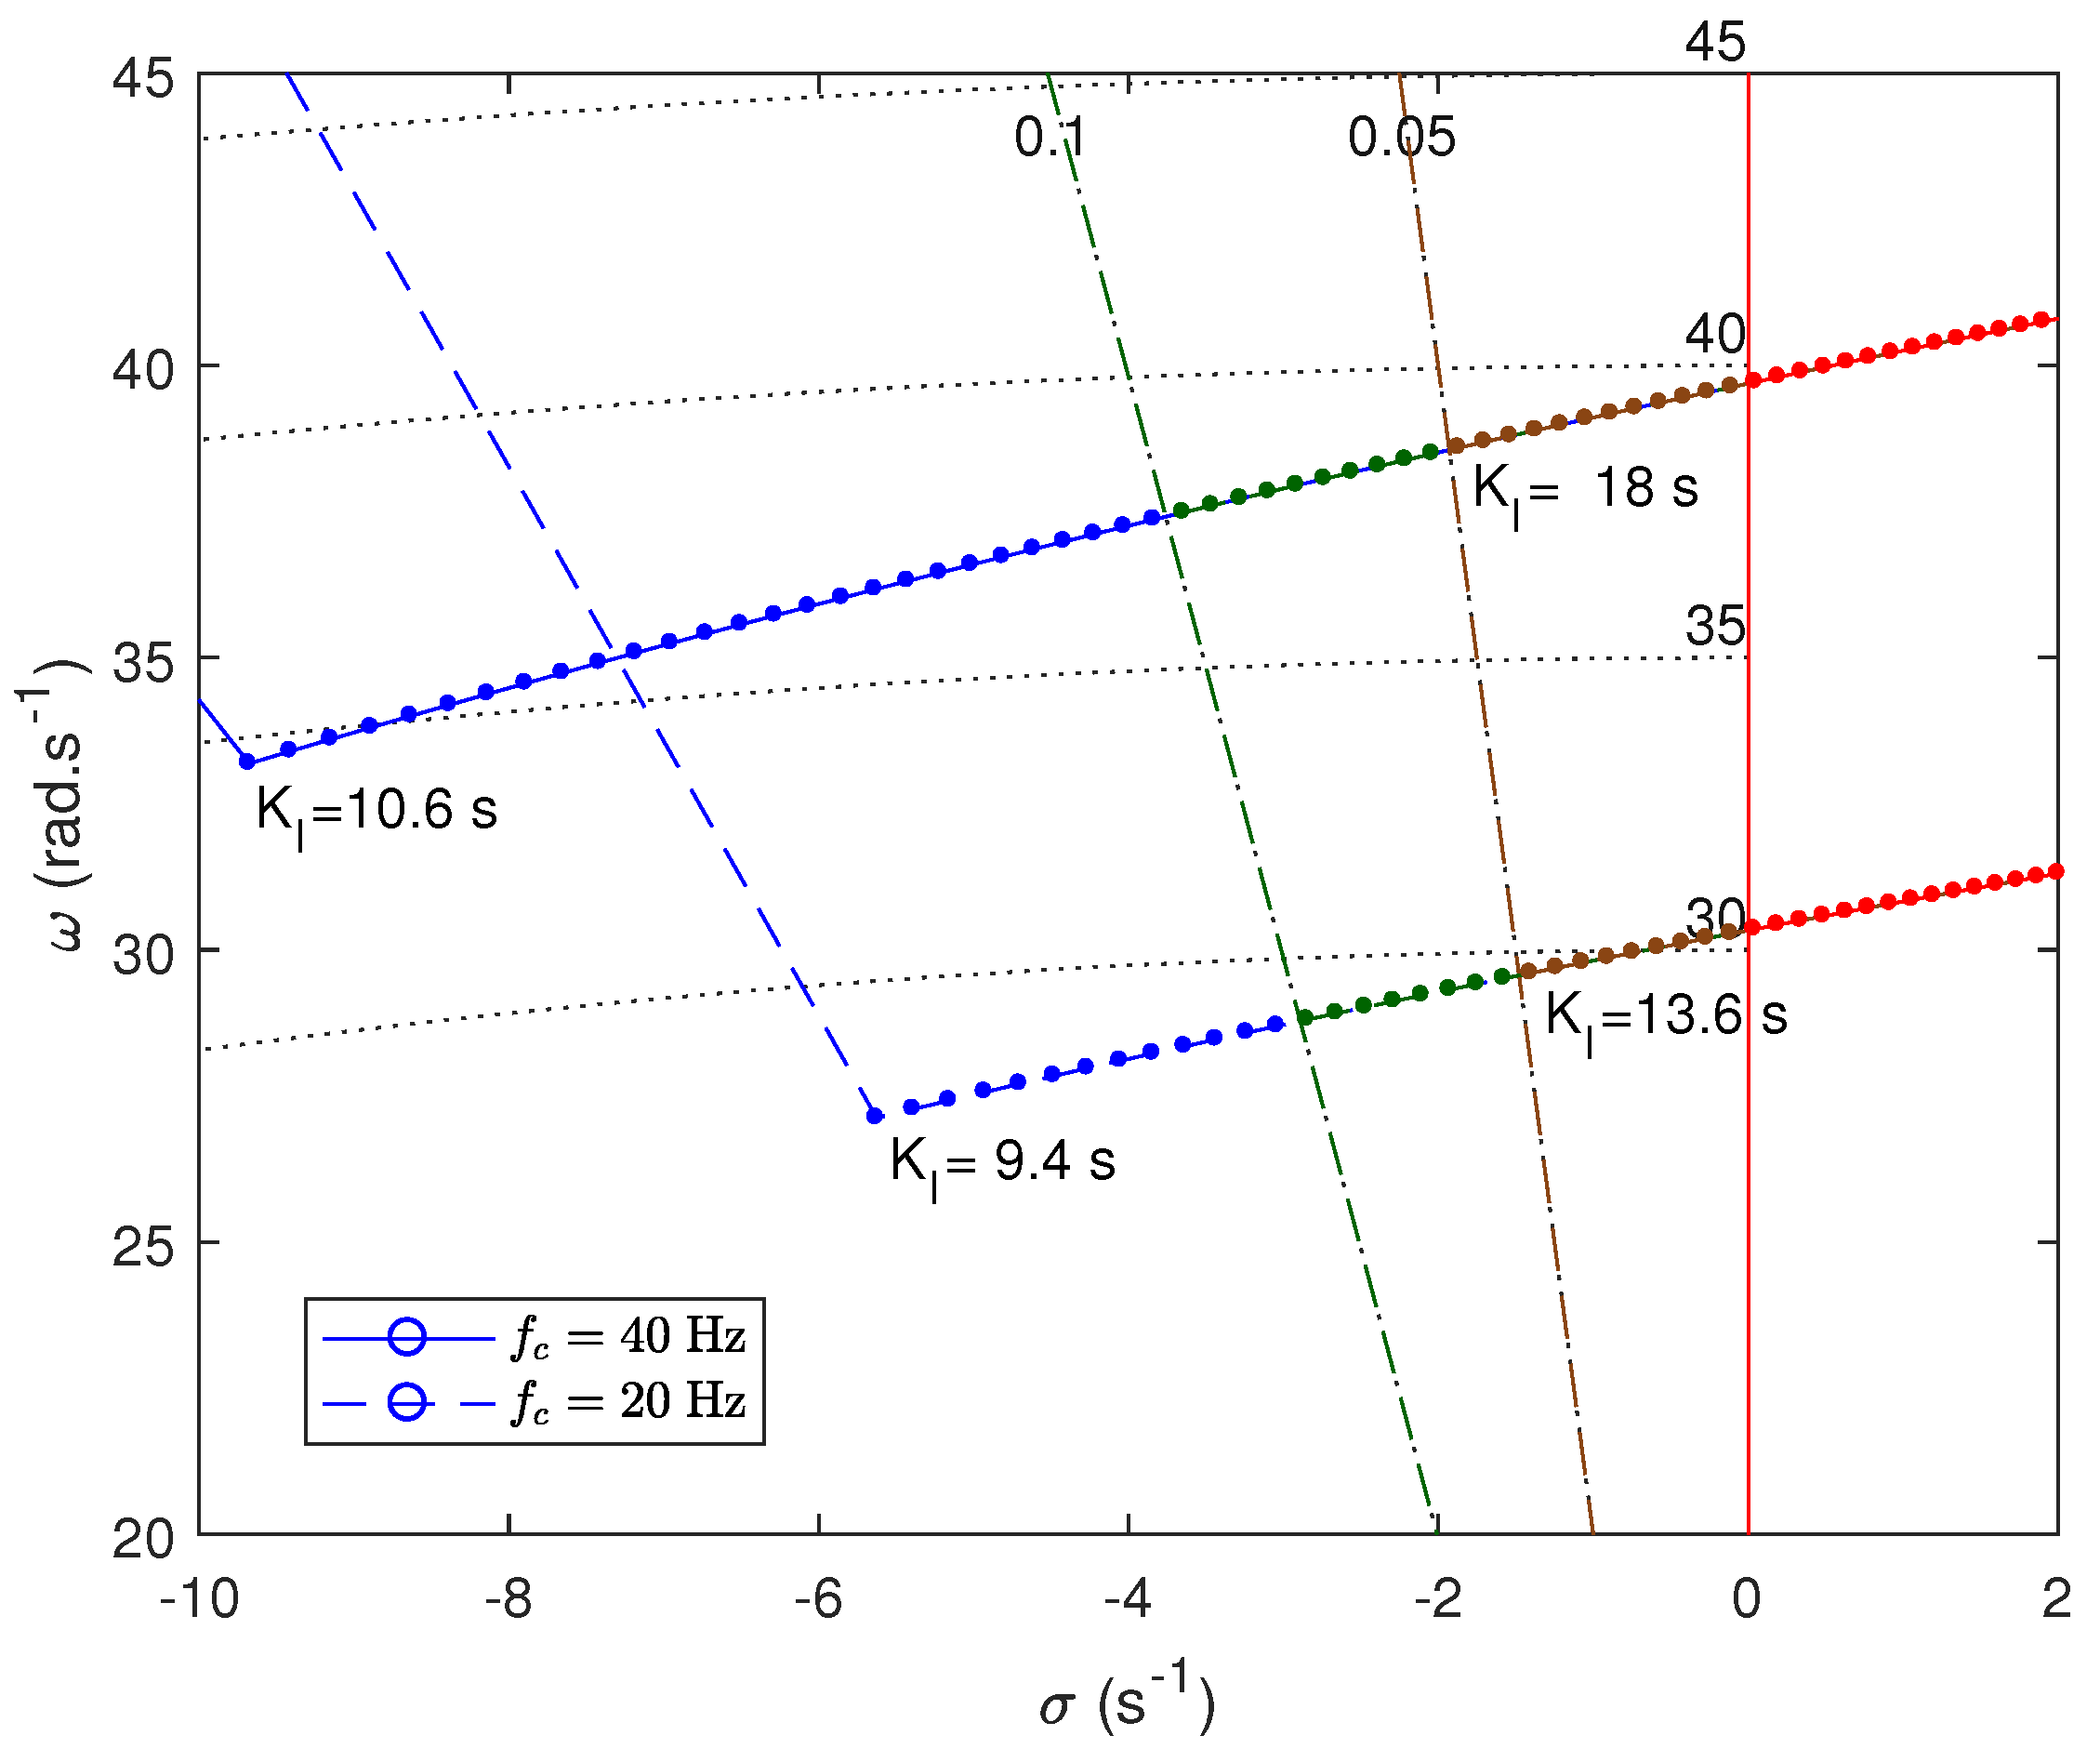
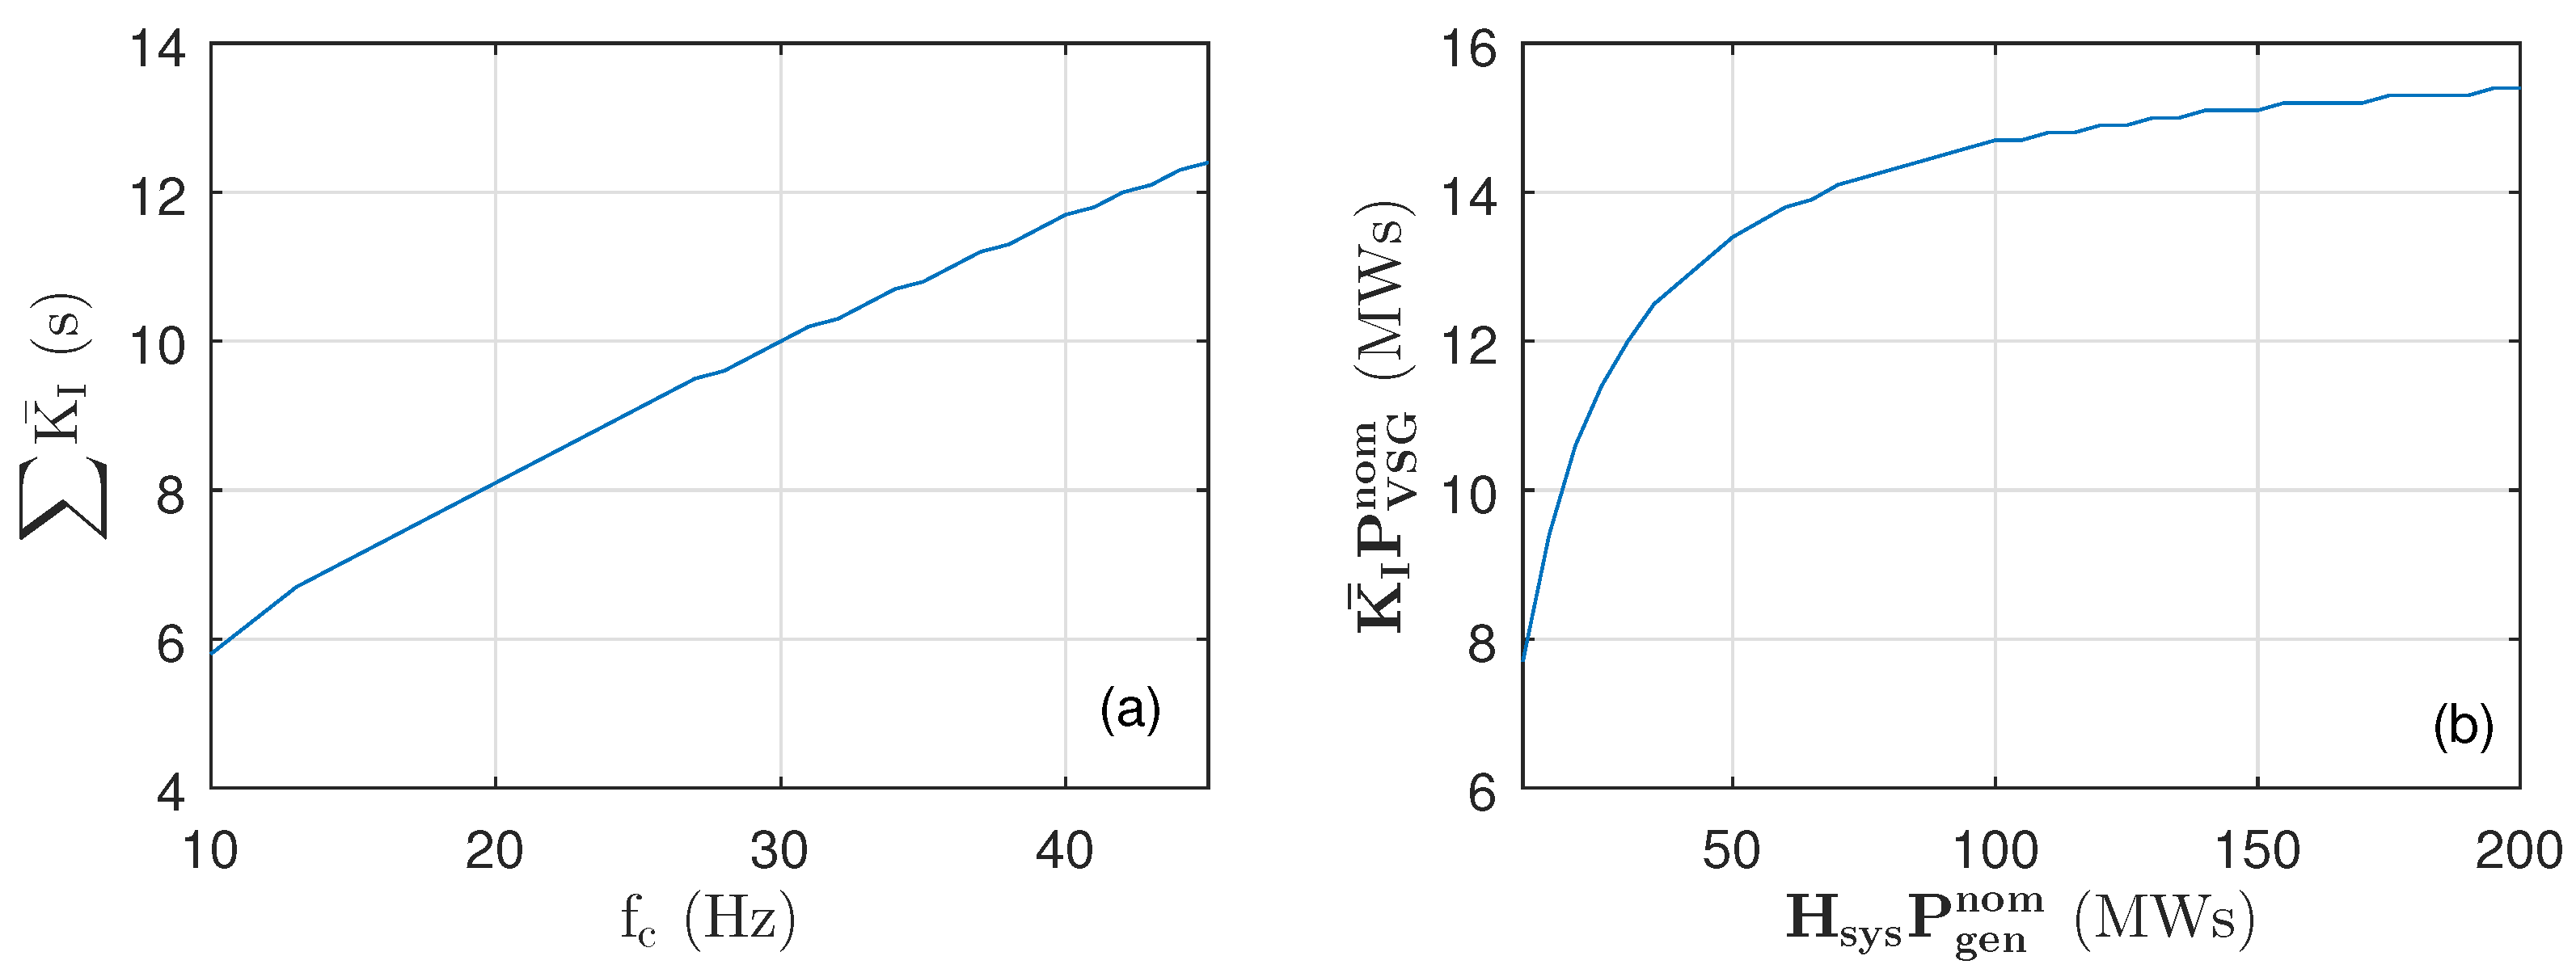
3.2. Multi-Machine System and Stability Analysis

The frequency response analysis of multi-machine systems aim at generalizing the results obtained for the SMSIB system. The multi-machine system considered consists of two VSG, two synchronous generators and a load. The single diagram is shown in Figure 11 and system parameters are given in Table 3.
The equivalent droop effect of the generators is derived as,
H LFC = i = 1 N 1 r i 1 + s τ t i 1 + s τ g i .
While, the system level transfer function is given as,
G grid = 1 H LFC + d + 2 i = 1 N h i s
where, r i is the ith generator droop gain, τ i is the first order governor delay, d is the damping introduced by the frequency dependent load and h i is the inertia of ith generator. The P L final is the final load. The per-unit quantities are calculated as,
r i = R i P base P gen i nom , h i = H i P gen i nom P base , d = D P L final P base
For the multi-machine system, if f c is set to 20 Hz, the corresponding maximum cumulative inertia gain is K I ¯ being the sum of K I ¯ of all VSGs has an upper limit of 13.6 s as shown in Figure 12. During the analysis, a load step of 1 MW has been applied to the system. If f c is increased to 40 Hz, then it can be observed that the gain can be increased to 18 s, i.e., 32% increase. The analysis of maximum cumulative virtual inertia gains with increasing share of VSGs and nominal power of generators is shown in Figure 13.
The impact of f c on K I ¯ can be observed in Figure 14a. Here, the results are similar to Figure 10 and we observe a linear relationship between K I ¯ and f c . The combined inertia contribution from all VSGs (MWs) as function of the system inertia (MWs) is shown in Figure 14b where, all the bold symbols are the sum of respective parameters for generators and VSGs. In this analysis, the total generation capacity increases from 1 to 20 MW while total nominal power of VSGs is fixed at 1 MW. We can observe that for smaller microgrids, where the cumulative capacity of VSGs is at least 10% of the generation capacity, the upper limit of the inertia support has an increasing trend. Once the VSGs capacity is less than 5% of the generation capacity, the inertia support saturates.
In light of the results from this study, we conclude that the maximum cumulative virtual inertia gain K I ¯ from VSGs is influenced by its nominal power and delay in the frequency measurement process. Moreover, the response to the reference incident during stability analysis is governed by the nature of frequency perturbation, overall inertia, cumulative droop gain of the power system and droop gains of participating VSGs. On the one hand, we observe that the maximum acceptable cut-off frequency of the PLL is determined by the desired robustness against harmonics. In general, the higher cut-off frequency leads to the smaller delay and hence greater is K I ¯ .

4. Conclusions and Outlook

This work addresses the key question in the industry about virtual inertia support from VSG in improving the small signal frequency stability. In this paper, a methodology is presented to identify the maximum permissible value of virtual inertia gain from VSG and identify the influencing factors. It is reported that by deploying an effective and faster PLL, the f c can be increased and more inertia can be emulated with a given VSG while offering significant level of robustness against harmonics. Due to a range of participating factors in the system, that depends on the load, inertia availability from generators and their droop gains, the upper limit of K I can be experimentally calculated using the presented methodology. In conclusion, with regards to supporting the inertia provision from VSG, the frequency measurement process plays a central role and the potential advantage of its improvement can be quantified by the frequency response analysis as presented in this paper.
Besides the academic interest, the work is also related to research and industry working in standardization committees in particular for the group “CENELEC WG7 Power frequency measurement for DER management” in TC8X [35] and the “RG-CE System Protection and Dynamics Sub Group” of ENTSO-E [36]. New standards are necessary to normalize the behavior of generators aiming at providing virtual inertia to ensure a stable operation of the system. Testing methods are necessary to determine the accuracy, robustness, delays from different implementations of virtual inertia in non-rotating generators. This paper provides a method for evaluating the virtual inertia limitations from stability perspective due to delays in frequency measurement and processing. However, in order to reach to more generic conclusions, the multi-dimensional nature of factors influencing the maximum virtual inertia gain of a VSG requires further study of the influences of load type, inertia availability and its distribution in the network, droop gains of the generators and the contingency specific evaluation. This study can be extended to hardware in the loop platforms that consider the detailed dynamics of inverters and increase the insight on further limiting factors on the virtual inertia. Moreover, the approach can be useful to compare virtual inertia provided by grid following inverters to the grid forming control in the future [37]. Recently, a comparison of various PLL approaches on the basis of accuracy and sensitivity to noise suggests Low-Pass Filter (LPF) PLL as having superior performance [38]. A study of the potential increase in the bandwidth of the virtual inertia loop using LPF-PLL could be interesting.

Author Contributions

S.K. and B.B. conceived and designed approaches; S.K. carried out the calculations, developed the software, produced and refined the visualization; B.B., W.G. and A.A. helped in analyzing the procedure, results and provided valuable guidance; B.B. reviewed the manuscript extensively.

Acknowledgments

This research was carried out in the frames of the research project BatterieSTABIL. This project is funded by the Austrian Climate and Energy Fund within the programme Energieforschung 2016 as well as Netz NÖ GmbH. Authors would like to thank Z.M. for the SOGI-FLL model.

Conflicts of Interest

The authors declare no conflict of interest.

Abbreviations

The following abbreviations are used in this manuscript:
VIVirtual Inertia
ESSEnergy Storage System
VSGVirtual Synchronous Generator
FFTFast Fourier Transform
LFCLoad Frequency Control
PLLphase-locked Loop
RoCoFRate-of-Change-of-Frequency
SMSIBSingle Machine Single Inverter Bus
SOGI-FLLSecond Order Generalized Integrator Frequency Locked Loop
STFTShort Time Fourier Transform

References

  1. Ørum, E.; Kuivaniemi, M.; Laasonen, M.; Bruseth, A.I.; Jansson, E.A.; Danell, A.; Elkington, K.; Modig, N. Future System Inertia; European Network of Transmission System Operators for Electricity (ENTSO-E): Brussels, Belgium, 2015. [Google Scholar]
  2. Thiesen, H.; Jauch, C.; Gloe, A. Design of a System Substituting Today’s Inherent Inertia in the European Continental Synchronous Area. Energies 2016, 9, 582. [Google Scholar] [CrossRef]
  3. Milano, F.; Dörfler, F.; Hug, G.; Hill, D.J.; Verbic, G. Foundations and challenges of low-inertia systems. In Proceedings of the 20th Power System Computation Conference (PSCC), Dublin, Ireland, 11–15 June 2017. [Google Scholar]
  4. Matevosyan, J.; Sharma, S.; Huang, S.H.; Woodfin, D.; Ragsdale, K.; Moorty, S.; Wattles, P.; Li, W. Proposed future ancillary services in electric reliability council of Texas. In Proceedings of the PowerTech Eindhoven 2015 Conference, Eindhoven, The Netherlands, 29 June–2 July 2015. [Google Scholar] [CrossRef]
  5. European Network of Transmission System Operators for Electricity (ENTSO-E); Eurelectric. Deterministic Frequency Deviations–Root Causes and Proposals for Potential Solutions; ENTSO-E: Brussels, Belgium; Eurelectric: Brussels, Belgium, 2011. [Google Scholar]
  6. European Network of Transmission System Operators for Electricity (ENTSO-E). Frequency Stability Evaluation Criteria for the Synchronous Zone of Continental Europe; ENTSO-E: Brussels, Belgium, 2006. [Google Scholar]
  7. Xypolytou, E.; Gawlik, W.; Zseby, T.; Fabini, J. Impact of asynchronous renewable generation infeed on grid frequency: Analysis based on synchrophasor measurements. Sustainability 2018, 10, 1605. [Google Scholar] [CrossRef]
  8. Seyedi, M.; Bollen, M. The Utilization of Synthetic Inertia from Wind Farms and Its Impact on Existing Speed Governors and System Performance; Elforsk AB: Stockholm, Sweden, 2013. [Google Scholar]
  9. Van de Vyver, J.; De Kooning, J.D.M.; Meersman, B.; Vandevelde, L.; Vandoorn, T.L. Droop control as an alternative inertial response strategy for the synthetic inertia on wind turbines. IEEE Trans. Power Syst. 2016, 31, 1129–1138. [Google Scholar] [CrossRef]
  10. Cooke, A.; Strickland, D.; Forkasiewicz, K. Energy storage for enhanced frequency response services. In Proceedings of the 52nd International Universities Power Engineering Conference (UPEC), Heraklion, Greece, 28–31 August 2017. [Google Scholar] [CrossRef]
  11. Knap, V.; Sinha, R.; Swierczynski, M.; Stroe, D.I.; Chaudhary, S. Grid inertial response with lithium-ion battery energy storage systems. In Proceedings of the IEEE 23rd International Symposium on Industrial Electronics (ISIE), Istanbul, Turkey, 1–4 June 2014; pp. 1817–1822. [Google Scholar]
  12. Bevrani, H. Robust Power System Frequency Control; Springer: Berlin, Germany, 2016. [Google Scholar]
  13. Akke, M. Frequency estimation by demodulation of two complex signals. IEEE Trans. Power Deliv. 1997, 12, 157–163. [Google Scholar] [CrossRef]
  14. Begovic, M.M.; Djuric, P.M.; Dunlap, S.; Phadke, A.G. Frequency tracking in power networks in the presence of harmonics. IEEE Trans. Power Deliv. 1993, 8, 480–486. [Google Scholar] [CrossRef]
  15. Giray, M.; Sachdev, M. Off-nominal frequency measurements in electric power systems. IEEE Trans. Power Deliv. 1989, 4, 1573–1578. [Google Scholar] [CrossRef]
  16. Xia, Y.; Douglas, S.C.; Mandic, D.P. Adaptive frequency estimation in smart grid applications: Exploiting noncircularity and widely linear adaptive estimators. IEEE Signal Process. Mag. 2012, 29, 44–54. [Google Scholar] [CrossRef]
  17. Girgis, A.A.; Peterson, W.L. Adaptive estimation of power system frequency deviation and its rate of change for calculating sudden power system overloads. IEEE Trans. Power Deliv. 1990, 5, 585–594. [Google Scholar] [CrossRef]
  18. Rodríguez, P.; Pou, J.; Bergas, J.; Candela, J.I.; Burgos, R.P.; Boroyevich, D. Decoupled double synchronous reference frame PLL for power converters control. IEEE Trans. Power Electron. 2007, 22, 584–592. [Google Scholar] [CrossRef]
  19. Adeuyi, O.D.; Cheah-Mane, M.; Liang, J.; Jenkins, N. Fast Frequency Response From Offshore Multiterminal VSC–HVDC Schemes. IEEE Trans. Power Deliv. 2017, 32, 2442–2452. [Google Scholar] [CrossRef]
  20. Rezkalla, M.; Zecchino, A.; Martinenas, S.; Prostejovsky, A.M.; Marinelli, M. Comparison between synthetic inertia and fast frequency containment control based on single phase EVs in a microgrid. Appl. Energy 2018, 210, 764–775. [Google Scholar] [CrossRef]
  21. Milano, F. Small-signal stability analysis of large power systems with inclusion of multiple delays. IEEE Trans. Power Syst. 2016, 31, 3257–3266. [Google Scholar] [CrossRef]
  22. Markovic, U.; Aristidou, P.; Hug, G. Stability Performance of Power Electronic Deviceswith Time Delays. In Proceedings of the 2017 IEEE Manchester PowerTech Conference, Manchester, UK, 18–22 June 2017. [Google Scholar]
  23. Markiewicz, H.; Klajn, A. Voltage Disturbances Standard EN 50160-Voltage Characteristics in Public Distribution Systems; Copper Development Association Inc.: New York, NY, USA, 2004. [Google Scholar]
  24. Marinescu, C.; Serban, I.; Teodorescu, R. Energy storage systems impact on the short-term frequency stability of distributed autonomous microgrids, an analysis using aggregate models. IET Renew. Power Gener. 2013, 7, 531–539. [Google Scholar]
  25. Hatziargyriou, N.; Cutsem, T.V.; Milanović, J.; Pourbeik, P.; Vournas, C.; Vlachokyriakou, O.; Kotsampopoulos, P.; Hong, M.; Ramos, R.; Boemer, J.; et al. Contribution to Bulk System Control and Stability by Distributed Energy Resources connected at Distribution Network; Report PES-TR22; IEEE Power & Energy Society: Piscataway, NJ, USA, 2017. [Google Scholar]
  26. Egan, W. Phase-Lock Basics; Wiley-Interscience IEEE: Hoboken, NJ, USA, 2008. [Google Scholar]
  27. The MathWorks, Inc. PLL (3ph) Function in SimPowerSystems Toolbox from Matlab 2015b; The MathWorks, Inc.: Natick, MA, USA, 2015. [Google Scholar]
  28. Teodorescu, R.; Liserre, M.; Rodriguez, P. Grid Converters for Photovoltaic and Wind Power Systems; John Wiley & Sons: Hoboken, NJ, USA, 2011; Volume 29. [Google Scholar]
  29. Liu, G.; Zinober, A.; Shtessel, Y.B. Second-order SM approach to SISO time-delay system output tracking. IEEE Trans. Ind. Electron. 2009, 56, 3638–3645. [Google Scholar]
  30. Machowski, J.; Bialek, J.; Bumby, D.J. Power System Dynamics: Stability and Control, 2nd ed.; Wiley: Hoboken, NJ, USA, 2008. [Google Scholar]
  31. Tamrakar, U.; Shrestha, D.; Maharjan, M.; Bhattarai, B.; Hansen, T.; Tonkoski, R. Virtual Inertia: Current Trends and Future Directions. Appl. Sci. 2017, 7, 654. [Google Scholar] [CrossRef]
  32. Probst, A.; Magana, M.; Sawodny, O. Using a Kalman filter and a Pade approximation to estimate random time delays in a networked feedback control system. IET Control Theory Appl. 2010, 4, 2263–2272. [Google Scholar] [CrossRef]
  33. Hammer, A. Analysis of IEEE Power System Stabilizer Models. Master’s Thesis, Norwegian University of Science and Technology, Trondheim, Ålesund, Gjøvik, Norway, June 2011. [Google Scholar]
  34. Pal, B.; Chaudhuri, B. Robust Control in Power Systems; Springer: Berlin, Germany, 2006. [Google Scholar]
  35. WG7 “Power frequency measurement for DER management”. Available online: https://bit.ly/2NARMMV (accessed on 10 July 2018).
  36. European Network of Transmission System Operators for Electricity (ENTSO-E). Frequency Measurement Requirements and Usage-Final Version 7; ENTSO-E: Brussels, Belgium, 29 January 2018. [Google Scholar]
  37. European Network of Transmission System Operators for Electricity (ENTSO-E). High Penetration of Power Electronic Interfaced Power Sources (HPoPEIPS), ENTSO-E Guidance Document for National Implementation for Network Codes on Grid Connection; ENTSO-E: Brussels, Belgium, 2017. [Google Scholar]
  38. Ortega, Á.; Milano, F. Comparison of different PLL implementations for frequency estimation and control. In Proceedings of the 18th International Conference on Harmonics and Quality of Power (ICHQP), Ljubljana, Slovenia, 13–16 May 2018. [Google Scholar] [CrossRef]
Figure 1. Frequency estimation performance analysis for various PLL configurations. The zero crossing (ZC) detection is for reference while SOGI (SOGI-FLL) with-out and with low-pass filter and PLL implementation (1Ph-PLL) from Matlab are compared. The f c has been set to 20 Hz.
Energies 11 02372 g001
Figure 2. Base to peak amplitude of PLL output measured frequency around steady-state value as function of f c of PLL, when harmonics are considered collectively.
Energies 11 02372 g002
Figure 3. The figure shows impact of increasing harmonic order in the input of PLL to the harmonic contents of frequency estimated at the output. Each sub-figure has on x-axis the harmonic frequency order ( K H ) in per-unit to the nominal frequency of 50 Hz. As the harmonic order is increased, the output harmonic frequency ( f H ) and the amplitude ( A H ) are shown on the y-axes, where the dominant suggests amplitude and (L, R) are referring to left and right axes. The figures are arranged as, without filtering on left-side (a,c,e) and considering PLL low-pass filter on the right-side (b,d,f), respectively. The f c of PLL is set to 20 Hz.
Energies 11 02372 g003
Figure 4. Frequency domain block diagram representing LFC of a single machine connected to an infinite bus.
Energies 11 02372 g004
Figure 5. Frequency domain block diagram of VSG shows the PLL stage followed by the control loops and G VSG τ representing VSG time-constant. The aggregate transfer function is given by G VSG .
Energies 11 02372 g005
Figure 6. System overview diagram of SMSIB system in test case.
Energies 11 02372 g006
Figure 7. Stability locus of most critical pole showing the maximum virtual inertia gain for given values of f c in SMSIB system. Damping ratio of 0.05 and 0.1 are shown in the background.
Energies 11 02372 g007
Figure 8. Stability locus of most critical pole showing the minimum value of f c for different values of virtual inertia gains.
Energies 11 02372 g008
Figure 9. Maximum virtual inertia gain limit for satisfying damping criteria as function of nominal power of the generator in (a) and VSG in (b) ( f c = 40 Hz).
Energies 11 02372 g009
Figure 10. (a) Maximum virtual inertia gain limit as function of f c ; (b) Inertia contribution from VSG to the system in MW seconds as function of system inertia for increasing level of generator nominal power and while keeping H fixed at 5 s.
Energies 11 02372 g010
Figure 11. Single line diagram of the multi-machine system.
Energies 11 02372 g011
Figure 12. Stability locus of most critical pole indicating maximum value of cumulative virtual inertia gain of all VSGs for given value of f c in the multi-machine system.
Energies 11 02372 g012
Figure 13. Cumulative virtual inertia gain as function of percentage share of VSG nominal power in (a) and of generator nominal power is shown in (b). The percentage share is to the total generation and VSG nominal power capacity. The f c of PLL is set to 40 Hz.
Energies 11 02372 g013
Figure 14. (a) Cumulative virtual inertia gain as function of cut-off frequency of PLL and (b) Maximum inertia support from VSGs compared to inertia in grid for increasing level of generation capacity.
Energies 11 02372 g014
Table 1. Harmonic frequency contents from EN 50160.
Harmonic order357911131517
Harmonic amplitude (%)5651.53.530.52
Table 2. Parameters for SMSIB system.
GeneratorVSGLoad
P gen nom 3.2 MW P VSG nom 2 MW P load 1 MW
R0.05 p.u. τ D 0.02 Δ P ref 0.2 MW
H5 s R VSG 0.02 p.u.D1
τ t gen 0.5 s P base 5.2 MW
τ g gen 0.2 s
Table 3. Parameters for multi-machine system.
Generator 1Generator 2VSG1VSG2Load
P gen 1 nom 3.2 MW P gen 2 nom 4.9 MW P VSG 1 nom 1 MW P VSG 2 nom 2 MW P load 1 MW
H gen 1 5 s H gen 2 2 s τ D VSG 1 0.01 s τ D VSG 2 0.01 s Δ P ref 1 MW
R gen 1 0.04 p.u. R gen 2 0.06 p.u. K I VSG 1 5 K I VSG 2 5D1
τ t gen 1 0.5 s τ t gen 2 0.5 s R VSG 1 0.02 p.u. R VSG 2 0.04 p.u. P base 11.1 MW
τ g gen 1 0.2 s τ g gen 2 0.2 s

