1. Introduction
Coalbed methane (CBM) is a significant natural energy resource that is increasingly playing a key role in the development of clean new energy in China. As the production of natural gas from coal and CBM from shallow hydrocarbon deposits is now relatively widespread, it is increasingly important to investigate the simultaneous adsorption and desorption of coalbed gases and water to enable more efficient exploitation [
1,
2,
3,
4,
5]. Methane desorption from coal at various conditions is affected by numerous factors—including gas content from underground boreholes, coalbed permeability, initial gas desorption properties, and coal strength—all variables that can be measured in the laboratory as well as in situ at the coal field [
6,
7,
8,
9].
Seam permeability during gas discharge is complex and can be influenced by the coupled processes of gas migration and coalbed deformation. The dual mechanisms of coupled flow and deformation on CBM recovery have attracted a great deal of attention and has led to significant achievements [
10]. A range of studies have assessed how high-pressure water injection into a coalbed will influence the desorption capacity of CH
4 because of residual moisture [
5,
11,
12,
13]. This process can also improve coalbed permeability although gas output is also influenced by high pressures as moisture content increases [
14,
15]. Additional technologies, including carbon dioxide enhanced coalbed methane (CO2-ECBM) and coalbed heating, can also be utilized for CBM exploitation [
16,
17]; all these methods improve gas production and break original adsorption and desorption equilibrium states to create very large discrepancies between experimental processes and engineering practice [
18].
To describe how desorption volumes gradually decrease with the amount of injected water, it is necessary to understand both pore size and the volume distribution law within this field. This is because pores and fissures are good places for gas and water to co-exist. Coal bodies can therefore both swell and shrink during adsorption and desorption due to porous features [
19,
20,
21,
22]. Different pore structures and fractal laws within coal have different adsorption and desorption capacities as macro pores have significant impacts on gas flow in both bituminous and subbituminous coals. This means that the higher the macro-porosity, the better the gas flow capability [
23,
24,
25].
For the pore size distribution law about porous media, it is widely used in all industry area such as agroindustrial waste, sludge, as well as coal. Some meso testing methods like X-ray computed tomography, mercury intrusion porosimetry(MIP), petrographic analysis, ultrasonic, nuclear magnetic resonance, and scanning electron microscopy have been used [
26,
27,
28]. These technologies are all valuable to analysis or evaluate the pore size distribution properties of porous materials.
In two-phase coalbed flow, moisture content decreases as pore specific volume increases as measured using nuclear magnetic resonance cytophotometry [
29,
30]. Gas desorption and transport within the coal matrix has also been illustrated to be a non-linear phenomenon, and therefore a modified version of Fick’s diffusion model called the density model has been proposed and some experiments have been performed [
17,
31,
32]. A complex two-phase flow process within coal is induced by porosity and pore size distribution once water is injected into CH
4 bearing coalbeds [
33,
34]. From the above contents, there is a research gap between gas desorption or production capacity and pore size distribution that needs to be addressed.
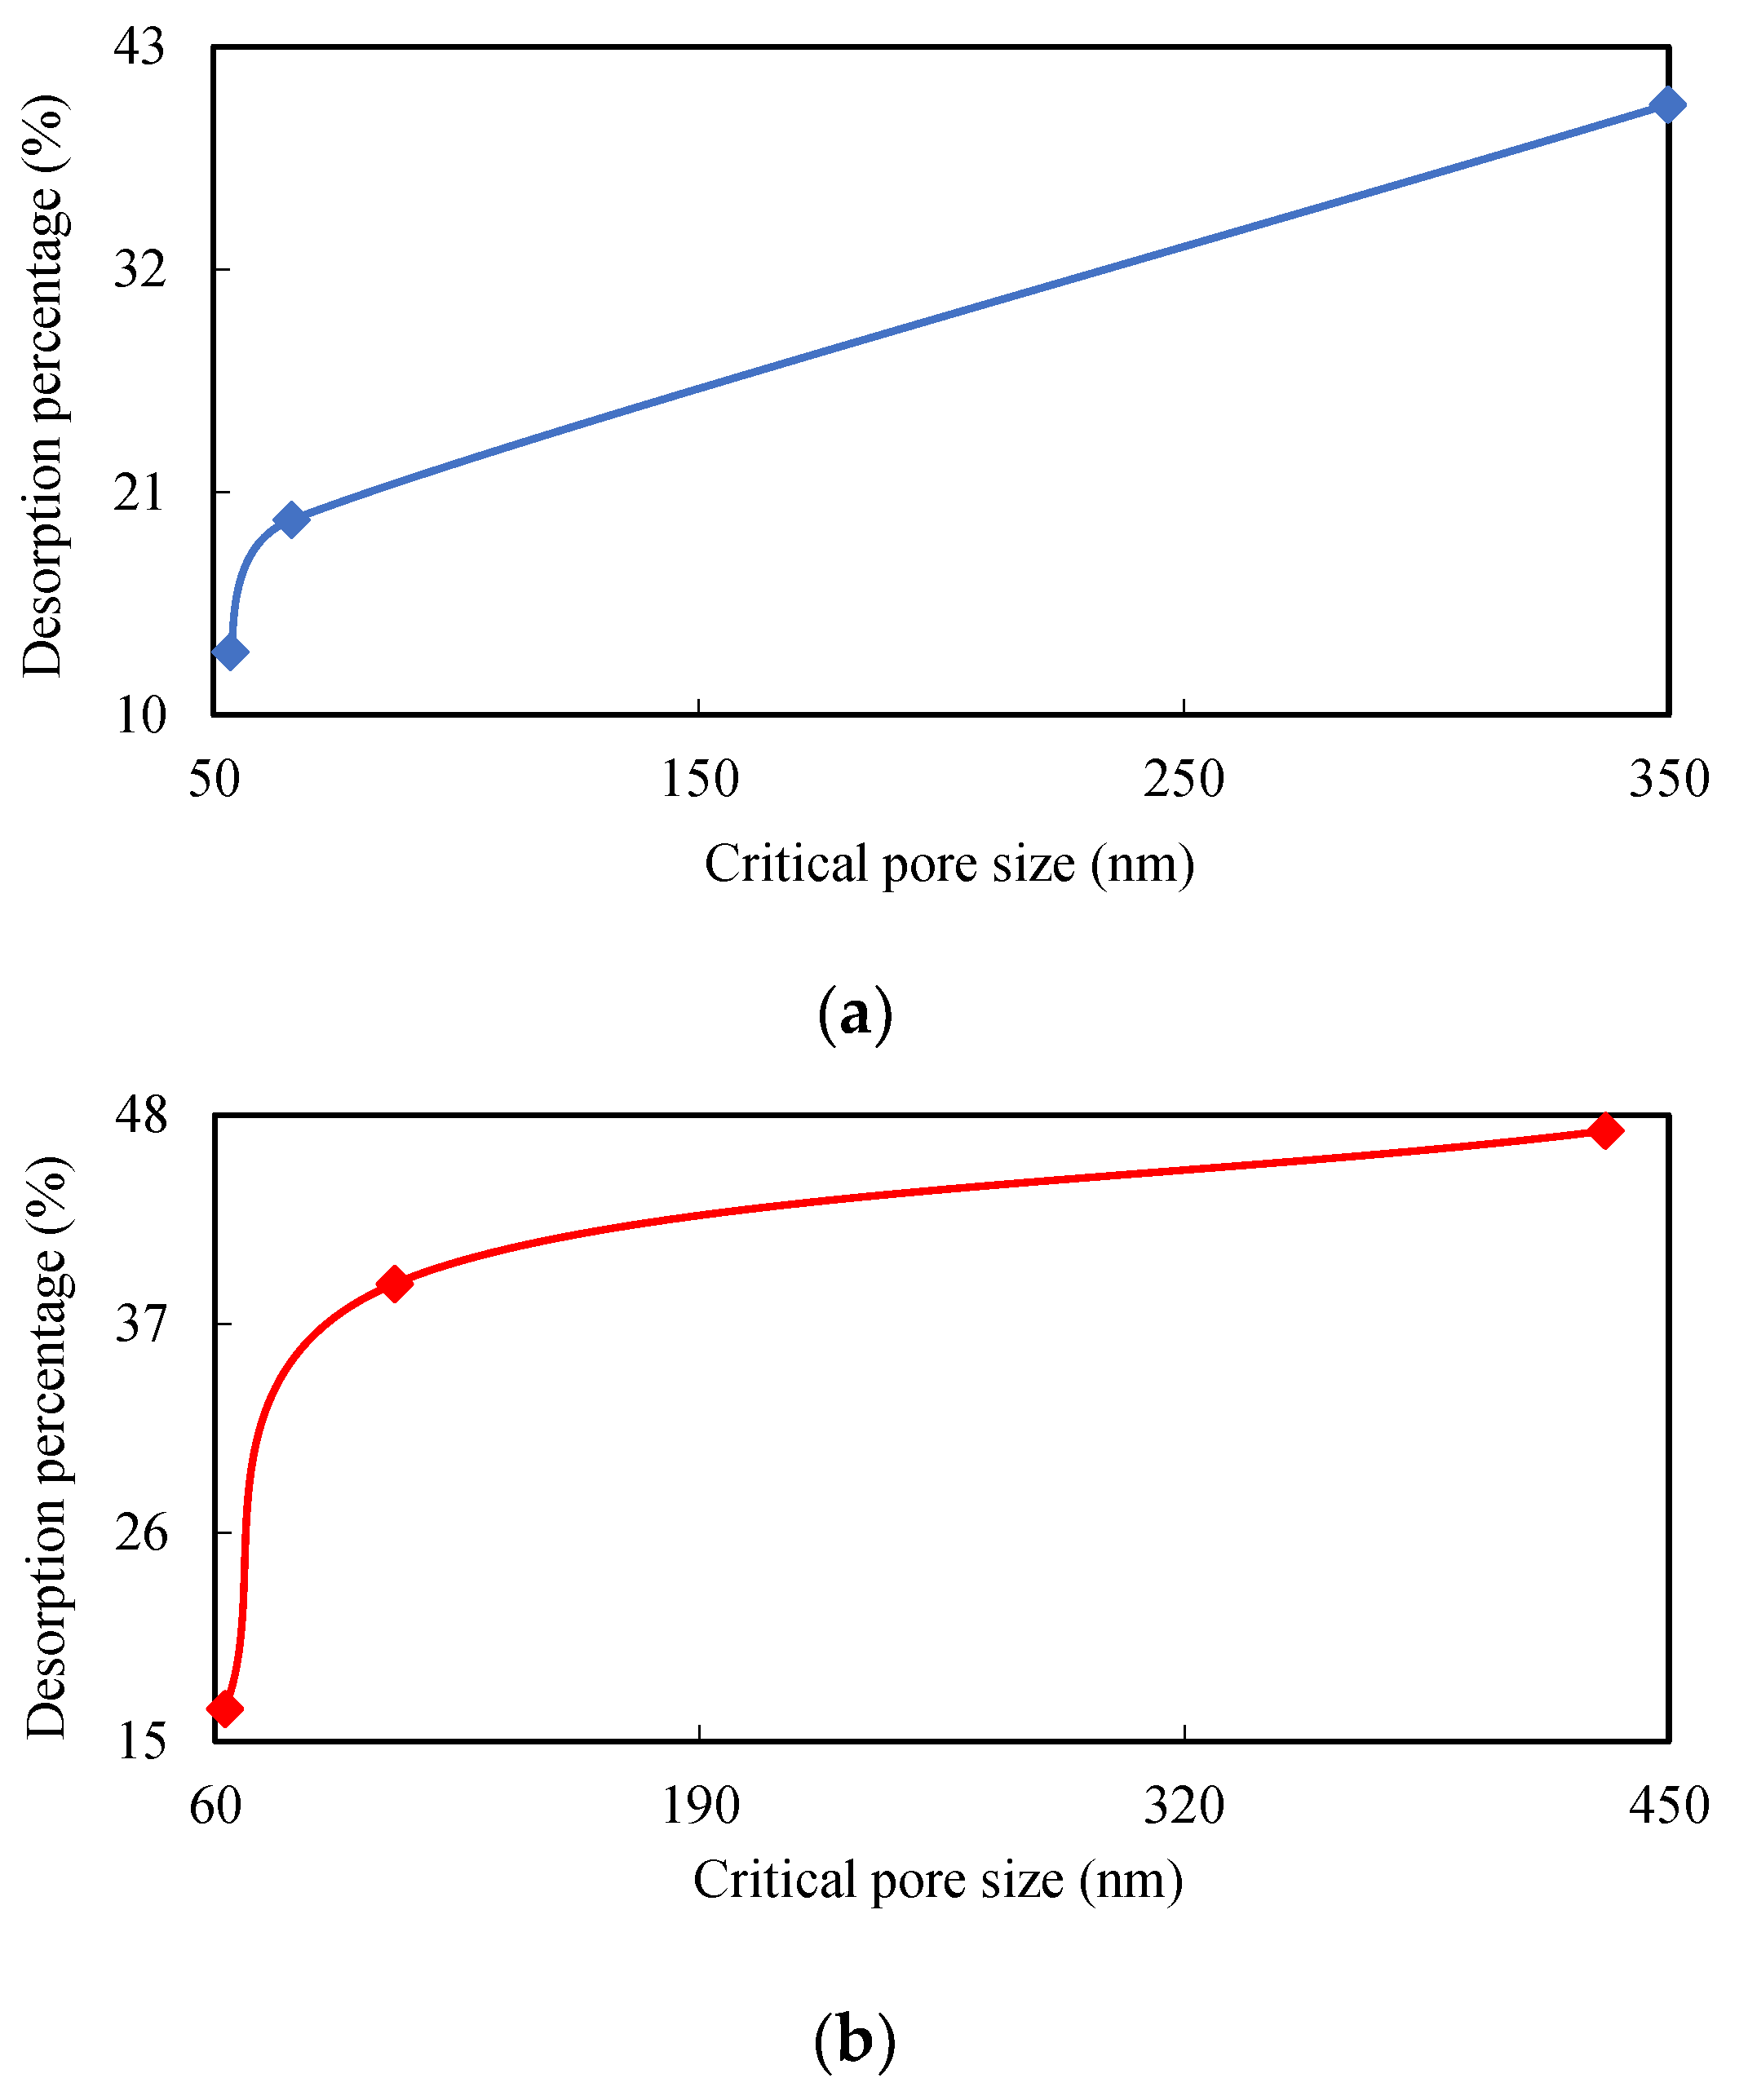
Two ranks of coal samples were used in this study in a series of desorption experiments at different water injection pressures combined with mercury intrusion porosimetry (MIP) measurements to study the relationship between desorption law and pore size distributions. A critical pore size has been established combining two-phase flow in coal as a new parameter to describe high pressure water effects as components of gas desorption.
The aim of this study is to predict gas and water flows within coalbeds as these variables are dependent on adsorbed gas and high-pressure water. We also reveal the underlying distribution laws controlling both two-phase flow and seepage.
2. Theoretical Study
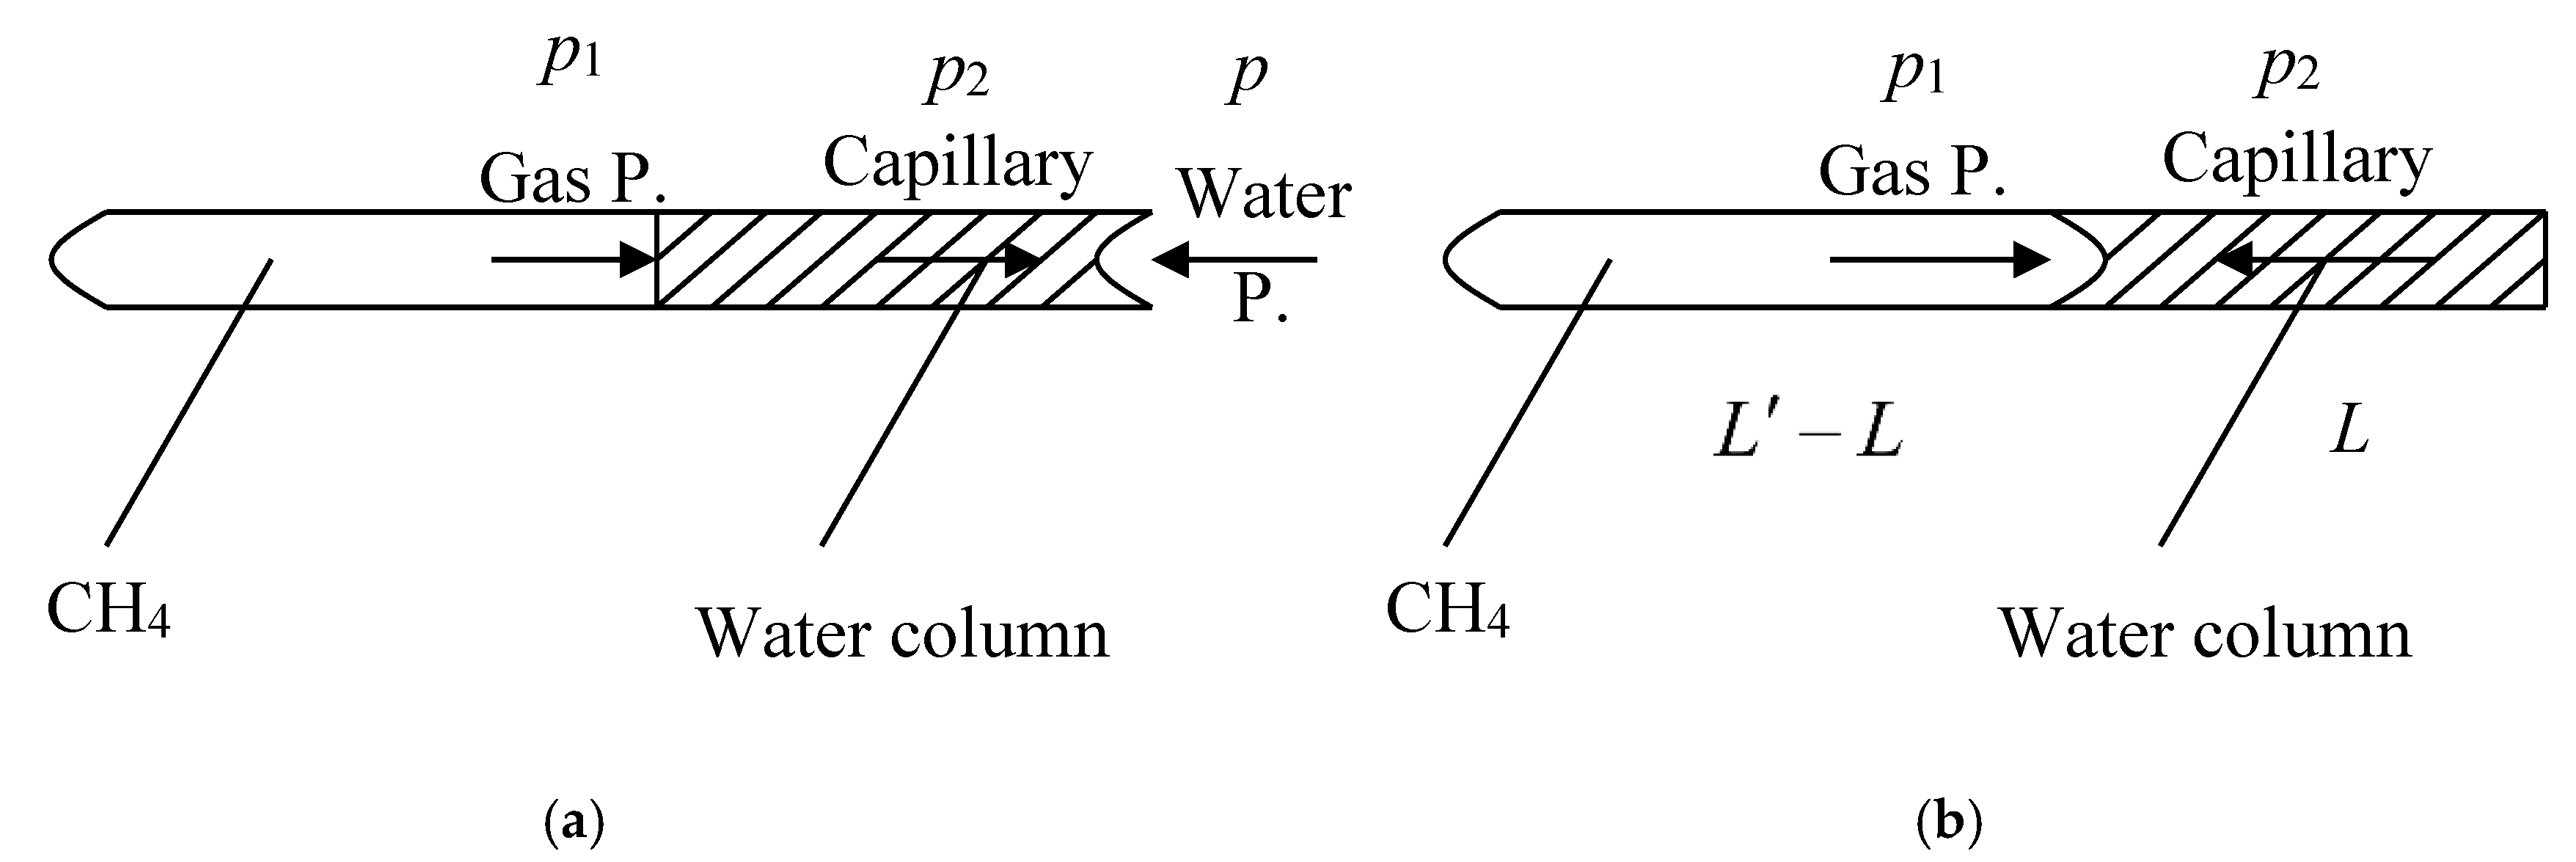
The tube used in this study was an imaginary tube and made from coal material with one side open and the other closed with measurable length and inner diameter parameters. The gas CH
4 was then passed into this tube under pressure while water was injected from the open side. Equilibrium was reached in this case depending on water pressure, length, and the inner diameter of the tube. The relationship between water injection and gas pressures conforms to Equation (1) [
35,
36] as
Gas pressure within the tube will be greater than the capillary force when water flow is reversed as pressure is unloaded. Thus, if gas pressure in the tube is equal to capillary force, the relationship between these two variables will conform to Equation (2) as
The interactions between gas and water are summarized in
Figure 1.
Combing Knudsen number which representing gas diffusion type, Knudsen number (Kn) is equal to molecular average free path divide by average diameter of pore [
37]. For gas diffusion in pores, if Kn is less than 0.1, it obeys Knudsen diffusion; if Kn is more than 10, it obeys Fick diffusion; if Kn is between the above two numbers, it obeys intermediate state diffusion.
Water injection pressure remains constant throughout this process (
Figure 1) as the initial gas pressure in the tube is less than this corresponding variable. A water column is formed within the tube as this process continues, and capillary force increases as this structure expands in concert with gas pressure as volume decreases. Assuming no exchange of matter and that temperature remains constant, the ideal gas state Equation (3) should be formed as
The volume decrease rate in this case is equal to the pressure increase rate while capillary tension induced by water column depends on the length of the water column and is reversed versus the diameter of the tube. These variables conform to Equation (5) as
As the volume of the water in the tube is equal to length multiply by cross-sectional area, it therefore follows that
Thus, building on Equations (1) and (4) to (6), it therefore follows that
Equation (7) denotes the relationship between the water injection pressure, length of the water column, and the cross-sectional area of the tube under initial gas pressure conditions such that lengths remain constant.
As shown in
Figure 1b, transient gas pressure within the tube is greater than capillary tension once water pressure is unloaded. The water column was then displaced with gas to reverse the water injection side, while at the same time, column length was decreased as both gas movement and pressure increase with closed volume. Capillary tension always existed before the water column moved out of the tube; thus, assuming gas pressure within the tube is equal to the capillary tension of water, Equation (2) could be modified as
and
Equations (8) and (9) can therefore be combined as
Substituting Equation (10) into Equation (7), it therefore follows that
Equation (11) represents a new model that expresses critical pore size D [D equal to ] in cases where water is injected into coalbeds.
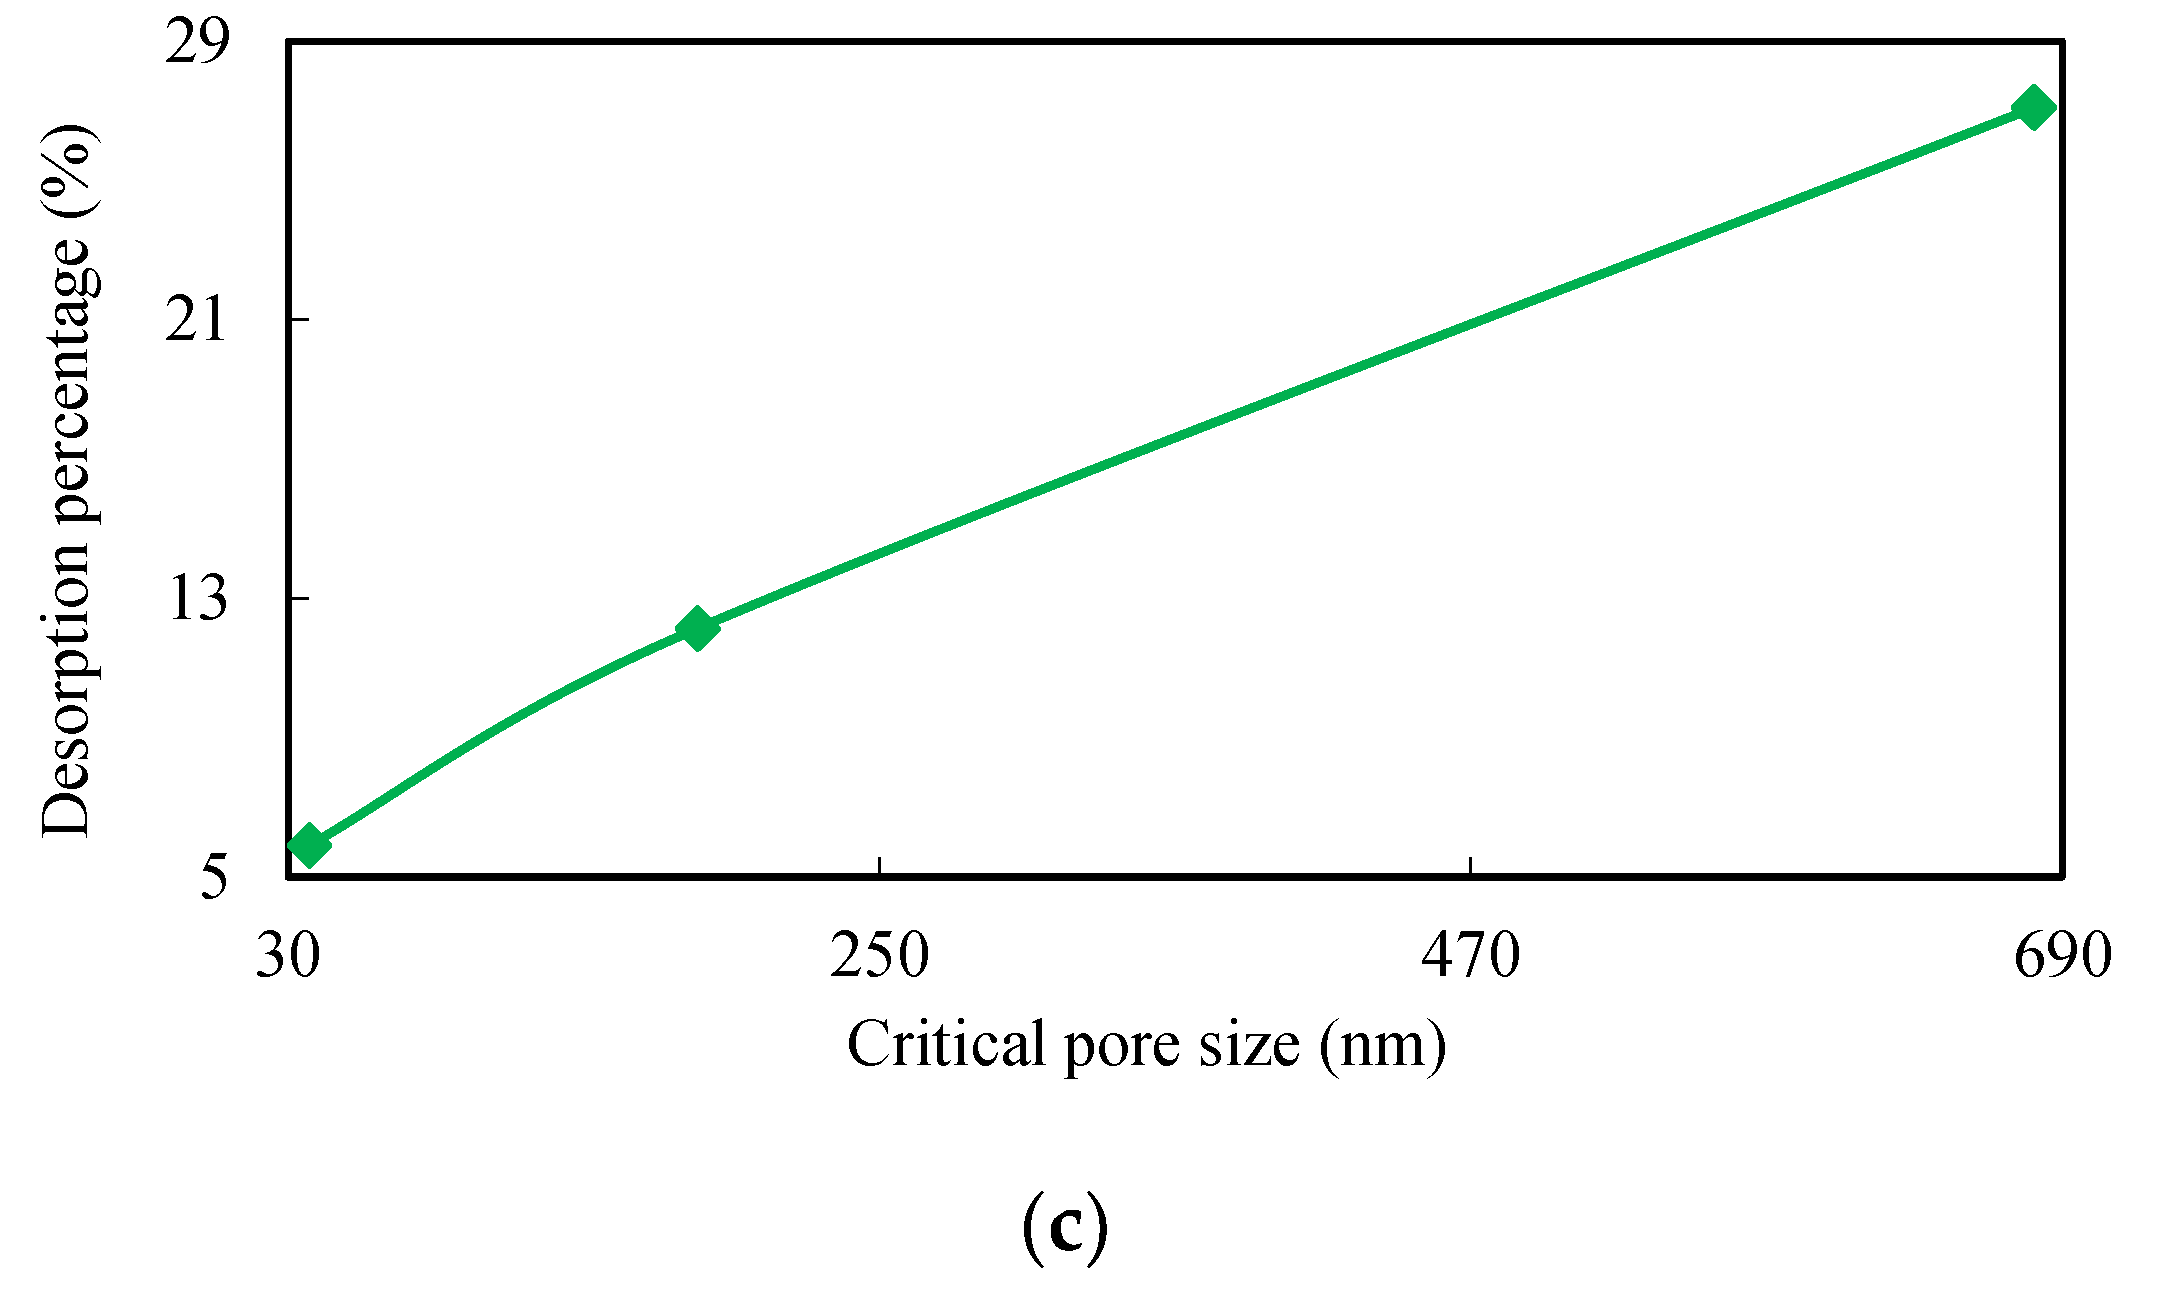
Figure 1 shows the relationship between water column movement and the length of water column in each tube; this latter structure will disappear during experiments are determined by water injection pressure via gas desorption. Indeed, capillary tension is also affected by inner tube diameter; data show that critical pore size for water injection into coalbeds depends on water injection pressure. Whether or not capillary tension is greater than gas pressure depends on the nature of the water column and increases in capillary tension. Water in coals moves out of pores and fissures once water pressure is unloaded and this depends on column length and gas pressure. In terms of equilibrium state, water is always present in pores and adsorbent gases cannot be desorbed through this way at constant atmospheric pressures and temperatures. This phenomenon results in a gas desorption capacity that decreases as water pressure increases even though some adsorbed gas remains in coal. A higher water injection pressure leads to a similar distribution of pores and fissures in coal; in other words, the greater the length of the residual water column in a coalbed, the less gas is desorbed.
3. Methodology
3.1. Samples
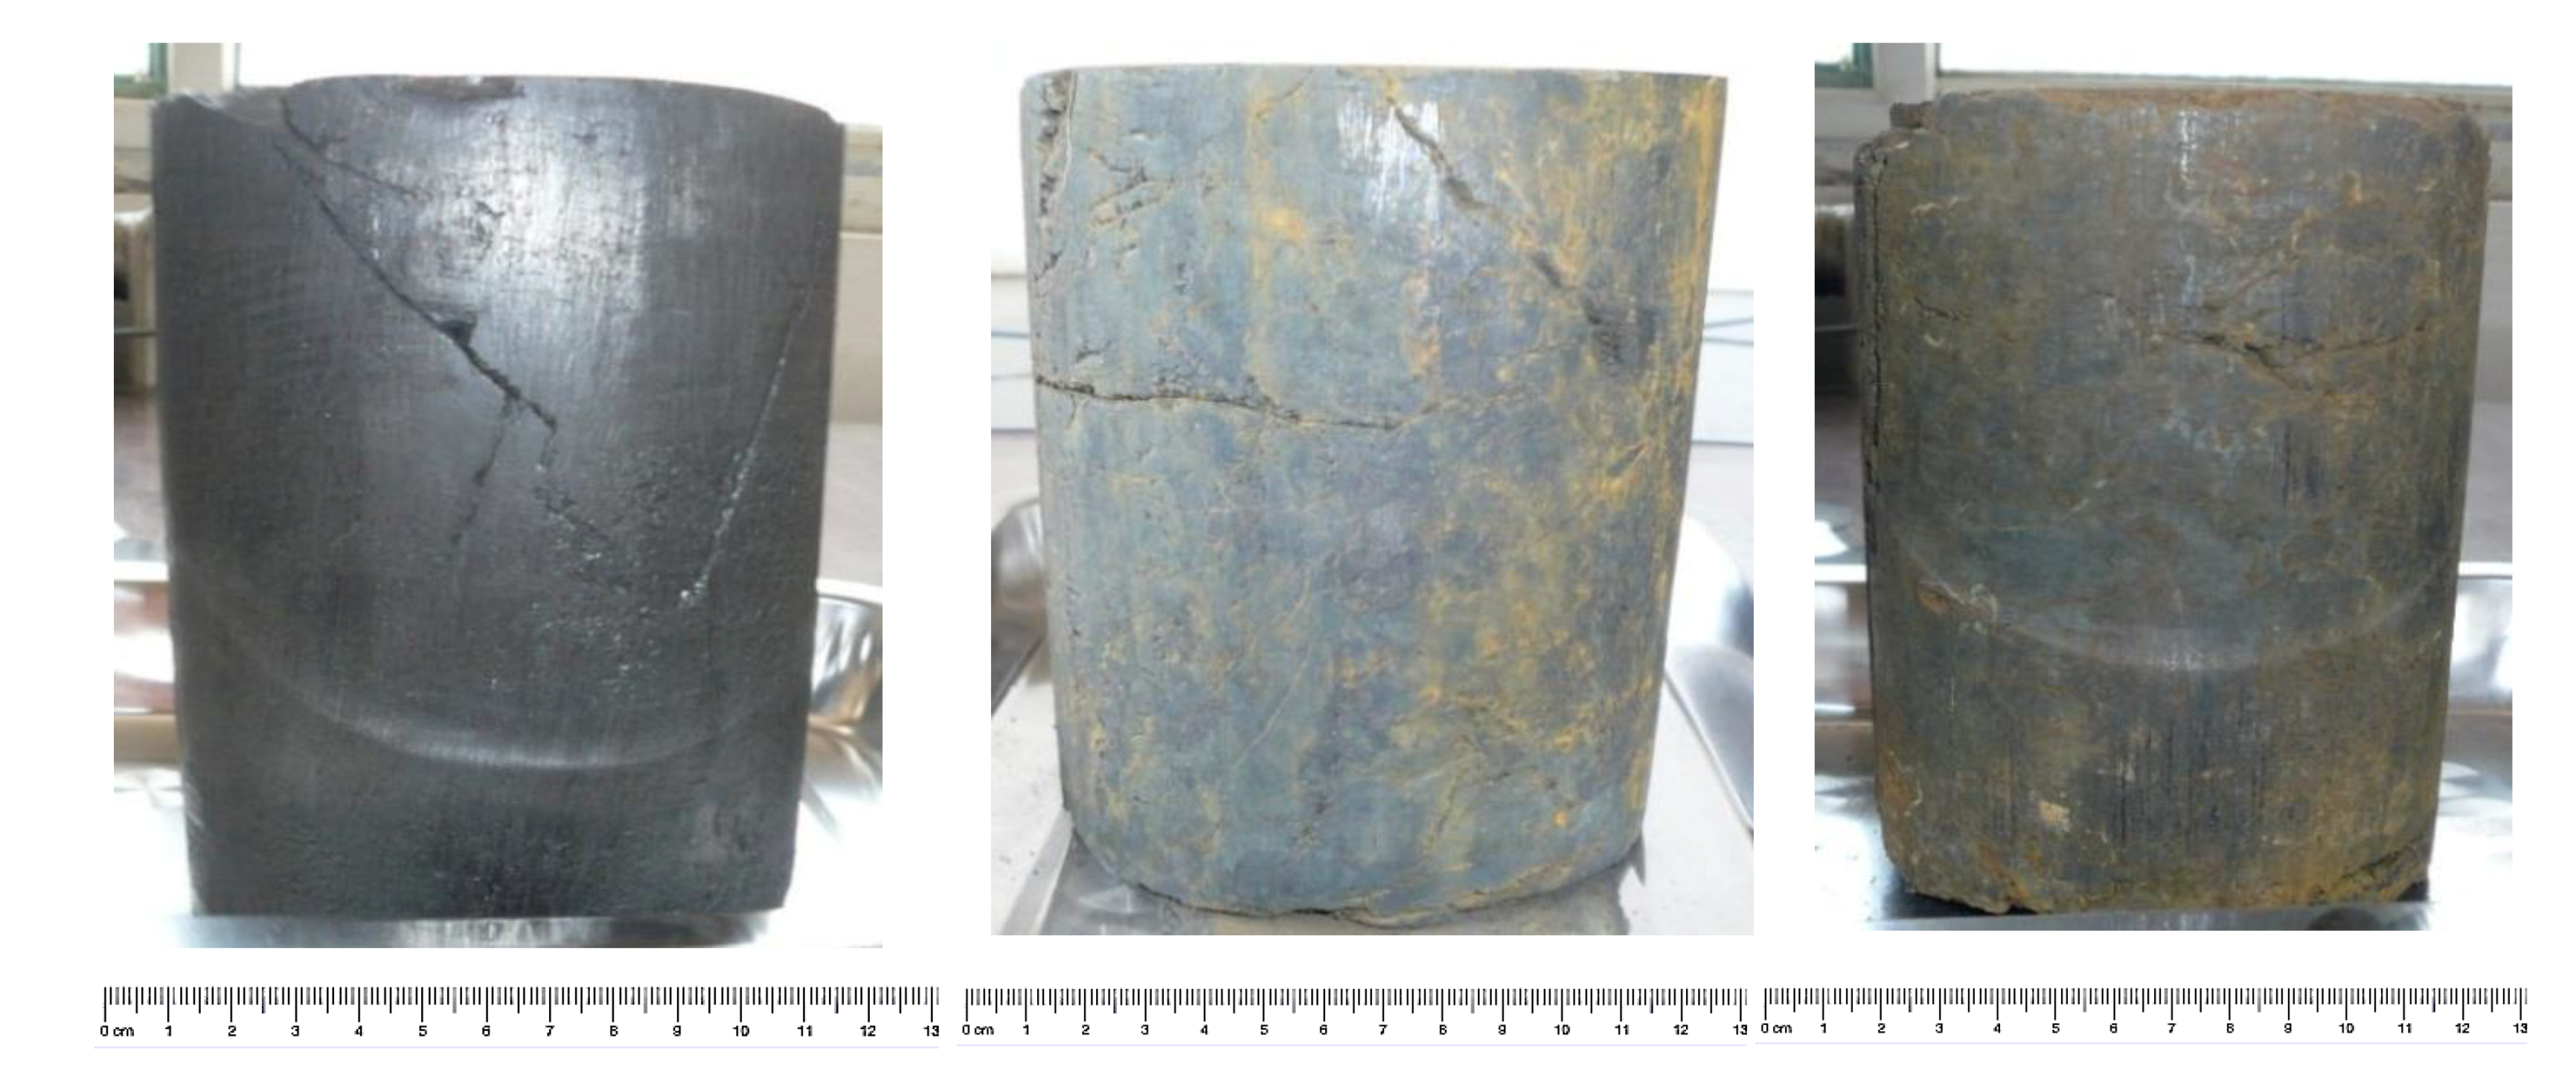
The samples used in this study taken from No. 3 Coalbed within the Tunliu Mine in Lu’an District and from the No. 9 Coalbed in Kaiyuan Mine within Yangquan District. The first set of samples comprise lean coal while the latter is anthracite; in each case, three cylindrical lumpy coal pieces 100 mm in diameter and 150 mm in height were machined using an abrasive wire sawing machine (DL5640, Delong CNC Equipment Co. ltd., Taizhou, Jiangsu Province, China) (samples are illustrated in
Figure 2 and the abrasive wire sawing machine is illustrated in
Figure S1 of Supplementary). As these lumpy coals contain both raw pores and fissures, they are suitable for in situ simulations; samples were numbered as lean coals 1-1 and 1-2 for analysis at different equilibrium gas adsorption pressures. Similarly, the anthracites were numbered as 2-1; prior to each experiment, samples were placed in a dryer for between 12 and 16 h at 106 °C to completely evaporate all moisture.
MIP was used in this study to illustrate pore sizes and the structural distribution of different coal ranks at the microscale. Once the distribution of pore sizes and structural characteristics were assessed using MIP, they were compared with adsorption and desorption experiments on lumpy coal. These samples were then machined into small cubes that weighed between 1.0 and 1.5 g in each case. The coal sample from Tunliu Mine was marked as Sample 1 while its counterpart from Kaiyuan Mine was marked as Sample 2. Proximate and elemental analyses, vitrinite reflectance, and the definition of coal rank were performed for all samples (
Table 1).
3.2. Experimental Apparatus
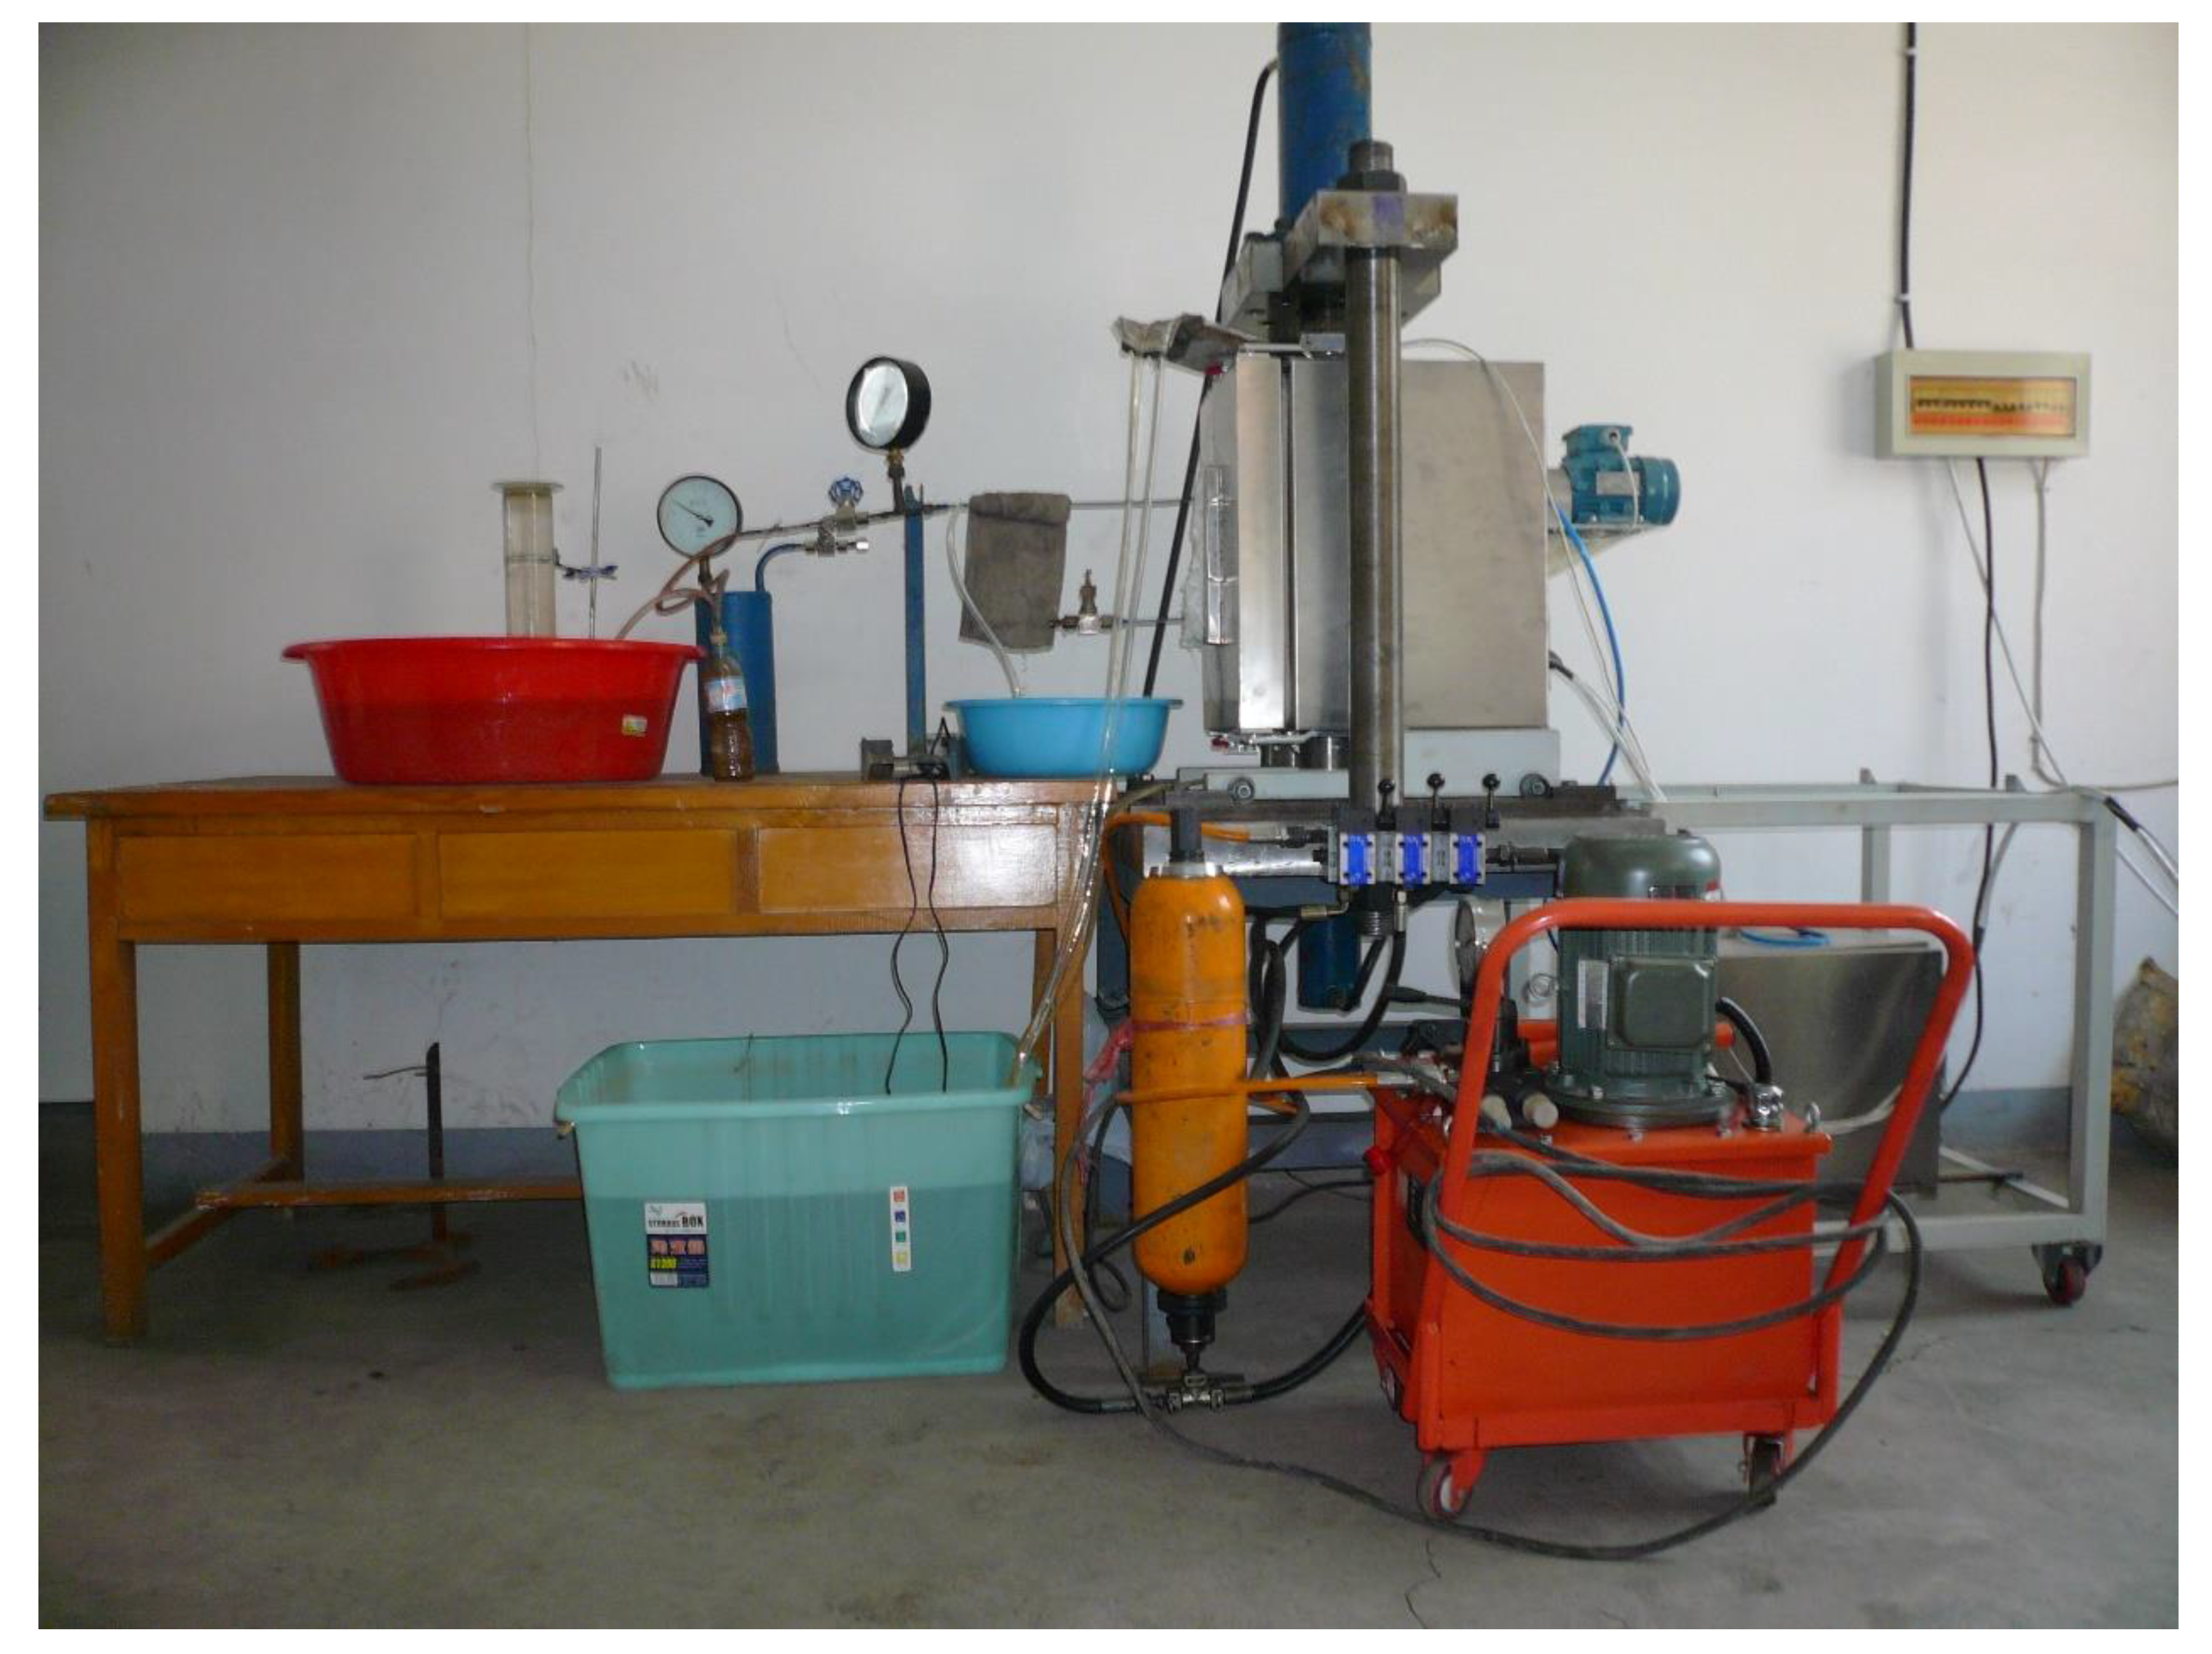
We developed an experimental system to study the adsorption and desorption characteristics of coal mass samples and to carry out simulated water injection CBM experiments. This set-up includes a stainless-steel container that can withstand pressures up to 20 MPa and that has top and bottom openings with flexible seals. The upper part is used to inject and produce gas while the bottom part is used to inject water; a columnar coal sample is then placed inside the container which is surrounded by a temperature-controlled air bath. Water injection and gas production components within this system are similar to an in situ gas production project because of the presence of water injection and gas production wells. These coal mass samples therefore simulate an ideal coal bed following hydro-fracture. Although gas usually desorbs rapidly, once water has been injected, this process slows down and becomes less efficient. A series of experiments were therefore performed at different water pressures to determine desorption behavior (
Figure 3). We have previously reported detailed information about this apparatus [
13].
3.3. MIP Procedures
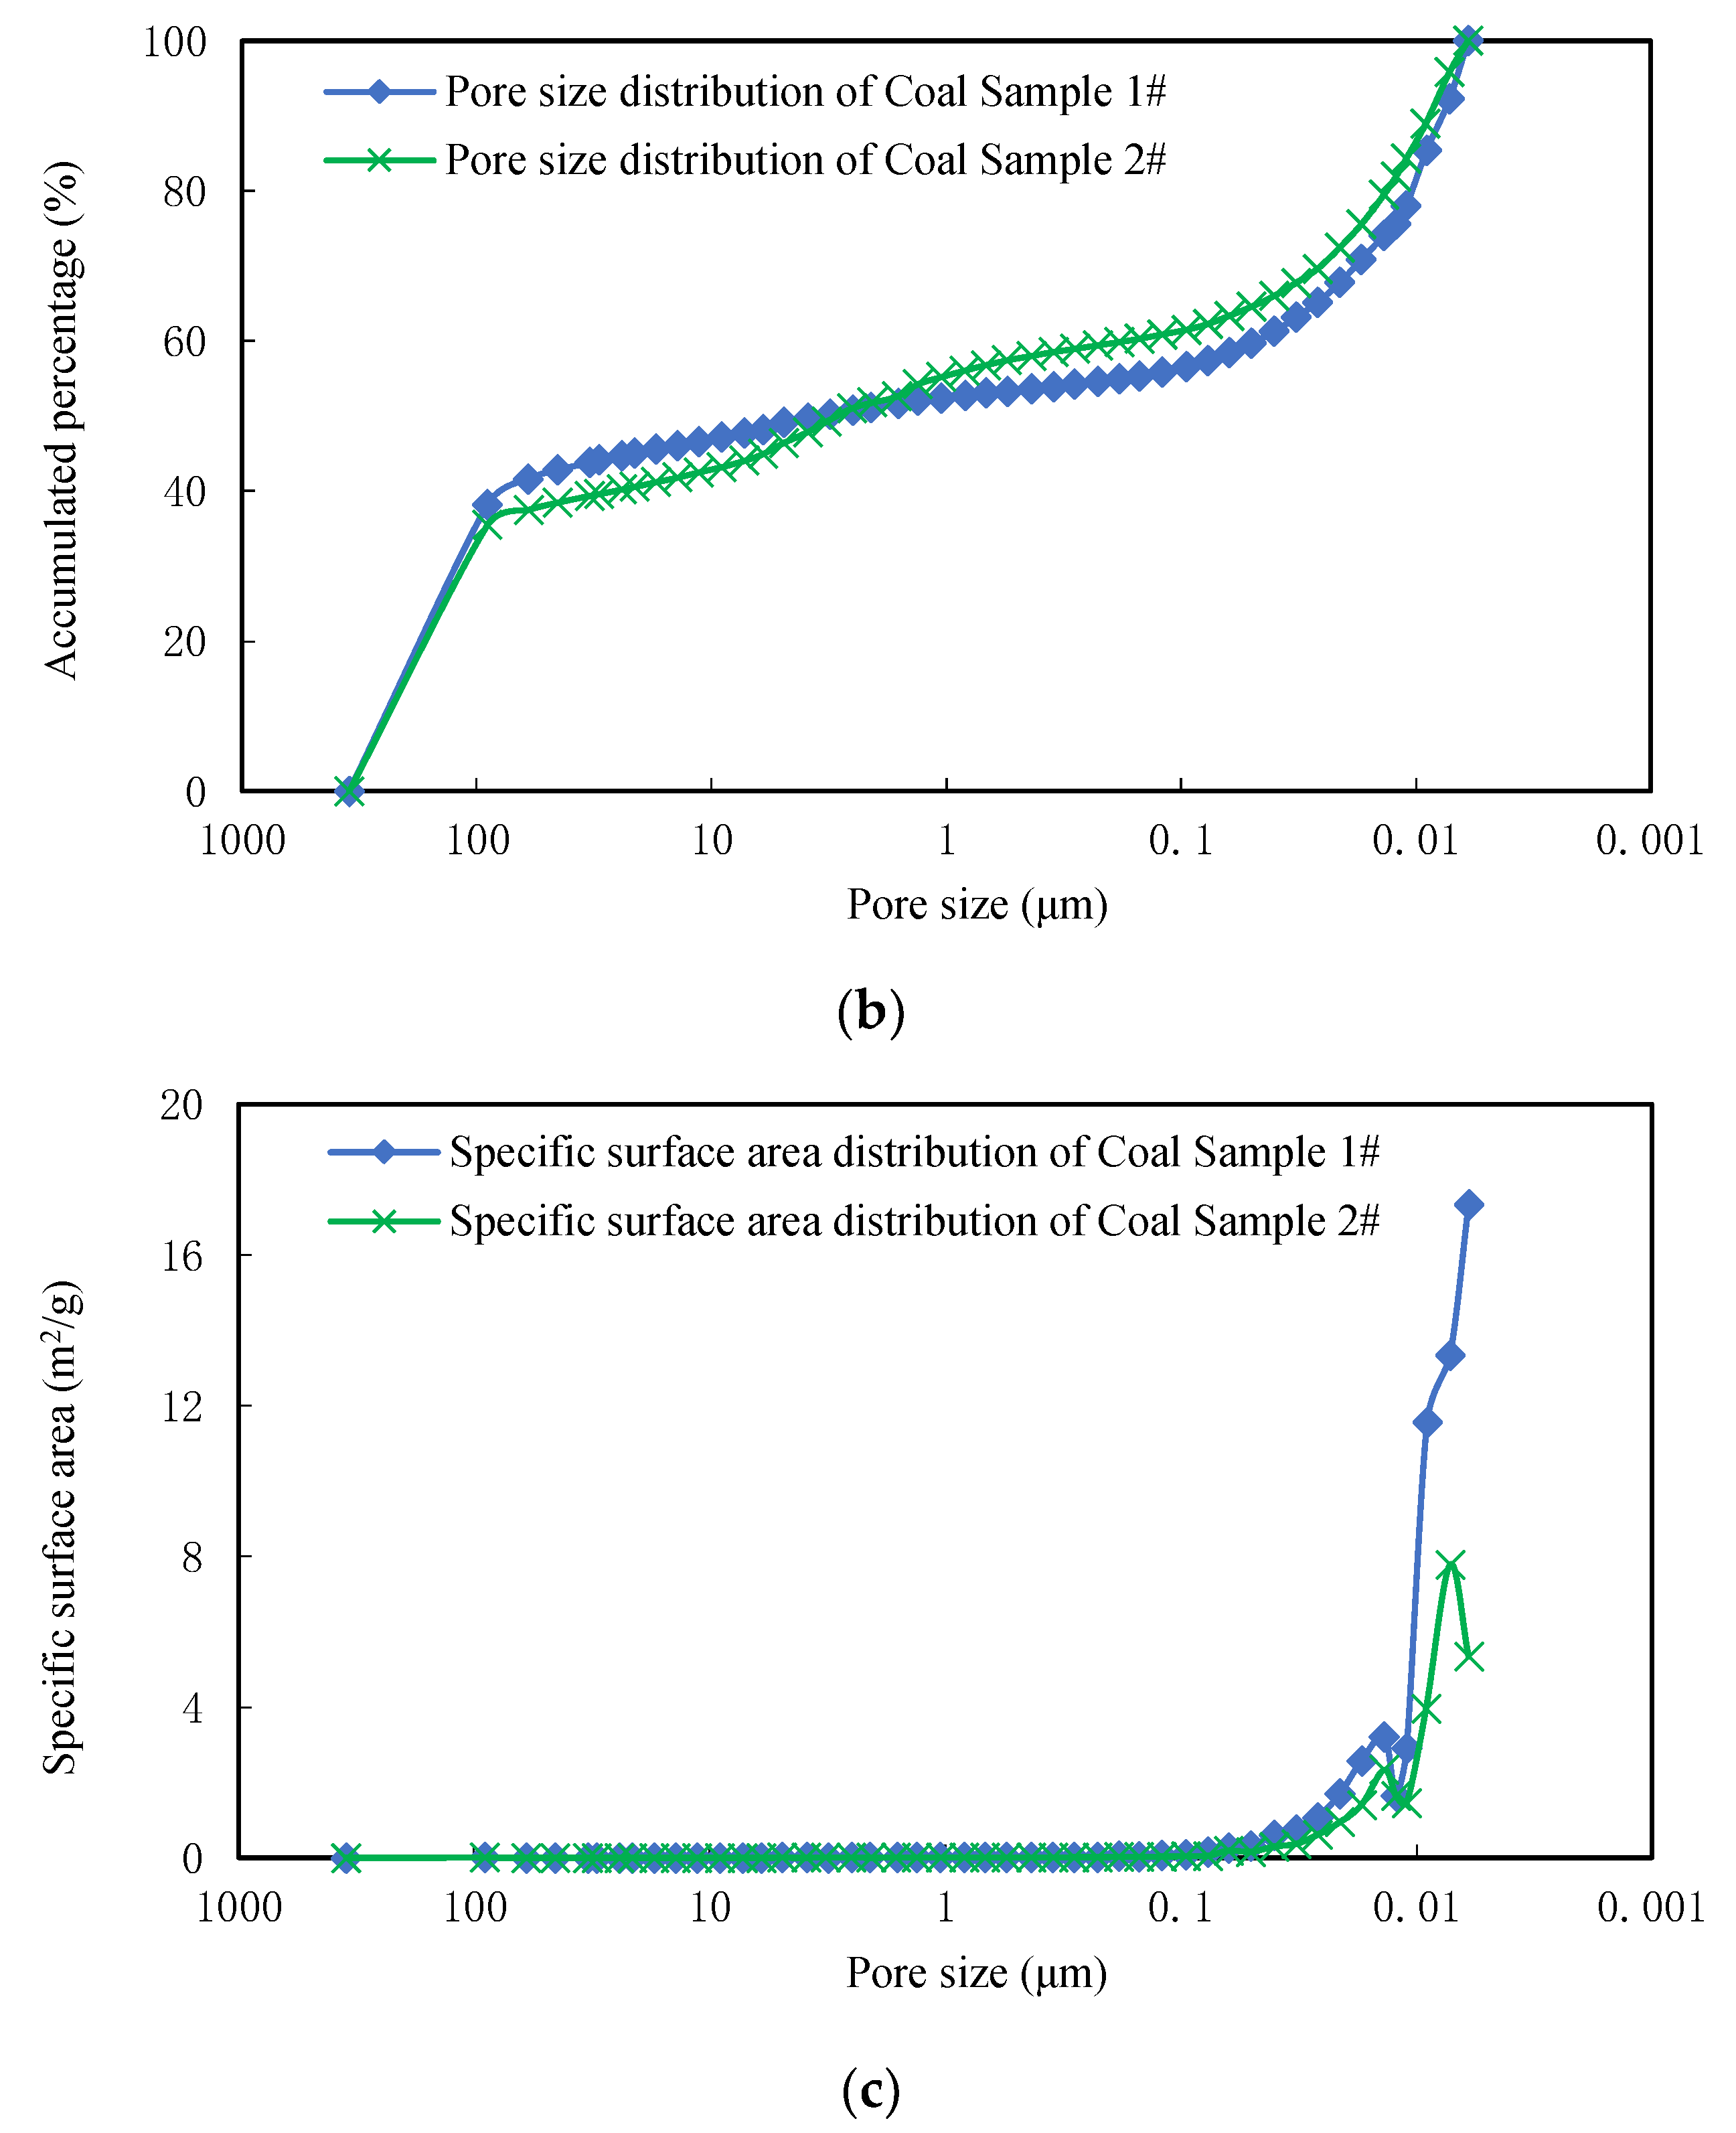
MIP measurements were made using a porosity instruments (Model 9310, Micromeritics Instruments Co. Ltd., Norcross, GA, USA) at working pressure between 0.0035 and 206.843 MPa, a resolution ratio of 0.1 mm3, a sample tube volume of 5.1669 cm3, and a minimum 6 nm pore size. The weight of Sample 1 was 1.1207 g while the weight of Sample 2 was 1.1430 g. Samples were placed in a dryer for 12 h at 90 °C and vacuumed prior to all experiments.
For an error analysis on MIP measurements, there are two hypotheses based on Washburn’s equation: one is all of the pores are cylinder, and the other is all of the pores could be connected to the surface of sample [
38]. Then, pore form, contact angle, and surface tension are all caused theoretical errors. Beyond this, system factors such as interspace, compressibility of mercury and sample are all caused results errors. Interspace is the space between the sample and tube, it is gradually increased with the mercury pressure increased. There is a compressibility factor about mercury and sample, and it is variated with pressure changed. So, based on these potential errors in MIP measurements, we can reduce the errors to the minimum in rigid operating instruction.
Pore size was calculated using mercury intrusion pressure and accumulated volume in nm-scale units [
39]. Pore volume was then equated to accumulated mercury volume, in units of mL/g, while specific surface area was calculated from pore size and volume, assuming these structures at spherical. The relationship between pore size and mercury intrusion volume conforms to Equation (12) as
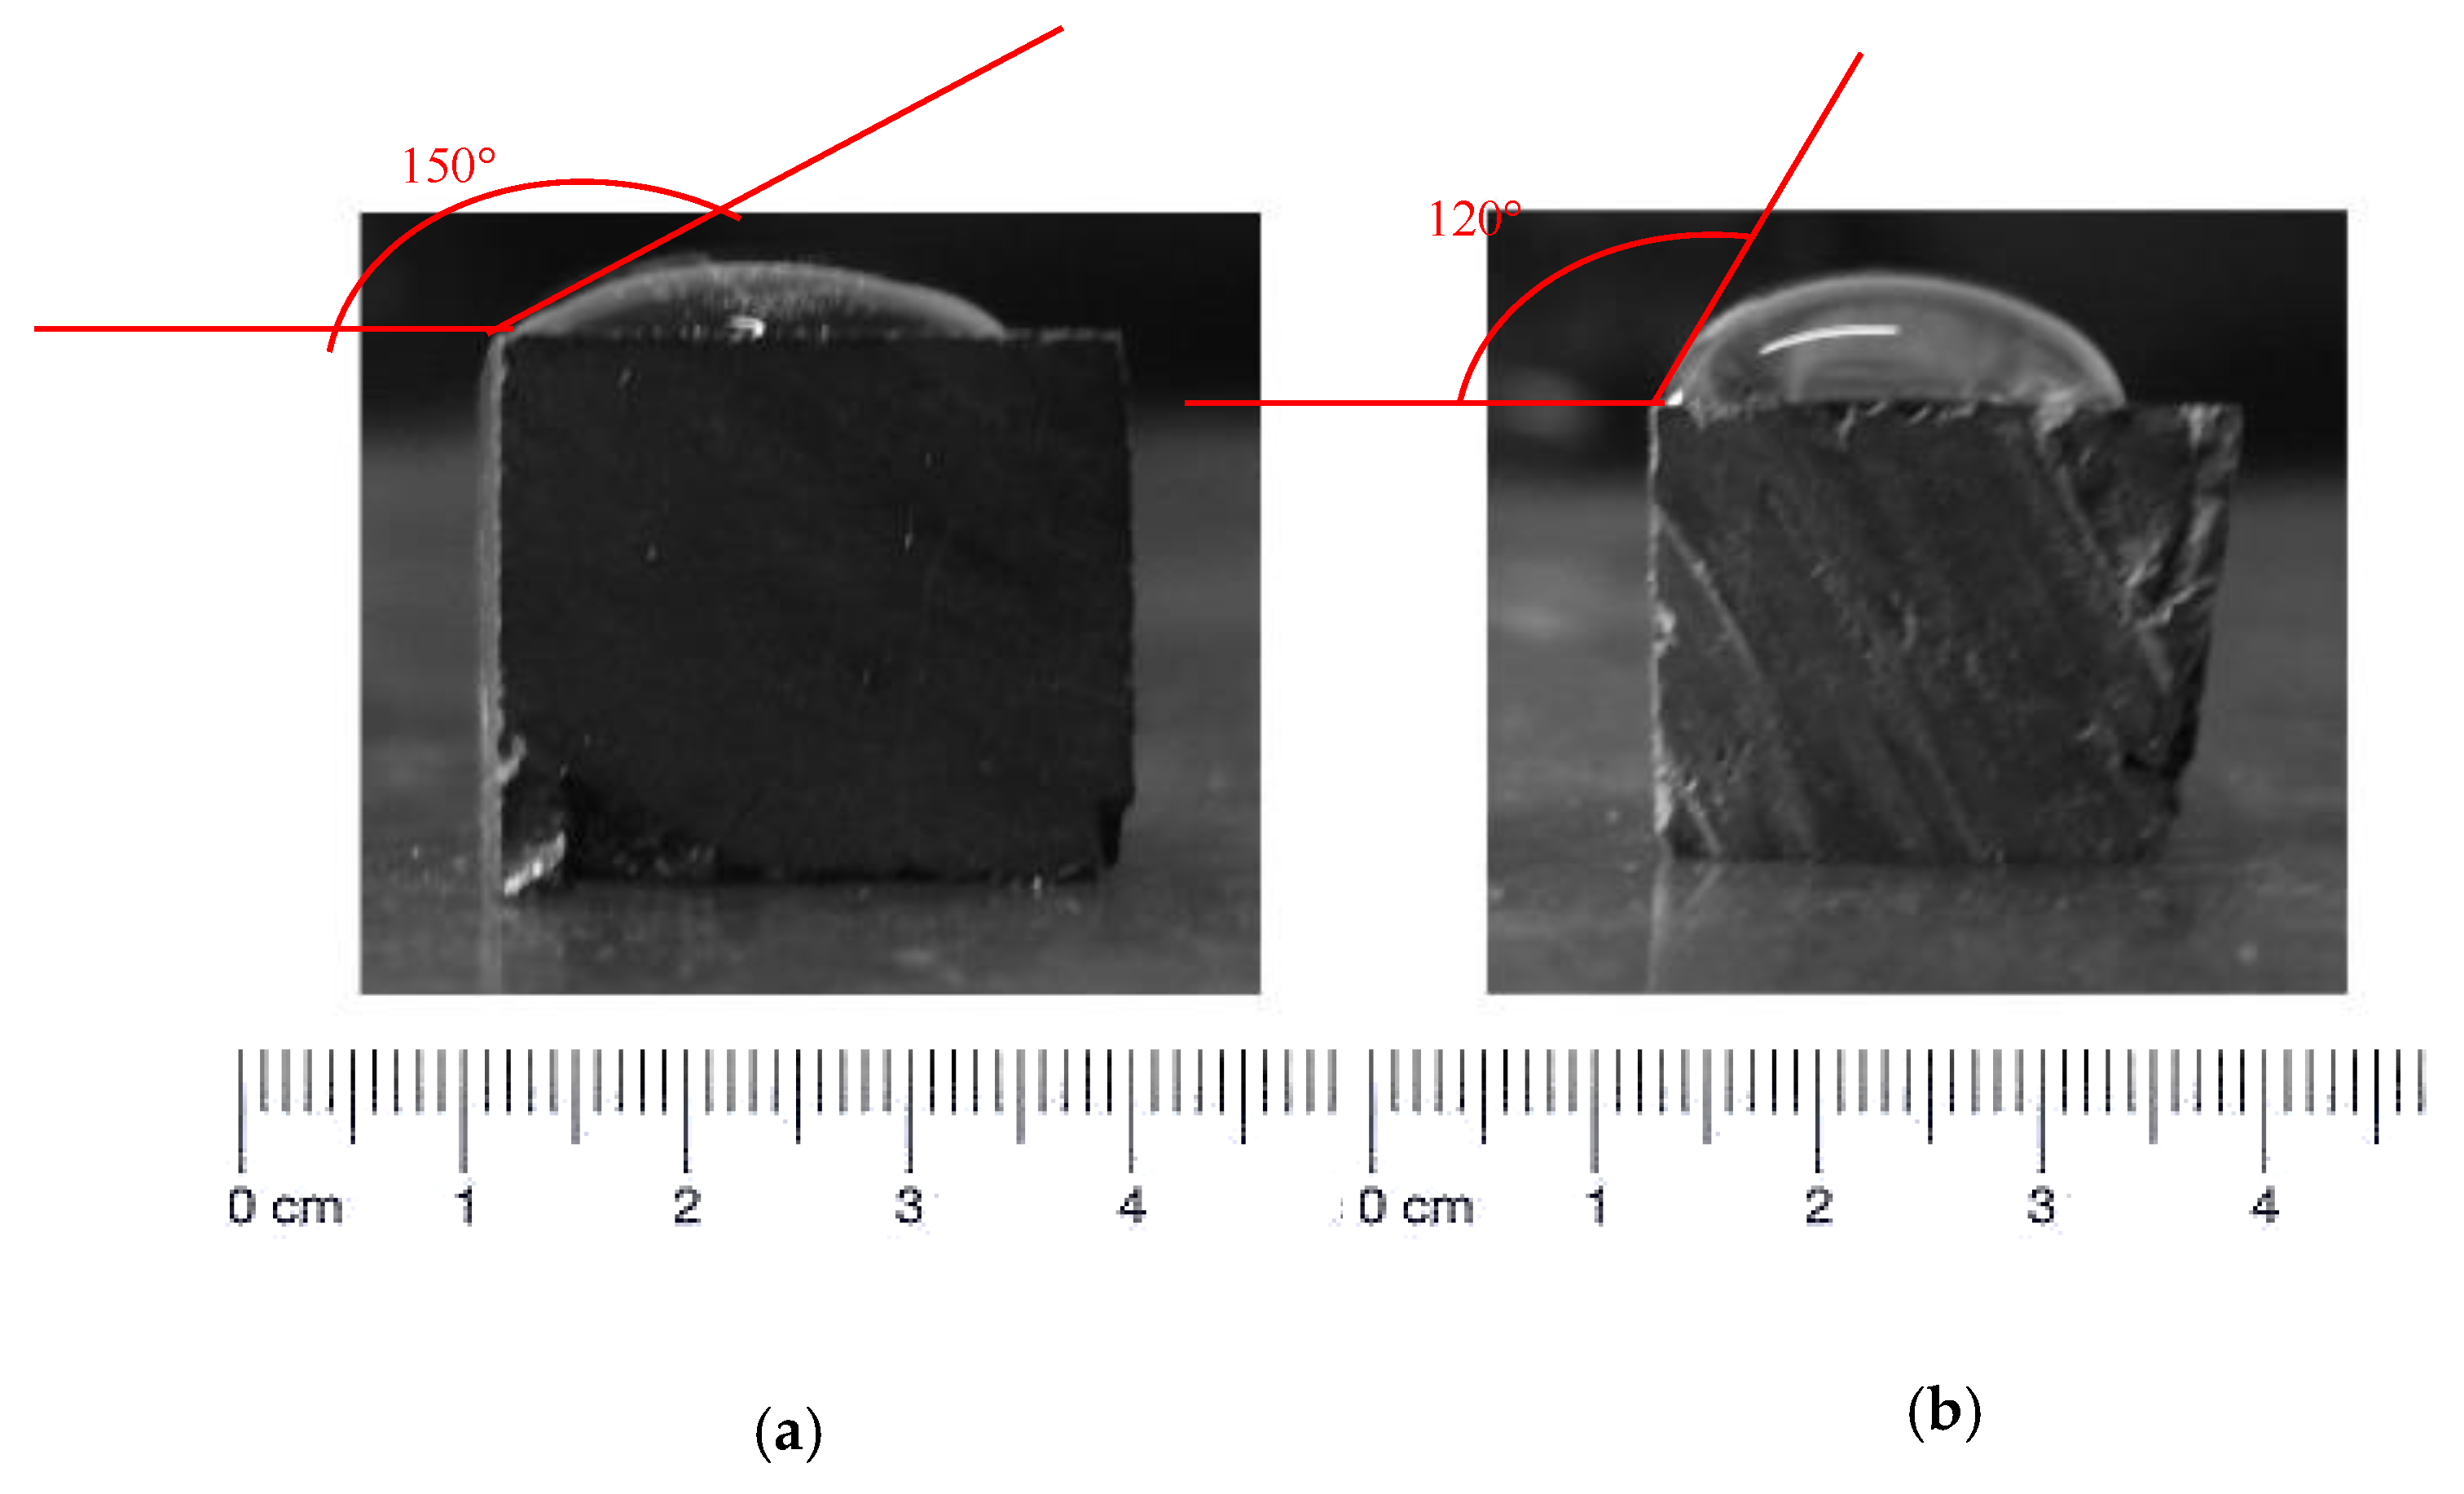
For mercury, α equal to 142° for the two samples.
3.4. Experimental Procedures
Samples were placed in an adsorption-water injection–desorption apparatus at 25 °C equivalents to simulate coal reservoir temperature. The free volume of coal in containers was measured prior to experiments while the procedures used in this study can be divided into three steps.
The first step of this process comprises adsorption, checking the airtight nature of the experimental device using high-pressure helium for more than 48 h. The valve was then opened to connect gas and sample containers so that coal sample could adsorb gas, a process which lasted between three days and seven days until gas pressure was constant. The rated adsorption pressure and change during the adsorption process was recorded using a digital gauge.
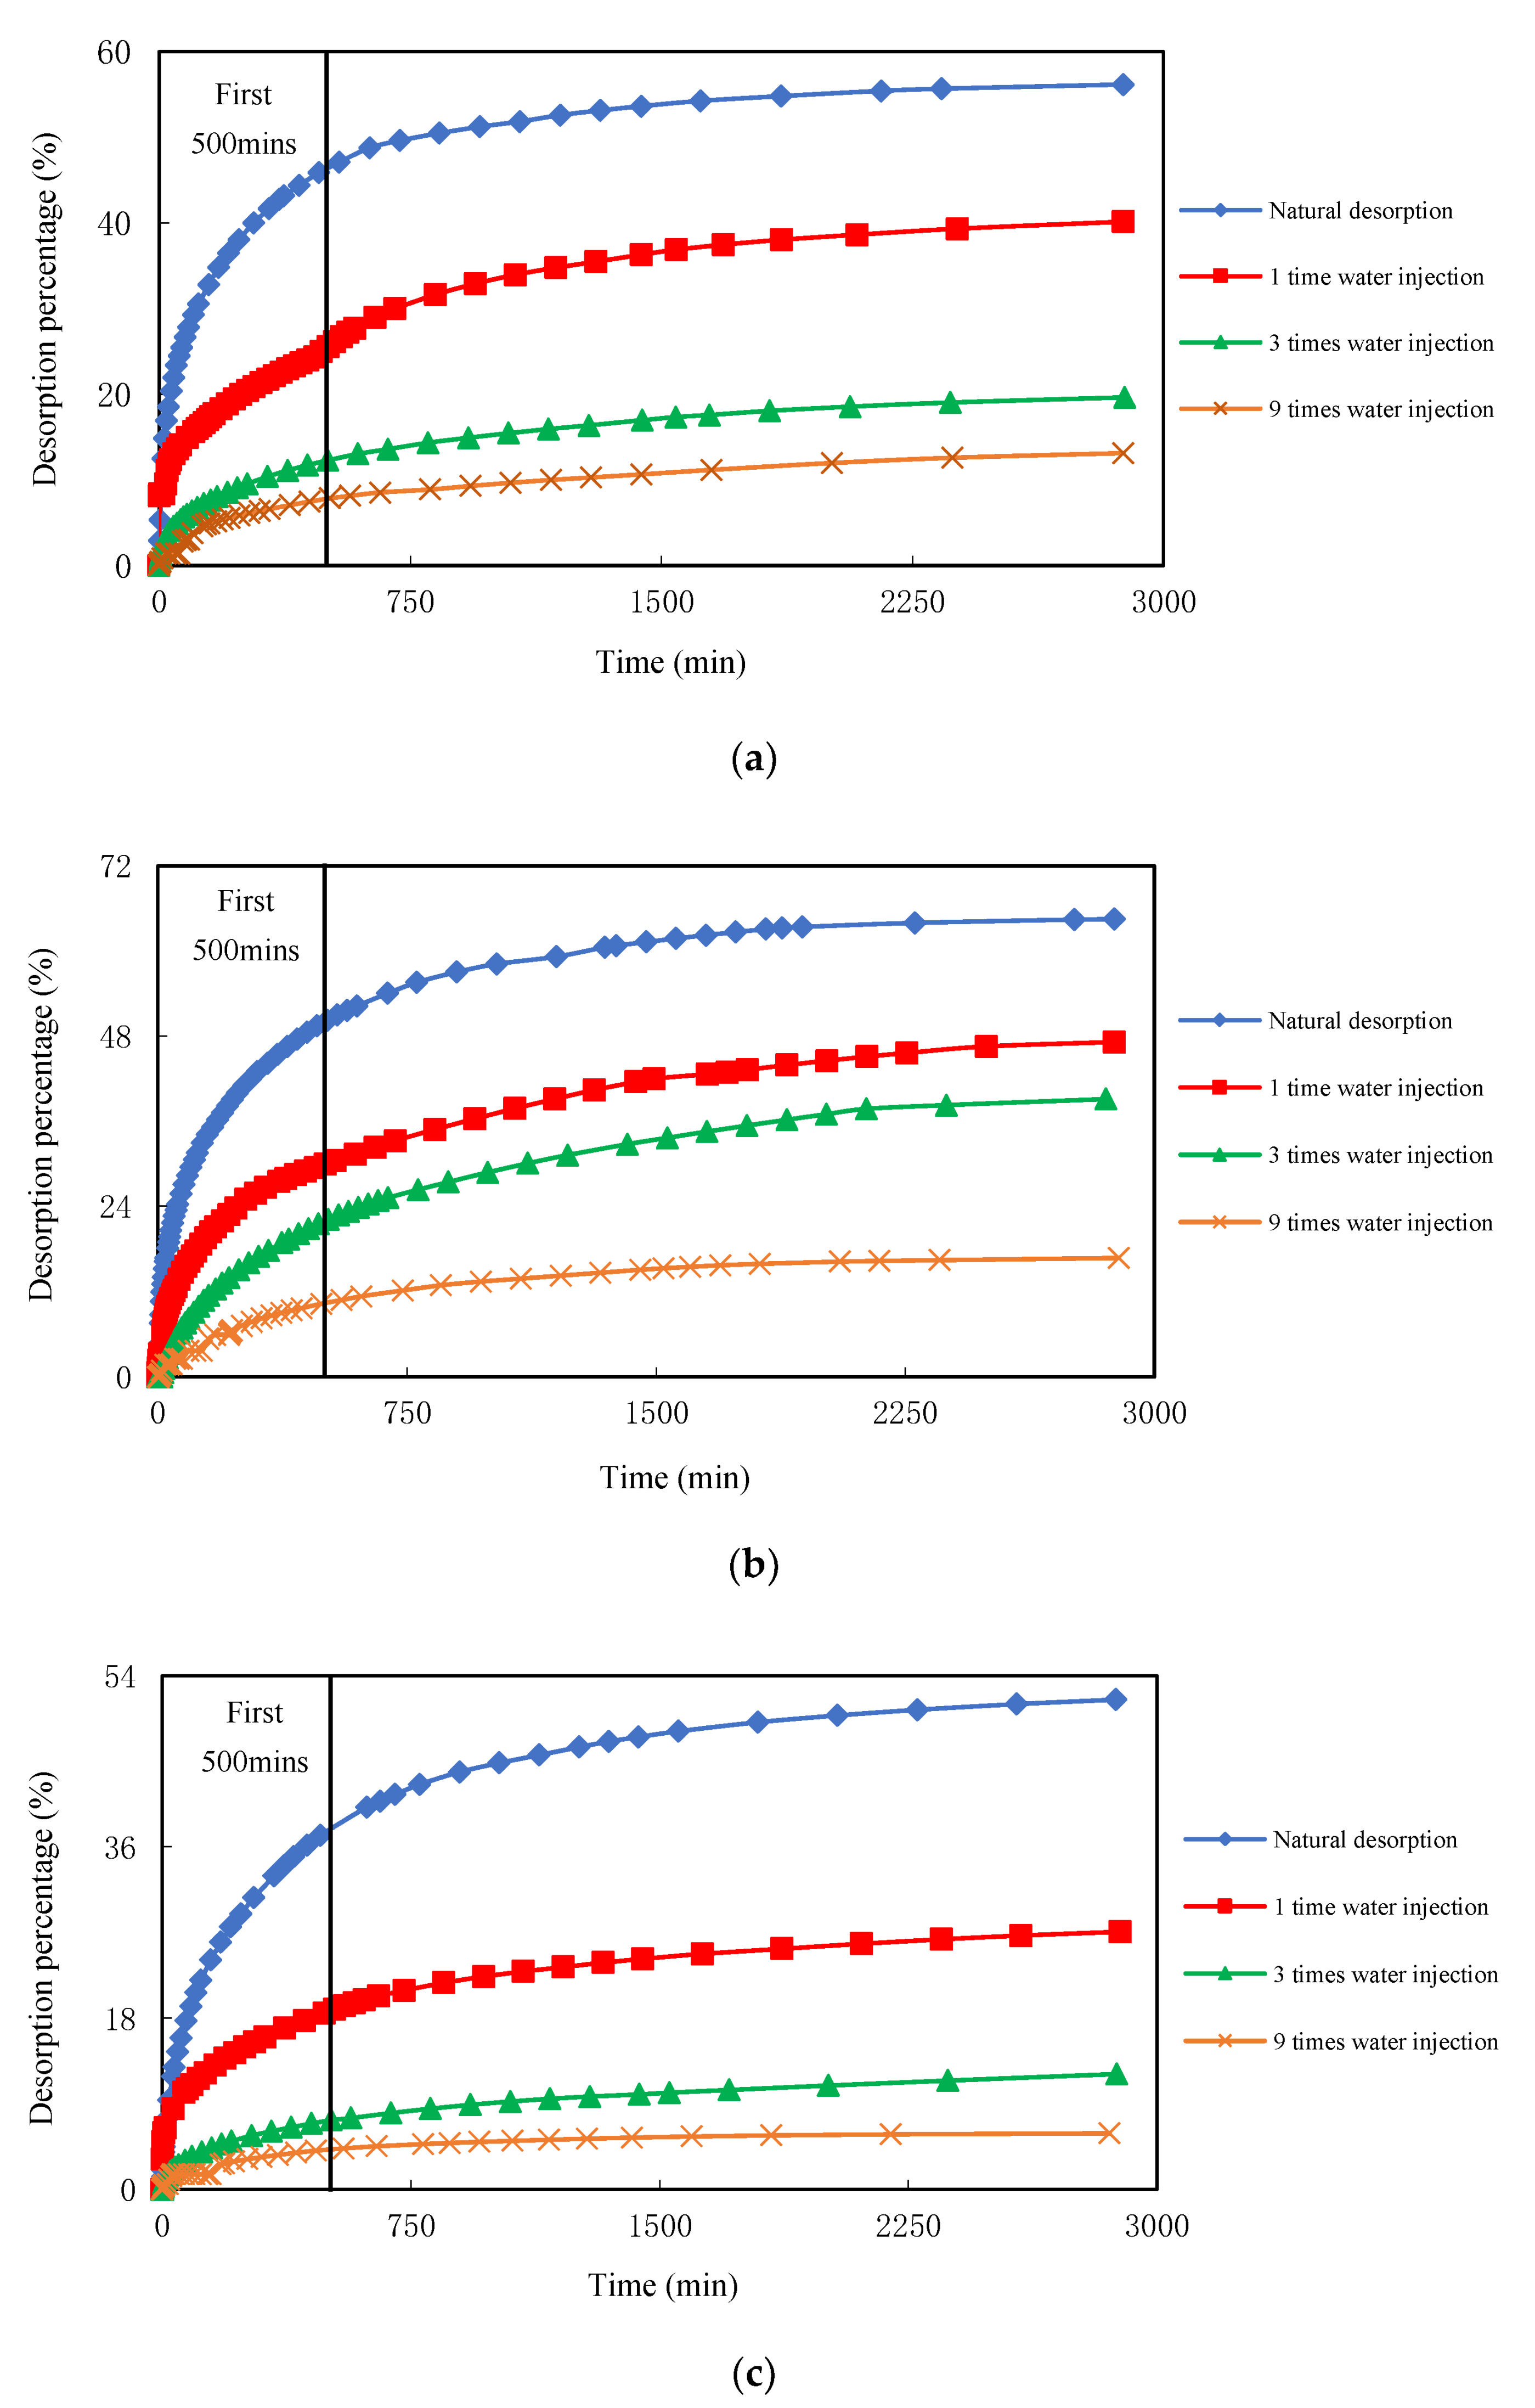
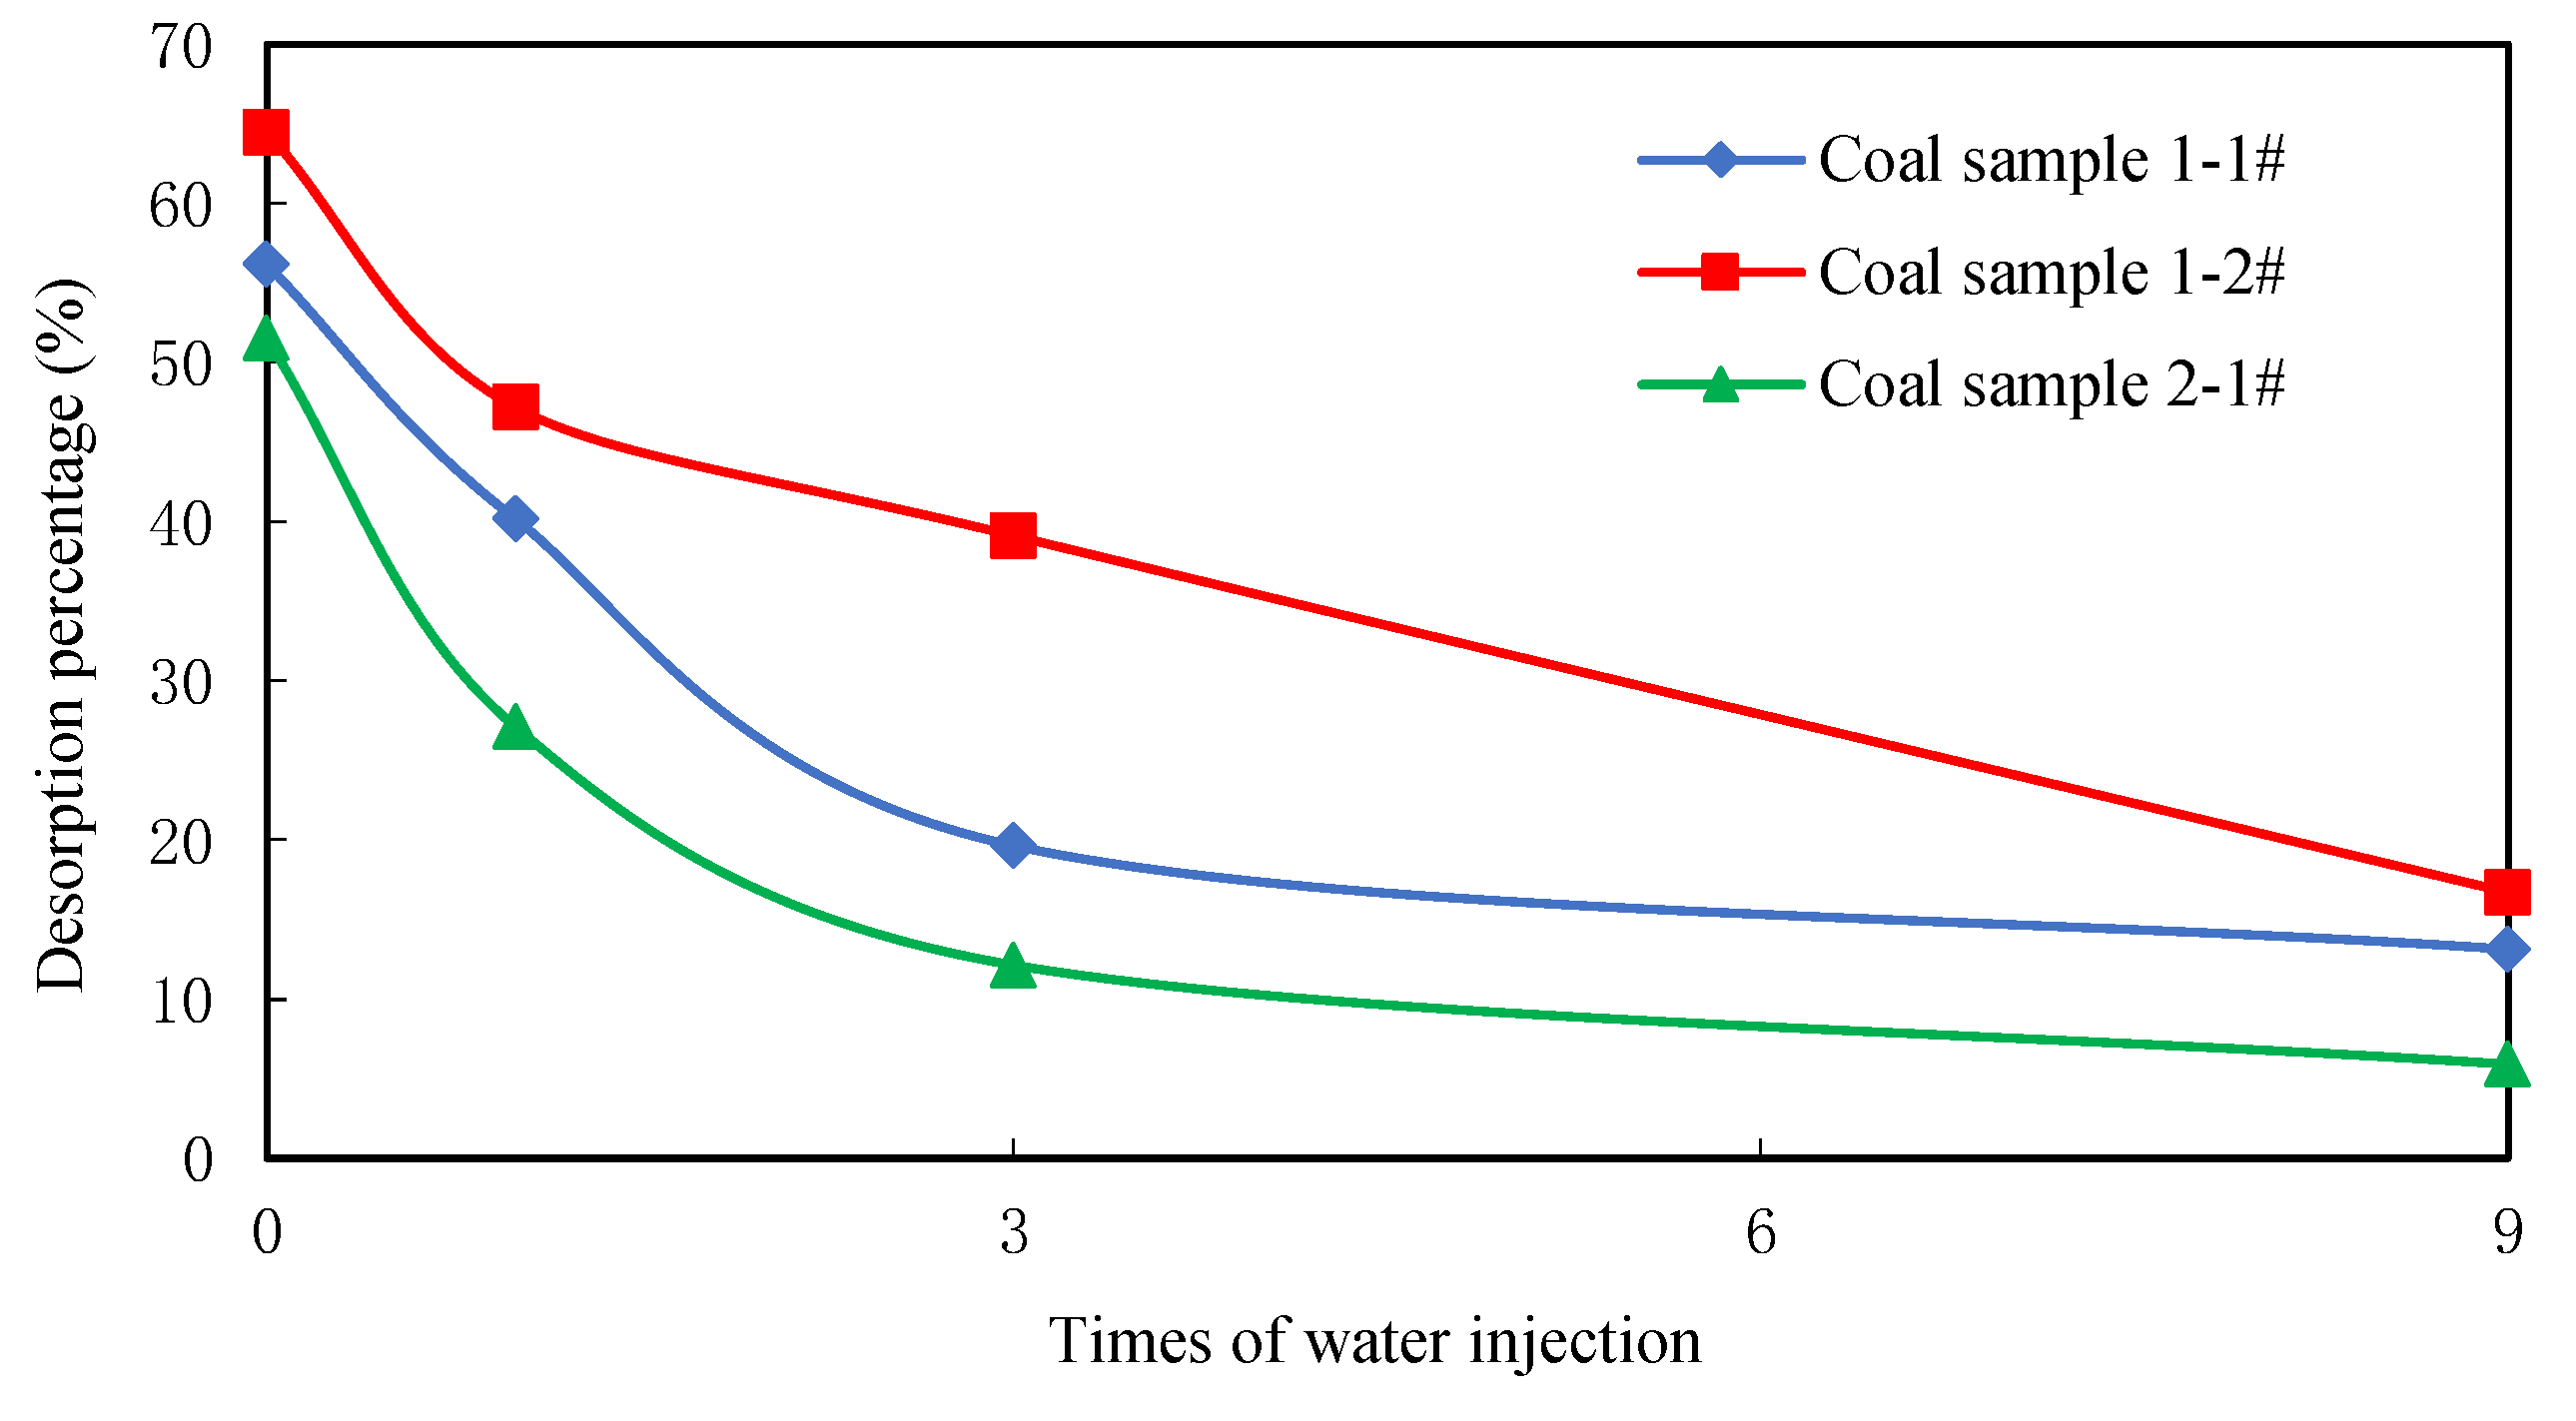
The second step of this process comprises high-pressure water injection, connecting M1 to M3 following coal sample adsorption to an equilibrium state. Water pressure was controlled in this case using a pump in M1 divided into four different pressures, including equal gas pressure (One-time), 3 times gas pressure (3 times), and 9 times gas pressure (9 times). In addition, natural desorption without water injection after adsorption is also necessary; water was passed through the entire coal sample during this process which maintained this state for 24 h within the coal sample container. This process simulates moisture injection within an in situ coal seam.
The third step of this process is desorption, separated into two distinct phases. In the first of these, M4 is connected to M3 for desorption under atmospheric pressure. This process lasts 48 h in each case; the amount of gas was measured in each case in real time during the experiment and desorption equilibrium was considered attained once desorption velocity fell to less than 10 mL/h. The temperature of desorption was maintained at 25 °C. The weight of each coal sample was then measured and its moisture ratio following water injection and desorption was calculated subsequent to the desorption process.


