Article

Exploring Outdoor Solar Potential in High-Density Living: Analyzing Direct Sunlight Duration for Urban Agriculture in Seoul’s Residential Complexes

1
Department of Urban Design and Planning, Hongik University, Seoul 04066, Korea
2
School of Architecture, Hongik University, Seoul 04066, Korea
*
Authors to whom correspondence should be addressed.
Energies 2018, 11(8), 2030; https://doi.org/10.3390/en11082030
Submission received: 2 July 2018 / Revised: 1 August 2018 / Accepted: 2 August 2018 / Published: 6 August 2018

Abstract

:
Urban agriculture has become a favored activity in many cities around the world. This study explores how urban agriculture’s potential can be maximized in Seoul, South Korea, a city characterized by high-density residential complexes. It selects six existing residential complexes with representative site typologies and diverse density levels. The study’s aim is to assess the impact of various typology and density settings on percentages of ground-level surface with direct sunlight above certain thresholds during warmer seasons when crops can grow. DIVA-for-Rhino is used for simulation. The findings suggest that parallel typologies and lower density levels offer the best performance, while other combinations show mixed results. This study could benefit citizens and policymakers to facilitate urban agriculture practices around the world by suggesting feasible solutions for high-density residential developments.

1. Introduction

Urban agriculture, including urban farming and urban gardening, is proliferating around the world. Defined as the practice of cultivating and producing food within an urban area and marketing it to consumers within that area [1], urban agriculture is increasingly gaining support from cities’ citizens, community activists, planners, and policymakers for a number of reasons. It is considered an alternative food supply system that dramatically shortens food chains in urban areas [2,3]. It is also widely believed to positively impact urban society [4,5,6,7].
Empirical research from many corners of the world has identified the broad range of benefits of urban agriculture. First, it promotes sustainable food security for urban dwellers [8,9] by improving food availability and accessibility [10]. Scholars suggest that it significantly helps the urban poor who may lack the means to secure food [11].
Second, urban agriculture helps build communities that are economically and environmentally sound and socially just [12]. Community engagement and problem solving in urban agriculture facilitate the development of strong civic virtues [13,14]. Some scholars suggest that it plays a critical role in establishing strong connections within the community by embracing under-represented groups, such as immigrants and the disadvantaged [15,16].
Third, urban agriculture contributes to public health [17]. Researchers argue that it has a positive, significant association with a higher nutritional status of school-age children [18], particularly low-income youth [19]. Dixon et al. [20] suggest that urban agriculture contributes to citizens’ mental health by dispelling the stress of food anxiety. Dennis and James [21] identify domestic gardens as having a more significant health impact in cities than regular green spaces.
Lastly, scholars have shown interest in urban farming’s role as a mitigation–adaptation approach to climate change amidst a growing world population [22]. Research shows that it may reduce greenhouse gas emissions, especially in the transportation sector [23], and may be a more efficient use of land in urban areas than typical urban development [24].
Due to all these benefits, and perhaps many more yet to be identified, cities around the world are concentrating on securing land for agricultural use. A common implementation strategy is to make use of vacant or underutilized land. City planners gather geographical information system (GIS) or aerial imagery to identify vacant lots, open spaces, and underutilized parts of their jurisdiction to build an inventory of where farming can occur that serves the local community [6,25,26]. While these efforts are most relevant for cities with sprawling low-density development patterns where potential land could be easily found, higher density cities, in which vacant or underused land is scarce, need other approaches to finding spaces to practice urban agriculture.
A popular solution for high-density urban settings is the creation of rooftop gardens; in other words, growing crops on top of buildings. These spaces successfully secure the preferred thermal conditions for urban gardening as they enjoy direct access to abundant sunlight with little interference. Rooftop gardens have been the focus of extensive research. Astee and Kishnani [27], Orsini et al. [28], and Specht et al. [29] argue that utilizing rooftop spaces may help increase domestic vegetable production that meets a substantial portion of local demand. Whittinghill and Rowe [30] suggest that rooftop gardens have the potential to alleviate the challenge of finding spaces for urban farming in today’s cities. Vertical farming is another important endeavor to facilitate urban agriculture. Despommier [31] argues that vertical farms require little or no land because they are easily established in abandoned buildings or on deserted lots and provide freshly grown and harvested food. Specht et al. [32] describe zero-acreage farming, or ZFarming, which kicked off in the early 2010s in Germany, and its acceptance by the local community.
However, despite their innovative aspects and wide implementation by many local communities and governments, these solutions still have several problems. Critics suggest that rooftop gardens may annoy occupants on the top floors of high-rise residential buildings due to possible noise or smells and that frequent entrance and exit of urban farmers may cause privacy and access issues [30]. Some documents doubt the ability of such spaces to overcome economic and technical barriers [33]. A key weakness of vertical farming, for example, is the difficulty of ensuring the right environmental conditions to grow crops. Research indicates the challenge of supplying adequate space, light, carbon dioxide, and water in buildings earmarked for vertical farming, as opposed to natural conditions in which these are available freely [34]. Another study mentions the technical infancy of the concept and reports that vertical farming produces a carbon footprint that is much higher than conventional practice [35].
As an alternative, in this study we explore the potential for utilizing ground-level open spaces in high-density residential complexes, where there are usually abundant open spaces between tall residential buildings. These spaces may provide better access and raise fewer concerns about privacy or other environmental issues as they are usually a communal asset shared by all residents. Existing open spaces already accommodate various amenities and can be redesigned to include space for urban agriculture without much additional effort.
A key challenge of promoting ground-level space for farming practice in high-density living is securing access to direct sunlight, which is critical for the successful growth of crops. Bulky and tall buildings tend to hinder sunlight from reaching the ground surface. Therefore, the task is to explore out how these high-density residential environments can be designed to secure the minimum hours of direct sunlight needed for crops to grow so that they can be harvested and consumed by neighborhood members.
This study focuses on Seoul, South Korea, a city where high-density living is universal and where urban agriculture is gaining interest from its citizens. We analyze the potential for urban agriculture in this high-density city with a specific focus on the duration of direct sunlight on the ground level so that crops can be grown in residential complexes with varying typologies and density levels. Our findings may support urban and architectural design practice in high-density cities that seek to promote urban agriculture and enjoy its diverse benefits.

2. Urban Agriculture in Seoul, South Korea

Seoul, the capital city of South Korea, is one of the world’s most dense cities. As of 2015, the city housed slightly over 9.9 million residents in 605.2 squares kilometers of land. Its population density, 16,365 persons per square kilometer, is considerably lower than that of Mumbai and Kolkata, where more than 20,000 people reside per square kilometer. However, it is about the same as the population density of Tokyo, 1.5 times greater than that of New York City, and twice as large as that of Singapore, three cities renowned for their exceptionally high-density living conditions. As a result, high-density residential complexes with tall residential buildings are pervasive and accommodate about 56 percent of total households.
Seoul has seen a rapid expansion of space for urban farming, which quintupled from 29 hectares in 2011 to 162 hectares in 2016 [36], as shown in Figure 1. Of this space, 53 percent is located in the city’s greenbelt that runs along its outskirts where vacant land is available and usually cultivated only on weekends, while a much smaller percentage is found on rooftops, in schools, in parks, or in small vacant spaces in the city [37]. The Seoul Metropolitan Government announced the Seoul Urban Agriculture Visions, the first in 2012 and the second in 2015. The second aims to secure up to 420 hectares of space in the city for urban agriculture by 2018 with significantly improved access to promote community capital and citizen satisfaction [38].
However, the future of urban agriculture in Seoul is not all bright. Figure 1 shows that the actual expansion of farming spaces in the city is slowing down in the very recent years compared to a major expansion in the early 2010s; therefore, it is very unlikely that the 2018 target will be met. Local critics suggest that the strategies adopted in the two visions do not incorporate approaches that exceed current practices to secure more land in the city and that finding additional space to grow crops is extremely difficult because land is a highly scarce resource in Seoul [39,40]. Instead, they call for utilizing ground-level open spaces in high-density residential complexes as a plausible solution to meet this target [41,42].

3. Methods

To explore the impact of different typologies and density levels of high-density residential complexes in Seoul on the duration of direct sunlight on ground-level open spaces, we followed a three-step process, as described below.

3.1. Crops and Their Growing Conditions

Our first step was to establish guidelines for analyzing the duration of direct sunlight on ground-level open spaces in high-density residential settings. We reviewed websites run by local governmental agencies, including the Rural Development Administration and the Seoul Agricultural Technology Center, as well as the related literature [43] that provides technical guidelines on urban agriculture in the country.
From these, we identified twelve crops most favored by local urban farmers, as shown in Table 1. The table also presents two thermal conditions that are of interest in this study, minimum direct sunlight duration and temperature range for each crop. It was evident that three or six hours of direct sunlight are critical for most of the crops and that ten degrees Celsius is the lowest temperature limit for growth. Thus, we set up three and six hours as thresholds for minimum direct sunlight in the analysis. We also chose a nine-month period from March to November as another guideline, during which the temperature rarely falls below ten degrees Celsius.

3.2. Study Sites

High-rise residential complexes are the most popular residential option in South Korea. The Enforcement Decree of the nation’s Building Act first adopted in 1976 mandates that certain distances are kept between high-rise residential buildings that face each other so as to protect the privacy of each dwelling unit and provide access to abundant direct sunlight. This resulted in not only a fair amount of ground-level open space in the complexes but also various site typologies.
Instead of using generic models of high-density residential complexes, we used existing sites for analysis so as to produce practical implications that may benefit design and development practice. We focused on the three most common typologies of high-density residential complexes in Seoul, which are parallel, grid, and tower, and selected two existing complexes for each of them, resulting in six study sites in total. Table 2 describes the six selected study sites, their typologies, and various physical characteristics, including size and density, and provides satellite and aerial images for each.
Study sites A and B are typical residential complexes built in the 1970s with I-shaped buildings arranged in parallel. The buildings in A generally run east–west, while those in B run southeast–northwest. Study sites C and D represent I-shaped residential buildings arranged in grid form. These typologies, which were popular in the late 1990s and the early 2000s, contain multiple enclosed outdoor spaces. Study sites E and F consist of Y-shaped towers, which have become popular since the 2000s because of their outstanding capability to accommodate high-density residences.
Figure 2 illustrates the location of the six study sites. They are all located south of the Han River, which cuts through Seoul from east to west. This area has experienced extensive residential development since the 1970s and therefore is a relatively newer part of the city designed to accommodate the soaring population.
For analysis, in addition to looking at the six study sites that represent three different typologies, we diversified their density levels. We kept their building footprints the same, meaning that their building coverage ratios (BCRs) were constant, but modified the building heights to set their floor area ratios (FARs) at 1.5, 2.0, 2.5, 3.0, 3.5, and 4.0 by adding or subtracting floors evenly throughout the complexes. Because we were dealing with real-world sites, it was impossible to precisely meet the desired FAR values. Hence, we modified the number of stories of the buildings to be as close to each FAR value as possible. Table 3 shows the projected FARs for each study site. For each of the six study sites, there are six cases based on FAR variations, resulting in a total of 36 cases in the study.

3.3. Solar Environment Analysis

Computer simulation is commonly used to analyze solar environments. Researchers who explore design strategies to secure sunlight access or enhance thermal comfort in high-density residential environments use various software tools, such as Ecotect [44,45,46], Sanalyst [47], and LadyBug [48]. DIVA-for-Rhino is used by many researchers to simulate solar environments [49,50,51,52,53]. It is a daylighting and energy-modeling plugin for Rhinoceros 3D, a nonuniform rational basis spline modeling software, and carries out parametric performance evaluations of individual buildings and urban landscapes [54].
Using DIVA-for-Rhino, we followed a procedure to parametrically analyze the duration of direct sunlight on the ground-level open space of the 36 study cases from the six selected sites at six density levels, as outlined below:
(1)
Constructing dwg files (drawing file generated by Autodesk AutoCAD) of the 36 study cases using local GIS information, satellite imagery, and database information on local real estate.
(2)
Importing the dwg files into Rhinoceros 3D and creation of three dimensional models that precisely represent the size and height of the residential buildings.
(3)
Entering the latitude and longitude coordinates of Seoul (37°34′N 126°58′E) and time (07:00 to 18:00 h) and date (March to November) information into the Sun Position component of DIVA-for-Rhino and generating vectors for shade analysis by time.
(4)
Entering the vectors from the Sun Position component into the Shadow component, which creates shades generated by masses based on input vectors, of Grasshopper, a tool that operates within DIVA-for-Rhino to build generative algorithms and analyze shades for each study case by time.
(5)
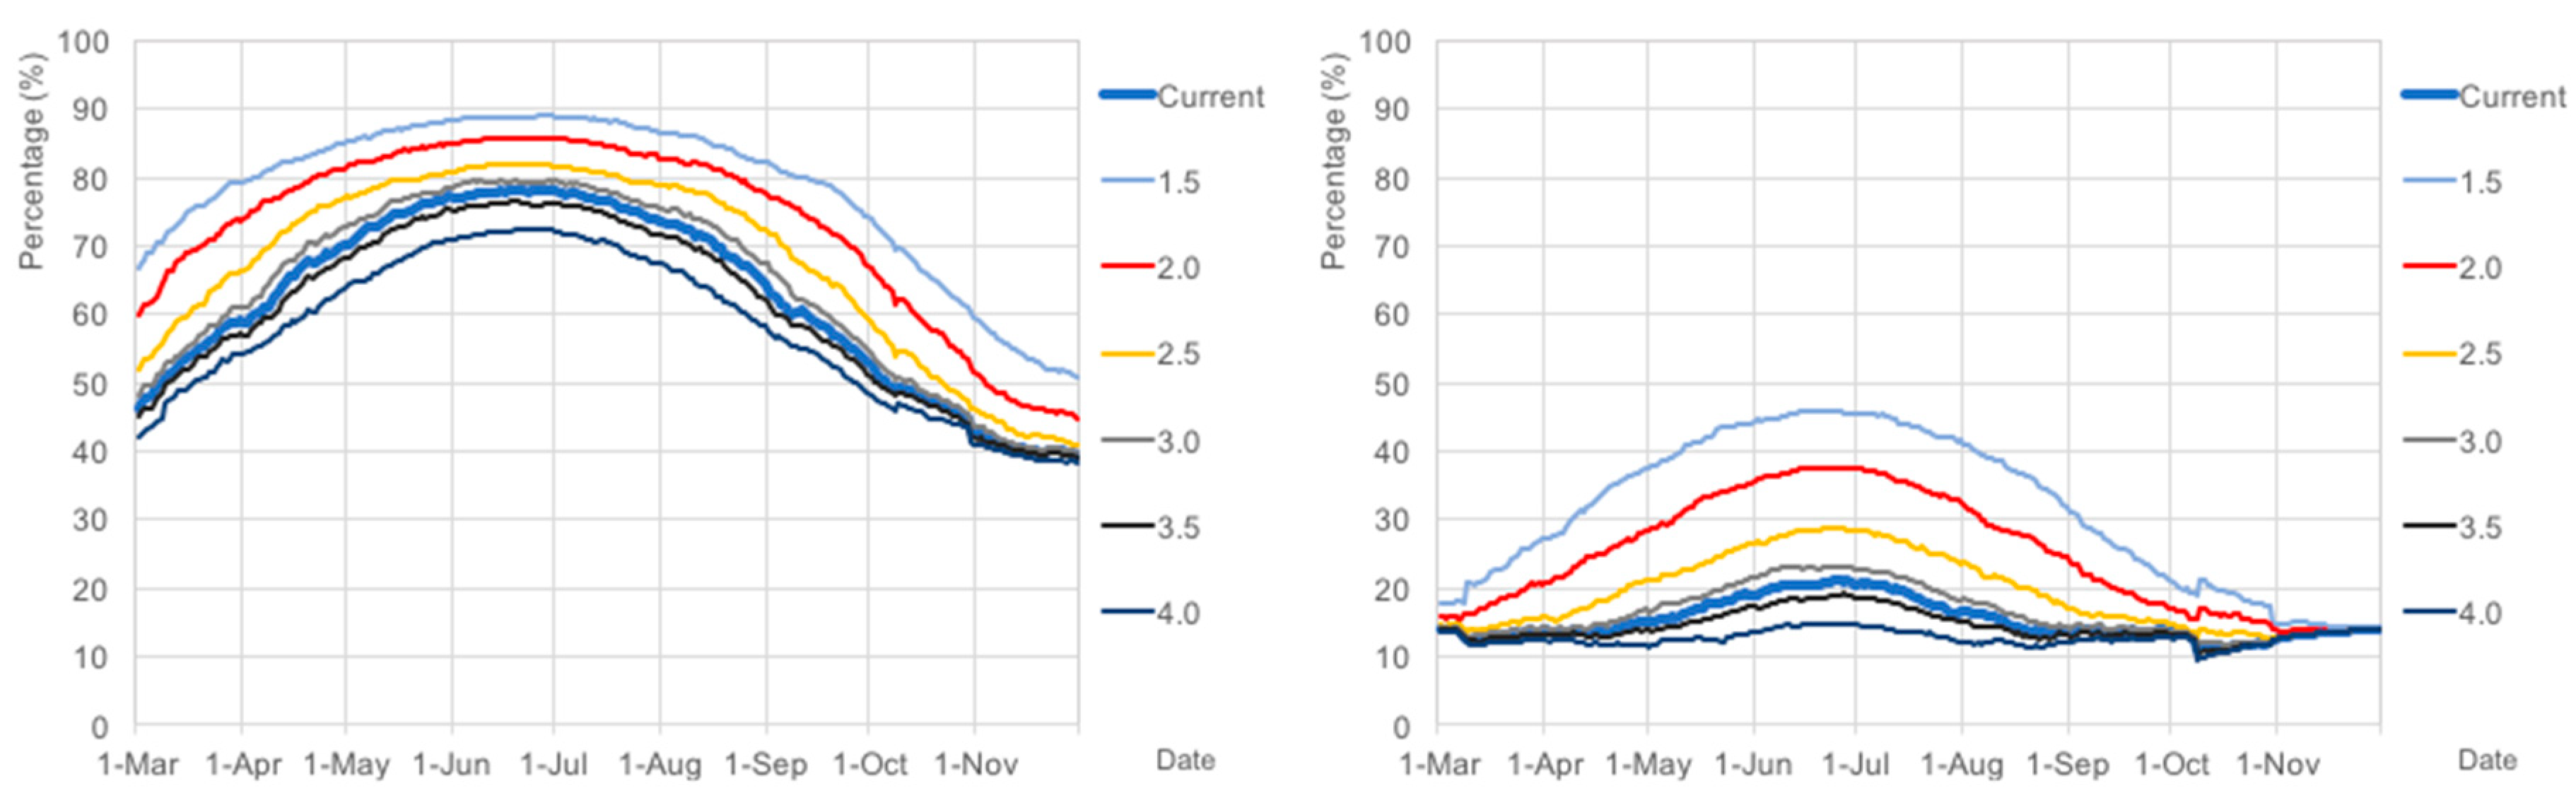
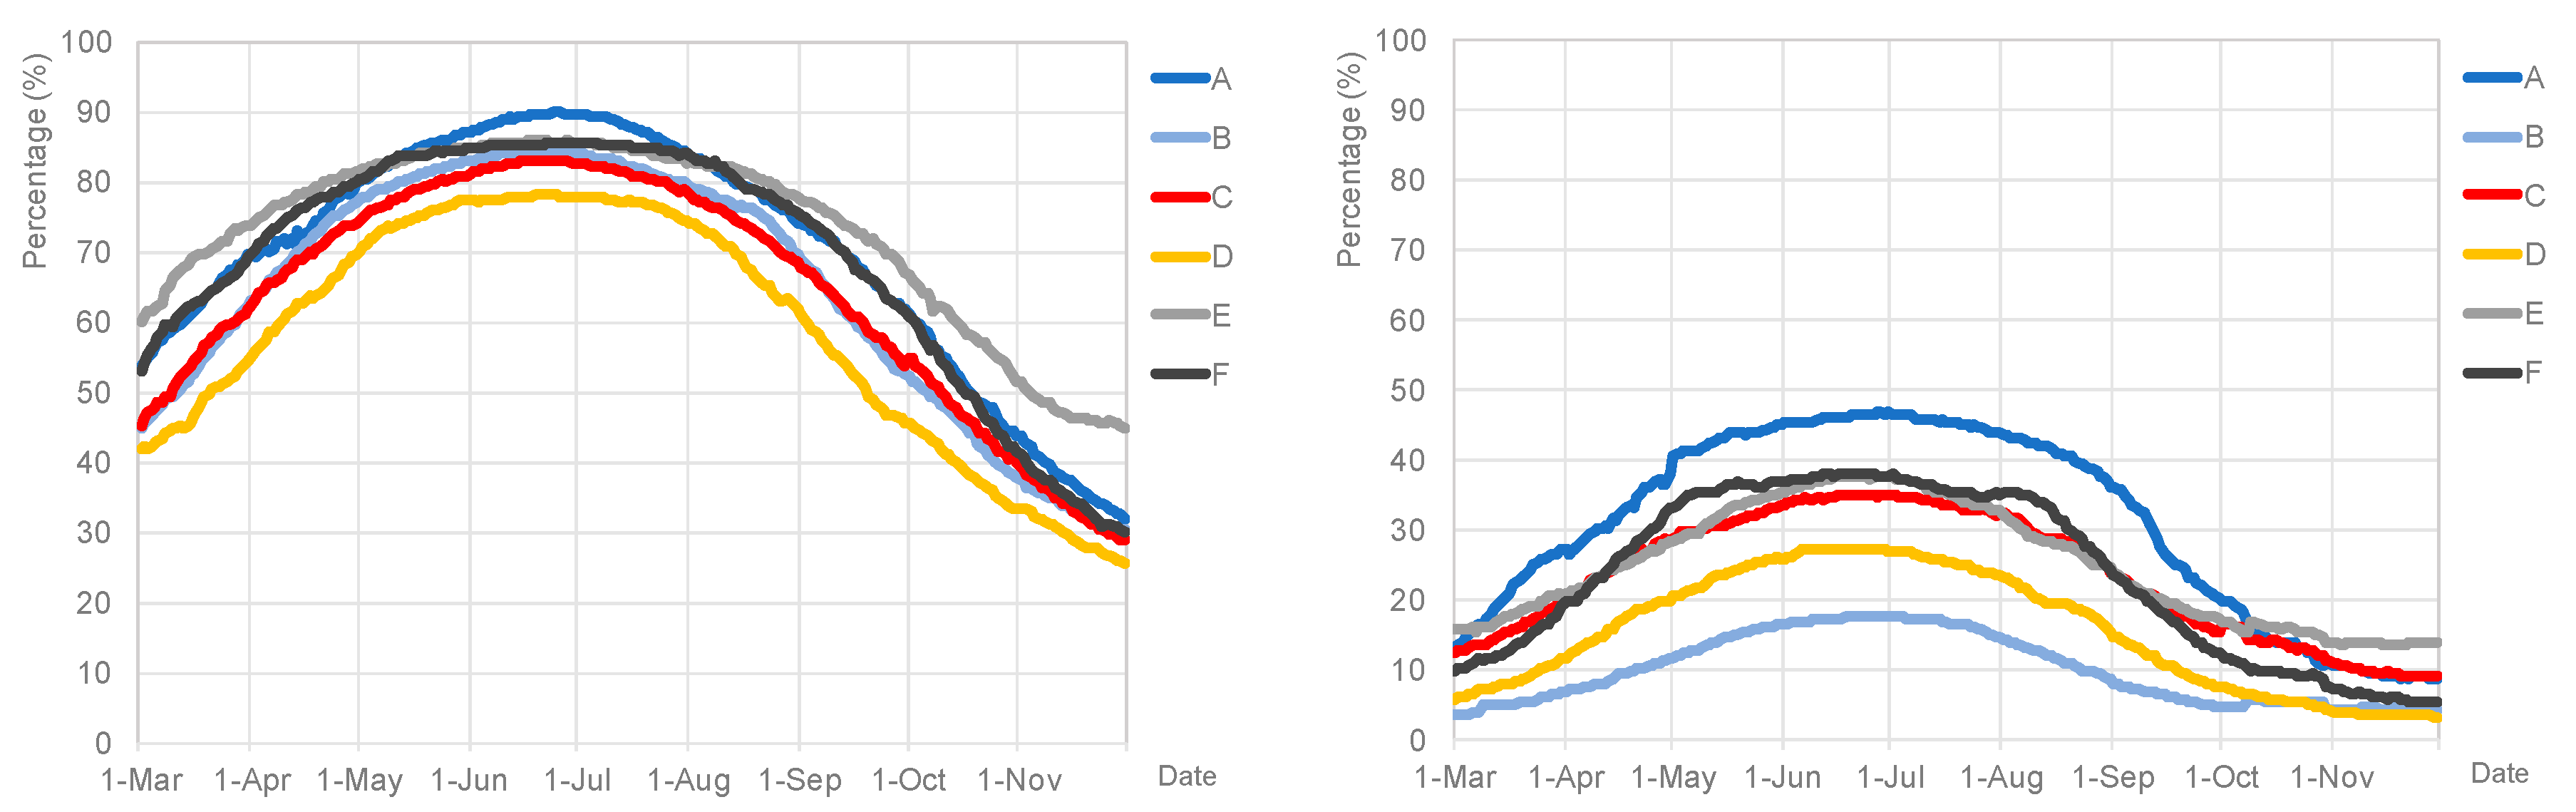
Subdividing the ground-level space of all the study cases into 12 m × 12 m grids; based on the duration of direct sunlight per day each grid receives, cases were divided between those that experience at least three hours and those that receive at least six hours.
(6)
Exporting the results to Microsoft Excel for analysis using gHowl, a Grasshopper addon that is created by Luis Fraguada [55]. gHowl helps hand over data from DIVA-for-Rhino to Microsoft Excel.
Figure 3 is an example of one of the six study cases, each representing a different density level case for site E with gridded ground-level surfaces created for solar environmental analysis. Figure 4 is an exemplary overlay of the model for site E, showing what lies on the ground. We do not consider roads and parking areas that exist on the actual ground in this study because our goal is to explore potential, implying that the use those areas may be rethought from scratch. Same applies to all the other sites.

4. Results

Figure 5 is an exemplary comparison of the amount of sunlight-irradiated area for the current condition of study site E with the six tested FARs. It presents how ground-level areas that receive direct sunlight may change over time depending on the FAR. Certainly, lower FARs provide more area for direct sun access and higher ones less but are also subject to site typologies. With these models, we simulated for each FAR.

4.1. FAR = 1.5

For the threshold of three or more hours, A, B, E, and F generally showed a similar trend throughout the nine-month period, as Figure 6 illustrates. Among these, A and B, the parallel typologies, experienced the most extensive direct sunlight at ground level from mid-May to late July, peaking at over 90 percent. E and F, the tower typologies, showed the most extensive percentages in spring and fall. C and D, the grid typologies, presented slightly lower percentages than the other four, falling below 60 percent in early March and 40 percent in late November.
For the six or more hours threshold, ground-level open spaces in A had the highest percentage values for the longest duration, with a peak exceeding 55 percent in summer. C, E, and F showed a similar trend throughout the whole nine-month period. D displayed lower values than most of the sites. However, it is surprising to observe that B, unlike its parallel-type companion A, presented the lowest values for most of the period, staying largely below 25 percent.

4.2. FAR = 2.0

For the threshold of three or more hours, A, E, and F were top-ranked, as shown in Figure 7. A showed the highest percentages, which reached 90 percent between mid-May and late July, and E had the most direct sunlight at ground level in spring and fall. B, C, and D were bottom-ranked, with D experiencing the least direct sunlight, peaking below 80 percent in summer.
For the threshold of six or more hours, A showed the highest percentages for most of this period, nearing 50 percent in late June and early July. It was followed by C, E, and F, which showed similar values throughout the whole period. D was mostly the second lowest with percentages below 30 percent at all times. Again, B had the lowest percentages for most of the nine-month period, peaking below 20 percent in summer.

4.3. FAR = 2.5

For the threshold of three or more hours, A, E, and F were the top three sites, as indicated in Figure 8. A showed the highest percentages between mid-May and the end of July, peaking with percentages in the high 80s in late June. E had the highest values in spring and fall. B, C, and D were the bottom three, with D consistently having the lowest percentage, peaking below 70 percent in summer. One difference from the previous two FAR scenarios is that, in October and November, F had low percentages that neared those of C and D.
For the six or more hours threshold, A again maintained the highest percentages of direct sunlight for most of the period, peaking just below 40 percent in late June and early July. The values for C, E, and F were generally similar throughout the whole period. The values for D were generally below 20 percent except for a very short period in late June. Again, B showed the lowest percentages, which during most of the nine-month period did not exceed 10 percent.

4.4. FAR = 3.0

For the threshold of three or more hours, A outperformed the other five between mid-May and the end of July, peaking at percentages in the mid-80s in late June, as shown in Figure 9. However, E had the highest percentages for a much a longer period in spring and fall. The difference between E and the other five became more significant in March and November when all the others presented similar values. A and E were followed by C and F, which presented a highly similar trend. B and D, the bottom two, showed almost identical percentages throughout the nine-month period.
For the threshold of six or more hours, A demonstrated the highest percentages of ground-level surface with direct sunlight for most of the nine-month period, with a peak exceeding 30 percent in summer. E showed the highest values during short periods in spring and after mid-September. The performance of C and F were mostly very similar. D and B had the lowest values, with D below 20 percent and B below 10 percent throughout the nine-month period.

4.5. FAR = 3.5

For the three or more hours threshold, A had the largest percentages of ground-level surface with direct sunlight in June and July, peaking at around 80 percent in late June, as illustrated in Figure 10. However, E ranked higher for a much longer period and outperformed the other five more considerably than in the previous scenarios, particularly in March and November when the difference between E and the other five neared 20 percentage points. Again, C and F showed similar percentages, and B and D had the lowest percentages, failing to exceed 60 percent.
For the six or more hours threshold, A displayed the highest values from April to August, exceeding 25 percent in summer. C, E, and F were rather constant throughout the whole period at mostly below 20 percent. D and B showed the lowest percentages for most of the time, with D peaking just below 15 percent and B below 10 percent.

4.6. FAR = 4.0

Unlike previous scenarios, E presented the highest percentages throughout the whole period when the FAR was set to 4.0, exceeding 70 percent in summer, as shown in Figure 11. It was followed by F, A, and C. B and D were again almost identical, staying below 50 percent for most of the nine-month period. A, C, and F also dropped below 50 percent in spring and fall.
For the threshold of six or more hours, it was difficult to make any judgement on which site outperformed the others, as all percentages generally remained below 15 percent for the whole nine-month period. Among them, D and B showed the lowest percentages for most of the time, remaining below 10 percent.

4.7. Estimation of Crop Yield

Based on a series of simulations carried out so far, we provide an estimation of annual yield per housing unit of carrot as an example for each study site at the six density levels as shown in Table 4. We applied yield estimates per area data normalized for each day provided by the Korean Statistical Information Service in the calculation (See Table 1). It is clear that lower FAR levels result in more carrot yields in both three hours and six hours cases and that the estimates vary by site typology. We also noted that the amount of fruit vegetable yields from at least six hours of direct sunlight, which may enhance produce quality, is significantly lower than three hours.

5. Discussion

The results of the solar environment analyses for the six study sites at six different density levels have important implications for the potential of urban agriculture in high-density residential complexes. First, among study sites A and B, the two parallel cases, A generally demonstrated higher percentages of ground-level surface with direct sunlight throughout the six density scenarios. Given that their densities were similar, we interpret that the orientation of the buildings plays a critical role in determining the amount of direct sunlight that reaches the ground level. Second, study sites C and D, the two grid cases, did not demonstrate any impressive results throughout the density. Between the two, D consistently had the lowest percentages of direct sunlight at ground level. While other characteristics of the two remain similar, the taller buildings in D may have contributed to blocking direct sunlight. Third, study sites E and F, the two tower cases, resulted in interesting findings, as they seemed to perform better than others as the density increased, demonstrating this typology’s potential for facilitating direct sunlight at ground level in a hyper-dense setting. Between the two, E performed better in general, presumably because of its relatively lower density. Based on a more comprehensive observation of the results, it was clear that, as density increased, the amount of ground-level open space with direct sunlight decreased in all cases. This suggests that to achieve a residential environment with sufficient direct sunlight to support urban agricultural practices, density has to be sacrificed. Lastly, it was difficult to come up with generalized rankings of the three site typologies. However, it was evident that, in lower-density settings, parallel typologies with buildings running east–west could secure the most direct sunlight. The tower typology also performed better as density increased. The grid typology performed the poorest in all scenarios.

6. Concluding Remarks

This study explored the potential for utilizing ground-level open spaces for urban agriculture in high-density residential environments. Six cases with differing typologies in Seoul were selected for study. A series of parametric analyses of the duration of direct sunlight on ground-level open space for each site at six density levels using DIVA-for-Rhino identified the density levels and site typologies that best support urban agriculture. This analysis suggested the trade-off between urban density and direct solar access for urban agriculture, yet high-density development is a popular approach in many Asian countries with high population density to efficiently provide housing. Developers also tend to maximize housing density to achieve maximum profit. However, careful building layouts that consider location, direction, and relationship with adjacent buildings can improve the solar accessibility of high-density developments, as the simulation results showed considerable differences in percentages of ground-level surface with direct sunlight between sites. Thus, solar-accessible urban and architectural design to harness unused solar energy for crop yields should contribute to improving environmental sustainability.
However, there are several shortcomings. First, the six sites, despite being highly representative of Seoul’s residential complexes, could produce case-specific findings that are not transferrable. Second, although DIVA-for-Rhino is a favored tool among researchers and has cutting-edge capabilities, it may be necessary to validate its simulation results to make the findings more convincing. Third, the study focuses on a subset of crops grown by locals, and therefore the findings may not be relevant to those interested in the potential cultivation of other crops.
Nonetheless, this study’s contributions could benefit Seoul’s residents and policymakers. It is one of the very first attempts to link the design of high-density built environments with urban agriculture in the Asian context. It also analyzes existing cases, rather than simplified prototypes that do not exist in the real world, therefore presenting more practical findings. Lastly, it provides guidance for local urban design practices, which may actively incorporate space for urban agriculture in high-density residential areas in the near future. Our future research will develop a user-friendly solar accessibility simulation tool that planers and architects can use during initial design process to assess solar potential of their design. We anticipate the new tool to encourage sustainable architecture and urban design by making it easy for designers to use simulations tools, and ultimately contribute to sustainable urban environments.

Author Contributions

H.K. and K.S.L. suggested the initial idea and conducted the data analysis. S.L. conducted the simulation. J.S.L. advised the research design and theoretical framework and edited the manuscript. All authors have approved the final manuscript.

Funding

This work is supported by the Korea Agency for Infrastructure Technology Advancement (KAIA) grant funded by the Ministry of Land, Infrastructure and Transport (Grant 18TBIP-C144203-01). This work was also supported by the National Research Foundation of Korea (NRF) grant funded by the Korea government (MSIT) (No. NRF-2018R1A2B6005938).

Conflicts of Interest

The authors declare no conflicts of interest.

References

  1. United States Environmental Protection Agency. Partnership for Sustainable Communities: Urban Farm Business Plan Handbook; United States Environmental Protection Agency: Chicago, IL, USA, 2011.
  2. Cockrall-King, J. Food and the City: Urban Agriculture and the New Food Revolution; Prometheus Books: Amherst, NY, USA, 2012. [Google Scholar]
  3. de Zeeuw, H.; Drechsel, P. Cities and Agriculture: Developing Resilient Urban Food Systems; Routledge: New York, NY, USA, 2015. [Google Scholar]
  4. Krishnan, S.; Nandwani, D.; Smith, G.; Kankarta, V. Sustainable urban agriculture: A growing solution to urban food deserts. In Organic Farming for Sustainable Agriculture; Nandwani, D., Ed.; Springer International Publishing: Basel, Switzerland, 2016; pp. 325–340. [Google Scholar]
  5. Ladner, P. The Urban Food Revolution: Changing the Way We Feed Cities, 1st ed.; New Society Publishers: Gabriola Island, BC, Canada, 2011. [Google Scholar]
  6. McClintock, N.; Cooper, J.; Khandeshi, S. Assessing the potential contribution of vacant land to urban vegetable production and consumption in Oakland, California. Landsc. Urban Plan. 2013, 111, 46–58. [Google Scholar] [CrossRef]
  7. Pearson, L.J.; Pearson, L.; Pearson, C.J. Sustainable urban agriculture: Stocktake and opportunities. Int. J. Agric. Sustain. 2010, 8, 7–19. [Google Scholar] [CrossRef]
  8. Barthel, S.; Isendahl, C. Urban gardens, agriculture, and water management: Sources of resilience for long-term food security in cities. Ecol. Econ. 2013, 86, 224–234. [Google Scholar] [CrossRef]
  9. Redwood, M. Agriculture in Urban Planning: Generating Livelihoods and Food Security; Routledge: New York, NY, USA, 2012. [Google Scholar]
  10. Koc, M.; MacRae, R.; Welsh, J.; Mougeot, L.J.A. For Hunger-Proof Cities: Sustainable Urban Food Systems; IDRC Books: Ottawa, ON, Canada, 2000. [Google Scholar]
  11. Zezza, A.; Tasciotti, L. Urban agriculture, poverty, and food security: Empirical evidence from a sample of developing countries. Food Policy 2010, 35, 265–273. [Google Scholar] [CrossRef]
  12. Campbell, M.C. Building a Common Table: The Role for Planning in Community Food Systems. J. Plan. Educ. Res. 2004, 23, 341–355. [Google Scholar] [CrossRef]
  13. Levkoe, C.Z. Learning democracy through food justice movements. Agric. Hum. Values 2006, 23, 89–98. [Google Scholar] [CrossRef]
  14. Lyson, T.A. Civic Agriculture: Reconnecting Farm, Food, and Community; Tufts University Press: Medford, MA, USA, 2004. [Google Scholar]
  15. Pothukuchi, K. Five decades of community food planning in Detroit city and grassroots, growth and equity. J. Plan. Educ. Res. 2015, 35, 419–434. [Google Scholar] [CrossRef]
  16. Saldivar-tanaka, L.; Krasny, M.E. Culturing community development, neighborhood open space, and civic agriculture: The case of Latino community gardens in New York City. Agric. Hum. Values 2004, 21, 399–412. [Google Scholar] [CrossRef]
  17. Brown, K.H.; Jameton, A.L. Public health implications of urban agriculture. J. Public Health Policy 2000, 21, 20–39. [Google Scholar] [CrossRef] [PubMed]
  18. Maxwell, D.; Levin, C.; Csete, J. Does urban agriculture help prevent malnutrition? Evidence from Kampala. Food Policy 1998, 23, 411–424. [Google Scholar] [CrossRef] [Green Version]
  19. Vallianatos, M.; Gottlieb, R.; Haase, M.A. Farm-to-school strategies for urban health, combating sprawl, and establishing a community food systems approach. J. Plan. Educ. Res. 2014, 23, 414–423. [Google Scholar] [CrossRef]
  20. Dixon, J.; Omwega, A.M.; Friel, S.; Burns, C.; Donati, K.; Carlisle, R. The health equity dimensions of urban food systems. J. Urban Health 2007, 84, 118–129. [Google Scholar] [CrossRef] [PubMed]
  21. Dennis, M.; James, P. Evaluating the relative influence on population health of domestic gardens and green space along a rural-urban gradient. Landsc. Urban Plan. 2017, 157, 343–351. [Google Scholar] [CrossRef] [Green Version]
  22. Thornbush, M. Urban agriculture in the transition to low carbon cities through urban greening. AIMS Environ. Sci. 2015, 2, 852–867. [Google Scholar] [CrossRef]
  23. Lee, G.-G.; Lee, H.-W.; Lee, J.-H. Greenhouse gas emission reduction effect in the transportation sector by urban agriculture in Seoul, Korea. Landsc. Urban Plan. 2015, 140, 1–7. [Google Scholar] [CrossRef]
  24. Kulak, M.; Graves, A.; Chatterton, J. Reducing greenhouse gas emissions with urban agriculture: A life cycle assessment perspective. Landsc. Urban Plan. 2013, 111, 68–78. [Google Scholar] [CrossRef]
  25. Kirnbauer, M.C.; Baetz, B.W. Allocating urban agricultural reuse strategies to inventoried vacant and underutilized land. J. Environ. Inform. 2012, 20, 1–11. [Google Scholar] [CrossRef]
  26. Mendes, W.; Balmer, K.; Kaethler, T.; Rhoads, A. Using land inventories to plan for urban agriculture: Experiences from Portland and Vancouver. J. Am. Plan. Assoc. 2008, 74, 435–449. [Google Scholar] [CrossRef]
  27. Astee, L.Y.; Kishnani, N.T. Building integrated agriculture: Utilising rooftops for sustainable food crop cultivation in Singapore. J. Green Build. 2010, 5, 105–113. [Google Scholar] [CrossRef]
  28. Orsini, F.; Gasperi, D.; Marchetti, L.; Piovene, C.; Draghetti, S.; Ramazzotti, S.; Bazzocchi, G.; Gianquinto, G. Exploring the production capacity of rooftop gardens (RTGs) in urban agriculture: The potential impact on food and nutrition security, biodiversity and other ecosystem services in the city of Bologna. Food Secur. 2014, 6, 781–792. [Google Scholar] [CrossRef]
  29. Specht, K.; Siebert, R.; Thomaier, S.; Freisinger, U.B.; Sawicka, M.; Dierich, A.; Dietrich Henckel, D.; Busse, M. Zero-acreage farming in the city of Berlin: An aggregated stakeholder perspective on potential benefits and challenges. Sustainability 2015, 7, 4511–4523. [Google Scholar] [CrossRef]
  30. Whittinghill, L.J.; Rowe, D.B. The role of green roof technology in urban agriculture. Renew. Agric. Food Syst 2012, 27, 314–322. [Google Scholar] [CrossRef]
  31. Despommier, D. The Vertical Farm: Feeding the World in the 21st Century; Picador: New York, NY, USA, 2011. [Google Scholar]
  32. Specht, K.; Siebert, R.; Thomaier, S. Perception and acceptance of agricultural production in and on urban buildings (ZFarming): A qualitative study from Berlin, Germany. Agric. Hum. Values 2016, 33, 753–769. [Google Scholar] [CrossRef]
  33. Sanyé-Mengual, E.; Anguelovski, I.; Oliver-Solà, J.; Montero, J.I.; Rieradevall, J. Resolving differing stakeholder perceptions of urban rooftop farming in Mediterranean cities: Promoting food production as a driver for innovative forms of urban agriculture. Agric. Hum. Values 2016, 33, 101–120. [Google Scholar] [CrossRef]
  34. Banerjee, C.; Adenaeuer, L. Up, Up and Away! The Economics of Vertical Farming. J. Agric. Stud. 2014, 2, 40–60. [Google Scholar] [CrossRef]
  35. Al-Chalabi, M. Vertical farming: Skyscraper sustainability? Sustain. Cities Soc. 2015, 18, 74–77. [Google Scholar] [CrossRef]
  36. Seoul Metropolitan Government. Seoul’s Urban Farmland. Available online: http://economy.seoul.go.kr/family-garden (accessed on 19 July 2017).
  37. The Seoul Institute. How Much Land for Urban Farming Has Increased? Available online: https://www.si.re.kr/node/55513 (accessed on 16 July 2017).
  38. Seoul Metropolitan Government. Seoul Urban Agriculture Vision 2.0; Seoul Metropolitan Government: Seoul, Korea, 2015.
  39. Heo, J.N.; Kwon, H.H. A study on evaluation and preference of urban agriculture using contingent valuation method. Seoul Stud. 2014, 15, 53–64. [Google Scholar]
  40. Lee, C. Promotion of Social Economic Enterprise in Urban Agriculture Sector in Seoul; (No. 2015-PR-05); The Seoul Institute: Seoul, South Korea, 2015. [Google Scholar]
  41. Oh, J.; Kim, S. Study on the introduction and planning of urban agriculture within multiple housing complex—Focused on the drawing planning index and ways to its application. J. Urban Des. Inst. Korea 2014, 15, 47–66. [Google Scholar]
  42. Kim, S.; Oh, J.; Kim, S. Research on residents’ preference for outdoor spaces to vitalize community gardens within joint housing complexes—With the focus on four joint housing complexes in Seoul. J. Urban Des. Inst. Korea 2016, 17, 57–70. [Google Scholar]
  43. Lee, G.; Jeong, Y.; Ji, S.; Kim, S. A study on improving the utilization of biotope area ratio system considering the plant growth conditions. J. Korea Acad. Ind. Coop. Soc. 2015, 16, 1490–1499. [Google Scholar] [CrossRef]
  44. Jones, P.J.; Alexander, D.; Marsh, A.; Burnett, J. Evaluation of methods for modelling daylight and sunlight in high rise Hong Kong residential buildings. Indoor Built Environ. 2004, 13, 249–258. [Google Scholar] [CrossRef]
  45. Lu, M.; Du, J. Assessing the daylight and sunlight availability in high-density residential areas: A case in north-east China. Archit. Sci. Rev. 2013, 56, 168–182. [Google Scholar] [CrossRef]
  46. Tan, P.Y.; Ismail, M.R.B. Building shade affects light environment and urban greenery in high-density residential estates in Singapore. Urban For. Urban Green 2014, 13, 771–784. [Google Scholar] [CrossRef]
  47. Jung, S.; Yoon, S. Changes in sunlight and outdoor thermal environment conditions based on the layout plan of flat type apartment houses. Energies 2015, 8, 9155–9172. [Google Scholar] [CrossRef]
  48. Yi, Y.K.; Kim, H. Agent-based geometry optimization with Genetic Algorithm (GA) for tall apartment’s solar right. Sol. Energy 2015, 113, 236–250. [Google Scholar] [CrossRef]
  49. Lee, K.S.; Lee, J.W.; Lee, J.S. Feasibility study on the relation between housing density and solar accessibility and potential uses. Renew. Energy 2016, 85, 749–758. [Google Scholar] [CrossRef]
  50. Lobaccaro, G.; Carlucci, S.; Croce, S.; Paparella, R.; Finocchiaro, L. Boosting solar accessibility and potential of urban districts in the Nordic climate: A case study in Trondheim. Sol. Energy 2017, 149, 347–369. [Google Scholar] [CrossRef]
  51. Mohsenin, M.; Hu, J. Assessing daylight performance in atrium buildings by using Climate Based Daylight Modeling. Sol. Energy 2015, 119, 553–560. [Google Scholar] [CrossRef]
  52. Nault, E.; Moonen, P.; Rey, E.; Andersen, M. Predictive models for assessing the passive solar and daylight potential of neighborhood designs: A comparative proof-of-concept study. Build. Environ. 2017, 116, 1–16. [Google Scholar] [CrossRef] [Green Version]
  53. Yun, G.; Yoon, K.C.; Kim, K.S. The influence of shading control strategies on the visual comfort and energy demand of office buildings. Energy Build. 2014, 84, 70–85. [Google Scholar] [CrossRef]
  54. Solemma. DIVA Features. Available online: http://www.solemma.net/Diva.html (accessed on 20 March 2017).
  55. Davidson, S. gHowl. Available online: https://www.grasshopper3d.com/group/ghowl (accessed on 4 August 2018).
Figure 1. Changes in urban agriculture area in Seoul between 2011 and 2018. Notes: * Revised estimate; ** Target set in Seoul Urban Agriculture Vision II [38].
Energies 11 02030 g001
Figure 2. Location of study sites A to F.
Energies 11 02030 g002
Figure 3. Models for study site E with six density levels for solar environment analysis using DIVA-for-Rhino.
Energies 11 02030 g003
Figure 4. Model overlay of site E showing actual roads and parking areas.
Energies 11 02030 g004
Figure 5. Percentages of ground-level surface with direct sunlight for three or more hours (left) and six or more hours (right) from March to November for study site E with the current FAR (3.235) in comparison with tested FARs (1.5, 2.0, 2.5, 3.0, 3.5, and 4.0).
Energies 11 02030 g005
Figure 6. Percentages of ground-level surface with direct sunlight for three or more hours (left) and six or more hours (right) from March to November for study sites A to F when FAR is 1.5.
Energies 11 02030 g006
Figure 7. Percentages of ground-level surface with direct sunlight for three or more hours (left) and six or more hours (right) from March to November for study sites A to F when FAR is 2.0.
Energies 11 02030 g007
Figure 8. Percentages of ground-level surface with direct sunlight for three or more hours (left) and six or more hours (right) from March to November for study sites A to F when FAR is 2.5.
Energies 11 02030 g008
Figure 9. Percentages of ground-level surface with direct sunlight for three or more hours (left) and six or more hours (right) from March to November for study sites A to F when FAR is 3.0.
Energies 11 02030 g009
Figure 10. Percentages of ground-level surface with direct sunlight for three or more hours (left) and six or more hours (right) from March to November for study sites A to F when FAR is 3.5.
Energies 11 02030 g010
Figure 11. Percentages of ground-level surface with direct sunlight for three or more hours (left) and six or more hours (right) from March to November for study sites A to F when FAR is 4.0.
Energies 11 02030 g011
Table 1. Twelve most common crops in South Korea and their growing conditions.
CropMin. Direct Sunlight Duration Required (hours)Temperature Aange (°C)Cultivation Area (ha)Annual Production (kg) per 10 haAnnual Production (ton)
Root vegetablesCarrot318~2121,48550511,085,223
Fruit vegetablesCherry TomatoN/A10~3044,66143451,940,733
Cucumber625~28
Eggplant622~30
Korean ZucchiniN/A23~25
Seasoning vegetablesGreen Onion315~2096,58423792,297,756
Leaf vegetablesLettuce315~25
Spinach615~20
Napa Cabbage815~20
Korean Perilla620~3045,47411452,024
Persimmon610~1525,0601411353,655
Potato610~2322,0002526555,670
Sources: Seoul Agricultural Technology Center (http://agro.seoul.go.kr/); Nongsaro (http://www.nongsaro.go.kr/); Korean Statistical Information Service (http://kosis.kr/search/search.do?query=%EC%B1%84%EC%86%8C%EC%83%9D%EC%82%B0%EB%9F%89).
Table 2. Characteristics of study sites A to F.
Study SiteABCDEF
Energies 11 02030 i001 Energies 11 02030 i002 Energies 11 02030 i003 Energies 11 02030 i004 Energies 11 02030 i005 Energies 11 02030 i006
Energies 11 02030 i007 Energies 11 02030 i008 Energies 11 02030 i009 Energies 11 02030 i010 Energies 11 02030 i011 Energies 11 02030 i012
Site typologyParallelParallelGridGridTowerTower
Number of units387861094258567834106864
Number of buildings827156614466
Maximum number of stories151623342936
Gross site area (m2)416,126474,848223,762258,577240,939282,551
Building coverage ratio (BCR)0.1750.1650.1940.1310.1230.128
Floor area ratio (FAR)2.1451.9873.1713.0503.2353.780
Building coverage ratio (BCR)0.1750.1650.1940.1310.1230.128
Floor area ratio (FAR)2.1451.9873.1713.0503.2353.780
Notes: North is shown upward in the satellite images presented in the first row. Aerial image source: © Naver Maps (http://map.naver.com).
Table 3. Current and modified FAR values of study sites A to F and their variations for analysis.
Study SiteCurrent FAR and Variations
Current1.52.02.53.03.54.0
A2.1451.4801.9782.4772.9763.4753.974
B1.9871.5211.9872.4543.0763.5424.008
C3.1711.5332.0792.4432.9893.5354.084
D3.0501.4611.9502.5613.0503.5384.027
E3.2351.4891.9542.5373.0023.4684.050
F3.7801.4991.9792.5803.0603.5404.019
Table 4. Estimation of crop yields (grams per housing unit) for each study site at the six density levels.
CropDirect Sunlight DurationFARStudy Site
ABCDEF
Root vegetables (Carrot)3 or more hours1.5459.95299.50328.71319.82603.00400.24
2.0313.24195.03220.14206.26423.67273.18
2.5230.17133.87161.03139.69313.89195.21
3.0175.9291.94119.84103.94247.78149.11
3.5138.9869.8092.6781.28201.31117.44
4.095.4455.0873.4865.91166.4394.45
Fruit vegetables (Cucumber) (Eggplant)6 or more hours1.5208.4150.73124.7285.56207.57198.50
2.0119.4926.0069.2047.38124.12154.51
2.576.1014.6645.6127.3576.92122.14
3.051.048.3329.2817.7954.3598.68
3.536.095.8519.9012.1640.9080.65
4.018.434.2414.258.8231.6166.25

