Complex Heat Pump Operational Mode Identification and Comparison for Use in Electric Vehicles


Abstract
1. Introduction
1.1. Low Temperature Issues with EVs
1.2. Potential Solutions
- Ambient
- Battery
- Inverter
- Motor
- Transmission
- Thermal Battery
- Cabin exhaust air
2. Aims
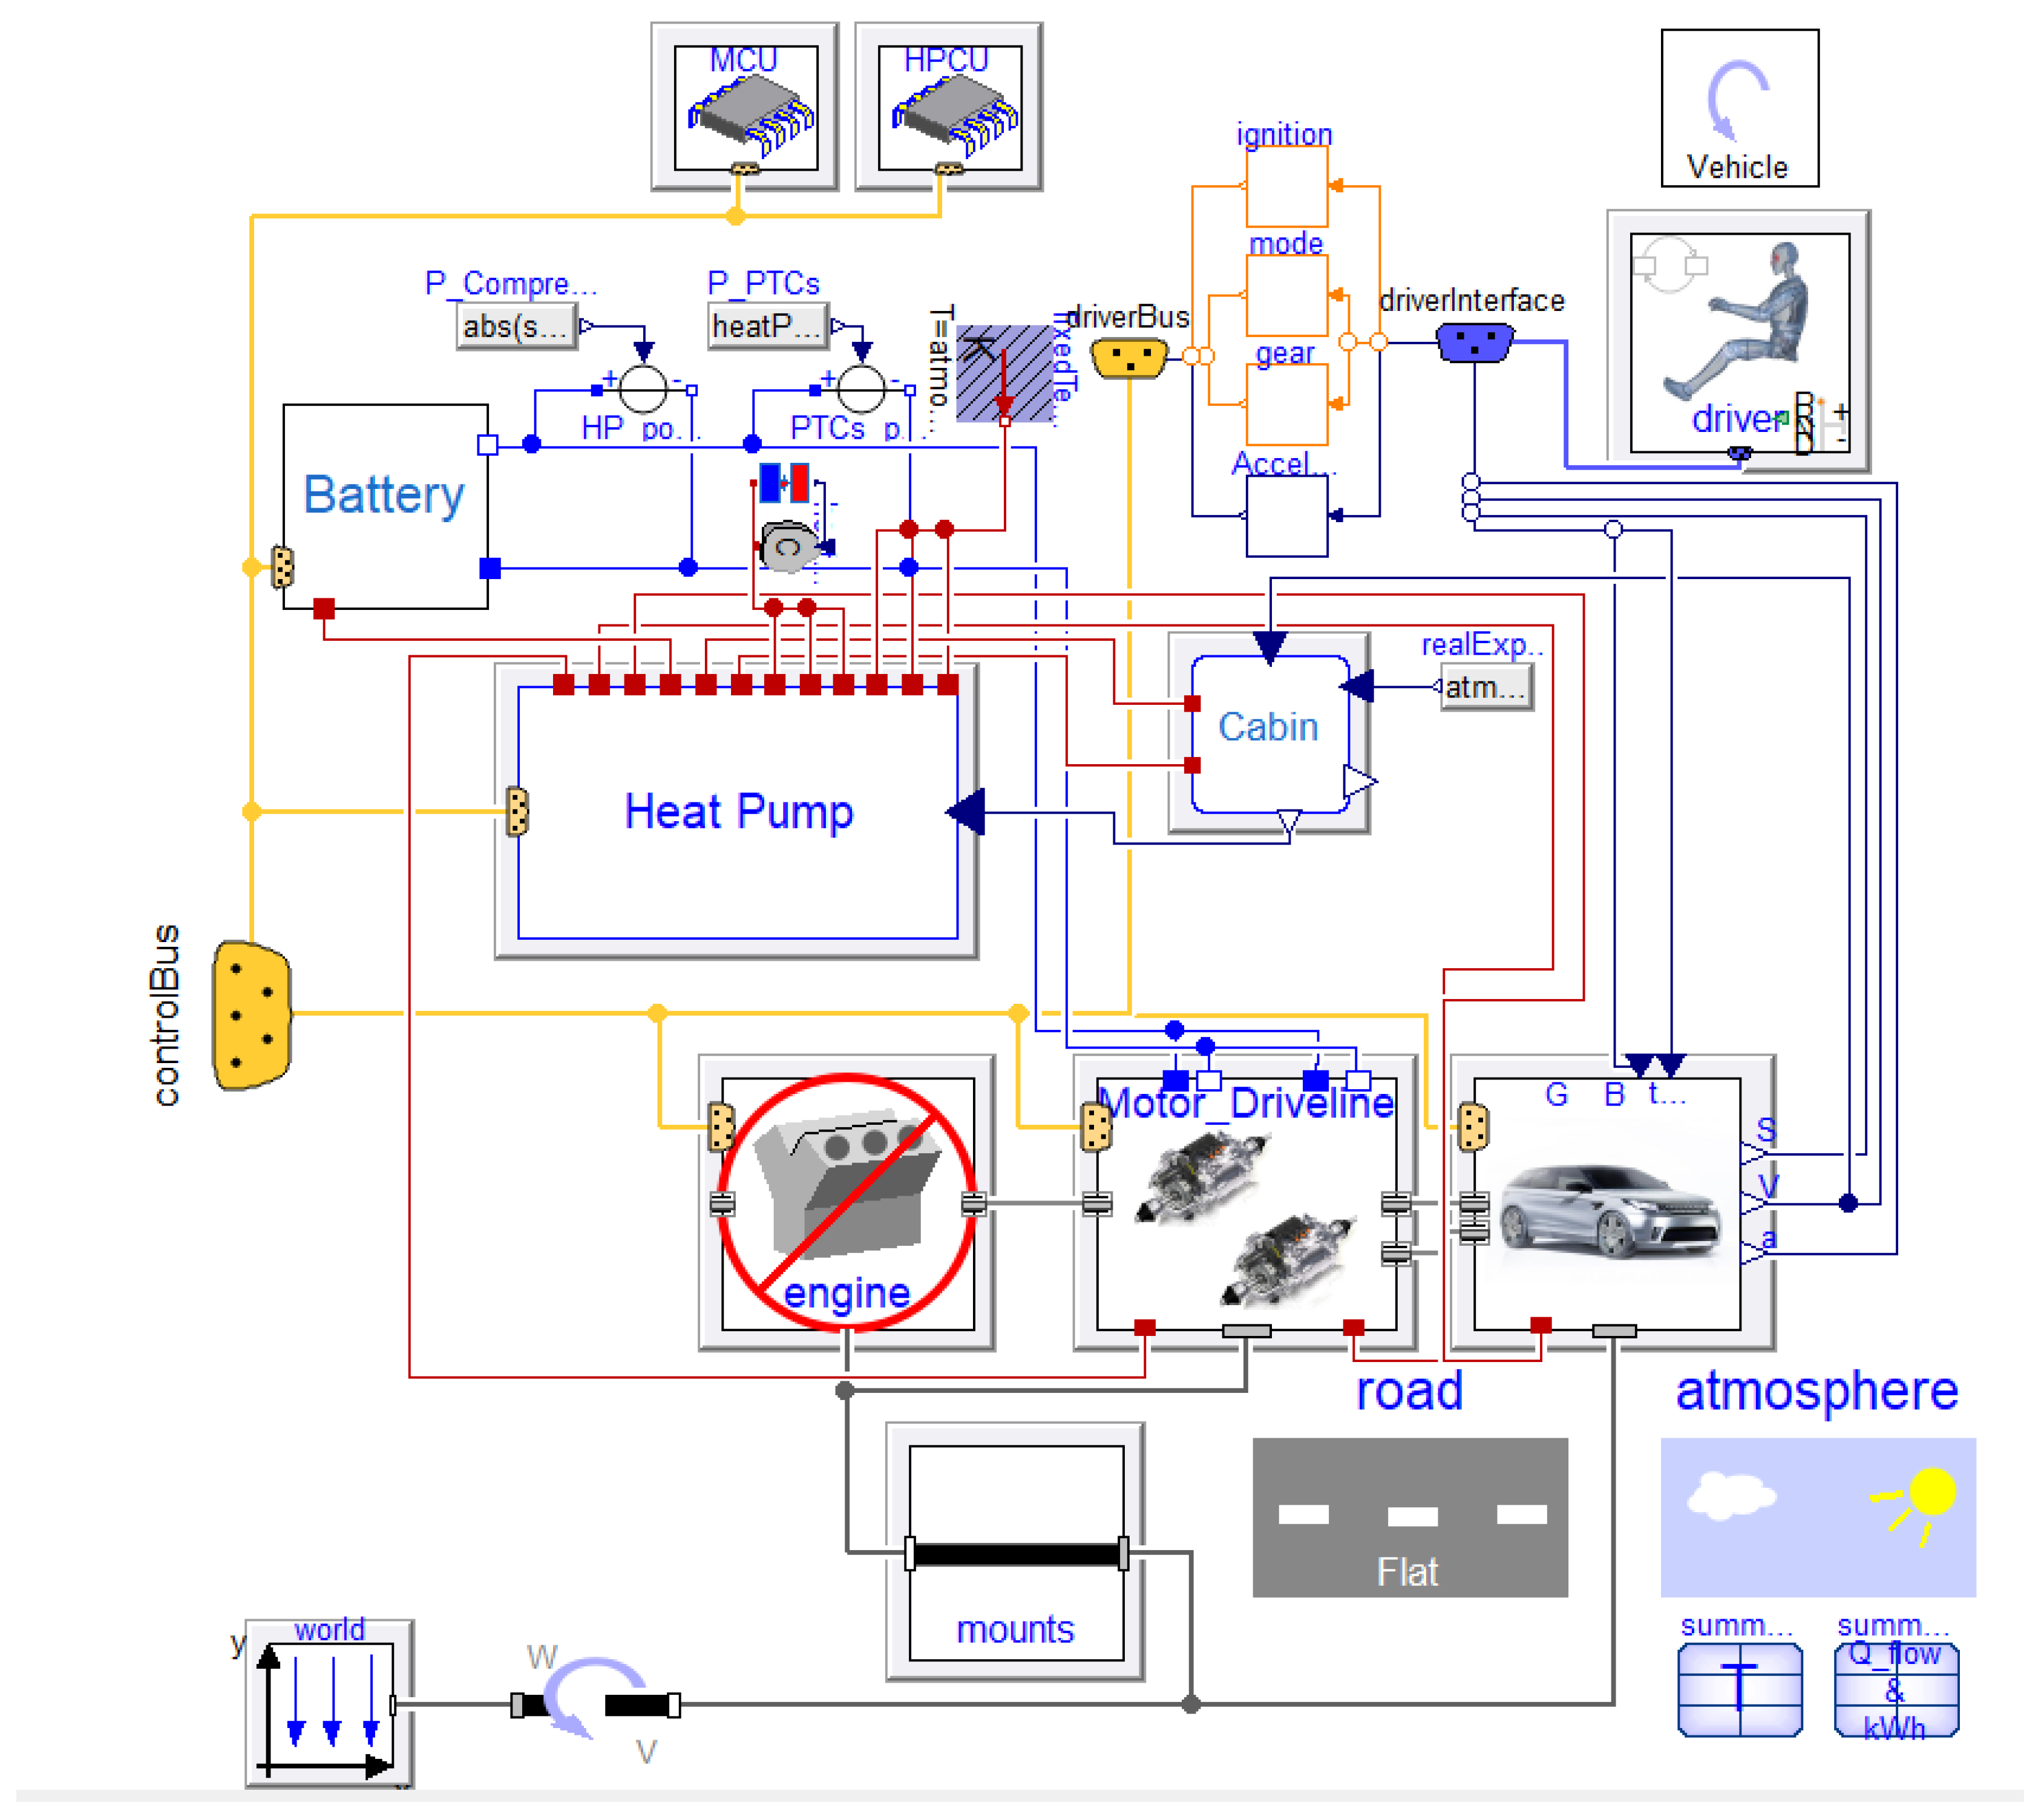
3. Model Development
3.1. Model Details
3.1.1. Battery
3.1.2. Motor
3.1.3. Thermal Storage
3.1.4. Transmission
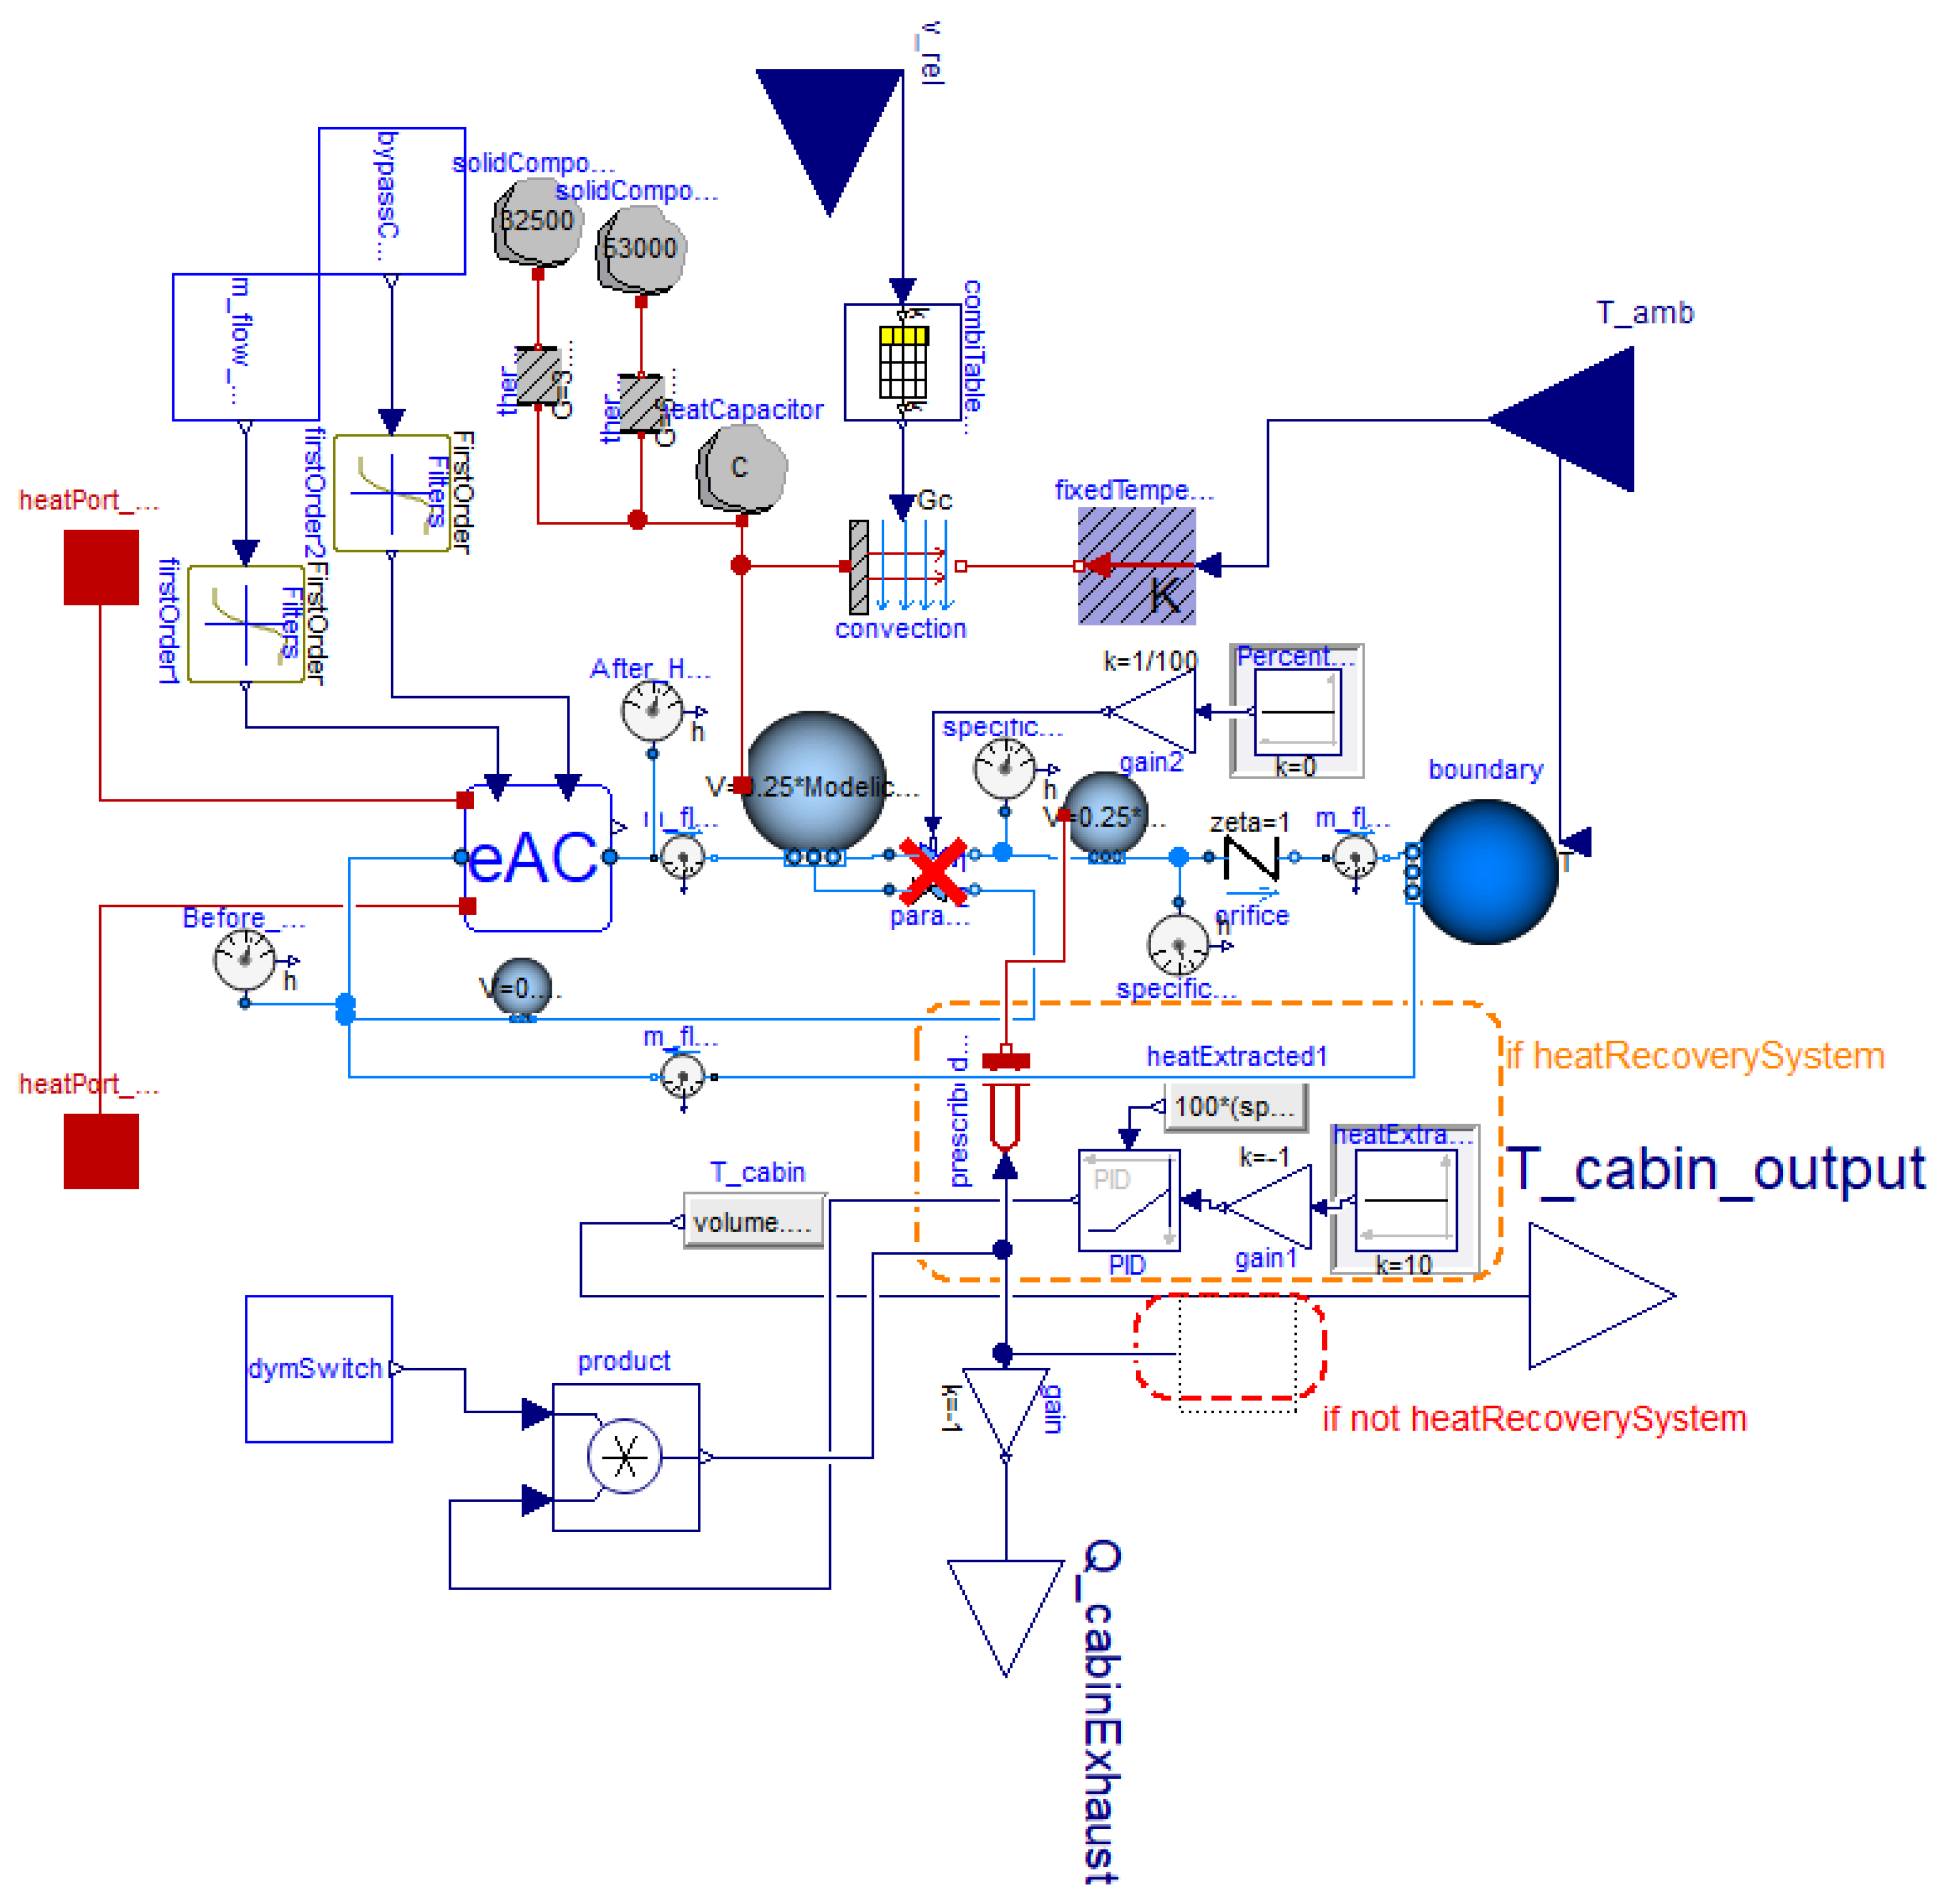
3.1.5. Cabin
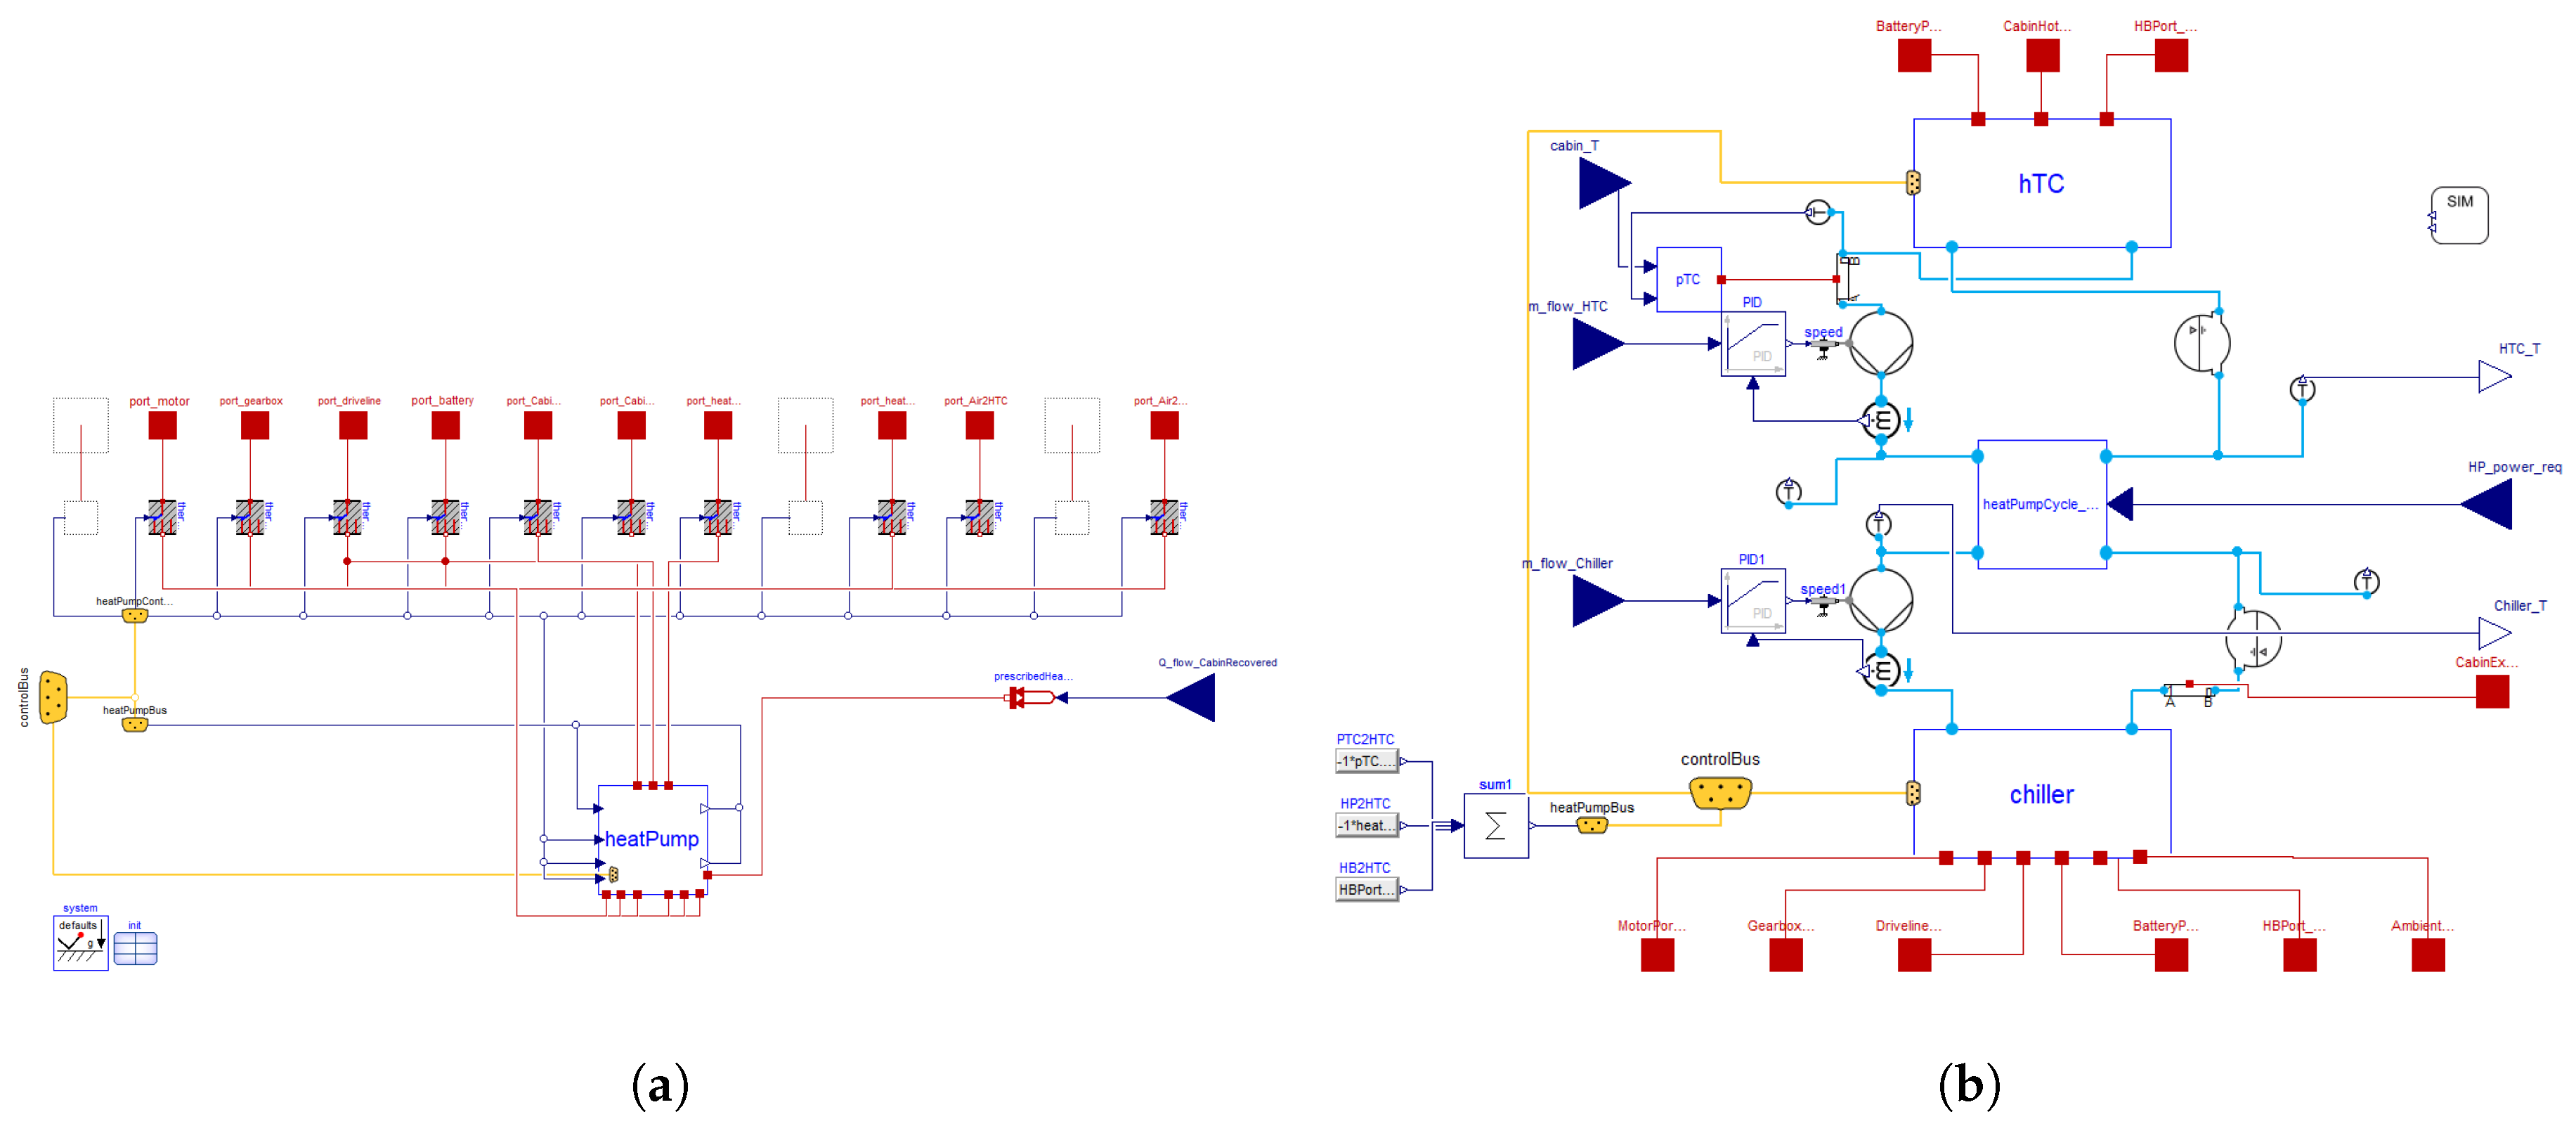
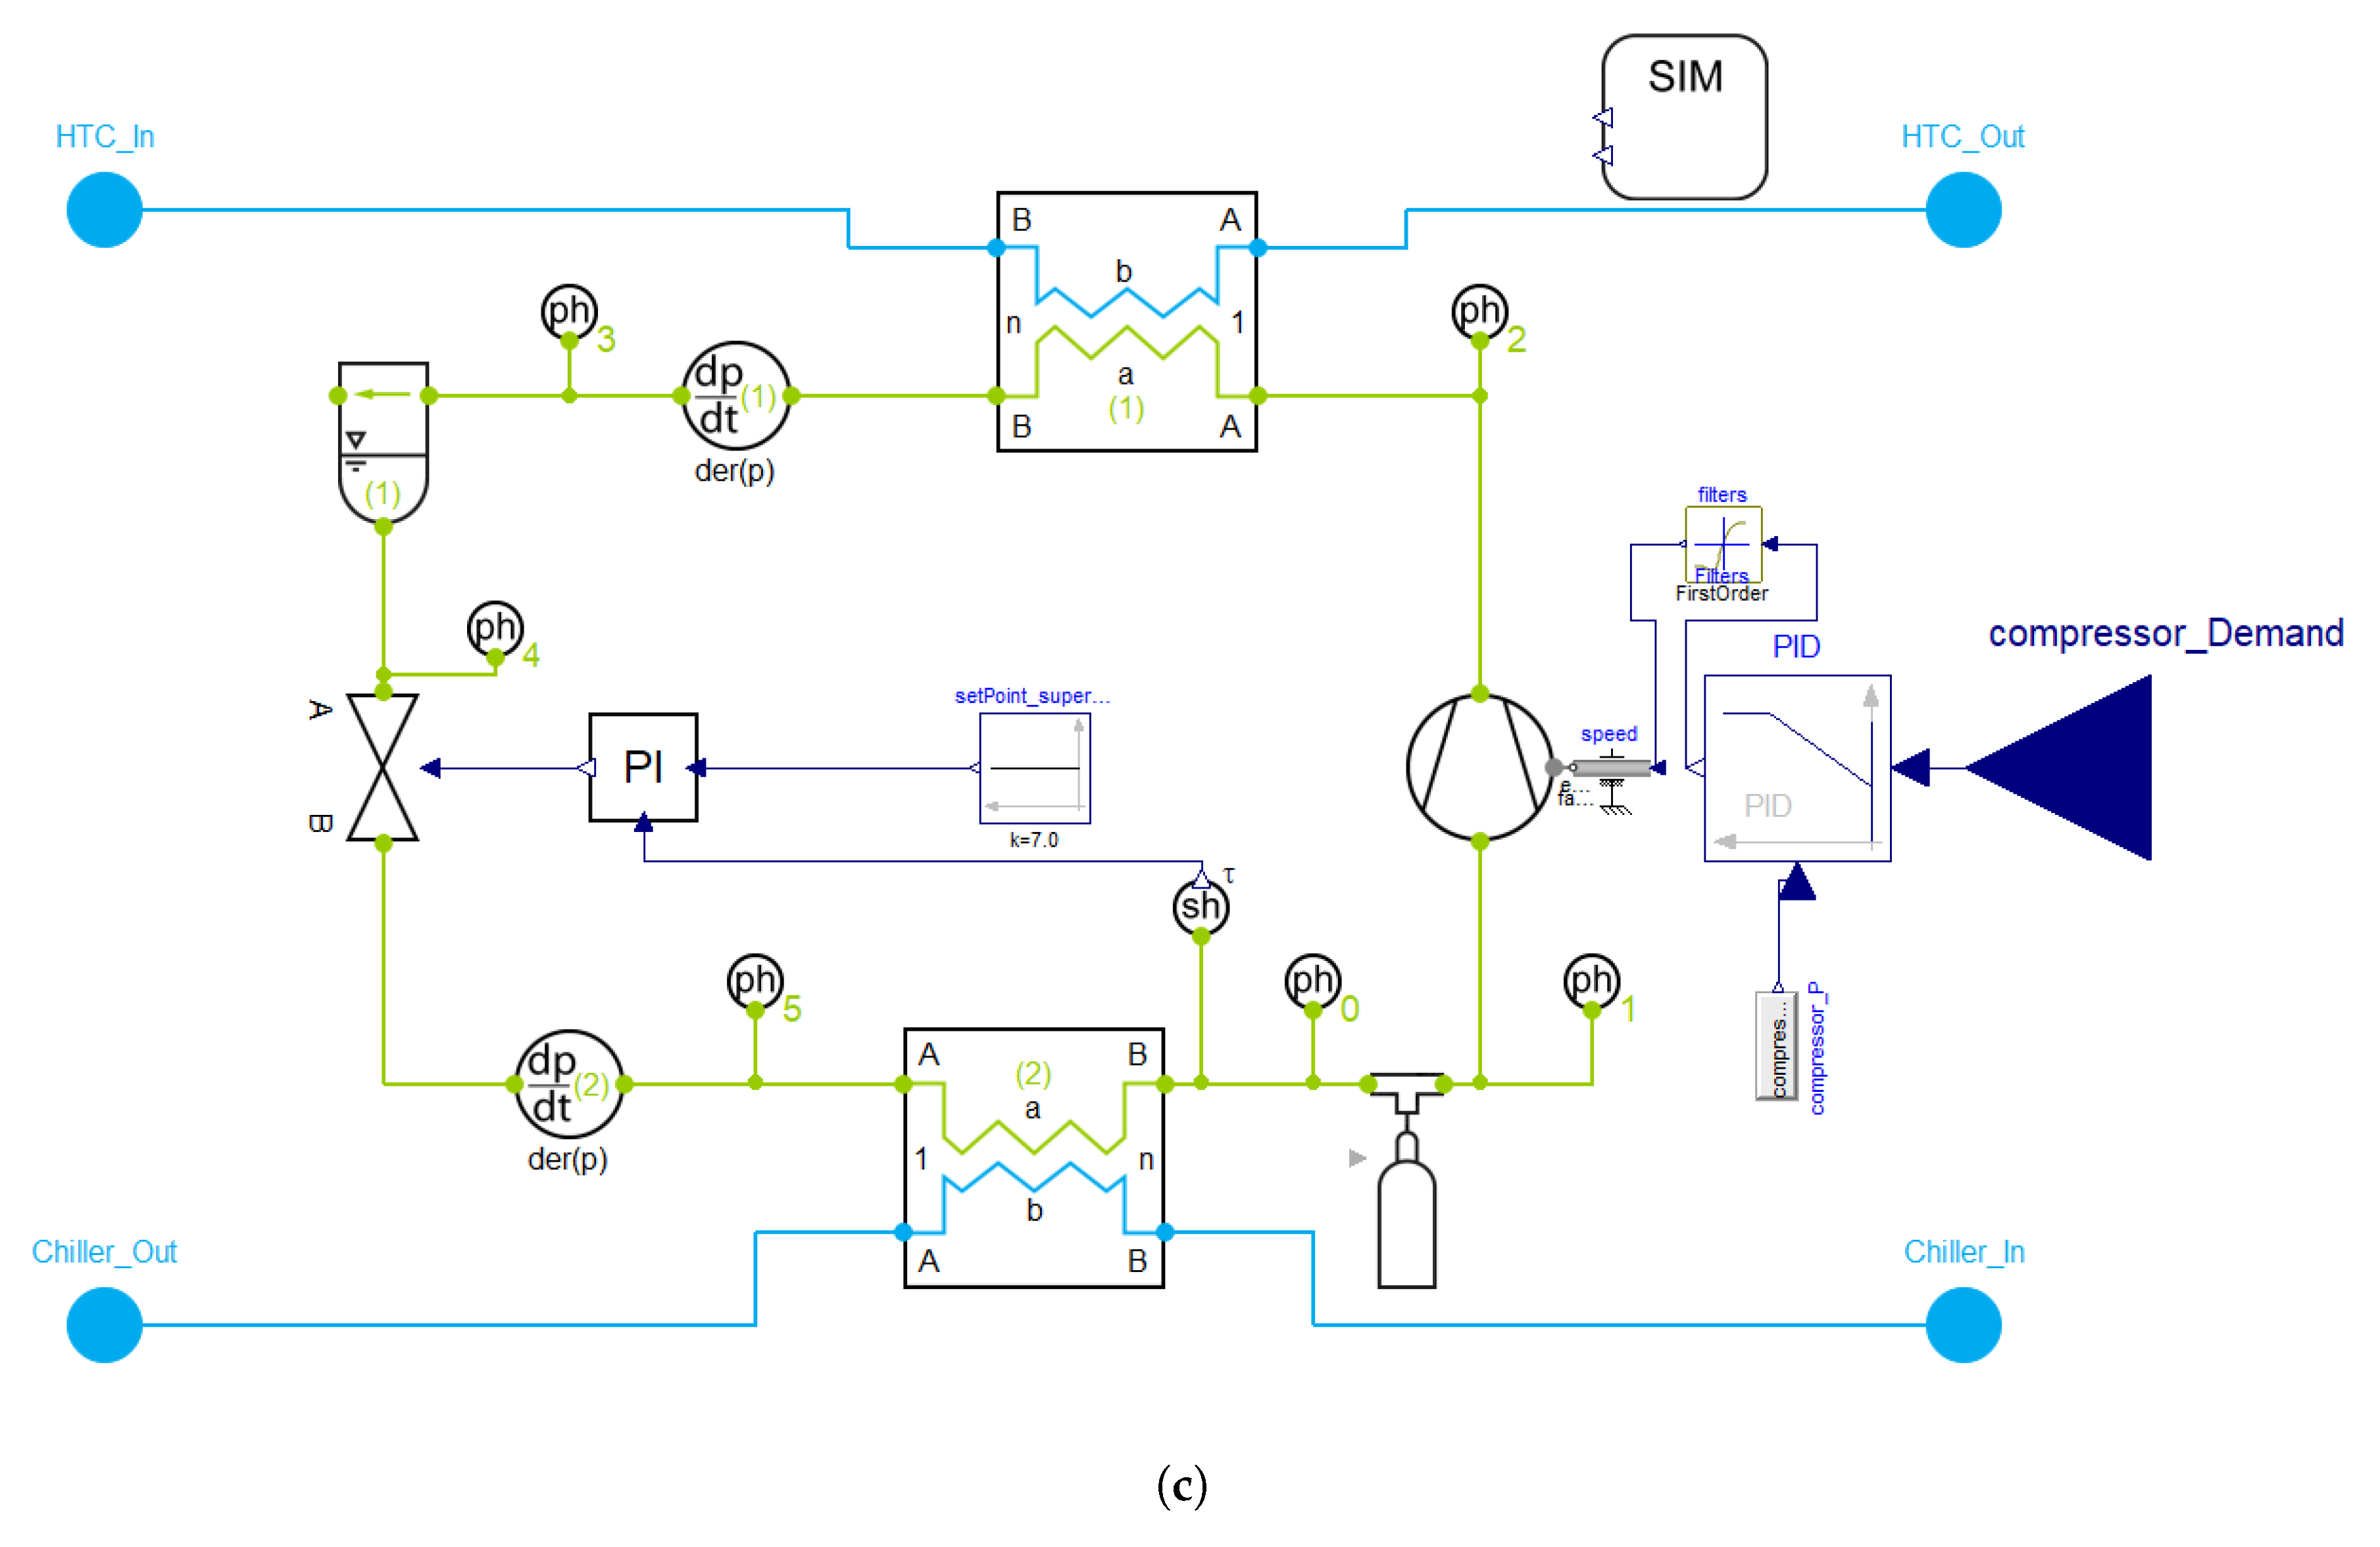
3.1.6. Heat Pump
3.1.7. PTC Heater
3.2. Parametrisation
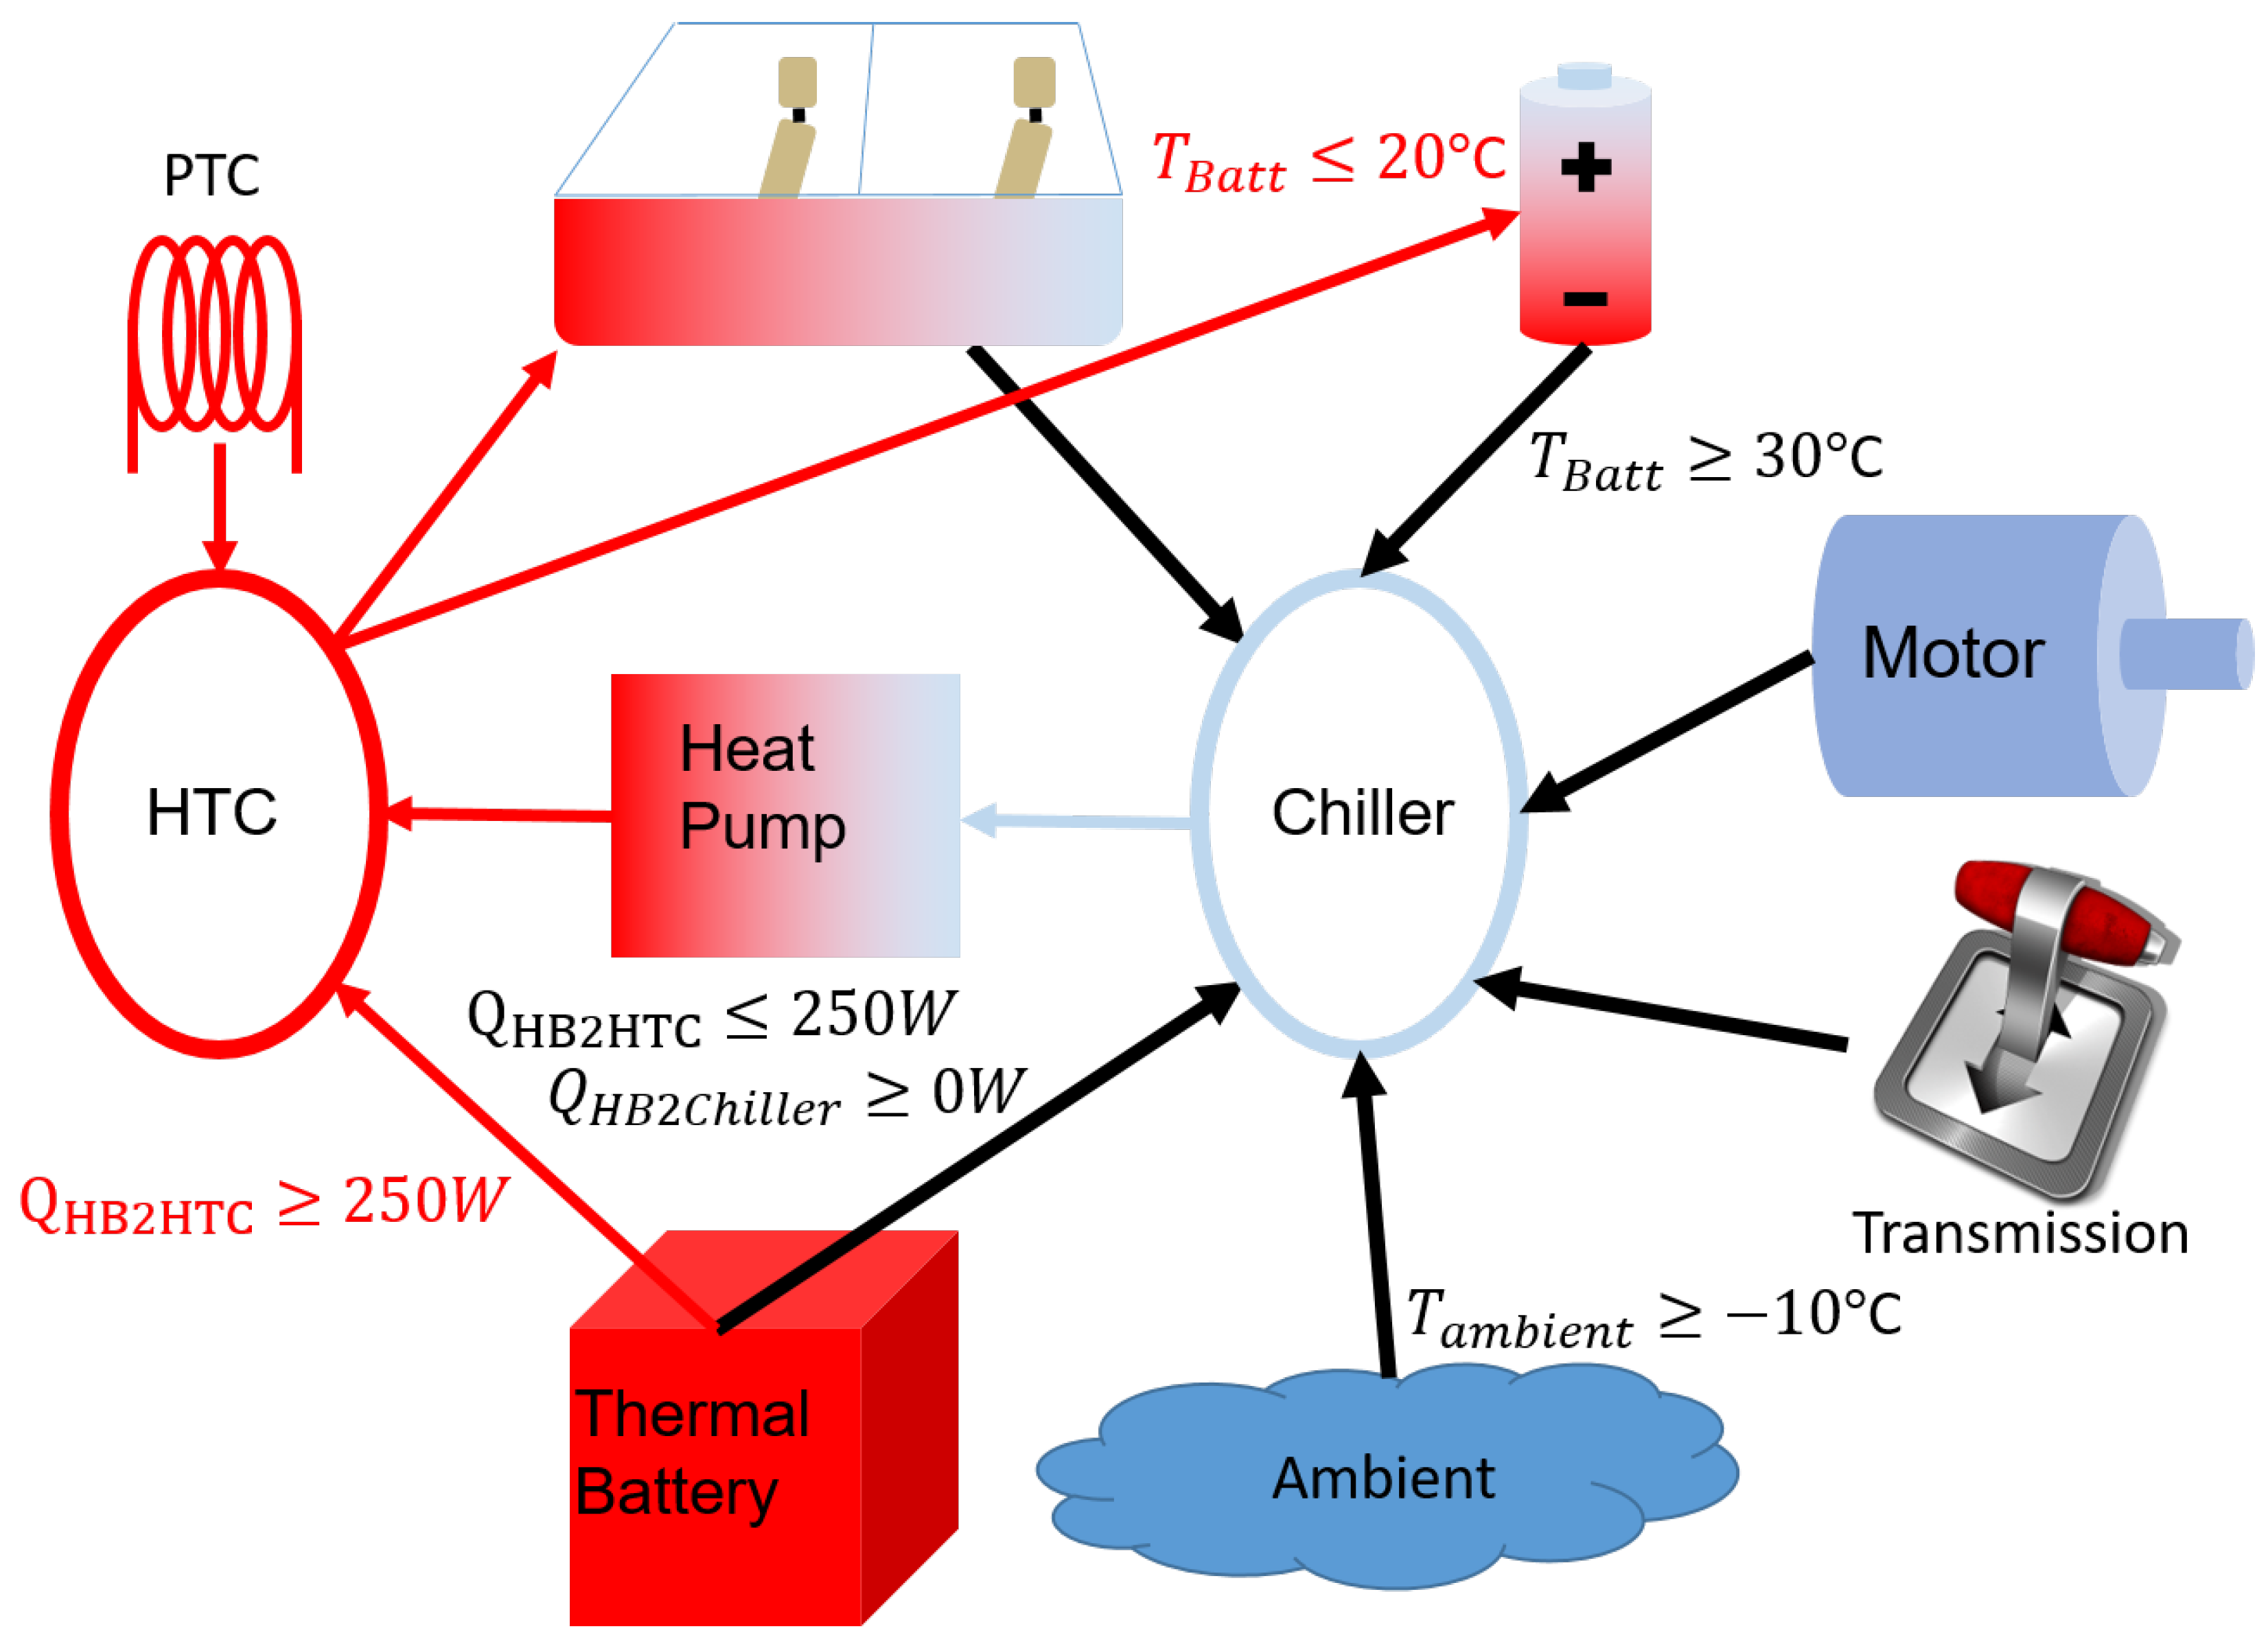
3.3. Model Usage Cases
- Motor
- Transmission
- Battery
- Thermal Battery
- Cabin Exhaust
4. Results
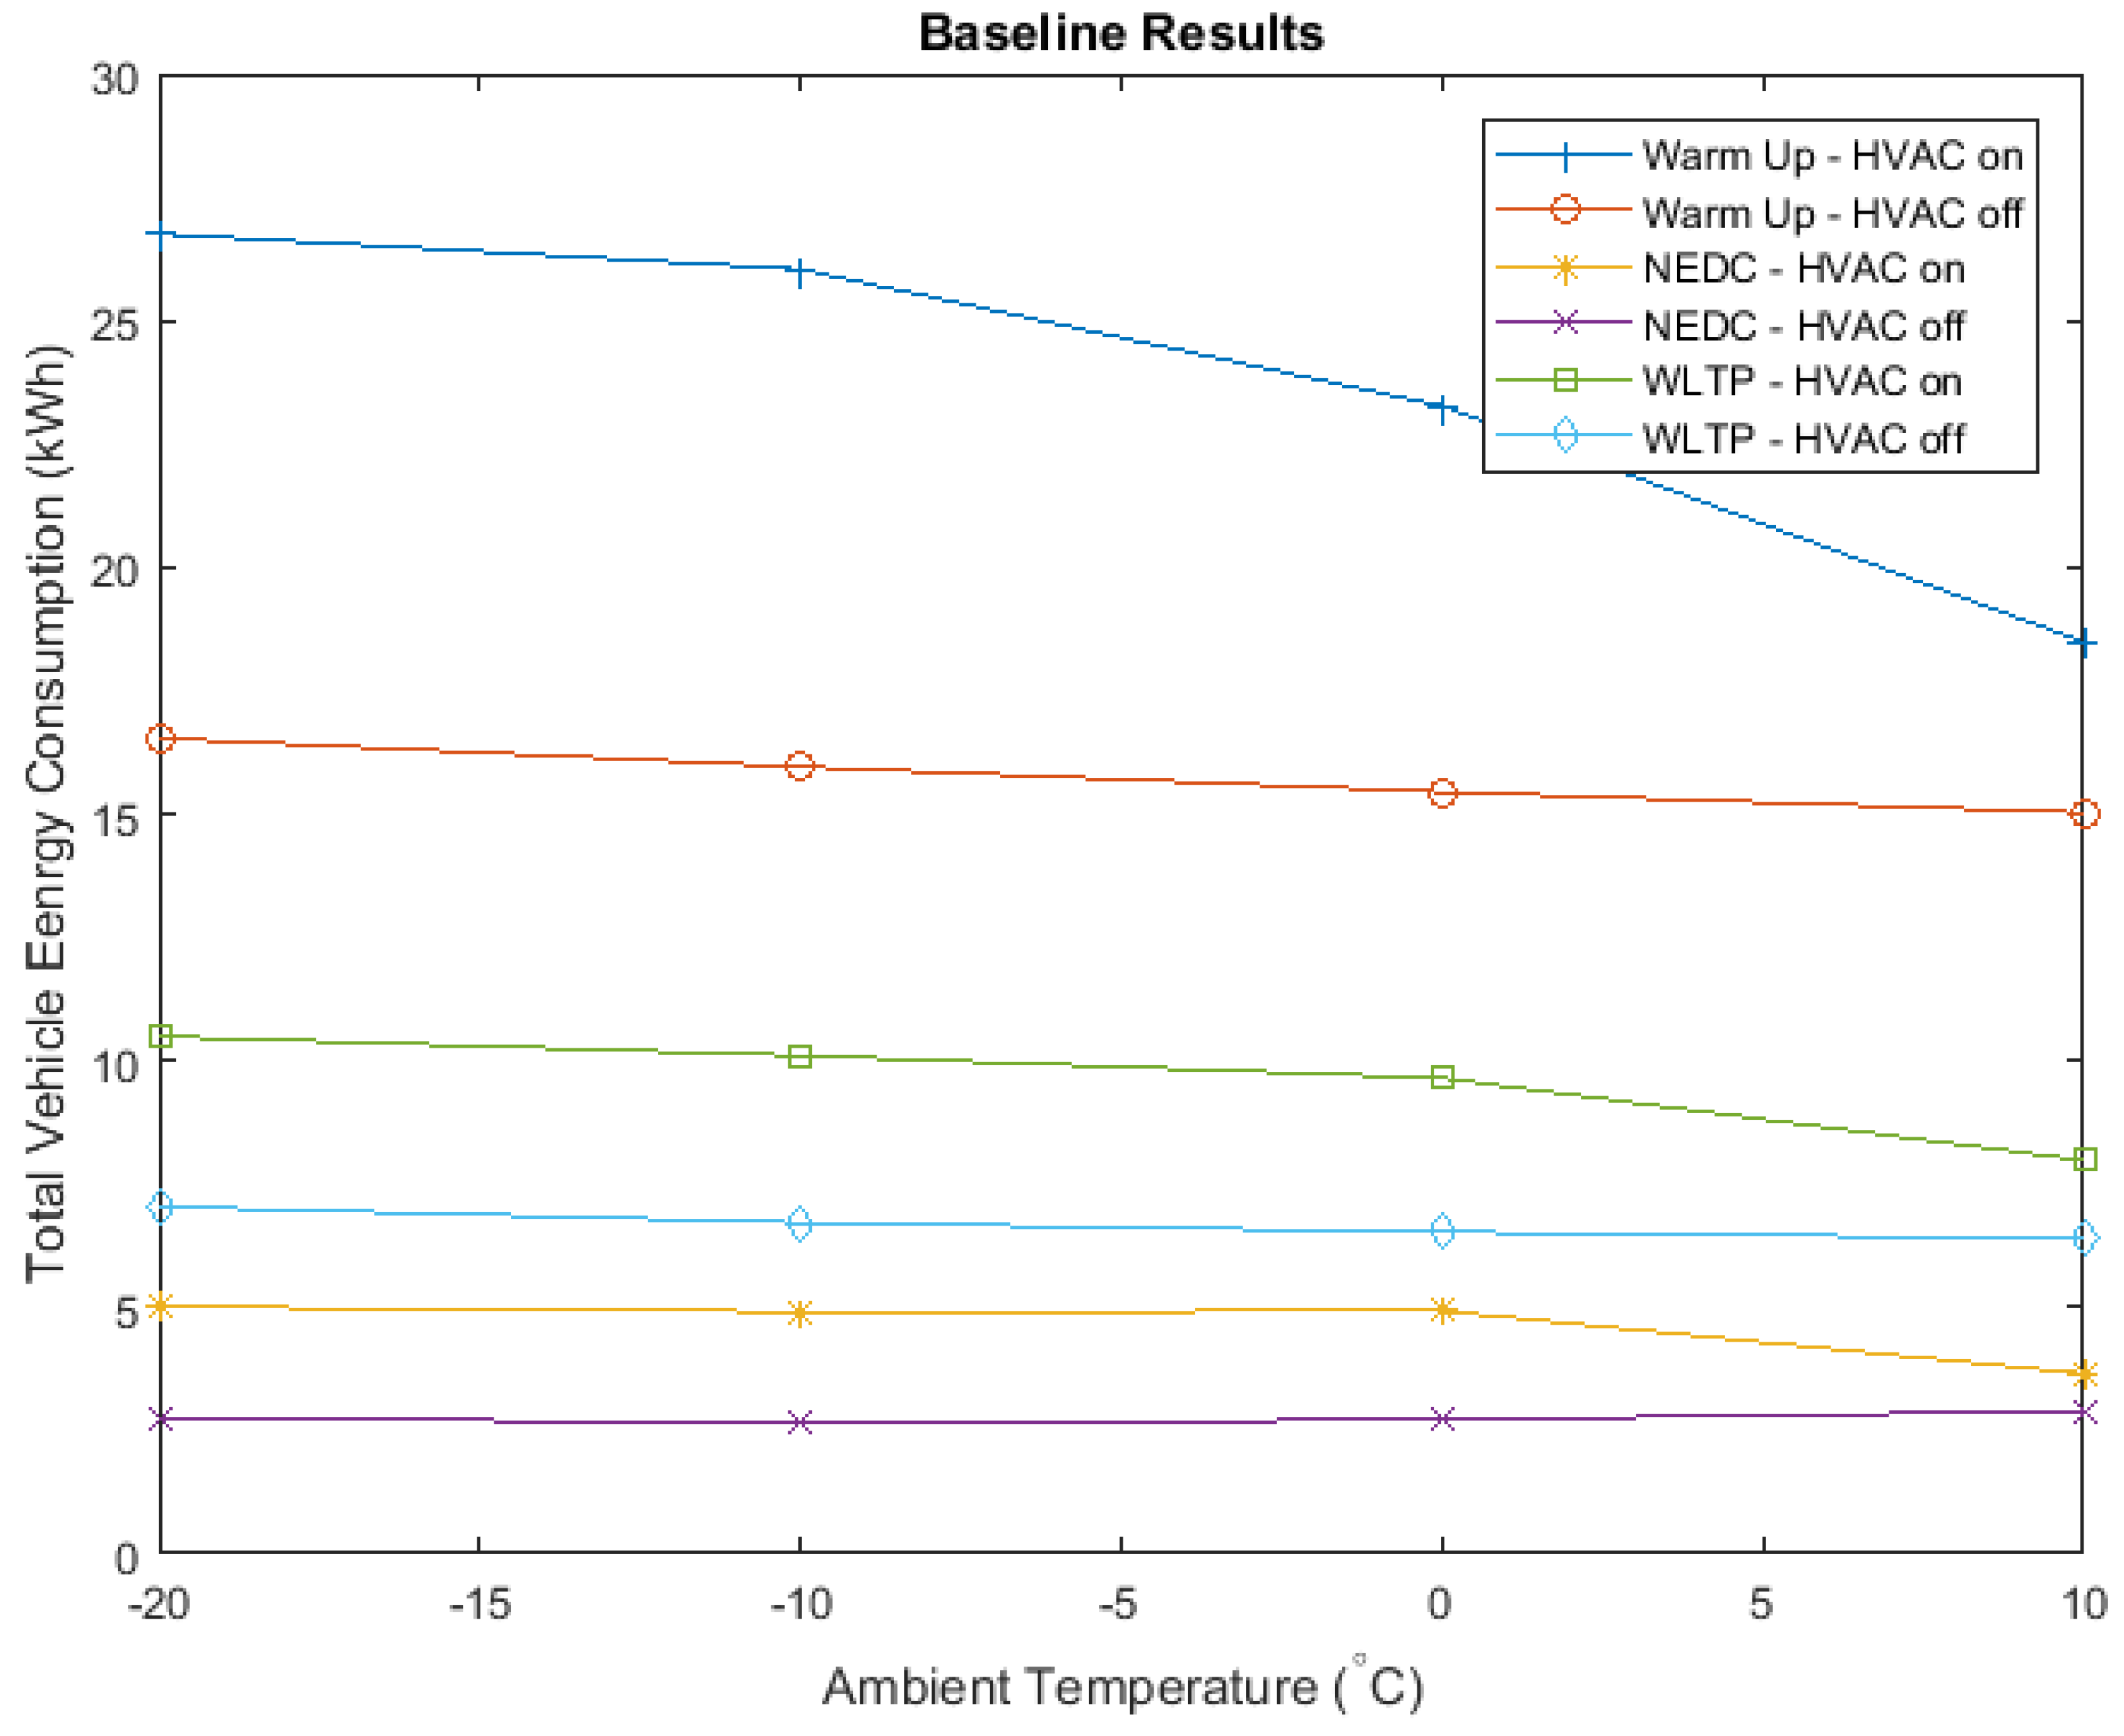
4.1. Baseline
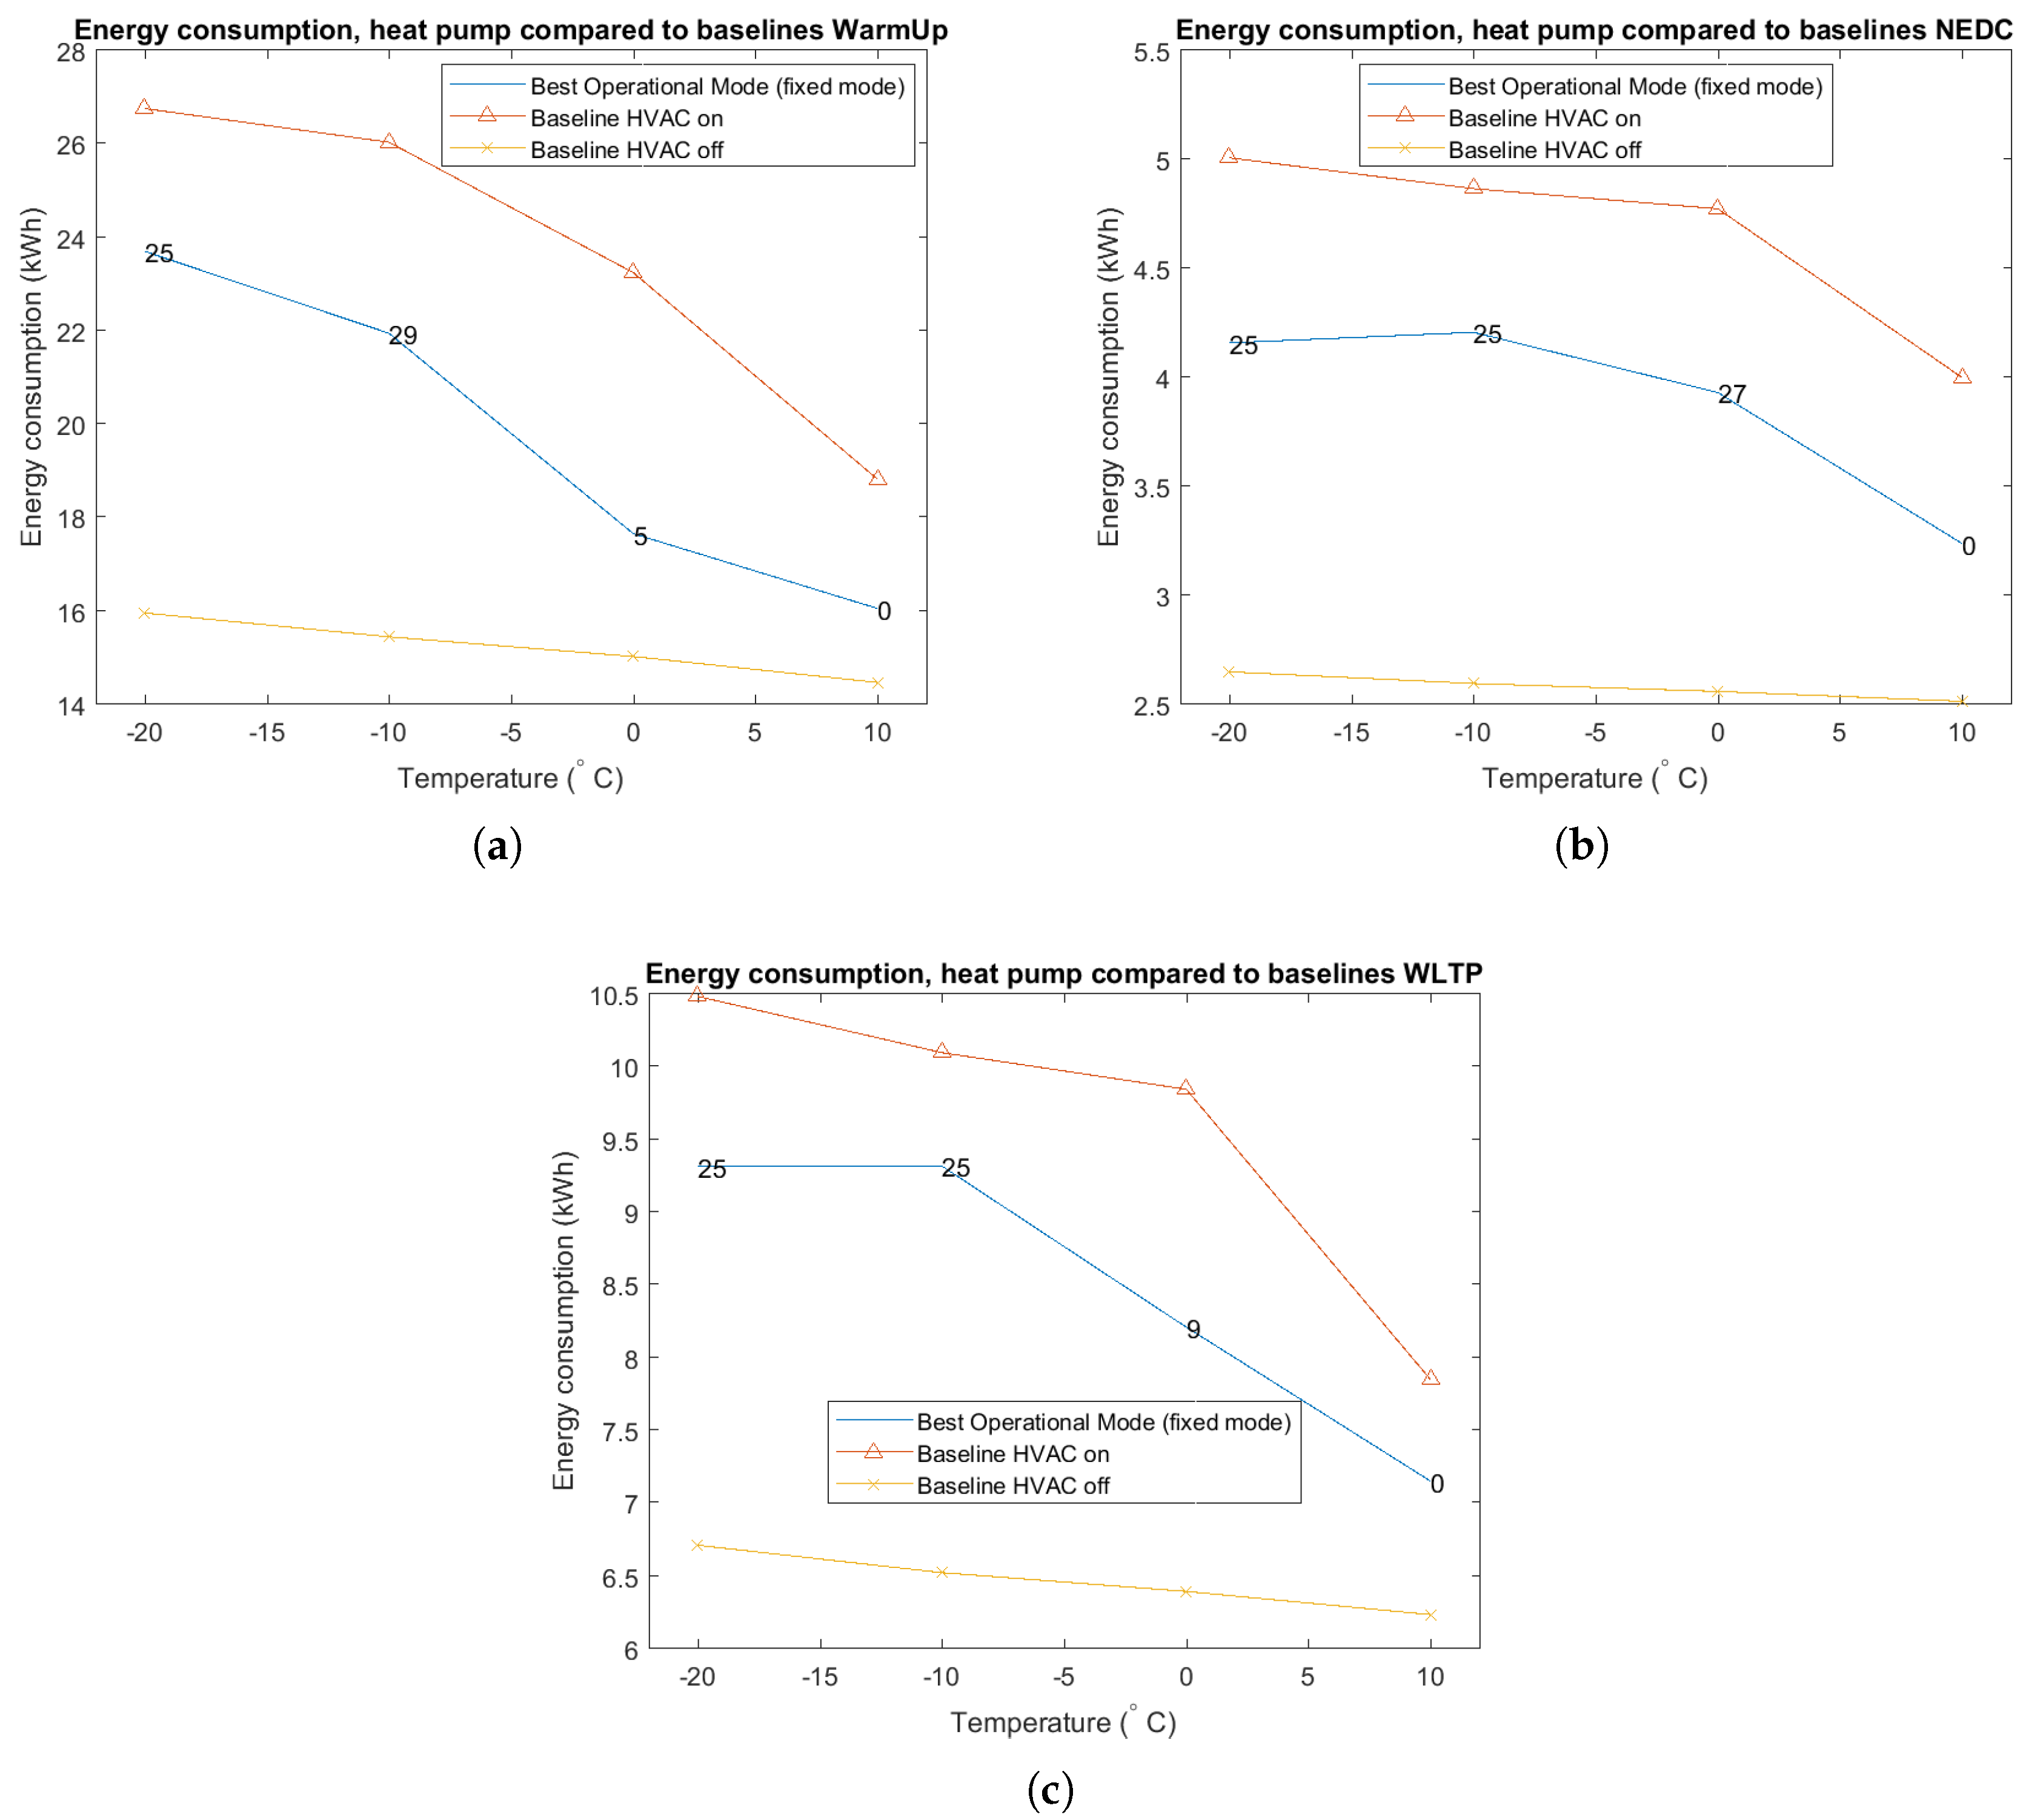
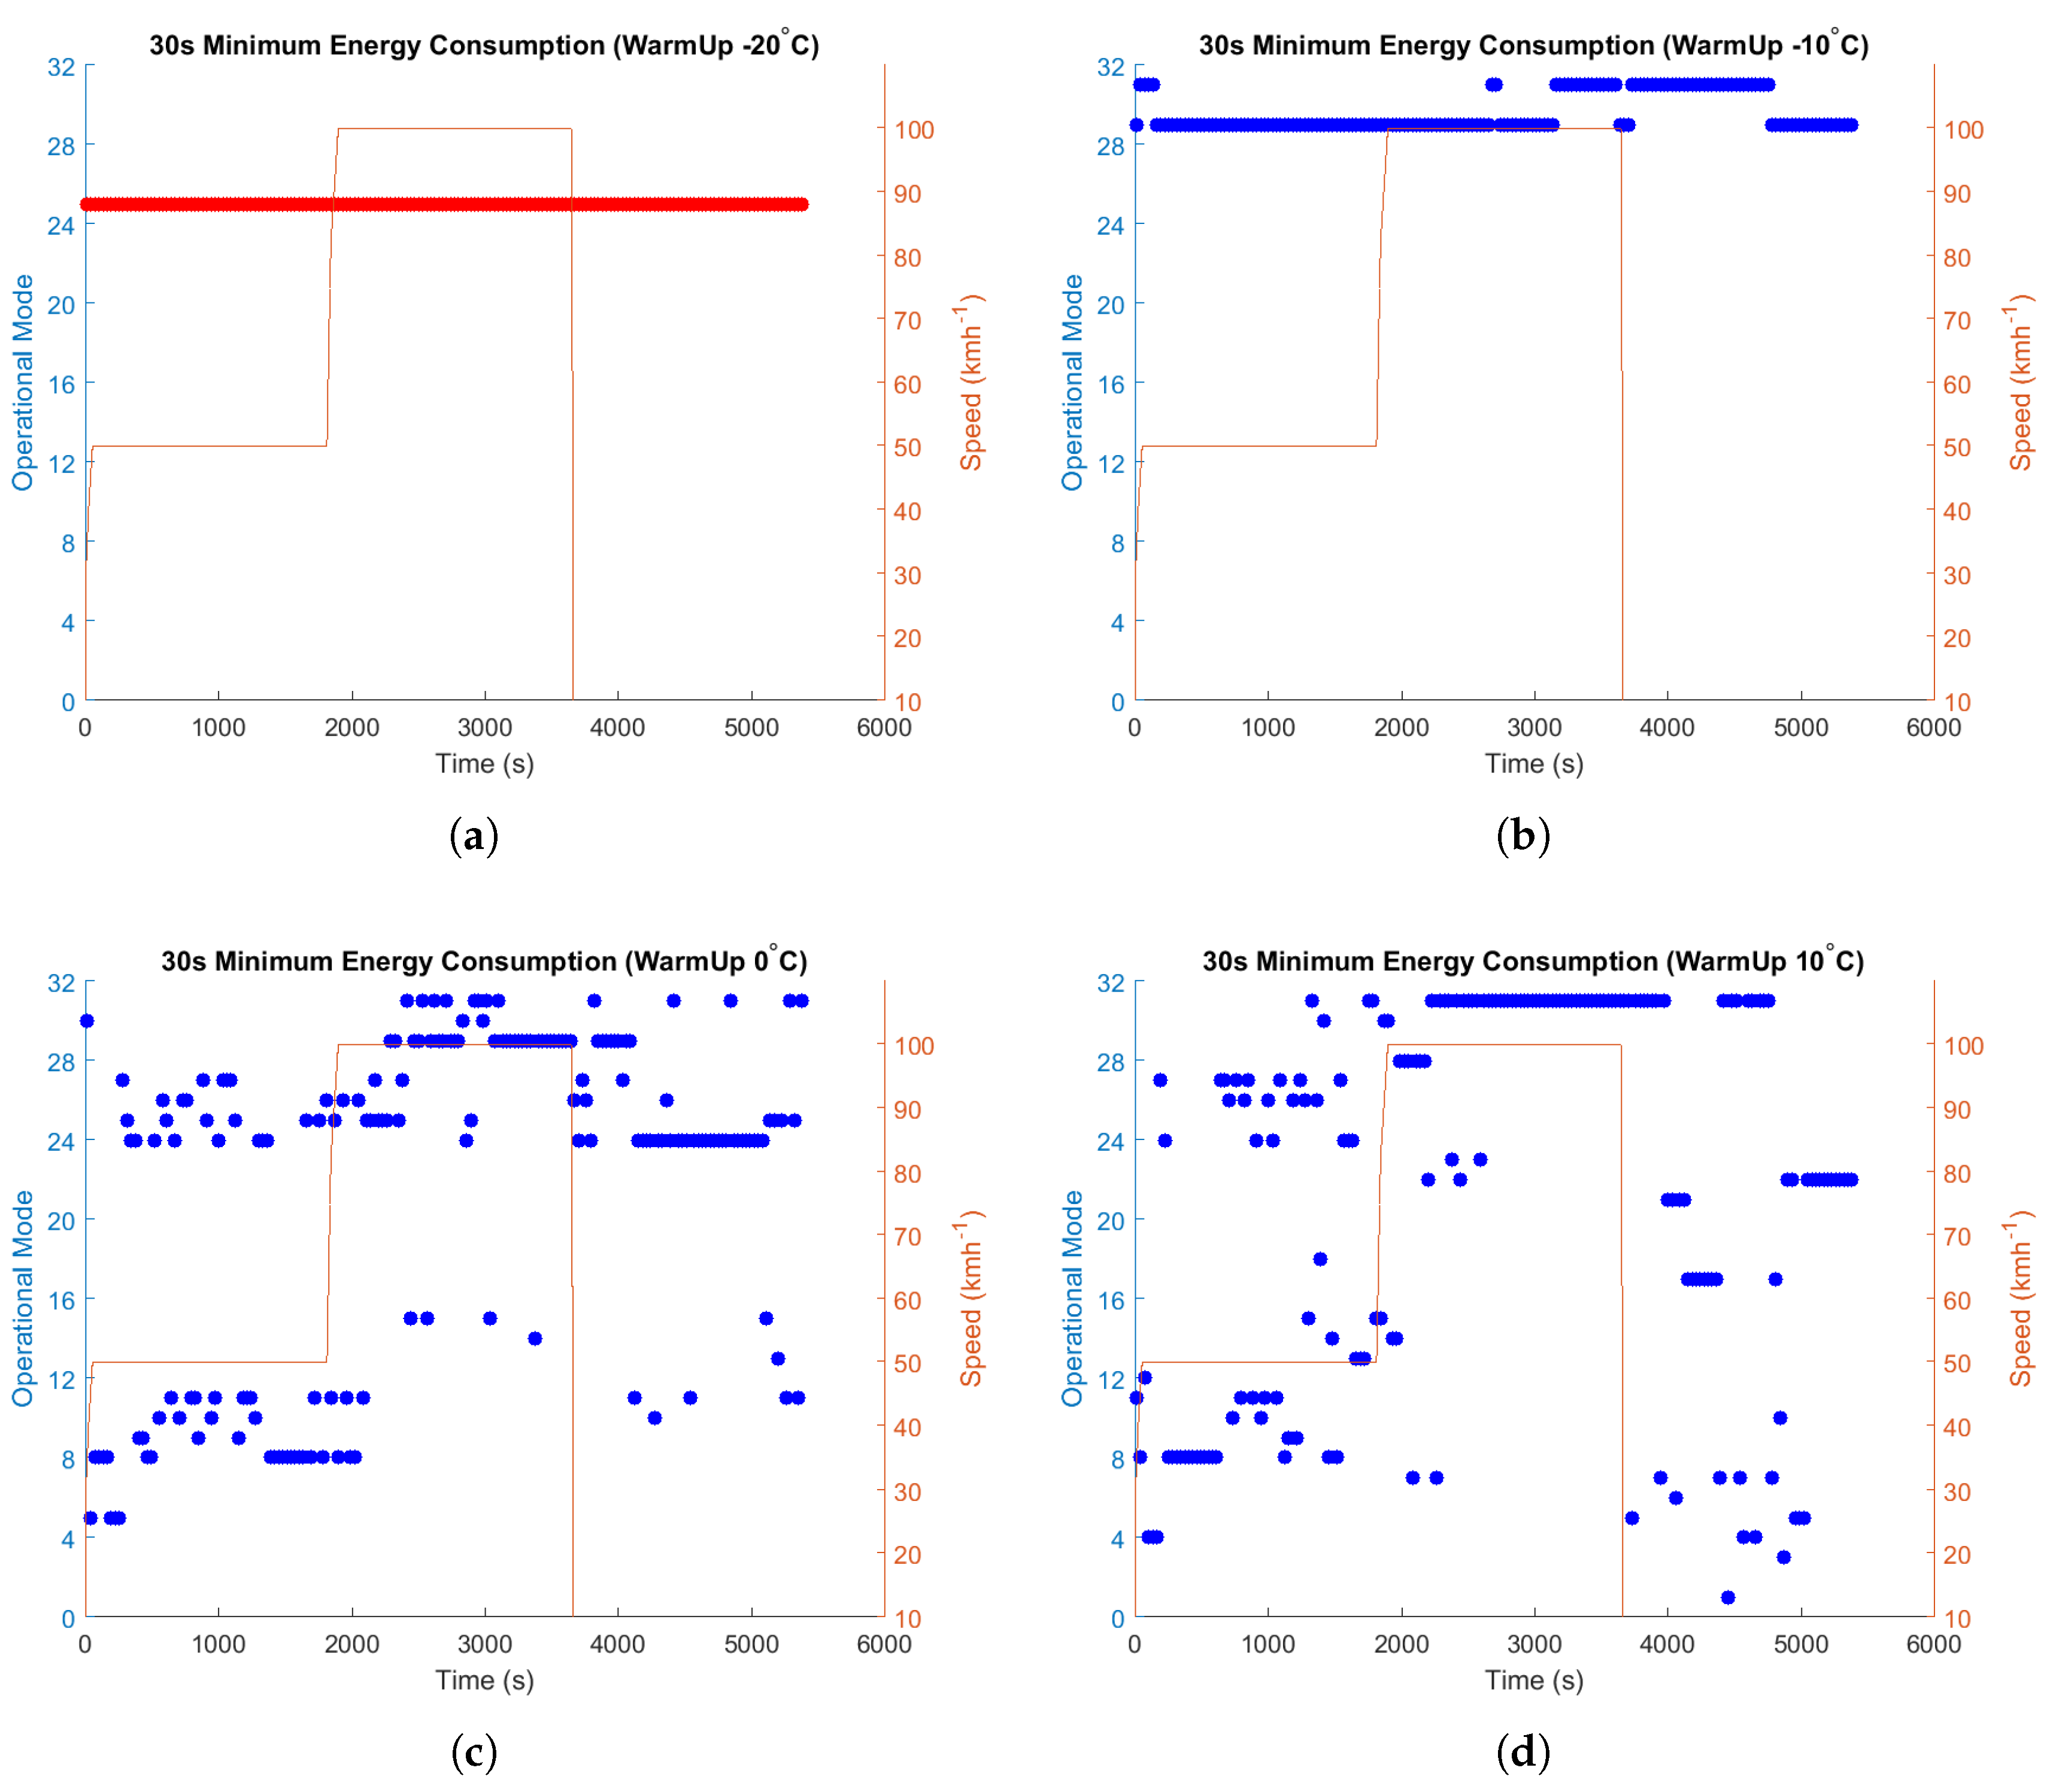
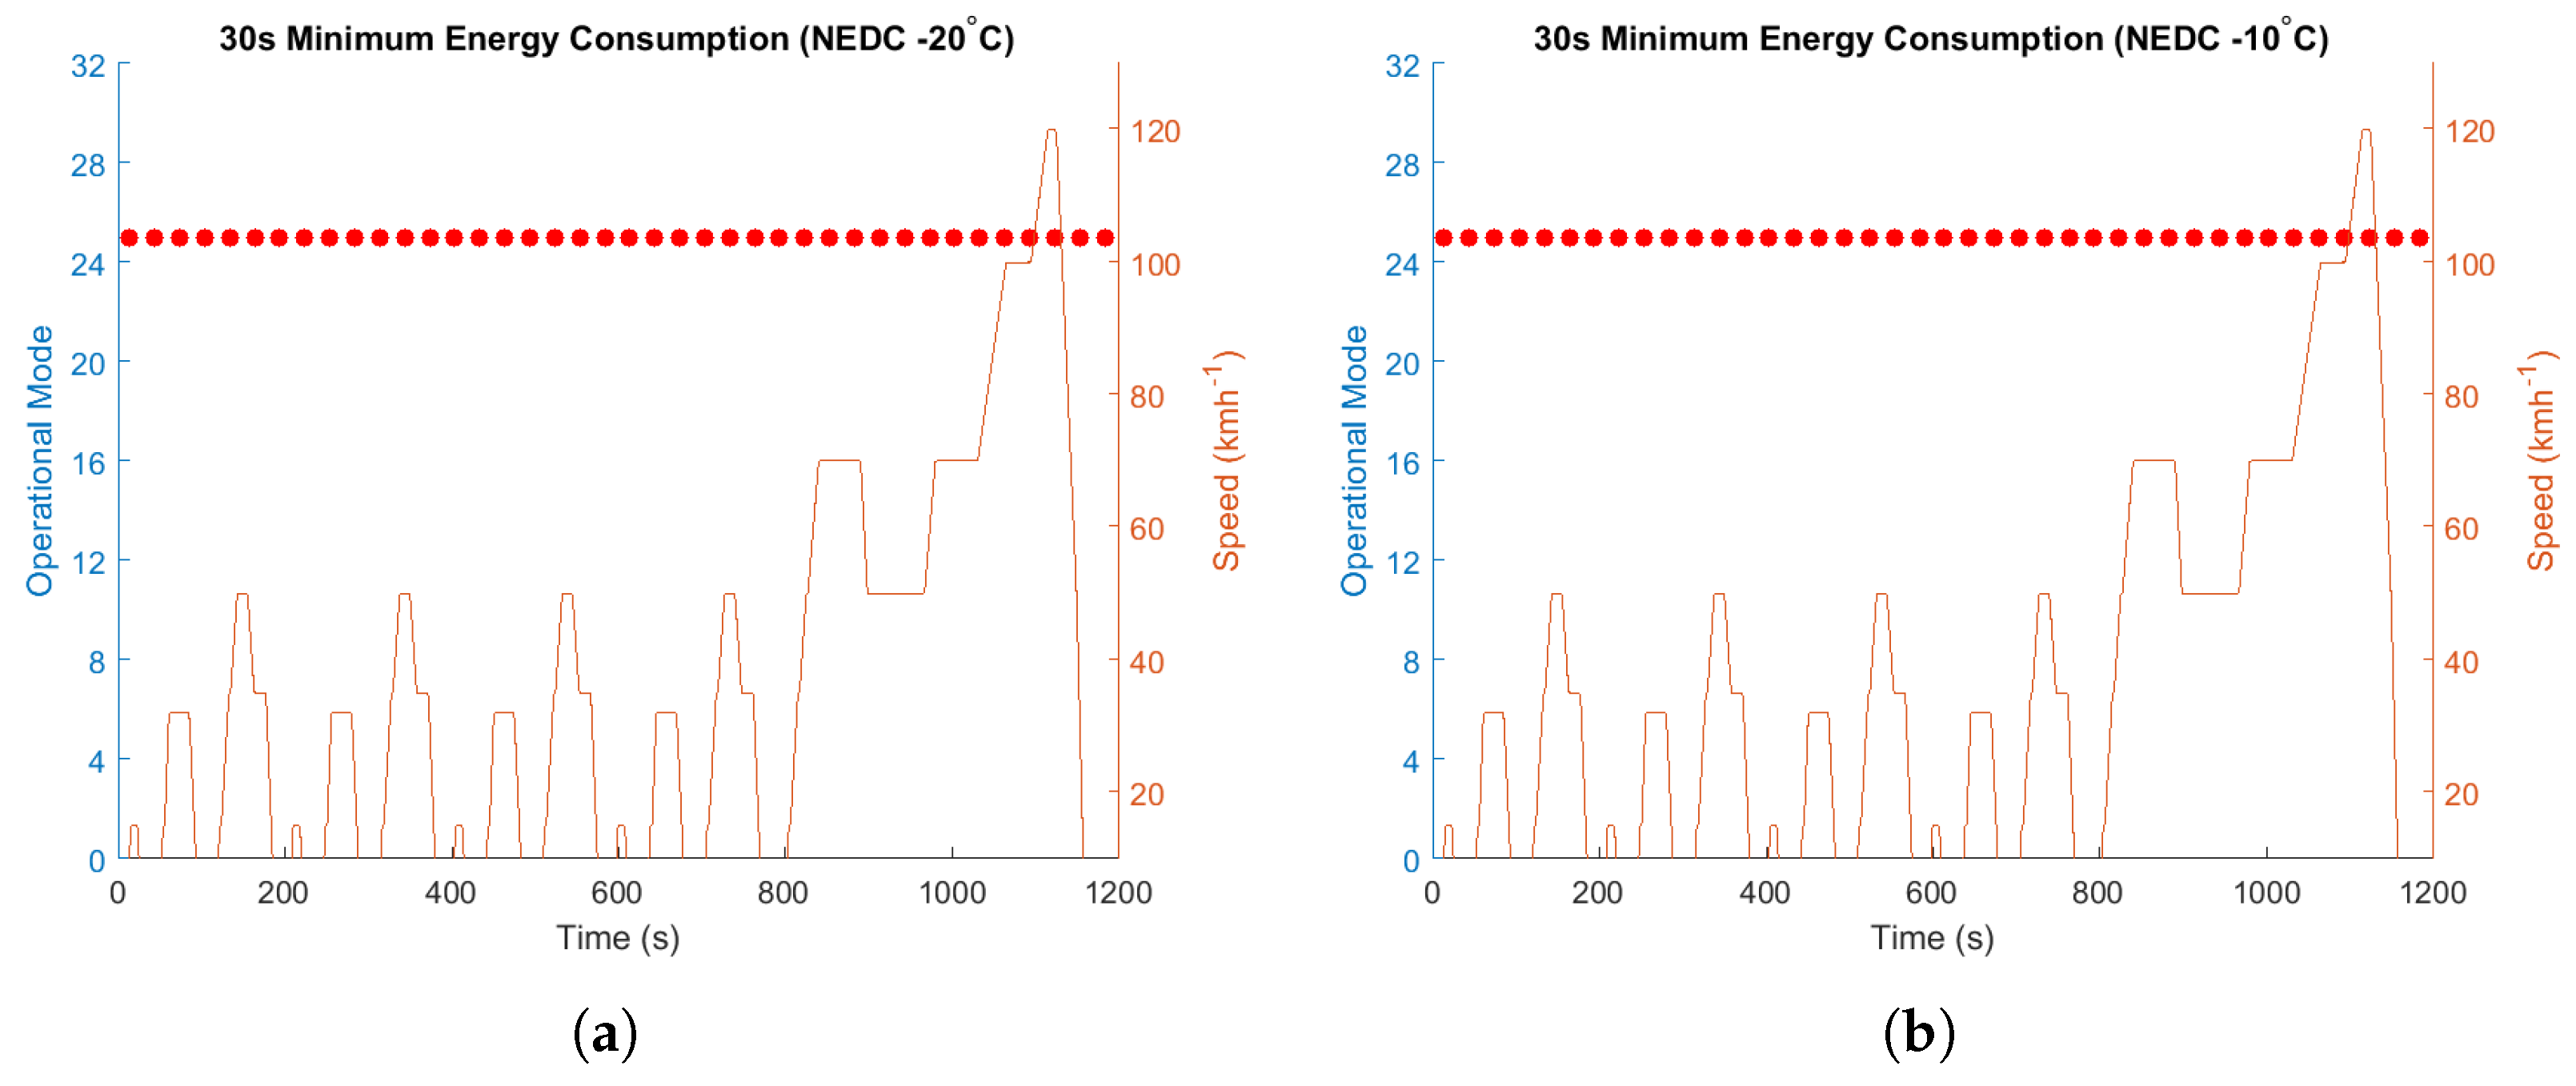
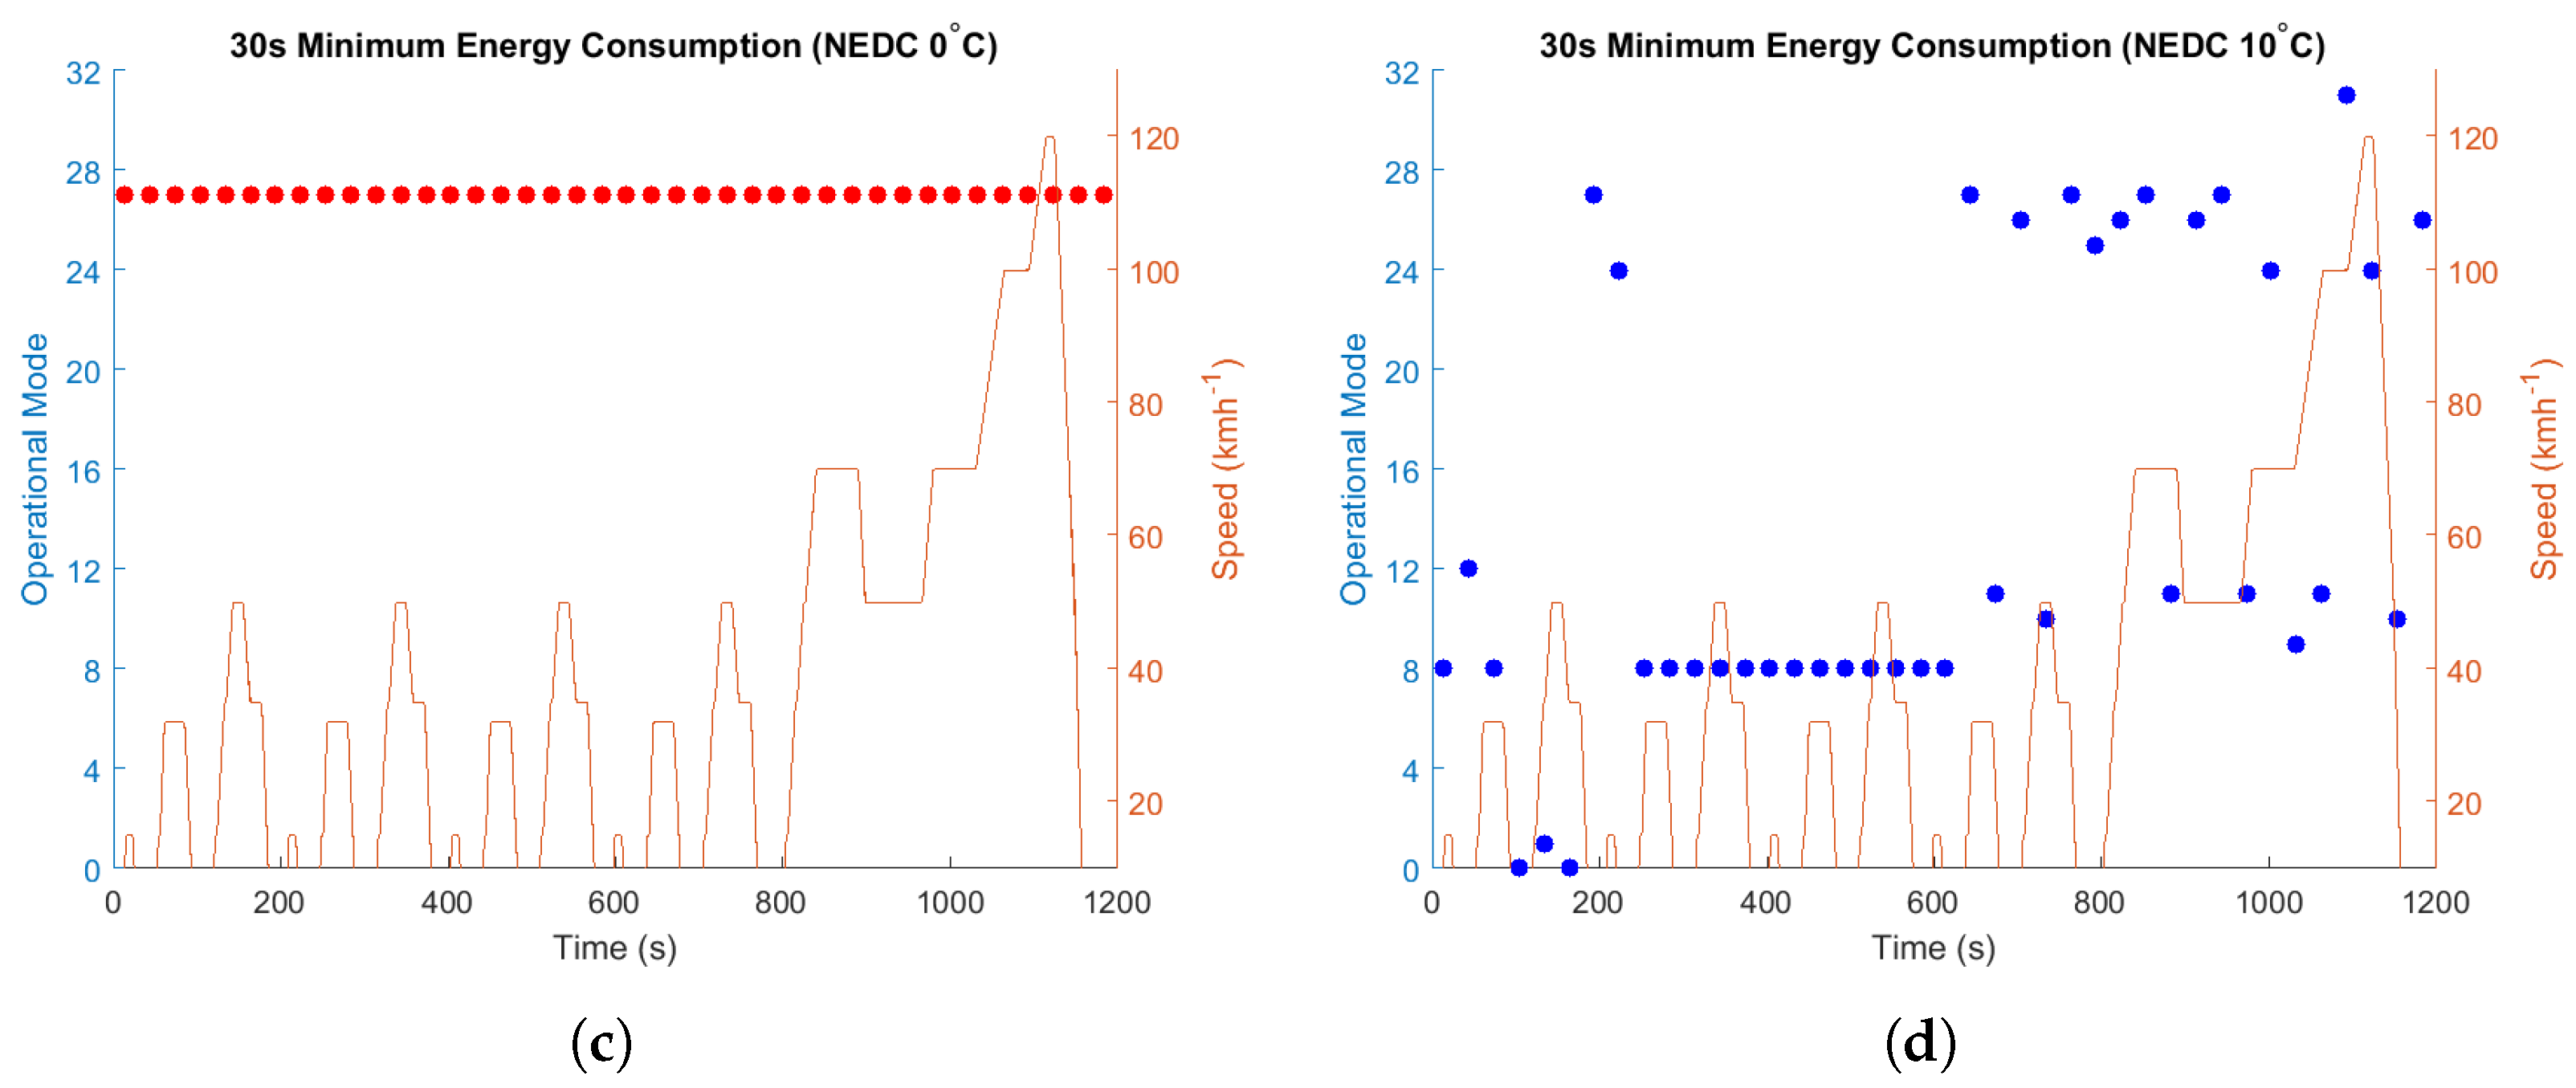
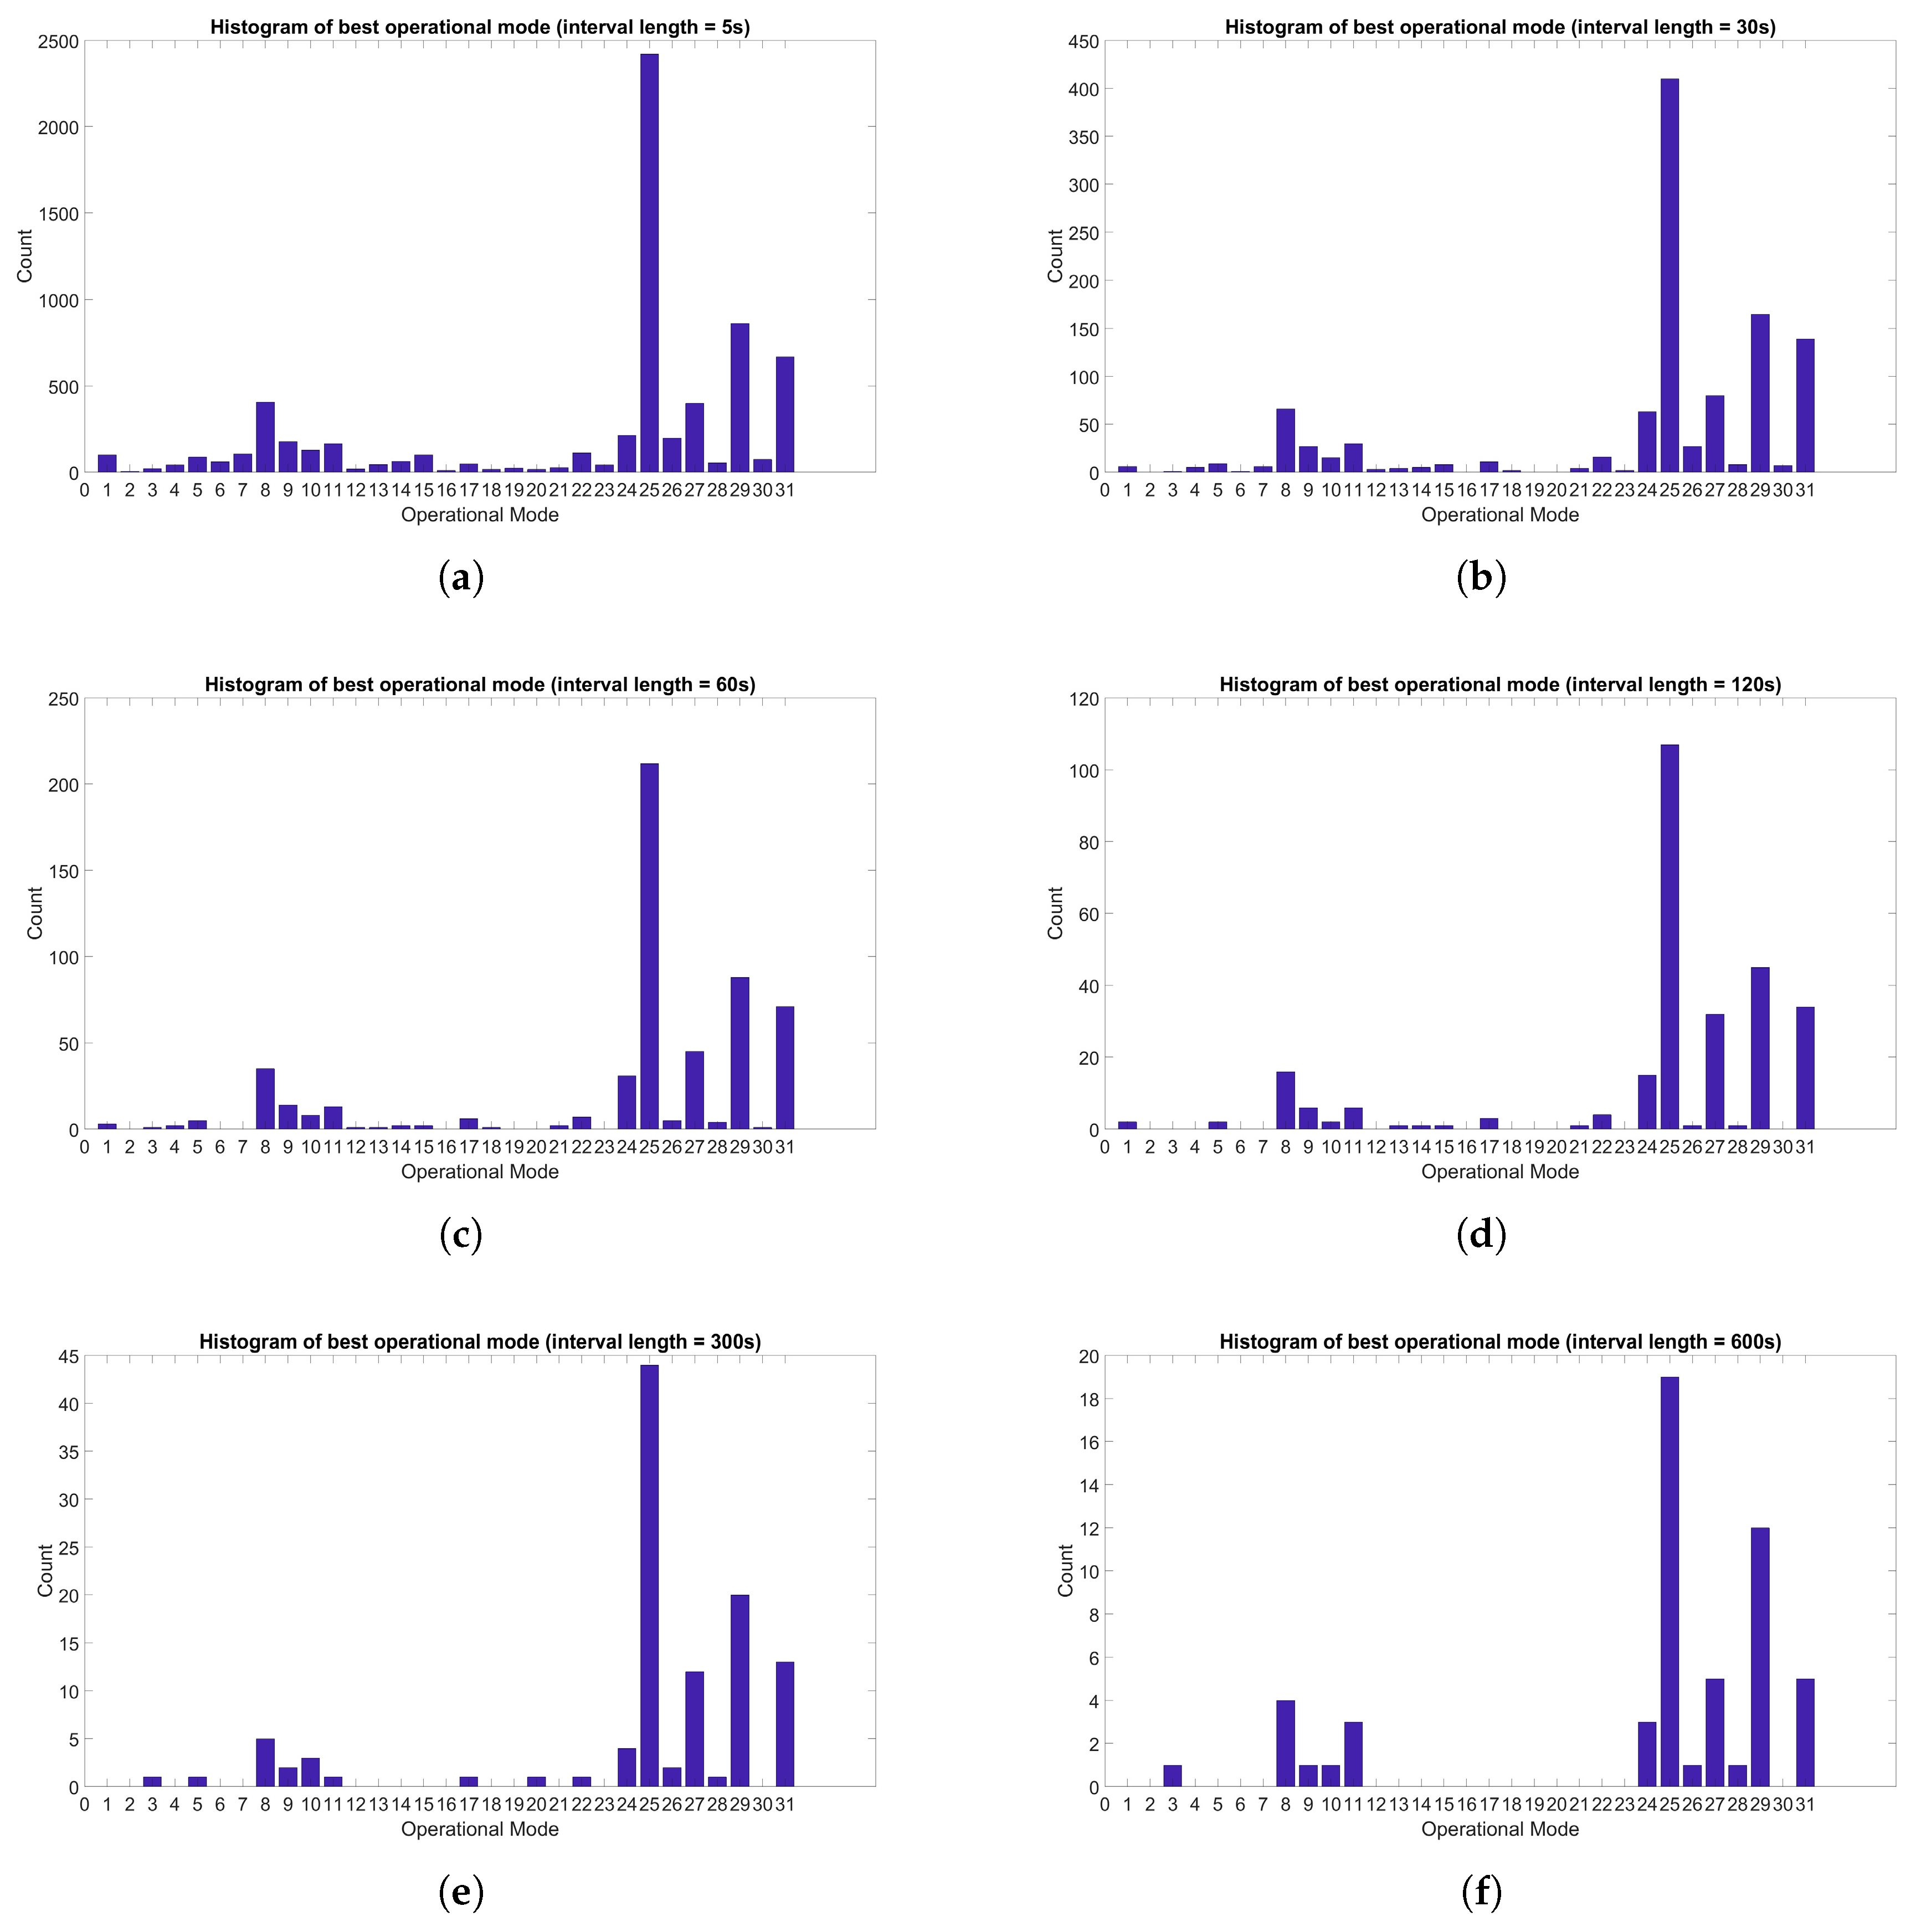
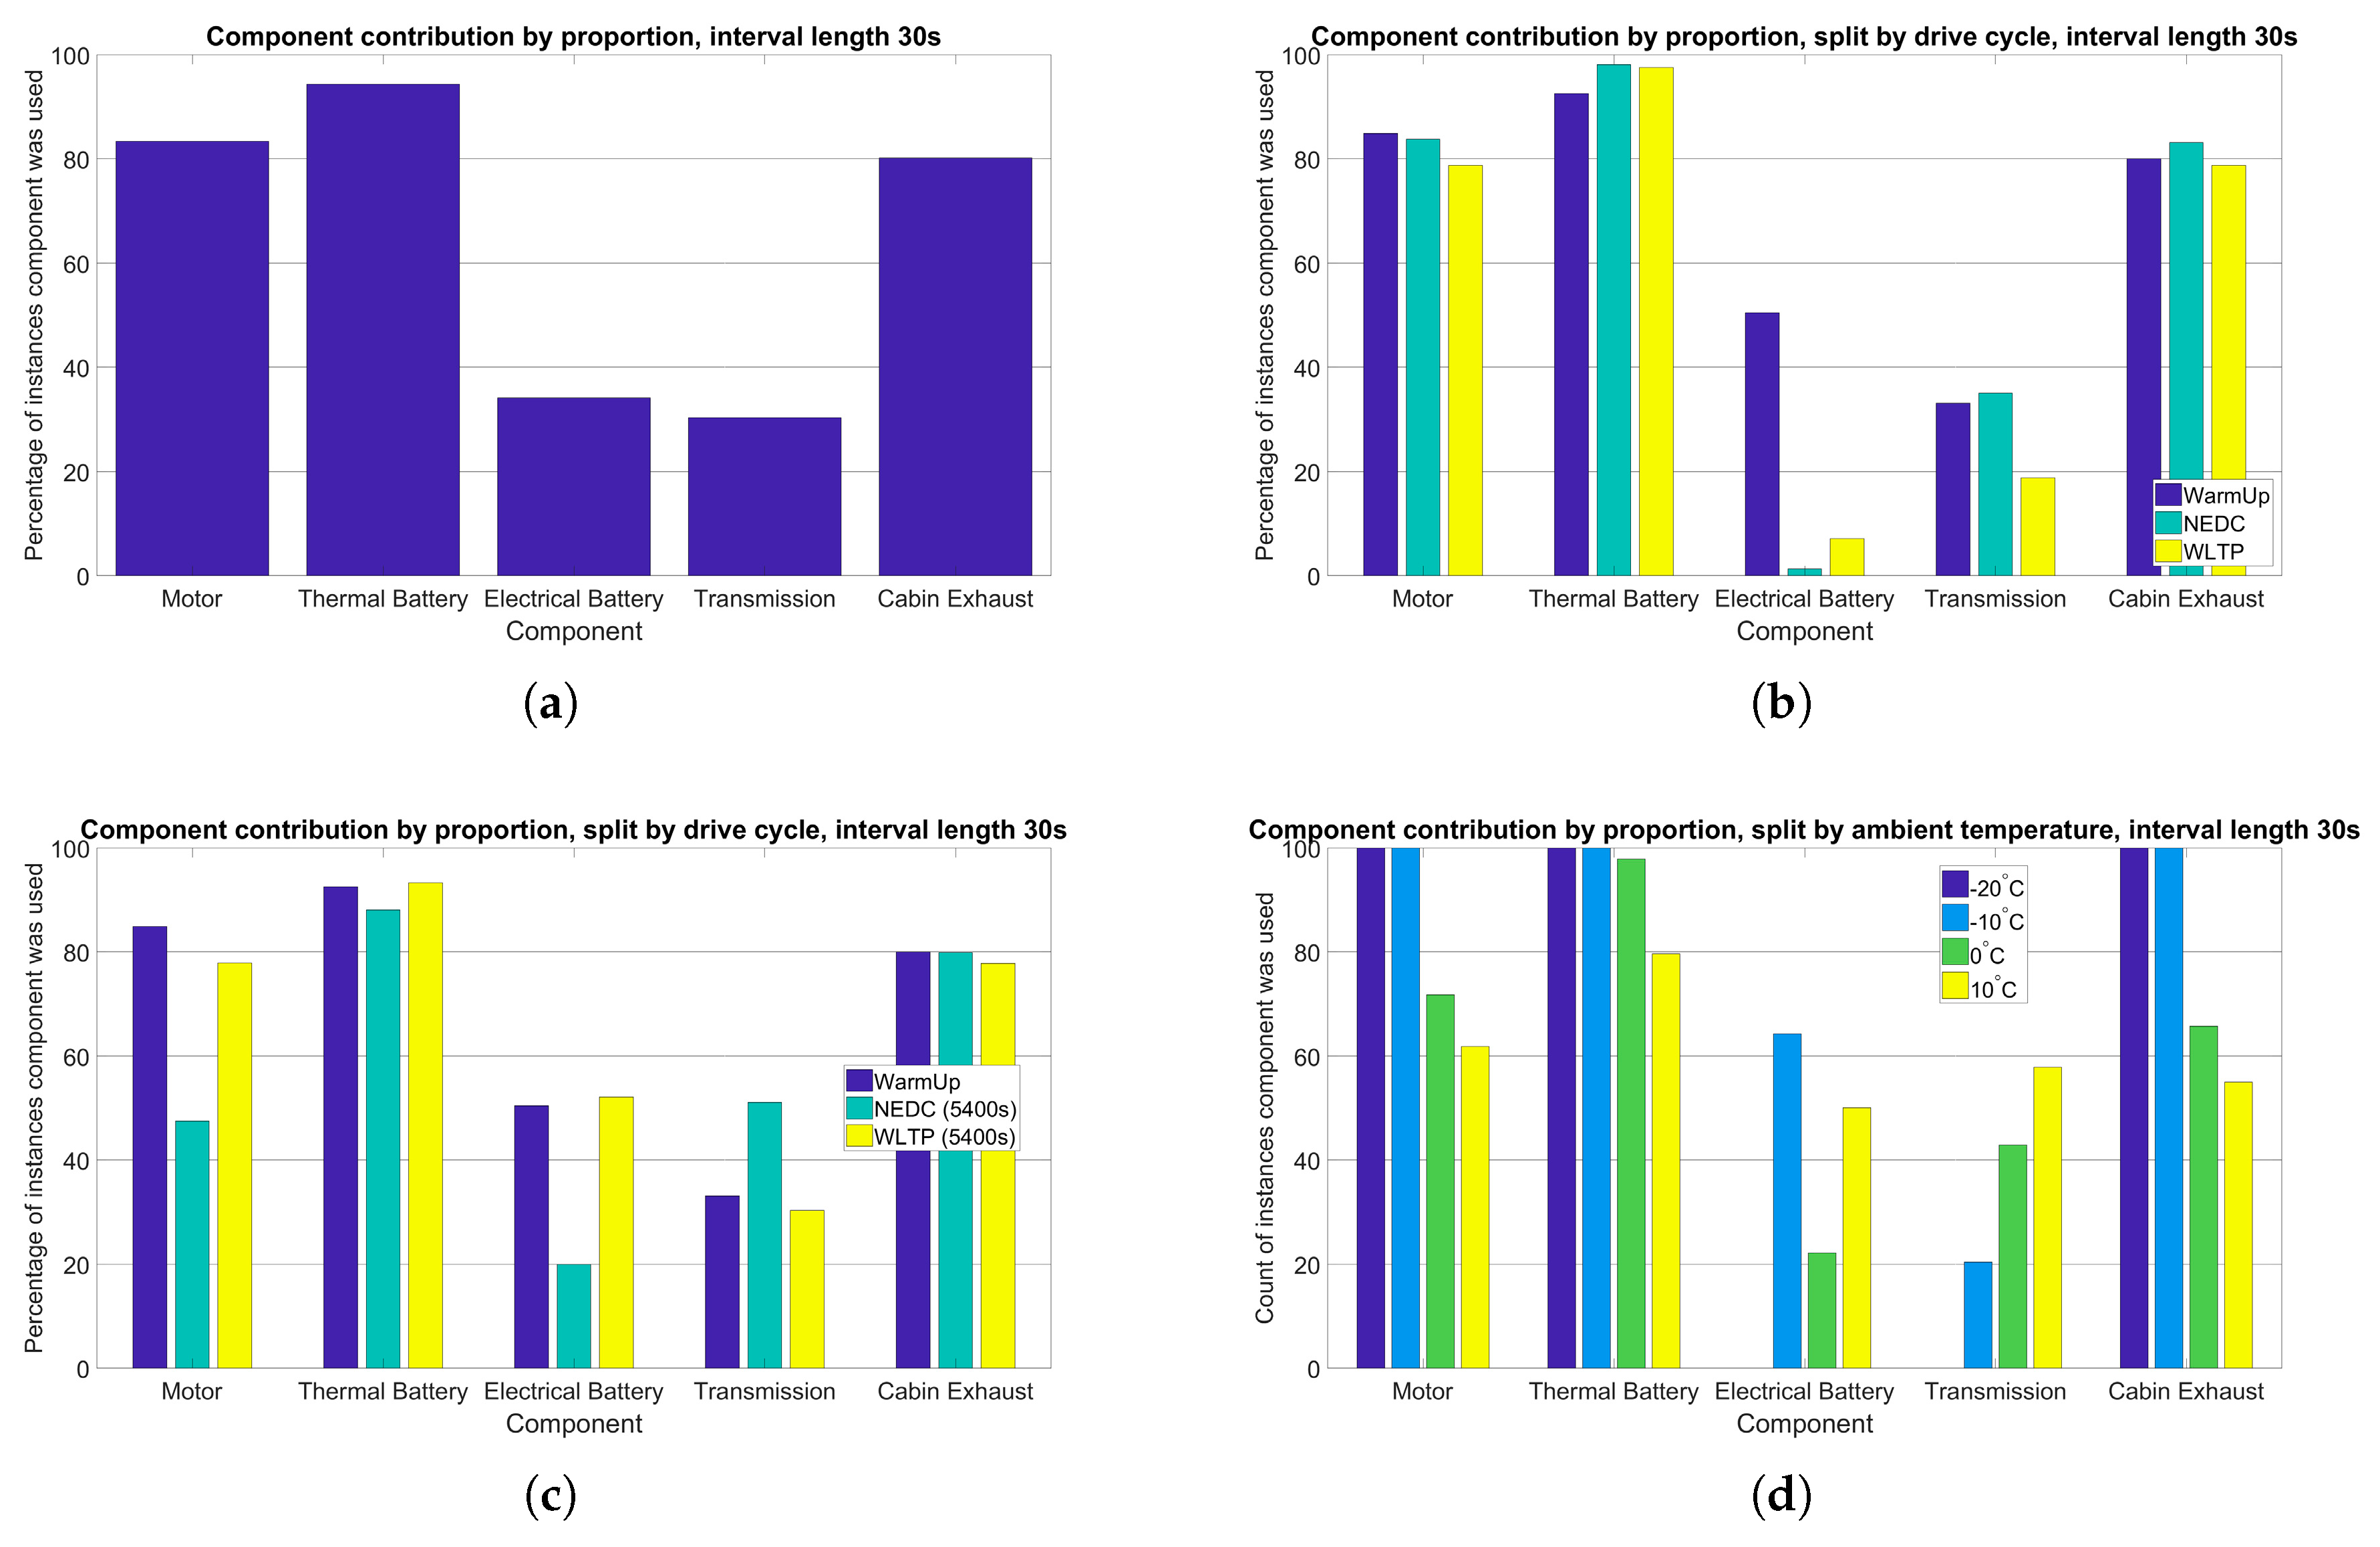
4.2. Heat Pump with Variable Heat Sources
- Run all 32 operational modes over all drive cycles and temperatures.
- For each scenario (temperature, cycle), reduce list of modes to those which reach cabin target temperature.
- If cabin temperature is not reached, limit operational mode choice to the one with highest cabin temperature.
- Identify best performing mode during each interval of drive cycle.
5. Discussion
6. Conclusions
Author Contributions
Funding
Conflicts of Interest
References
- Roscher, M.A.; Leidholdt, W.; Trepte, J. High efficiency energy management in BEV applications. Int. J. Electr. Power Energy Syst. 2012, 37, 126–130. [Google Scholar] [CrossRef]
- How Do Extremely Cold Temperatures Affect the Range of an Electric Car? 2013. Available online: http://www.fleetcarma.com/electric-car-range-in-bitter-cold/ (accessed on 15 September 2016).
- AAA Monthly Gas Price Report: March 2014 Trends and April Outlook. 2014. Available online: http://newsroom.aaa.com/2014/03/ (accessed on 15 September 2016).
- Electric Vehicle Range Drops in Cold Weather, and Technological Solutions Are Years Away. 2013. Available online: https://www.technologyreview.com/s/522496/electric-vehicles-out-in-the-cold/ (accessed on 15 September 2016).
- Barnitt, R.A.; Brooker, A.D.; Ramroth, L.; Rugh, J.; Smith, K.A. Analysis of off-board powered thermal preconditioning in electric drive vehicles. In Proceedings of the 25th World Battery, Hybrid and Fuel Cell Electric Vehicle Symposium & Exhibition, Shenzhen, China, 5–9 November 2010. [Google Scholar]
- Kim, K.; Kim, S.; Kim, M. Experimental studies on the heating performance of the PTC heater and heat pump combined system in fuel cells and electric vehicles. Int. J. Automot. Technol. 2012, 13, 971–977. [Google Scholar] [CrossRef]
- Meyer, N.; Whittal, I.; Christenson, M.; Loiselle-Lapointe, A. The impact of the driving cycle and climate on electrical consumption and range of fully electric passengers vehicles. In Proceedings of the EVS, Los Angeles, CA, USA, 6–9 May 2012. [Google Scholar]
- Reyes, J.R.M.D.; Parsons, R.V.; Hoemsen, R. Winter happens: the effect of ambient temperature on the travel range of electric vehicles. IEEE 2015. [Google Scholar] [CrossRef]
- Nagasubramanian, G. Electrical characteristics of 18650 Li-ion cells at low temperatures. J. Appl. Electrochem. 2001, 31, 99–104. [Google Scholar] [CrossRef]
- Ji, Y.; Zhang, Y.; Wang, C.Y. Li-ion cell operation at low temperatures. J. Electrochem. Soc. 2013, 160, A636–A649. [Google Scholar] [CrossRef]
- Fan, J. On the discharge capability and its limiting factors of commercial 18650 Li-ion cell at low temperatures. J. Power Sources 2003, 117, 170–178. [Google Scholar] [CrossRef]
- Jaguemont, J.; Boulon, L.; Dubé, Y.; Poudrier, D. Low temperature discharge cycle tests for a lithium ion cell. In Proceedings of the 2014 IEEE Vehicle Power and Propulsion Conference (VPPC), Coimbra, Portugal, 27–30 October 2014. [Google Scholar]
- Panosonic. Lithium Ion NCR18650; Panosonic: Kadoma, Japan, 2012. [Google Scholar]
- Rui, X.; Jin, Y.; Feng, X.; Zhang, L.; Chen, C. A comparative study on the low-temperature performance of LiFePO 4/C and Li 3 V 2 (PO 4) 3/C cathodes for lithium-ion batteries. J. Power Sources 2011, 196, 2109–2114. [Google Scholar] [CrossRef]
- Zheng, F.; Jiang, J.; Sun, B.; Zhang, W.; Pecht, M. Temperature dependent power capability estimation of lithium-ion batteries for hybrid electric vehicles. Energy 2016, 113, 64–75. [Google Scholar] [CrossRef]
- Petzl, M.; Kasper, M.; Danzer, M.A. Lithium plating in a commercial lithium-ion battery—A low-temperature aging study. J. Power Sources 2015, 275, 799–807. [Google Scholar] [CrossRef]
- Waldmann, T.; Wilka, M.; Kasper, M.; Fleischhammer, M.; Wohlfahrt-Mehrens, M. Temperature dependent ageing mechanisms in Lithium-ion batteries—A post-mortem study. J. Power Sources 2014, 262, 129–135. [Google Scholar] [CrossRef]
- Jaguemont, J.; Boulon, L.; Dubé, Y. Characterization and modeling of a hybrid-electric-vehicle lithium-ion battery pack at low temperatures. IEEE Trans. Veh. Technol. 2016, 65, 1–14. [Google Scholar] [CrossRef]
- Matthe, R.; Turner, L.; Mettlach, H. VOLTEC battery system for electric vehicle with extended range. SAE Int. J. Engines 2011, 4, 1944–1962. [Google Scholar] [CrossRef]
- Hayes, J.G.; de Oliveira, R.P.R.; Vaughan, S.; Egan, M.G. Simplified electric vehicle power train models and range estimation. In Proceedings of the 2011 Vehicle Power and Propulsion Conference (VPPC), Chicago, IL, USA, 6–9 September 2011. [Google Scholar]
- Saxena, S.; Le Floch, C.; MacDonald, J.; Moura, S. Quantifying EV battery end-of-life through analysis of travel needs with vehicle powertrain models. J. Power Sources 2015, 282, 265–276. [Google Scholar] [CrossRef]
- Lindgren, J.; Lund, P.D. Effect of extreme temperatures on battery charging and performance of electric vehicles. J. Power Sources 2016, 328, 37–45. [Google Scholar] [CrossRef]
- Broglia, L.; Autefage, G.; Ponchant, M. Impact of passenger thermal comfort and electric devices temperature on range: a system simulation approach. World Electri. Veh. J. 2012, 5, 1082–1089. [Google Scholar] [CrossRef]
- Shin, Y.H.; Ahn, S.K.; Kim, S.C. Performance characteristics of PTC elements for an electric vehicle heating system. Energies 2016, 9, 813. [Google Scholar] [CrossRef]
- Torregrosa-Jaime, B.; Payá, J.; Corberan, J. Design of efficient air-conditioning systems for electric vehicles. SAE Int. J. Alter. Power 2013, 2, 291–303. [Google Scholar] [CrossRef]
- Helms, H.; Pehnt, M.; Lambrecht, U.; Liebich, A. Electric vehicle and plug-in hybrid energy efficiency and life cycle emissions. In Proceedings of the 18th International Symposium Transport and Air Pollution, Zürich, Switzerland, 18–19 May 2010. [Google Scholar]
- De Gennaro, M.; Paffumi, E.; Martini, G.; Manfredi, U.; Scholz, H.; Lacher, H.; Kuehnelt, H.; Simic, D. Experimental Investigation of the Energy Efficiency of an Electric Vehicle in Different Driving Conditions; Technical Report for SAE 2014 World Congress & Exhibition; SAE International: Warrendale, PA, USA, 14 April 2014. [Google Scholar]
- Leighton, D. Combined fluid loop thermal management for electric drive vehicle range improvement. SAE Internat. J. Passeng. Cars-Mech. Syst. 2015, 8. [Google Scholar] [CrossRef]
- Ahn, J.H.; Kang, H.; Lee, H.S.; Jung, H.W.; Baek, C.; Kim, Y. Heating performance characteristics of a dual source heat pump using air and waste heat in electric vehicles. Appl. Energy 2014, 119, 1–9. [Google Scholar] [CrossRef]
- Shahidinejad, S.; Bibeau, E.; Filizadeh, S. Design and Simulation of a Thermal Management System for Plug-in Electric Vehicles in Cold Climates; Technical Report for SAE 2012 World Congress & Exhibition; SAE International: Warrendale, PA, USA, 16 April 2012. [Google Scholar]
- Jha, K.K.; Badathala, R. Low Temperature Thermal Energy Storage (TES) System for Improving Automotive HVAC Effectiveness; Technical Report for SAE 2015 World Congress & Exhibition; SAE International: Warrendale, PA, USA, 14 April 2015. [Google Scholar]
- LaClair, T.J.; Gao, Z.; Abdelaziz, O.; Wang, M.; Wolfe, E.; Craig, T. Thermal Storage System for Electric Vehicle Cabin Heating-Component and System Analysis; Technical Report for SAE 2016 World Congress and Exhibition; SAE International: Warrendale, PA, USA, 5 April 2016. [Google Scholar]
- Kaygusuz, K. Performance of solar-assisted heat-pump systems. Appl. Energy 1995, 51, 93–109. [Google Scholar] [CrossRef]
- Jeffs, J.; McGordon, A.; Widanage, W.D.; Robinson, S.; Picarelli, A. Use of a thermal battery with a heat pump for low temperature electric vehicle operation. In Proceedings of the 2017 IEEE Vehicle Power and Propulsion Conference (VPPC), Belfort, France, 11–14 December 2017. [Google Scholar]
- Peng, Q.; Du, Q. Progress in heat pump air conditioning systems for electric vehicles—A review. Energies 2016, 9, 240. [Google Scholar] [CrossRef]
- Williamson, S.S. Electric drive train efficiency analysis based on varied energy storage system usage for plug-in hybrid electric vehicle applications. In Proceedings of the Power Electronics Specialists Conference, Orlando, FL, USA, 17–21 June 2007. [Google Scholar]
- Hofman, T.; Dai, C. Energy efficiency analysis and comparison of transmission technologies for an electric vehicle. In Proceedings of the 2010 IEEE Vehicle Power and Propulsion Conference (VPPC), Lille, France, 1–3 September 2010. [Google Scholar]
- Grady, M.L.; Jung, H.; chul Kim, Y.; Park, J.K.; Lee, B.C. Vehicle Cabin Air Quality with Fractional Air Recirculation; Technical Report for SAE 2013 World Congress & Exhibition; SAE International: Warrendale, PA, USA, 8 April 2013. [Google Scholar]
- Suck, G.; Spengler, C. Solutions for the Thermal Management of Electrically Driven Vehicles. ATZ Worldw. 2014, 116, 4–9. [Google Scholar] [CrossRef]
- Zhu, T.; Min, H.; Yu, Y.; Zhao, Z.; Xu, T.; Chen, Y.; Li, X.; Zhang, C. An optimized energy management strategy for preheating vehicle-mounted li-ion batteries at subzero temperatures. Energies 2017, 10, 243. [Google Scholar] [CrossRef]
- Taylor, R.A.; Chung, C.Y.; Morrison, K.; Hawkes, E.R. Analysis and testing of a portable thermal battery. J. Therm. Sci. Eng. Appl. 2014, 6, 031004. [Google Scholar] [CrossRef]


| Heat Source | Operational Mode | |||||||||||||||||||||||||||||||
|---|---|---|---|---|---|---|---|---|---|---|---|---|---|---|---|---|---|---|---|---|---|---|---|---|---|---|---|---|---|---|---|---|
| 0 | 1 | 2 | 3 | 4 | 5 | 6 | 7 | 8 | 9 | 10 | 11 | 12 | 13 | 14 | 15 | 16 | 17 | 18 | 19 | 20 | 21 | 22 | 23 | 24 | 25 | 26 | 27 | 28 | 29 | 30 | 31 | |
| Motor and Inverter | 0 | 0 | 0 | 0 | 0 | 0 | 0 | 0 | 0 | 0 | 0 | 0 | 0 | 0 | 0 | 0 | 1 | 1 | 1 | 1 | 1 | 1 | 1 | 1 | 1 | 1 | 1 | 1 | 1 | 1 | 1 | 1 |
| Thermal Battery | 0 | 0 | 0 | 0 | 0 | 0 | 0 | 0 | 1 | 1 | 1 | 1 | 1 | 1 | 1 | 1 | 0 | 0 | 0 | 0 | 0 | 0 | 0 | 0 | 1 | 1 | 1 | 1 | 1 | 1 | 1 | 1 |
| Electric Battery | 0 | 0 | 0 | 0 | 1 | 1 | 1 | 1 | 0 | 0 | 0 | 0 | 1 | 1 | 1 | 1 | 0 | 0 | 0 | 0 | 1 | 1 | 1 | 1 | 0 | 0 | 0 | 0 | 1 | 1 | 1 | 1 |
| Transmission | 0 | 0 | 1 | 1 | 0 | 0 | 1 | 1 | 0 | 0 | 1 | 1 | 0 | 0 | 1 | 1 | 0 | 0 | 1 | 1 | 0 | 0 | 1 | 1 | 0 | 0 | 1 | 1 | 0 | 0 | 1 | 1 |
| Cabin Exhaust | 0 | 1 | 0 | 1 | 0 | 1 | 0 | 1 | 0 | 1 | 0 | 1 | 0 | 1 | 0 | 1 | 0 | 1 | 0 | 1 | 0 | 1 | 0 | 1 | 0 | 1 | 0 | 1 | 0 | 1 | 0 | 1 |
| Mode | Components | ||||
|---|---|---|---|---|---|
| Motor | Thermal Battery | Electric Battery | Transmission | Cabin Exhaust | |
| 25 | 1 | 1 | 0 | 0 | 1 |
| 29 | 1 | 1 | 1 | 0 | 1 |
| 31 | 1 | 1 | 1 | 1 | 1 |
| 8 | 0 | 1 | 0 | 0 | 0 |
| 27 | 1 | 1 | 0 | 1 | 1 |
© 2018 by the authors. Licensee MDPI, Basel, Switzerland. This article is an open access article distributed under the terms and conditions of the Creative Commons Attribution (CC BY) license (http://creativecommons.org/licenses/by/4.0/).
Share and Cite
Jeffs, J.; McGordon, A.; Picarelli, A.; Robinson, S.; Tripathy, Y.; Widanage, W.D. Complex Heat Pump Operational Mode Identification and Comparison for Use in Electric Vehicles. Energies 2018, 11, 2000. https://doi.org/10.3390/en11082000
Jeffs J, McGordon A, Picarelli A, Robinson S, Tripathy Y, Widanage WD. Complex Heat Pump Operational Mode Identification and Comparison for Use in Electric Vehicles. Energies. 2018; 11(8):2000. https://doi.org/10.3390/en11082000
Chicago/Turabian StyleJeffs, James, Andrew McGordon, Alessandro Picarelli, Simon Robinson, Yashraj Tripathy, and Widanalage Dhammika Widanage. 2018. "Complex Heat Pump Operational Mode Identification and Comparison for Use in Electric Vehicles" Energies 11, no. 8: 2000. https://doi.org/10.3390/en11082000
APA StyleJeffs, J., McGordon, A., Picarelli, A., Robinson, S., Tripathy, Y., & Widanage, W. D. (2018). Complex Heat Pump Operational Mode Identification and Comparison for Use in Electric Vehicles. Energies, 11(8), 2000. https://doi.org/10.3390/en11082000