1. Introduction
Existing buildings, especially non-residential buildings, contribute to a significant portion of greenhouse gas emissions [
1]. There is an urgent call for reducing the environmental impact of existing buildings via retrofitting [
2]. It is well known that the majority of existing buildings last for 50–100 years [
3] and that retrofitting existing buildings is more resource-efficient and sustainable than building new green constructions [
4,
5]. Through modifications, demolition and rebuilding could be avoided; consequently, less construction wastes are generated and less material resources are required [
6].
Retrofitting was defined as some modification or conversion instead of a complete replacement of an existing process, facility or structure [
7]. It might involve additions, deletions, rearrangements or replacements of one or more parts of the facility [
8]. The retrofitting of existing buildings usually includes enhancing efficacy of the air-conditioning system [
9,
10,
11], upgrading the lighting system [
12,
13], implementing lighting controls [
14,
15], and improving thermal insulation of building envelopes [
16] and roof systems [
17]. Studies showed that these retrofits could significantly reduce energy consumptions of existing buildings and energy costs while enhance occupants’ comfort [
18].
Typically, a retrofit project involves three key steps: energy auditing, building simulation and measurement and verification (M & V). An energy audit is the process of inspecting, surveying and analyzing the current situation of energy uses in a building; it is the first step to identify opportunities to reduce energy uses [
19]. It plays a key role in understanding existing building energy uses and proposing cost-effective Energy Conservation Measures (ECMs). ASHRAE [
20] recommended three levels of energy auditing: Level 1: “walk-through” which includes a review of utility bills or other operating data and a walk-through of the facility to identify issues related to energy waste or inefficiency; Level 2: “energy survey and analysis” that adds detailed energy calculations and financial analyses of proposed ECMs; and Level 3: “detailed analysis of capital intensive modifications” which focuses on an engineering analysis of the potential capital-intensive projects identified in Level 2.
Identifying ECMs and evaluating their effectiveness are most important in an energy audit project [
21]. Krarti [
22] categorized common ECMs on the following building elements: building envelopes, electrical systems, HVAC systems, compressed air systems, energy management controls, indoor water management and new technologies. To understand their effectiveness of improving energy performance, building performance simulation is used as an instrument in the retrofitting process [
23]. The building simulation can help to predict the peak values and load profiles of heating/cooling loads of buildings which could be used as the basis for the upgrading HVAC equipment, systems, and plants [
24]. Furthermore, innovative strategies for energy saving such as reflective roof, daylighting, free-cooling, solar hot-water heating, heat recovery, and thermal storage can be evaluated before implementation [
25]. Last but not least, after the retrofit, measurement and verification should take place to verify the effectiveness of the retrofit.
At the same time, the building retrofit or refurbishment faces many challenges and uncertainties, such as climate change, services changes, users’ behavioral changes and technological changes, all of which directly affected the selection of retrofit techniques and hence the success of a retrofit project [
26,
27]. Other challenges might include financial barriers and long payback periods [
28]. One important strategy to reduce the retrofit risks and uncertainties is adopting green building certification [
7,
29,
30]. In recent years, LEED has been emerging as a popular rating system to evaluate the environmental performance of a building and encourage market transformation towards sustainable design [
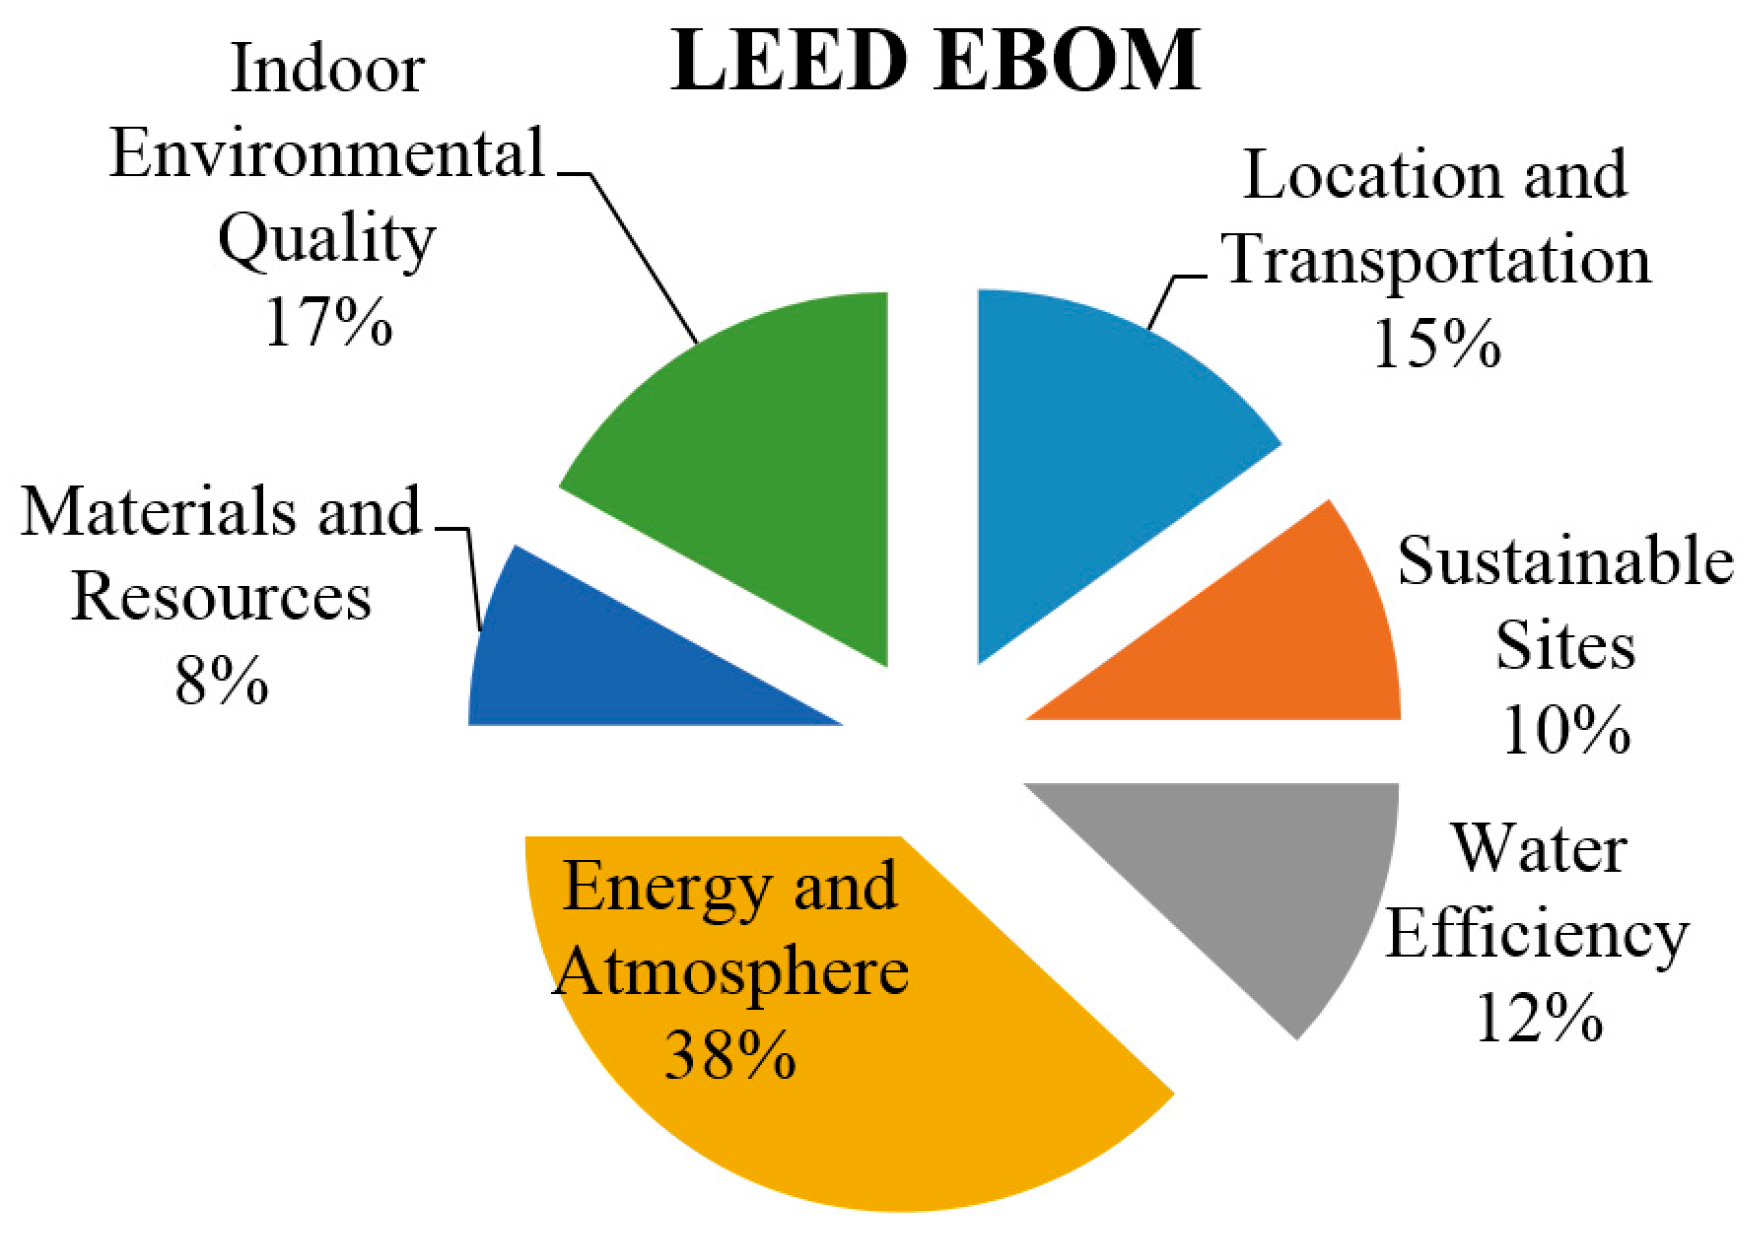
31]. LEED has established a number of programs aiming for different real estate markets, one of which is dedicated to existing building retrofits: LEED EBOM. LEED EBOM defines the green retrofit as “an upgrade at an existing building to improve energy and environmental performance, reduce water use, improve comfort and quality of space in terms of natural lighting, air quality and noise” [
32]. Similar to other green rating tools, LEED EBOM covers six aspects (
Figure 1). Among all aspects, Energy and Atmosphere is the most important and accounts for the largest portion of points.
Table 1 shows the specific credits and points involved in Energy and Atmosphere. More details of this program could be found in the reference guide of LEED EBOM [
33].
A number of studies have been conducted to verify the impact of LEED certification on building energy and environmental performance [
34,
35,
36]. These studies showed the benefits of an existing building retrofit and green building certification to building owners, tenants and occupants [
37]. The present study, investigating into a LEED EBOM certified project, intends to understand the methodology and process of an existing building green retrofit project. The present study also aims to disclose the strengths and weakness of each retrofitting step and to optimize the retrofit process to increase the effectiveness of retrofitting. Although many studies can be found in the subject of energy retrofit, they mainly used building simulation to verify the ECMs and their related outcomes theoretically. This study, using a real project and a longitudinal investigation through the whole retrofit process, provides first-hand empirical data and facts on each stage of retrofitting. Furthermore, based on the real case, this paper summarizes the methodological strengths and weaknesses of the green retrofit process.
2. Methodology: Case Study
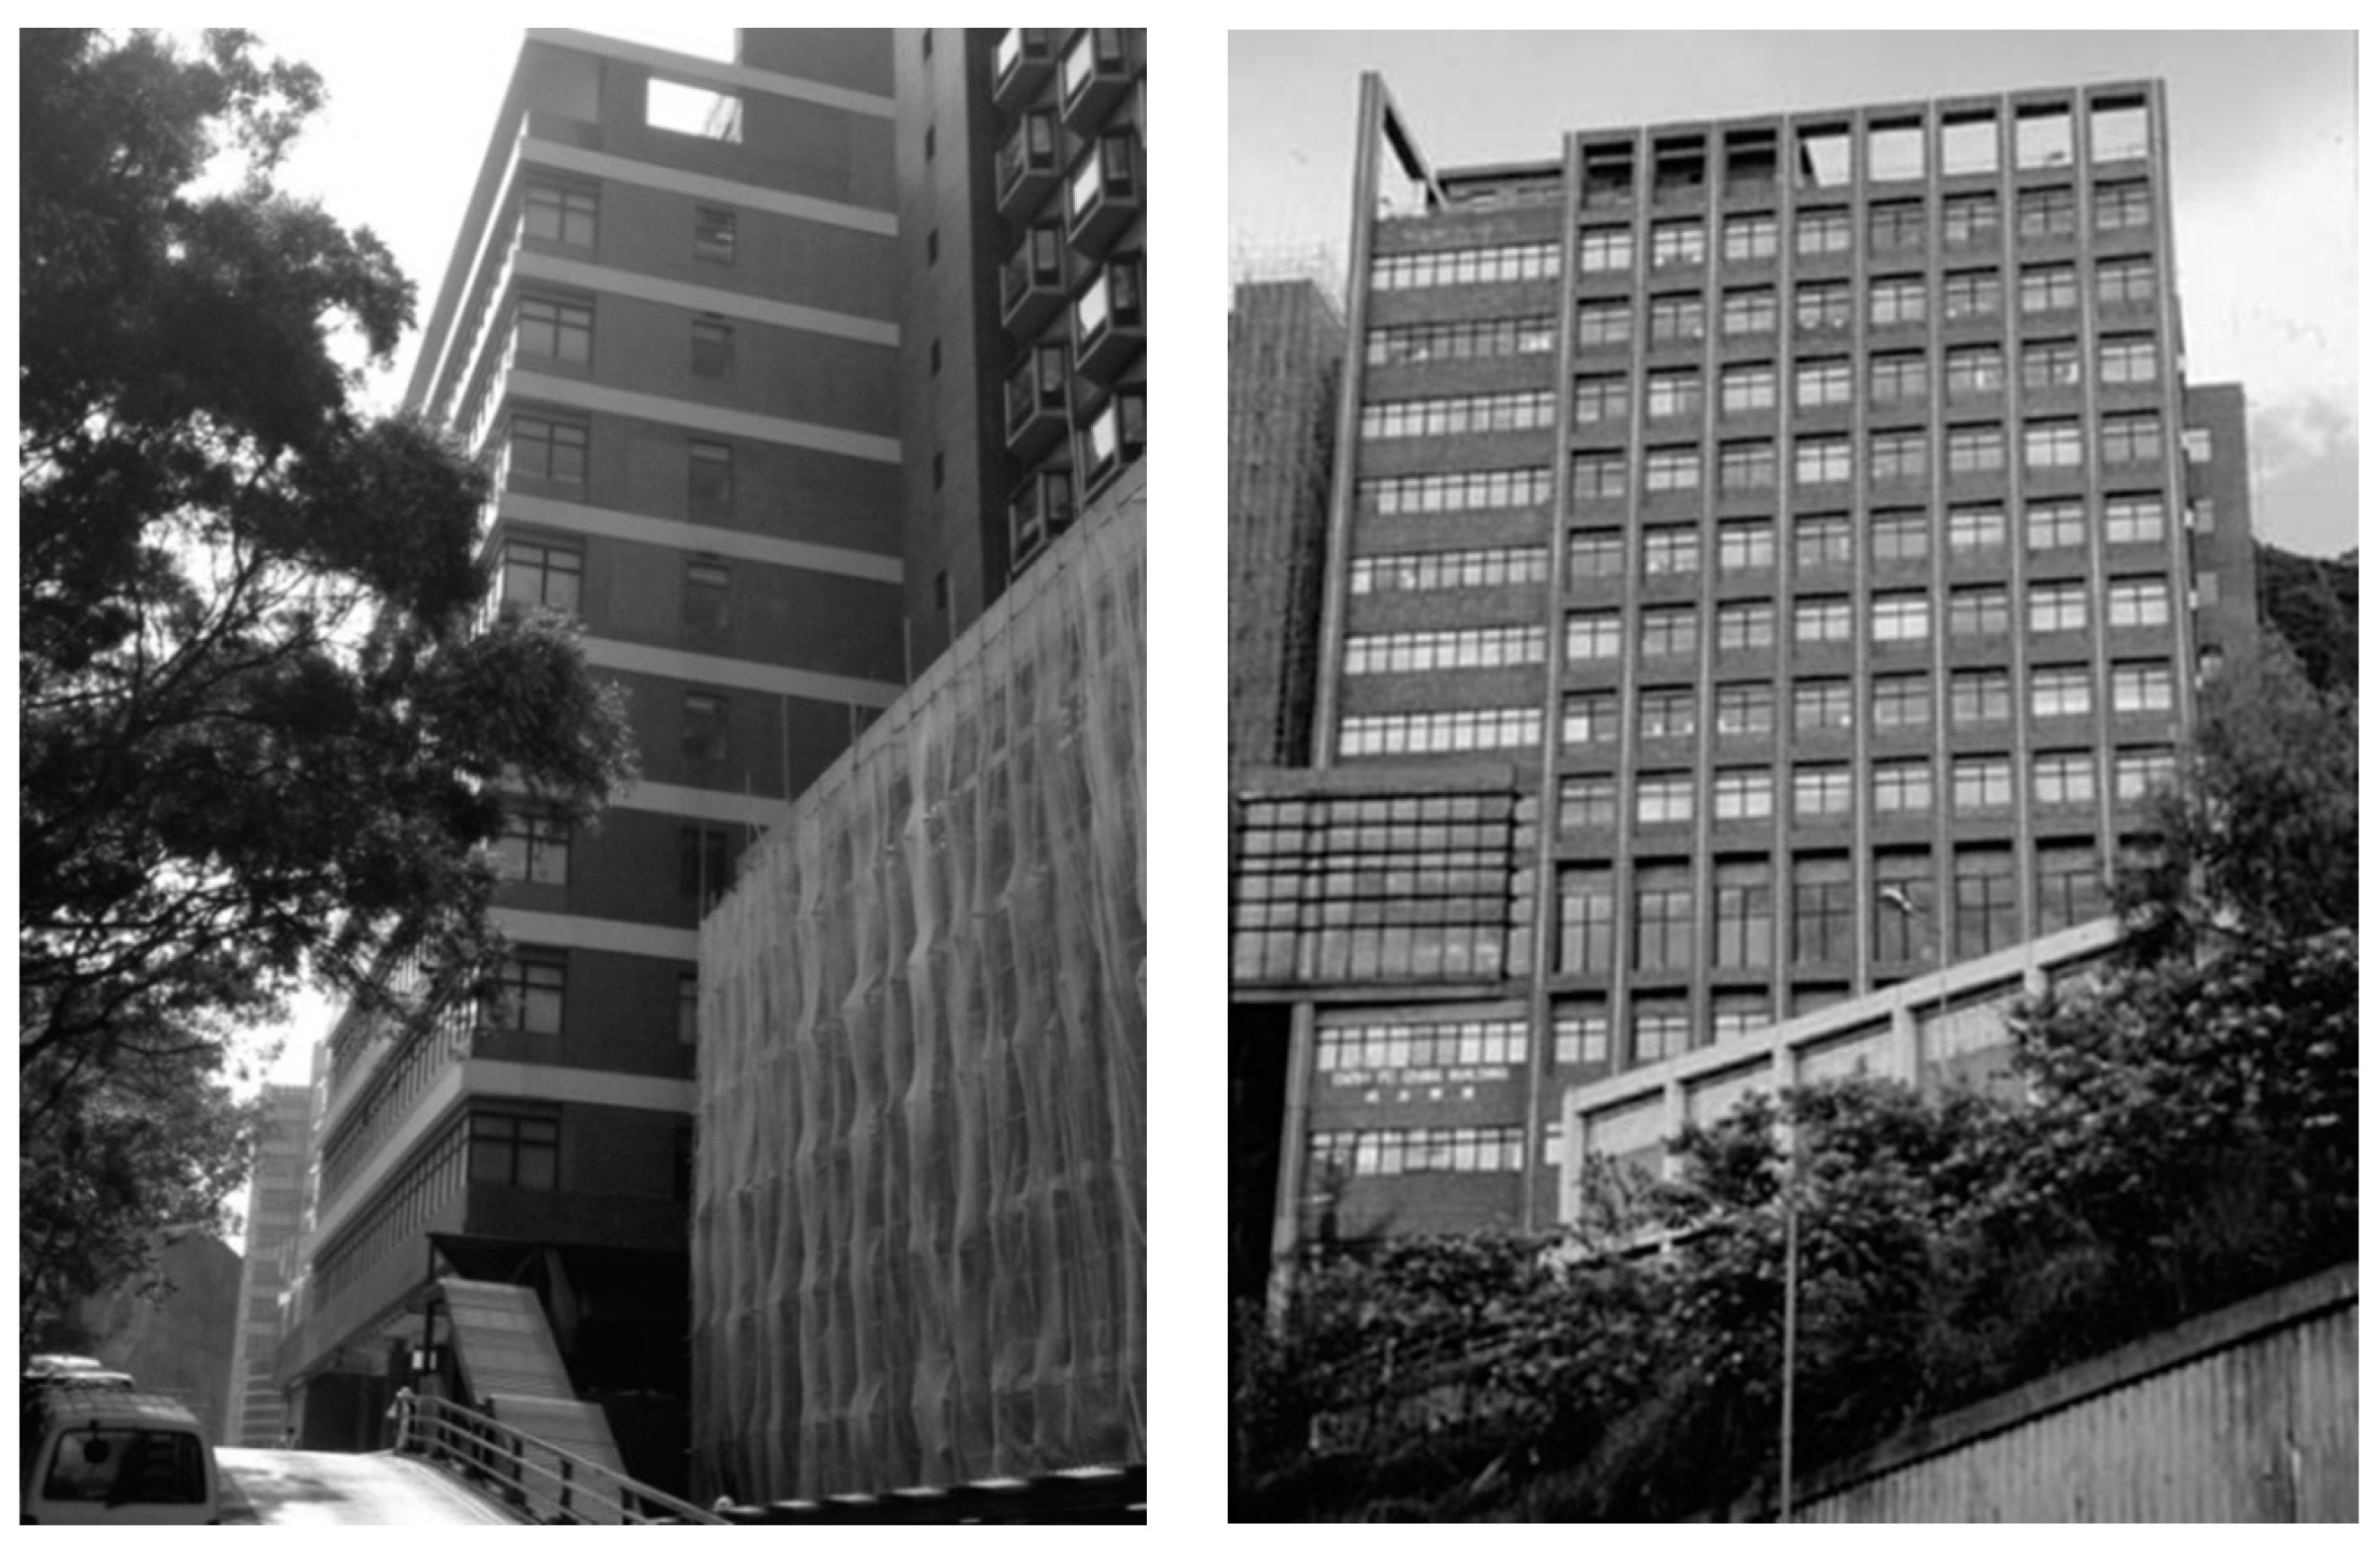
To meet the research objective, this paper investigated a LEED EBOM project which had gone through a rigorous green retrofit process. The data for this paper were collected from the whole retrofitting process. The building selected for this study is the Chow Yei Ching (CYC) Building (
Figure 2) which belongs to the University of Hong Kong. The University of Hong Kong sets sustainability goals, one of which is to significantly reduce the energy consumption of existing buildings. The CYC building was selected for an energy efficient retrofit to achieve LEED EBOM Gold certification (
Table 2). The CYC building is located on the main campus of the University of Hong Kong. It was built in 1993 and now it is a multi-purpose academic building which comprises offices, lecture rooms and different types of laboratories. It has a total of 13 floors from LG4/F to its highest 8/F. The GFA is around 13,168 m
2. Hong Kong is located at latitude 22.2783° N and longitude 114.1747° E. Hong Kong’s climate is sub-tropical. August and September are the hottest months with high humidity, which are the highest energy consumption period due to the need of cooling. The major energy consumers of this building are the air conditioning system, lighting system and office equipment. To conduct the retrofit project, the university employed an energy service company to manage the technical and funding issues. Other parties such as Estate Office, electrical/electronic technicians, and LEED consultants were involved to follow the energy measurements, to supervise the implementation and to ensure the achievement of LEED certification. The CYC project went through a standard retrofit process. A walk-through assessment and an energy survey were conducted in the year of 2011 before the retrofit was implemented. Based on the energy audit, several ECMs were recommended. Building performance simulation was conducted to look at detailed cost-effectiveness of these ECMs. The retrofit period was March 2012 to July 2013. The operation period after the retrofit was August 2013 to August 2014, during which the measurement and verification was conducted.
3. Results
3.1. Energy Audit
The energy audit was conducted to find the current condition of the CYC building. The content of the energy audit is shown in
Table 3. Different methods, such as “walk through”, “on-site measurement” and “electricity bill reading”, were used in the energy auditing process, based on which ECMs were recommended for the retrofit.
The energy auditing started from the building envelope. The exterior walls consisted of 150 mm thick concrete blocks with face brick exteriors. The windows consisted of a combination of single pane glass with aluminum frame. Large window areas were found facing north (440 m2) and south (388 m2). The roof construction consisted of 150 mm thick concrete blocks. The total surface area of roof floor was around 1013 m2.
The major part of the energy audit was focused on mechanical and electrical systems, such as chiller plant, AHU, VF, FCU, lighting and lifts. A chiller plant located at the roof floor provided the cooling of the whole building. The chiller plant consisted of four air-cooled 180 tons chillers, four primary chilled water pumps and three secondary chilled water pumps. The chiller plant was installed with Honeywell building management system. It was found that some of the sensors such as temperature sensors and flow sensors were mal-functional. The chiller plant could not be operated fully automatically. Due to the operation requirements in laboratories and facilities such as computer servers, the plant was in 24 h operation to maintain suitable conditions.
Various types of lighting fixtures were installed at CYC. Most of them were T8 tubes with electronic ballasts. All lighting fixtures were controlled by conventional timers according to the pre-set time schedule. A total of four lifts are installed in the CYC building. One of them is a service lift. Power factor is one of the major concerns for good power quality within a building. It affects the demand side management and also the electricity costs. During the site visit, the power quality was in good condition with the power factor at 0.98.
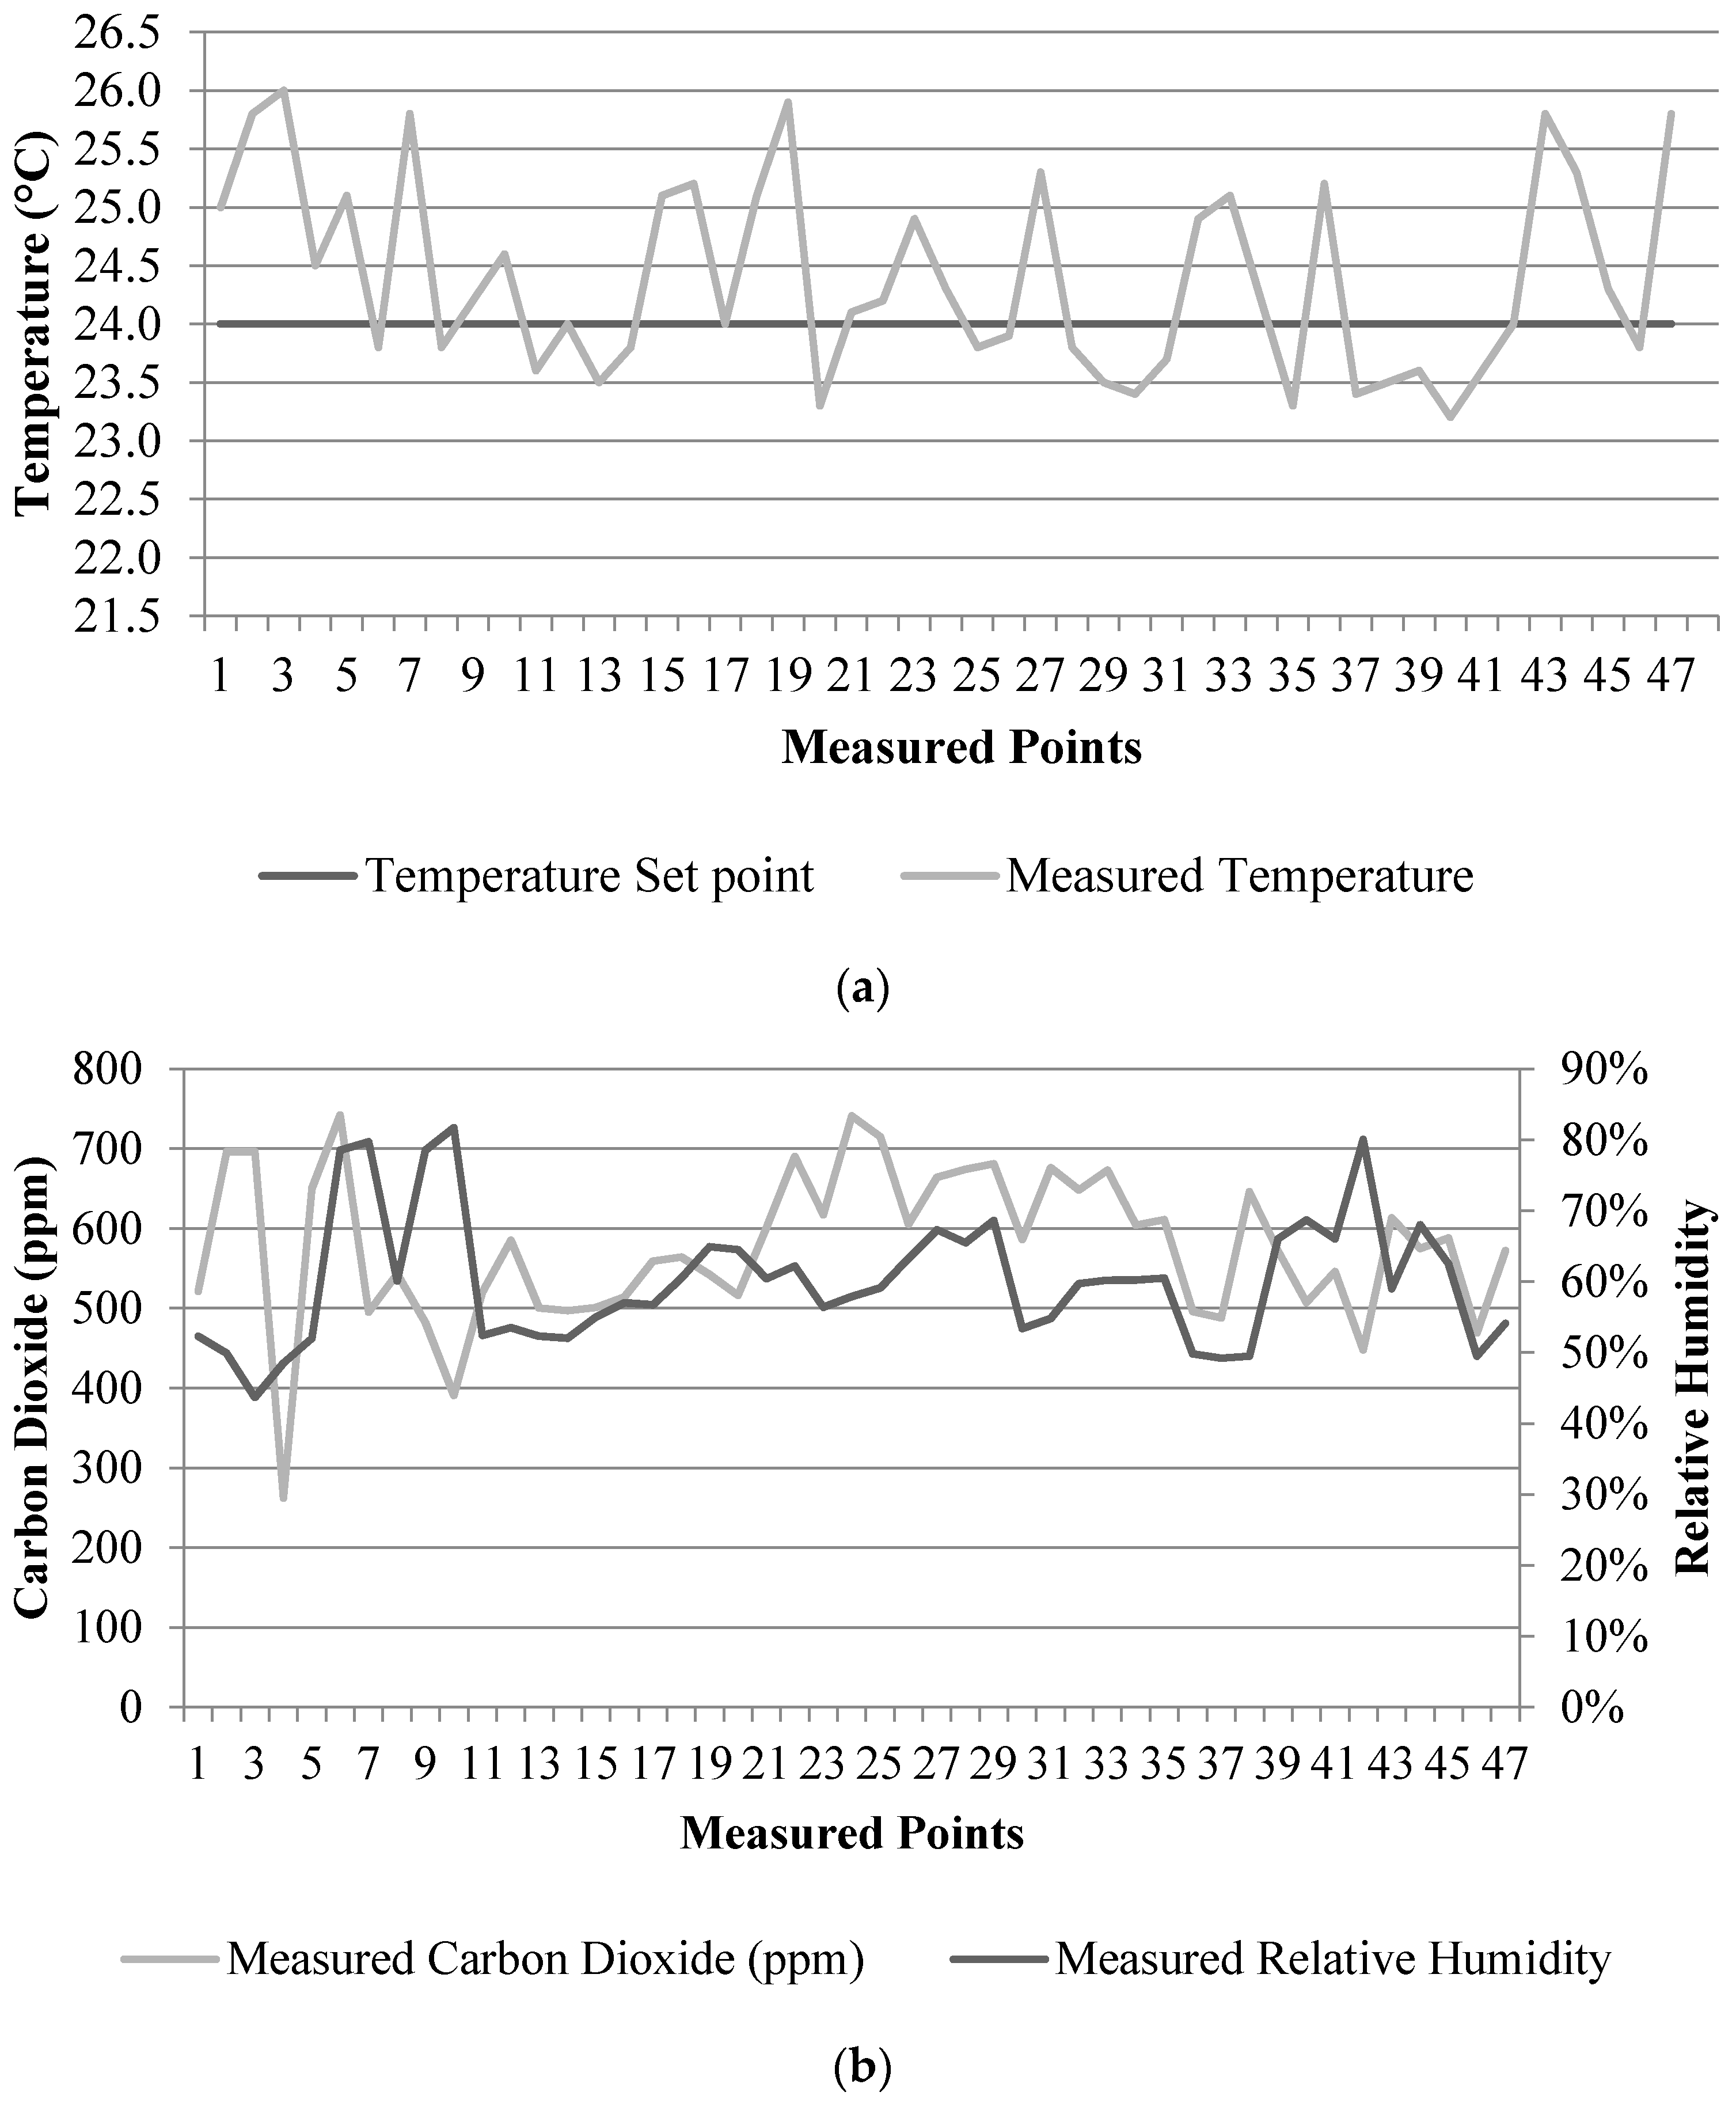
The building was occupied by around 700 staff from 8:30 a.m. to 7:00 p.m. Monday to Friday and 8:30 a.m. to 12:30 p.m. on Saturday. To better understand the IEQ in the CYC Building, the research conducted on-site measurements before the retrofit. The measurement was conducted at different locations covering individual offices, open-plan offices, laboratories, corridors, toilets, and entrances/exits during occupied conditions. For small spaces such as individual offices, the measurement took place nearby the seat positions of the occupants; while for large spaces such as open-plan offices and laboratories, the measurement took place at several different seat positions to cover window, middle and isle seats. In total, 47 points were measured. The measurement was conducted during office hours.
Figure 3 shows the measurement results. Compared to the temperature set point which was 24 °C, many spaces were warmer than expected, especially corridors, entrances/exists and some offices on the top floors, while some individual offices and laboratories were colder. The occupancy and floor conditions were the main reason for the temperature variation. Higher occupancy load in open-plan offices and laboratories resulted in higher heat dissipations both from human bodies and equipment. Higher floors, especially the top floors, too, had more heat gains from the roofs. The private offices and lower floors, on the contrary, had less heat gains and consequently lower temperature. The relative humidity and carbon dioxide concentration had similar trend.
The retrofitting project was expected to be conducted during the year 2010 to 2011, so energy consumption data from the closest year 2009 were analyzed.
Figure 3 shows the electricity data for the CYC building in the year of 2009. The total electricity use was 3,742,860 kWh at a total cost of HK
$4,695,048 (with the charge at HK
$1.254 per kWh).
Table 4 breaks down the energy use. The air-conditioning system took up more than 40% of the building energy use. Lighting accounted for 16% and lifts consumed 10%.
Based on the energy auditing and diagnostics of the CYC building, four ECMs were selected to reduce its energy consumption.
Lighting Retrofit: Currently in the CYC Building, 90% of the general lighting fixtures used fluorescent tubes. LED, a semiconductor light source, is considered as the ultimate general lighting solution due to a low power consumption, high efficiency and long life span.
Green Roofs: The poor thermal insulation of the roofs which was flat with 150 mm concrete blocks caused solar heat gains in offices at top floors. It was suggested to build a green roof at the flat roof area.
Window Film Coating: The SHGC for windows was approximately 0.82. The large value of coefficient resulted in large amount of heat transfer. It was proposed to coat windows with 3MTM Night Vision window films that allow 35% daylight in (3M NV 35). The total area of the window film coating was approximately 843 m2.
Updating Chiller Plant and Building Management System Installation: The existing chiller plant was low efficiency with COP at 2.6 (0.7 kW/ton); for a well-designed all variable speed plant, the COP should be above 5.0 (i.e., 1.35 kW/ton). A new plant was to be built the replace the old one.
3.2. Building Performance Simulation
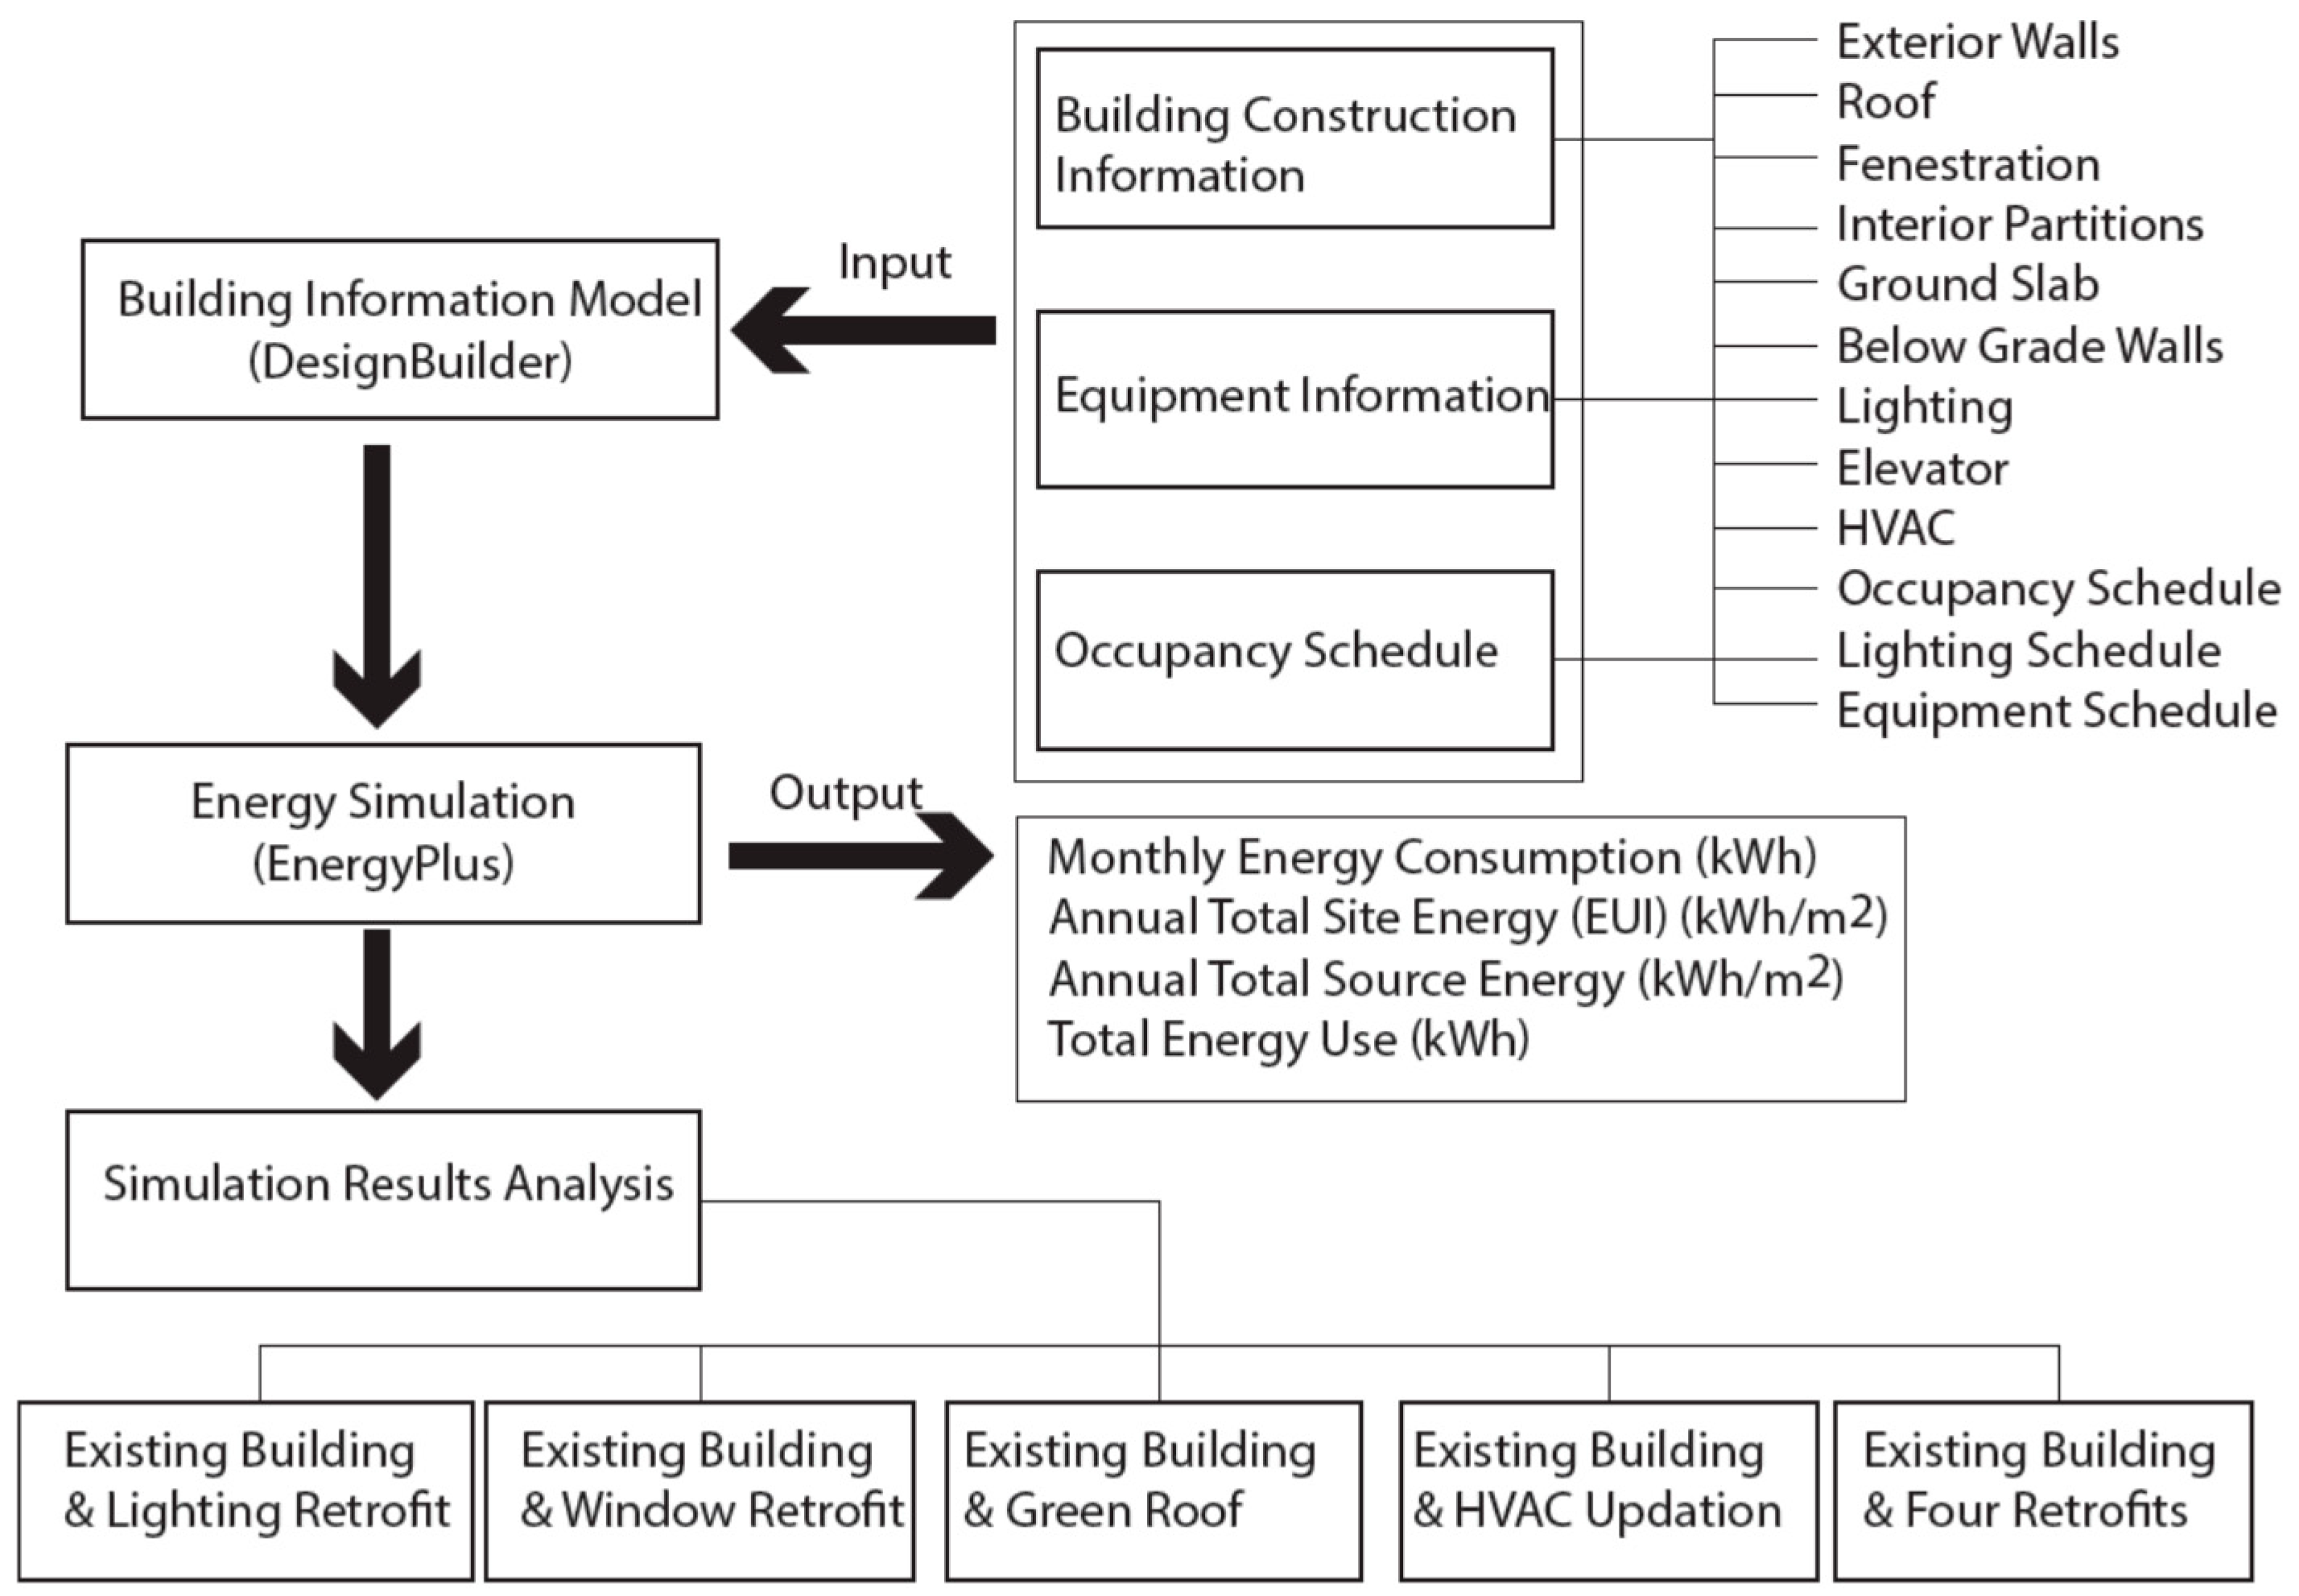
In order to determine the benefits of proposed ECMs to the CYC building, building energy simulation was conducted using EnergyPlus. In the project, the latest Version of Energy Plus v8.1/8.0 was employed. This version was authorized by U.S. Department of Energy and Building Technologies Program. In this research, the building information model was created in DesignBuilder and then exported into EnergyPlus for energy simulation. The simulation process is shown in
Figure 4.
In the simulation model, the thermal zone was defined according to the partitions of the space and the function of the space. The major thermal zones in each floor of CYC were identified as office, laboratory, service room, bathroom, lobby and corridor, AHU and lecture room. For each thermal zone of the floor, the total number of lighting fixtures and occupants were counted based on the energy audit result. The power densities of equipment and lighting were calculated according to the ASHRAE Standard.
Table 5 summarizes the building information settings using ASHRAE 90.1 as a baseline [
38]. Other building information such as occupant schedule, lighting schedule and equipment schedule were collected through the energy audit process as discussed before.
Validation was conducted to verify the simulation by comparing the simulation results with the actual energy use in 2009. Validation is an essential task to ensure that building systems are properly modeled and integrated for the purpose of simulating the building energy consumption [
39].
Table 6 shows the simulated energy use data compared with the actual data of 2009.
The error of the total yearly energy consumption between simulated results and the actual data was 2.8%. The measured monthly energy consumption was within 15% of the simulated monthly energy consumption. This demonstrates that the predictions were in good agreement with the actual energy consumption data of the CYC Building. Thus this modeling and simulation technique can be used for the evaluation of different energy conservation retrofits and their energy performance analysis. This error should be also considered in the measurement and verification process.
There are four ECMs applied to the CYC project: lighting system retrofit; window film; green roof; and chilled plant and related building management system upgrading. To evaluate and analyze the result of each retrofit, the research compared the existing building’s energy consumption with each retrofit respectively while the other four aspects keeping the same. At last, the research also compared the existing building’s energy consumption with the one after all four retrofits applied in order to study the integrated effect.
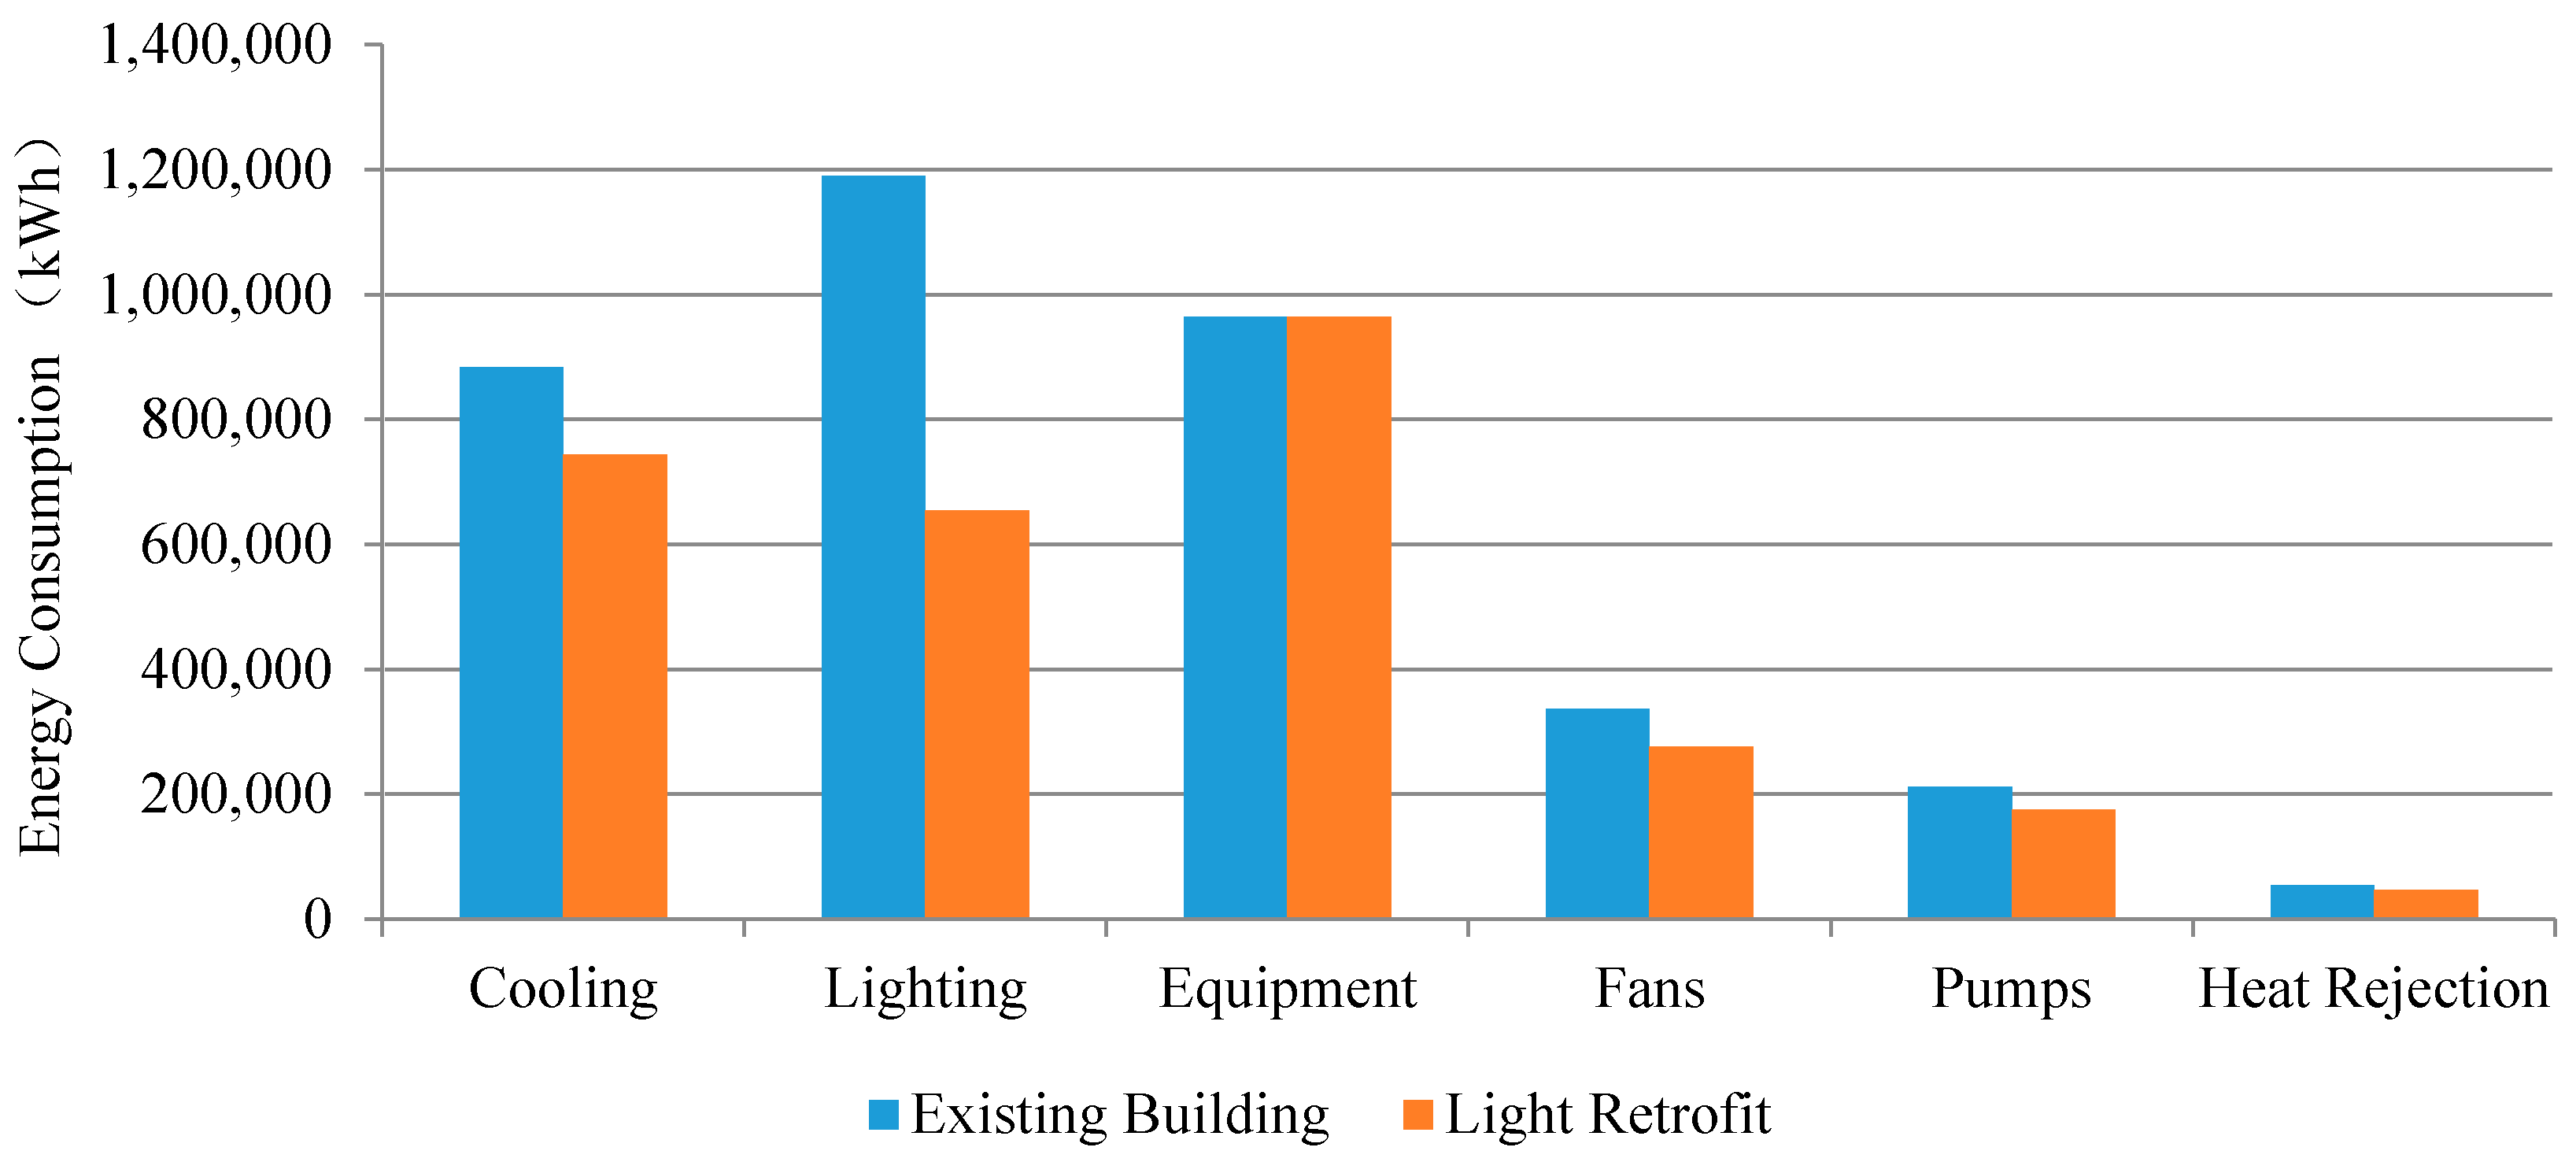
LEDs with 35W power were to be installed in the CYC Building to replace the original T8 lightings. The lighting power density before and after the Lighting retrofit were calculated in
Table 7.
Figure 5 compares the simulation result of the annual energy consumption breakdown by LED energy efficient lamps with the base model. From the simulation result, it can be seen that after the lighting system retrofit, the cooling consumption and the interior lighting consumption were reduced by 16% and 44%, respectively.
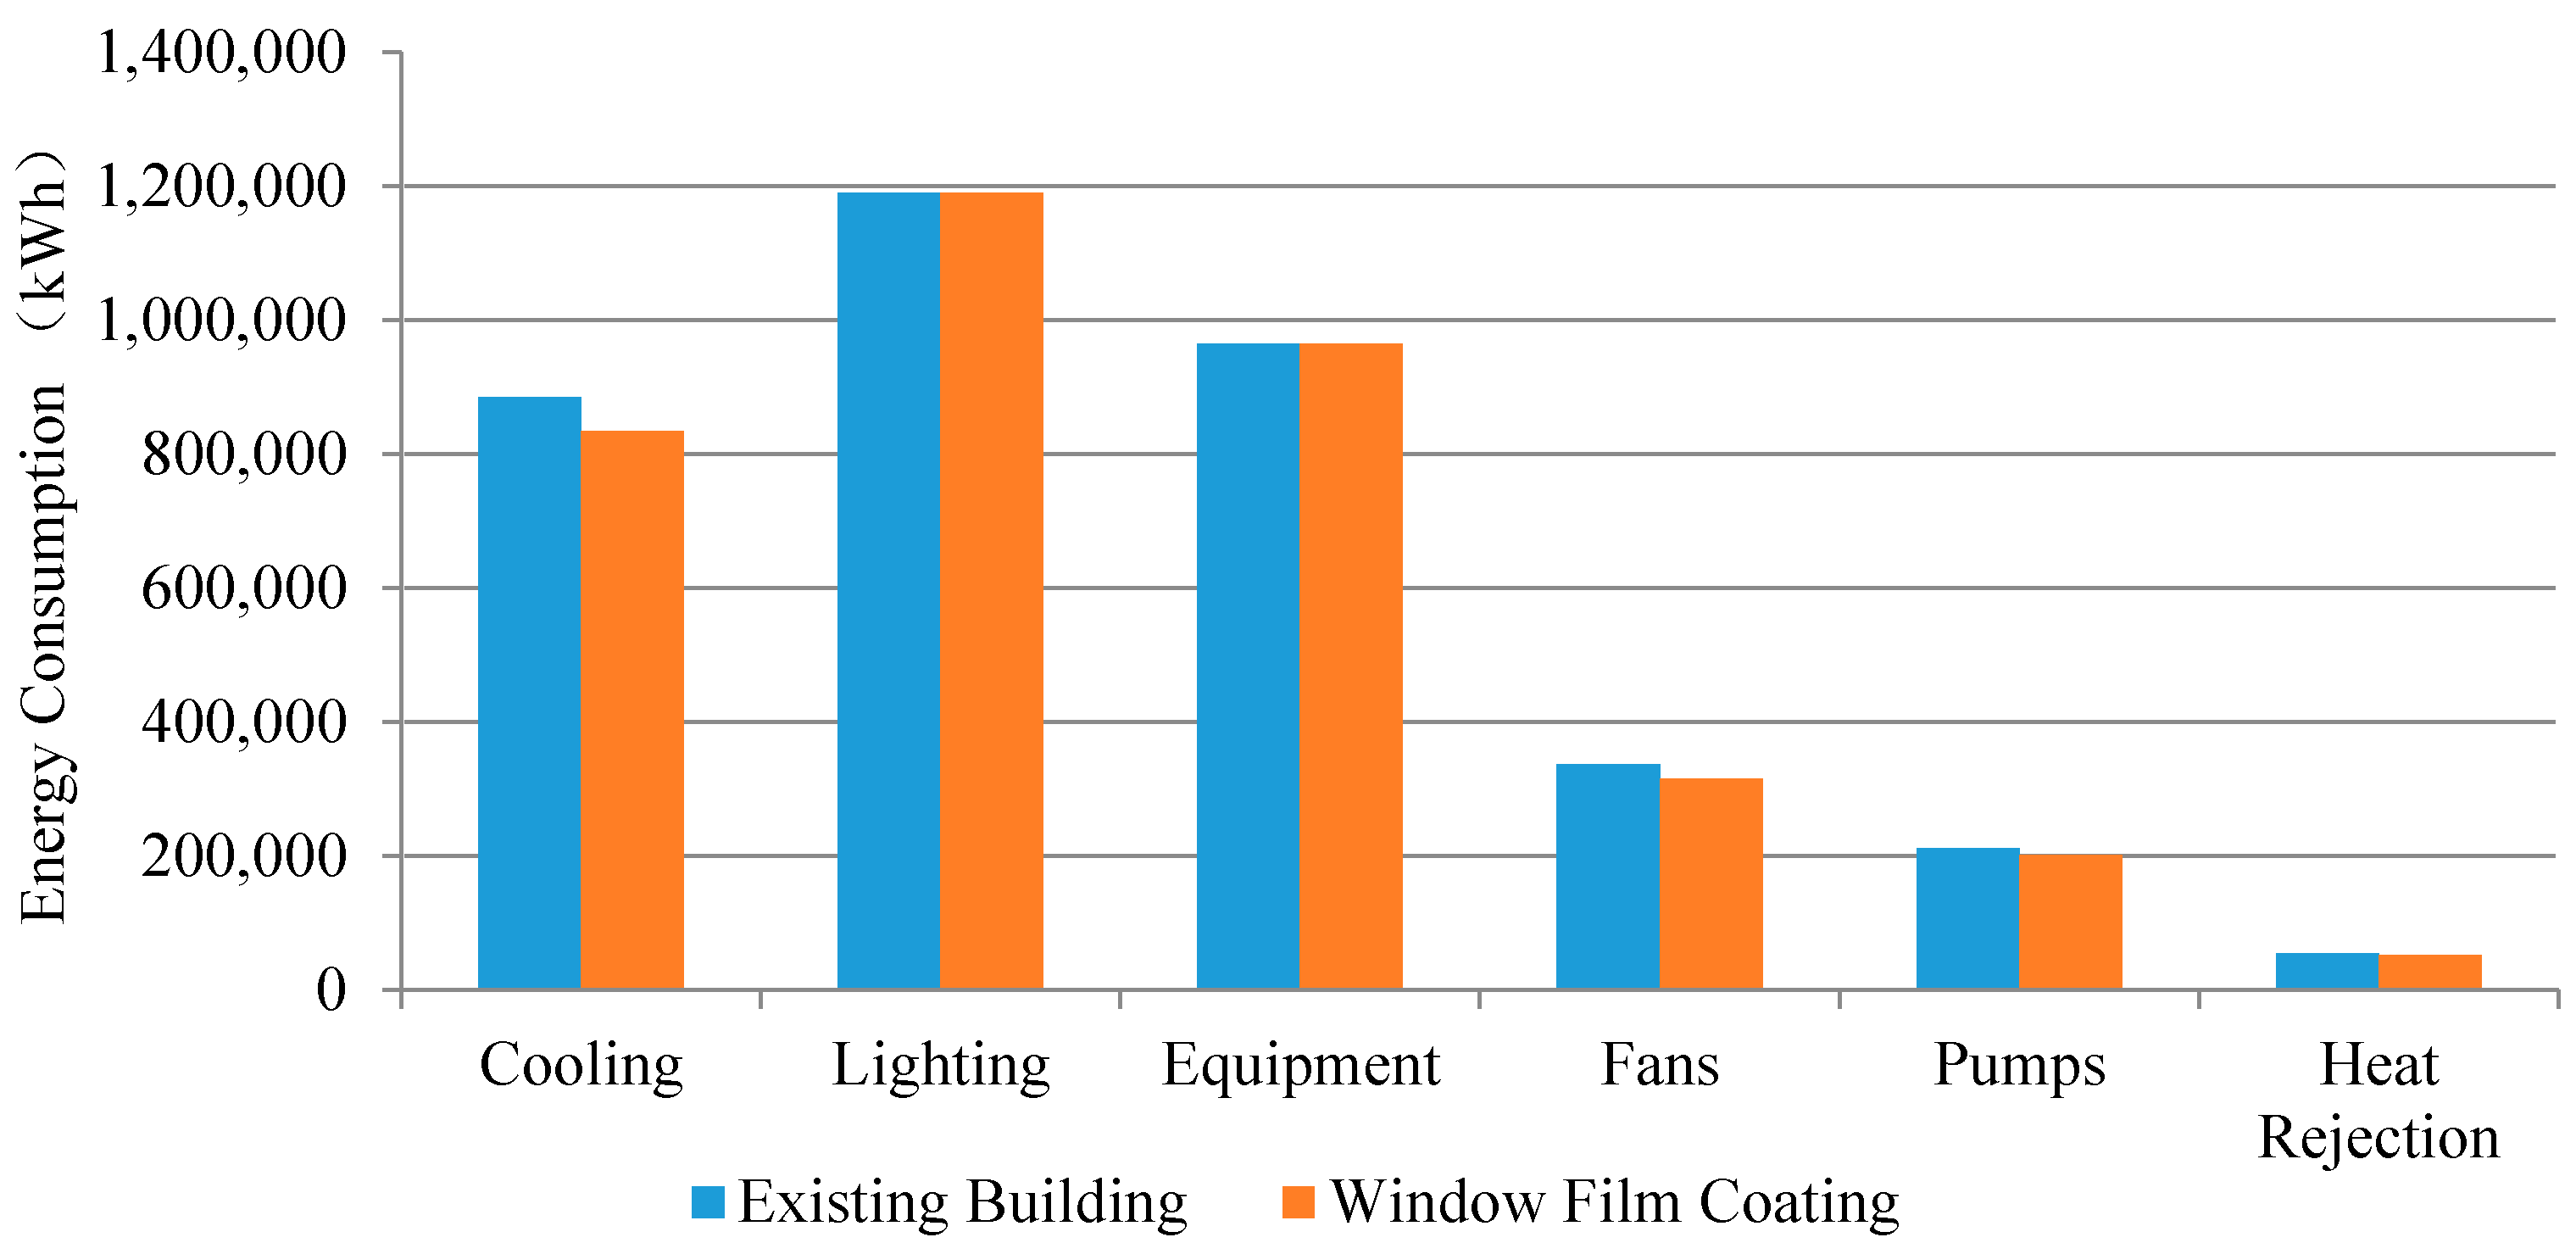
In the CYC Building, some windows were to be coated with the 3M NV 35. The specifications of the original glazing and window film coated glazing are shown in
Table 8. From the simulation results as shown in
Figure 6, it can be seen that after the window film coating, the cooling consumption and the fans energy consumption were reduced by 6% and 6.5%, respectively.
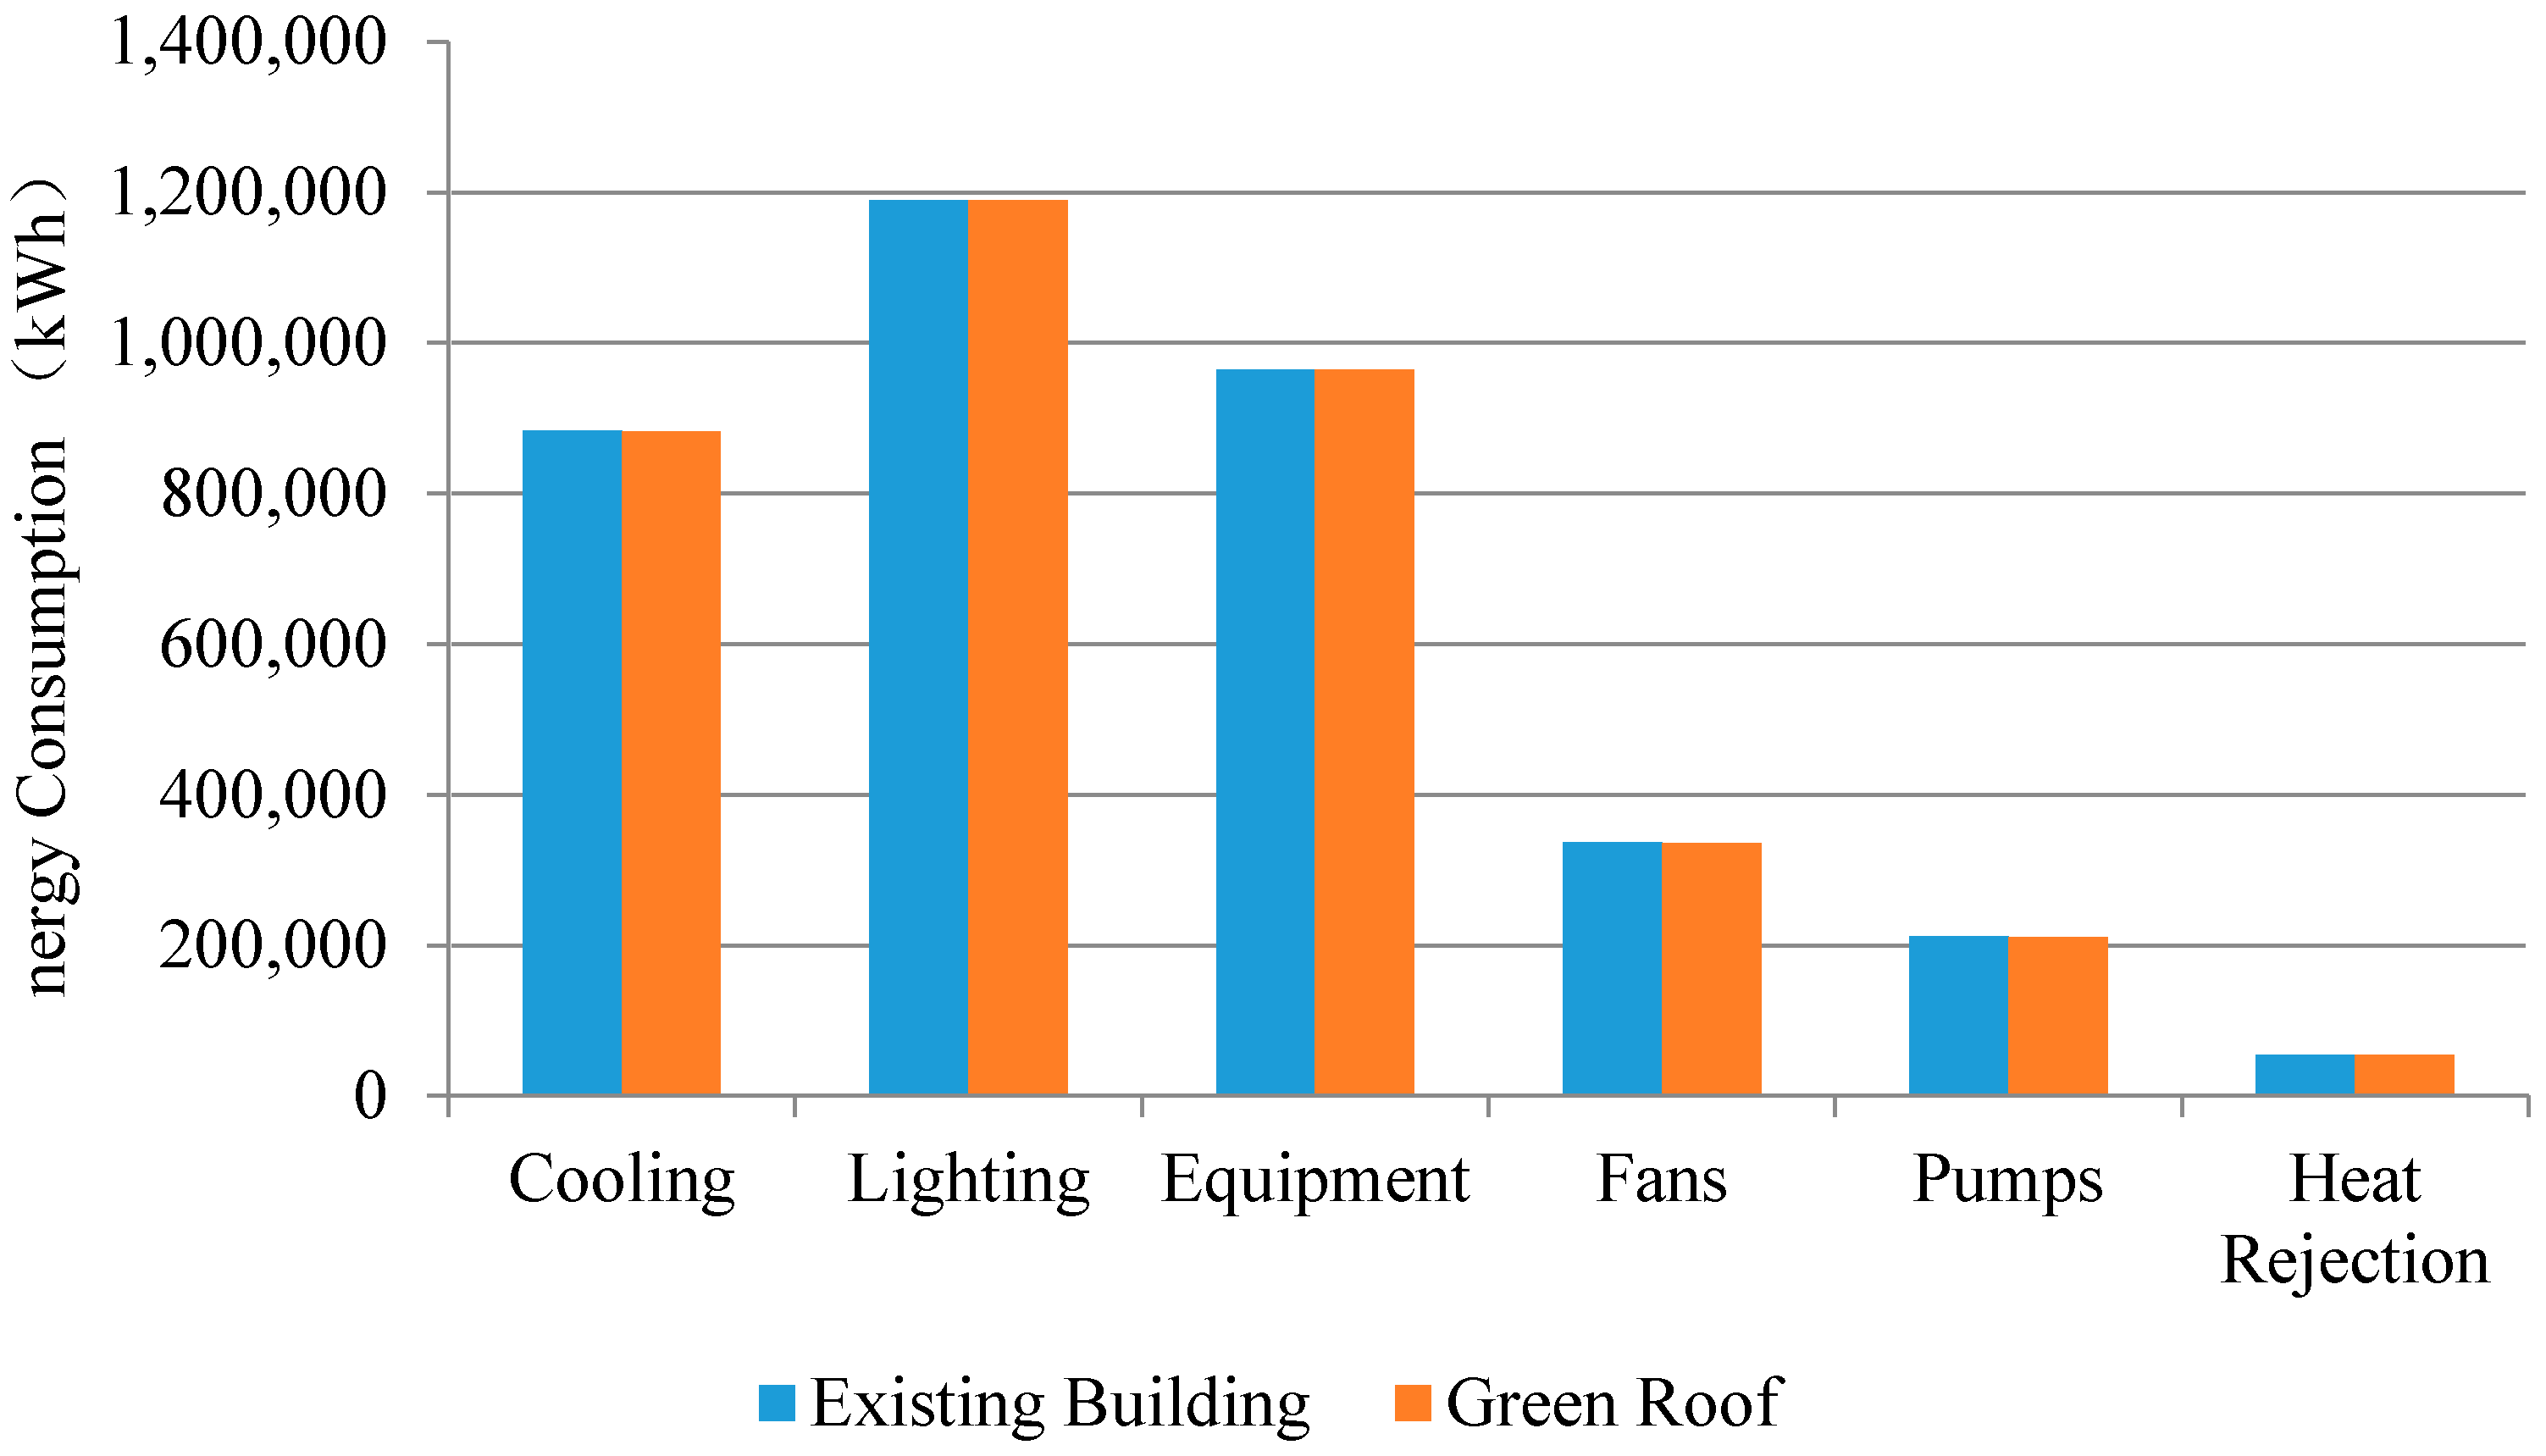
In the CYC Building, an intensive green roof system was designed to reduce solar radiation on the original flat concrete roof.
Table 9 shows the specification of the green roof system. From the simulation results as shown in
Figure 7, it can be seen that after greening the roof, the annual energy consumption was not reduced obviously. It might because the area of the green roof was too small (only 100 m
2) and it did not have much influence on the whole building’s energy consumption.
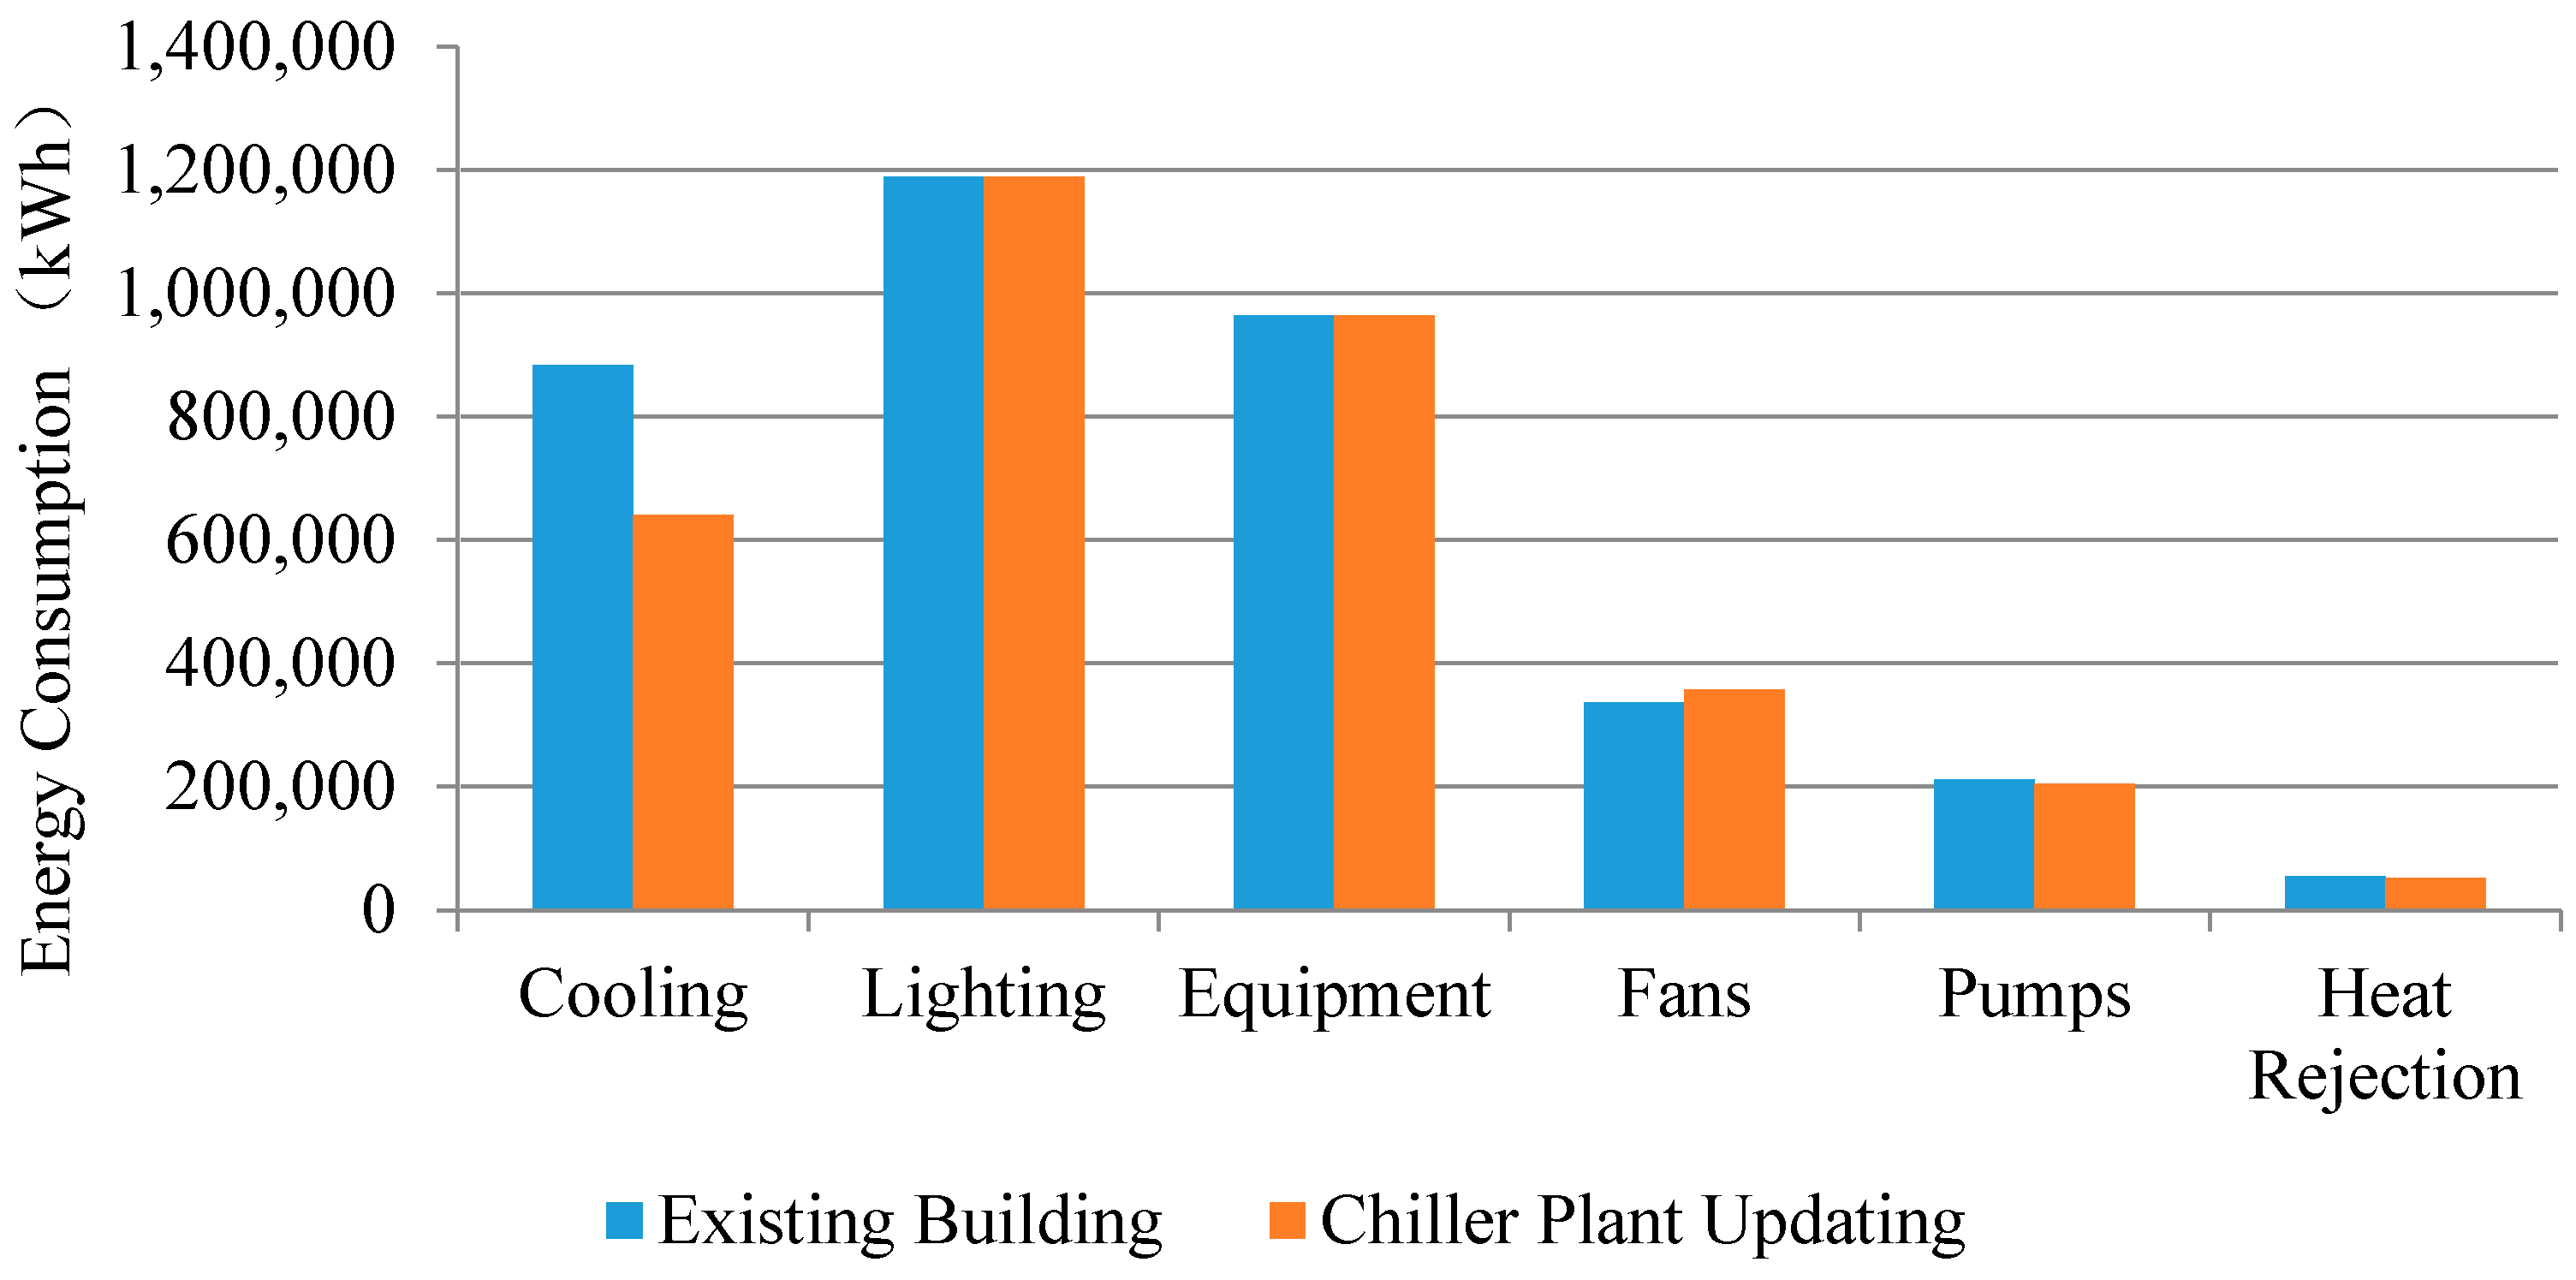
The COP of chiller plant was to be updated from 2.6 to 5.0 by the plant replacement.
Table 10 compares the monthly electricity consumption due to this upgrade. As shown in
Figure 8, chiller plant updating can reduce a significant portion of cooling load in summer, especially in June, July, August, September and October. The cooling energy consumption was reduced by 27.4%.
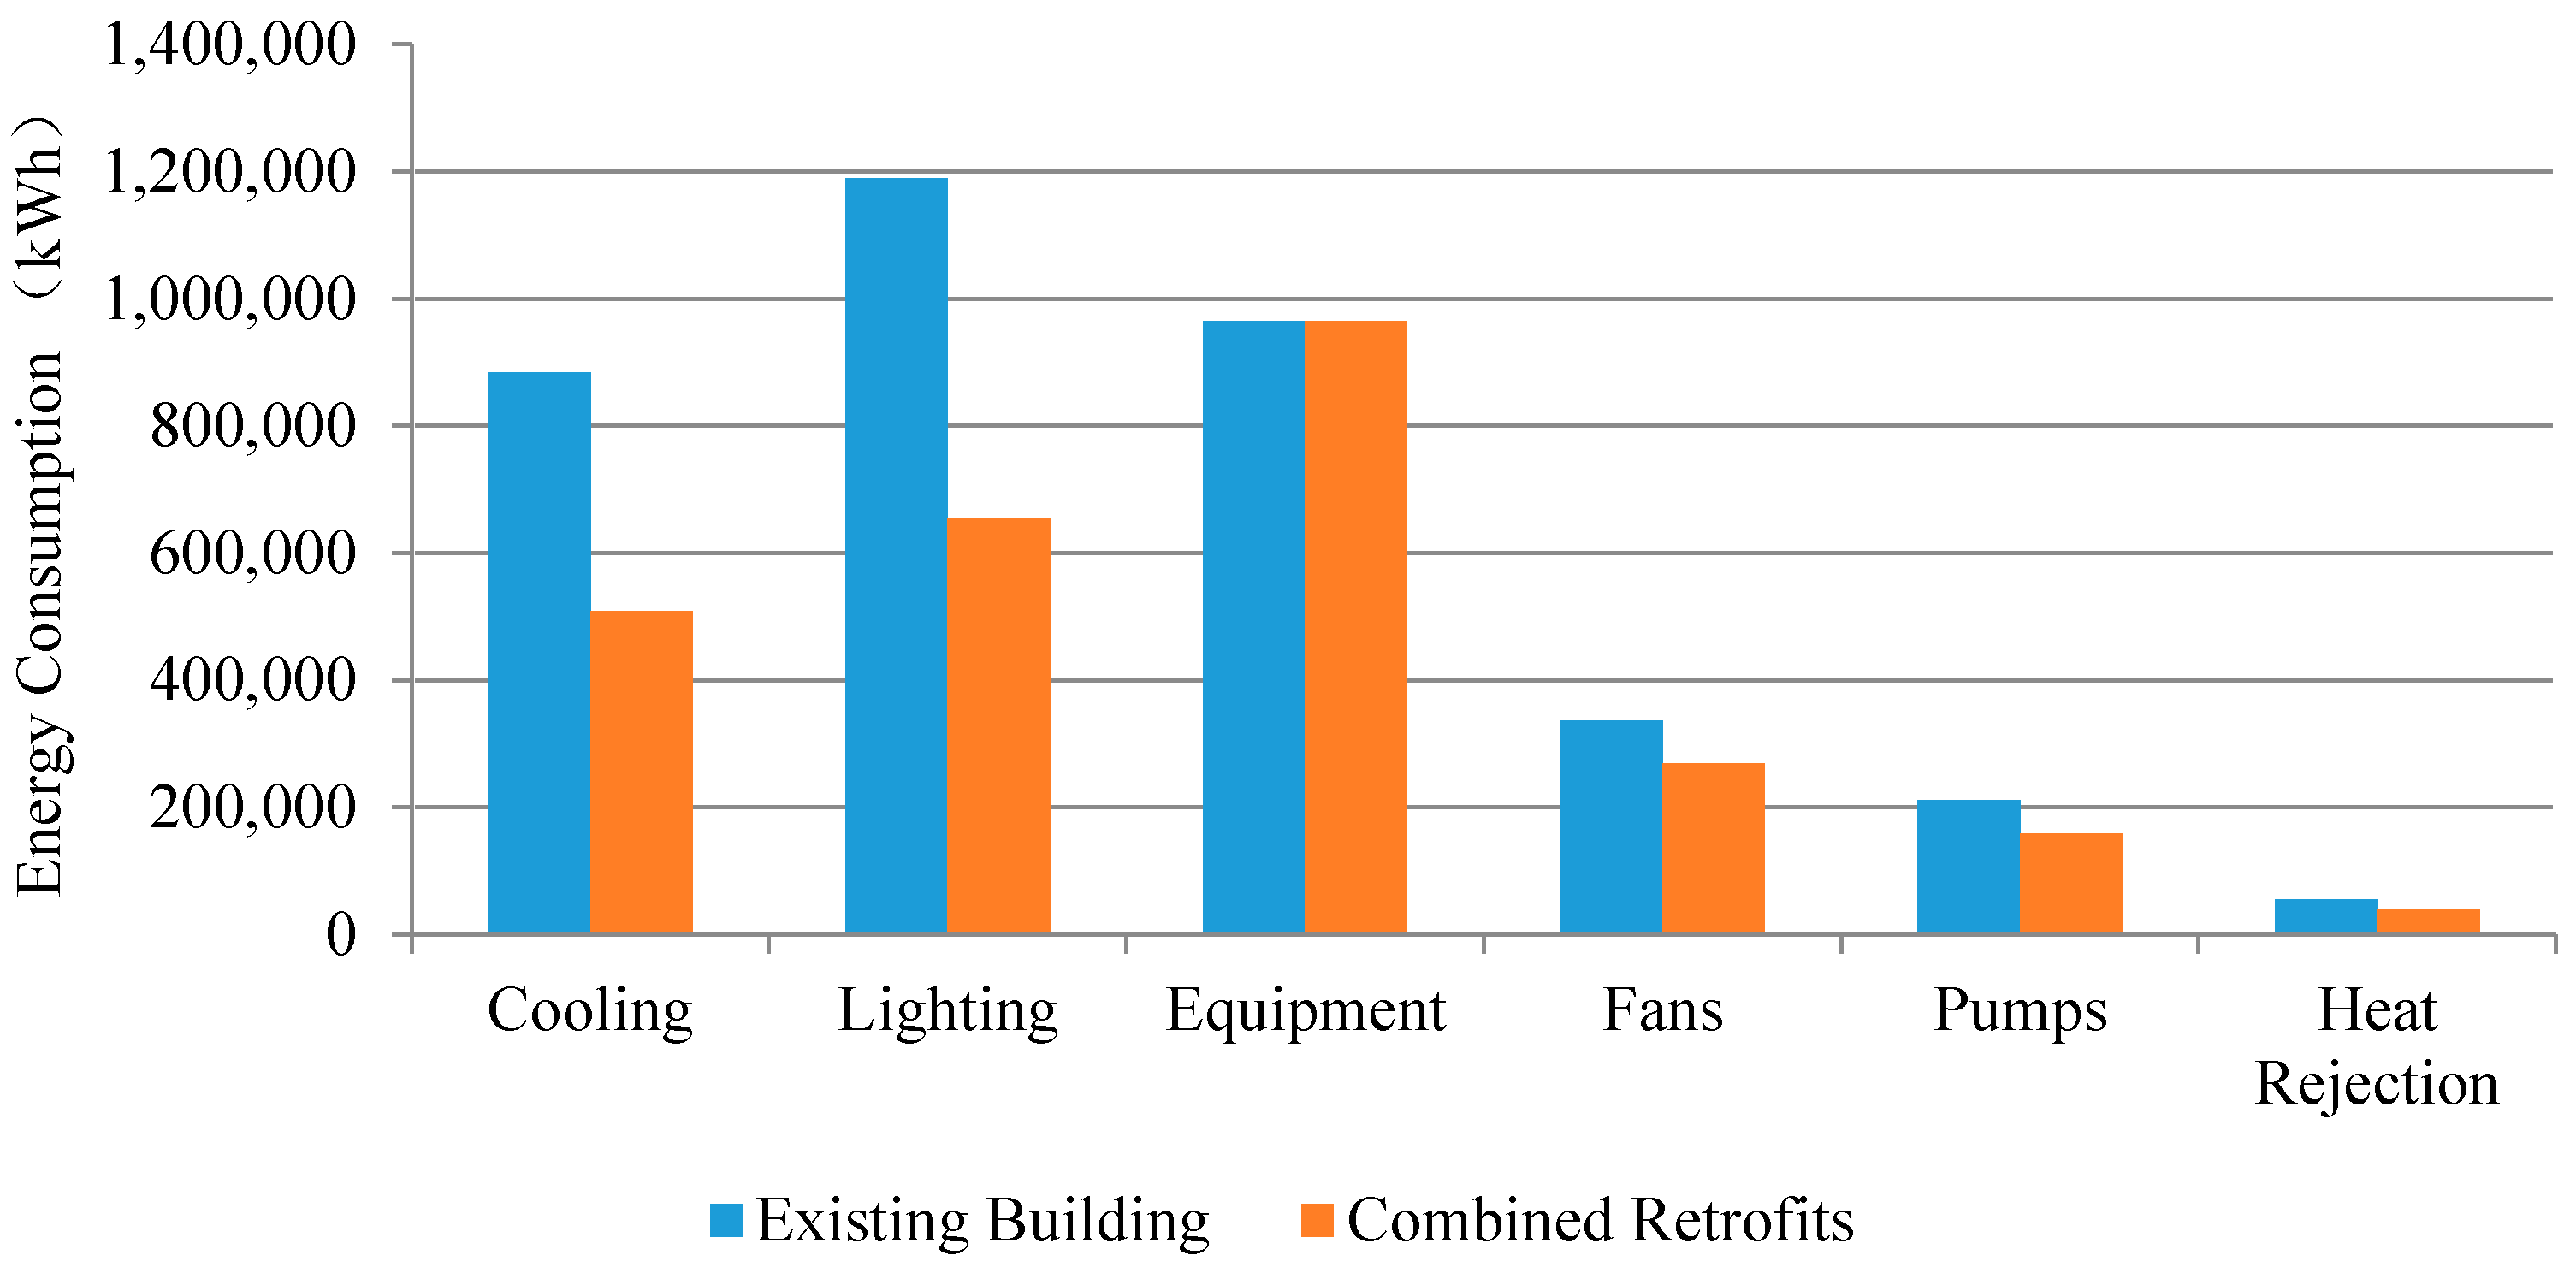
From the simulation results (
Figure 9), it can be seen that after combining the four measures, the cooling consumption and the interior lighting consumption were reduced by respectively 42% and 45%. The total energy saving was 1,256,259 kWh per year which could be translated to a reduction of 853 tons of CO
2 emission per year.
3.3. Measurement and Verification
The determination of energy savings requires both accurate measurement and replicable methodology, known as a measurement and verification protocol. Based on the M & V protocol [
40], this project measured and verified the effectiveness of isolated retrofit strategy as well as energy use of the whole retrofitted building.
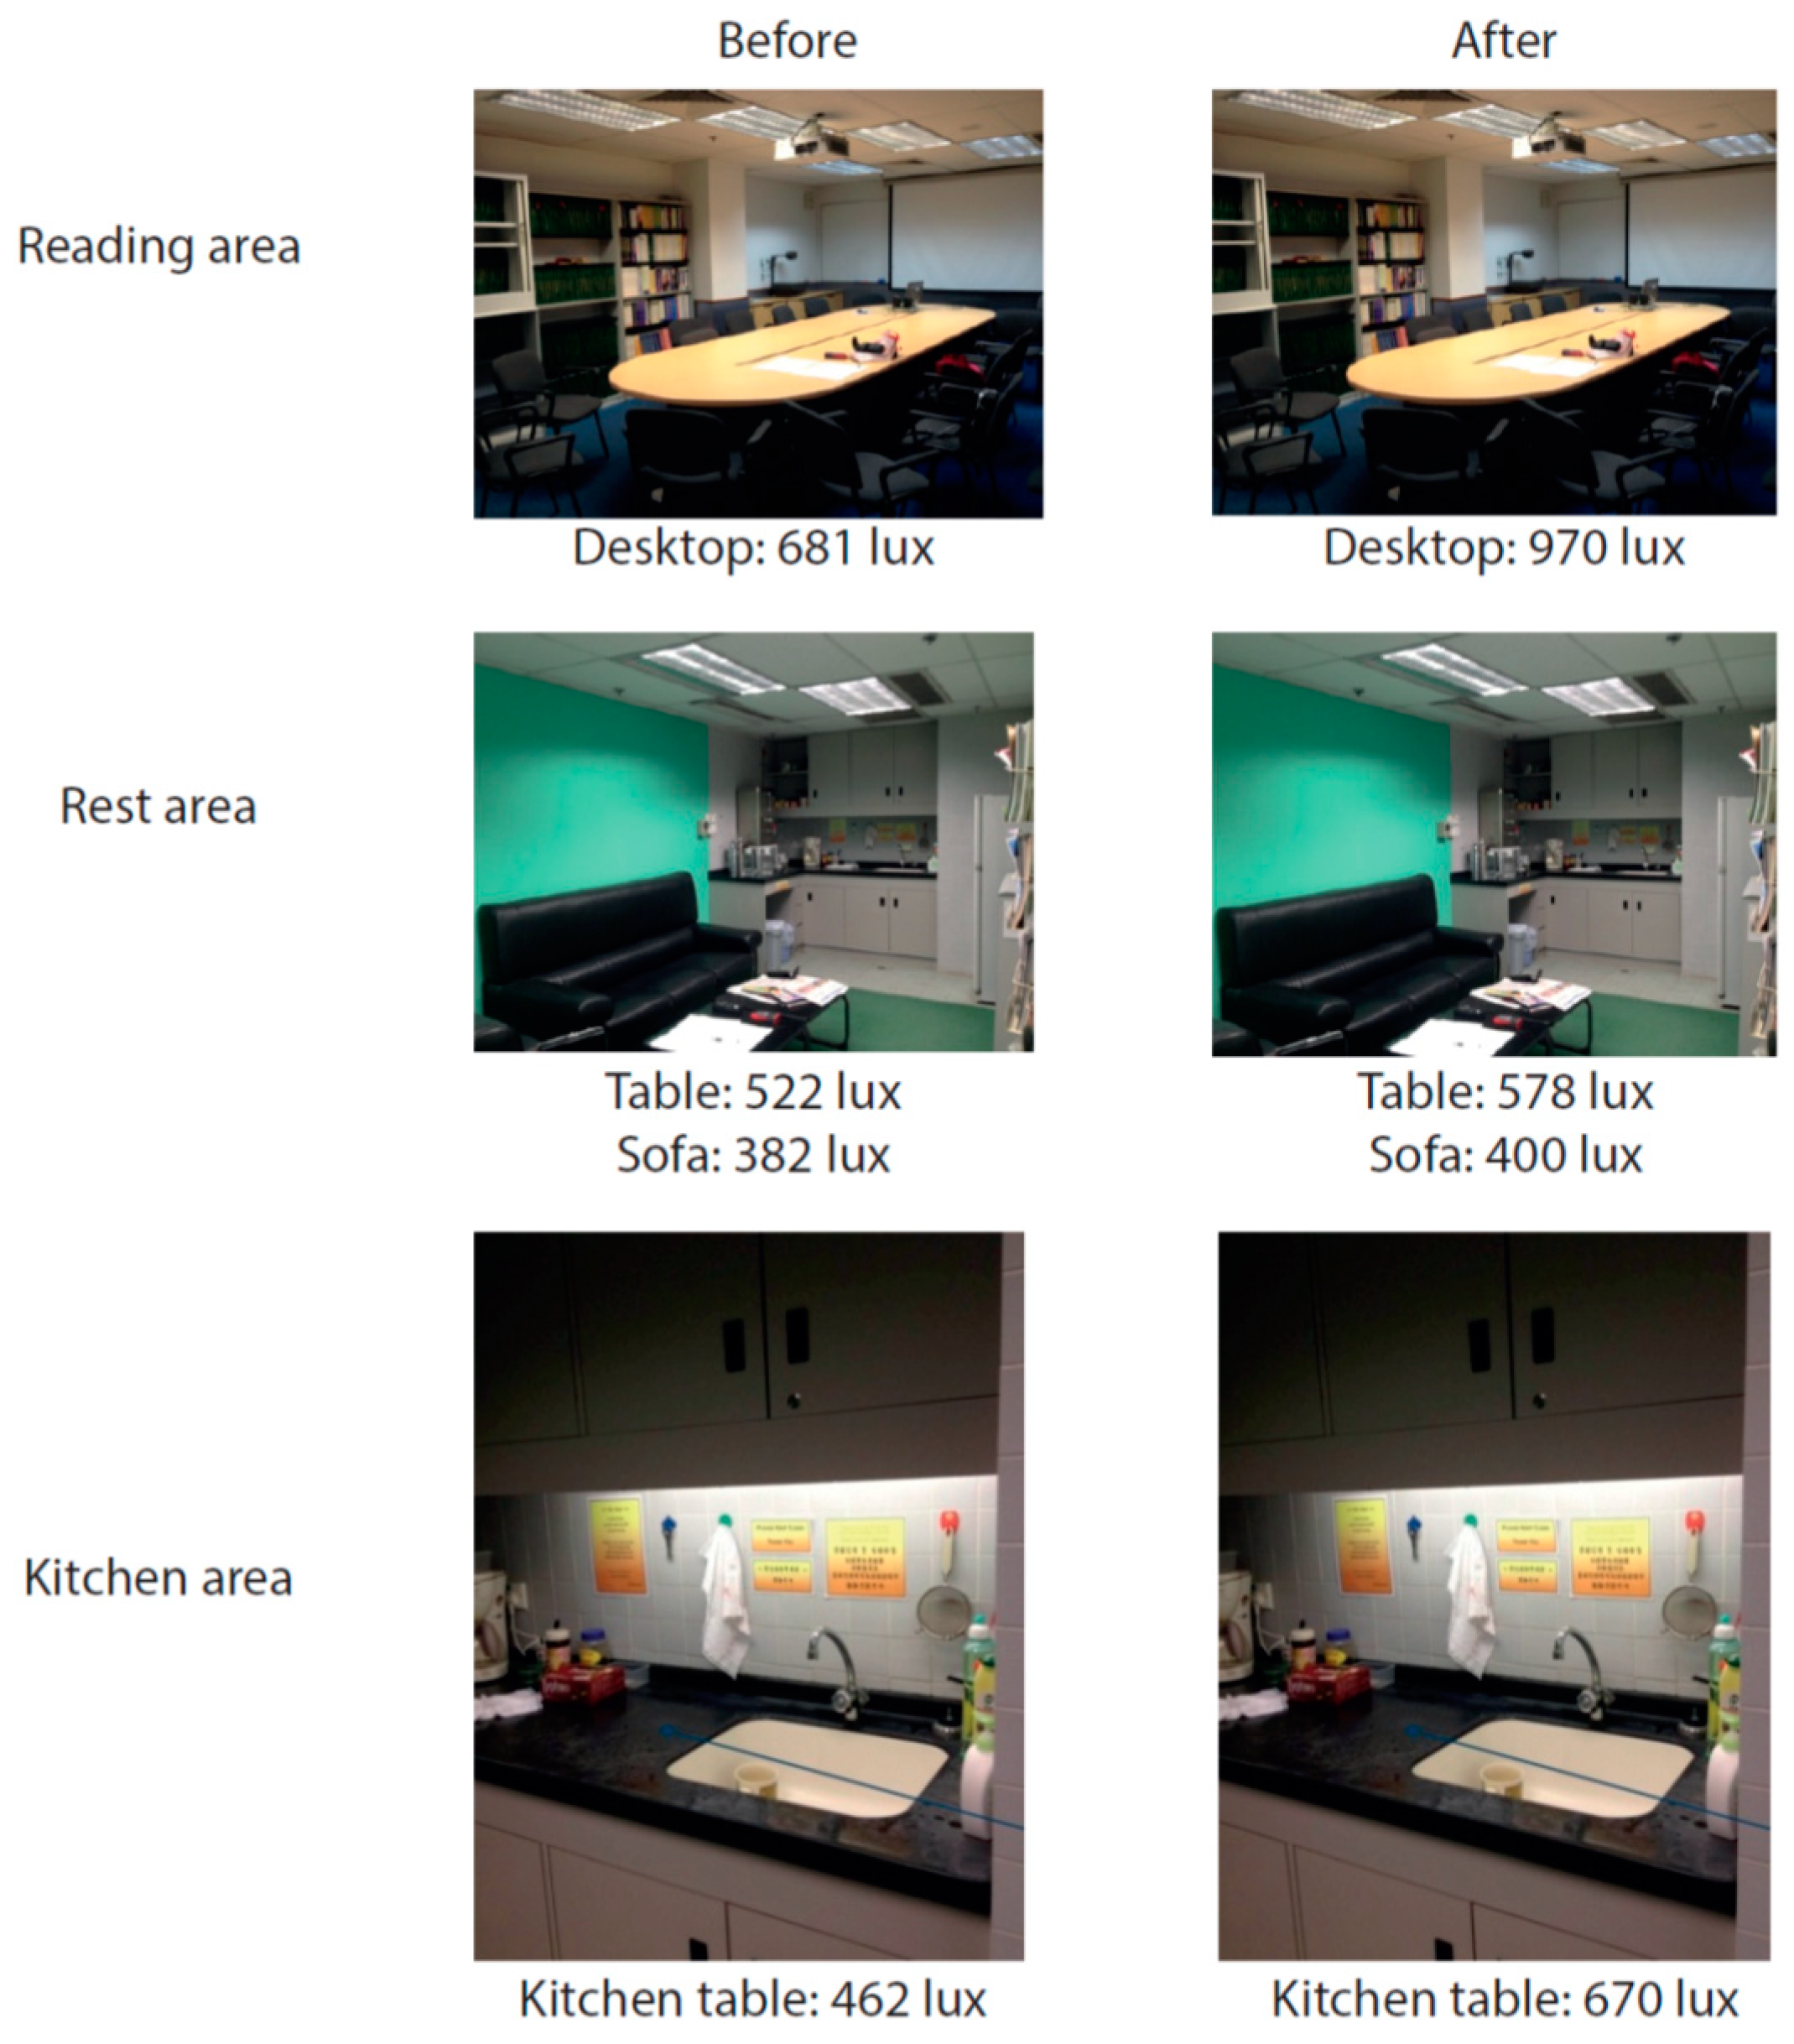
The M & V of the lighting retrofit was conducted before and after the retrofit. The M & V chose three areas to do the comparison study before and after the retrofit: study area, rest area and kitchen area. The three areas were measured several times before and after retrofits under artificial illumination only. A CHROMA Meter CL-200 (Konica Minolta Sensing Americas, Ramsey, Inc., NJ, USA) was used to measure illuminance levels. The result is disclosed in
Figure 10. After the retrofit, the illuminance was increased at the same place. The M & V also tested 30 T8 tubes (the main lighting sources before the retrofit) and 30 LED tubes (the main lighting sources after the retrofit). The average wattage of LED tubes was 35 W and that of T8 tubes was about 67 W, which means that LED saved more electricity to achieve the same illuminance level.
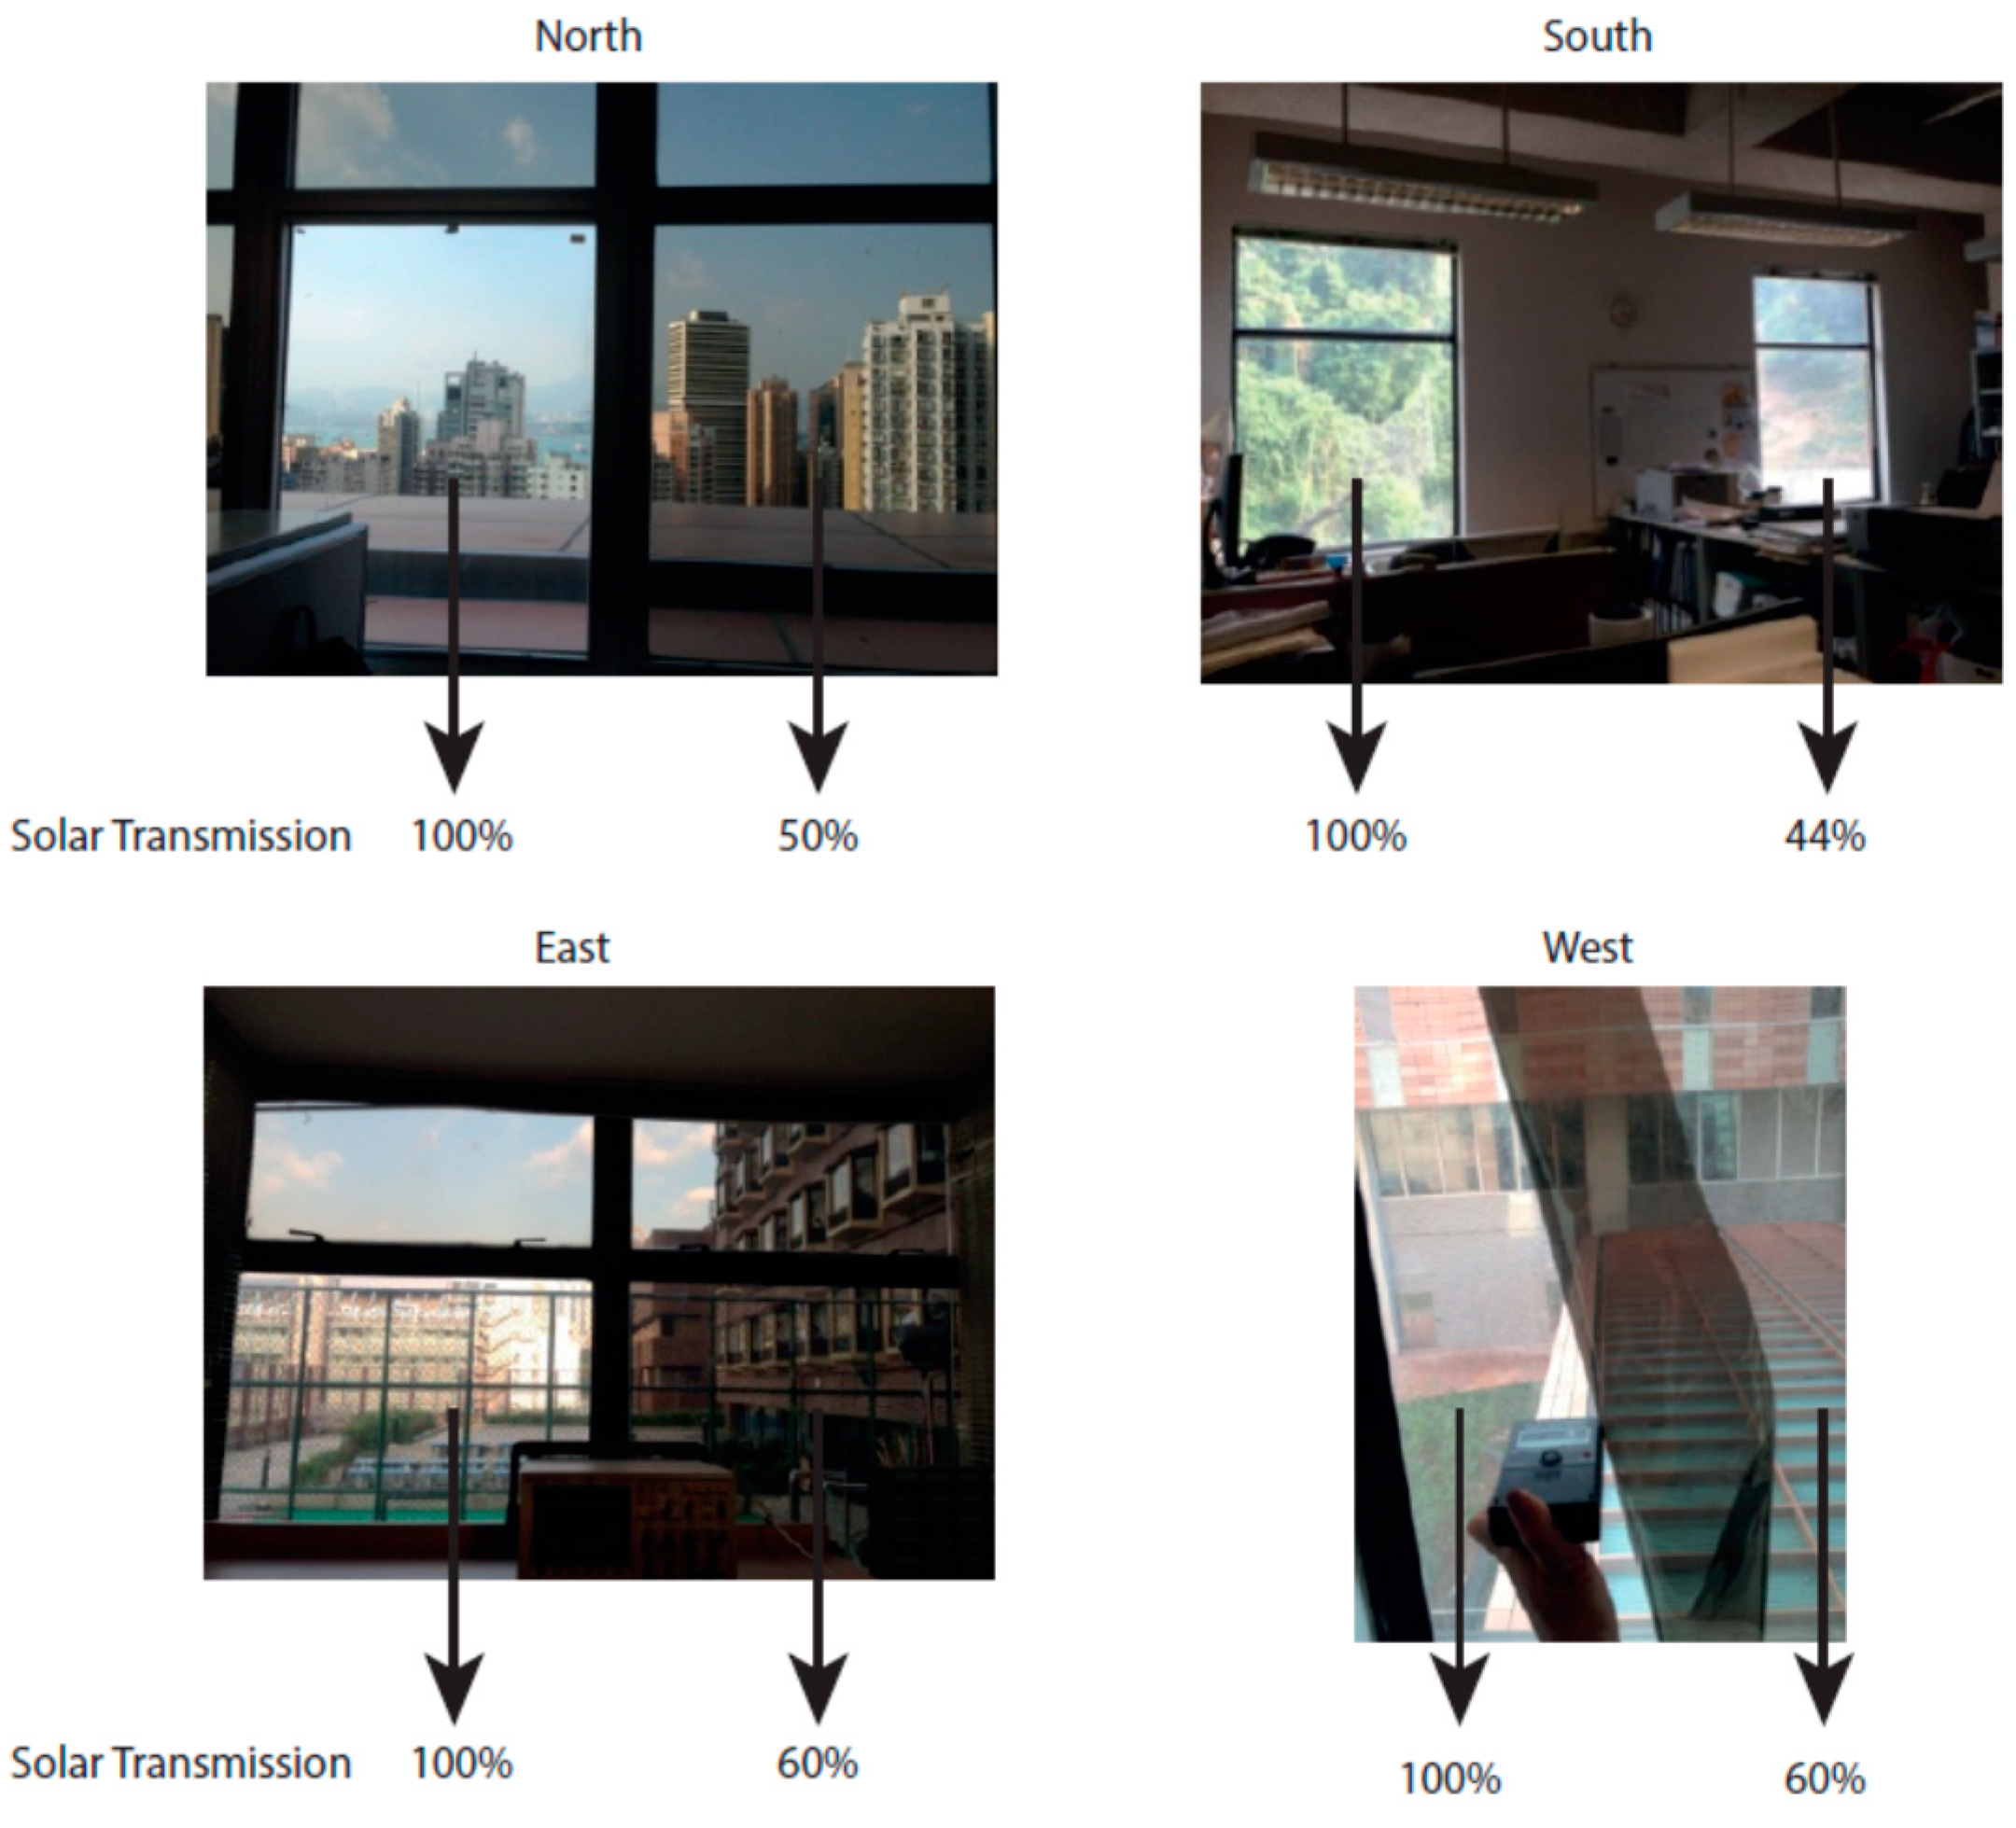
Most windows were tinted with films to reduce solar heat gains; however, while some of windows were kept unchanged for comparison. M & V was conducted to compare transmission properties of windows with and without films. This measurement was conducted on 21 October 2012 during 12:00–13:00 p.m. The windows on each façade north, south, east and west were selected to conduct the measurement. A Solar Transmission & BTU Power Meter (EDTM SP2065, EDTM, Inc., Toledo, OH, USA) was used to measure the two types of windows on each façade.
Figure 11 shows the comparative study; it indicates that the windows with films significantly reduced the solar heat gains.
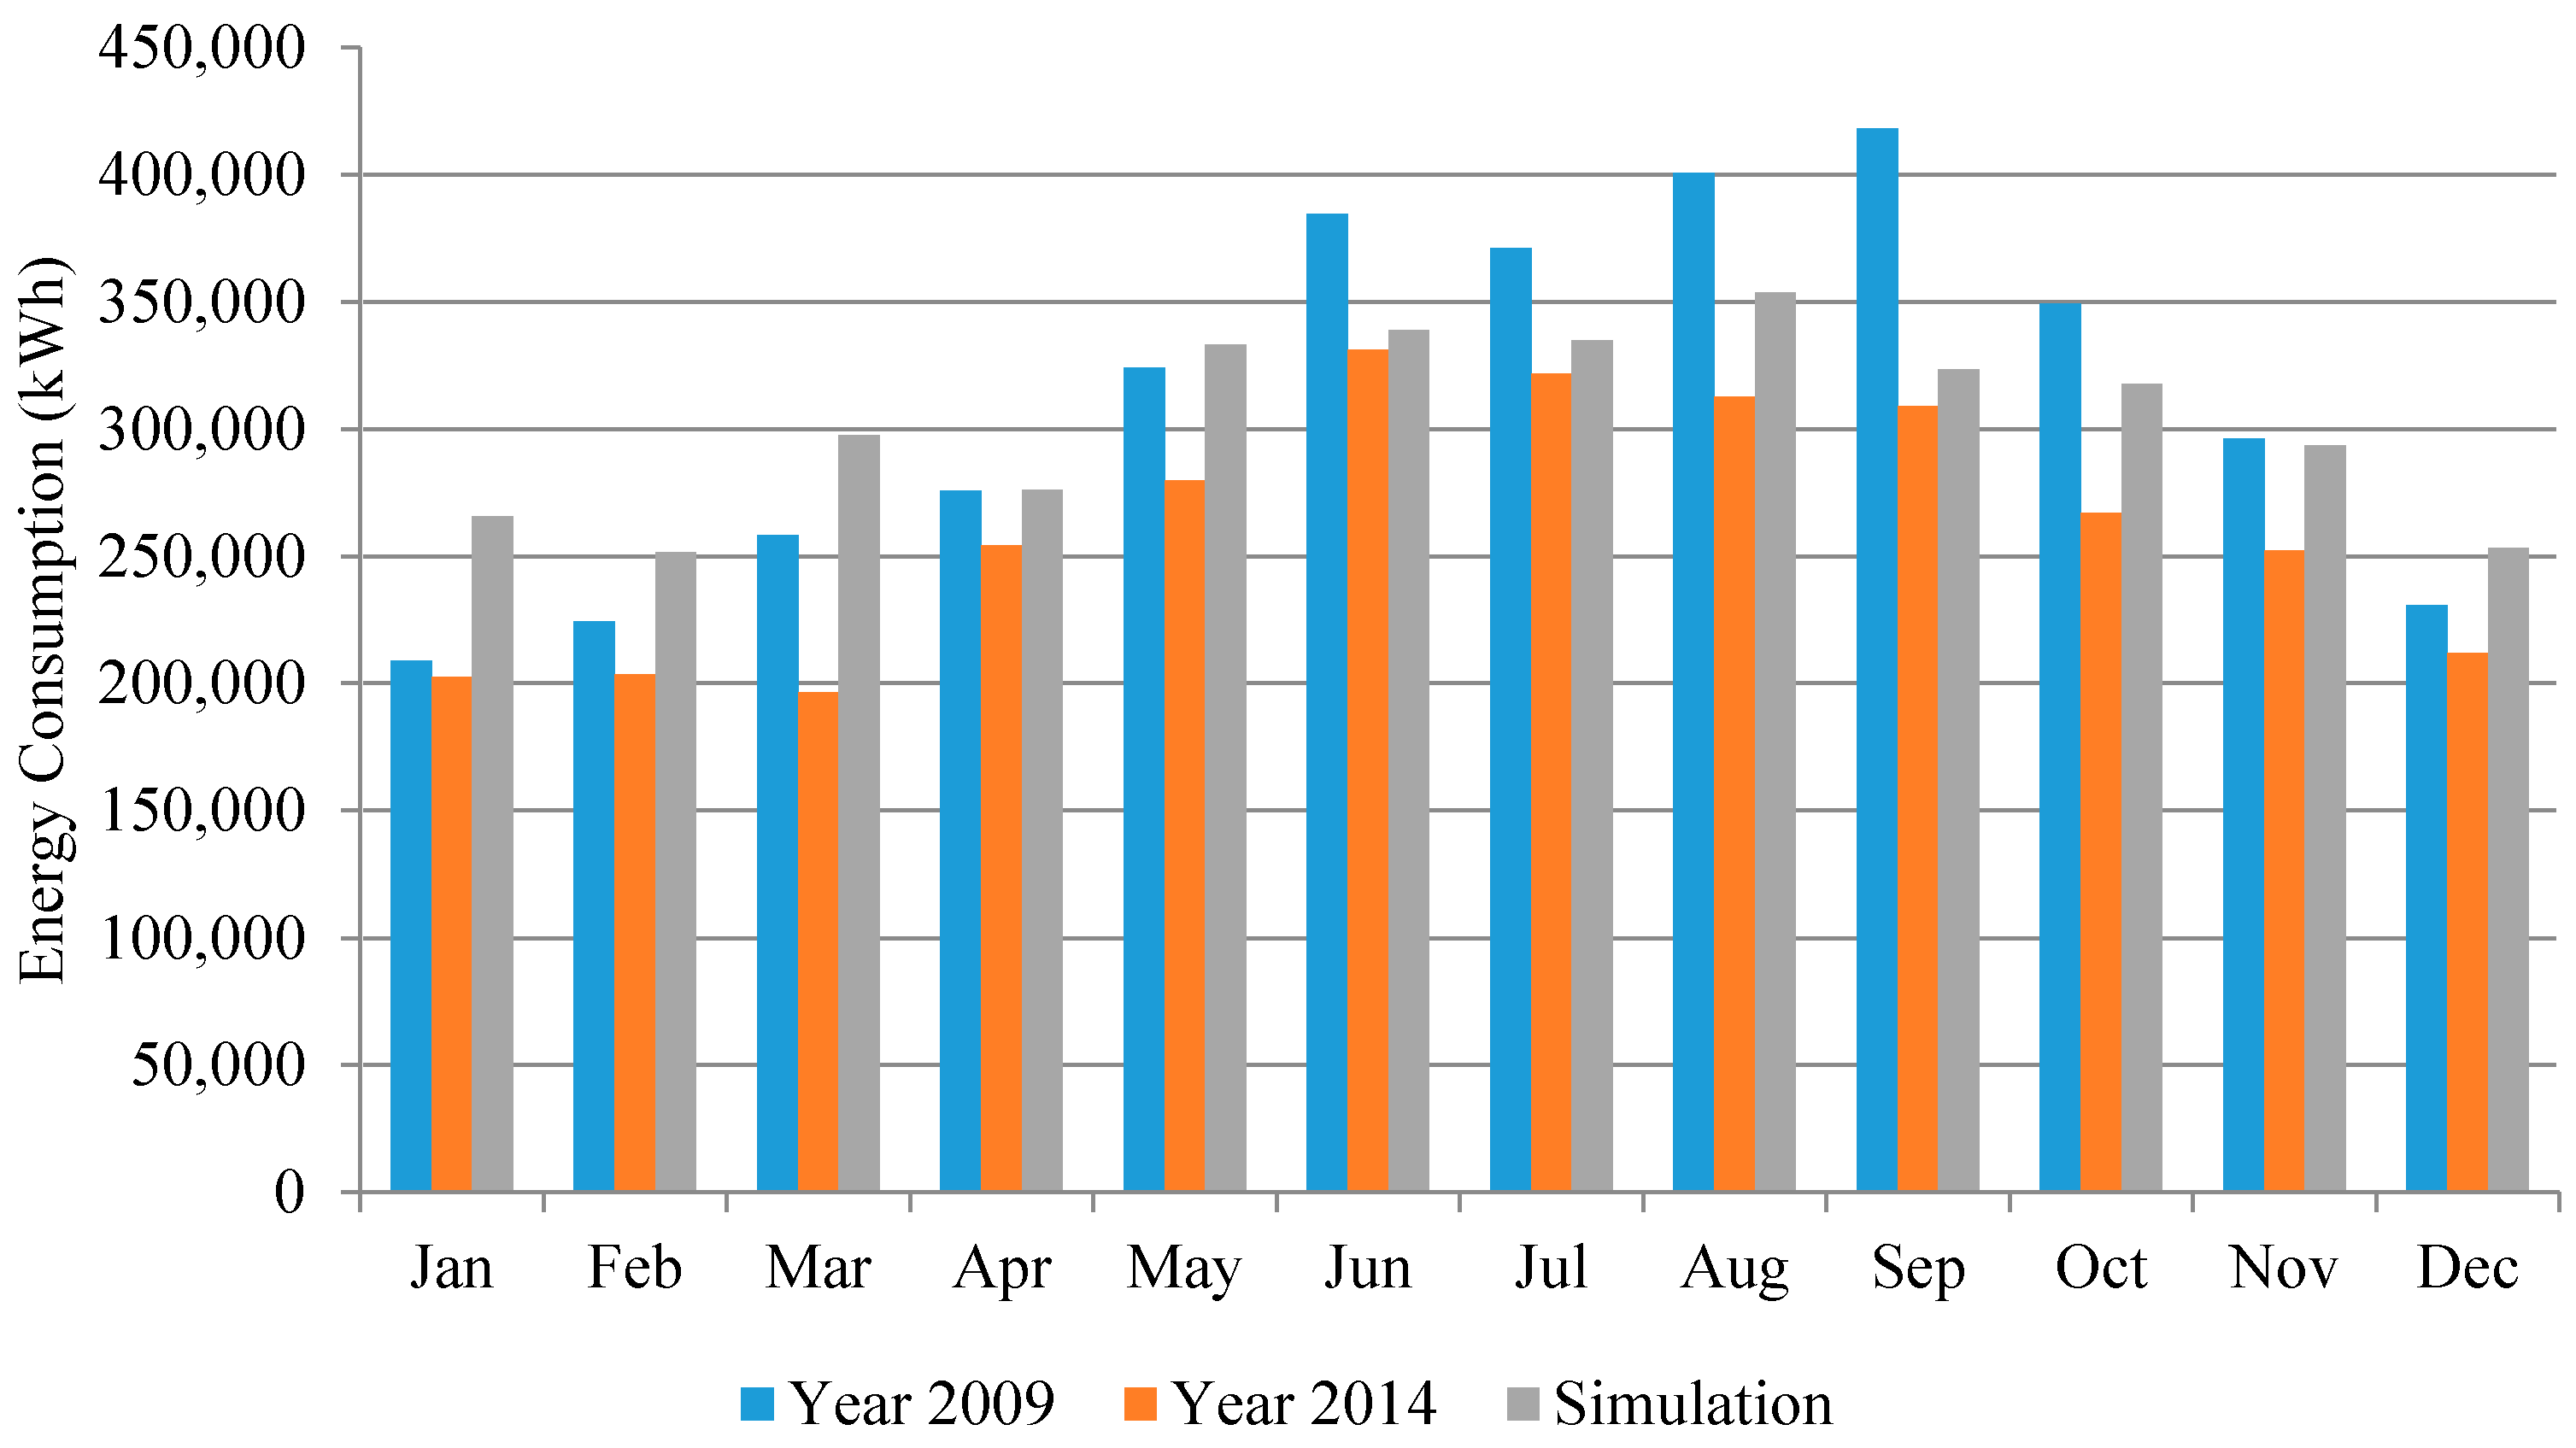
The retrofitting was completed in 2012. Energy use data for the year 2014 were collected. Through the comparison of the actual energy use data before and after the retrofit, the energy savings could be verified.
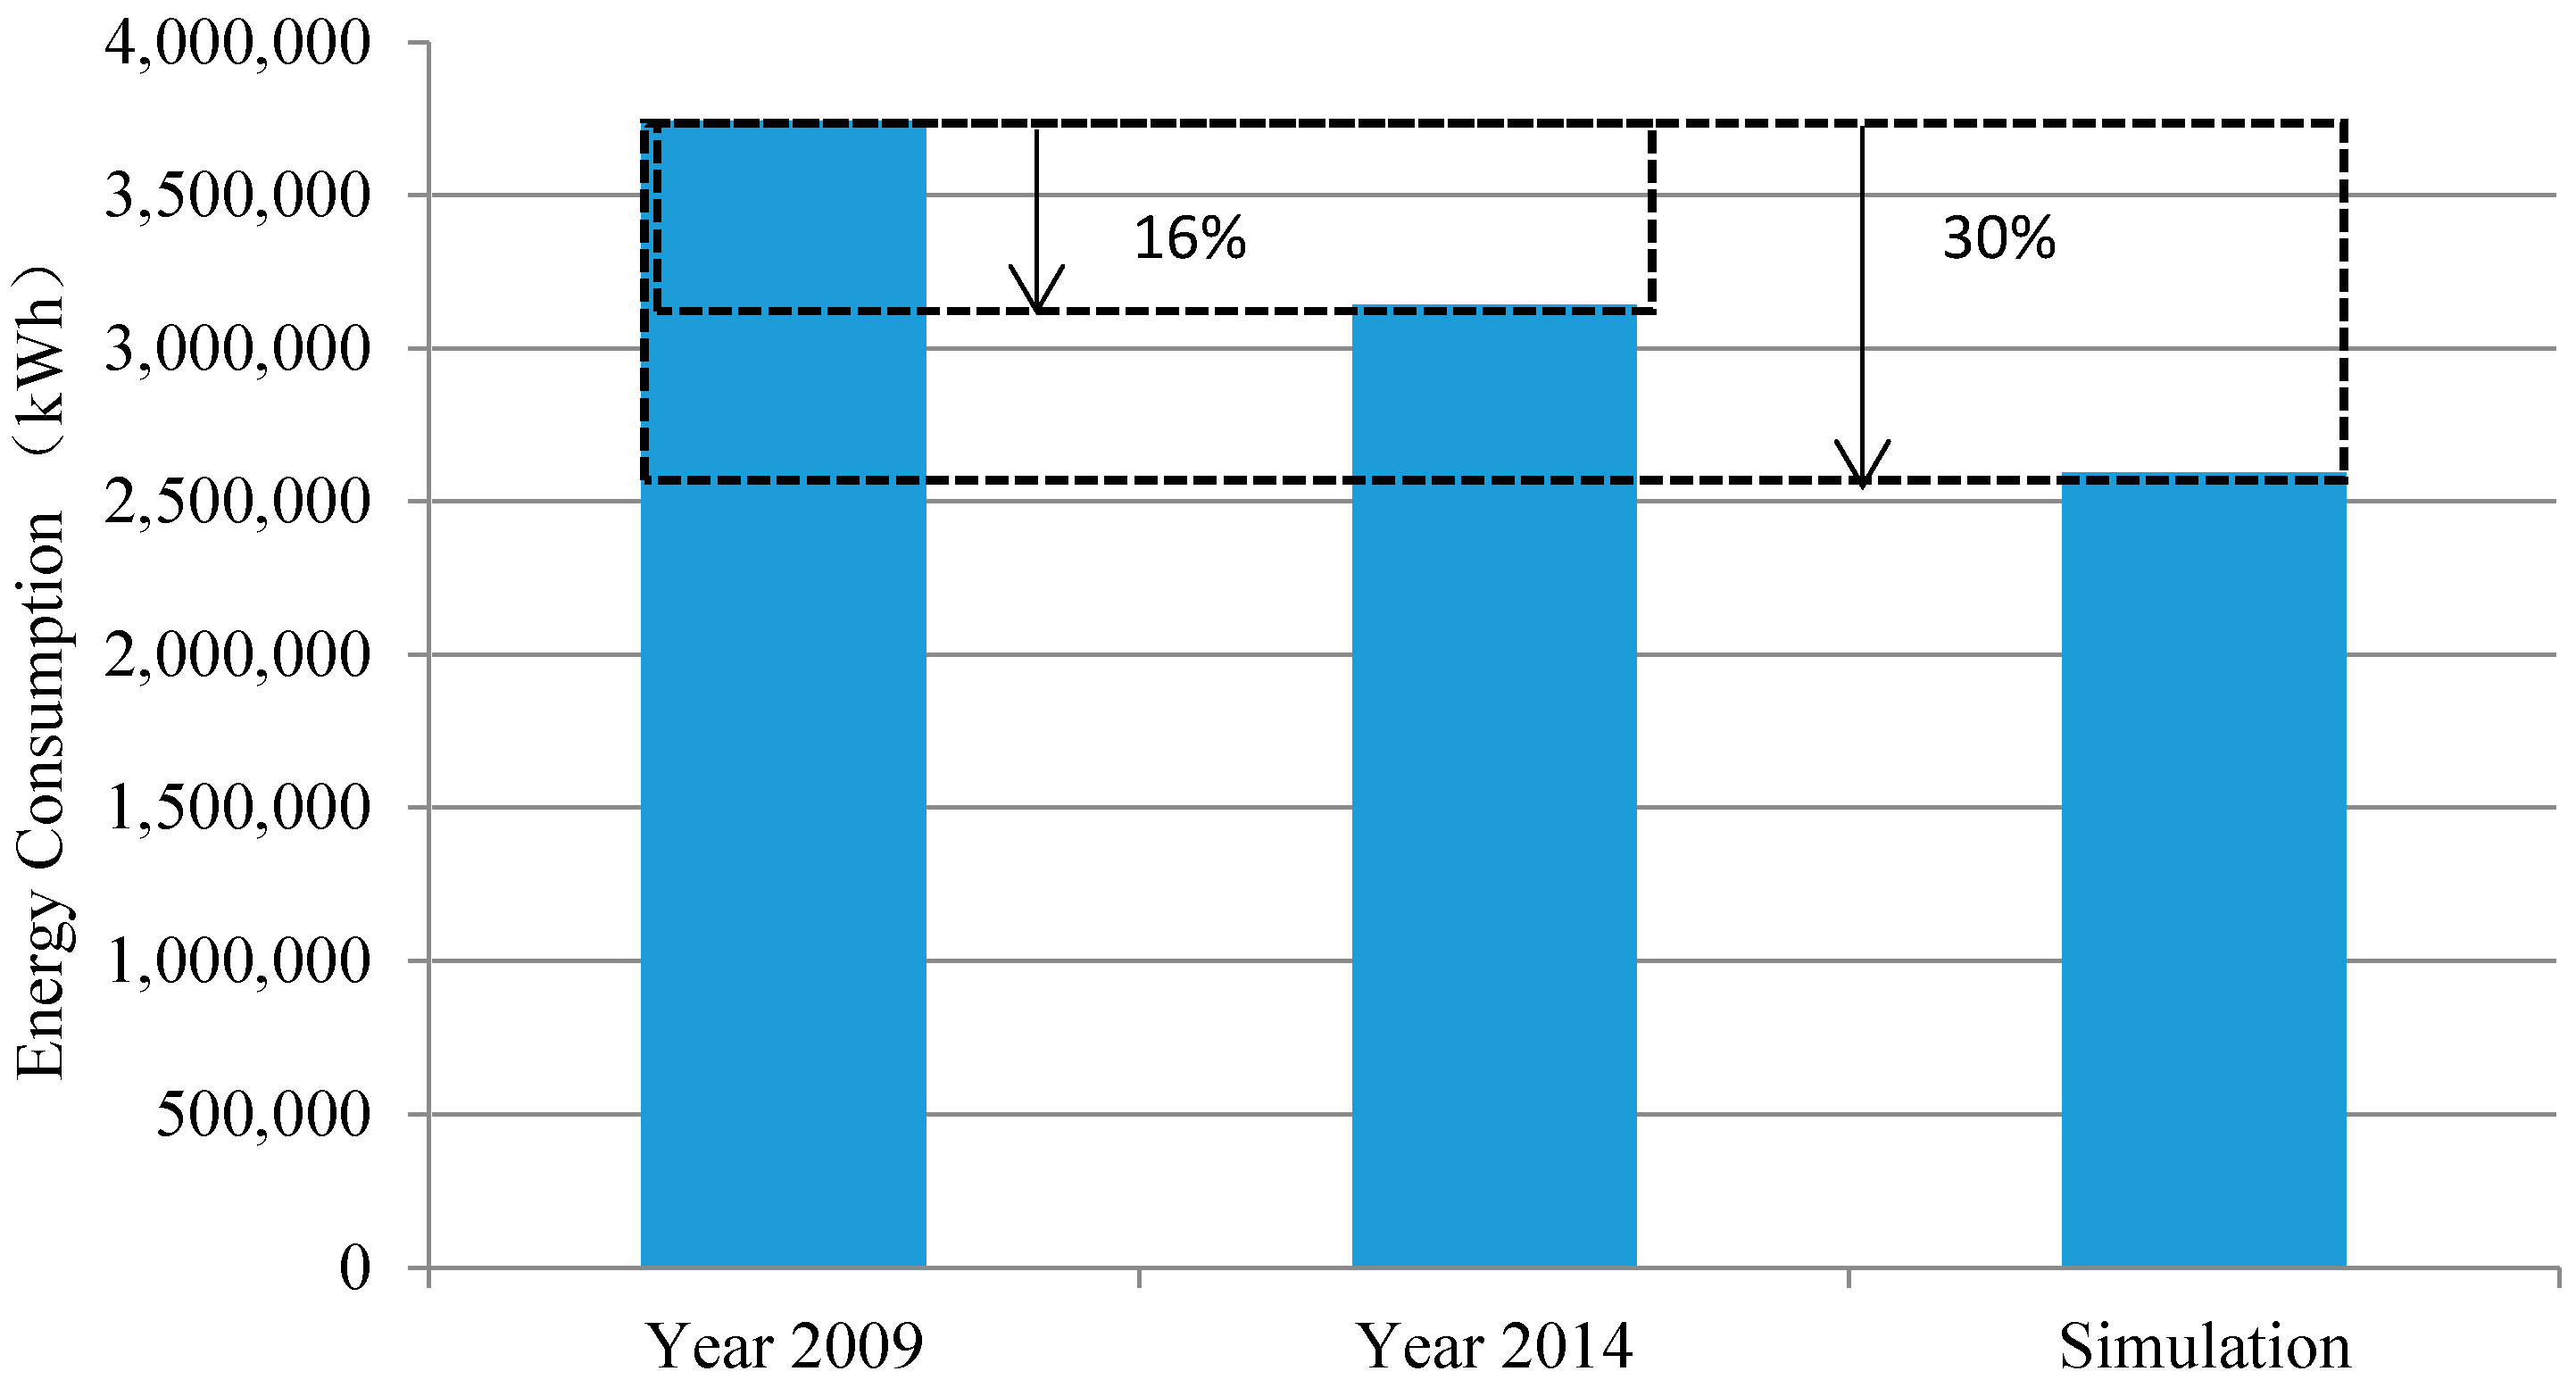
Figure 12 compares the monthly electricity bill of the year 2009 and that of the year 2014 as well as the simulation result. It is observed that the energy use after the retrofit was reduced from 2009 to 2014. However, the reduction was not that significant as the simulation predicted.
Figure 13 further summarizes the three results and found that the simulation expected 30% energy saving while the actual energy saving was 16%. There was still 14% gap between the real energy reduction and the simulated reduction. The simulation validation study mentioned in
Section 3.2 showed that there was some error (15%) in the simulation result, which might explain the performance gap. Kaplan and Canner [
41] suggested the difference between the predicted energy consumption by simulation and the actual energy consumption data fall into the range of 10% to 25%. Xu et al. [
42] suggested that the acceptable error for building simulation model when using ASHRAE standard should be within 5% for monthly energy data.
4. Discussion
From this case study, the strengths and weaknesses of the key stages of the retrofit project can be summarized as in
Table 11. Energy auditing is the foremost part of a retrofit process to identify the ECMs. It is based on direct evidence: visual inspections and direct utility costs. However, it does not tell the effectiveness of the ECMs. Therefore, it should be followed by the next stage: building performance simulation to analyze and compare the ECMs. The concern is that the energy audit is confined to budget and manpower and the selection of ECMs consequently may miss some opportunities. For example, in this project, due to the budget and manpower limitations, only four ECMs were selected. To better identify ECMs, a stakeholder approach is recommended to reduce the risks of missing opportunities. The stage of building performance simulation is instrumental in analyzing and comparing the selected ECMs; based on the analysis, the effectiveness and outcome of ECMs can be estimated. However, the building simulation has a large variety of parameters and complexity of factors such as non-linearity, discreteness, and uncertainty. In this study, it is found that the building simulation overestimated the energy savings through the ECMs. The main reason for this overestimation is occupancy condition. In simulation, the assumed occupancy hours are 9am-5pm; while in reality, overtime working is normal in both academic offices and laboratories. This accounted for the overestimation of energy reduction. It is almost impossible to precisely predict the real occupancy condition. Therefore, the energy simulation for retrofitting should be flexible to accommodate this unpredictability. Furthermore, although the building simulation can provide results corresponding to what the user inputs, they cannot provide suggestions to improve design [
24]. Finally, the measurement and verification stage verifies the effectiveness and outcomes predicted by the building simulation. It can compare the physical environments and utility costs before and after the retrofit. The concern is that there are many factors (including occupancy condition change) contributing to the variation of the before- and after- performances. Therefore, to find out the reasons for the success or failure, the non-building factors should be controlled.
The rigorous process demonstrated typical energy efficiency practice on commissioning analysis and implementation, which helped this project achieve the LEED EBOM Gold certification. The four ECMs, too, helped to reduce the energy uses to achieve the credits in “Optimize Energy Performance”. However, the four ECMs were confined to active strategies (mainly mechanical systems) while there were no significant passive strategies such as natural ventilation and daylighting which could significantly reduce energy demanding, which handicapped this project for further achievement towards a higher certification level such as Platinum.


