1. Introduction
Nowadays, the Eddy Dissipation Concept (EDC) [
1,
2,
3] is very common in turbulent combustion modeling. Since the initial publication of the EDC in the 1970s, several modifications of the EDC were proposed in literature [
4,
5,
6,
7,
8], all of them claiming to improve the modeling results. In recent years, emphasis is on the extension of the EDC for Moderate or Intense Low oxygen Dilution (MILD) combustion conditions [
7,
8,
9]. In contrast to classical turbulent combustion, MILD combustion features widely distributed reaction zones and slower reactions due to lower oxygen concentrations as well as slightly lower turbulence [
10,
11,
12,
13]. In classical turbulent combustion, chemical reactions occur only in small areas, the so-called fine structures, where educts are mixed at molecular scale. These fine structures are of Kolmogorov length scale in at least two spatial dimensions and of larger scale in the third [
3,
4,
14,
15]. A fine structure share (
) and a fine structure residence time (
) are defined for characterization based on turbulence parameters. The non-reacting fluid is called the surroundings in the EDC context. At sufficiently high Reynolds numbers, combustion reactions are limited by the mixing rate only, and an infinitely fast chemistry assumption is possible. However, if turbulence and turbulent mixing decrease, the reaction progress can be limited by either mixing or chemistry. In this regime, finite rate chemistry is necessary to accurately describe the turbulence-chemistry interaction [
7,
12,
13]. When using detailed chemistry with the EDC, the fine structures are typically treated as perfectly stirred reactors (PSRs), since educts are mixed on a molecular scale and mass is exchanged with the surroundings [
4]. The fine structure state is determined by solving the PSR to steady-state, which is numerically expensive due to the strong nonlinearity in the reaction source terms. Some EDC implementations, therefore, treat the fine structures as plug flow reactors (PFR) [
7,
16,
17,
18,
19]. These PFRs are solved for the fine structure residence time, implying that the fine structures are spatially isolated structures in the fluid only evolving in time. Since fine structure residence times are typically small (approx.
to
seconds) for classical turbulent combustion, the numerical effort to solve the detailed chemistry in a PFR is significantly reduced. However, the latter approach is not in line with the EDC theory. Although the PFR fine structure treatment was employed in many published research works, e.g., [
16,
17,
18,
19,
20,
21], only De et al. [
17], Li et al. [
16], and Lewandowski and Ertesvaag [
18] commented on the consequences of the PFR simplification. However, none of them performed an in-depth analysis of species profiles and species consumption rates.
De et al. [
17] state that the PSR and PFR results are only similar for slow reactions having little heat tone. However, they did not provide any evidence for this. Only recently, Li et al. [
16] published a numerical study of the Adelaide Jet in Hot Co-flow (JHC) flame. Besides other investigations, they compared species concentration and temperature profiles obtained by PSR and PFR fine structure treatment. The presented data indicates good agreement between main species and temperature, while concentrations for minor or intermediate species differ slightly. Therefore, they conclude that the PFR approach could be used instead of the PSR approach without loss of accuracy. An in-depth analysis of the results is missing. Lewandowski and Ertesvåg [
18] concluded that the PSR and PFR approaches should give comparable results, since the steady-state solution of the PSR equations is of a similar form to the PFR solution. However, no numerical data to prove this conclusion was shown. In contrast to previous works, this work focuses on an in-depth analysis of the consequences of the PFR simplification and is meant to shed additional light on the comparisons available in literature. The results presented by Li et al. [
16] indicate discrepancies in the minor species concentration under MILD combustion conditions. Since reactions are more intense (faster and higher heat release) in classical combustion than in MILD combustion, the differences between PSR and PFR results are expected to increase for classical combustion, e.g., Sandia Flame D [
22,
23]. Moreover, no data on species consumption/production rates have been published in literature so far. However, these rates reveal more details about the combustion process. This work aims to extend the knowledge on the different aspects of the EDC, e.g., model improvements and fine structure treatment, and for the first time gives a thorough comparison of the PSR and PFR results. For this purpose, first the EDC and its modifications are discussed, followed by an evaluation of the model differences. Furthermore, the PSR and PFR fine structure treatments are tested on a simple case. Eventually, the findings of the preliminary tests are challenged with a Sandia Flame D [
22,
23] modeling study. The study is conducted with a custom EDC extension for OpenFOAM
® [
24].
3. The Mean Reaction Rate Expression
Converting fine structure reaction rates to fluid mean rates by a characteristic volumetric ratio would be a logical choice Equation (
16). However, different conversion ratios based on adapted model assumptions have been proposed in literature. Gran and Magnussen [
5] modified the conversion of the mass transfer rate to
Equation (
17). Actually, this means reaction rates are converted by a characteristic surface to volume ratio instead of a characteristic volume ratio. Keeping in mind that
should be between 0 and 1 to satisfy
, it is obvious that this modification increases the average reaction rate compared to the characteristic volume ratio conversion. In 2005, Magnussen [
6] proposed a new modification Equation (
18) based on a characteristic surface ratio. Therefore, both the mass transfer rate and the surrounding species mass fraction are converted by
and
, respectively. This surface ratio conversion gives the highest average reaction rates. In general, the conversion expressions differ only by the exponents of the characteristic fine structure length fraction
in the numerator and denominator. The following equations summarize the conversion factors of the EDC1981, EDC1996 and EDC2005 modification:
Obviously, all three expressions have a singularity near
= 1. Moreover, they can be approximated by
or
if
1, respectively. However, since the fine structure residence time (
) should be smaller than or equal to a characteristic mixing time (
), the fine structure fraction should be limited in order to ensure a ratio (
) of the fine structure to the mixing time below unity, e.g., for the original EDC [
16,
17,
18,
28]:
As a result, the maximum
is different for the three conversion ratios and has values between 0.70 and 0.79. In contrast, Lewandowski et al. [
26] proposed the trivial condition based on the mean and fine structure reaction rates, which give
:
Requiring
< 1 allows significant higher species reaction rates. According to Lewandowski et al., a limitation of the fine structure length fraction is only necessary if the employed mixing time scale deviates from the EDC mixing time scale.
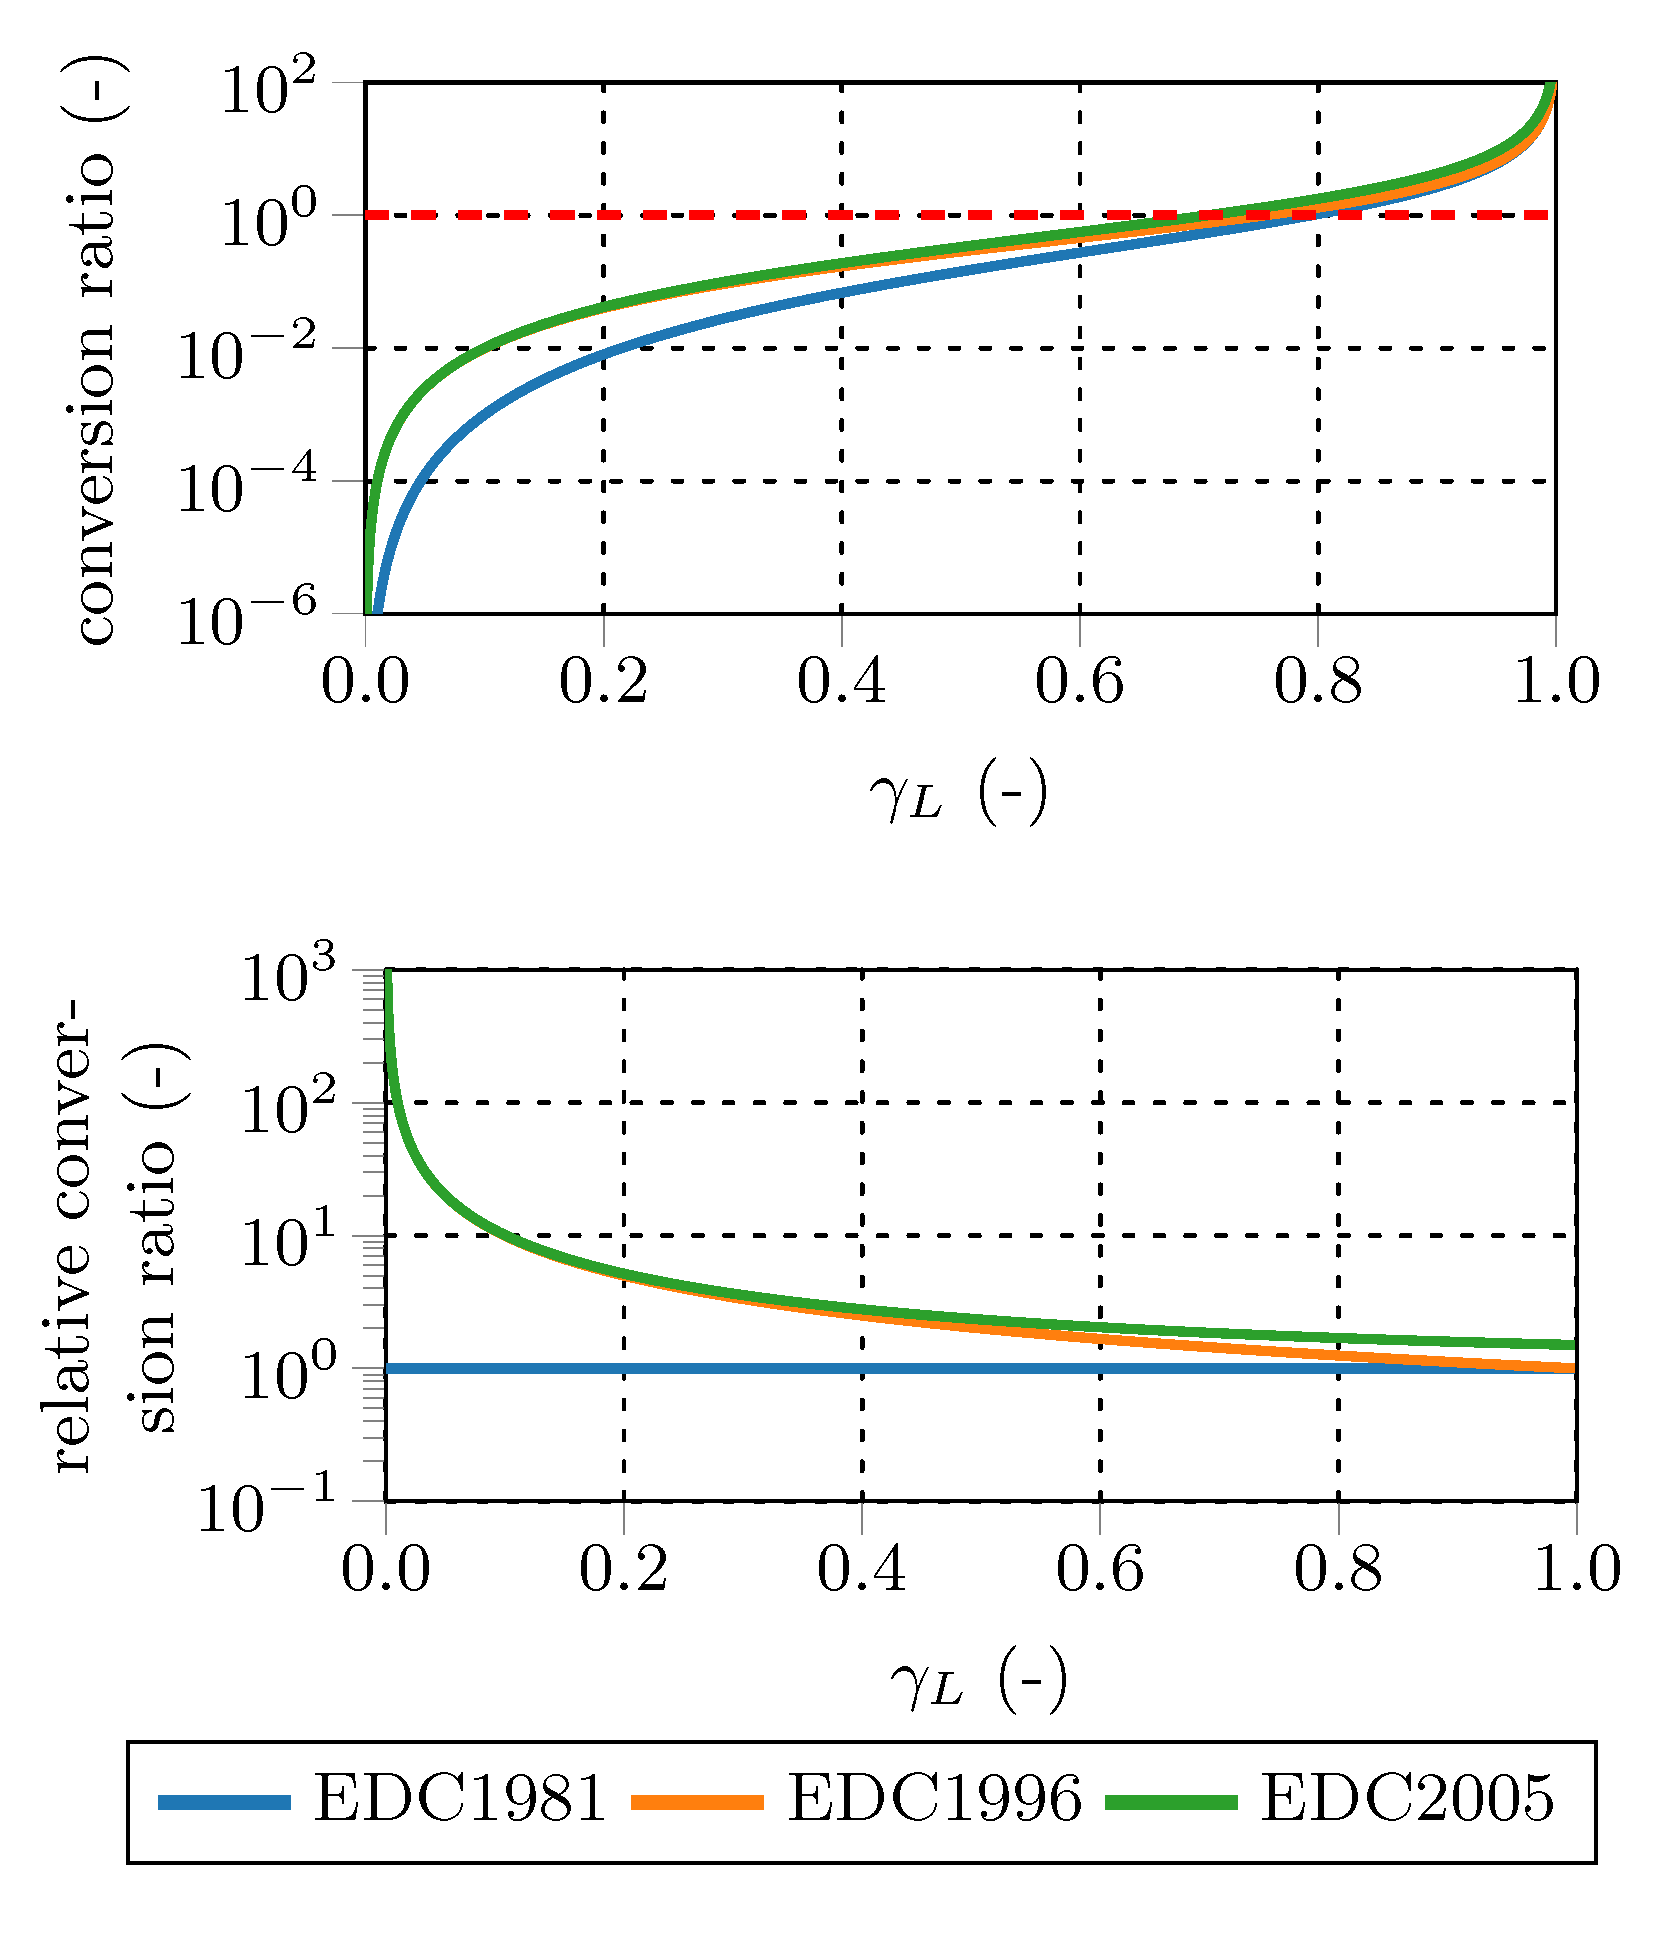
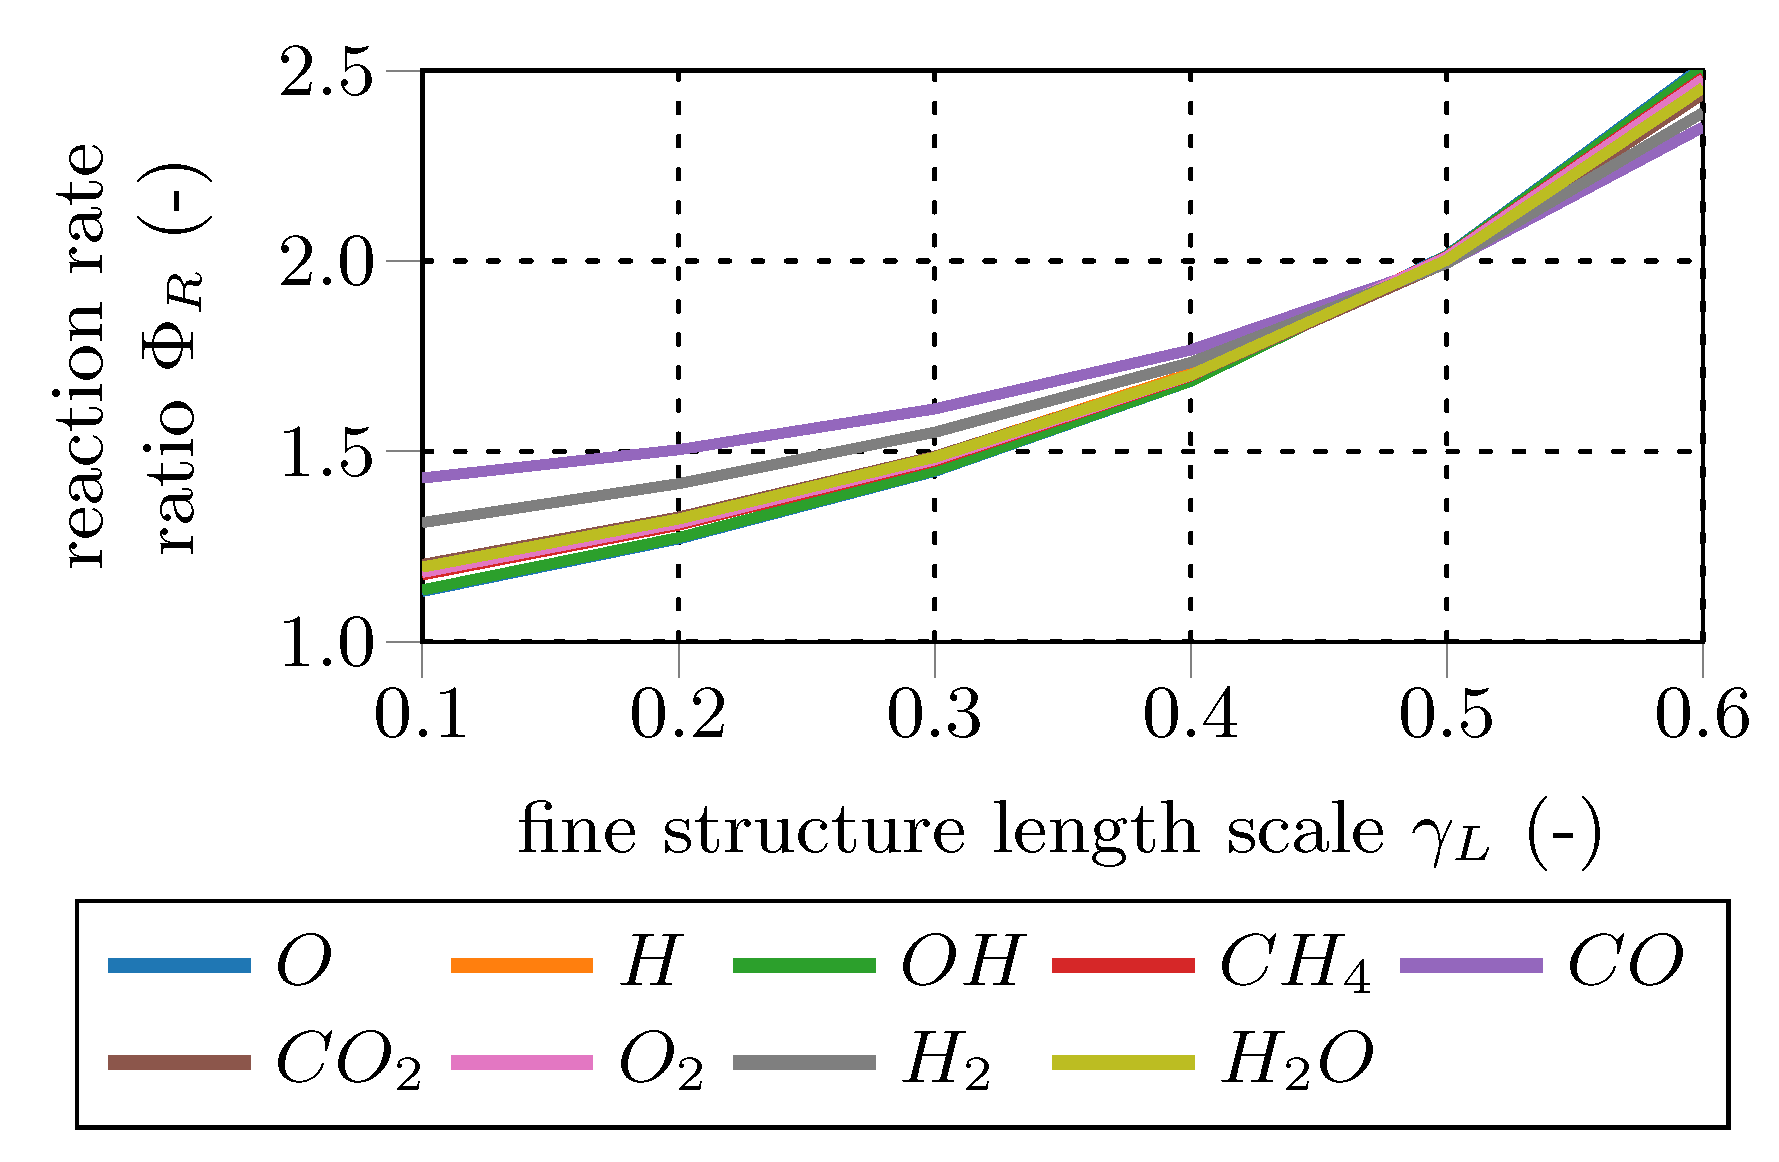
Figure 2 shows the influence of the different conversion ratios on the average reaction rate. The top diagram depicts the conversion factor for all three conversion ratios, the dashed line represents the maximum conversion ratio to obey Equation (
19). The bottom diagram depicts the conversion factors normalized by the volume ratio conversion factor Equation (
7) over the whole
range. Both the surface to volume and the surface ratio give similar values for
<
. Starting at
=
, the surface to volume ratio approaches the volume conversion ratio.
The normalized conversion ratios reveal that the surface conversion ratio results in approximately 1.5 times higher reaction source terms than the volume conversion ratio at high . In contrast, at low values (especially if smaller than 0.1), the surface to volume and the surface conversion ratios give several times higher reaction rates than the volume conversion ratio. The surface to volume conversion ratio is a hybrid version of the other two ratios: it is similar to the surface conversion ratio for low and similar to the volume conversion ratio for high values. In general, the relative differences arising due to the different conversion ratios are higher at low values (exceeding a factor of 100) and reduce to a factor below 2 for > . However, the absolute differences are small for low , since the conversion ratios are small compared to unity ( 1).
4. Model Constant Modification
The
and
EDC constants were adapted to reproduce MILD combustion conditions by Parente et al. [
7] and Bao [
8]. The Damköhler number at Kolmogorov scale (
) is of order unity in this combustion regime. Thus, the influence of the different model formulations is investigated for
< 2 and turbulent Reynolds numbers (
) up to 1000.
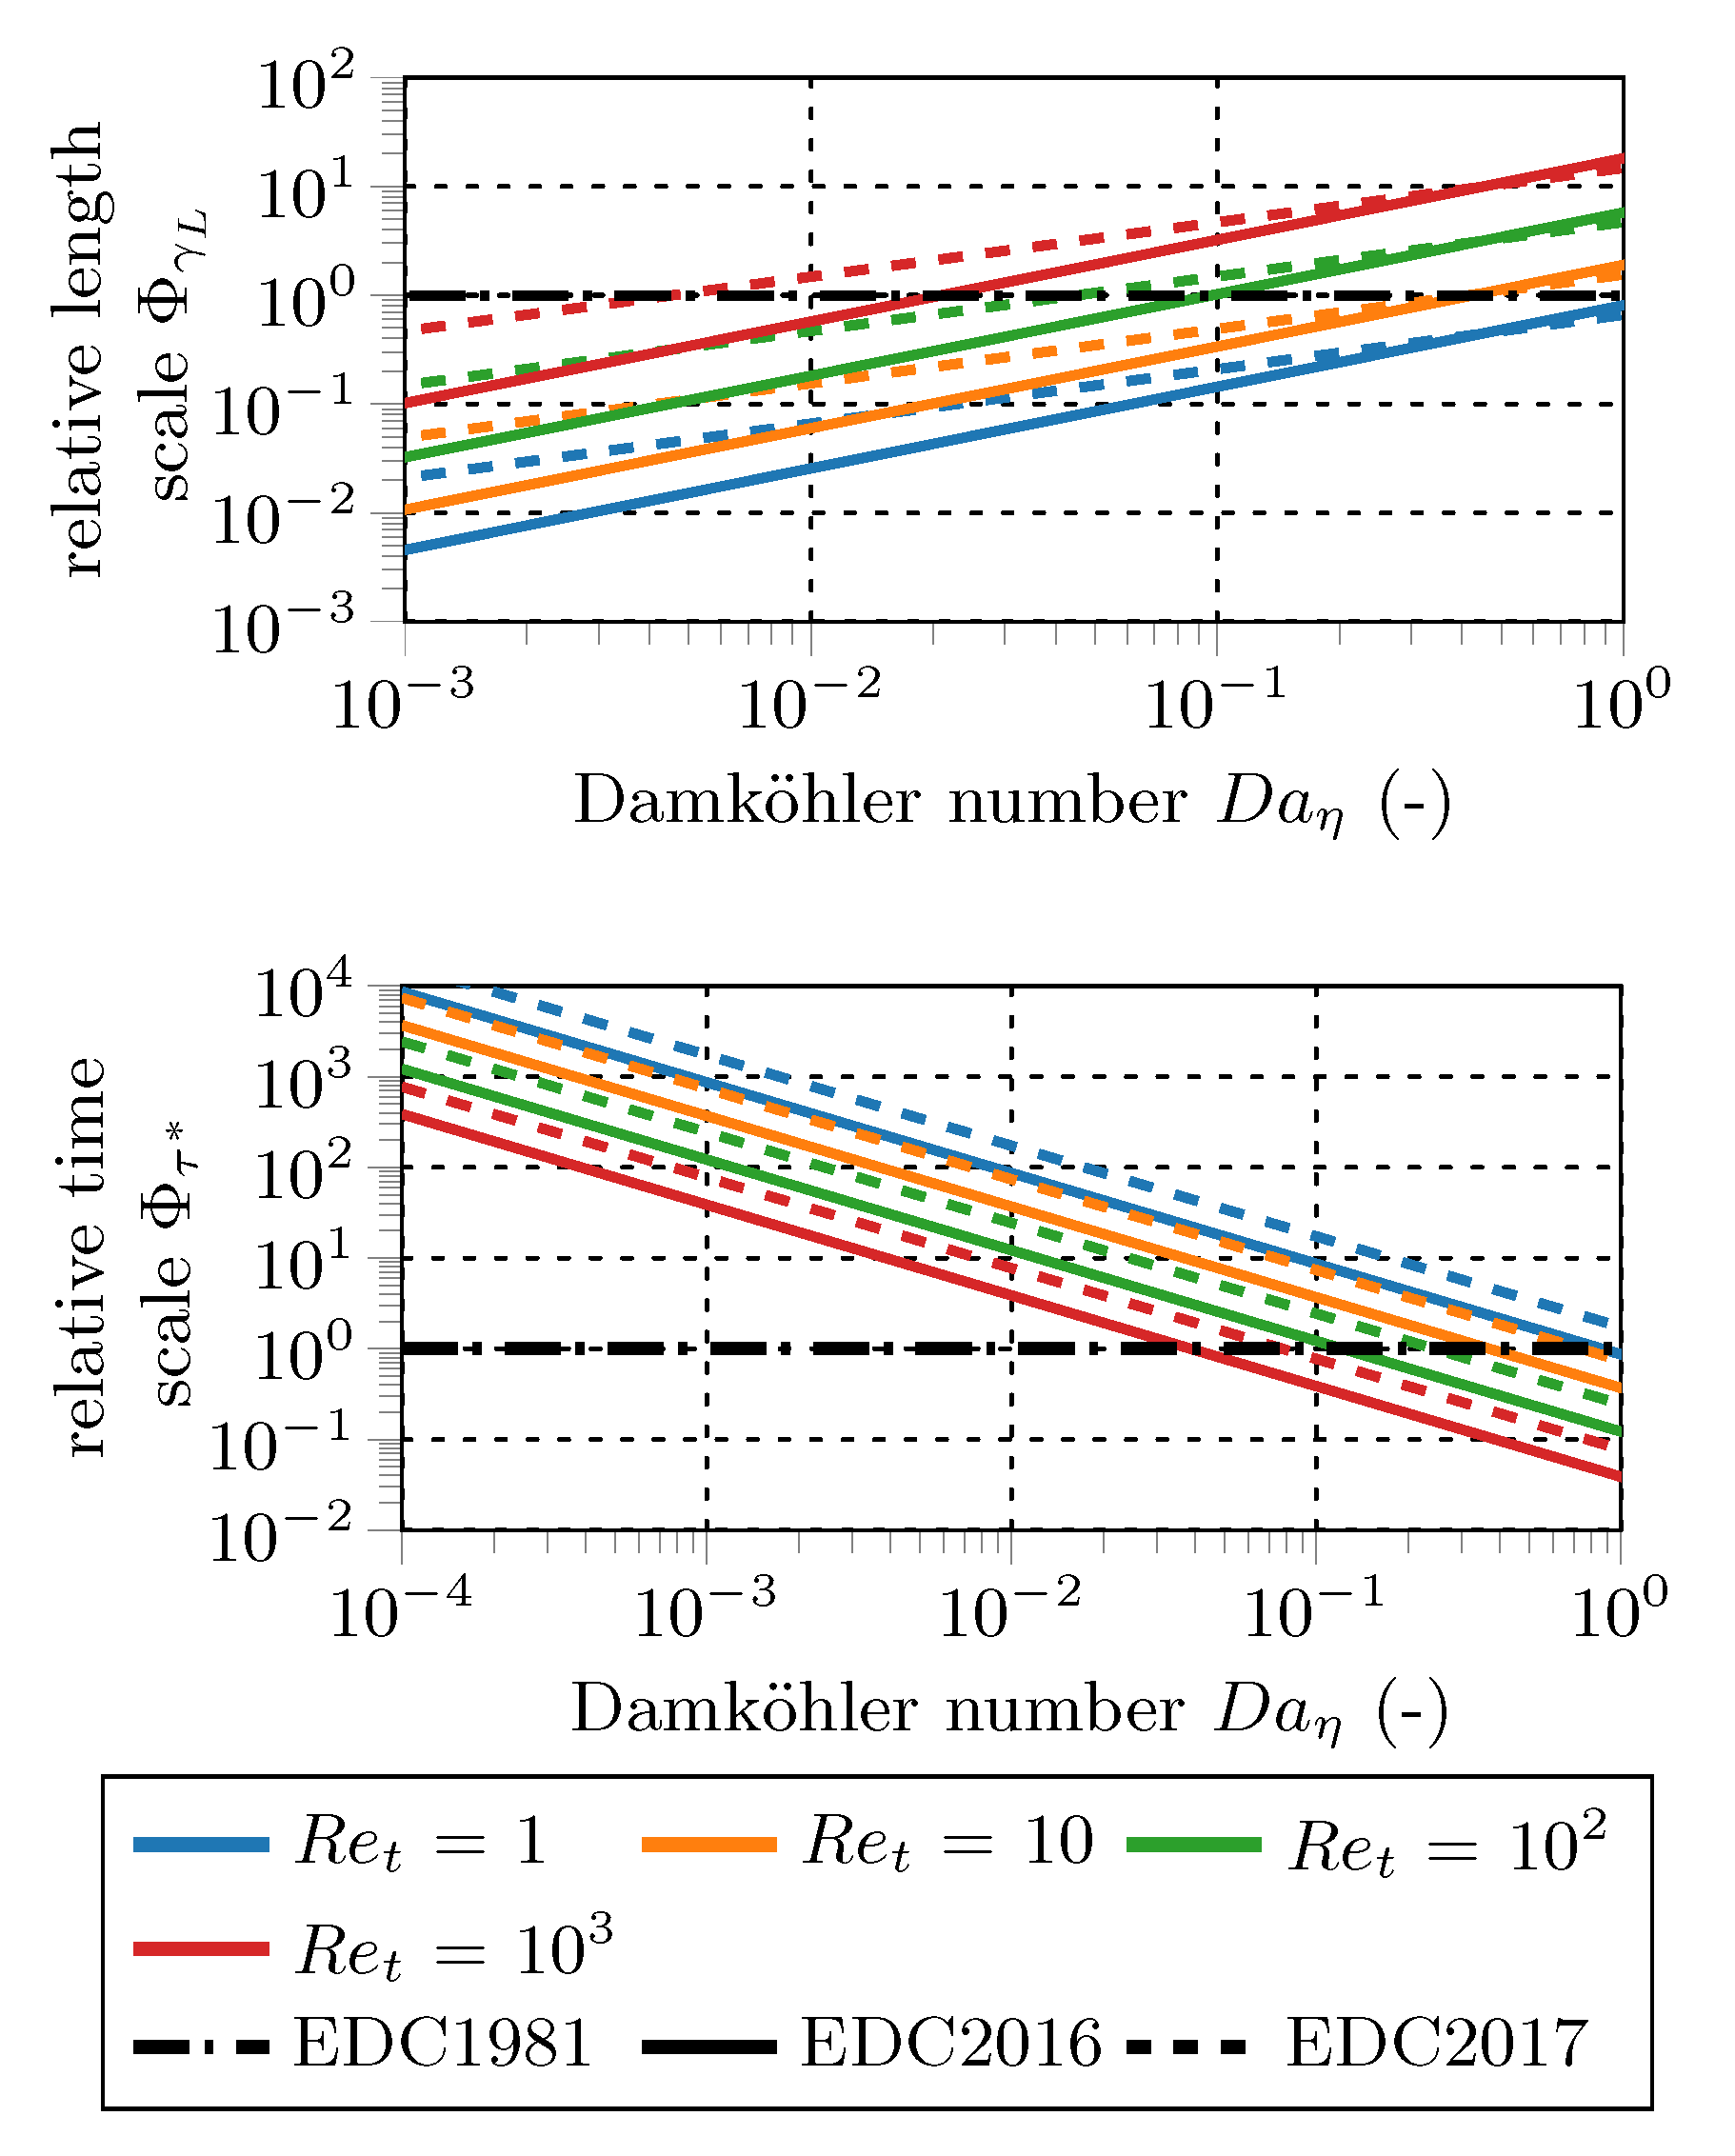
Figure 3 shows
(top) and
(bottom) for the modified EDC constants normalized by the results for the standard EDC constants on a double-log plot. The fine structure length fraction (
) increases with increasing Damköhler number at a given Kolmogorov scale (
) and increasing turbulent Reynolds number (
). EDC2016 and EDC2017 modifications reach the original fine structure length fraction below a Damköhler number of around unity. If
is clipped by the EDC1981 value, the modifications affect the results for slow reactions in less turbulent regions. The slope of EDC2016 is higher, but the intercept is significantly lower than for the EDC2017.
The fine structure residence time () behaves opposite to the fine structure length fraction. The EDC2016 and EDC2017 residence times approach the EDC1981 values between Damköhler numbers of and 1 for the investigated turbulent Reynolds numbers (). The slopes of the EDC2016 and EDC2017 modifications are identical in the double-log representation, but the intercepts of the EDC2016 are significantly lower, indicating smaller fine structure residence times.
Farokh and Birouk [
20,
21] showed that the influences of
and
on temperature and species concentrations depend on the turbulence level. They performed a modeling study on Sandia Flames A and B; Flame A is a low turbulent flame (Re
≈ 1100), while Flame B is more turbulent (Re
≈ 17500). In case of low turbulence, the time scale ratio according to Equation (
19) would exceed unity and, thus, fine structure shares are limited to ensure a proper ratio between mixing and fine structure residence time. If
is decreased in these regions, reaction rates increase and vice versa. In contrast, if the critical Reynolds number is exceeded, an increase of
gives higher reaction rates. For highly turbulent flames, e.g., Flame B, higher
values result in higher temperatures and reaction rates. The influence of
is less distinct than the one of
. However, increased
constants gave lower temperatures before and after the temperature peak, while the peak temperature was virtually the same. At peak temperatures, reactions are mixing controlled, since chemistry time scales are fast there. Up- and downstream, temperatures decrease and reactions become either mixing or chemical controlled.
5. Fine Structure Treatment—Perfectly Stirred Reactor (PSR) vs. Plug Flow Reactor (PFR)
According to Magnussen [
4], fine structures can be seen as perfectly stirred reactors (PSR), since they provide a perfect analogy: the fine structure residence time
corresponds to the PSR residence time. The PSR inlet concentrations are equal to the species concentrations of the non-reacting surroundings and the PSR outlet concentrations are the fine structure concentrations. Neglecting radiative or diffusive thermal losses of the fine structures, the PSR is described by the following set of equations for species mass fraction (
), enthalpy (
h), and pressure (
p):
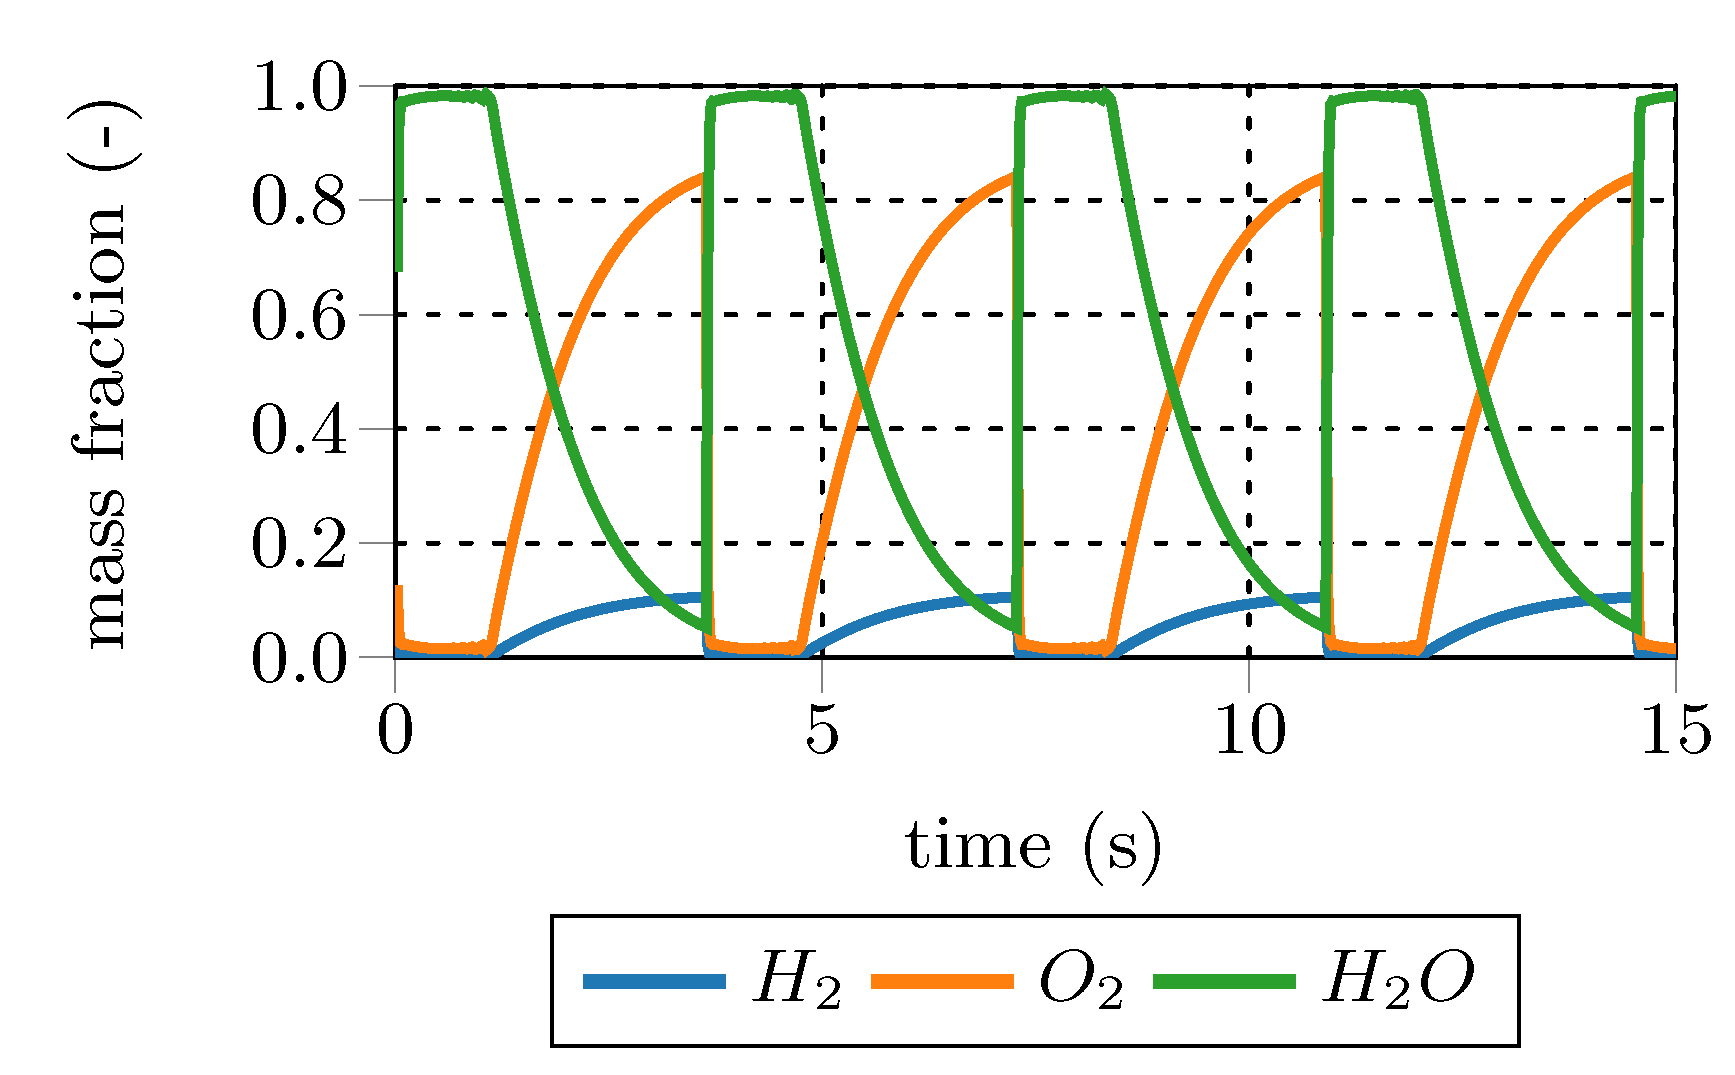
is the chemical species reaction rate, while the second term on the right hand side (RHS) represents the mixing between fine structures and surroundings. The PSR is solved to steady-state to obtain the fine structure composition. Solving this set of ordinary differential equations (ODE) is numerically expensive, since the chemical source terms are highly nonlinear. Furthermore, under certain conditions, periodic oscillating states might occur in PSRs, although steady input parameters are employed, due to chemical kinetic effects. An example of such a periodic oscillating state is given in
Figure 4. A stoichiometric hydrogen mixture at 800 K and 0.1 bar is combusted in a PSR with a residence time of 0.75 s employing the kinetic mechanism of Connaire et al. [
29]. The open source tool Cantera [
30] was employed for the PSR calculation. Moreover, Cantera tutorials inspired the authors for the periodic oscillation example.
A convenient way to get rid of the instabilities and to reduce the numerical effort, is to neglect the mixing term between the fine structures and the surroundings [
9,
16,
17,
18]. This approach is referred to as the plug flow reactor (PFR) approach, since back-mixing is ignored in the species conservation equations and only chemistry is integrated over time. The integration time reduces to the fine structure residence time (
). Using the same assumptions as for the PSR, the PFR is described by the following set of equations:
Obviously, the results of these two reactor types should differ when using the same starting values. Since the fine structure species concentrations directly influence the mean reaction rates, the results using the PSR and PFR approach in flame modeling are expected to differ.
Figure 5 gives a conceptional illustration of the PSR and the PFR fine structure treatment. In case of the PSR treatment, small eddies forming at the surface or diffusion effects enable mass exchange with the surroundings. This is indicated by tiny eddies surrounding the fine structures. In contrast, the PFR approach assumes isolated, possibly smooth structures lacking mass transfer with the surroundings. Treating the fine structures as PFR should increase the EDC mean rates compared to the PSR approach for fast reactions, since no educts are back-mixed to the PFR.
For a better illustration, a case study for different
and
values was conducted. A simple test case representing a single fluid element was used. The employed chemical mechanism for all calculations was the GRI3.0, which is an optimized methane combustion mechanism [
32]. In order to investigate the influence of the reactor type, the ratio of the PFR and PSR mean reaction rate is taken. If the initial values are identical, the ratio reduces to the ratio of the difference between the mean and fine structure mass fractions:
This ratio is investigated for the main combustion educts and products (CH, CO, CO, H, HO, O) and the main combustion radical species (H, O, OH) to quantify the effect of the fine structure treatment on the mean reaction rate.
Three sets of initial mole fractions were employed for the simple test case: lean and stoichiometric mixtures of main species, and a high radical mixture representing the reaction zone of a methane flame. Initial temperatures were set to 1000 K, and 2000 K for the main species and to 2000 K, and 2200 K for the high radical mixture, respectively. The fine structure residence times were chosen rather arbitrarily, but should reflect typical residence times. A PSR model based on Cantera [
30] was employed for the test cases.
Table 1 and
Table 2 summarize the initial conditions of the main species and radical species test cases, respectively.
Figure 6 and
Figure 7 show representative results of the total 192 data sets. In general, the differences in the mean reaction rates increase at bigger fine structure scales (
), while they decrease for longer fine structure residence times (
). For
=
, mean reaction rates of most species are in the same range. In other words, PSR and PFR approaches give similar results for the mean rates in the case of small fine structure length fractions. Since classical turbulent combustion occurs in small isolated structures [
3,
12,
13], both fine fraction treatments should give similar results. In contrast, in case of MILD combustion, reactions occur in a significant portion of the fluid and, therefore, the PFR approach will give different EDC reaction rates than the PSR approach.
Comparing the main and radical test case results reveals that the differences in the mean reaction rates are in general higher for the radical species cases. This is caused by the pronounced radical pool and the resulting small characteristic chemical time scales. The results confirm the findings of De et al. [
17] that both approaches give similar results only for slow and slightly exothermic reactions. The differences in the reaction rates between the PSR and PFR fine structure treatment depend on the fine structure properties (
,
), the fine structure state (temperature, pressure, chemical composition), and the employed reaction mechanism. However, under certain conditions, e.g., small fine structure shares, both reactor types can give comparable results.
6. Influences of the Model Variations in Flame Modeling
The influences of the proposed model variations are tested using Sandia Flame D, piloted under a stoichiometric premixed jet flame [
22,
23] surrounded by an air co-flow. The jet Reynolds number is approx. 22,400 and the visible flame length approx. 0.48 m.
Table 3 shows the properties of the three gas streams (methane jet, pilot and co-flow stream), which are used as input parameters for the Flame D simulations.
The flame is modeled using OpenFOAM
® [
24] and in-house libraries for the EDC model. Differential diffusion was neglected, since turbulent diffusion is dominant at high turbulence conditions. Although the modeling results are compared to the measured flame data, the main focus is on identifying the model differences. Therefore, a relatively coarse wedge grid with approx. 6090 cells is used. It has a 0.1 m upstream part for the methane jet and pilot inlet; the downstream part is 0.5 m in length and 0.15 m in radial direction. All five EDC modifications were tested on this grid using the PSR and PFR fine structure treatment, summing up ten test cases for the evaluation of the model differences and the fine structure treatment. The EDC2016 and EDC2017 were included in these tests to verify their validity for classical combustion conditions. Obviously, there should be no differences to the EDC1996, since the EDC2016 and EDC2017 are exactly the same as the EDC1996, if the model constants are limited to their standard values in the high turbulent regions. The chemical time scale (
) of Ren and Goldin [
33] is employed to determine the EDC model constants in the EDC2016 and EDC2017 modification:
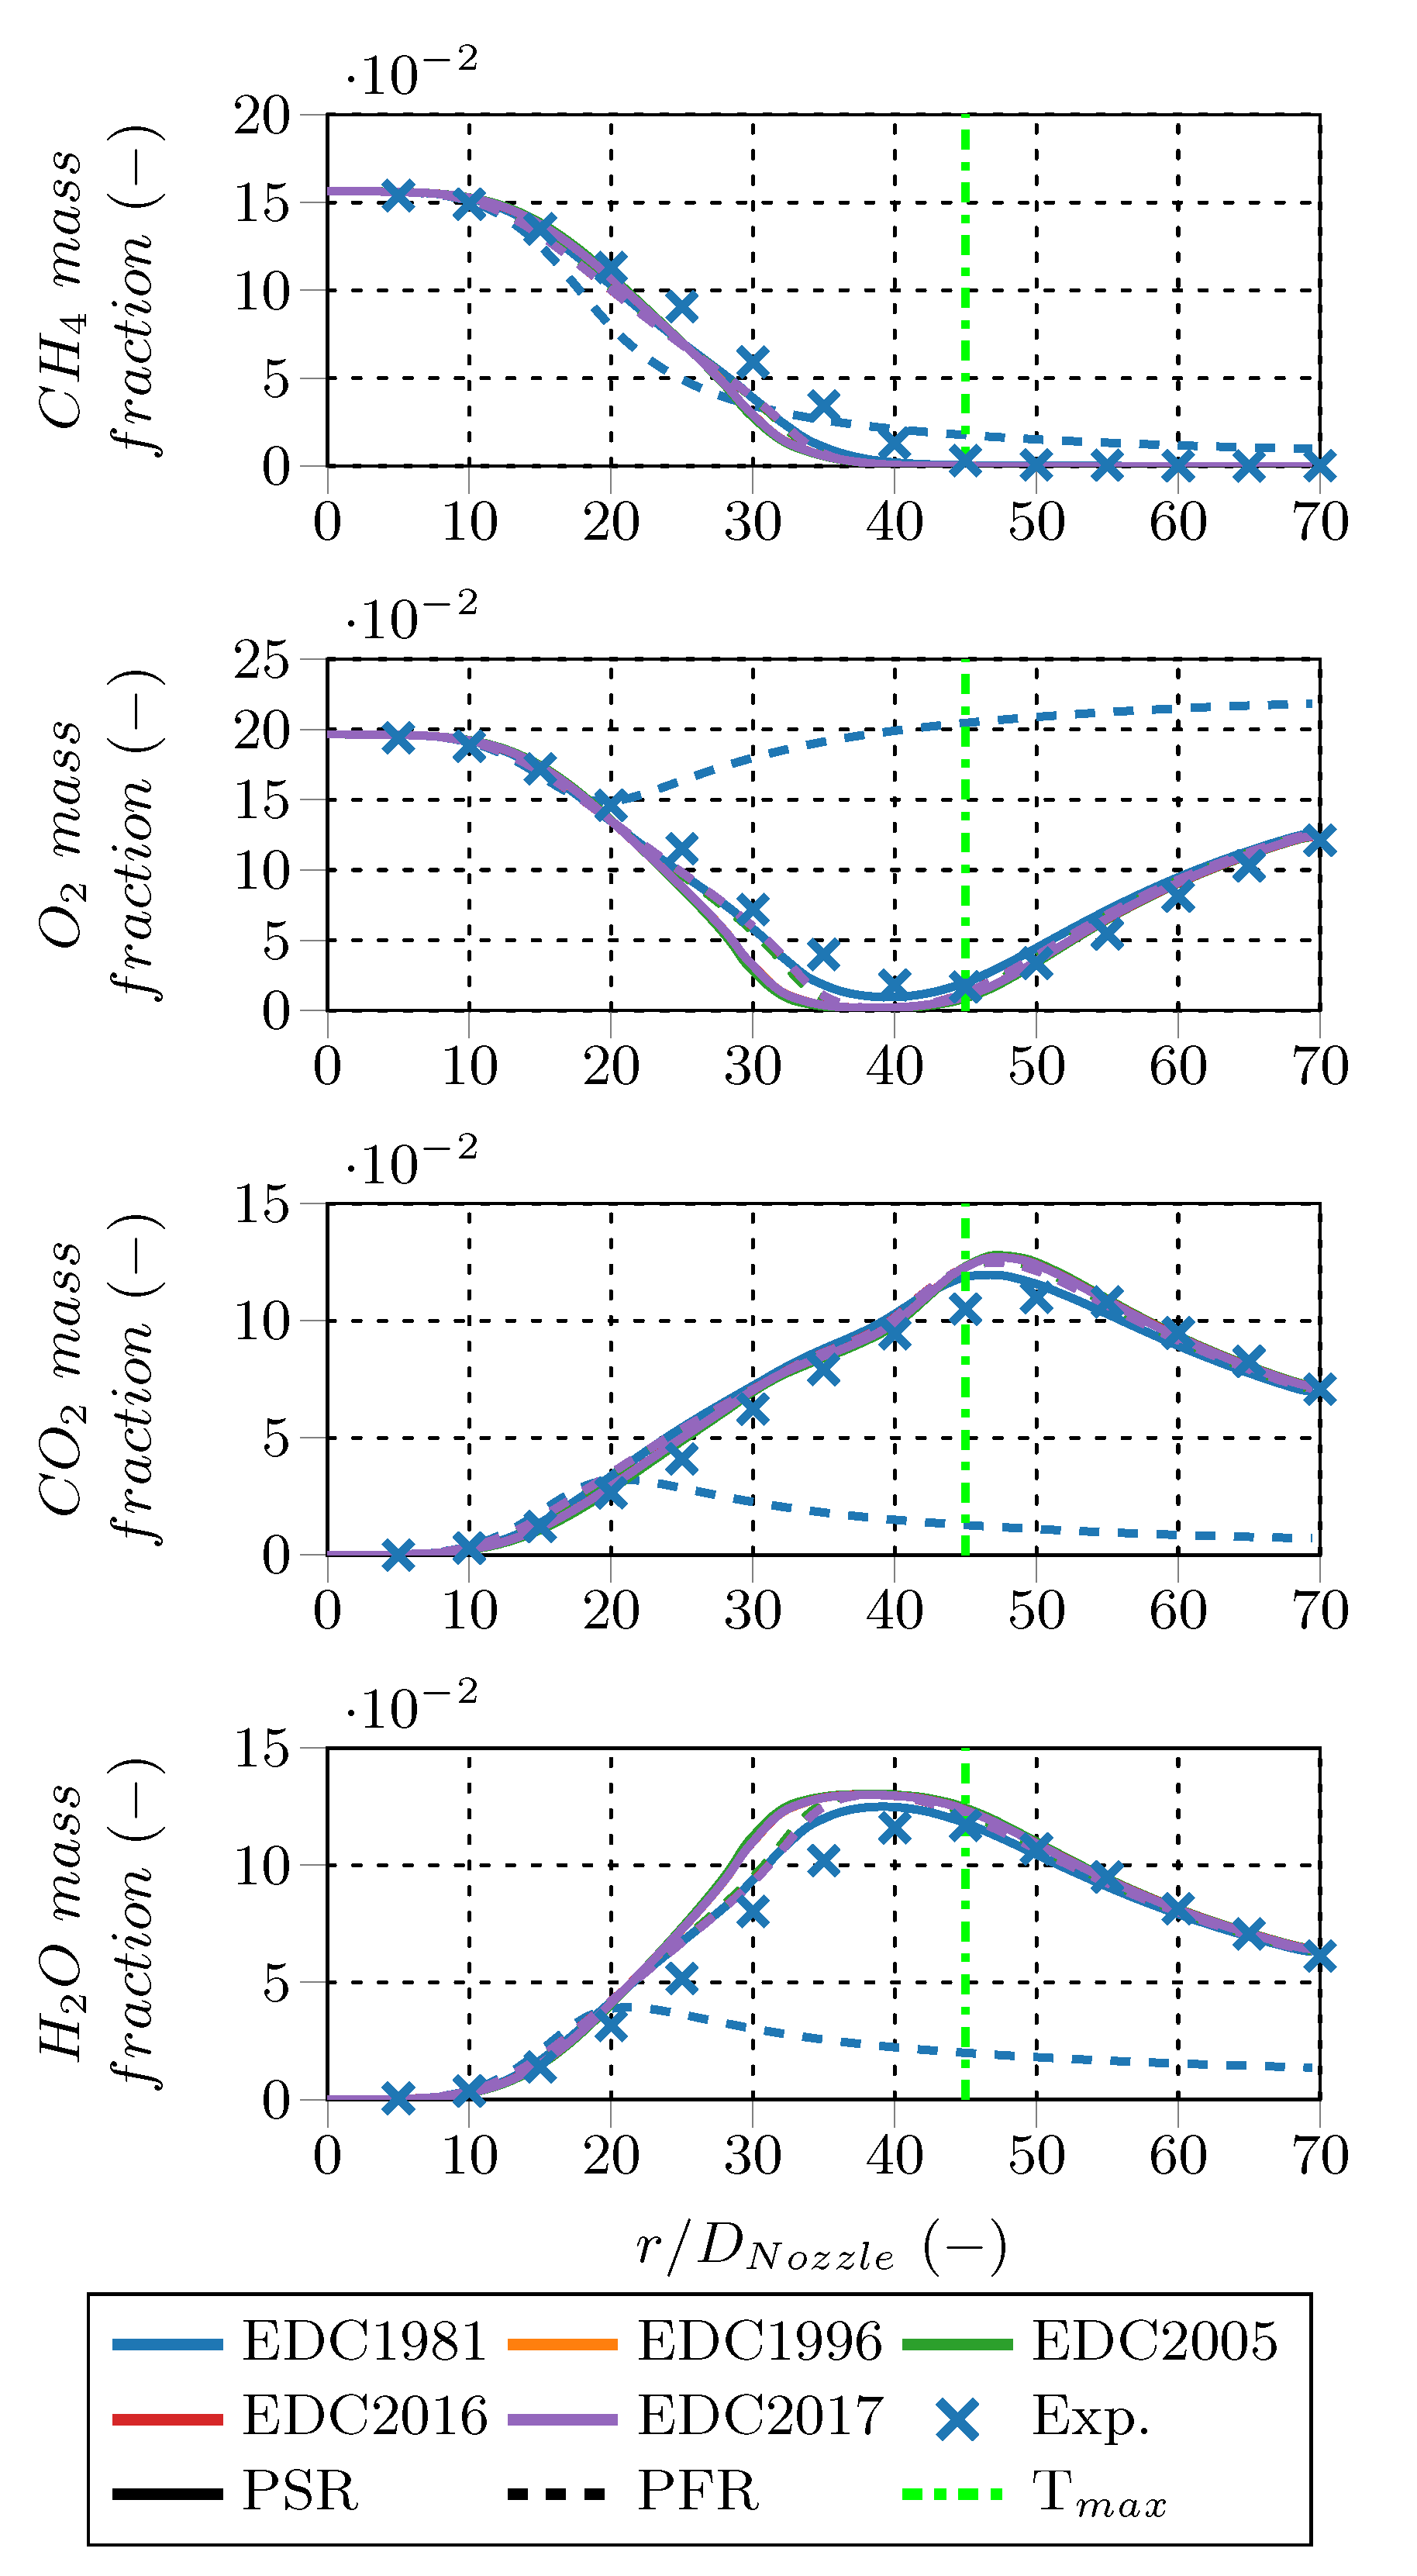
Figure 8 compares the main species (CH
, O
, CO
, and H
O) mass fractions along the center line. In general, all variations give similar results except for the original EDC employing the PFR fine structure treatment, which did not ignite the mixture. Although no detailed investigation was conducted, the EDC reaction rate conversion factor, which is the lowest of all the EDC versions, might be the reason. Moreover, the other results show reasonable agreement to the experimental data. Due to almost identical results, lines in the subsequent diagrams overlap and only some are visible.
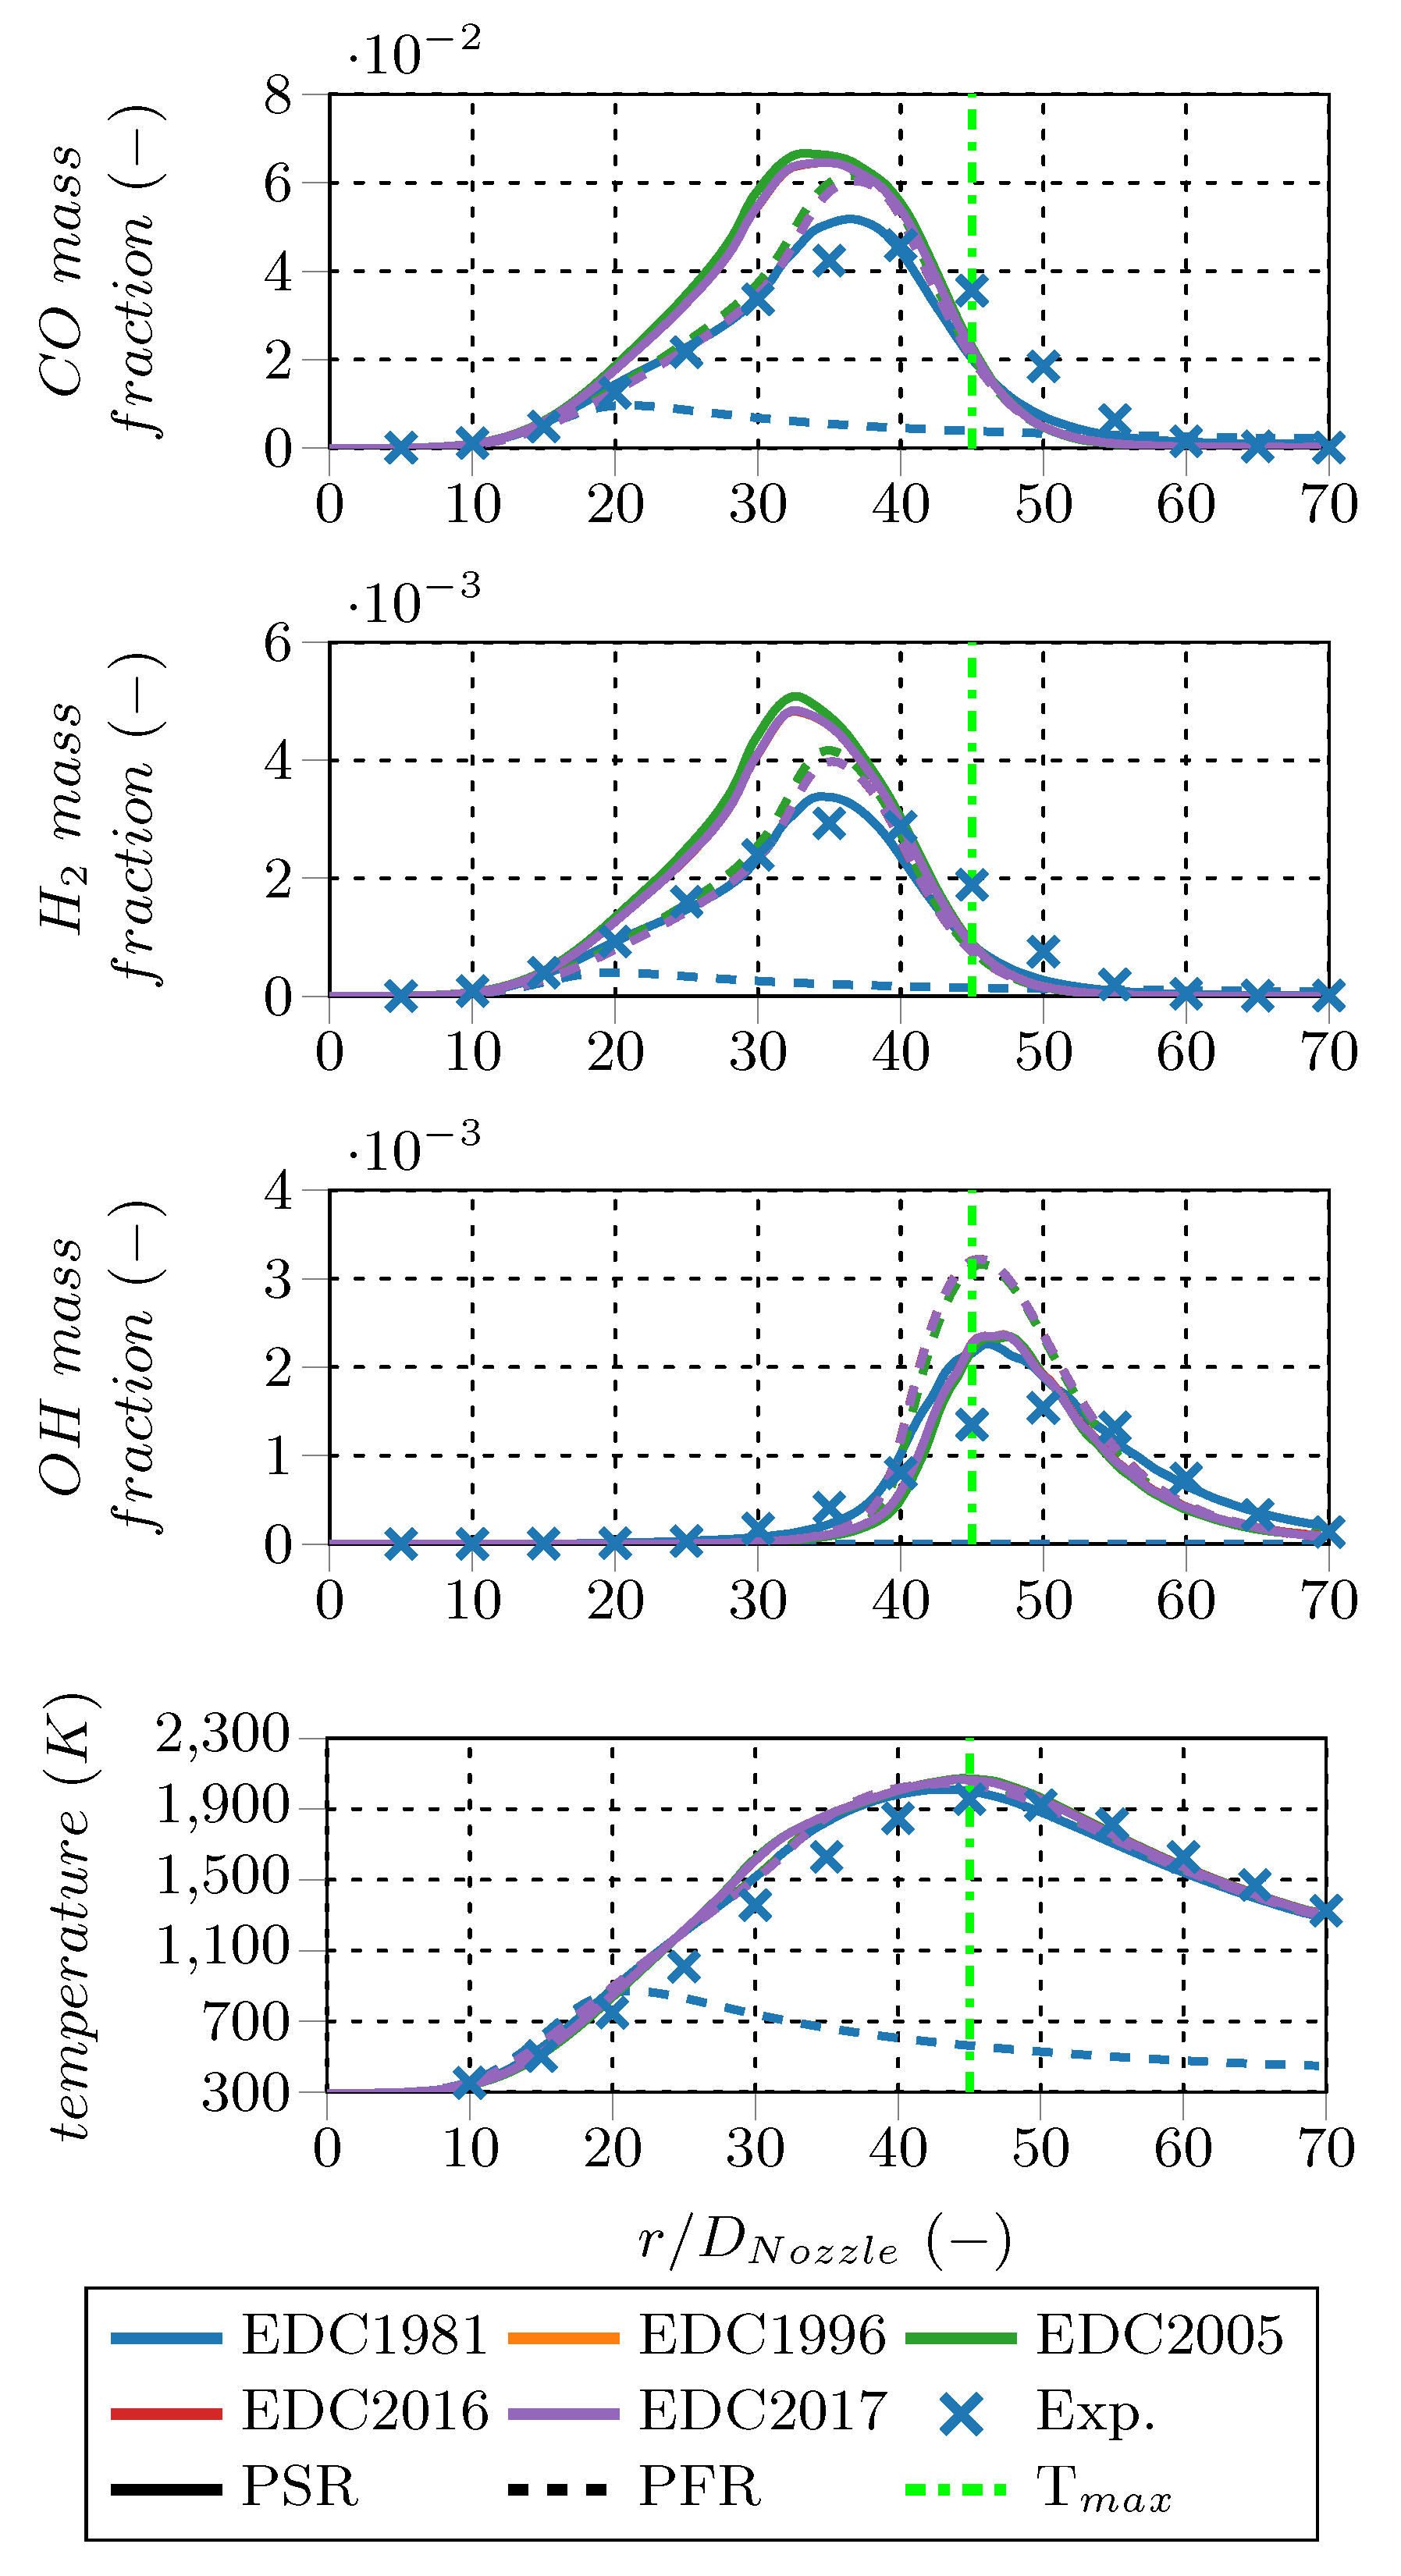
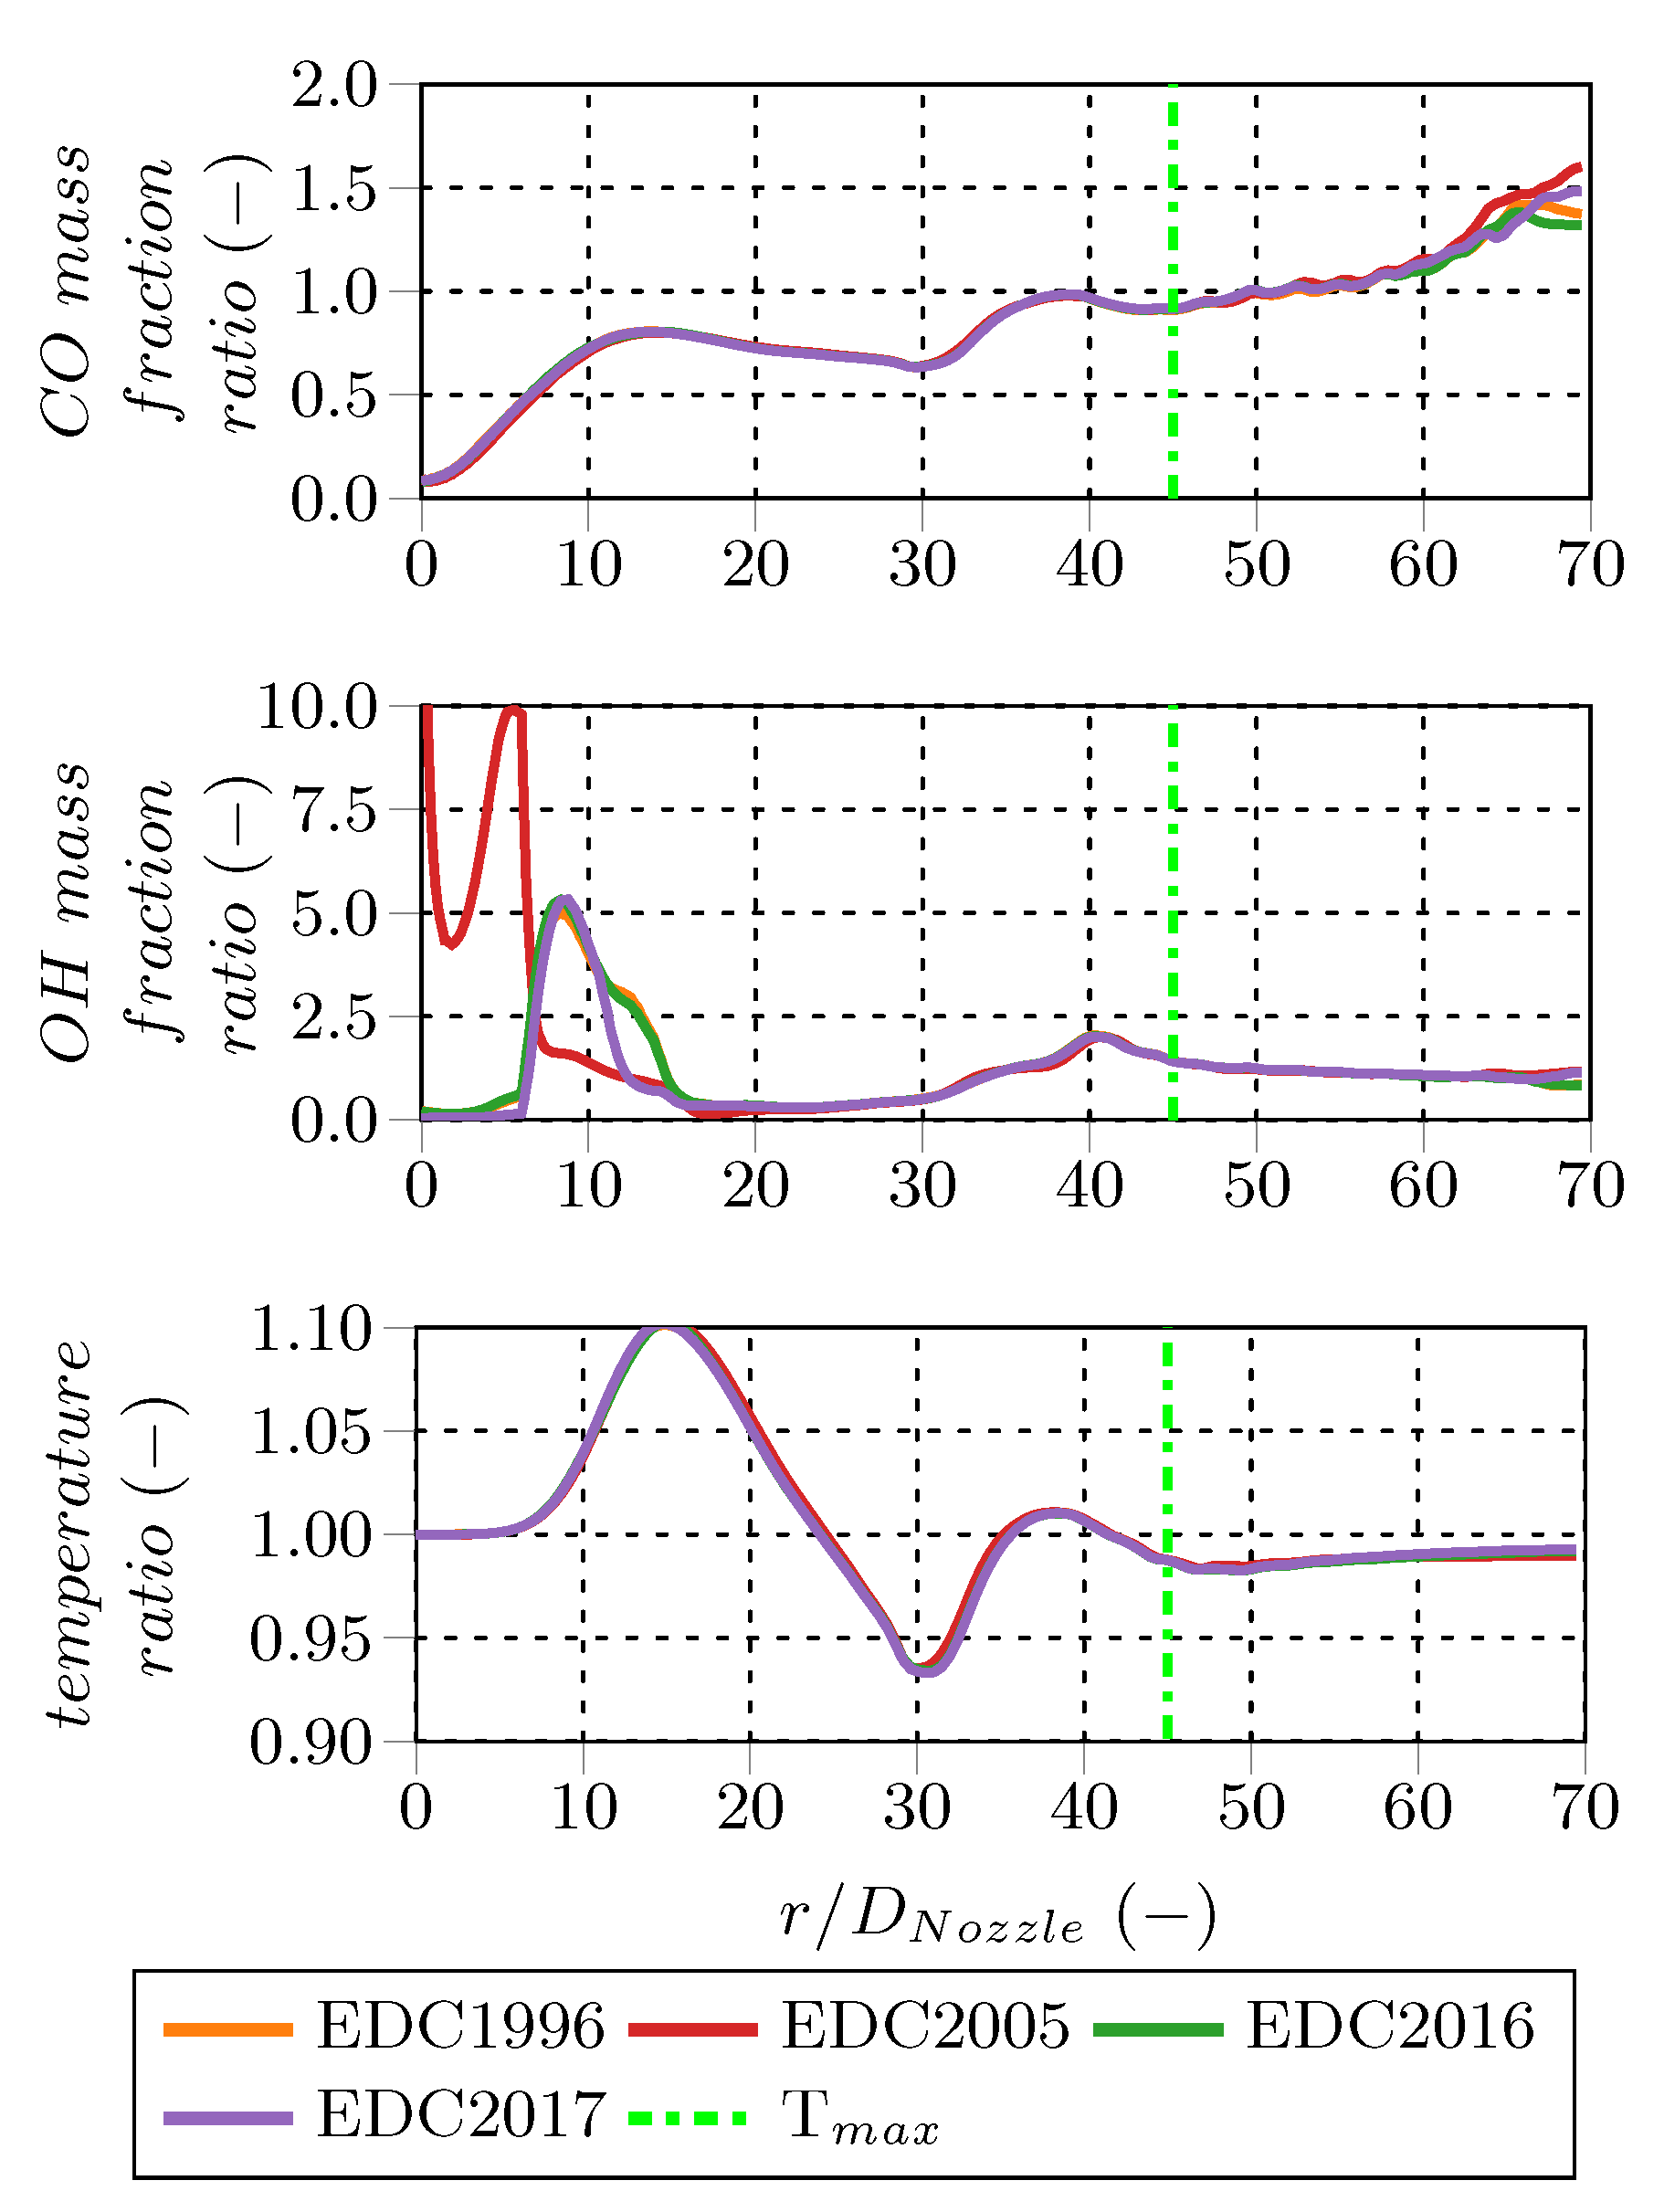
Figure 9 shows the species mass fraction profiles of intermediate species (CO, H
, and OH) as well as the temperature profile along the center line. Compared to the main species, results for intermediates deviate more among the EDC modifications. However, only the OH radical profiles show distinct differences between the PSR and PFR fine structure treatment. The PFR OH peak mass fraction is approx. 1.5 times the PSR peak mass fraction, while the peak position and the profile shapes are similar. In this region, the PSR treatment is closer to the measured values. Temperature profiles confirm that the EDC1981 employing the PFR fine structure treatment failed to ignite the methane jet; therefore, this variant is excluded from further investigations. The other profiles resemble each other and show reasonable agreement with the measured temperatures.
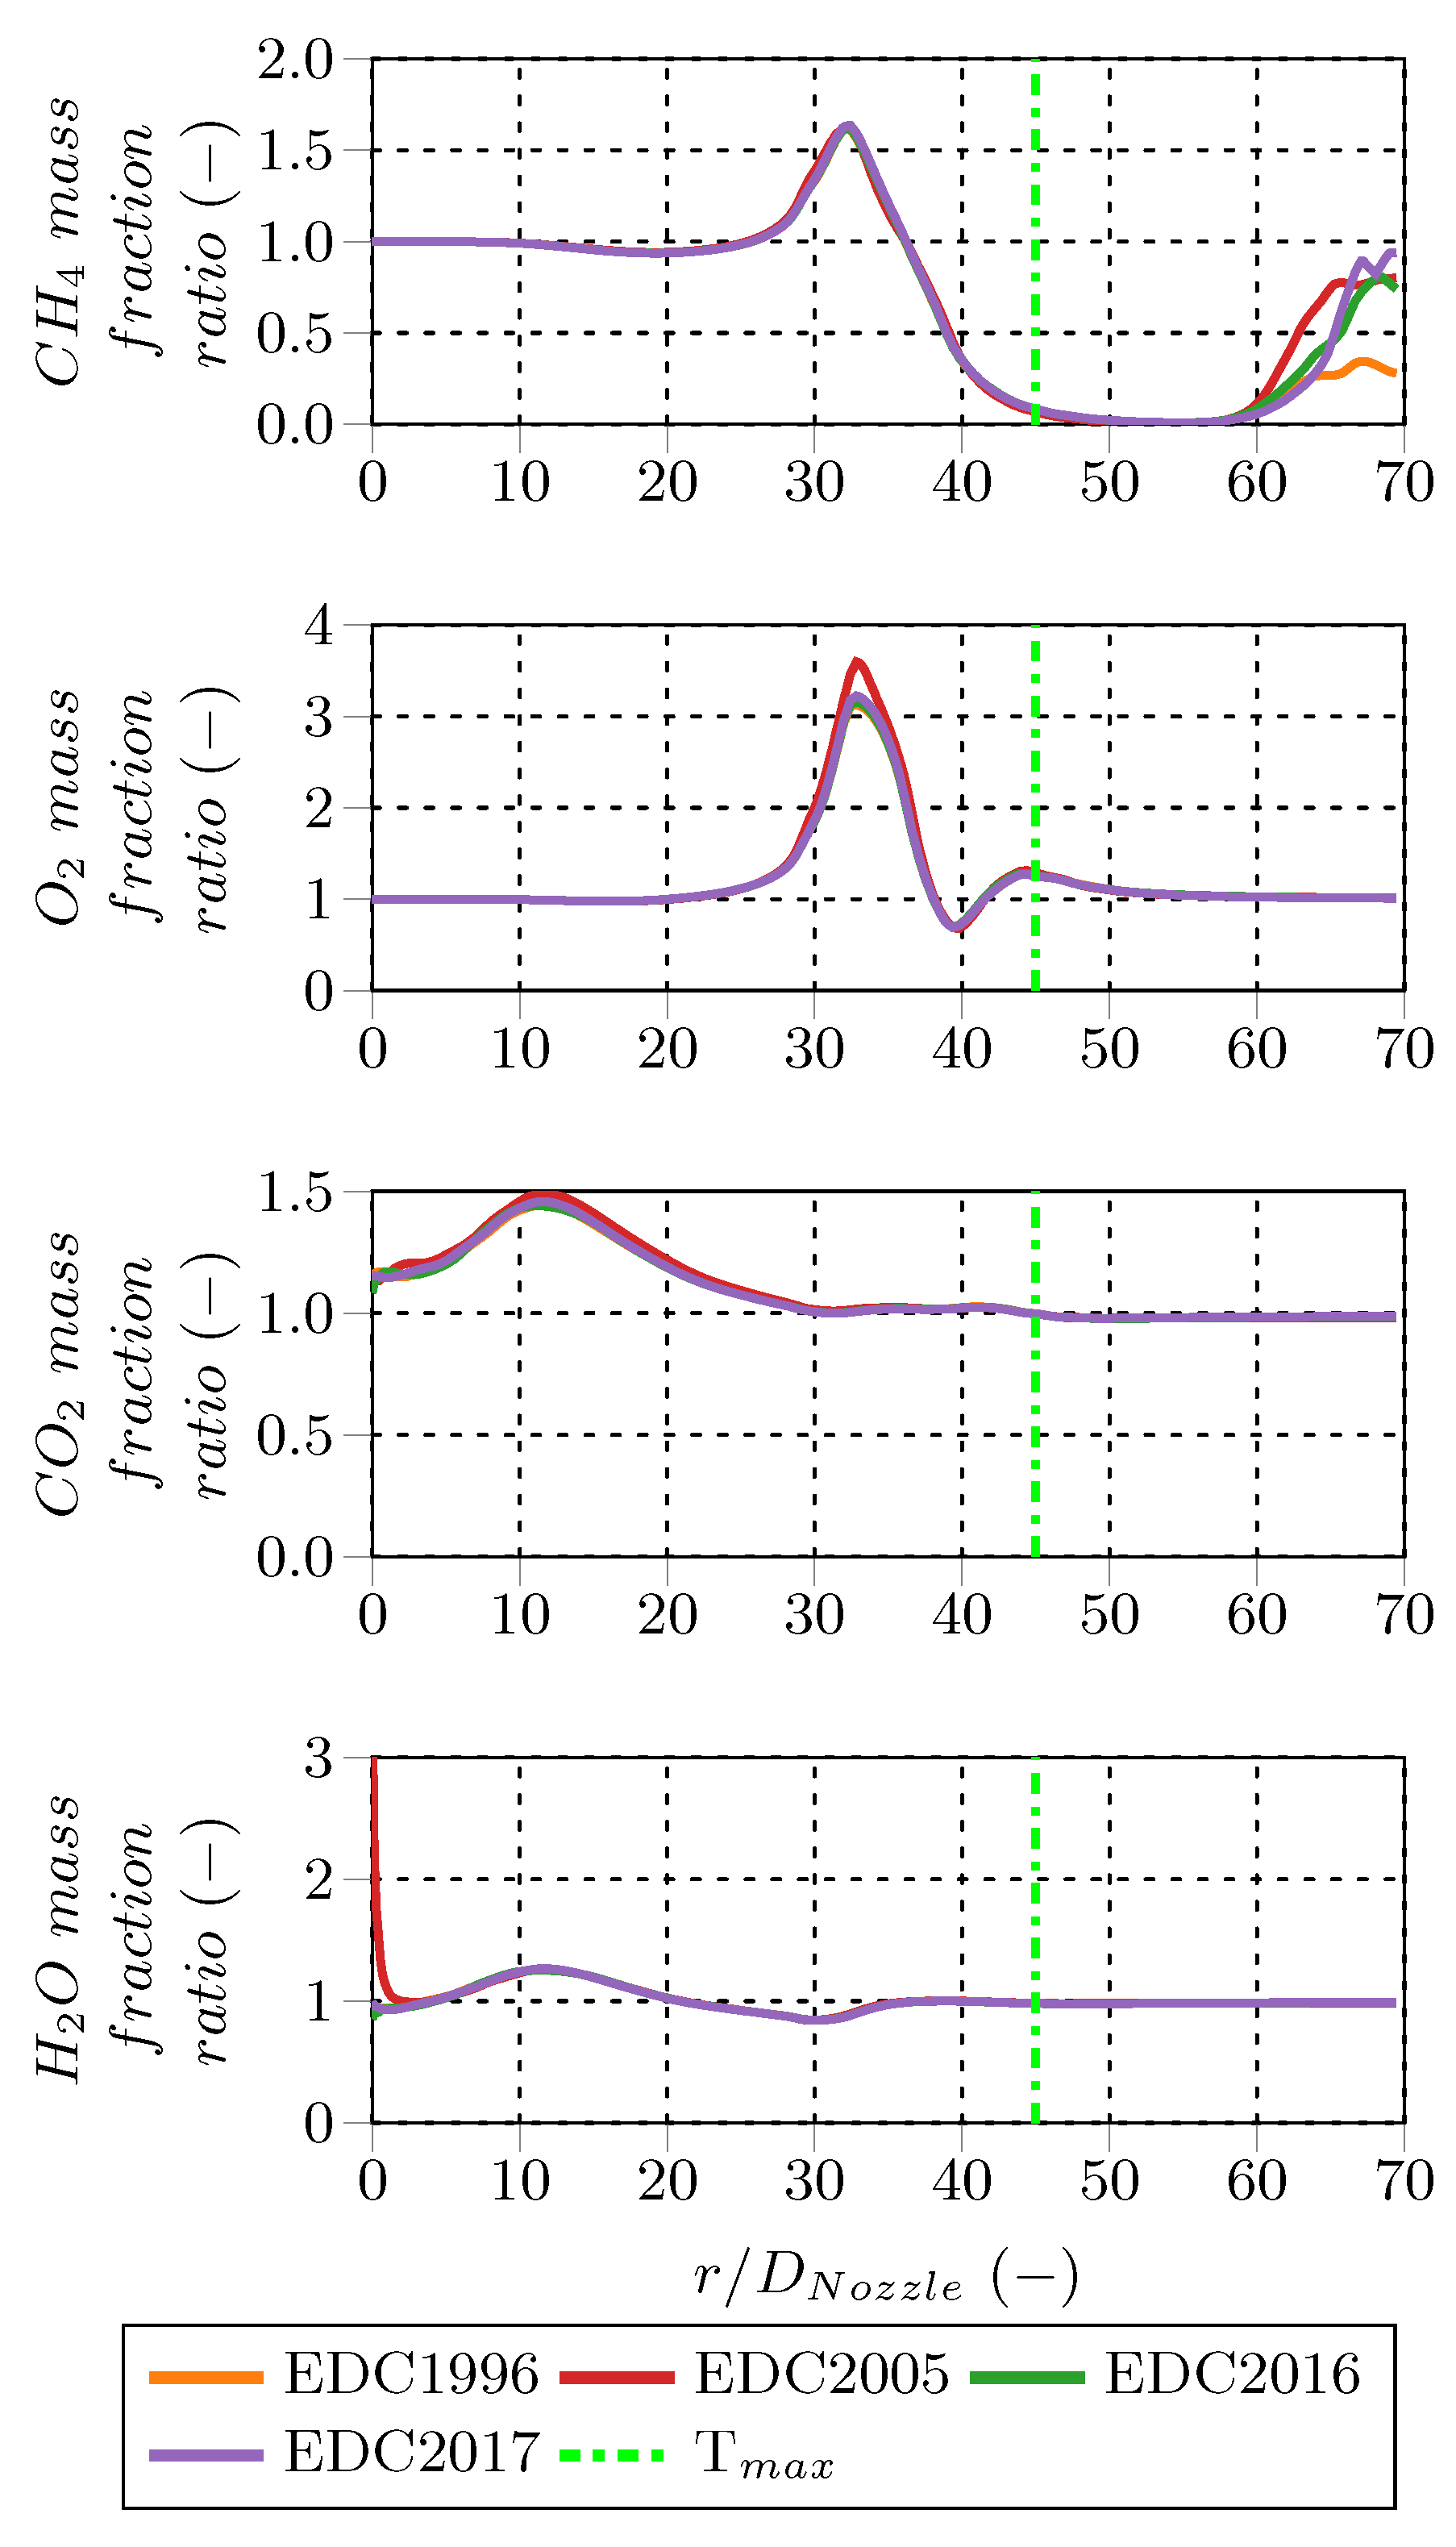
For a better quantification of the fine structure treatment influence, the PFR results are normalized using the PSR results of the corresponding EDC modification. In contrast to the species mass fraction profiles, these normalized profiles reveal more pronounced deviations between the PSR and PFR treatment. Especially for low species mass fractions, the PFR approach predicts up to several times higher or lower concentrations for consumed and produced species, respectively. Methane (CH
) and oxygen (O
) deviate the most 20
upstream from the peak temperature, which is located at
. The PFR first predicts higher mass fractions than the PSR followed by lower ones (see
Figure 10).
Carbon dioxide (CO
) and water vapor (H
O) mass fractions are higher for the PFR downstream from the burner nozzle, but similar further downstream from the PSR values. In contrast, CO and H
mass fractions are higher for the PSR approach upstream from the peak temperature, while PFR and PSR results are similar further downstream (see
Figure 11).
radical mass fractions are significantly overpredicted by the PFR treatment compared to the PSR treatment directly above the burner tip (located at
) and around the peak temperature location. Both give similar mass fractions further downstream, while
mass fractions are higher for the PSR upstream. The deviations of the different profiles in the inlet and outlet regions of the intermediate species and
profiles are caused by numerical fluctuations for these amounts which are close to zero. The normalized temperature profile reveals that the PFR approach predicts slightly higher temperatures downstream from the burner tip. Starting at
, the PSR treatment predicts higher temperatures, but they converge further downstream. The maximum temperature deviation between the two fine structure treatments is around 10%.
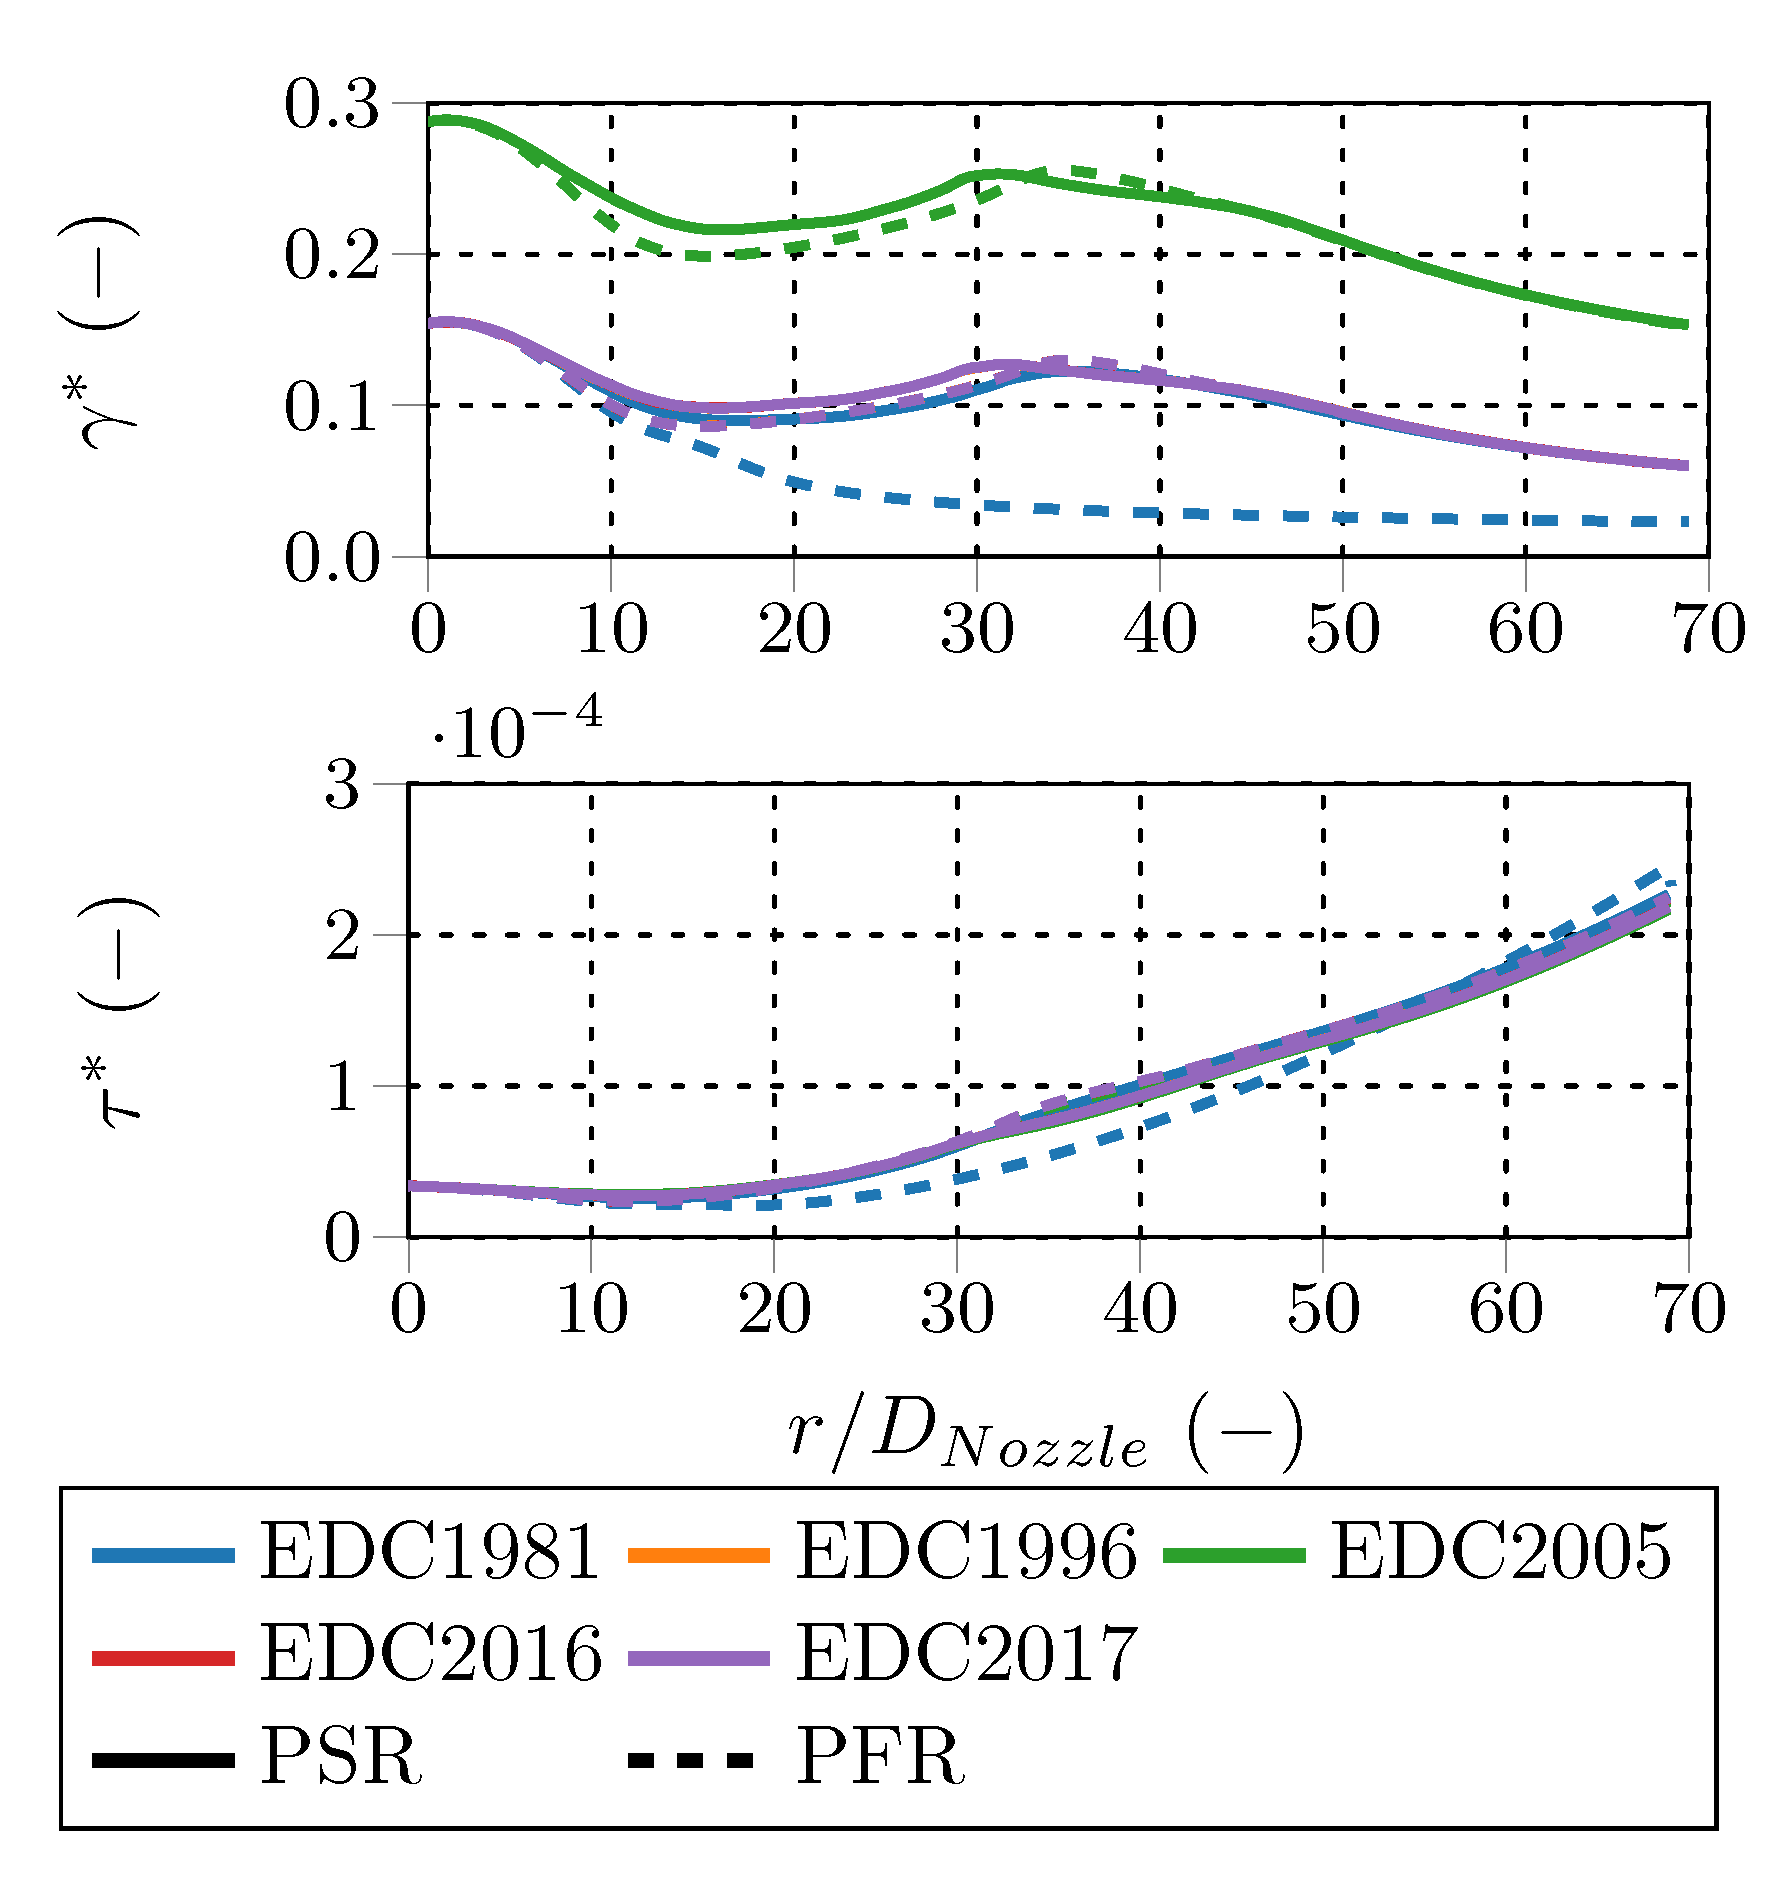
Comparing the fine structure share (
) and the fine structure residence time (
) along the centerline reveals that the values of the PFR and PSR treatment differ in the range between
and
for all EDC modifications (see
Figure 12). Up to
, the fine structure share of the PFR computations is lower than using the PSR treatment. Further downstream, both fine fraction treatments predict similar fine structure shares. Assessing the species and relative species mass fraction profiles in this context shows that their deviations correlate with the variations in the fine structure shares (
). Moreover, the EDC2005 fine structure shares are considerably higher than the ones of the other model variations, e.g., EDC1981 and EDC1996, which are virtually similar. That is obvious, since the fine structure share definition differs, e.g., Equation (
10) for EDC2005 and Equation (
3) for the other EDC versions. The EDC2016 and EDC2017 modifications give identical results as the EDC1996, thus the EDC1996 and EDC2016 values are overlapping in
Figure 12. The fine structure deviations appear at the axial positions between
and
, while the residence times deviate all over the investigated profile. Along the centerline, the normalized fine structure shares and residence times are identical for all EDC modifications, except the EDC2005 fine structure share, which deviates per definition. The fine structure residence times are similar for all investigated cases, although the cases employing the PFR treatment predict higher fine structure residence times than the PSR around
. The original EDC employing the PFR treatment (which failed to ignite the mixture) gives different residence times: lower ones up to
and higher ones further downstream.
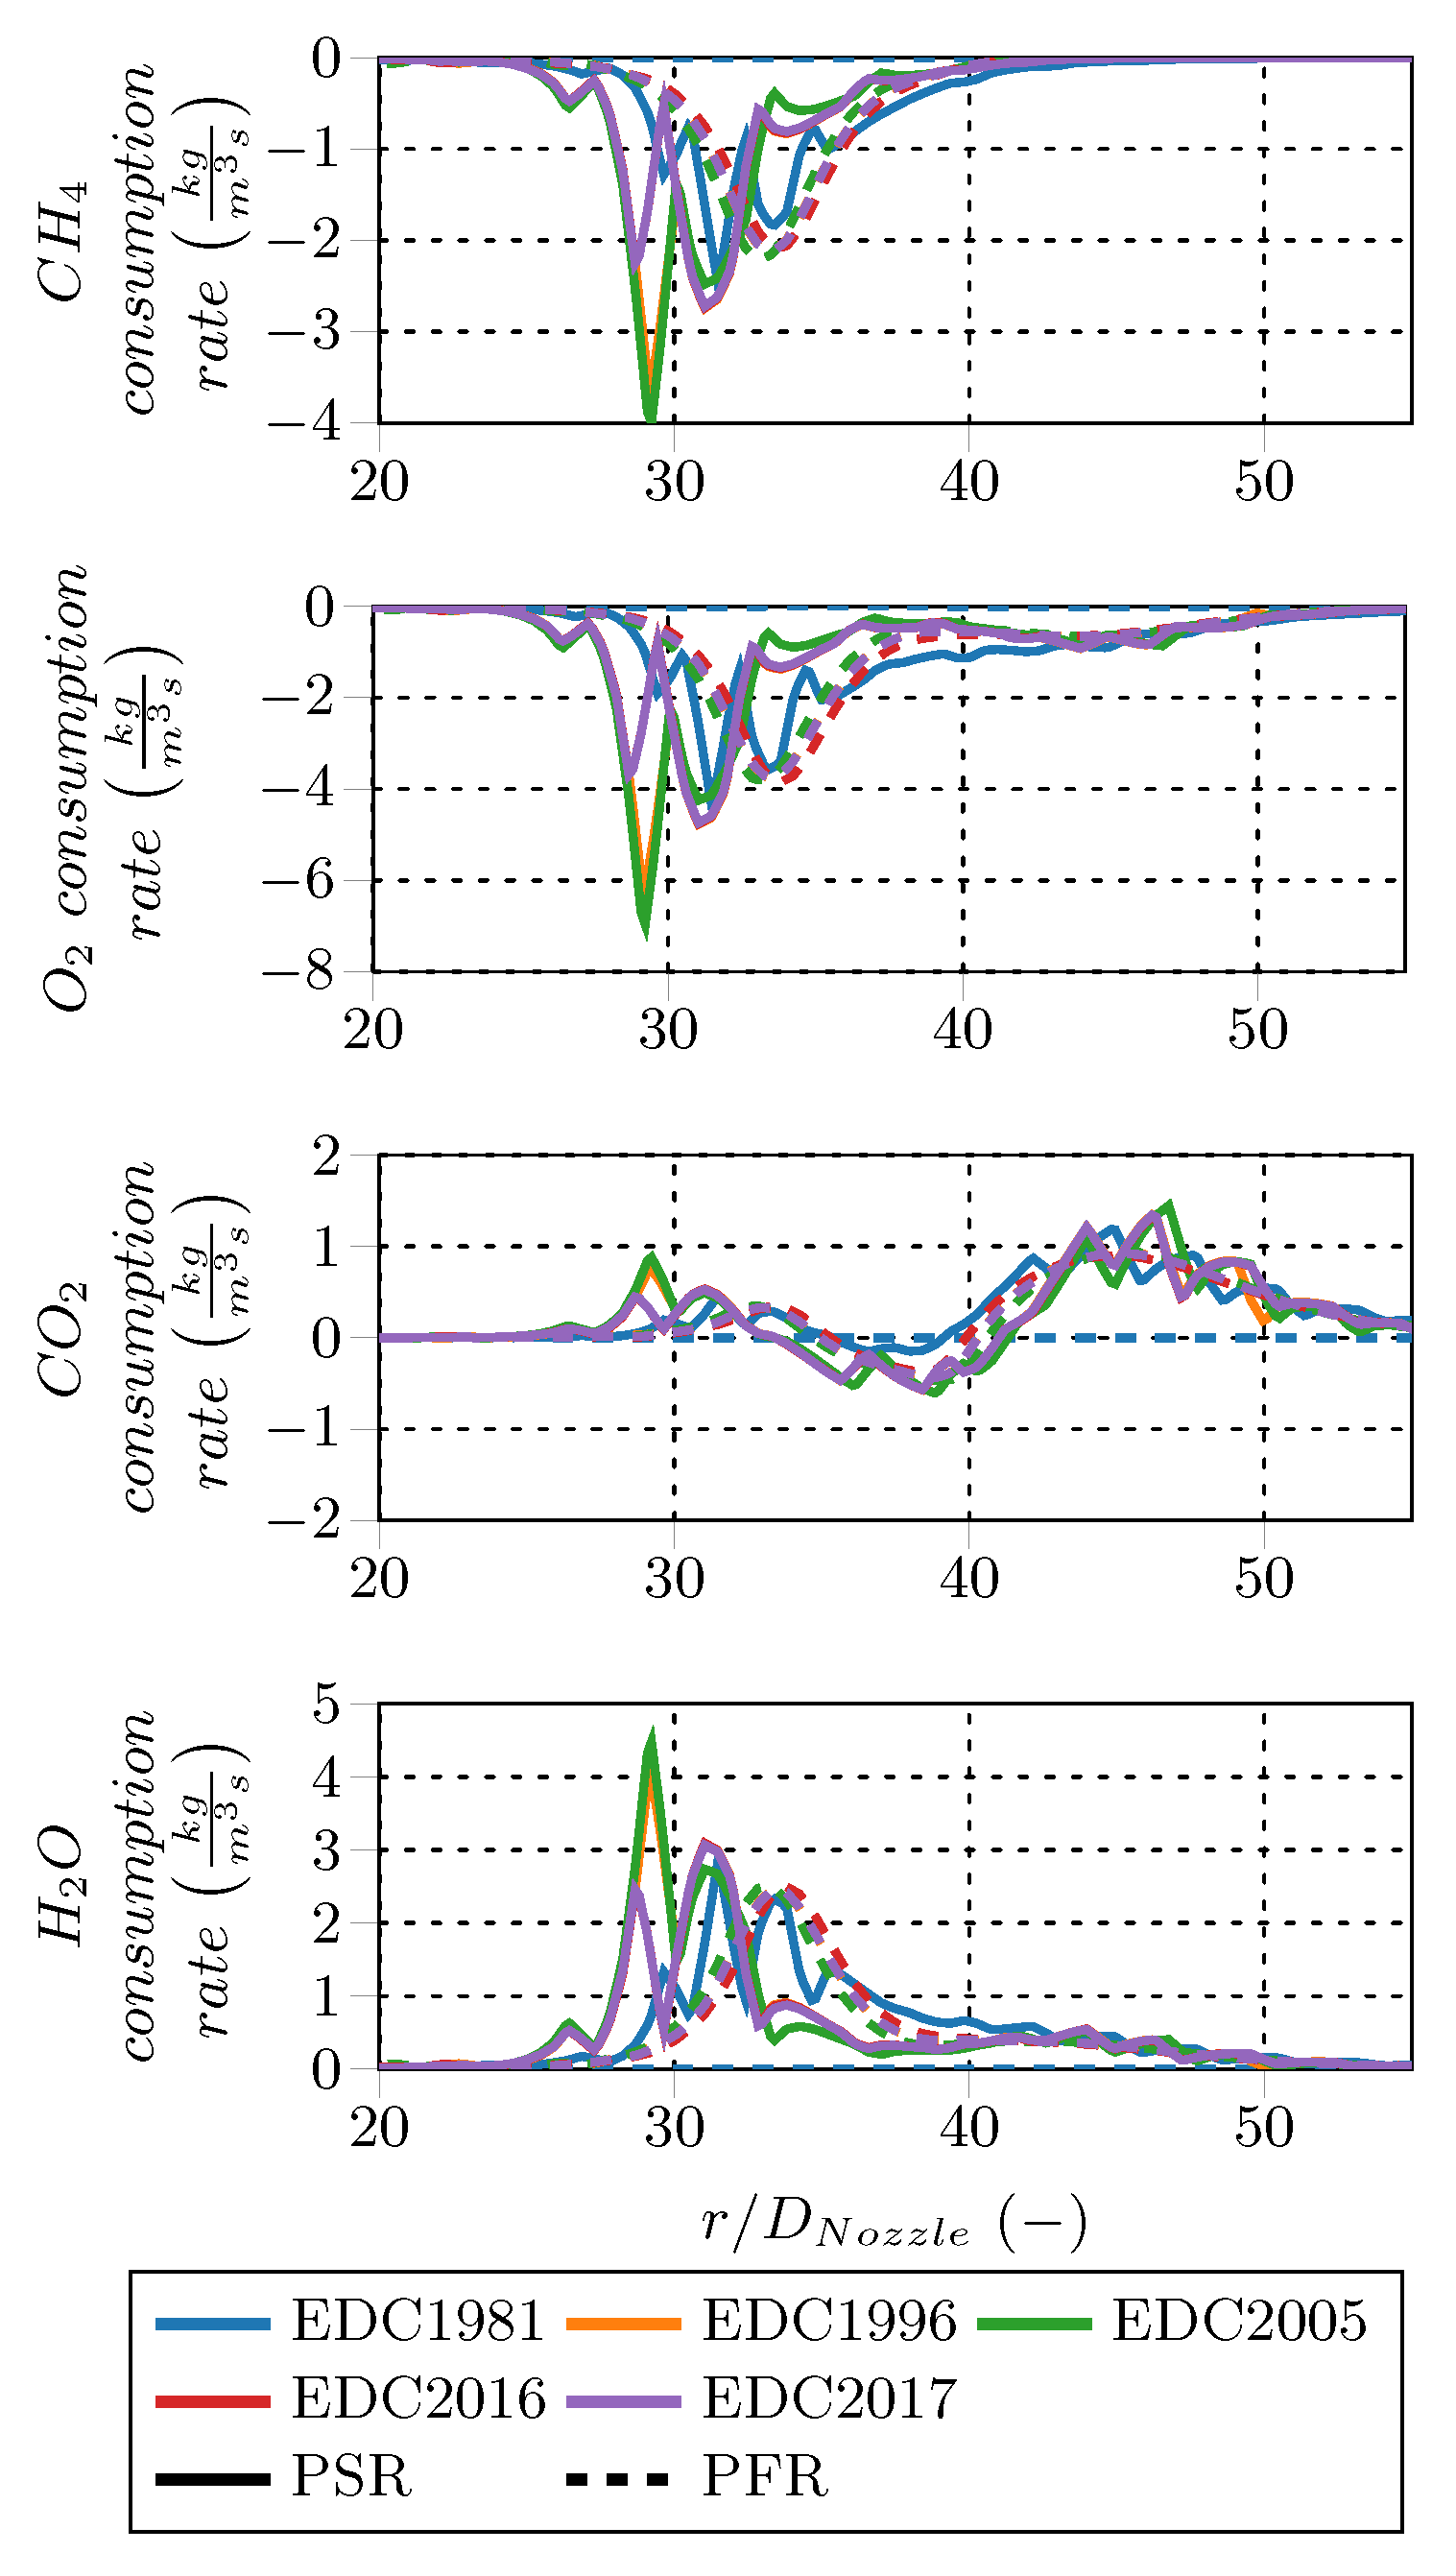
For a better understanding of the variations in the PSR and PFR treatment, the species reaction rates along the center axis were investigated.
Figure 13 shows the main species (e.g., CH
, O
, CO
, and H
O) rates for all EDC variations. The fluctuating rate profiles of the PSR treatment are probably caused by periodic oscillating states or numerical effects occurring when solving the PSR to steady-state. In contrast, the PFR rate profiles are smooth. The CH
, O
, and H
O consumption peaks of the PSR treatment are shifted approx. 5
upstream compared to the PFR peaks. Moreover, the PSR peak magnitudes are almost twice as high as the PFR peak magnitudes. In contrast to the other main species rates, CO
is both produced and consumed along the flame D centerline. An initial production at
is followed by a consumption zone and a second production zone between
and 40 and
, respectively. The predicted consumption peak and the second production peak are similar in position and magnitude for both the PSR and PFR fine structure treatment. The rates of the EDC1981 employing the PFR fine structure treatment shows species rates around zero, since the model failed to ignite the mixture.
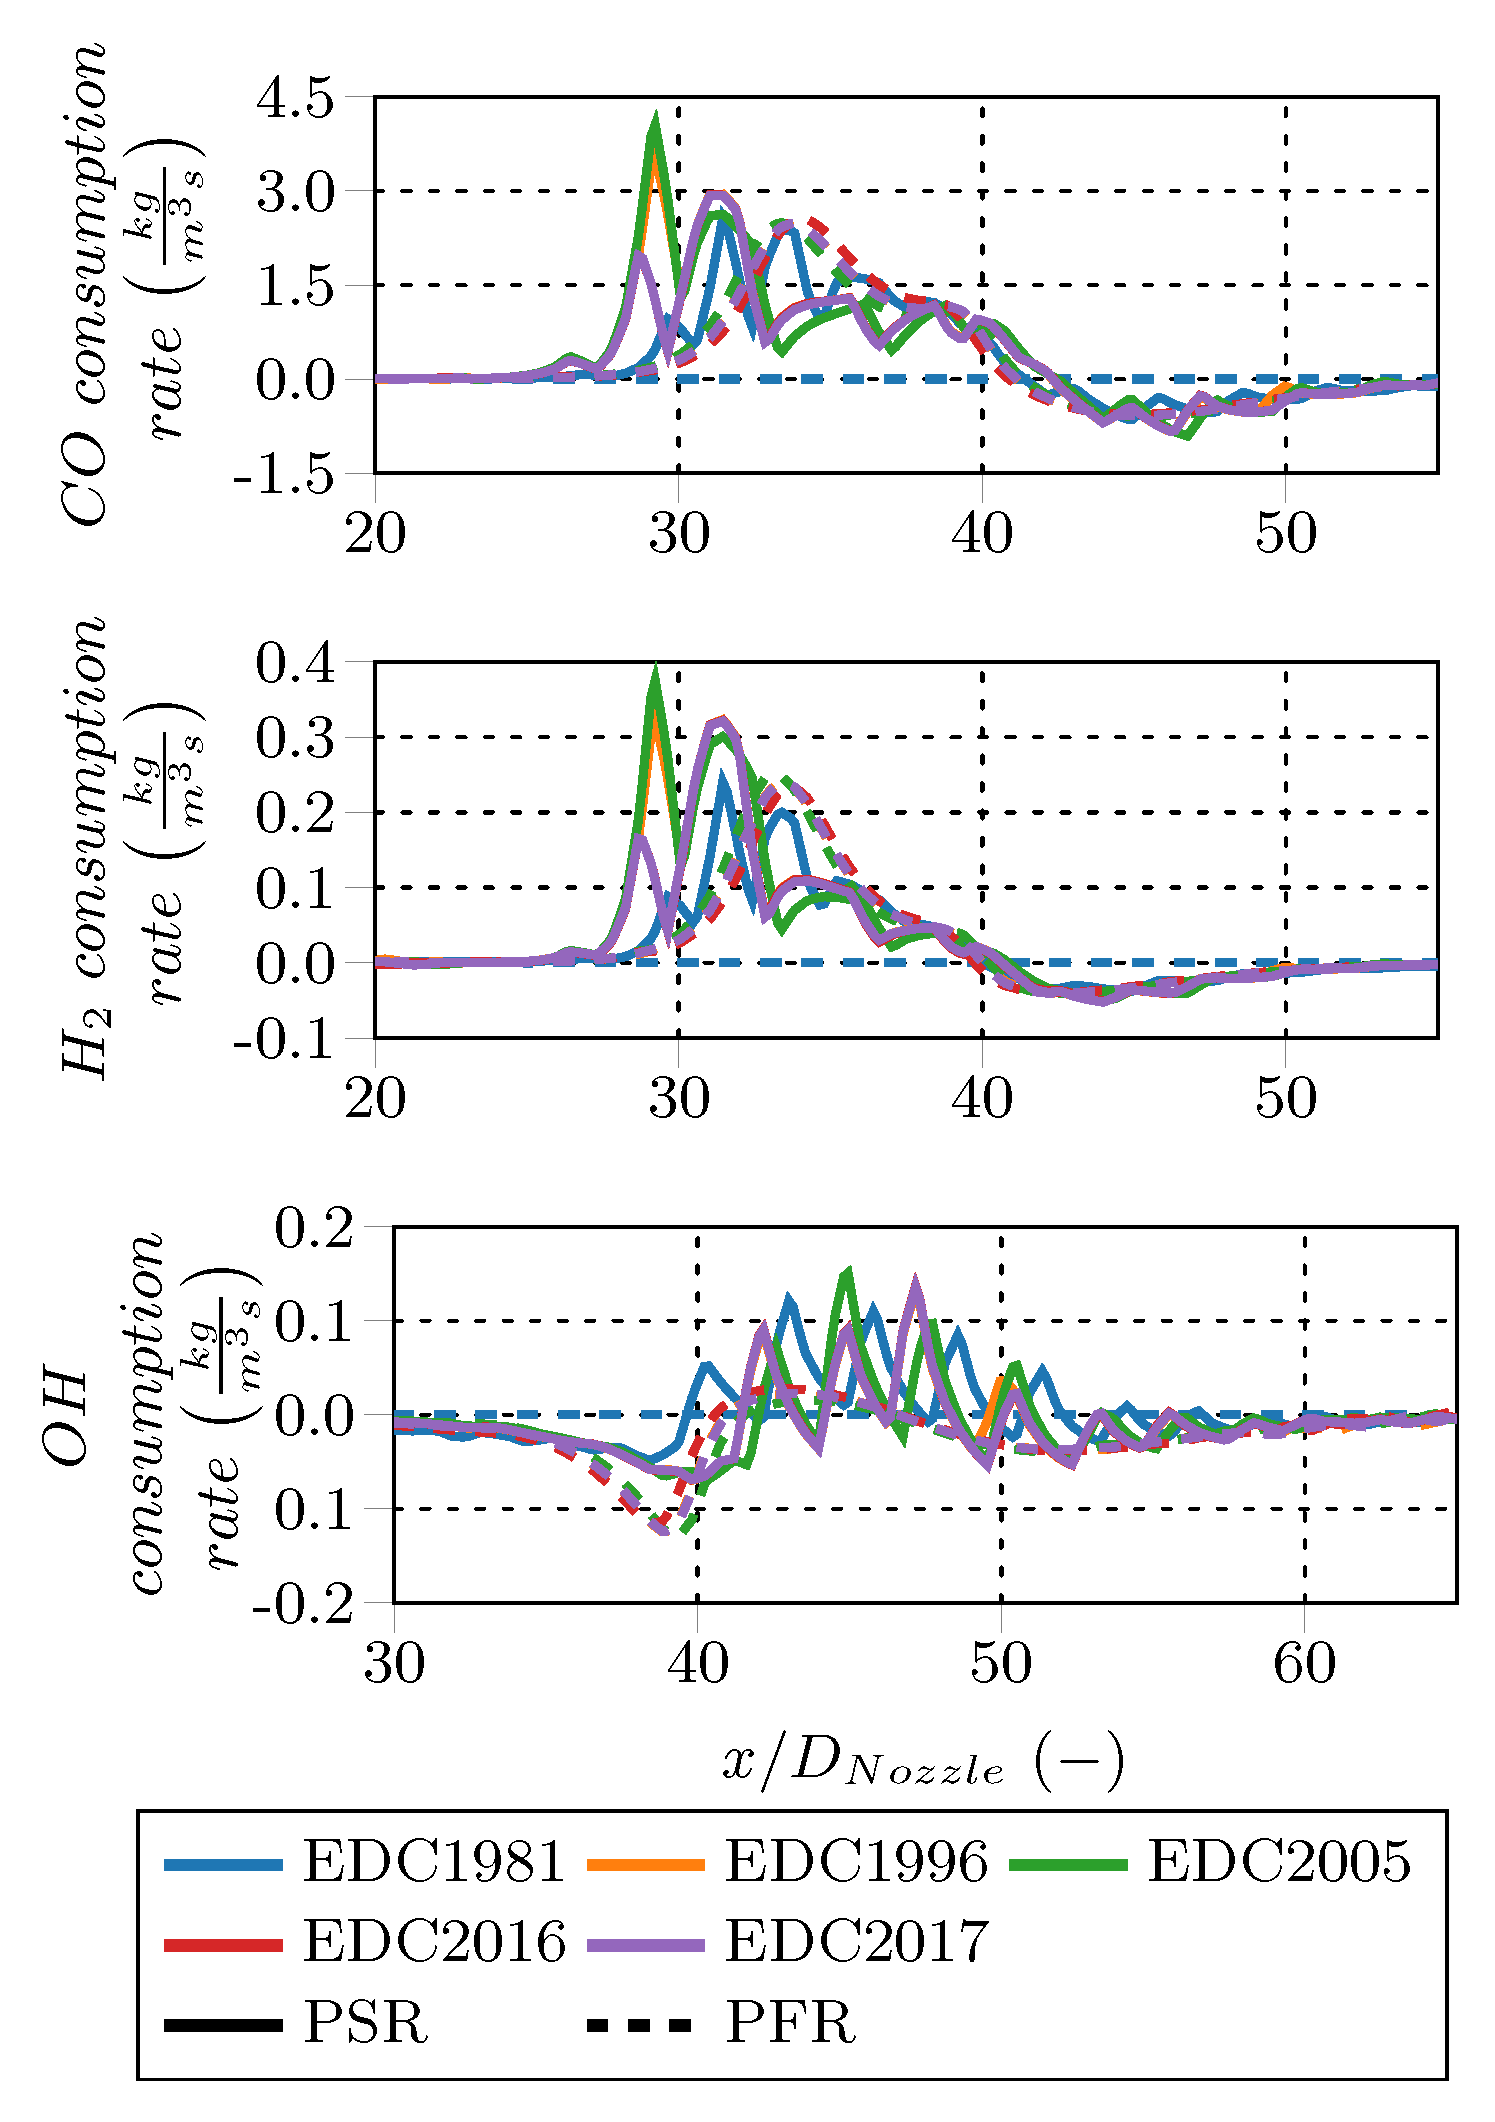
The species consumption rate profiles of the intermediate species are given in
Figure 14. The PSR fine structure treatment predicts CO and H
production peaks approx. 5
upstream from the PFR rates. Peak magnitudes are about the same for CO and higher for H
in case of the PSR treatment. Starting at
, CO and H
are consumed at almost similar rates for both fine structure treatments. In case of OH, the PFR fine structure treatment predicts a consumption peak shortly upstream that of the PSR treatment and has twice the magnitude. The PFR treatment gives smooth profiles, which shows an area of OH production between
and 45 and a second consumption zone further downstream. After the initial production peak, the rates predicted by PSR treatment are alternating between consumption and production up to
, eventually reaching consumption far downstream. In general, the species consumption rates predicted by the PSR fine structure treatment indicate an earlier combustion start and higher rates than the PFR treatment. Furthermore, the CO, CO
and OH rate profiles project the inner and outer reaction zone occurring in Sandia Flame D. The PFR profiles are smooth, while the PSR ones are volatile in this investigation. The PSR behavior is likely caused by oscillating internal states during the solution procedure of the fine structures due to effects caused by the reaction system.


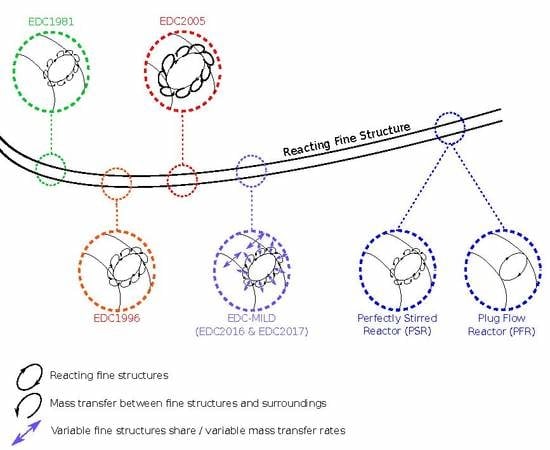
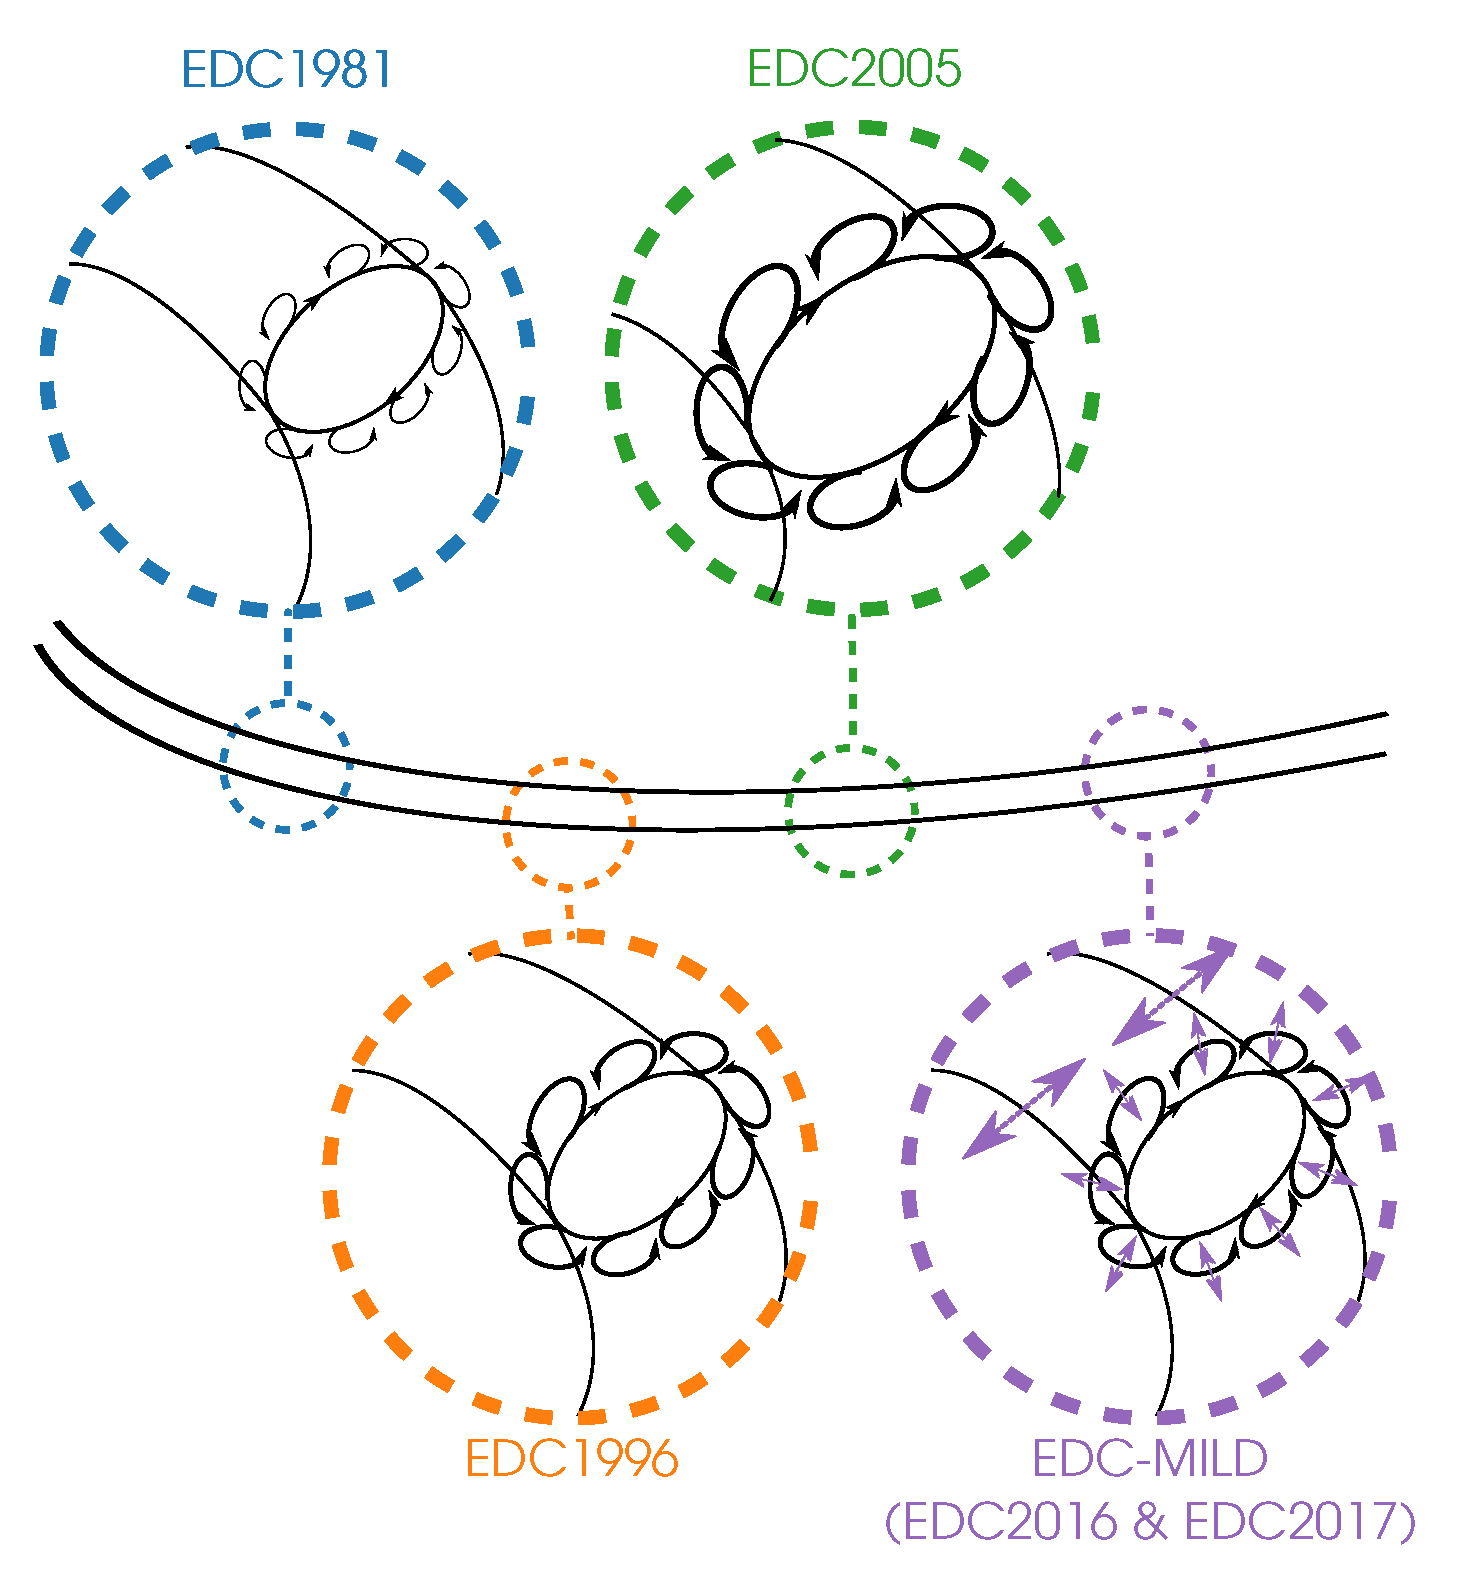
 indicates the fine structures, while
  represents the mass transfer between them and the surroundings.
  illustrates the variable fine structure fractions and mass transfer intensities occurring in the EDC modifications for Moderate or Intense Low oxygen Dilution (MILD) combustion. Symbol sizes indicate their relative relations.


 indicates the fine structures, while
  indicates the mass transfer between them and the surroundings.


