1. Introduction
After the accession to the European Union (EU), the Republic of Croatia has assumed the obligation of increasing the use of energy from renewable sources. Based on Directive 2009/28/EE on the promotion of the use of energy from renewable sources [
1], in 2020, the proportion of energy from renewable sources in terms of gross final consumption at the EU level should account for at least 20 percent [
2].
The Government of the Republic of Croatia is committed to encouraging investments in research, development, and the application of technologies for the utilization of energy from renewable sources (RES) in all types of plants. According to the National energy strategy (2009), incentives were provided for energy generated by wind power plants. The share of wind generated energy in the total consumption of electricity in Croatia will eventually amount to between 9% and 10% in 2020 [
3]. The incentive system for investments in renewable sources of energy is based on the model of feed-in tariffs guaranteeing the purchase of all electricity produced during certain time periods at prices higher than market prices. The incentive program has shown itself as particularly effective in achieving the goal of increasing the production of electricity from wind power plants. Indeed, according to data from the Croatian Energy Regulatory Agency (HERA) [
4], in 2016 the share of electricity produced from wind power plants in Croatia with respect to total electricity produced was 8.85%.
The use of renewable sources of energy has numerous social and economic advantages. RES application reduces harmful emissions, such as CO2, and plays a significant role in the protection of the environment. RES deployment also induces positive economic effects on other domestic sectors included in the RES value added chain. Economics literature provides a broad scope of methods for evaluating the total effects of renewable sources of energy on the rest of the economy as presented in the short literature review in the next section. The approach most frequently applied in the macroeconomic analysis of the role of direct, indirect and induced effects of renewable sources of energy in the national economy is the input-output analysis. Despite numerous analytical possibilities of the input-output analysis, the issue of the economic effects of wind power plant deployment on the Croatian economy has not been previously explored. The contribution of this research is reflected in the evaluation of the total economic effects of the deployment and operation of wind power plants in Croatia for the first time. These effects are expressed in terms of employment and gross value added (GVA) as the most important indicators of economic performance and competitiveness.
This paper is organized in a number of sections. The introduction is followed by an overview of the literature on the total effects of wind power plants on the national economy.
Section 3 describes the research methodology and data sources used in the study, while
Section 4 presents the empirical results of the total effects of constructing and operating wind power plants on the economic activities in Croatia.
Section 5 discusses the results in the context of previous findings. Finally, the conclusion presents an outline of policy implications as well as recommendations for further research.
2. Literature Review
The effects of wind powered plants on the national economy were analyzed in recent literature using various economic and econometric methods, with effects on employment as the key observed indicator of economic effects. Based on a thematic survey, Blanco and Rodrigues [
5] found positive direct effects of wind energy on employment in EU countries. On the other hand, Jaraite, Karimu and Kazukauskas [
6] used panel data time-series econometric techniques for 15 EU countries, finding that the deployment of wind and solar power led to job growth in the short term but not in the long term. The results of the panel data fixed-effects regression models suggest a positive effect from renewable sources of energy, among which wind power plants are prevalent, on gross domestic product per capita for EU countries [
7]. In terms of the Croatian economy, the feasibility of wind power plant projects was analyzed using Monte Carlo simulations [
8]. The results indicated that the economic viability of investing in wind power plants in Croatia is borderline. An ex-post econometric estimation for the local Chinese economy found that wind power plants have a small or statistically significant positive effect on gross domestic product (GDP) and a negative effect on local revenues [
9]. The results of a conducted survey, in-depth personal interviews, and economic modelling confirmed the significant direct and indirect effects of constructing the wind power plant near the small town of Weatherford in Oklahoma [
10].
An overview of relevant research in the field of input-output analysis and wind power plants indicates that the quantification and analysis of the effects of wind power plants on the growth and development of national economies is relatively modest. Papers dealing with the overall effects of wind power plants on national economies, which quantified effects in terms of employment and GVA, are given below.
Driven by the increased development and deployment of wind power plants in the USA, Brown et al. [
11] analyzed the effects of wind power plants on economic growth. The twelve state, so called windy regions of the US were analyzed in the period from 2000 to 2008. Taking into account factors that influence the position of wind turbines, the analyzed region recorded a total increase in income of around 11,000 dollars and job growth of 0.5 per MW of capacity of constructed windfarms in the observed period. Based on the Jobs and Economic Development Impacts Wind model, an input-output model adjusted to wind power plant analysis, Lantz [
12] analyzed the direct, indirect, and induced effects of wind power plants in the state of Nebraska on employment. Results for the period covering forty years and which includes the development and business operations of the wind power plants show that the average employment impact from building a 7800 MW wind power plant in Nebraska is 1600 to 2925 full-time jobs. For the following 22 years, the deployment of a 1000 MW wind power plant may ensure jobs for an average of 345 to 649 people. The Jobs and Economic Development Impacts model [
13] was also applied to estimate the number of jobs related to the development of wind power plants in the western region of Texas. The number of employed persons during the four-year construction phase of the wind power plant was about 4100 full-time equivalent jobs; i.e., 58% of all generated jobs. The emphasis on environmental protection and increasing awareness of the necessity to prevent climate change led to the use of renewable sources of energy in a number of countries. The social and economic benefits of "renewable" technologies, especially on job creation, were analyzed in the case of Brazil in [
14]. The number of jobs generated in the production, construction, maintenance, and management of wind power plants was estimated. The findings indicate that for every MW of power installed between the construction of the wind power plant and its first year of operation generates a total of 13.5 jobs annually. Throughout the lifespan of the wind power plant, 24.5 more jobs are added annually. Haerer and Pratson [
15] used the input-output model to estimate employment in the US electricity sector for the period 2008–2012. Having compared the coal industry, which lost more than 12% of jobs in the observed period, the natural gas, solar and wind industries recorded job growth of about 21%.
Ragwitz et al. [
16] applied the multi-regional input-output model to analyze the renewable energy industry in terms of the GVA and employment for EU member states. In 2005, the total (direct and indirect) GVA, induced by expenditures for renewable energy sources deployment, reached € 58 billion in 2005 or 0.58% of total EU 27 GDP. Total (direct and indirect) employment induced by the deployment of renewable energy sources was 1.4 million, which is equal to 0.64% of total employment in the EU 27. With respect to wind power plants, GVA and employment from wind power were largely concentrated in Germany, Denmark, and Spain. According to the policy framework for renewable energies for the EU, the sector of renewable energy sources employment is expected to grow by 2.8 million employees in 2020 and 3.4 million employees by 2030, with wind energy among the most important technologies contributing to job growth. Based on research conducted for Norrbotton in Sweden [
17], investments in wind power plants will encourage regional development and job growth. The data indicates that the effects on the employment rate will be positive with an employment multiplier of 1.4 during the work phase of constructing the wind power plant. To estimate the direct, indirect, and induced effects of the UK offshore wind industry on employment for the period 2017–2032, a model was developed to include the input-output table for the UK in which the offshore wind energy sector was separated from the other economic sectors in order to track the effect of offshore wind energy on output and employment [
18]. Research indicated that by 2032, the total number of persons directly employed in the UK offshore wind sector will be 21,000, with 37,000 full-time equivalent jobs expected as indirect and induced effects. Similar research has been conducted for the Danish economy [
19]. Using input-output tables, authors focused on the wind energy sector to measure the impact on the Danish economy. The total (direct and indirect) effects of the wind energy sector generated value added growth of 15.6% in the period 2007–2010, whereas in 2010 the wind energy sector generated 37,442 jobs, 7.1% more than in 2007. The predictions are that in 2020, the wind energy sector may generate 42,689 jobs, meaning 14% more than in 2010, where the contribution to GDP will grow from around 25 billion DKK to more than 40 billion DKK. In Portugal, a hybrid input-output model was used to analyze the effects of energy policy on the economy [
20]. The results indicate the positive effects of energy policy on growth, employment, and the reduction of emission of greenhouse gases in the analyzed period of 2000–2010.
In addition to the research that analyzed the effects of wind power on national economies, there are also papers that analyze the economic effects on employment for other types of renewables by applying the input-output method.
The primary strategy of reducing global carbon emissions is the transformation of the energy sector by increasing energy efficiency and the use of renewables. The transition to lower carbon emissions reduces the use of fossil fuels, which in turn leads to the loss of jobs in the fossil fuel industry. In his paper, Garret-Peltier [
21] presented a method of creating clean energy industries using input-output tables, which enables evaluations of public and private consumption of clean energy when compared to the effects of spending fossil fuels. Having analyzed employment in the short and middle term, the spending of 1 million dollars of fossil fuels generates on average 2.65 full-time jobs, whereas the same amount spent on renewable sources of energy generates 7.49 jobs, while energy efficiency creates 7.72 jobs. Hence, every million dollars spent on moving away from brown to green energy creates an additional 5 jobs.
Investments into environmental protection (so called green investments), apart from economic benefits, increase the quality of the environment by reducing emissions of greenhouse gases and other pollutants. A paper [
22], using input-output analysis, estimated the contribution of green investments to employment in the Greek economy in the period 2010–2020. The results show that a million euro of investments generates 24.75 full-time jobs. Moreover, it was also found that green investments create 743,000 full-time jobs on average.
Incentivizing the implementation of technologies involving renewable sources of energy is a key part of governmental strategies for preventing climatic change and increasing the proportion of electricity produced from renewable sources. Based on the input-output approach, the potential for creating jobs for each technology involving renewable sources of energy in the UK was forecasted in the paper [
23] for the year 2020. It was estimated that should each of the technologies involving renewable sources of energy achieve the predefined installed power by 2020, a total of 95,999 jobs will be generated directly and indirectly. The analysis also showed that the majority of jobs will be generated in assembling new facilities. Hence, a large proportion of jobs will be of a temporary nature, as opposed to permanent jobs associated with maintenance.
3. Methodology and Data Sources
The input-output analysis is a practical macroeconomic analysis tool used to test and determine interdependencies of all economic sectors in a national economy [
24]. The statistical and informational basis of the input-output analysis is the input-output table. It contains a system of an economy classified into a number of economic sectors showing the flow of goods and services between production sectors [
25,
26]. The importance of the input-output tables is stipulated by the EU directive, according to which all EU member states should devise input-output tables every five years [
27].
The fundamental equation in the input-output model used to show the dependency of flows between sectors on total production of each sector is as follows:
where
is the total output of sector
,
represents the output of sector
which is used as the intermediate input in sector
,
is the final consumption of sector
, and
is the technical coefficient indicating the part of the product of sector
which is necessary for sector
for the production of one unit of that product,
.
The solution to the system of Equation (1) in matrix form can be shown as:
where the
is the column vector of total production,
is the matrix of technical coefficients, and
is the column vector of final consumption. The matrix
is called the Leontief inverse matrix or multiplier matrix.
The input-output model is used for quantifying direct, indirect, and inducted effects of a particular sector on the overall economy of a country. There are two types of input-output models. The open input-output model, in which the final consumption is considered as an exogenous variable, is used for analyzing the direct and indirect effects. The indicators used to determine the direct and indirect effects are called the type I multipliers and they are calculated by using the Leontief inverse matrix
. The closed input-output model uses the particular components of final consumption, which depend on other variables to analyze the direct, indirect, and induced effects [
28,
29]. The indicators that include the direct, indirect, and induced effects are called type II multipliers. Calculating the type II multipliers requires the
matrix, the extended matrix of technical coefficients
with an additional row representing the coefficients for fees to employees and an additional column, which contains the input coefficients for personal consumption. The block matrix,
apart from the direct and indirect effects, also suggests induced effects. When the focus is solely on the calculation of the direct, indirect, and induced effects of the original
sectors, then the
-by-
matrix
is used. The total effect of a particular sector on the overall economy is equivalent to the sum of the direct, indirect, and induced effect.
After estimating the total effect on total economy according to the Equation (2), the total effects on the value GVA and employment can be estimated [
25,
30]. If
is the diagonal matrix with elements on the main diagonal of the value-added coefficients, presenting the share of the value added in the output of each sector of the economy. Then the total (direct and indirect) GVA effects in the open input-output model are calculated using:
whereas the total effects (direct, indirect and induced) in the GVA term in the closed input-output model are calculated as follows:
Furthermore, let the
diagonal matrix with elements on the main diagonal (employment coefficients) show the proportion of number of employed in the output of a particular sector. The direct and indirect employment effects in the open input-output model are then calculated as follows:
whereas
is used to calculate the direct, indirect, and inducted effects in the employment term in the closed input-output model.
The empirical part of the analysis in this research is based on a combination of data sources. The most important data set on the deployment and operation of wind power plants originates from the Croatian Energy Market Operator (HROTE) as well as the direct survey of RES units in Croatia. The investor’s annual financial statements are publicly available, containing basic information on assets and liabilities (balance sheet), as well as revenue and costs (income statement). In order to adjust the aggregated categories from publicly available reports to the requirements of this study, a special questionnaire on the structural characteristics of investments, revenue, and costs was created. The survey was conducted in 2017 for the period 2007–2016. In total, 13 wind power plants in Croatia comprising 70% of the total installed capacity participated. The questionnaire contained financial data on the business operations of wind power plants and technical indicators on the size of the plant and annual production. The entrepreneurs were asked to provide the detailed structure of investments according to the categories of products incorporated into the plant, as well as the structure of investment regarding the domestic or foreign origin of such equipment. Apart from investment data, the questionnaire also contained data on revenue and intermediate consumption of energy producers during the regular operation of the plant (direct effects in the channel of intermediate consumption). The data on the structure of annual operating costs of the wind power plant are based on the set of typical goods and services (first round of spillover effects in the intermediate consumption channel). In addition to the questionnaire, the official input-output table for the Croatian economy for 2010 (published by the Croatian State Bureau of Statistics [
31]) is used in order to include the indirect effects along the value added chain.
The estimation of the total effects in terms of GVA and employment on a national economy, induced by investments in renewable sources of energy, can be allocated into two analytical categories, or periods: the investment and regular plant operations. The indirect effects of wind power plants on other economic sectors of a national economy are dispersed through the investment channel and the channel for demand for intermediate goods and services. During the installment period of the wind power plant, the demand for investment goods increases economic activity and employment in units that deliver items required to put the plant in operation. The direct effects spill over to other domestic suppliers included in the value added chain which deliver equipment. The total effect on GVA and employment induced by investments in wind power plants are calculated by the application of the standard input-output model; i.e., according to the Equations (1)–(7).
The methodological framework and data sources for estimating the effects of both channels of spillover effects are summarized by
Table 1.
4. Results
The incentive policy for renewable sources of energy based on the feed-in tariff scheme has been proven as successful and Croatia has achieved its goal in achieving the share of RES in total energy production for the year 2020, a few years ahead of schedule. The results on the effects of the analyzed wind power plants on the Croatian economy confirm the hypothesis on the existence of a positive effect of the incentive policy for renewables on the national economy. The results below show the GVA and employment multipliers, decomposition of the effects based in absolute and relative terms and the total effect trends in the analyzed period.
Table 2 shows the multipliers for the wind power plants of GVA and employment type I (only indirect effects included) and type II (total effects included). These multipliers are calculated using the standard input-output method and should be interpreted as the ratio of the total economic effects in the overall economy to the unit value of investment delivered by the domestic producer. In terms of the particular investment categories, the GVA and employment multiplier may be high, but it should be noted that the multiplier is effective only on the domestic part of the investment. Should a significant part of the investment relate to equipment originating from abroad, the estimated effects of the total investments on the domestic economy may be relatively low despite the high multiplier for domestic production. In addition, the effects of total investments on the domestic economy (
Table 3) also include effects relating to the origin of investment equipment (domestic or exports).
The GVA and employment multipliers are expressed in terms of the total induced effects per unit of direct effect of domestic producers. Following the analysis of the investment channels, the type I GVA multiplier amounted to 1.72. In other words, for every 1 euro of GVA, which is achieved by a direct supplier of investment equipment, the spillover effects on the other domestic producers in the Croatian economy are estimated at an additional 0.88 euros of GVA. In terms of the effect of induced personal consumption, the type II GVA multipliers recorded a greater value in relation to the value of the type I GVA multipliers and amounted to 2.65. Every euro of GVA realized by a direct supplier of equipment induces an additional 1.65 euros in the value added chain. Employment multipliers are somewhat less in relation to the GVA multipliers. However, every person employed by a direct supplier of RES equipment indirectly creates additional employment in the value added chain estimated at 0.52 (if only indirect effects are included) or 1.34 persons employed if induced personal consumption is included.
Multipliers in the intermediate consumption channel reflect the intensity of interconnections of the wind power plant plants and other economic sectors during the plant’s operating period. Concerning the channel of intermediate consumption, the results show a somewhat lower value of the GVA multipliers in relation to the same multipliers in the investment channel. During operations, the requirements for intermediate inputs of wind power plants are limited to services such as regular maintenance, which limits the multiplier values. Wind power plants require more indirect labor input (employees of contractors performing regular maintenance and related services) while direct labor requirements are not substantial. Because of the low denominator (direct labor) the employment multipliers in the intermediate consumption channel were higher than comparable employment multipliers in the investment channel. This is despite the fact that the total job creation effect is more pronounced in the investment channel (14.3 full time equivalent (FTE) jobs induced by 1 million euros of investments compared to 10.7 FTE induced by 1 million euros of revenues derived by the energy sales).
Table 3 shows the spillover of direct, indirect, and induced effects of wind power plants in terms of GVA and number of full time employees induced by 1 million euros of total investments (investment channel) or 1 million euros of revenues related to energy production (intermediate consumption channel).
A 1 million euro invested in the deployment of a wind power plant induces 345 thousand euros of GVA in the Croatian economy. The investment of the same value generates a total of 14 employed persons in terms of full time equivalent (FTE) annual labor input. The total effects on GVA for a value of 1 million euros of production through the intermediate consumption channel have a higher intensity than the total effects achieved through the investment channel. The proportion of intermediate consumption for wind power plants is low. In terms of national accounts, directly generated GVA for wind power plants accounts for almost three quarters of revenue from the sale of electricity prices defined by the feed-in scheme. During regular operations, indirect and induced GVA effects are less pronounced. From the energy policy perspective, wind energy production of 1 million euros generates 1023 thousand euros of the total GVA in the Croatian economy and generates 11 jobs in terms of FTE labor input.
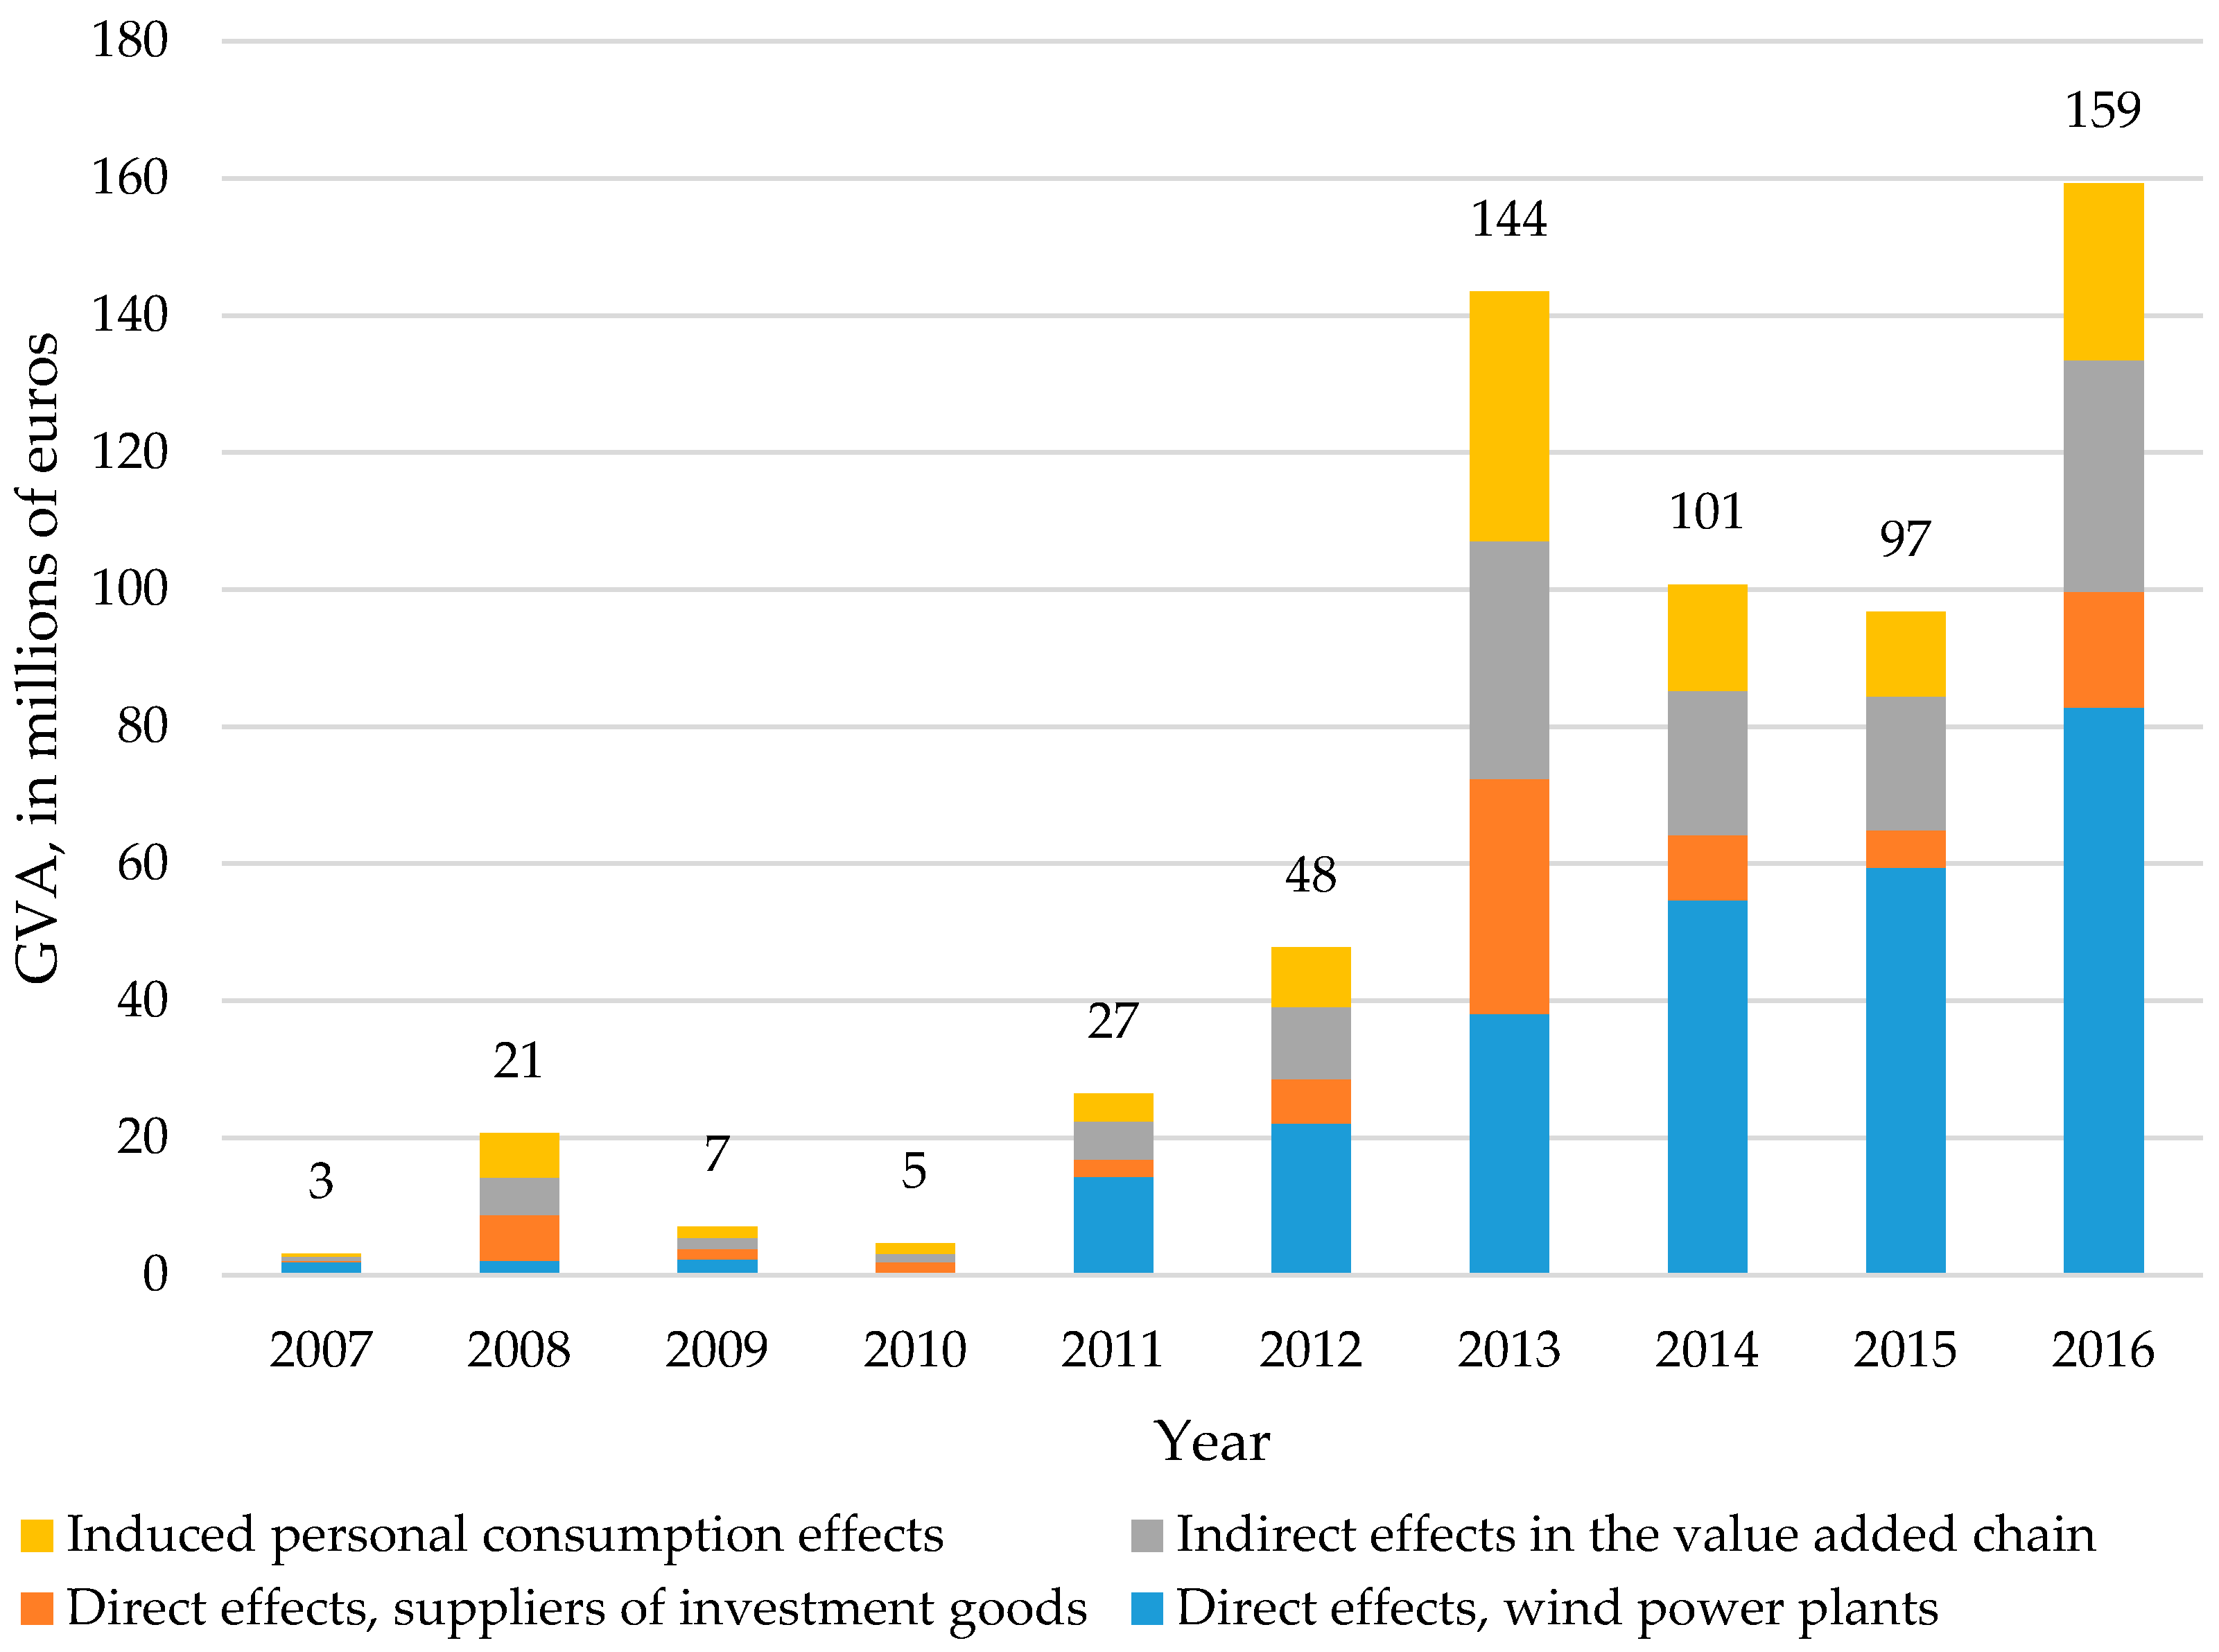
Table 4 shows the total effects of wind power plant deployment and operation on the overall Croatian economy in terms of GVA, as well as the decomposition of GVA into direct, indirect, and induced effects for the period 2007–2016 through both the investment and the intermediate consumption channel. The direct effect in the observed period in terms of GVA recorded is a somewhat higher value for indirect but also induced effects. The greatest values of direct, indirect, and induced effects were recorded in 2013 when the total GVA induced by the investment channel amounted to almost 91 million euros. In terms of employment, the direct effect through the investment channel dominates over the indirect effect. However, with the inclusion of the induced personal consumption, the sum of indirect and induced effects is higher than the direct effects only (
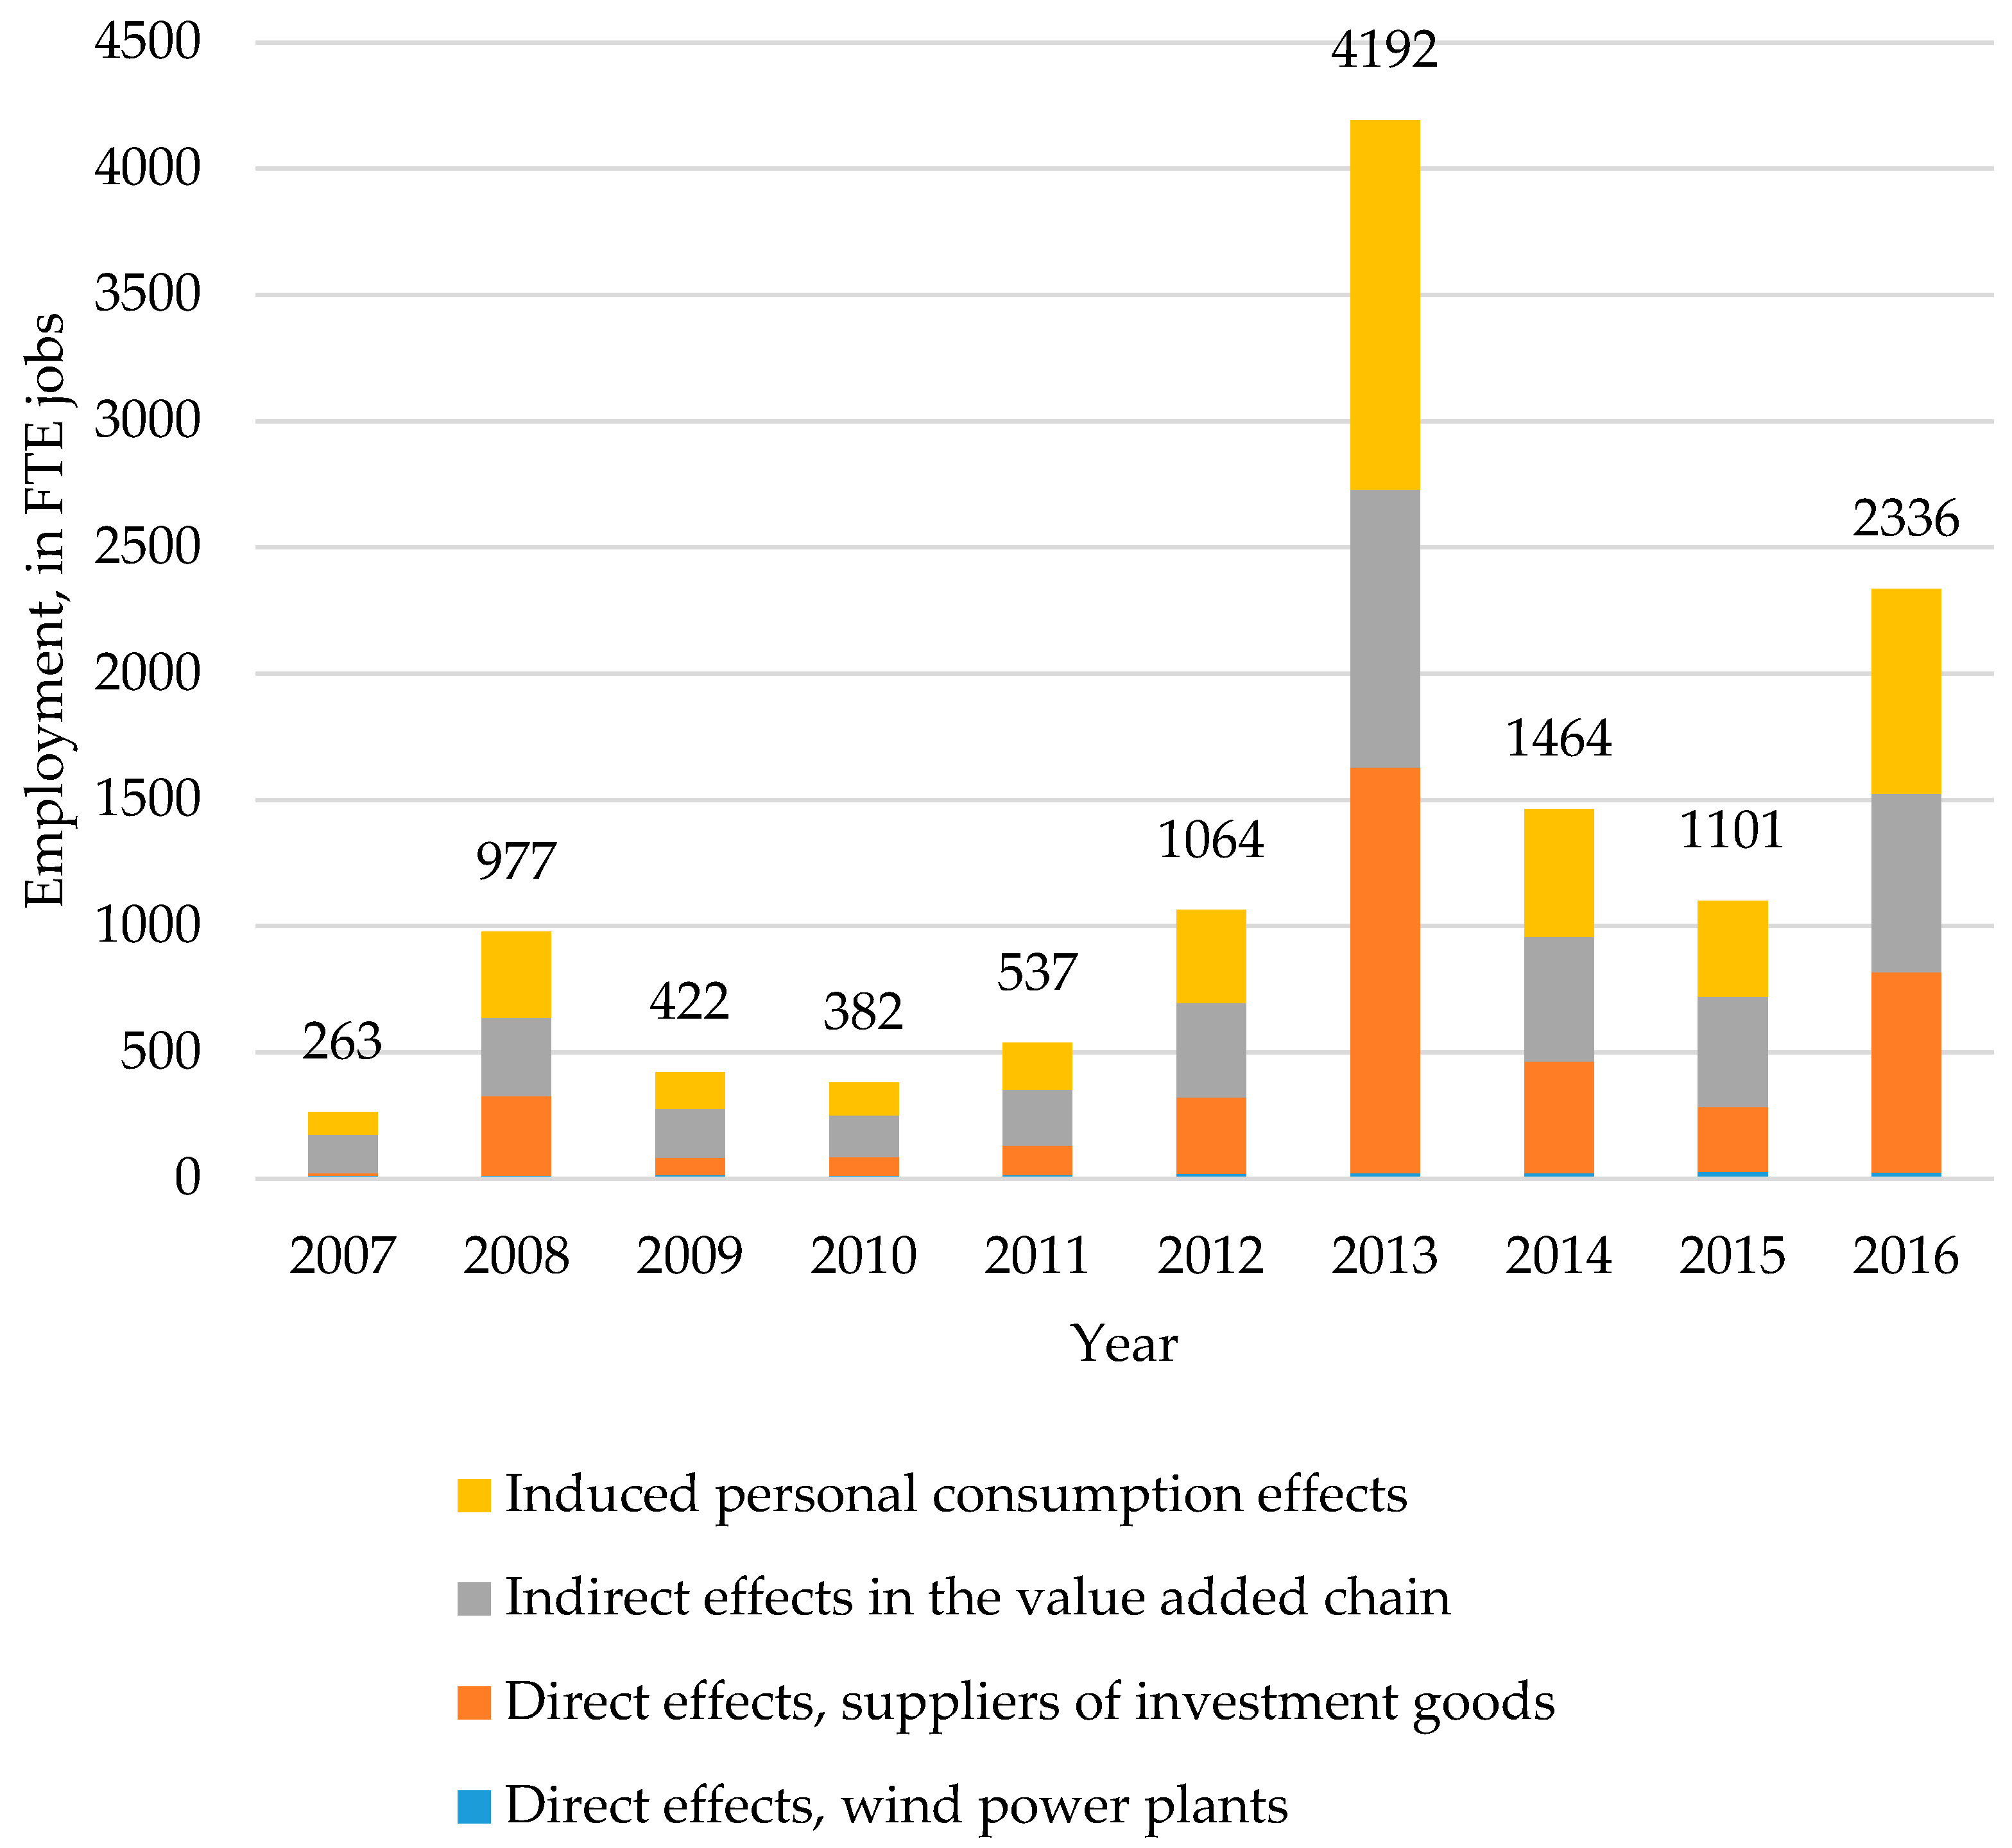
Table 5). In 2013, wind power plants generated 3766 jobs through the investment channel in terms of FTE annual labor input. The directly generated GVA through the intermediate consumption channel accounted for approximately 72 percent of total GVA induced by the operation of wind power plants. In difference to the investment channel, indirect employment effects were more pronounced. Operation of wind power plants induced 114 million euros of GVA and 481 FTE jobs in the Croatian economy in 2016.
Figure 1 suggests that the direct effects prior to 2010 were low in the analyzed period, followed by an increase in the direct effects of the wind power plants. This is a consequence of increased investments in the wind power plant deployment due to the preferential feed-in tariff system policy. The strong growth of investments indicates the investors’ perception of the sound financial viability of wind power plant deployment under the existing feed-in tariff system. As with direct effects, indirect and induced effects of wind power plants also increased in relation to the overall value added chain. The highest total effect values were recorded in 2013 when most existing wind power plants started to operate. After this, investment intensity decreased despite the deployment of additional wind power plants in subsequent years. As already stated, the increased volume of electricity produced by wind power plants exerts positive effects on the Croatian economy. The trends of total employment effects induced by wind power plants (
Figure 2) generally follow the same trend as GVA. Hence in 2013, when the investments in wind power plants were most pronounced, wind power plants induced the total employment of 4192 persons, if both investment and intermediary consumption channels are added together.
5. Discussion
Recent literature analyzes the economic effects of wind power plants on the national economy using various economic and econometric methods. Most studies concentrated on the socioeconomic effects in developed European economies and the USA; global leaders in the technological development of wind turbines and other RES equipment. Most studies use the employment induced by deployment of wind power plants as the synthetic indicator of total economic effects. The novelty of this paper relates to the quantification of economic effects in Croatia, an economy with a relatively smaller share of the domestic component in the production of equipment incorporated into wind power plants. Results presented in the previous chapter indicate positive indirect and induced economic effects on supporting activities, even if most of the equipment originates from imports.
This section discusses the results of this study in the context of previous research. Key findings of the papers dealing with the economic effects of wind power plant deployment are summarized by
Table A1 in the
Appendix. The recent literature on the economic effects of RES deployment applies a variety of methods. First part of the table presents key findings of econometric modelling and thematic surveys while the second part groups papers where the input-output analysis was applied. This paper follows the approach found in the majority of the research, applying the standard input-output model. However, as suggested by
Table A1, the positive indirect and induced economic effects of RES plants are generally present, regardless of the applied model: input-output [
12,
13,
15,
16,
17,
18,
19,
20,
21,
22,
23,
32,
33,
34], econometric modeling [
6,
7,
9,
11,
14] or survey method [
5,
10]. The results in this paper confirm that positive indirect economic effects are present in Croatia as well.
Total effects on GVA or employment per unit value of investments in Croatia are lagging behind the effects estimated for technologically advanced economies with a higher share of domestic production of wind turbines and other major components of RES plants, such as the USA [
10,
11,
12,
13,
15,
21], Germany [
33], UK [
23], Denmark [
19] or total EU [
7,
16]. Part of the indirect and induced effects of RES investments located in Croatia are transferred abroad towards economies that export equipment required to develop wind power plants. However, positive effects are still present, especially for transport, construction, maintenance, and other sectors that support the deployment and regular operation of wind power plants.
Different to previous results of more significant short-term effects on job growth [
33], the Croatian case shows that the number of persons employed per 1 million euros of revenues during regular long-term operation is not significantly lower than employment induced by 1 million euros of investments (
Table 6 and
Table 7).
Besides the quantification of the total direct, indirect, and induced effects induced by the wind power plants, the input-output analysis provides insights into the sectoral distribution of the wind power plant deployment effects. Those effects stem from inter-sector relationships between wind power plants and other domestic entrepreneurs. The presentation of results based on economic sectors is shown on the aggregate level, as shown by
Table A2 in the
Appendix.
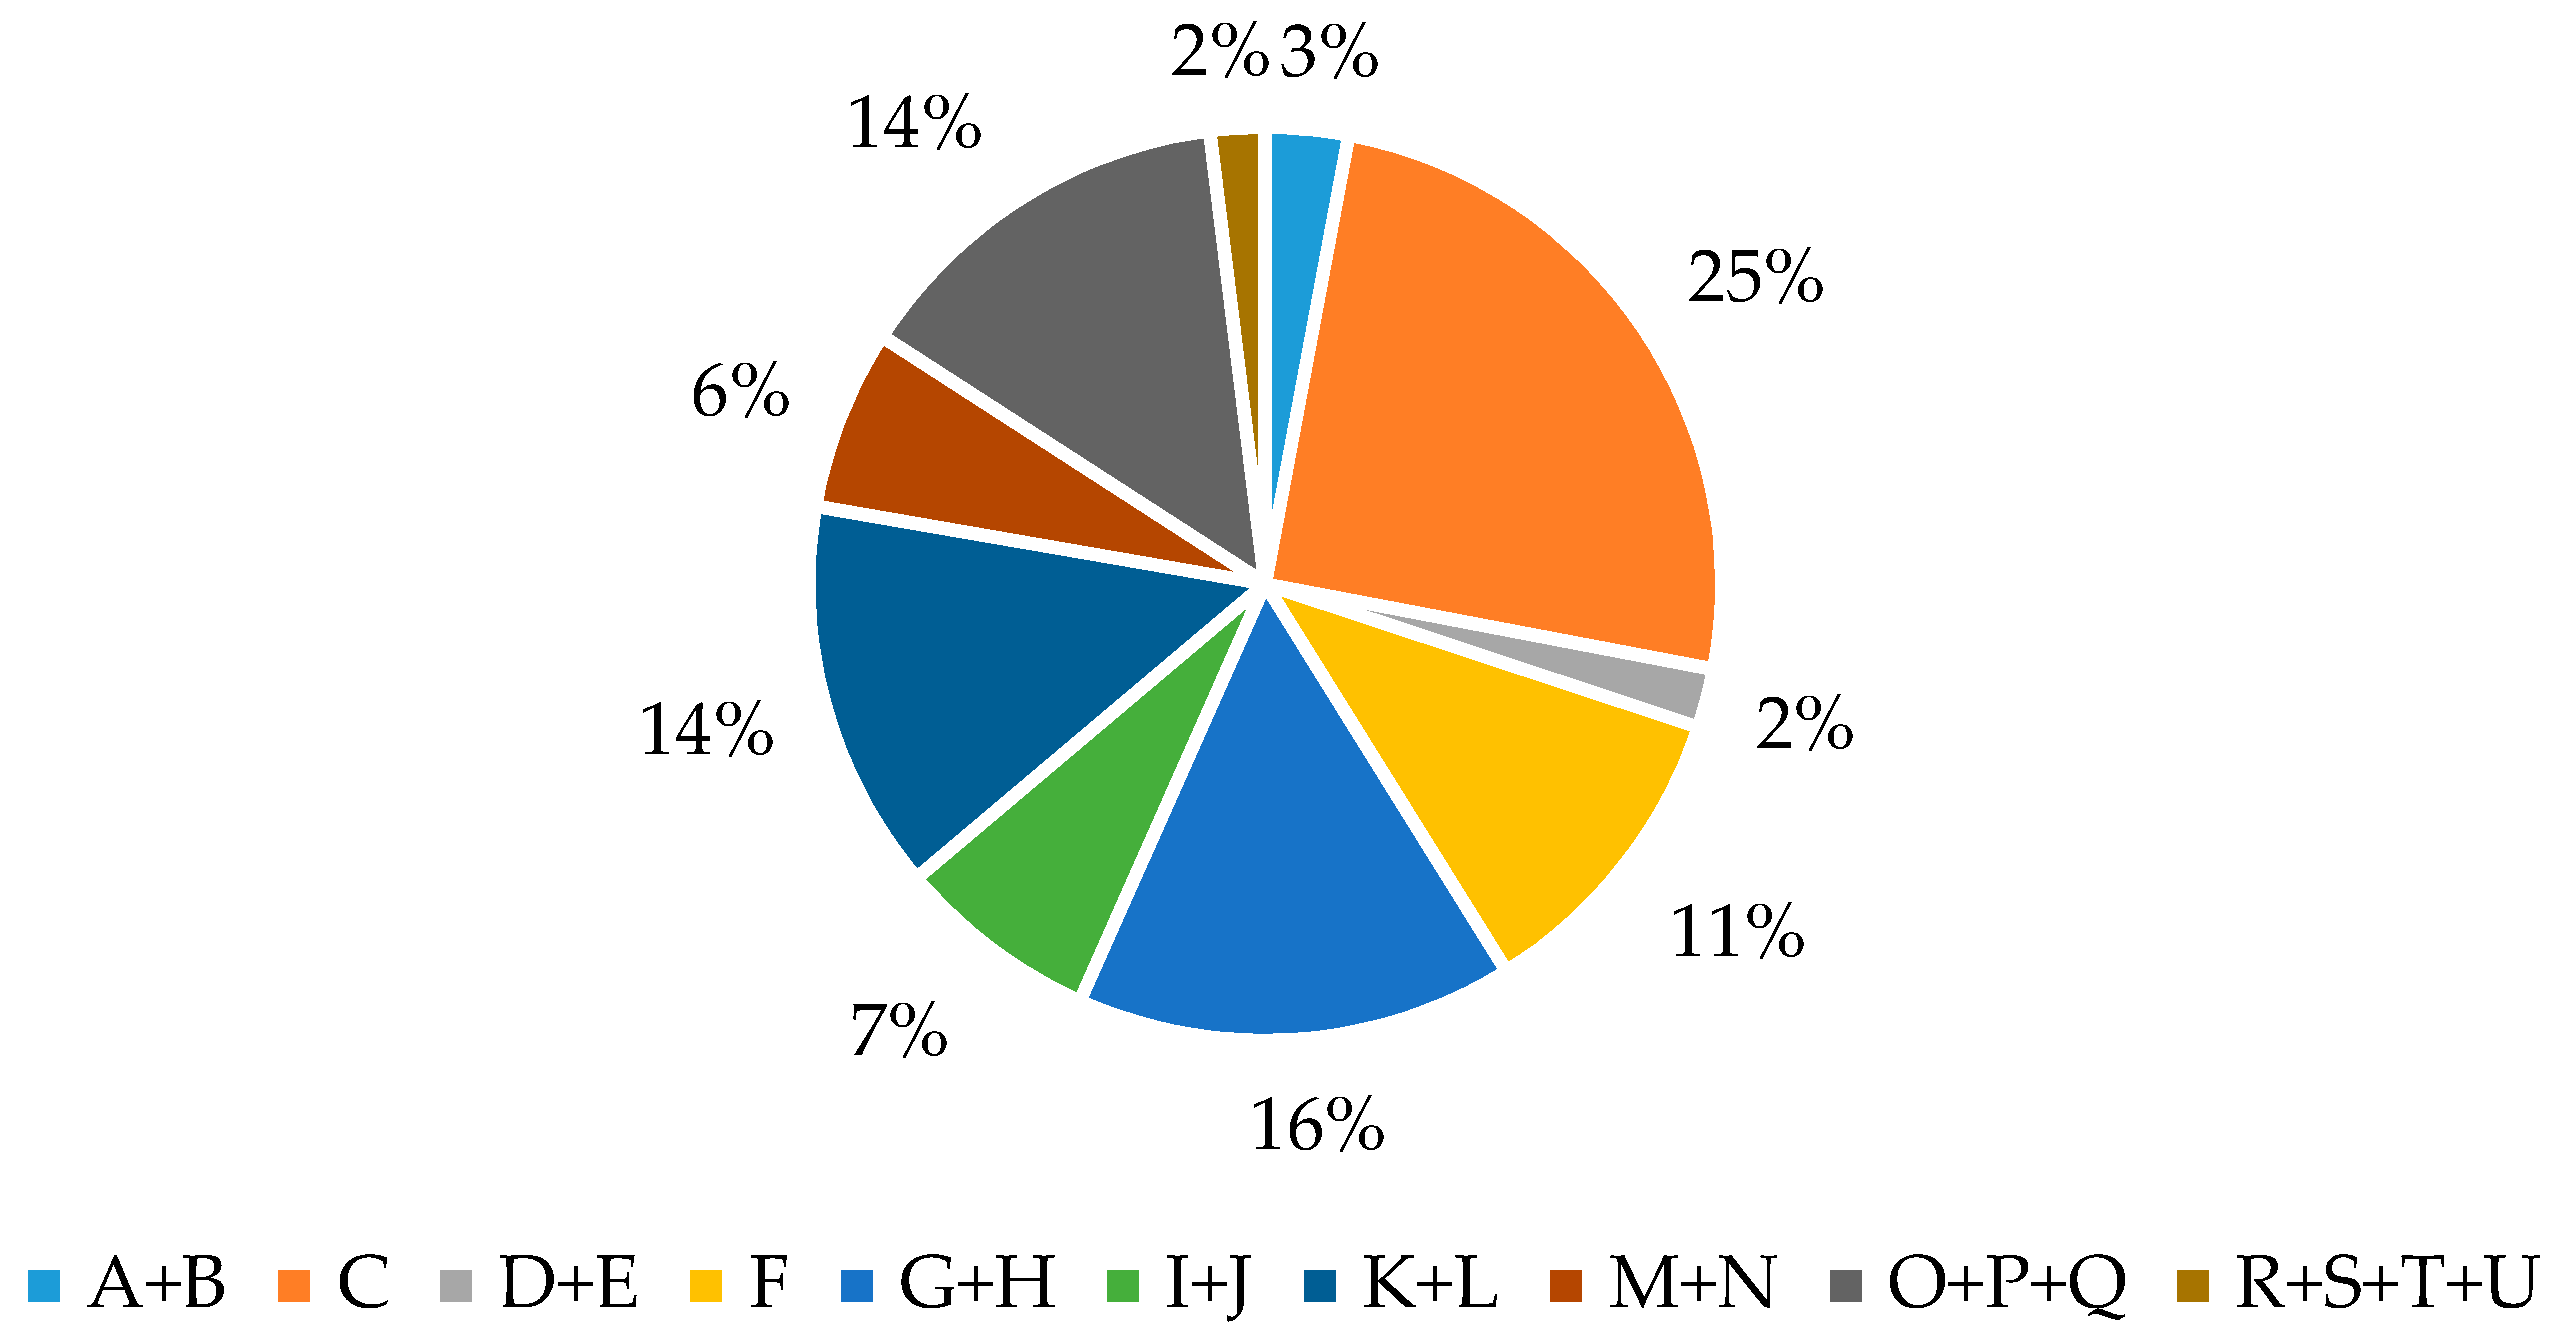
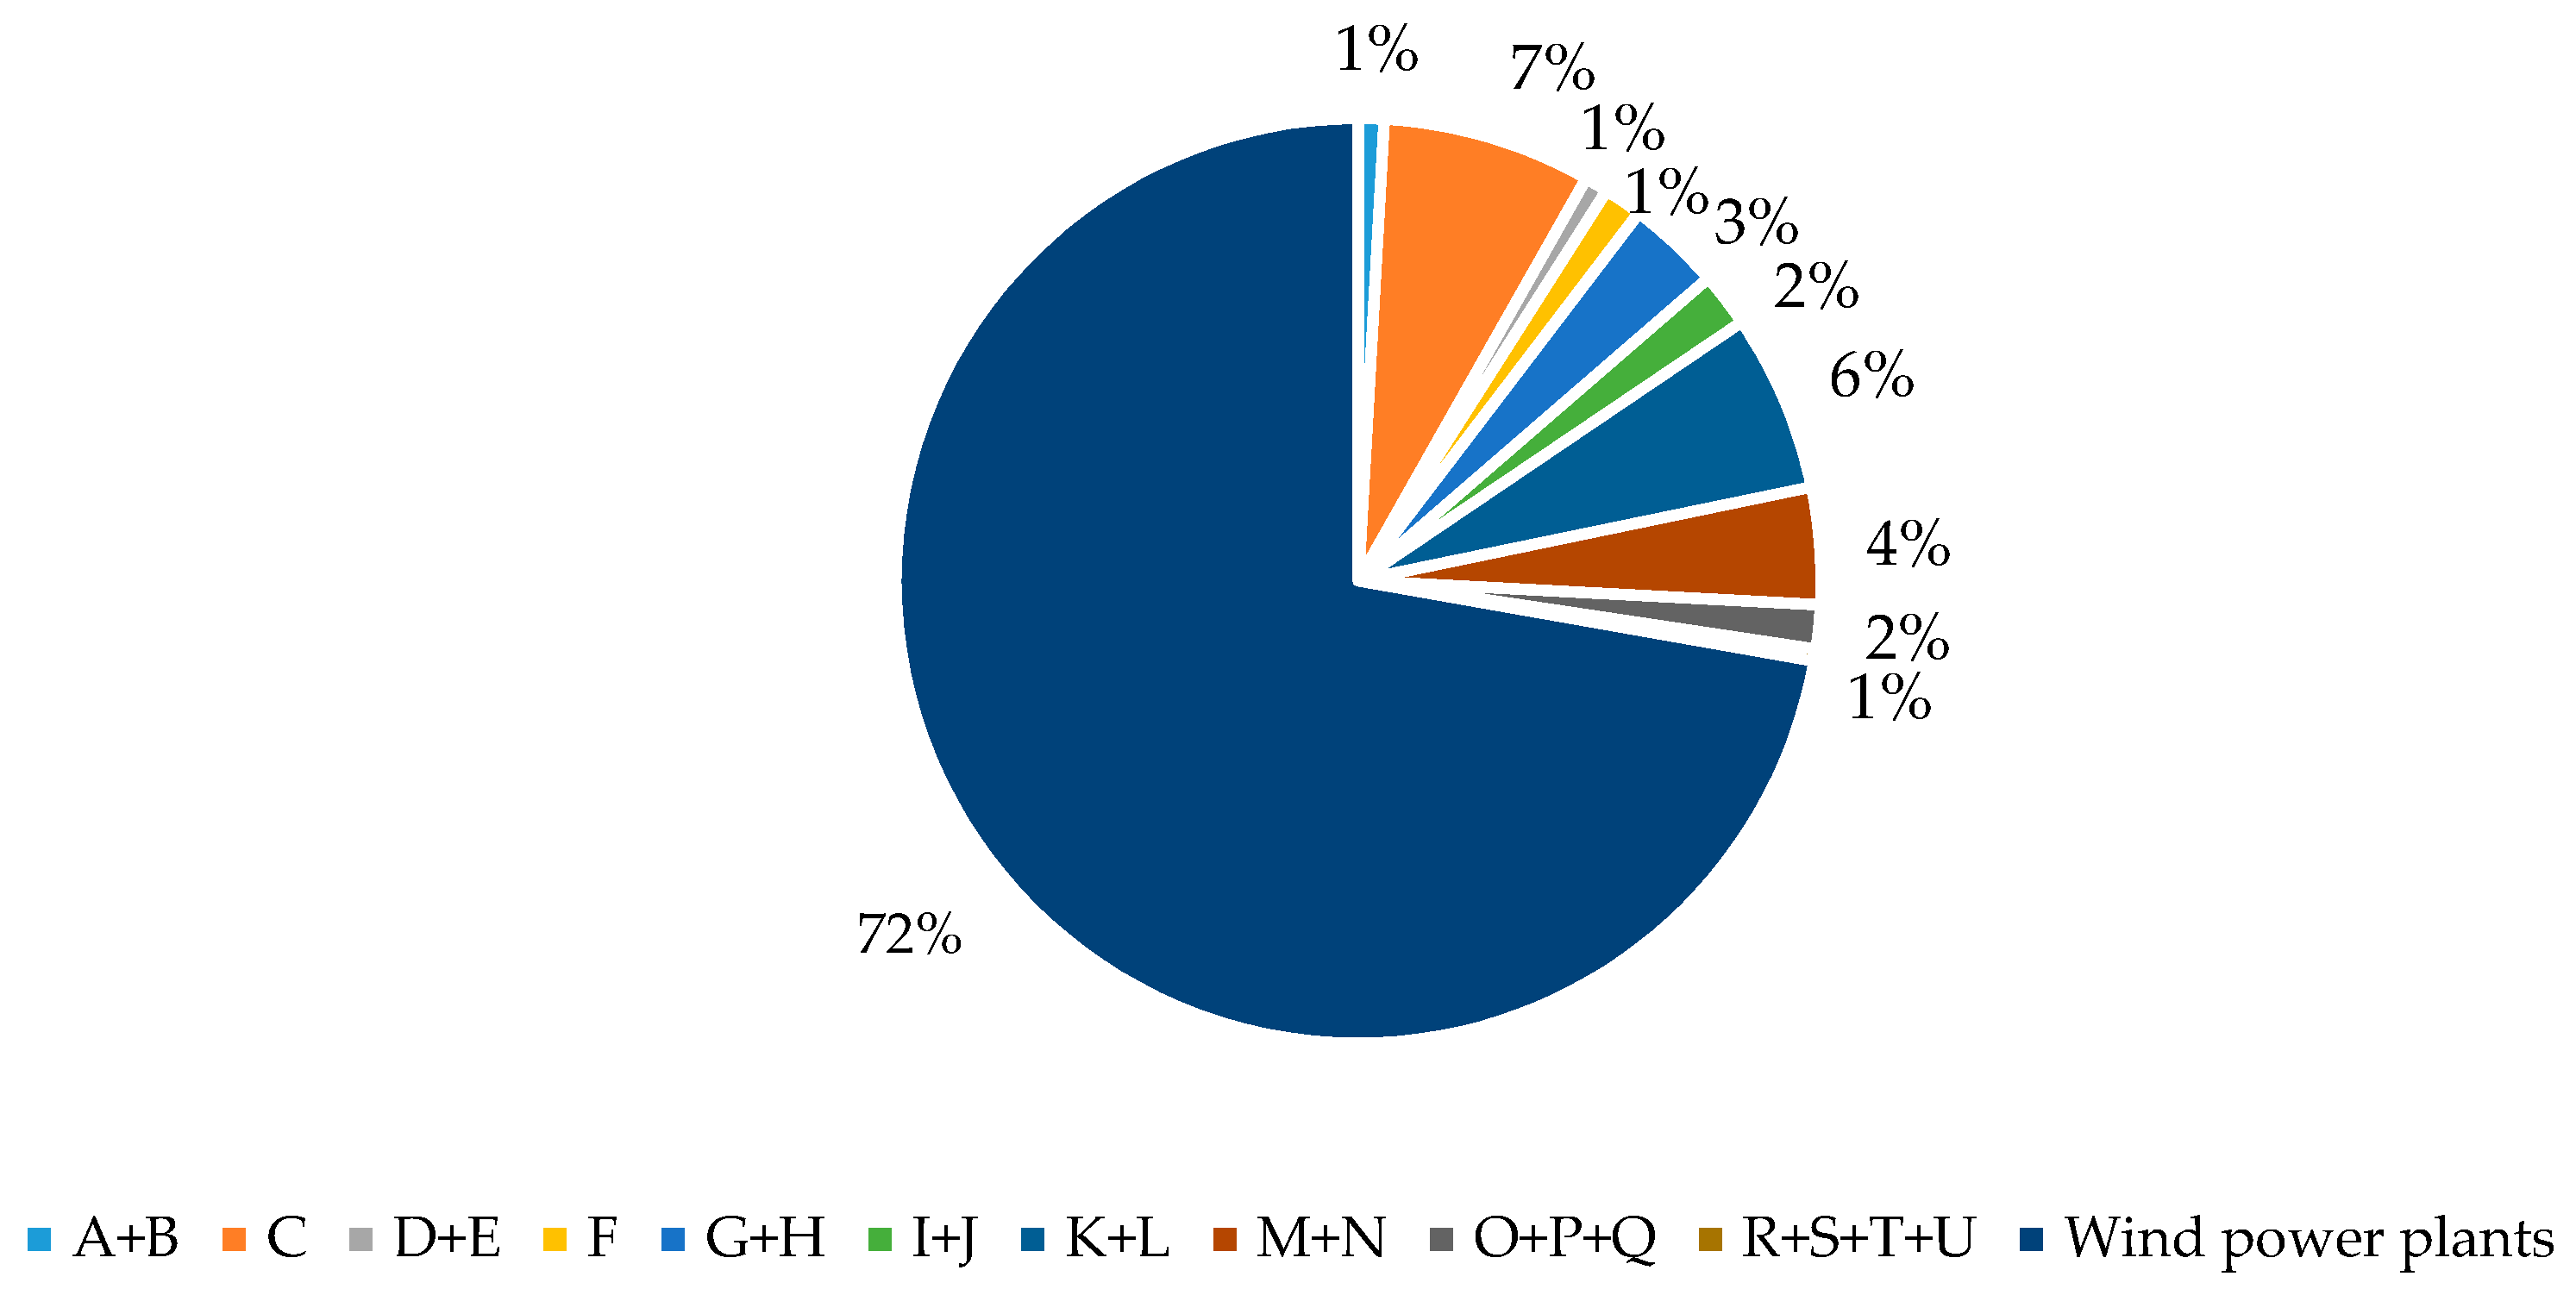
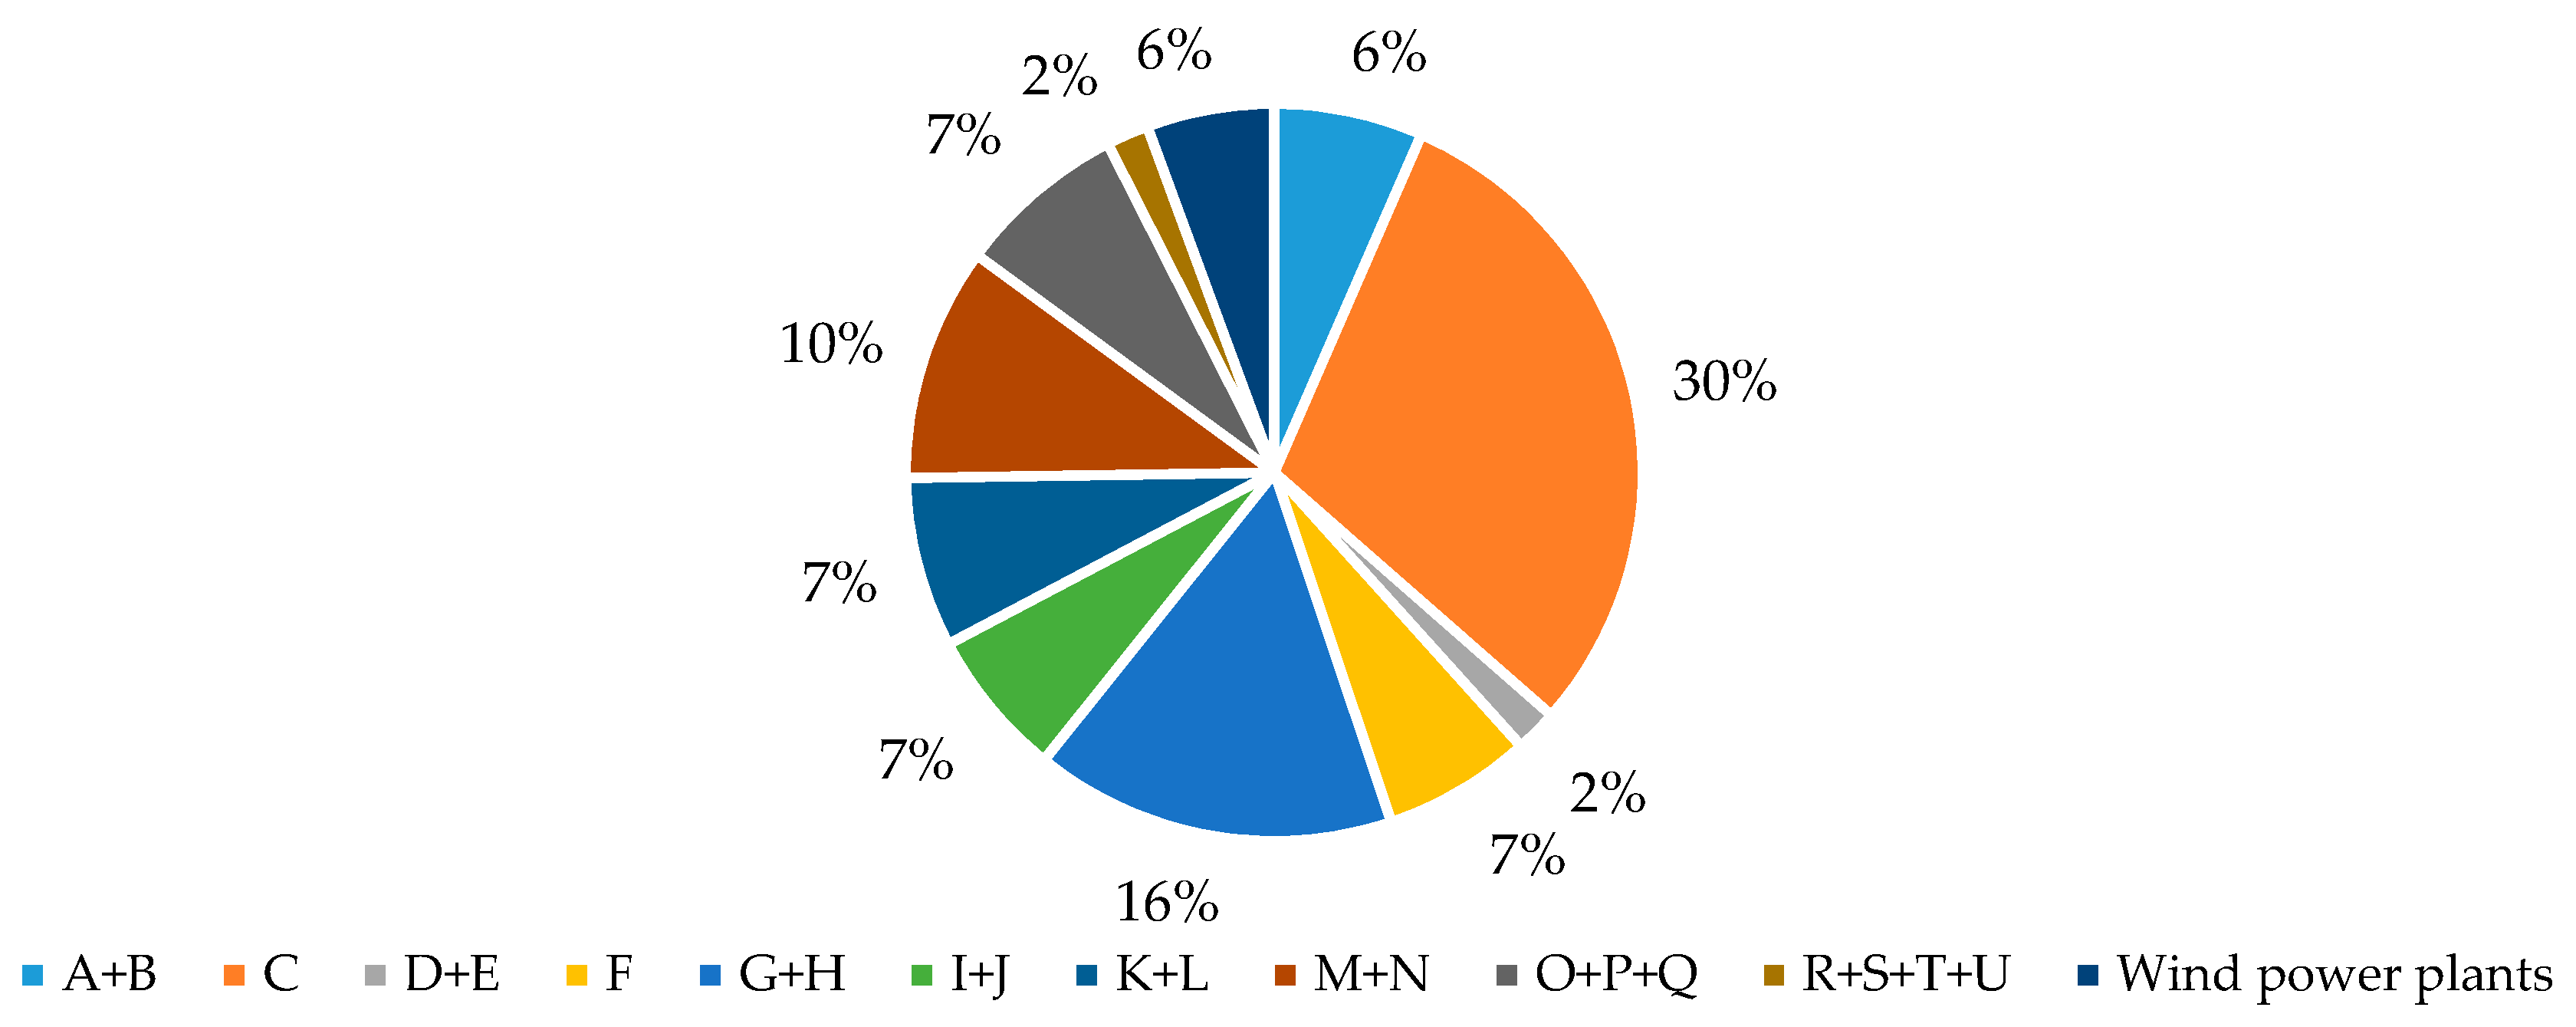
Regarding the structural characteristics of the economic effects of wind plants, the greatest indirect effects refer to activities that deliver the equipment required for wind power plant deployment or intermediate inputs during the operating period. One quarter of the total GVA induced by wind power plants through the investment channel by 2016 related to area C (manufacturing industry), and mostly sector C28—production of machinery and equipment, where total effect on gross domestic product amounted to 36.2 million euros (
Table 6). Apart from area C, wind power plants deployment and operation affect various business activities classified as services and trade (divisions classified in sections G + H, O + P + Q and K + L in NACE Rev. 2 classification), as is also shown in
Figure 3 and
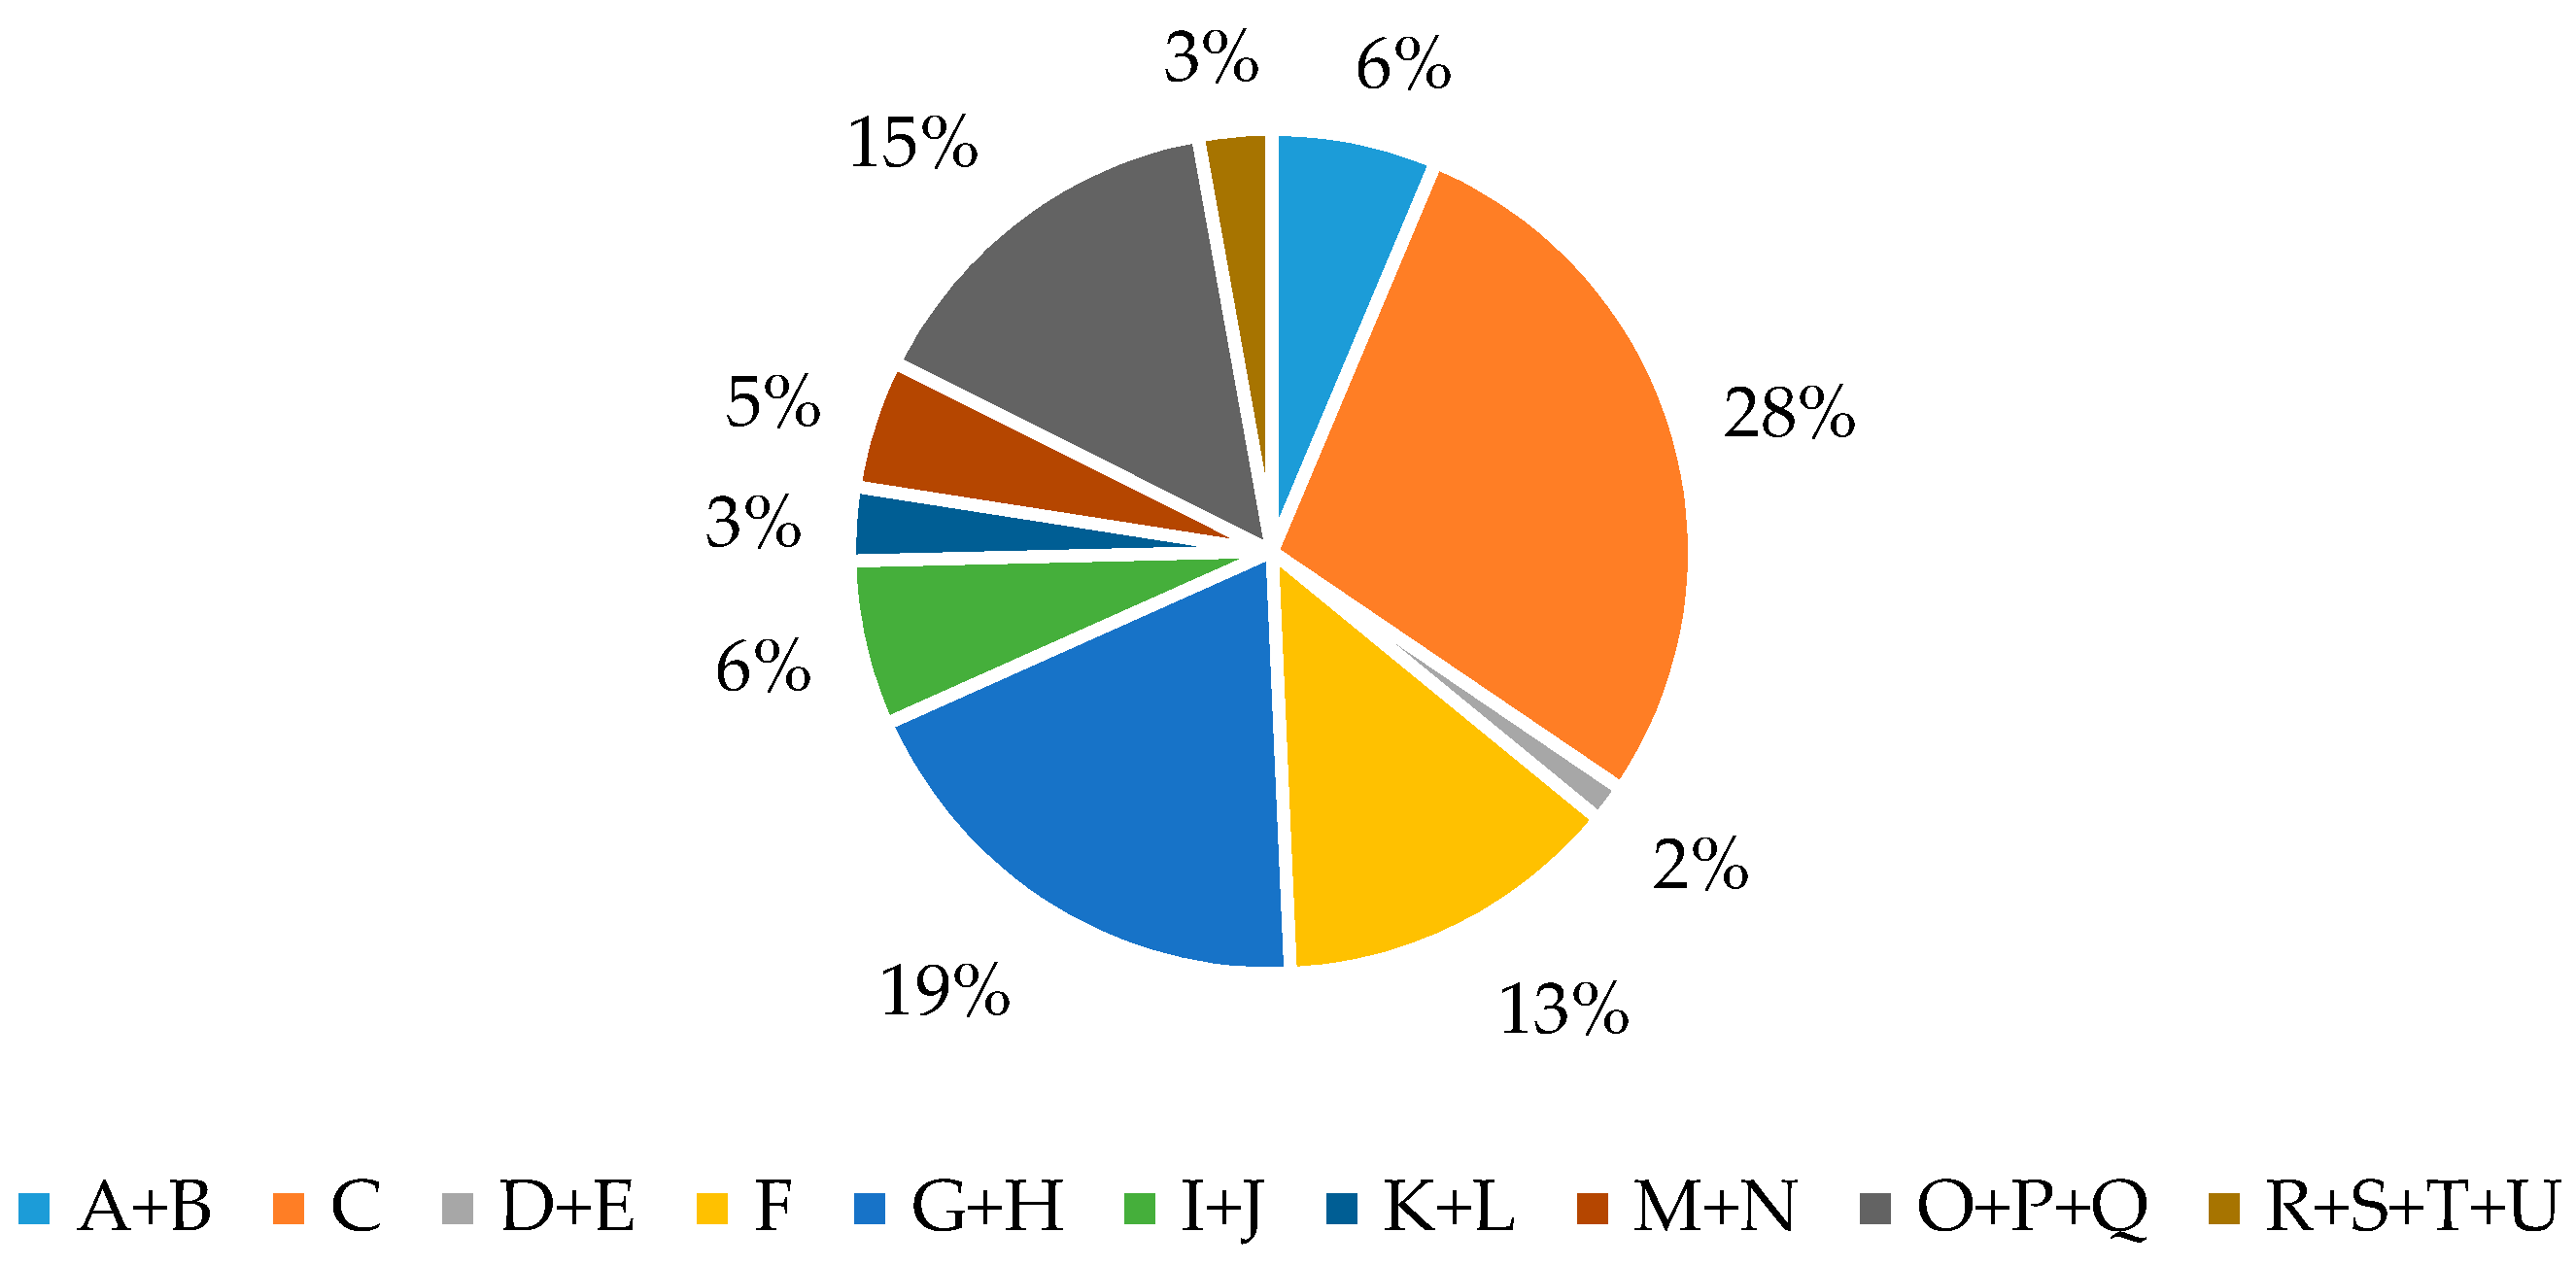
Figure 4. The same sectors dominate if, instead of GVA, the employment effects in the investment channel are analyzed. The highest GVA and employment effects through the intermediate consumption channel were recorded for sectors classified in C, K + L, M + N (
Table 7 and
Figure 5 and
Figure 6).
Almost three quarters of the total GVA induced by regular operation of a wind power plant relates to the direct effects; i.e., GVA distributed to plants. On the other hand, because of the high capital intensity and low direct labor requirements, wind power plants require only 6% of the total number of induced jobs during regular operations, while employment effects are most pronounced for manufacturing industry and supporting services.
It is noticeable that the structure of the economic effects in Croatia is, to a degree, different in comparison to technologically advanced economies, as is evident from previous research for the USA [
13], UK [
18], Germany [
33] or Denmark [
19]. Sectors that produce most of the equipment required for deployment (manufacturing industry), especially Classification of Products by Activities (CPA) sectors C24_C25, C26_C27 and C28, comprise only one quarter of total GVA effects. On the other hand, the share of effects related to construction, trade and other supporting services in total effects is more pronounced than in other economies.
Although the input-output model is most frequently applied for the quantification of total effects of wind power plant deployment, results of this approach have some weakness and limitations. The main assumption of the input-output model is the existence of fixed technological coefficients. In other words, the share of intermediate inputs delivered by sector
i to sector
j in the output value of sector
j is assumed to be constant over the analyzed period. However, technology, especially in sophisticated industries as the development of equipment required to deploy wind power plants could change over a longer period of time as a result more efficient production processes or changes in relative prices [
25]. An additional disadvantage of the input-output approach relates to the assumption of the constant share of domestic and imported intermediates. This could result in biased estimates if the change in relative prices potentially affects the input-output coefficients. Currently, the last available input-output table for Croatian economy is for 2010 as the reference year. The stability of technical coefficients and their impact on the results is the subject of future research when a more up-to-date input-output table becomes available. According to previous studies, potential errors in quantification of induced effects in a closed model relates to strict assumptions on the stability of the relation between labor incomes and consumer spending [
24,
25]. In the real word, total effects are probably located in the middle of the interval estimated by type I and type II multipliers [
25].
In the previous period, offshore wind power plants were not explored as a potential investment opportunity in Croatia. As highlighted in the literature review [
34], offshore wind is a capital intensive sector and investment costs per capacity are higher in comparison to other RES plants. However, taking into consideration the significant development of the offshore wind industry in the past few years, as well as the fact that Croatia has a long coast in the Adriatic Sea, a potential for development of offshore plants will be subject to a more in-depth technical and economic analysis. Assessment of potential for offshore wind plants should be based on an integrated approach, as suggested by previous studies [
35,
36].
6. Conclusions
With the aim of achieving the strategic goals of reducing environmental pollution from the emission of CO2 and other pollutants, Croatia has decided to support the production of energy from renewable sources. The procedure for the entry of certain types of RES plants into the feed-in tariff scheme has been defined in 2010. Investors contract the long-term purchase of produced energy with the government agency HROTE at supported prices, which are higher than the market electricity prices. The feed-in tariffs scheme has led to significant positive results, achieving the goal of a 10% share of energy produced from new RES plants included in the scheme a few years before the planned deadline in 2020.
The research in this paper focuses on quantification of the indirect and induced economic effects, resulting from the energy policy measures that support wind power plant deployment. Incentivizing investments in wind power plants contributes positively to the economic activity of equipment suppliers and also related contractors, installing, and maintaining such equipment. Increasing activity of producers of RES equipment and intermediate inputs leads to an increase in employment and induces an additional income for the household sector, in support of previous research findings. The production of wind turbines and other equipment necessary for wind power plants is not yet developed in Croatia. The novelty of this research primarily relates to the finding that even economies that are oriented towards "foreign" technology in the deployment of wind power plants recorded socioeconomic benefits effects if indirect and induced effects are included. Total effects are somewhat less compared to the results from recent research, which is generally focused on industrially developed countries. However, Croatian producers participate in equipping power plants, especially with services for installation, construction works, transport, and other supporting services.
In the period of intensive investments in wind power plant deployment, their effect on overall employment in the Croatian economy accounted for more than 4000 persons. The planned quota for applying the system of feed-in tariffs for energy produced in wind power plants was fulfilled significantly before the planned deadline and investment activity has recently decreased. Therefore, the economic effects in the recent period include the effects in the intermediate consumption channel, which continue to be important and contribute to employing almost 2500 people annually. However, the input-output approach has some limitations regarding the stability of technical coefficients and import contents. When a more up-to-date input-output table for the Croatian economy becomes available, future research will focus on testing the robustness of the results.
The new energy strategy of the Republic of Croatia for the future long-term period is currently being developed in 2018, but it is widely expected that the share of RES energy will increase further. If the industrial policy measures are better linked to the energy strategy, the inclusion of domestic producers in the overall value added chain of particular components for the equipment may well increase. As a result, the total effects of wind power plant deployment in the future may become even more significant.


