Design and Experimental Study of HTSG for Waste to Energy: Analysis of Pressure Difference


Energy Efficiency and Materials Research Division, Korea Institute of Energy Research (KIER), Daejeon 34129, Korea
*
Author to whom correspondence should be addressed.
Energies 2018, 11(7), 1815; https://doi.org/10.3390/en11071815
Submission received: 18 June 2018
/
Revised: 4 July 2018
/
Accepted: 5 July 2018
/
Published: 11 July 2018
Abstract
:The purpose of the present study is to analyze pressure difference changes inside a high-temperature steam generator (HTSG), which produces steam using the heat generated by waste incineration and decreases the pressure of the produced steam while increasing its temperature. The high-temperature, low-pressure steam produced by a HTSG is used for hydrogen production. Therefore, the steam temperature must be at least 700 °C, and the pressure must be lower than 300 kPa; hence, a device is needed to increase the steam temperature in the boiler and decrease the steam pressure. The physical behavior of the device was modeled and experimentally validated. The modeling and experimental results demonstrated good agreement when the steam was not preheated; however, an additional pressure drop required consideration of the opposite case.
1. Introduction
Waste to energy (WtE) has the advantages of reducing waste and transforming the energy obtained during incineration to a new form of useful energy [1]. In addition, the waste heat that is dissipated during incineration can be used to generate steam in a waste heat boiler, which can then be used directly or supplied to a turbine for power generation [2,3].
In cases when steam is generated and used directly near demanding locations, the steam temperature typically ranges between 125 and 180 °C [4]. This temperature range is obtained without a superheater due to the requirements and economic feasibility. When a superheater is not installed, low-temperature corrosion needs to be considered because the water vapor in the air accelerates chemical changes [5,6].
WtE thermochemical technology typically includes incineration, thermal gasification, and pyrolysis methods. In the incineration method, waste is burned at temperatures above 1000 °C. However, the conventional temperature of the thermal gasification method is 750 °C, and the conventional temperature of the pyrolysis method ranges between 300 and 800 °C, which occurs at a higher pressure and in the absence of oxygen. However, the practical temperature and pressure at which the steam is produced in the waste heat boiler is approximately 400 °C and 40 bar, respectively, due to high-temperature corrosion problems [7,8]. Extensive research on materials has been recently conducted to overcome this challenge. Zieliński et al. [9] introduced a material with an austenitic structure (HR6W, Sanicro 25) that has stability up to 750 °C. In particular, Sanicro 25 was proven to remain stable for more than 2000 h at 700 °C. Zeng et al. [10] investigated the tensile properties, microhardness, chemical composition distribution, and microstructure of the BTi-6431S titanium alloy, which can be used in applications up to 700 °C. Furthermore, Wright et al. [11] examined the properties of Alloy 800H and Alloy 617 for nuclear plants and asserted that their operating temperature range was 750–800 °C in the steam generator. Dewa et al. [12] also analyzed the fatigue properties of Alloy 617 and stated that its maximum design temperature was 950 °C.
Among the technologies available for hydrogen production, the operating conditions and characteristics of fuel cells vary depending on their constituent materials. Some examples include the electrolyte-type alkaline fuel cell, the phosphoric acid fuel cell, the polymer electrolyte membrane fuel cell, the molten carbonate fuel cell, and the solid oxide fuel cell (SOFC). The objective of this work is to produce steam for hydrogen production using heat, and thus the SOFC is considered, as it has an operating temperature range of 600–1000 °C [13]. In addition, the minimum operating temperature of the SOFC is 700 °C, and the efficiency increases along with the heat source temperature [14].
The use of hydrogen and power generation technologies that exploit the steam obtained from the heat generated during waste incineration is expected to help reduce the effects of global warming and environmental pollution. Despite their advantages, hydrogen production technologies that leverage wastes have not yet been commercialized owing to the lack of advanced technology required to generate the high-temperature steam (greater than 700 °C) using waste.
Therefore, this paper presents the design of a high-temperature steam generator (HTSG) having a structure that can be inserted into an incinerator to produce high-temperature steam over 700 °C. The steam passing through the HTSG is designed to be heated and expanded because the pressure must be reduced due to SOFC durability. The pressure characteristics of the proposed HTSG are analyzed herein.
2. High-Temperature Steam Generator (HTSG) Design
When the steam generated using waste incineration heat is used directly, the steam temperature ranges between 125 and 180 °C [4]. Therefore, the design temperature considered herein is 151.9 °C, which corresponds to the saturation temperature at the design pressure of 500 kPa. The processes illustrated in Figure 1 are required to lower the pressure below 300 kPa while increasing the temperature above 700 °C. In Process A, the steam is first heated at the proposed inlet conditions, and the pressure is subsequently reduced. Contrarily, Process B first reduces the pressure and then heats the steam. Process A generally exhibits higher exergy than Process B. However, devices that expand the heated steam above temperatures of 700 °C will face durability issues and are considerably more expensive than those designed for relatively low-temperature ranges. As a result, the HTSG of this study is designed considering the aspects of both engineering and energy.
In a typical closed-loop system, the pressure and temperature rise simultaneously. Since the HTSG proposed herein heats the steam using the high waste incineration heat (1000 °C) [7], which is a sufficient heat source, the heat transfer area can be sufficiently enlarged while forcing the pressure to drop.
Figure 2 depicts the proposed HTSG, wherein different variables are used to describe each component for the purposes of modeling the pressure drops. The heat transfer area corresponds to the total height (), which is installed in the combustor for the experiment. The heat transfer area was obtained from Equation (1). Where, the heat loss is generally higher at high temperature ranges. In the combustor, the heat loss was assumed to be 30%, because the heat loss due to fouling is large [15,16].
Furthermore, the overall heat transfer coefficient was computed using Equation (2).
The Gnielinski correlation [17] was employed to compute the Nusselt number and obtain the internal and external heat transfer coefficients (Equation (3)). The internal and external fluids were assumed to be steam and air, respectively.
The ratio of the diameter () to the total height () of the HTSG was calculated using Equations (1) and (4) and resulted in a ratio of 1:2. The design lengths of the diameter and total height were approximately 0.35 m and 0.7 m, respectively. In general, as the length of the total height increases, the streamline length increases; however, the outlet velocity decreases at the same time. Therefore, the diameter and the total height were selected such that the flow of steam was smooth. In this study, a laboratory scale experiment was conducted beforehand, and the HTSG material was SUS310. The thermal conductivity of SUS310 is similar to that of HR6W [9] at temperatures below 400 °C, as shown in Figure 3, however, its conductivity differs from that of HR6W at temperatures above 400 °C. Further analysis on this discrepancy would be necessary prior to actual site applications.
3. Pressure Difference
The size of each HTSG component was determined to generate a reduced pressure while using the HTSG. The inner diameter () at the inlet was approximately 0.008 m, the outlet inner diameter () was approximately 0.025 m, and was designed to be longer than HHTSG. Moreover, the angle of the pipe from the entrance to the HTSG inlet was established as 5°. This value was selected to minimize the heat loss and to avoid pressure stagnation inside the HTSG by immediately pushing the induced vortices toward the pipe outlet. If the inlet angle of the pipe is 0°, the residence time of steam at the top of the HTSG increases. This decreases the velocity of steam at the outlet of the HTSG.
Figure 4 features a schematic of the parts that affect the pressure variation inside the HTSG. In Part A, the pressure drops sharply due to the sudden enlargement, and the steam flows into the HTSG body at the HTSG inlet in a tangential direction, which causes the swirling flow in Part B. The majority of the heat transfer and pressure reduction occurs in Part B. Part C is designed to induce a vortex flow, which allows the fluid to exit directly towards the outlet; a slight pressure drop occurs due to friction. In Part D, the pressure is reduced by the sudden contraction. Subsequently, the pressure drop across each part can be computed as the total pressure drop, given by Equation (5). The additional pressure drop due to heating was obtained from the experiment.
3.1. Sudden Enlargement Part
The pressure decreases abruptly when the fluid exits the pipe due to the sudden enlargement effect [19,20]. The HTSG proposed in this study features a shape that varies from a narrow inlet area to a wider area, thus, forcing the pressure to drop. The Borda-Carnot equation was used to compute the pressure drop (Equation (6)).
where, is the coefficient of fluid resistance obtained from Karev’s experimental data [19].
3.2. Swirling Flow Part
Figure 5 illustrates the steam in the HTSG that swirls downwards in the tangential direction. The length of the streamline is obtained by the sum of L, and uniform spacing is assumed between the lines. The pressure drop is then computed using the well-known Darcy-Weisbach equation (Equation (7)) [21].
3.3. Vortex Flow Part
After passing through Part B, the fluid forms a vortex flow and concentrates at the bottom center as it enters Part C. In this case, it was assumed that the streamline of Part C was extended from Part B, and the streamline can be calculated using Equation (8) because it was assumed that was constant. When the hemispherical bottom of the HTSG is differentiated infinitely, the length of each stream is linear, and the total streamline in the vortex flow region can be obtained by integration. Here, is assumed to be the same as that in the swirling flow.
where, n is the pitch number between the stream lines. The pressure drop was computed using the Darcy-Weisbach equation [21].
3.4. Sudden Contraction Part
The sudden contraction as the fluid enters the pipe causes the pressure to drop, similar to the sudden enlargement pressure drop discussed previously [19,20]. The proposed HTSG is also designed to discharge the fluid that is concentrated at the center due to the vortex flow through the intermediate pipe. Additionally, the shape of the intermediate pipe varies from a wide to a narrower area. Subsequently, the pressure drop is obtained from Equation (9).
where, was given by the sudden contraction data in Karev’s experimental data [19].
4. Experiments
The HTSG experimental setup contained an external combustor to heat the HTSG, as depicted in Figure 6. The steam boiler supplied steam to the HTSG, and a mass flowmeter (MF, vortex type flowmeter) was installed at the HTSG inlet. The temperature and pressure at the inlet and outlet of the HTSG, as well as those of the gas that served as a heat source, were measured. To minimize the heat loss, the combustor exterior and steam pipe were insulated with 150 mm of castable and 100 mm of fiberglass, respectively. The details of each sensor are presented in Table 1.
The experimental data were obtained by averaging the values for more than 30 min after the inlet/outlet temperatures, inlet/outlet pressures, and the flow rate of steam became constant. Additionally, the steam was supplied to the HTSG inlet at a constant pressure and flow rate using a pressure regulator.
5. Results
The HTSG pressure drop model was used to obtain the pressure drops as functions of different inlet conditions. In addition, various entrance angles and changes in the outlet pipe diameter were examined to further reduce the computed pressure drop.
5.1. Modeling Results
Figure 7 shows the pressure variation as a function of the Reynolds number at the HTSG inlet, which demonstrates the effect of the sudden enlargement. As the Reynolds number increases, the higher fluid velocity causes the magnitude of pressure to drop. The magnitudes of the pressure drops are expected to increase further if higher flow rates than those proposed herein are implemented.
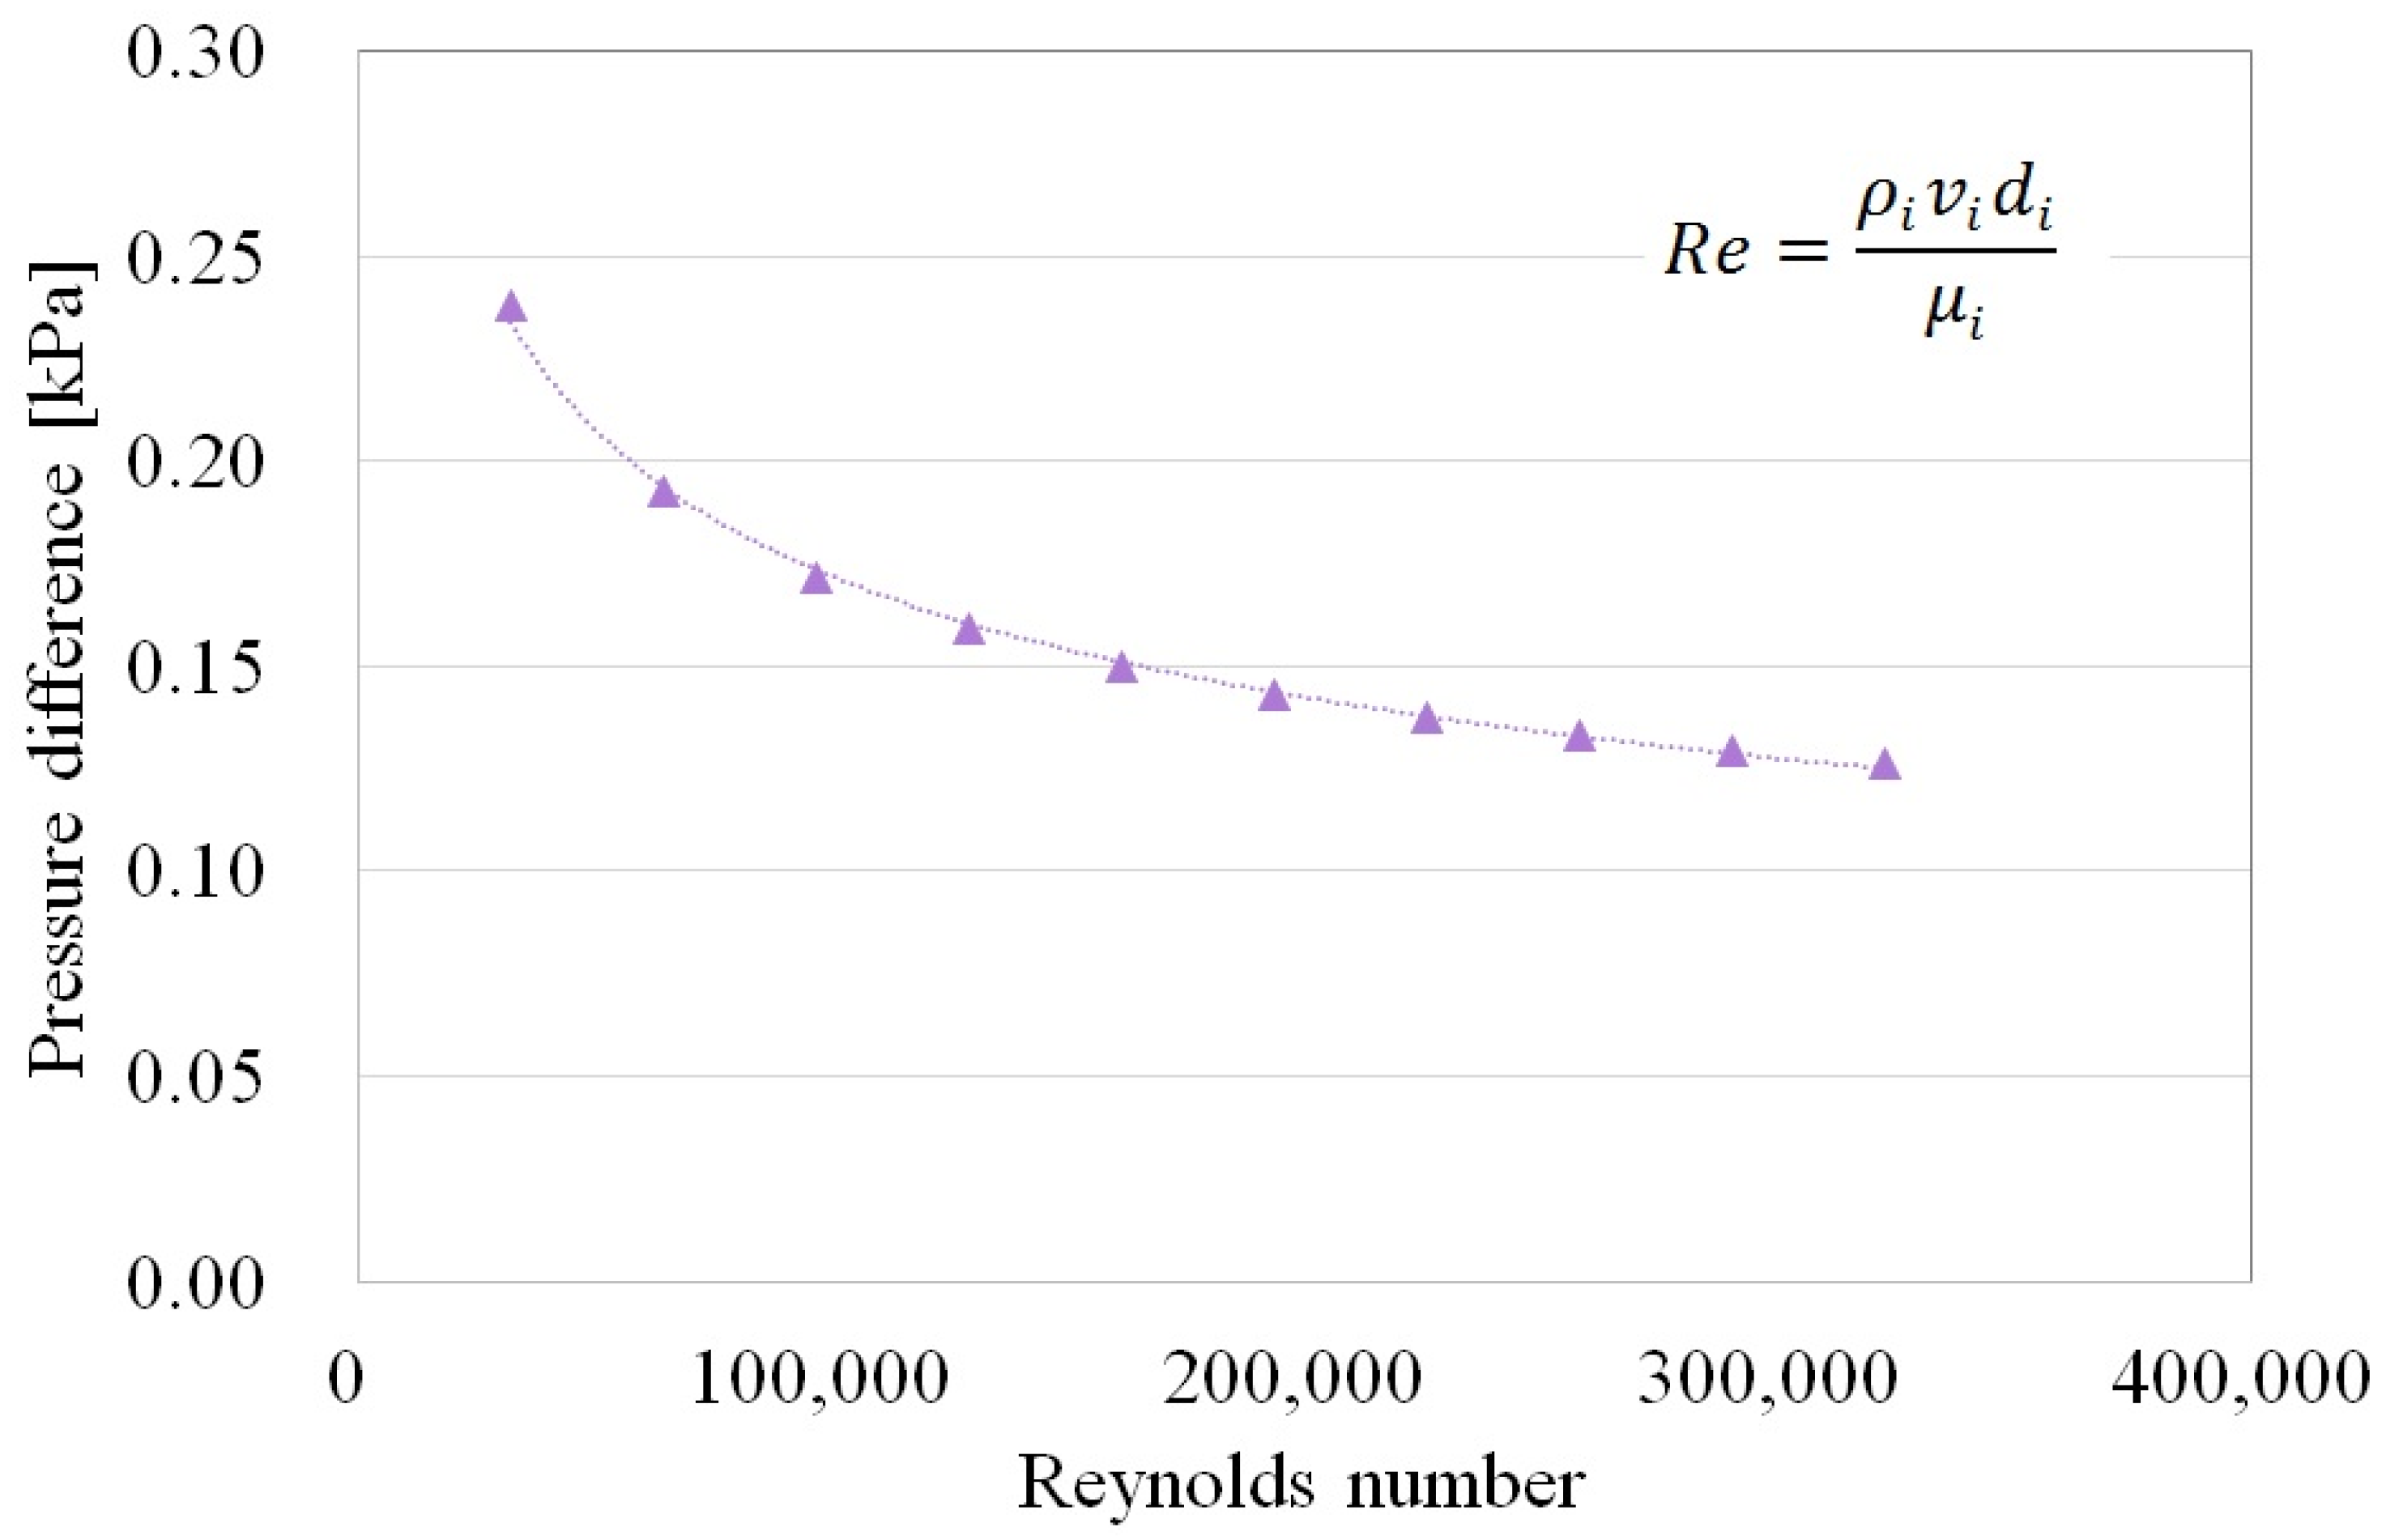
Figure 8 displays the pressure variation in the swirling flow region. The pressure drop decreases as the Reynolds number at the inlet increases due to the reduced friction factor with increased Reynolds numbers. Subsequently, the pressure drop will increase further if the flux increases at higher inlet flow rates. Figure 9 depicts the pressure variation in the swirling flow region as a function of the inlet pipe entrance angle. As the entrance angle decreases, the pressure drop increases. This is because the length of streamline increases as the angle becomes smaller. However, further reduction of the entrance angle will lead to fluid retention in the upper region of the HTSG, and the pressure will stagnate; hence, care must be taken in the design process.
Figure 10 depicts the pressure variation in the vortex flow region. The pressure drop in this region is relatively smaller than the other parts due to the smaller area, and the pressure drop decreases as the Reynolds number at the inlet increases due to the reason discussed previously pertaining to the swirling flow region.
Figure 11 shows the pressure variation in the sudden contraction region. This pressure drop is also small due to the relatively large size of the discharging pipe. The pressure drop increases with increasing Reynolds number, similar to the sudden enlargement region. Figure 12 depicts the pressure variation in the sudden contraction region with respect to different outlet pipe diameters, where the pressure drop increases as the pipe diameter decreases. However, if the outlet pipe diameter is further reduced, the pressure inside the HTSG will stagnate; thus, careful consideration is required in the design process.
5.2. Experimental Results
The experiment conducted herein considered various temperatures at the HTSG inlet. The temperature was controlled by installing a heater at the HTSG inlet, and the Reynolds number was varied by changing the flow rate for a given temperature. Figure 13 shows a graph of the temperature variation as a function of the different temperatures and flow rates. The pressure drop increases with the Reynolds number and HTSG inlet temperature due to the increased fluid viscosity at the HTSG inlet.
Figure 14 compares the two cases, one where the combustor interior is heated and the other where it is not heated. When the HTSG surface is heated, the internal HTSG temperature increases, and an additional pressure drop occurs due to the high-temperature steam residing in the upper region of the HTSG, thus, pushing out the steam that enters through the inlet. Such a phenomenon is herein termed the thermo-extrusion effect, and Figure 15 shows the additional pressure variations due to this effect.
The thermo-extrusion effect is caused by the changes in the density and viscosity as the fluid is heated, as well as due to the fluid velocity change. Therefore, this effect can be described as a function of the Reynolds number (Equation (10)).
where, α = 0.00001 and β = 1.3287 within the present experimental range.
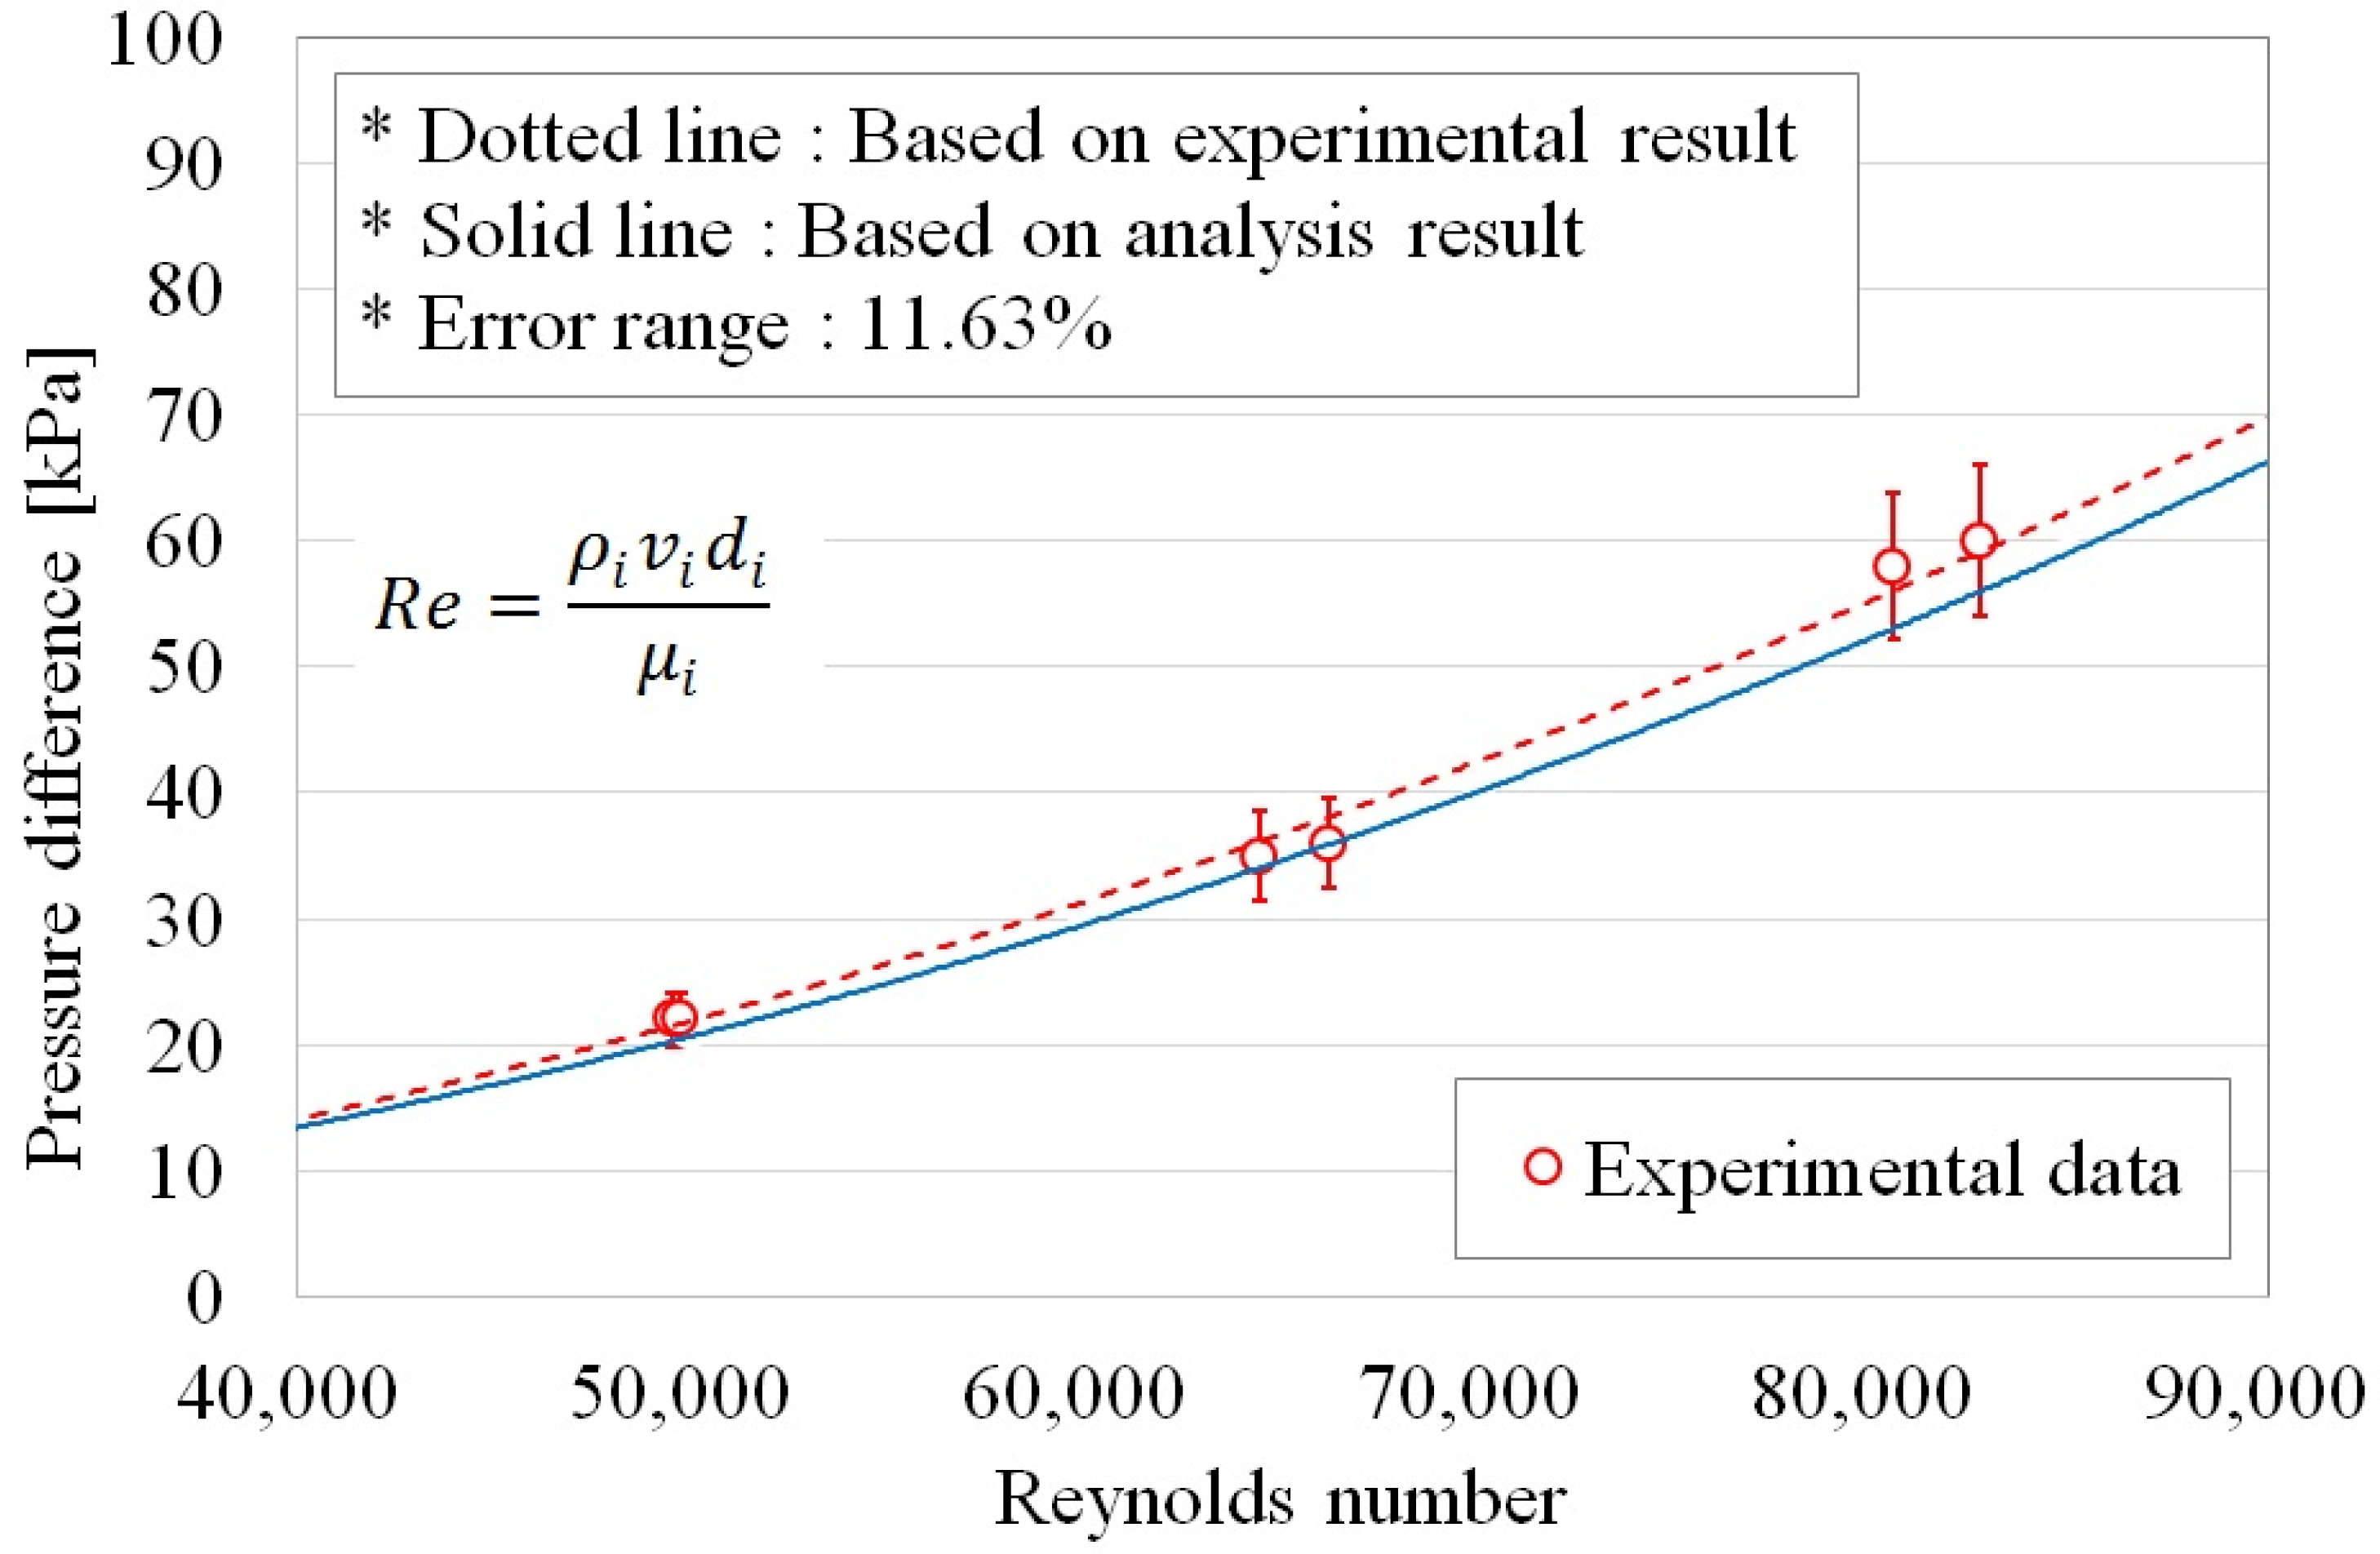
Figure 16 shows a comparison of the simulation and experimental results. The dotted line represents the linearized experimental results, and the solid line denotes the linearized simulation results. The discrepancy increases with increasing Reynolds numbers due to thermo-extrusion, the effects of which must be considered in the design process.
6. Conclusions
In this study, we examined the use of an HTSG to increase the steam temperature and reduce the pressure of the high-temperature steam that is obtained using waste incineration heat for hydrogen production. The structure of the HTSG was designed to facilitate maintenance and repair when inserted into an actual waste incinerator, and the proposed design model was experimentally validated. The structure of the proposed HTSG can be deduced from the pressure changes due to sudden enlargement, swirling flow, vortex flow, and sudden contraction when the fluid temperature remains constant. In the case when the HTSG is heated, however, the pressure variation as a function of temperature must be considered. As a result, the inner diameters of the HTSG inlet and outlet and the entrance angle must be reduced, and the streamline must be lengthened by extending the of the HTSG body to increase the pressure drop.
Author Contributions
J.J. conceived this paper and proposed the model; S.O. performed the experiments; C.C. advised the proposed paper; S.-R.P. designed the experimental device and contributed to the entire manuscript. All authors provided substantive comments.
Funding
This subject is supported by the “Technologies for Waste Recycling Policy” funded by the Korea Ministry of Environment (MOE) as the “Public Technology Program based on Environmental Policy” (2016000710007).
Conflicts of Interest
The authors declare no conflict of interest.
Nomenclature
| A | Area | m2 |
| Cp | Specfic heat at constant pressure | kJ/kg·K |
| D | Diameter of HTSG body | m |
| d | Diameter of pipe | m |
| f | Friction factor | |
| g | Gravitational acceleration | m/s2 |
| H | Height | m |
| h | Convection heat transfer coefficient | kW/m2·K |
| k | Conduction heat transfer coefficient | kW/m·K |
| L | Stream line length | m |
| ℓ | Pipe length | m |
| ṁ | Mass flow | kg/s |
| n | Number of pitch | EA |
| Nu | Nusselt number | |
| P | Pressure | kPa |
| Pr | Prandtl number | Cpμ/k |
| Q | Heat capacity | kW |
| Re | Reynolds number | ρvd/μ |
| T | Absolute temperature | K |
| t | Thichness | m |
| U | Heat transfer coefficient | kW/m2·K |
| v | Velocity | m/s |
| Greek Letters | ||
| α | Coefficient of thermo-extrusion | |
| β | Exponent of thermo-extrusion | |
| Δ | Difference | |
| η | Heat loss coefficient | |
| Θ | Angle | ° |
| μ | Viscosity | kg/ms |
| ξ | Resistance coefficient | |
| ρ | Density | kg/m3 |
| Subscriptions | ||
| ave | Average | |
| ex | External | |
| HTSG | High temperature steam generator | |
| i | Inlet | |
| in | Internal | |
| it | Intermediate | |
| lm | Log mean temperature difference | |
| mt | Material | |
| o | Outlet | |
| sc | Sudden contraction | |
| se | Sudden enlargement | |
| sf | Swirling flow | |
| st | Stream line | |
| te | Thermo-extrusion | |
| tot | Total | |
| vf | Vortex flow | |
References
- Lam, S.S.; Chase, H.A. A Review on Waste to Energy Processes Using Microwave Pyrolysis. Energies 2012, 5, 4209–4232. [Google Scholar] [CrossRef] [Green Version]
- Akhator, E.P.; Obanor, A.I.; Igbinomwanhia, D.I. Thermal Analysis of a Small Scale Solid Waste-Fired Steam Boiler for Power Generation in Benin City, Nigeria. Niger. J. Technol. 2016, 35, 555–561. [Google Scholar] [CrossRef]
- Yusoff, M.H.M.; Zakaria, R. Combustion of Municipal Solid Waste in Fixed Bed Combustor for Energy Recovery. J. Appl. Sci. 2012, 12, 1176–1180. [Google Scholar] [CrossRef]
- Greef, J.D.; Villani, K.; Goethals, J.; Belle, H.V.; Caneghem, J.V.; Vandecasteele, C. Optimising energy recovery and use of chemicals, resources and materials in modern waste-to-energy plants. Waste Manag. 2013, 33, 2416–2424. [Google Scholar] [CrossRef] [PubMed]
- Fehlner, F.P.; Mott, N.F. Low-temperature oxidation. Oxid. Met. 1970, 2, 59–99. [Google Scholar] [CrossRef]
- Milovanović, N.; Đorđević, B.; Tatić, U.; Sedmak, S.A.; Štrbački, S. Low-Temperature Corrosion Damage and Repair of Boiler Bottom Panel Tubes. Struct. Integr. Life 2017, 17, 125–131. [Google Scholar]
- Marshall, J.; Hoornweg, D.; Eremed, W.B.; Piamonti, G. World Energy Resources Waste to Energy. World Energy Counc. 2016, 5–60. Available online: https://www.worldenergy.org/ (accessed on 29 May 2018).
- Ryu, C.; Shin, D. Combined Heat and Power from Municipal Solid Waste: Current Status and Issues in South Korea. Energies 2013, 6, 45–57. [Google Scholar] [CrossRef]
- Zieliński, A.; Dobrzański, J.; Purzyńska, H.; Sikora, R.; Dziuba-Kałuża, M.; Kania, Z. Evaluation of Creep Strength of Heterogeneous Welded Joint in HR6W Alloy and Sanicro 25 Steel. Arch. Metall. Mater. 2017, 62, 2057–2064. [Google Scholar] [CrossRef] [Green Version]
- Zeng, Z.; Oliveira, J.P.; Bu, X.; Yang, M.; Li, R.; Wang, Z. Laser Welding of BTi-6431S High Temperature Titanium Alloy. Metals 2017, 7, 504. [Google Scholar] [CrossRef]
- Wright, J.K.; Carroll, L.J.; Cabet, C.; Lillo, T.M.; Benz, J.K.; Simpson, J.A.; Lloyd, W.R.; Chapman, J.A.; Wright, R.N. Characterization of elevated temperature properties of heat exchanger and steam generator alloys. Nucl. Eng. Des. 2012, 251, 252–260. [Google Scholar] [CrossRef] [Green Version]
- Dewa, R.T.; Kim, S.J.; Kim, W.G.; Kim, E.S. Effect of Strain Range on the Low Cycle Fatigue in Alloy 617 at High Temperature. Metals 2017, 7, 54. [Google Scholar] [CrossRef]
- Wu, J.; Liu, X. Recent Development of SOFC Metallic Interconnect. J. Mater. Sci. Technol. 2010, 26, 293–305. [Google Scholar] [CrossRef]
- Silva, F.S.; Souza, T.M. Novel materials for solid oxide fuel cell technologies: A literature review. Int. J. Hydrogen Energy 2017, 42, 26020–26036. [Google Scholar] [CrossRef]
- Zhou, W.; Jia, Z.; Qin, J.; Bao, W.; Yu, B. Experimental study on effect of pressure on heat sink of n-decane. Chem. Eng. J. 2014, 243, 127–136. [Google Scholar] [CrossRef]
- Beek, M.C.V.; Rindt, C.C.M.; Wijers, J.G.; Steenhoven, A.A.V. Analysis of Fouling in Refuse Waste Incinerators. Heat Transf. Eng. 2010, 22, 22–31. [Google Scholar] [CrossRef]
- Gnielinski, V. Neue Gleichungen für den Wärme- und den Stoffübergang in turbulent durchströmten Rohren und Kanälen. Forschung im Ingenieurwesen 1974, 41, 8–16. [Google Scholar] [CrossRef]
- Petukhov, B.S. Heat Transfer and Friction in Turbulent Pipe Flow with Variable Physical Properties. Adv. Heat Transf. 1970, 6, 503–564. [Google Scholar] [CrossRef]
- Idelchik, I.E. Handbook of Hydraulic Resistance, 3rd ed.; Begell House: New York, NY, USA, 1996; pp. 1–130. [Google Scholar]
- Prasad, S.S.; Satish, G.; Panduranga, G. Comparison of Flow Analysis through Sudden Contraction and Enlargement of Pipes by Providing Smooth Corners. Int. J. Eng. Trends Technol. 2015, 25, 205–211. [Google Scholar] [CrossRef]
- Weisbach, J. Lehrbuch der Ingenieur- und Maschinen-Mechanik. In Theoretische Mechanik; Vieweg und Sohn: Braunschweig, Germany, 1845; Volume 1, pp. 532–560. [Google Scholar]
Figure 1.
The processes A and B on the T-s diagram.
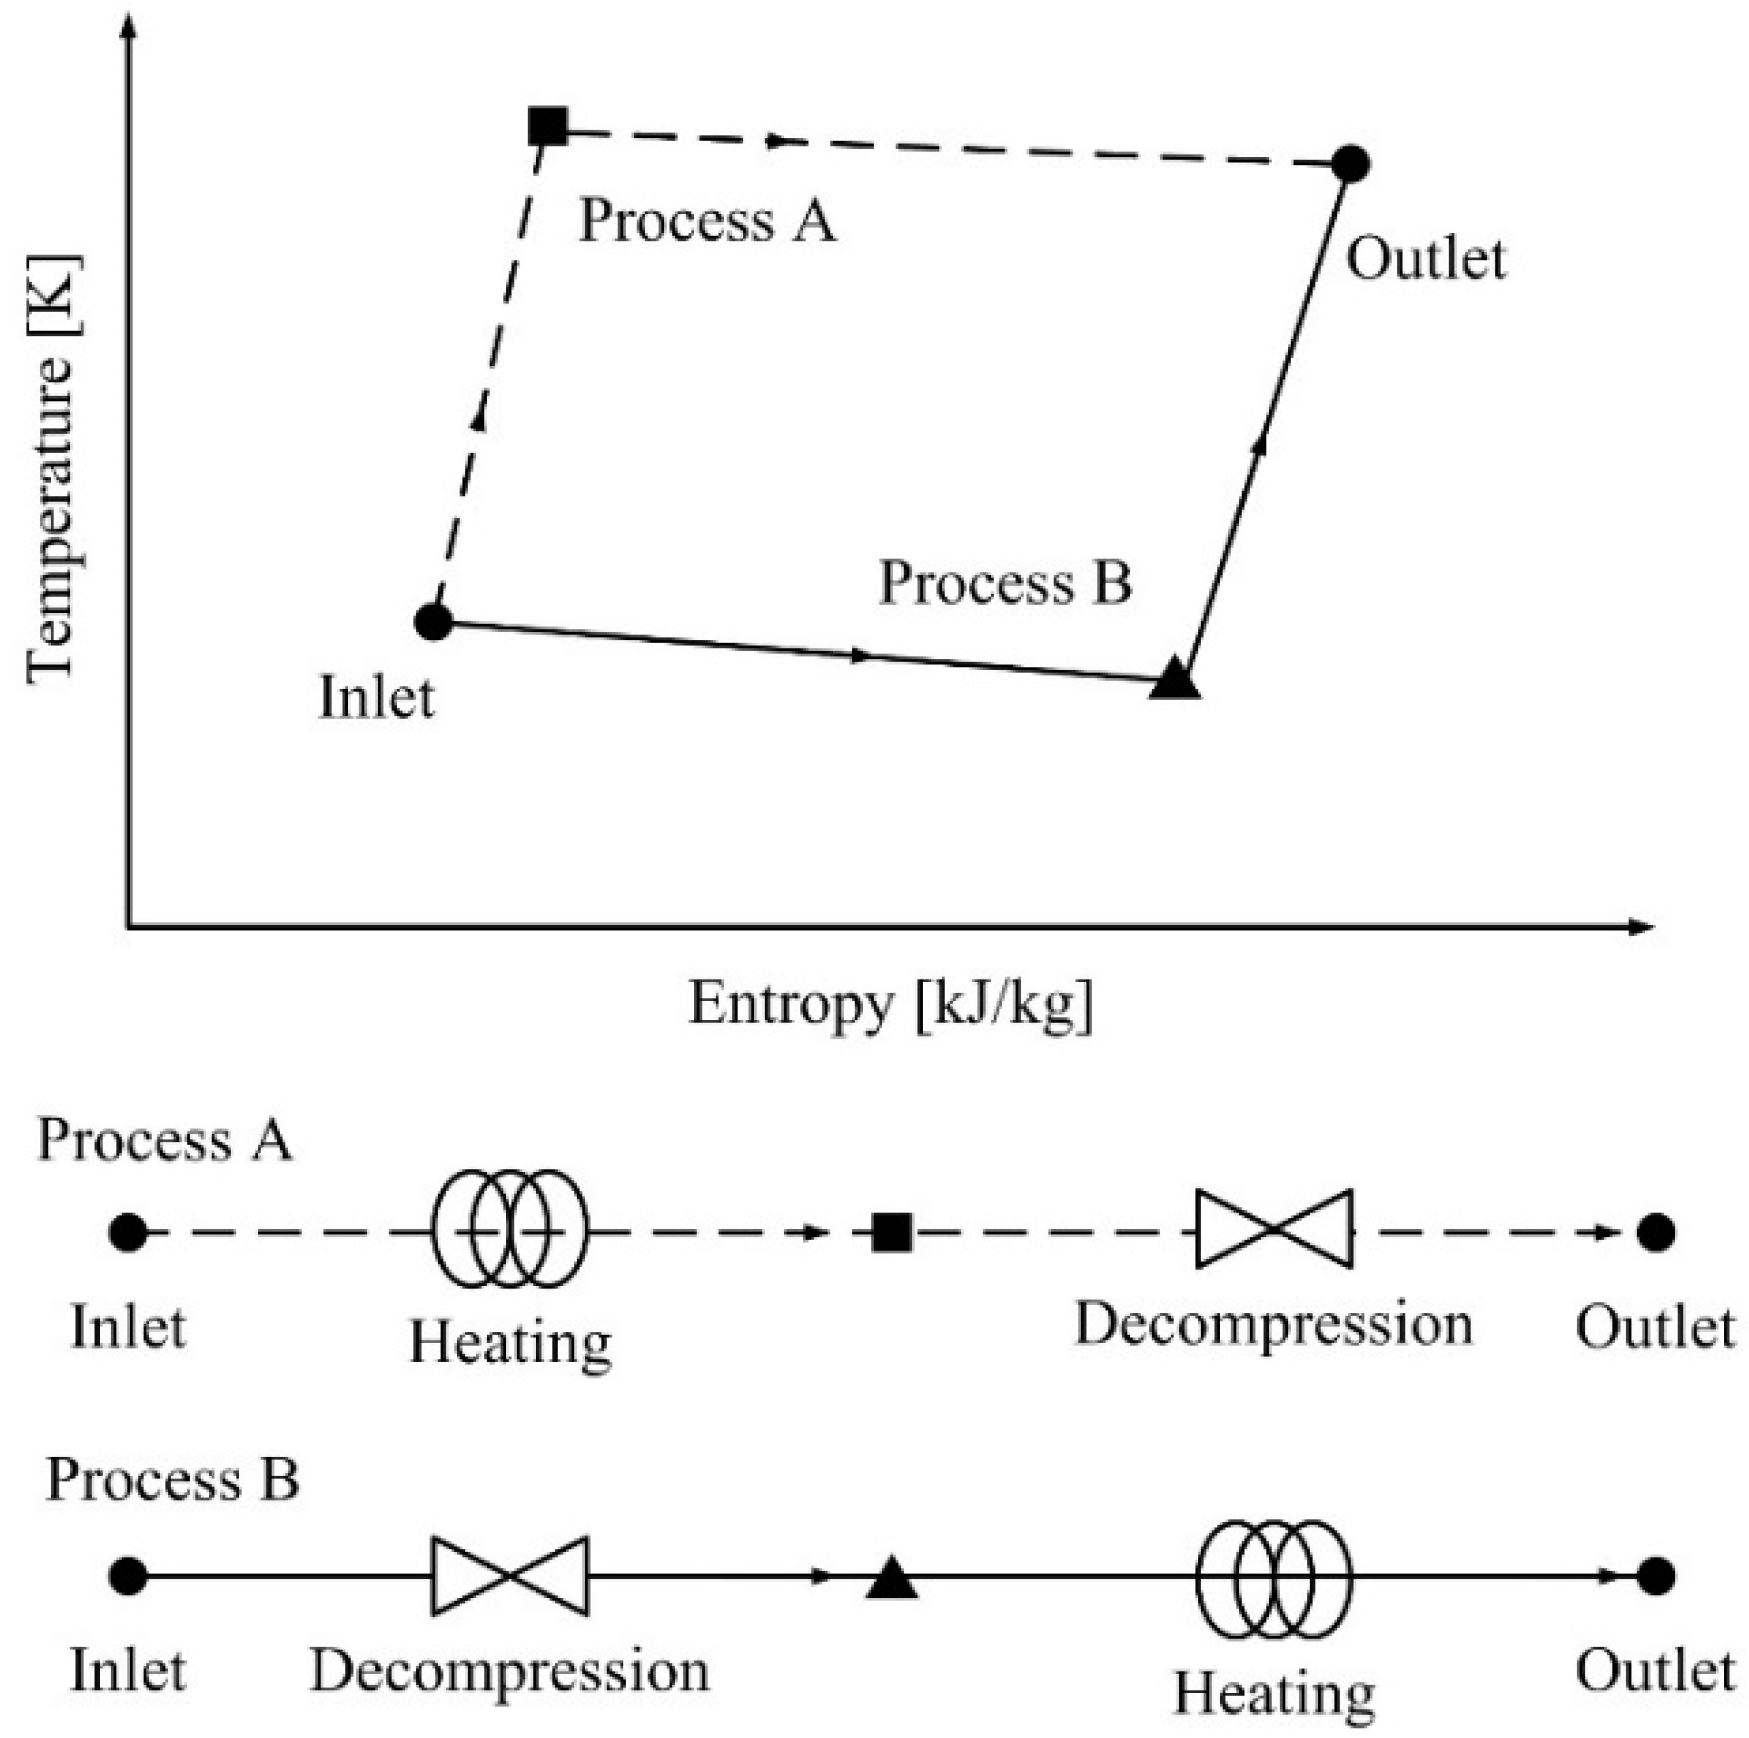
Figure 2.
The schematic diagram of the high-temperature steam generator (HTSG) geometry.
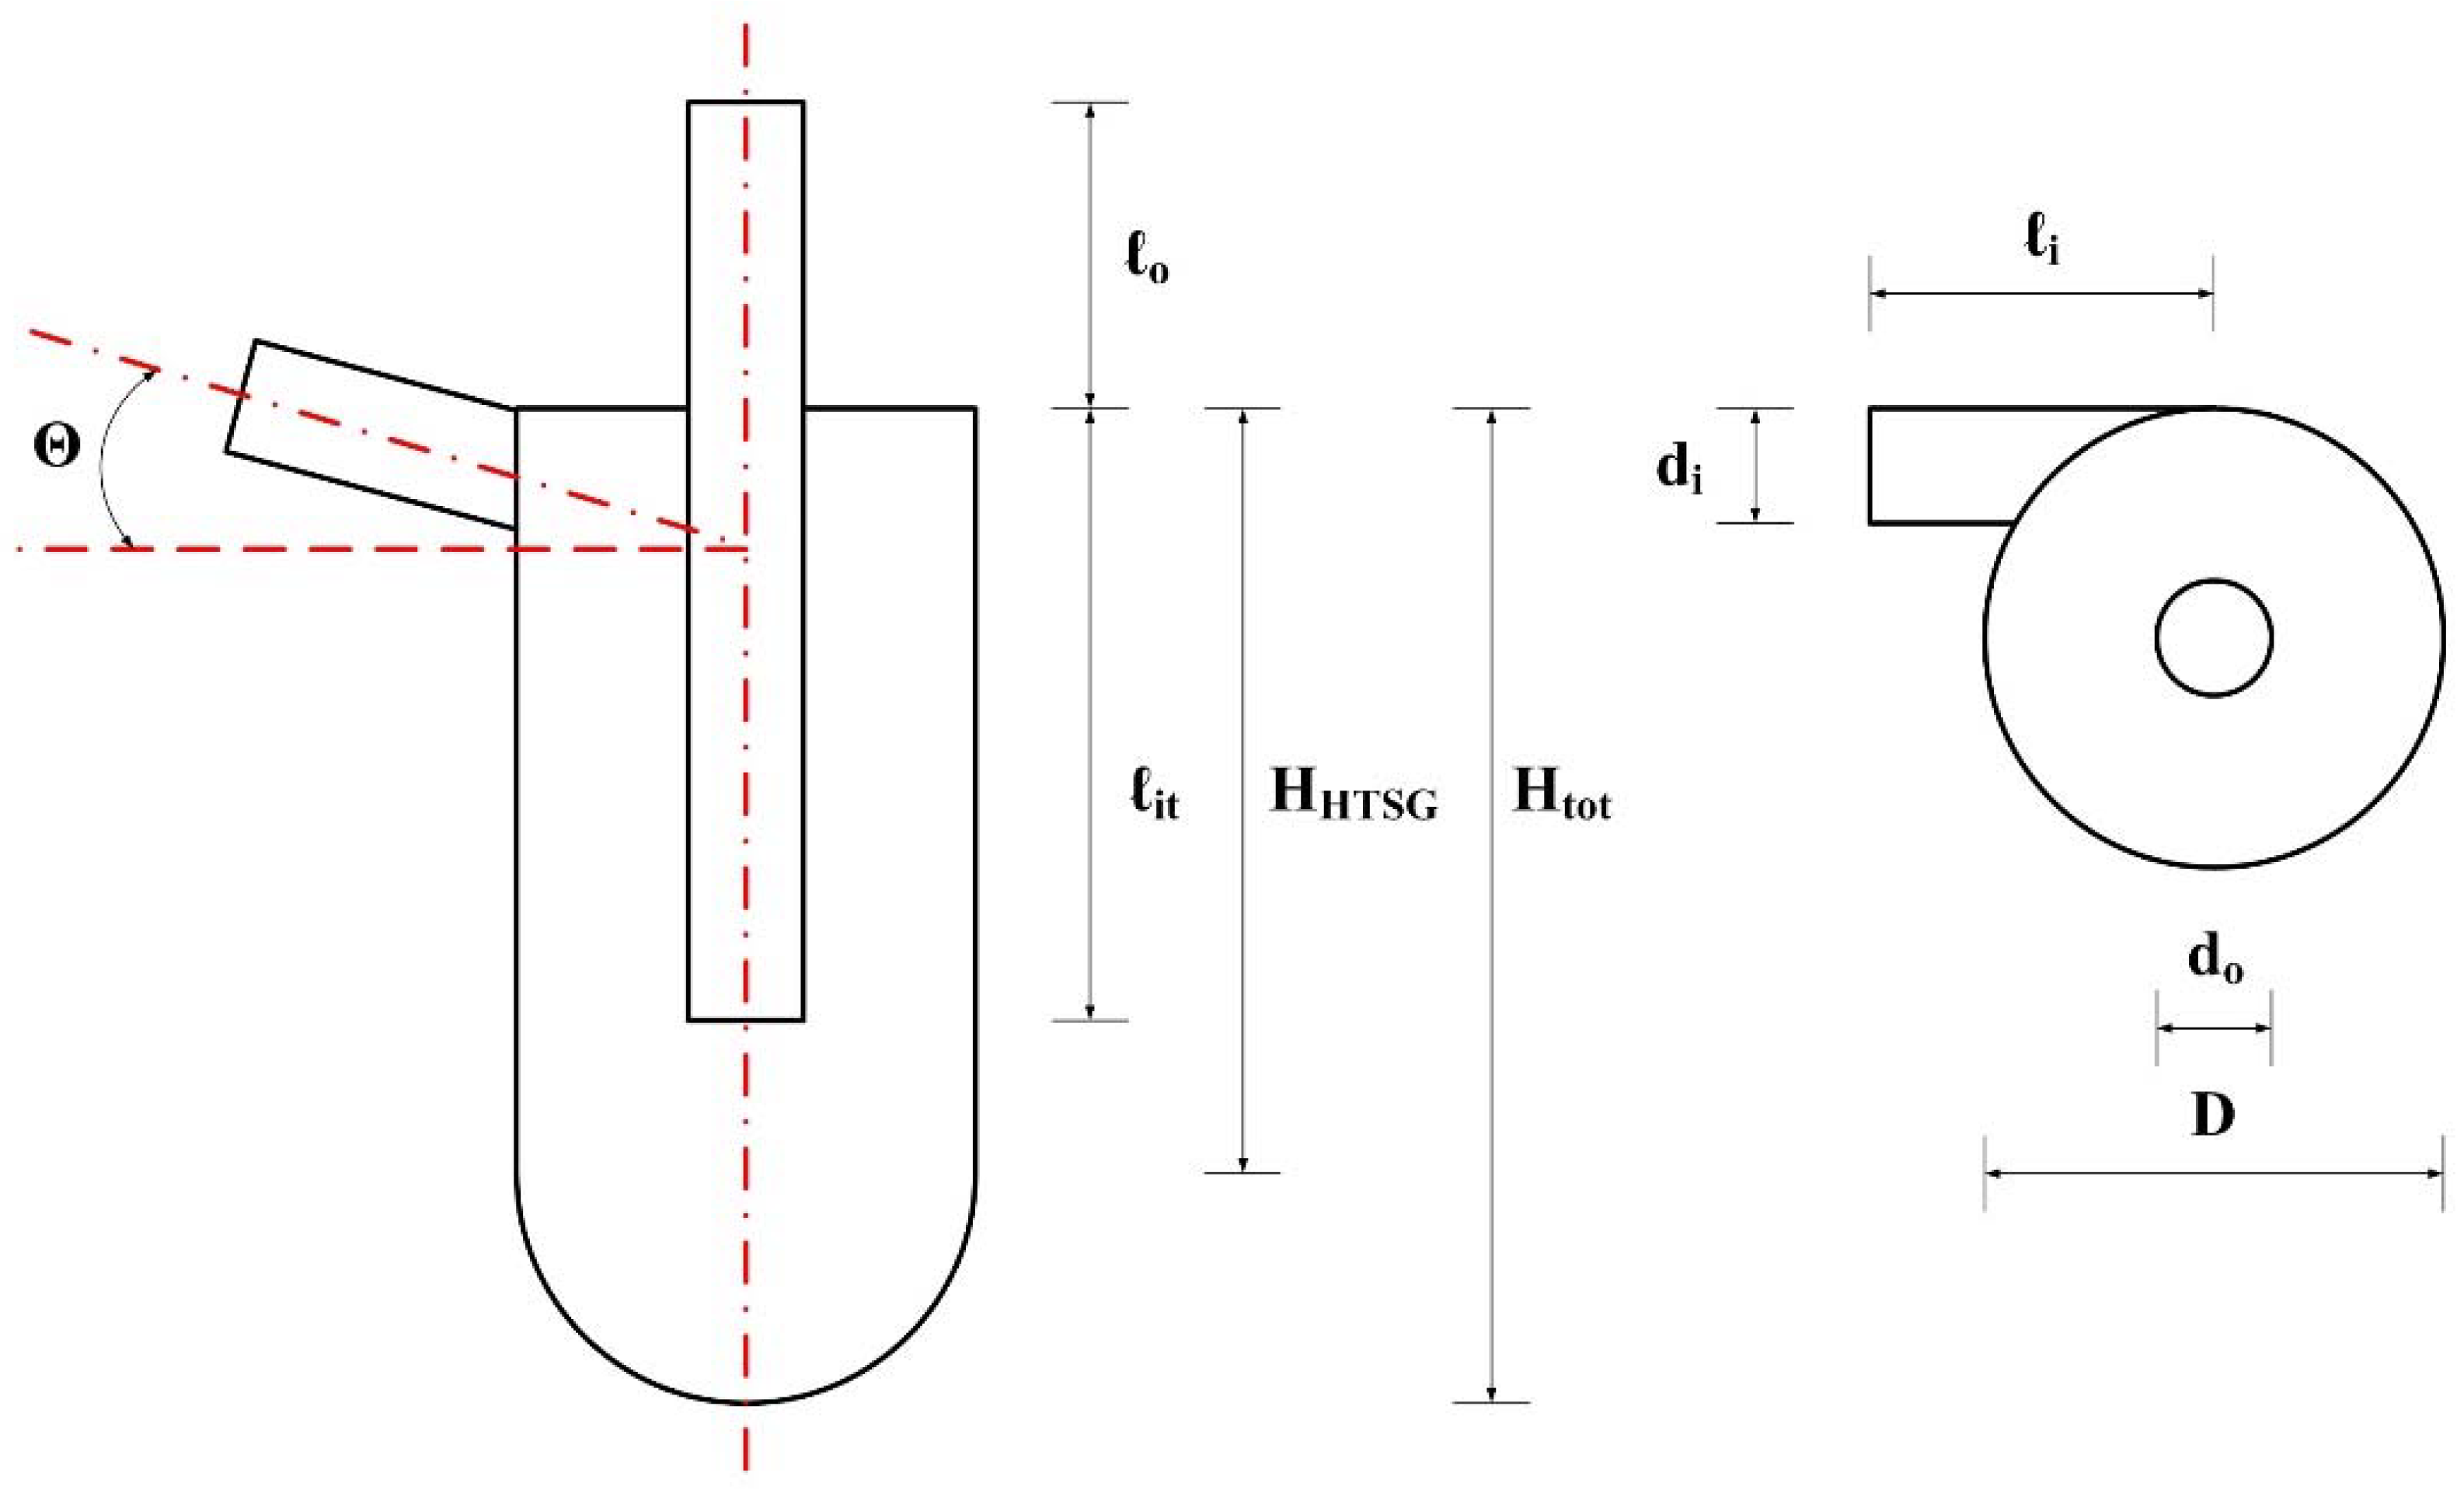
Figure 3.
The thermal conductivities of the HR6W and SUS310.
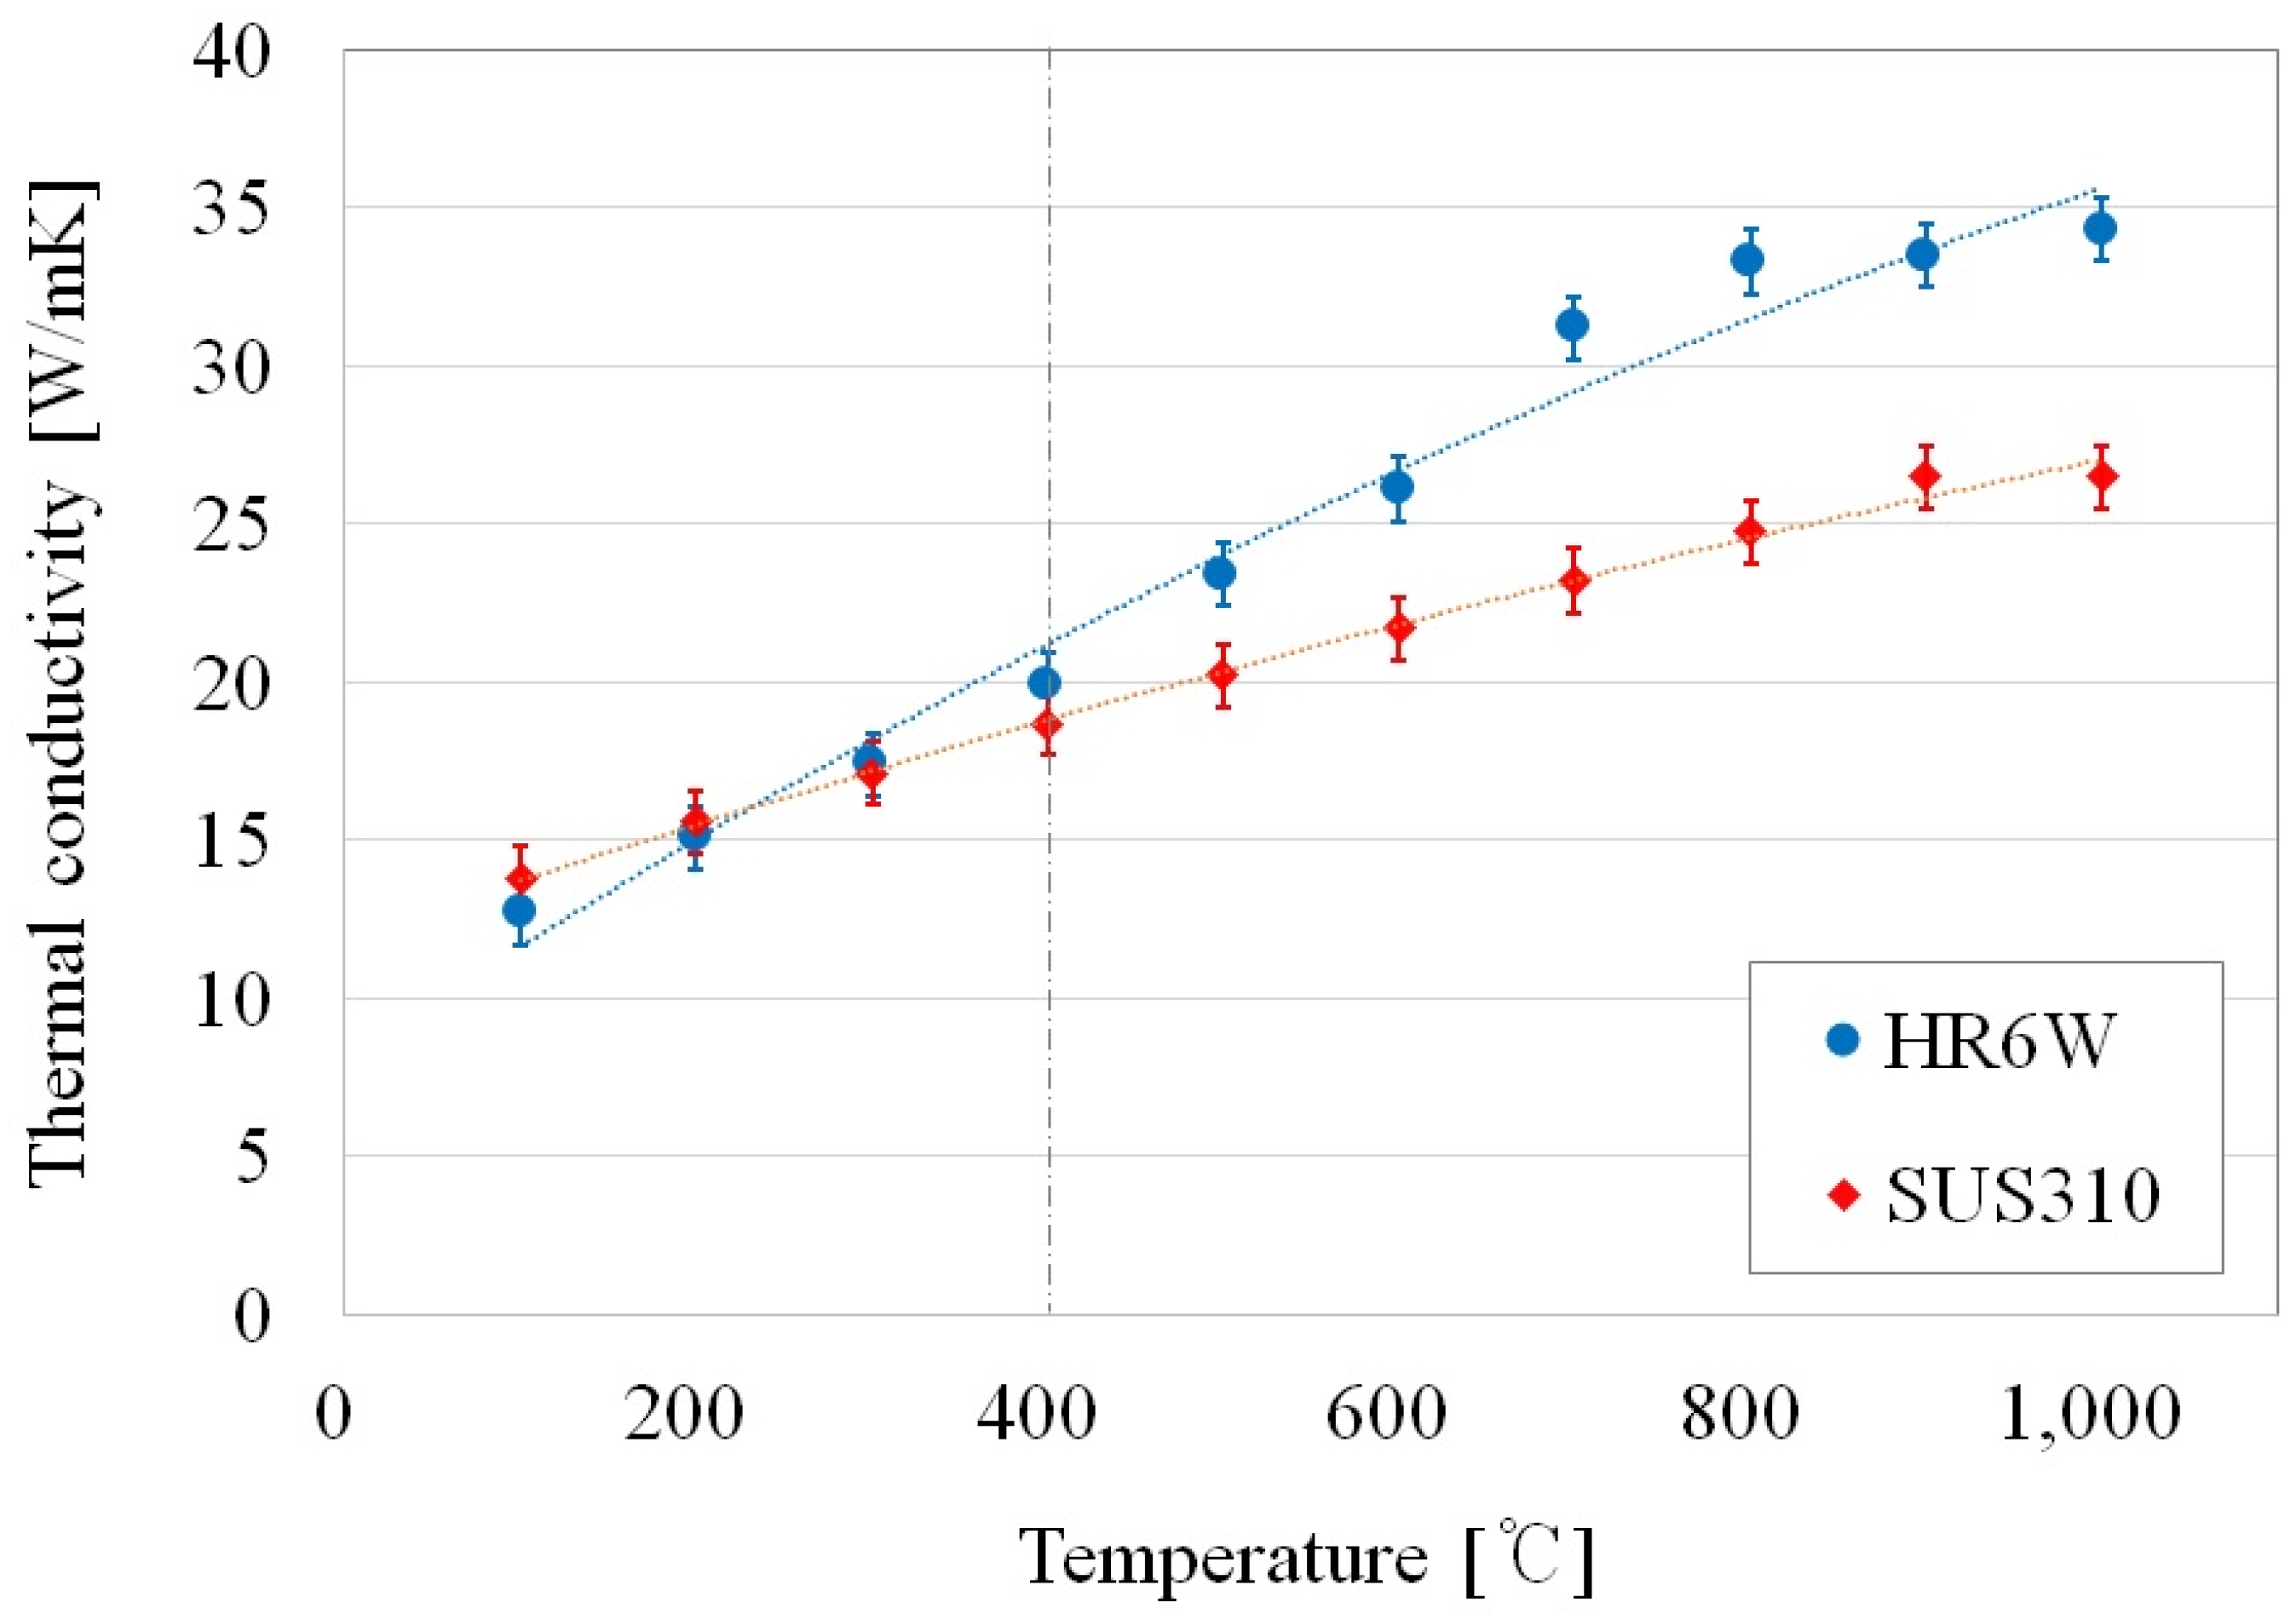
Figure 4.
The streamline of the HTSG and typical pressure profile.
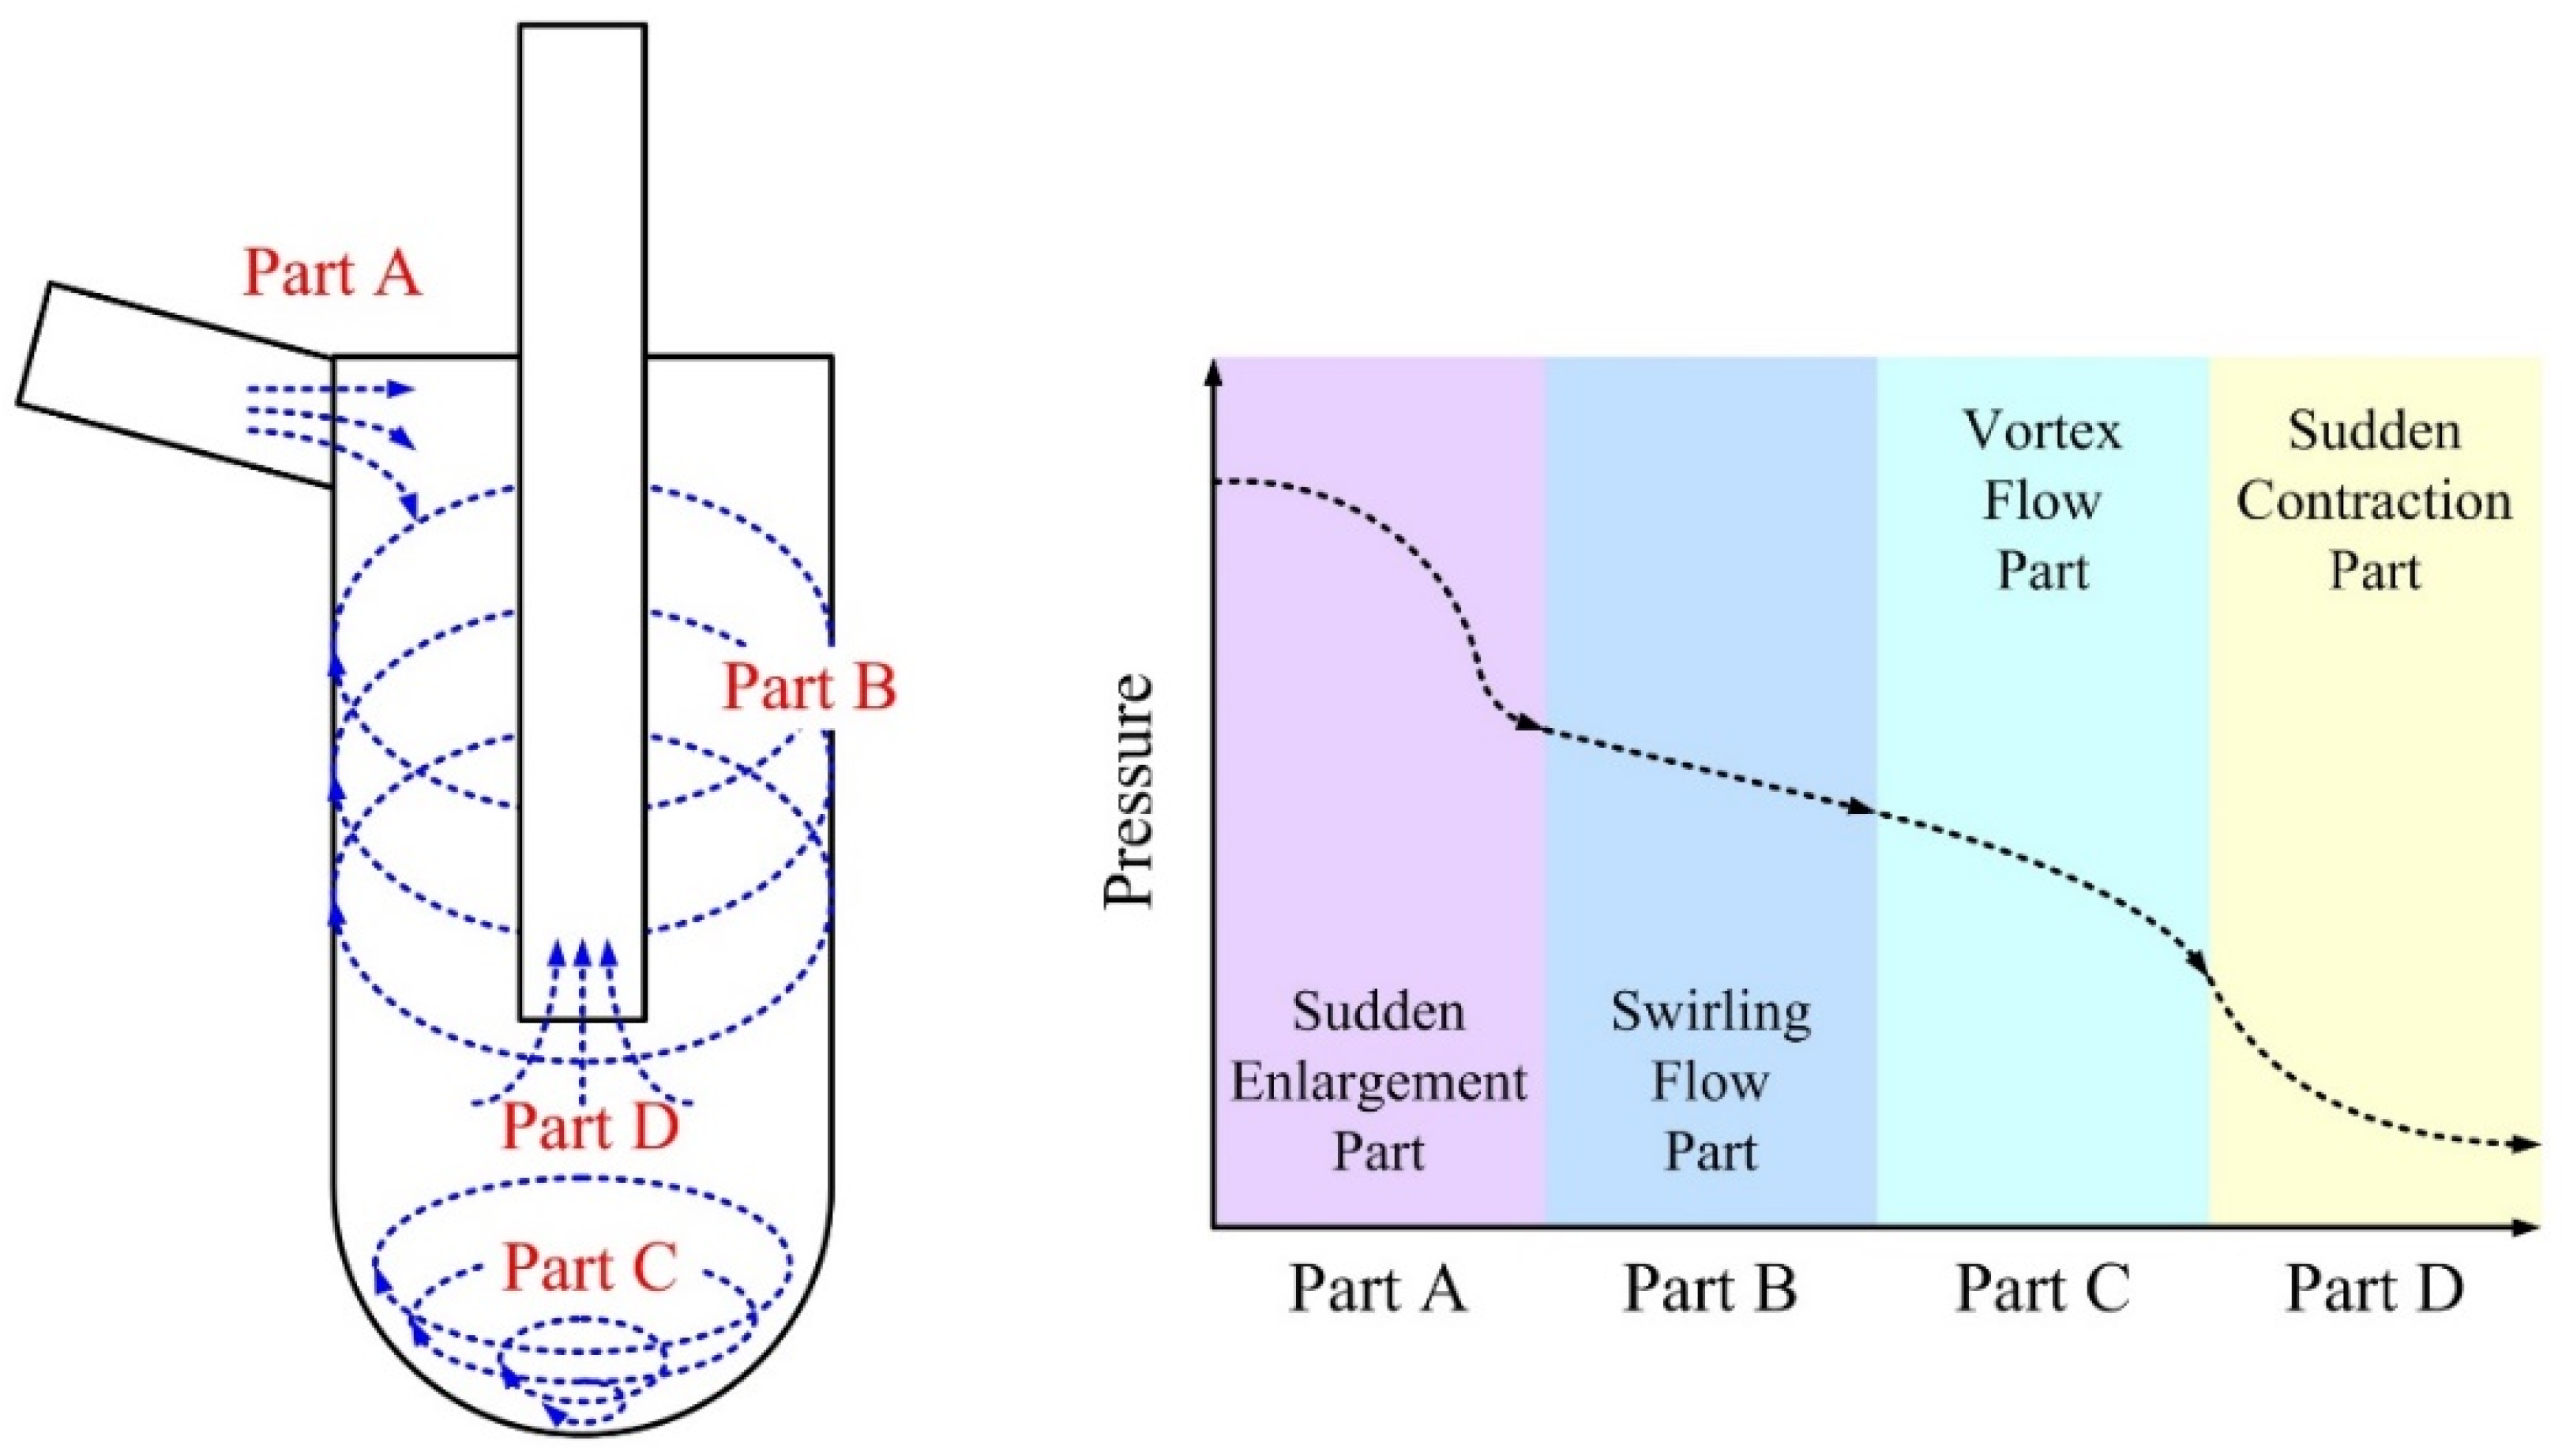
Figure 5.
The streamline of the swirling flow.
Figure 6.
The schematic diagram of the HTSG tester and HTSG test rig.
Figure 7.
The pressure difference according to the Reynolds number (sudden enlargement effect).
Figure 8.
The pressure difference according to the Reynolds number (swirling flow effect).
Figure 9.
The pressure difference according to the entrance angle at the swirling flow part.
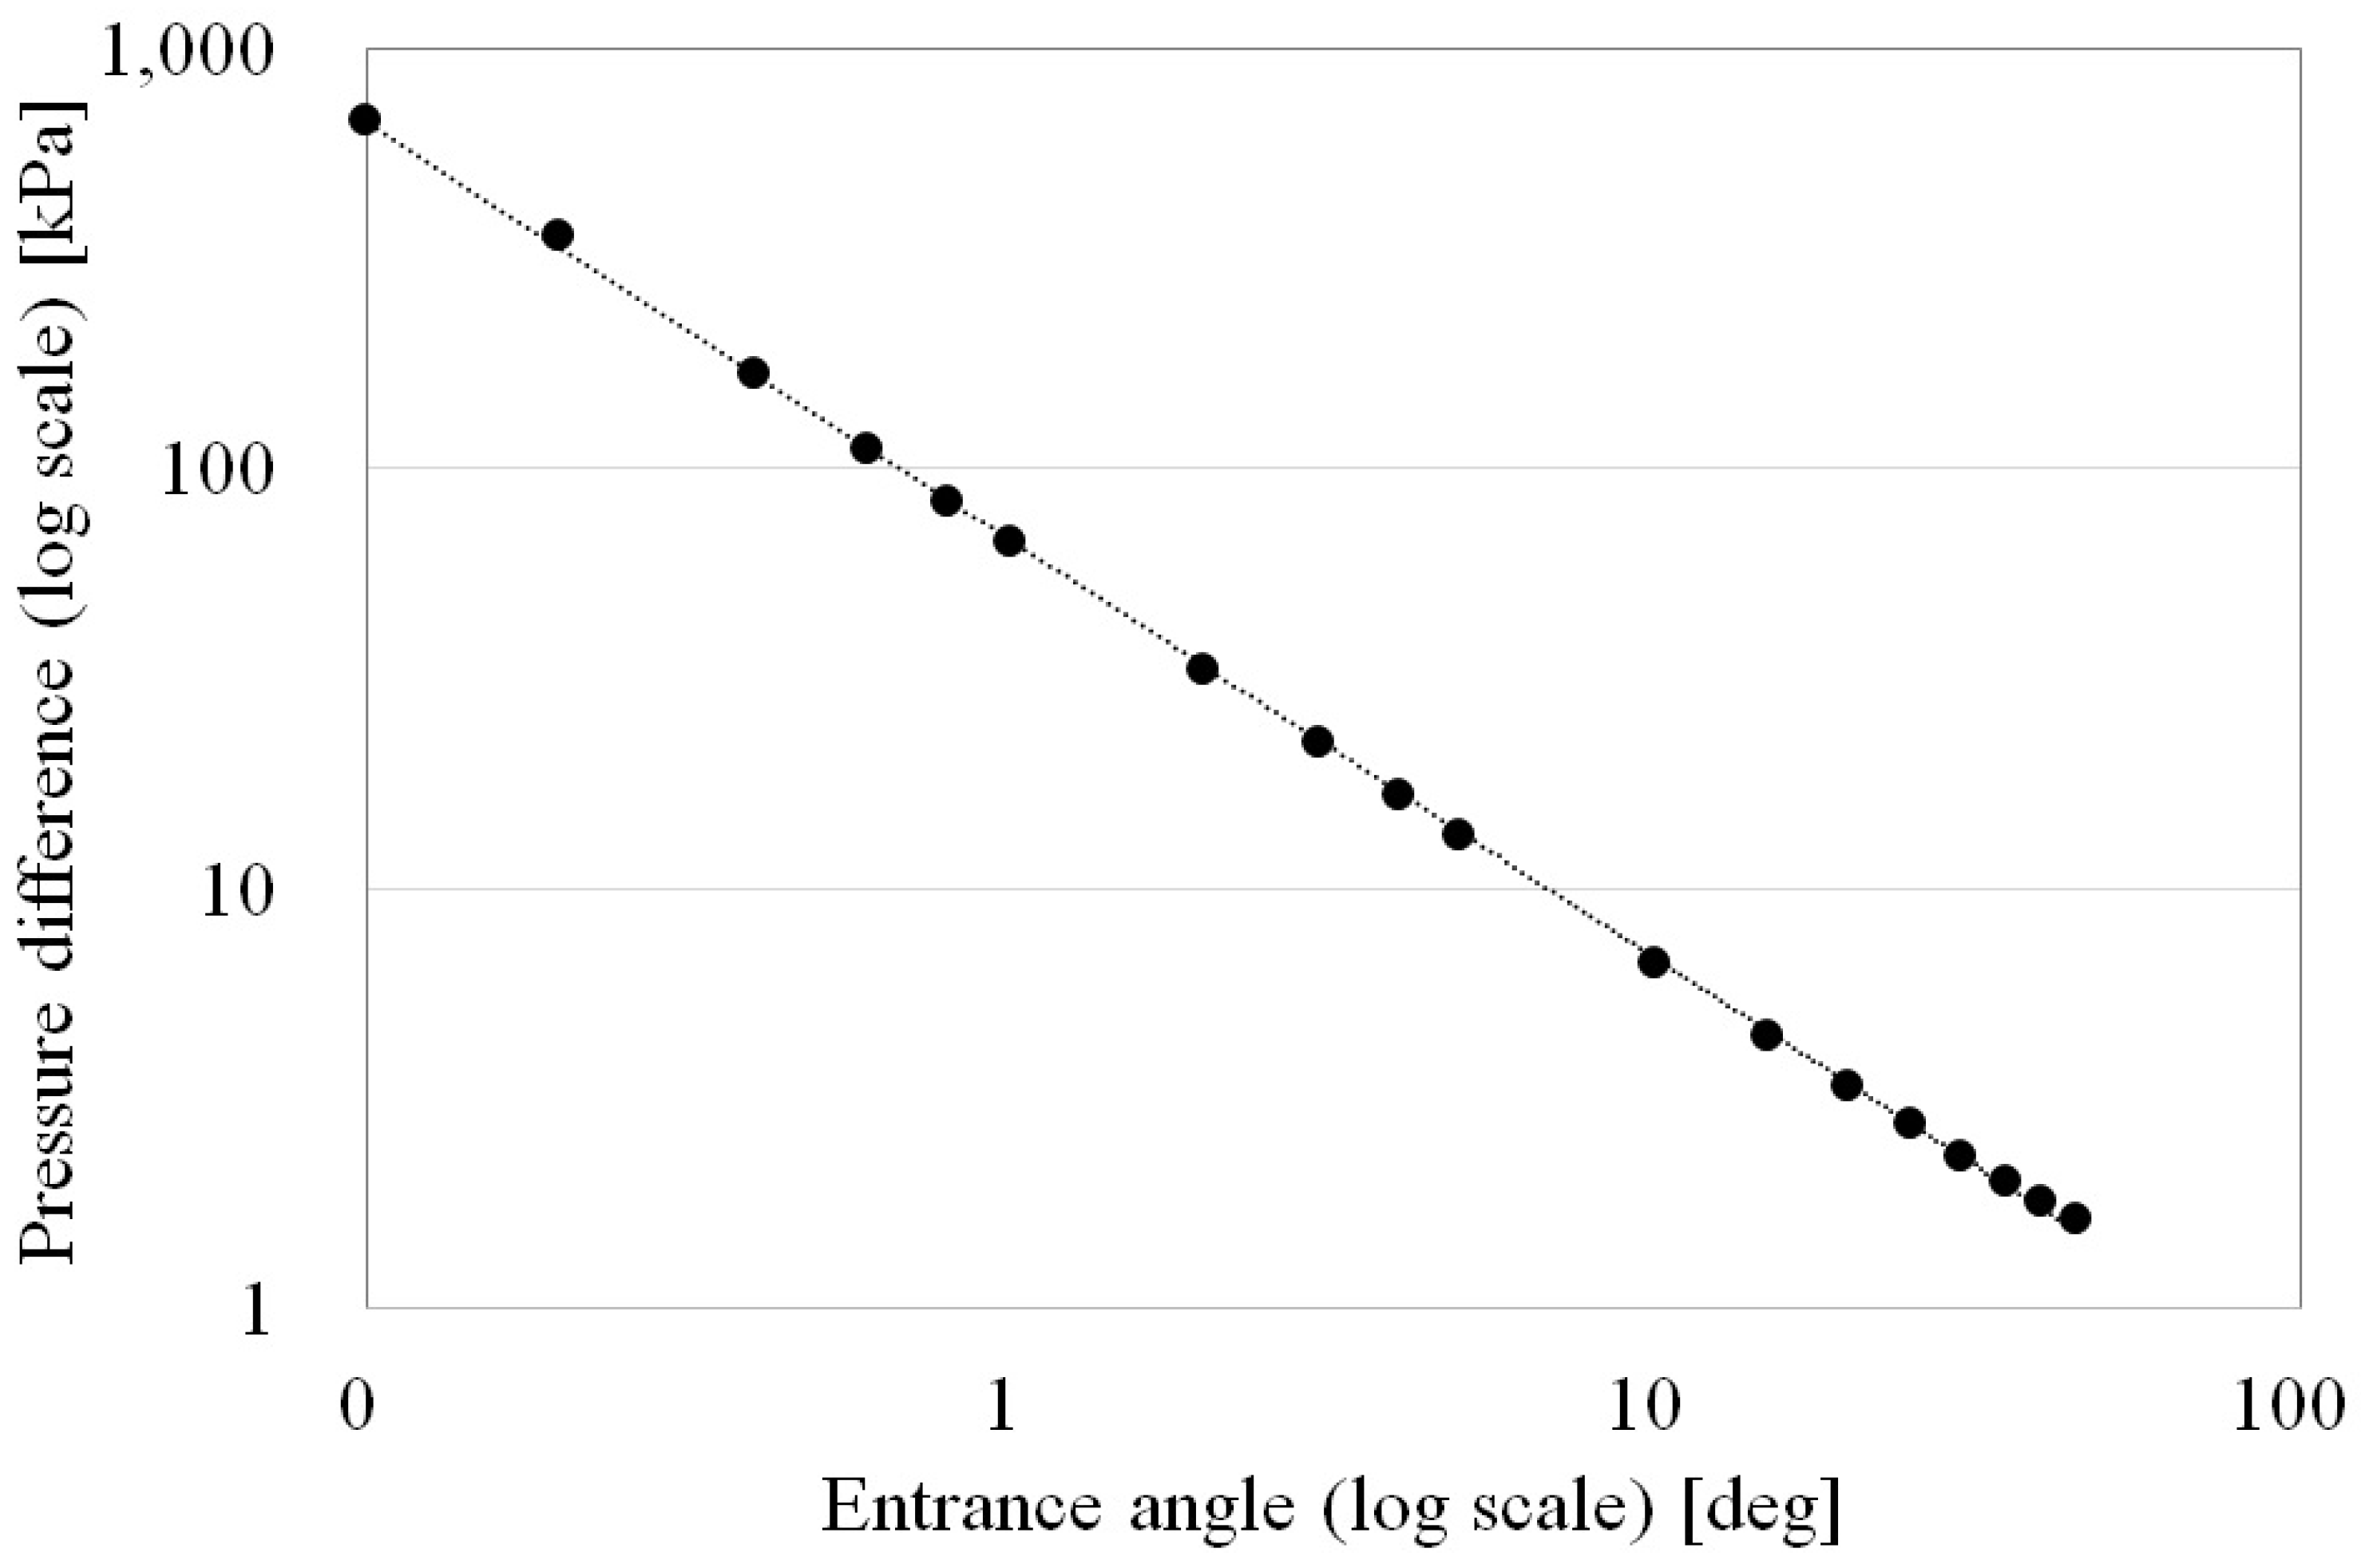
Figure 10.
The pressure difference according to the Reynolds number (vortex flow effect).

Figure 11.
The pressure difference according to the Reynolds number (sudden contraction effect).
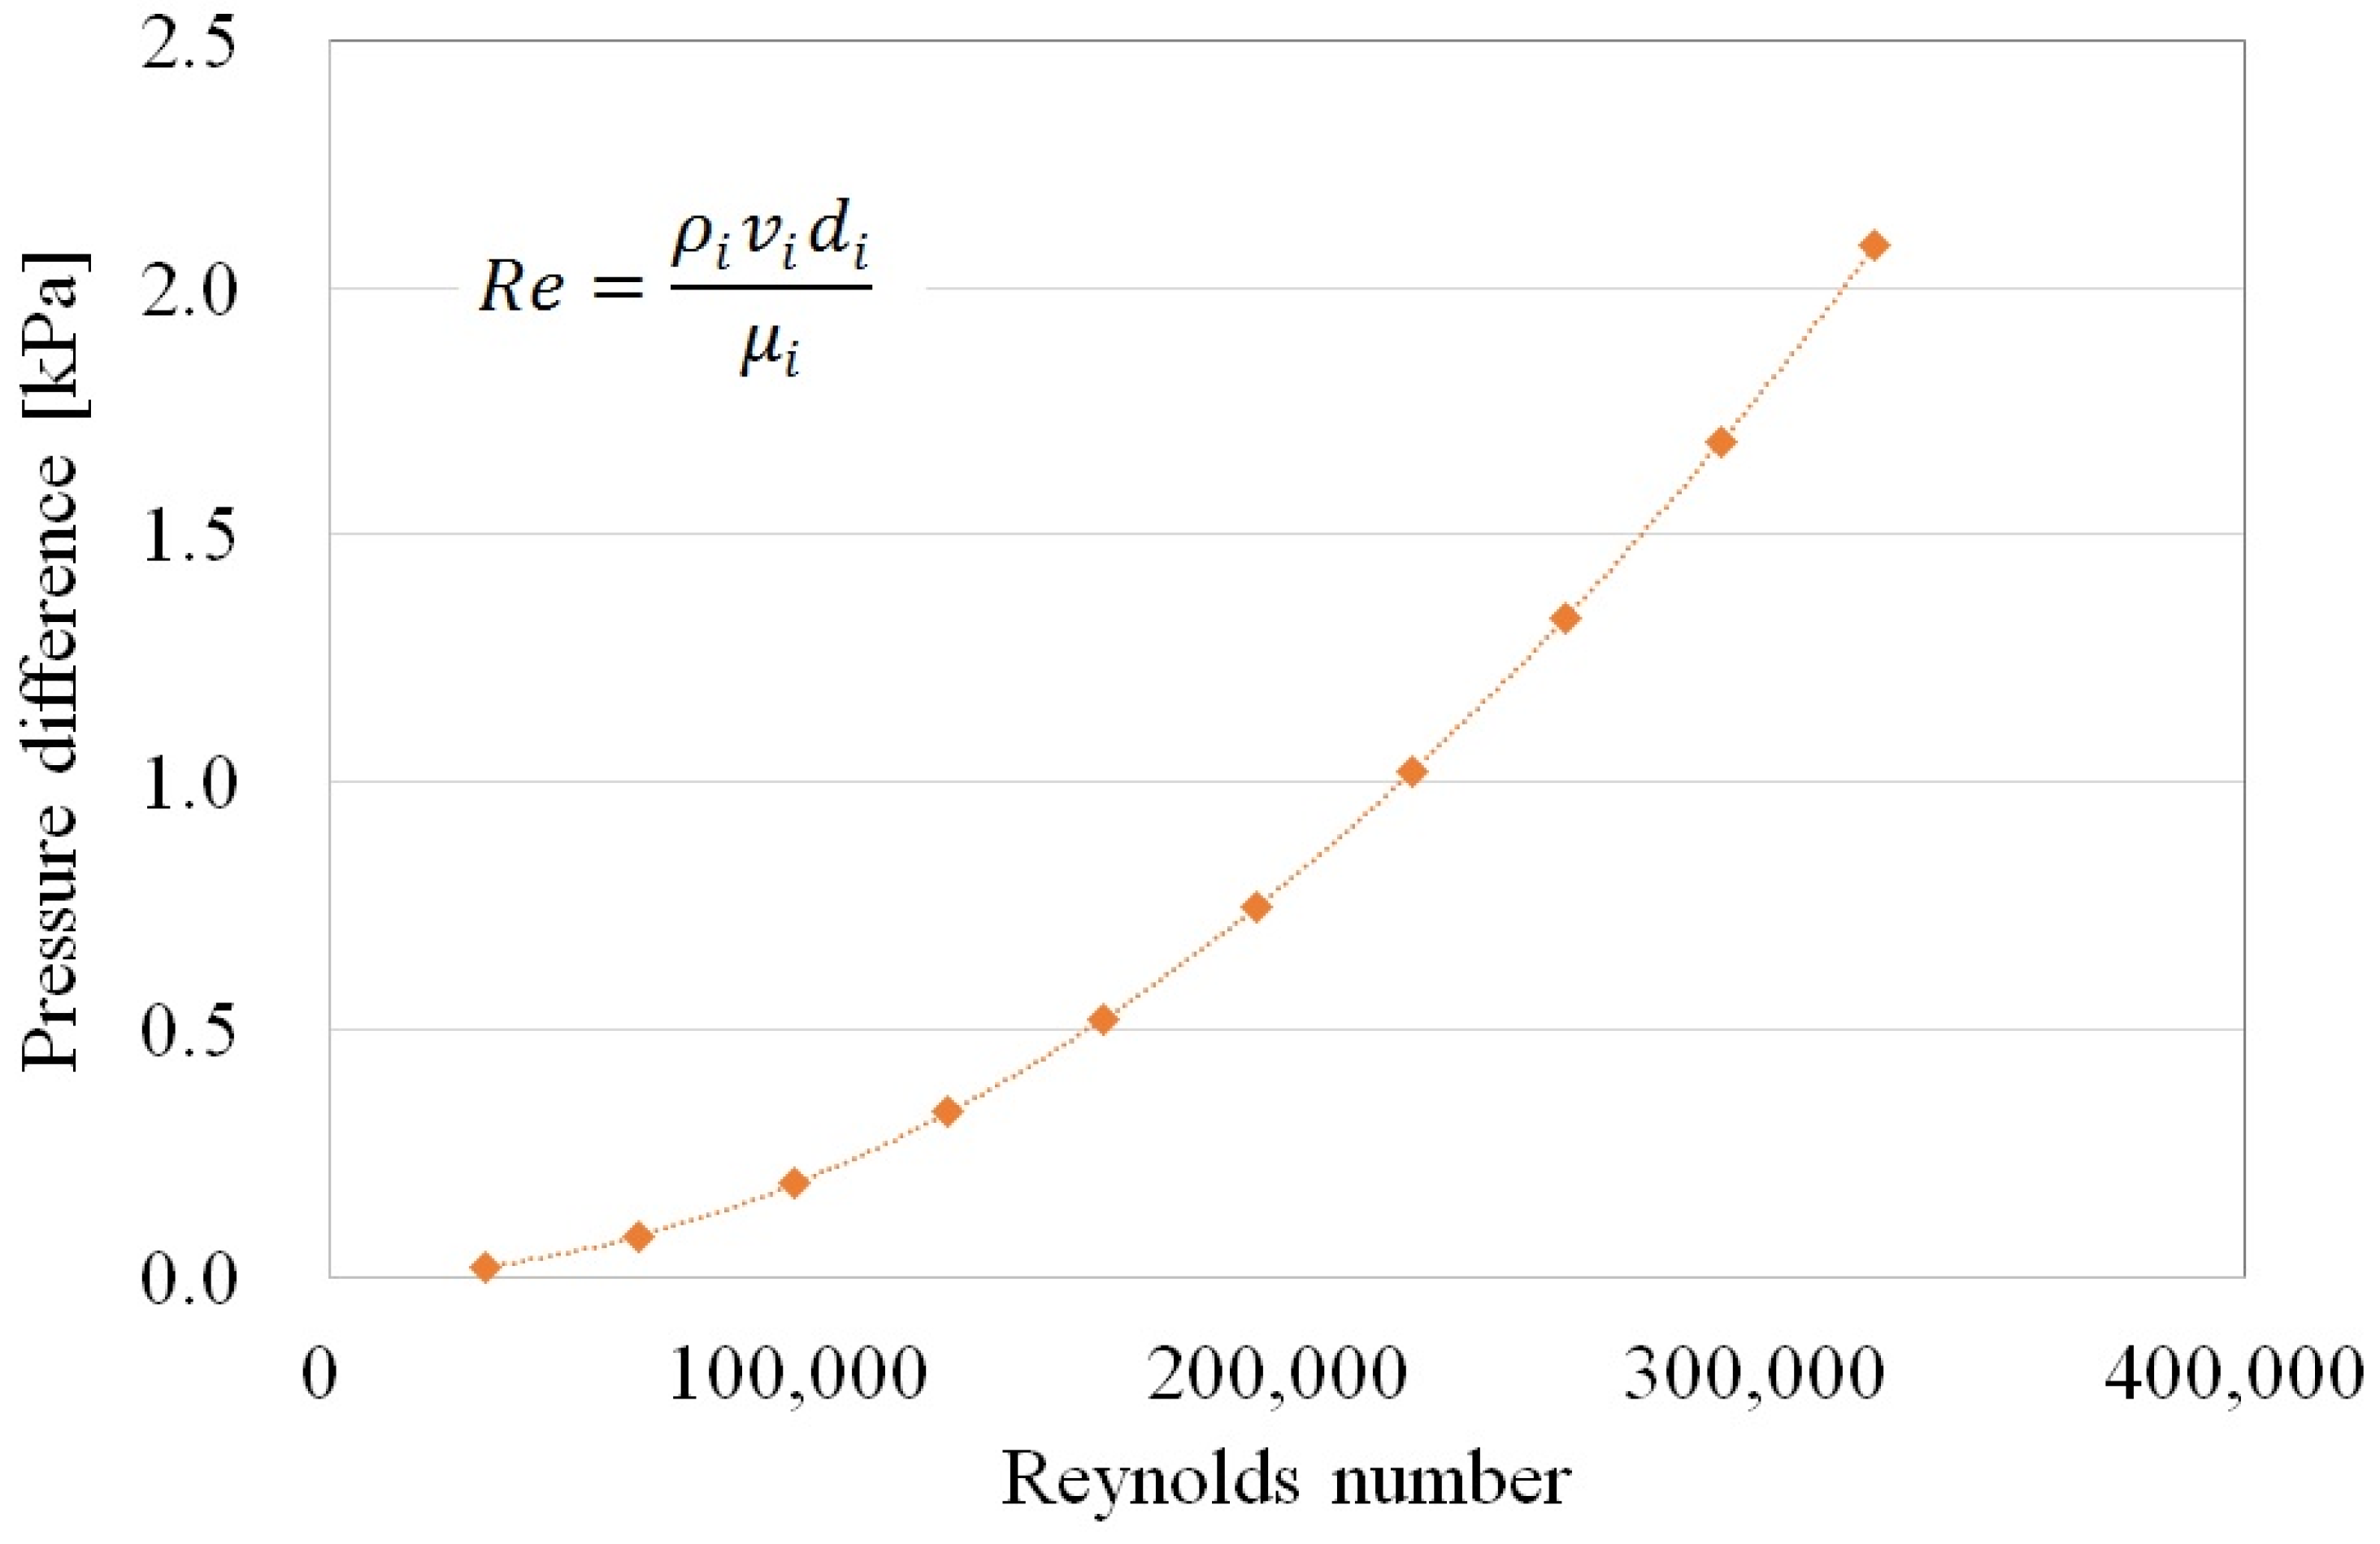
Figure 12.
The pressure difference according to the outlet pipe diameter at the sudden contraction part.
Figure 12.
The pressure difference according to the outlet pipe diameter at the sudden contraction part.
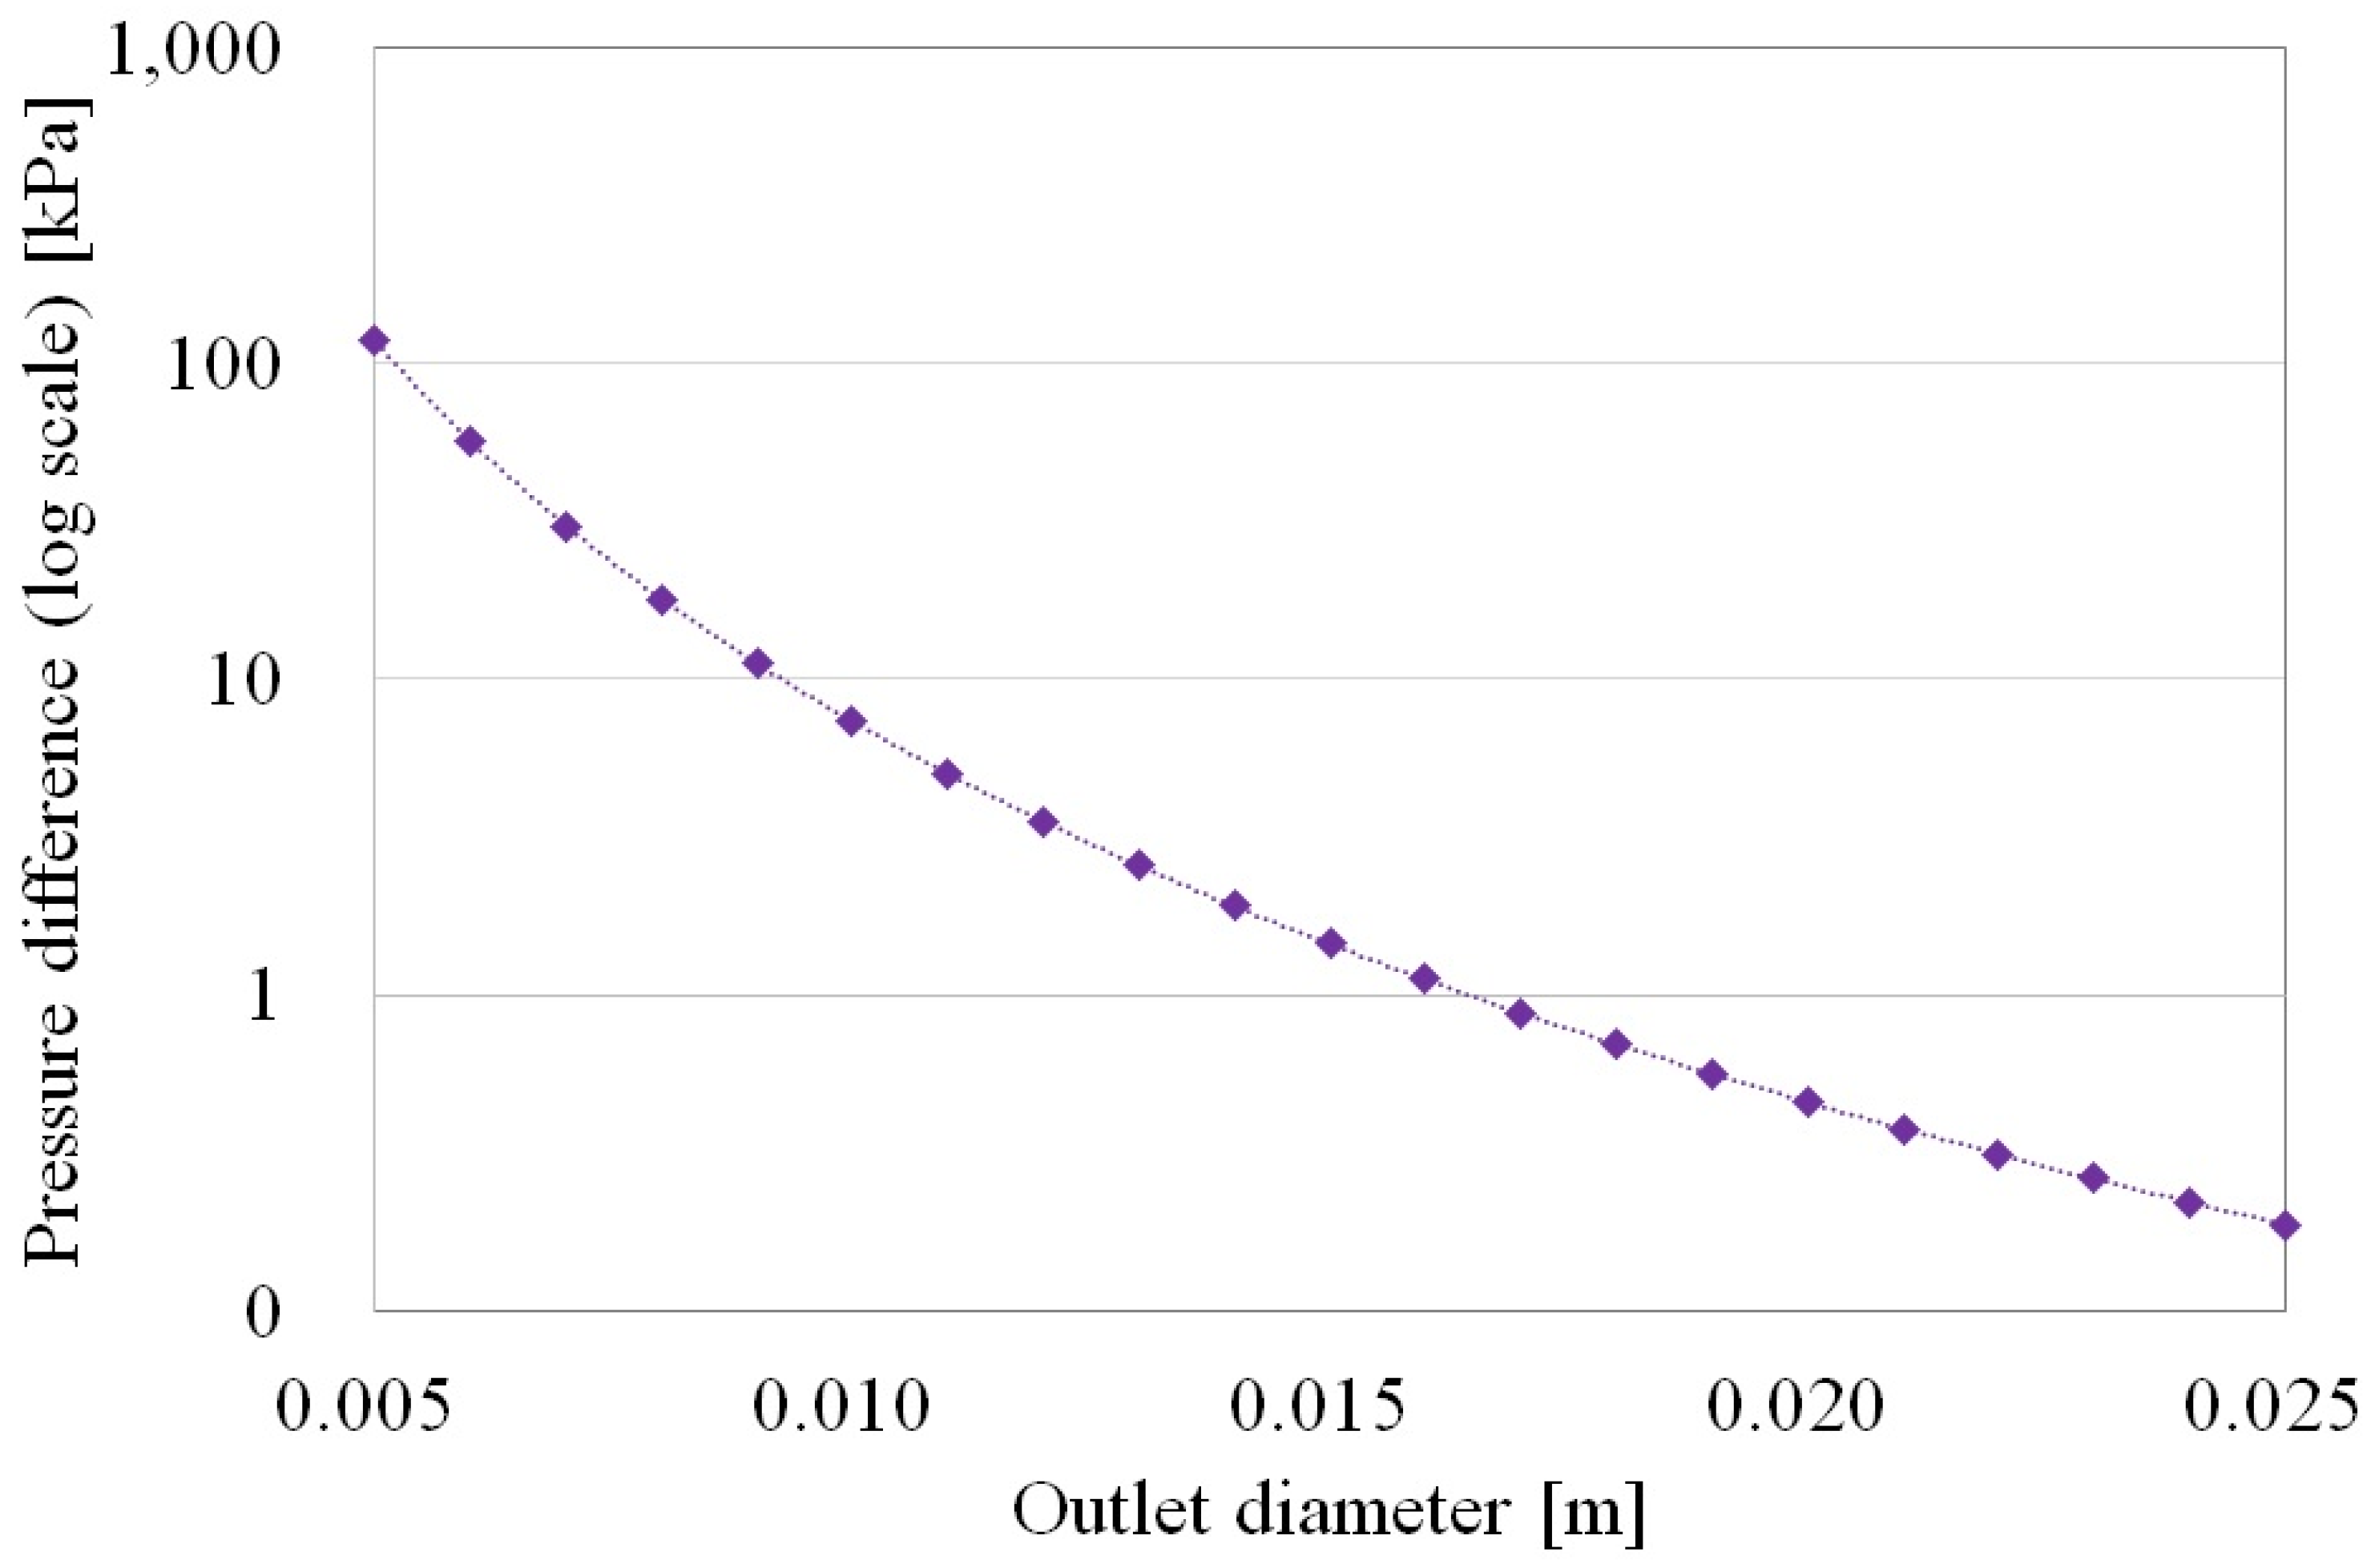
Figure 13.
Comparisons of the pressure difference according to the inlet temperature.
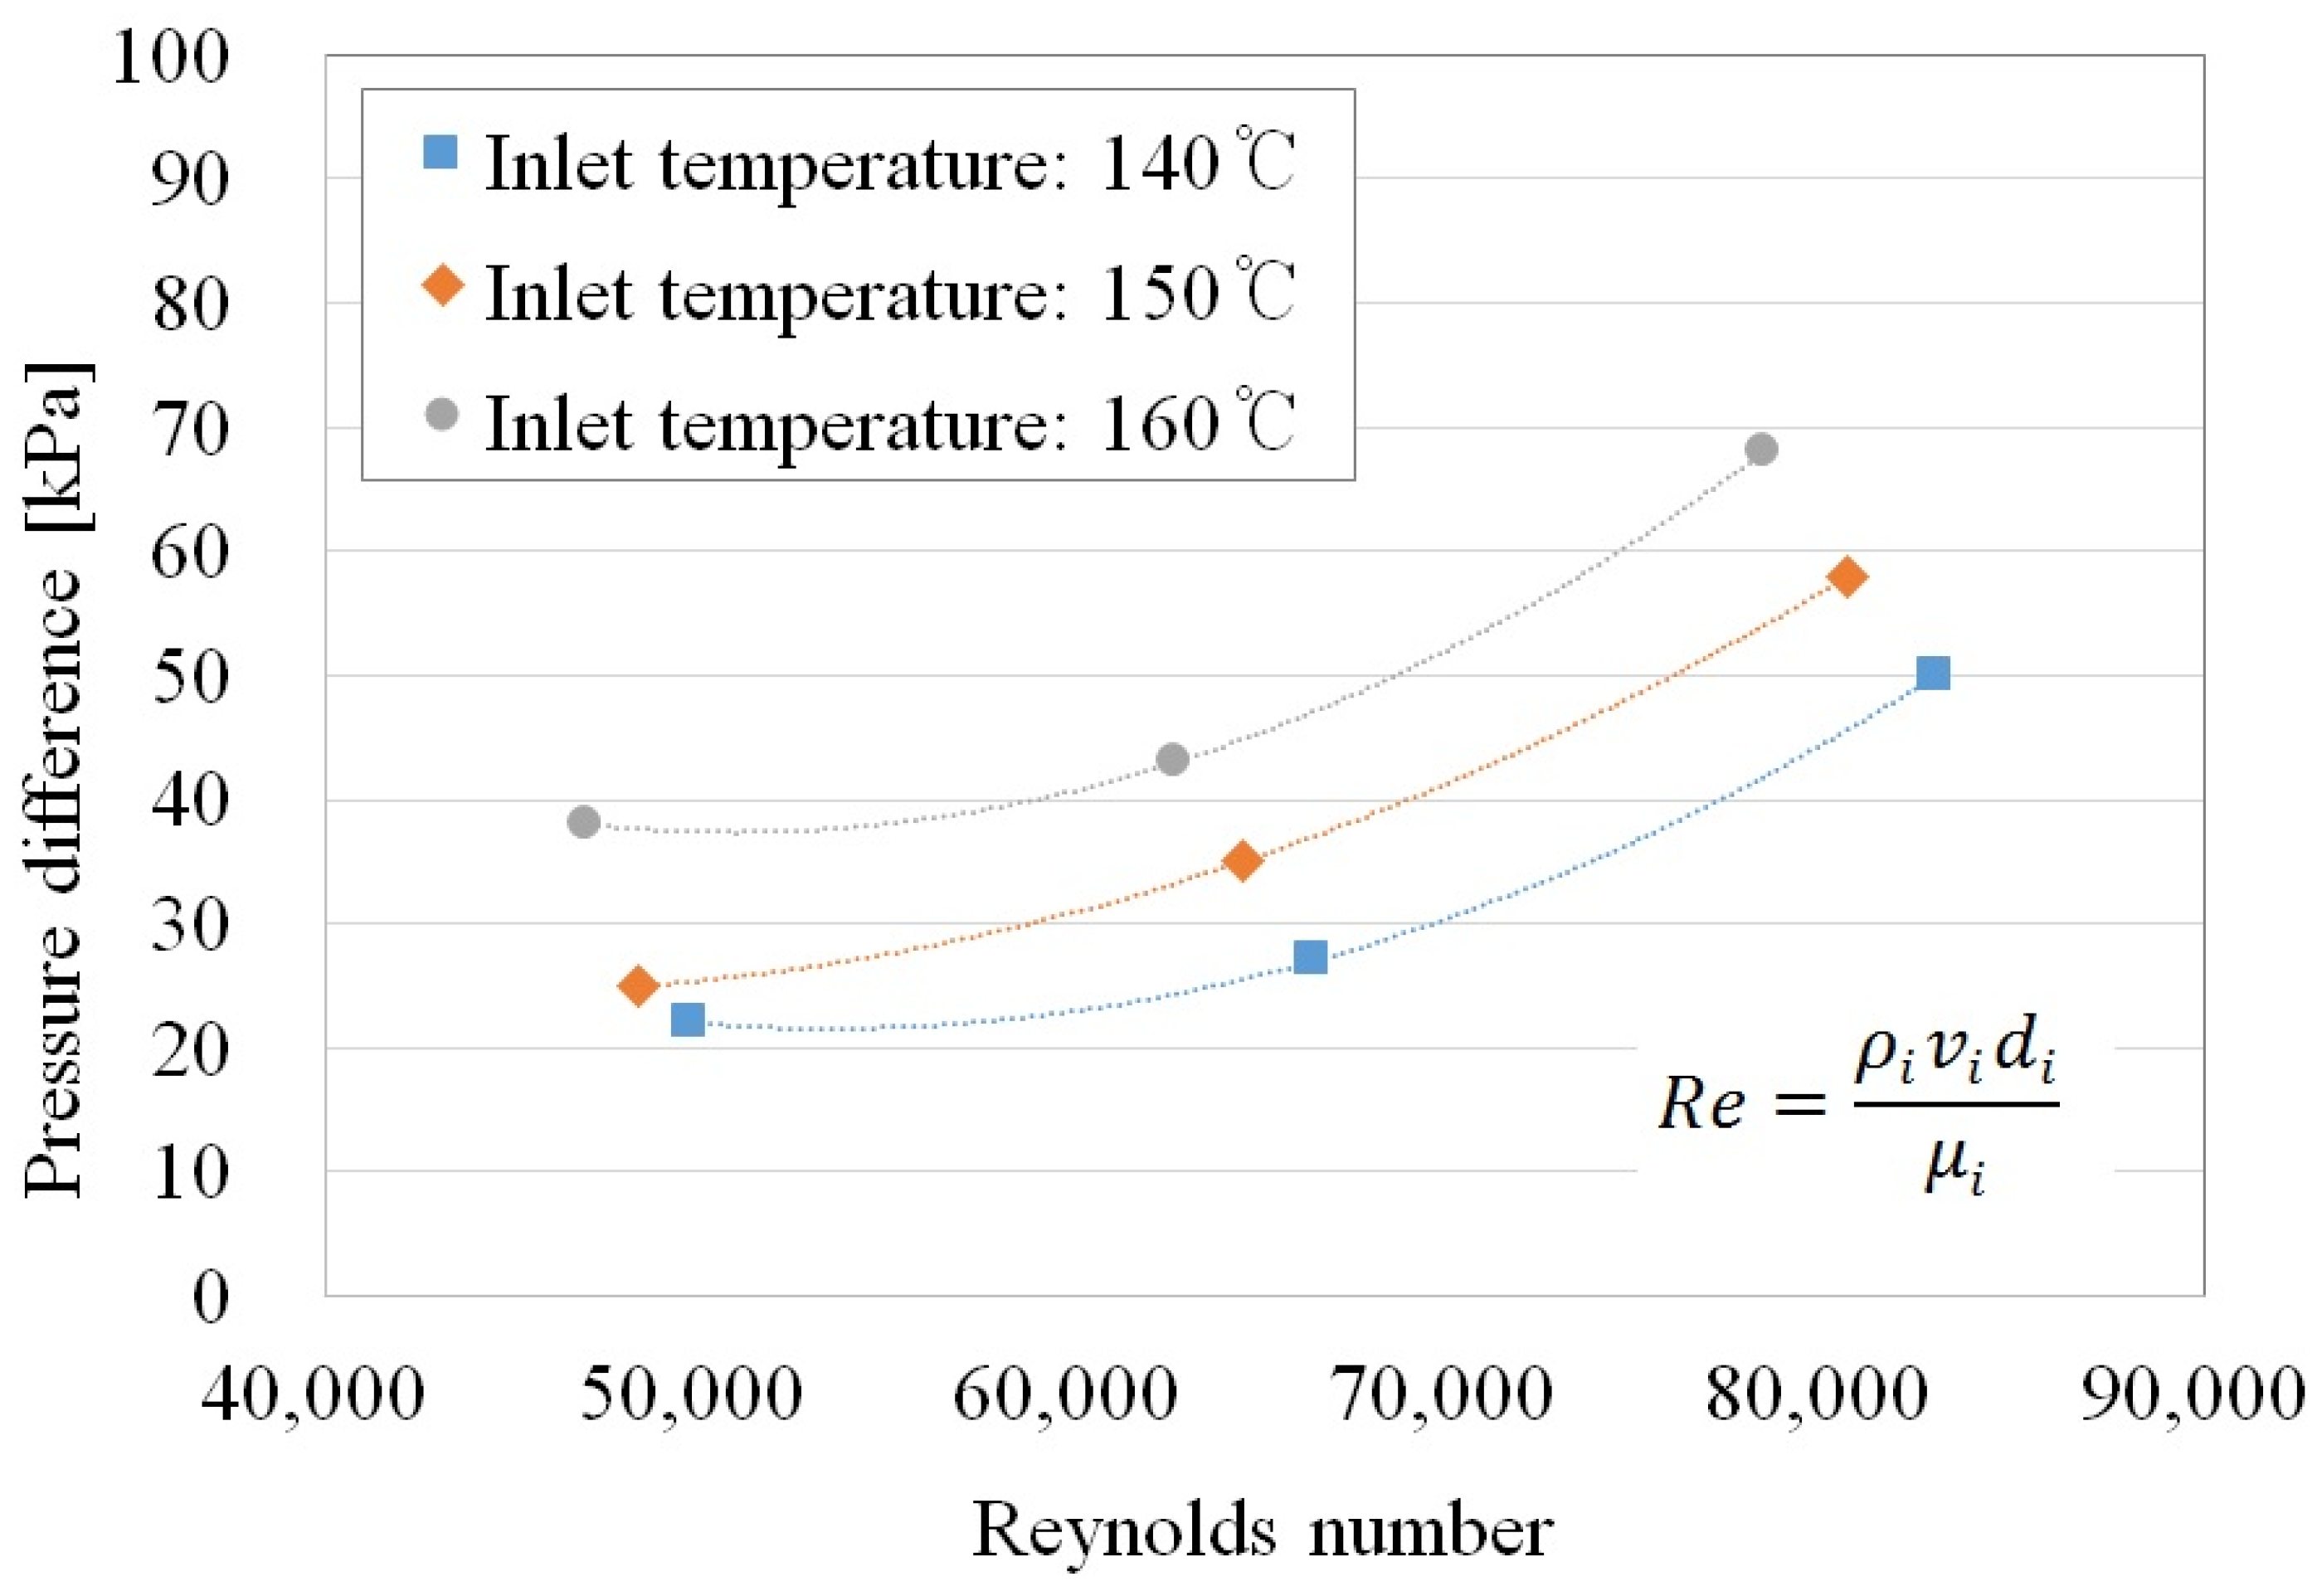
Figure 14.
Comparisons of the heating case and non-heating case according to the Reynolds number.
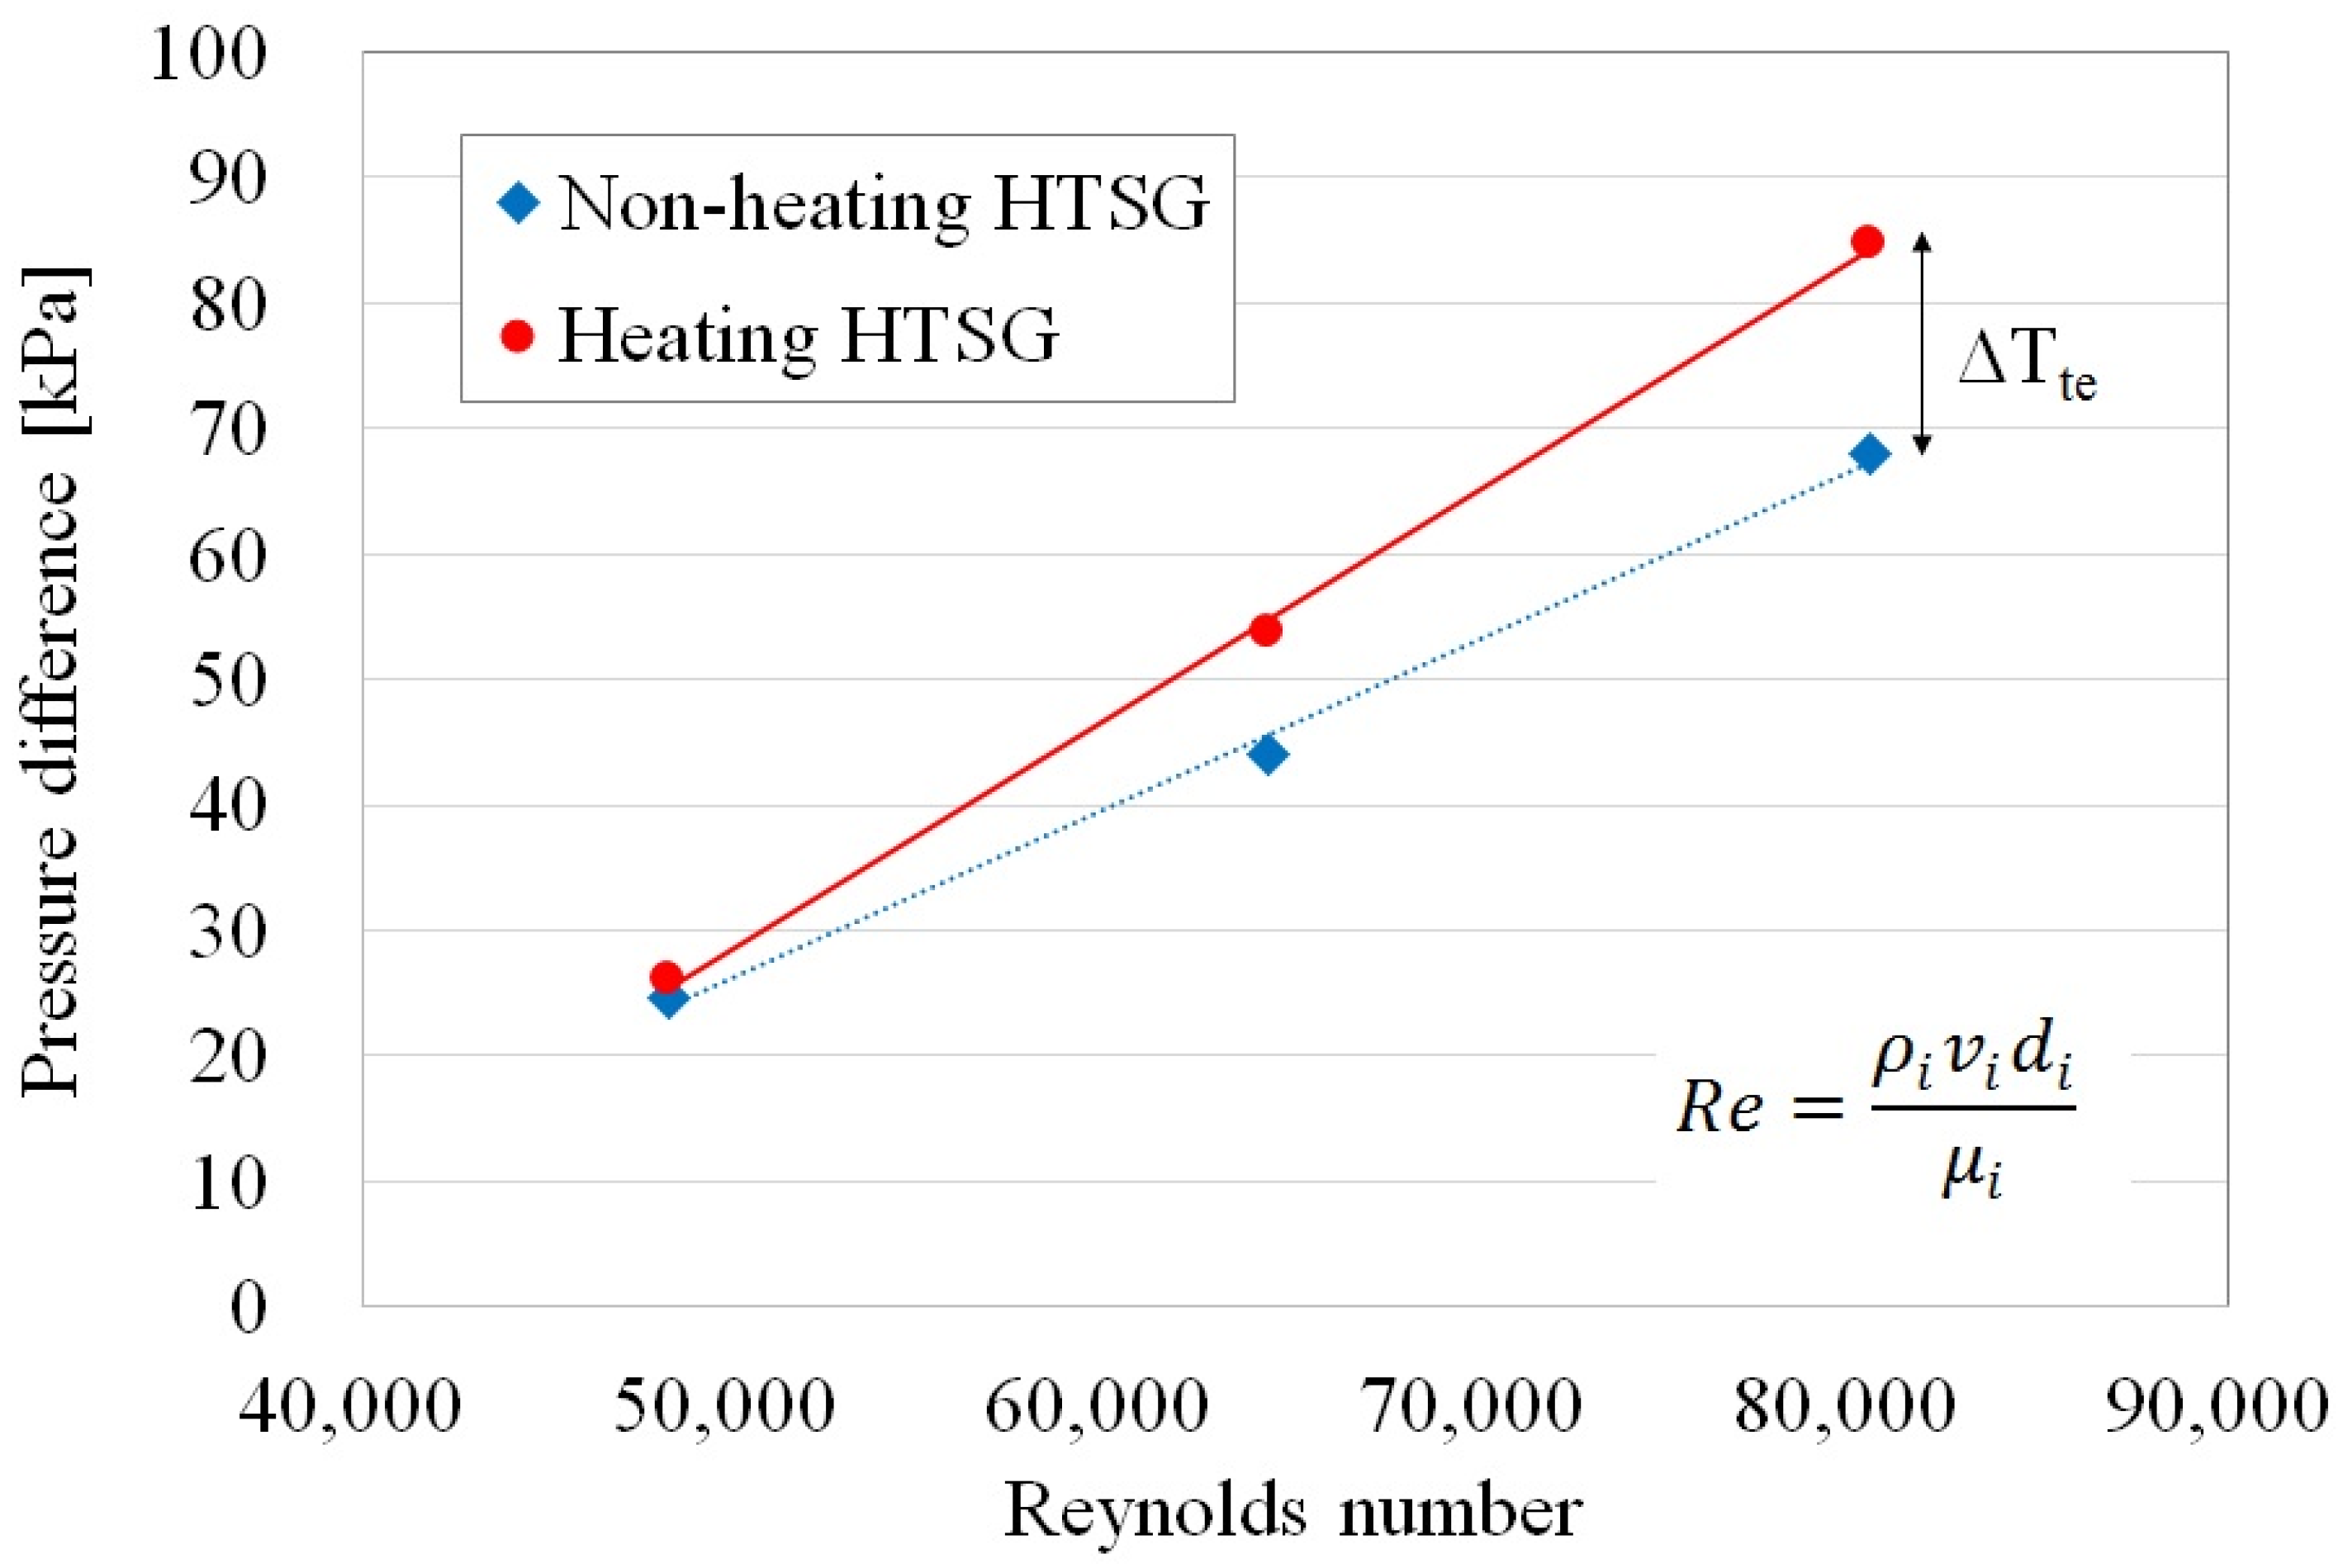
Figure 15.
The additional pressure difference by heating (thermo-extrusion effect).
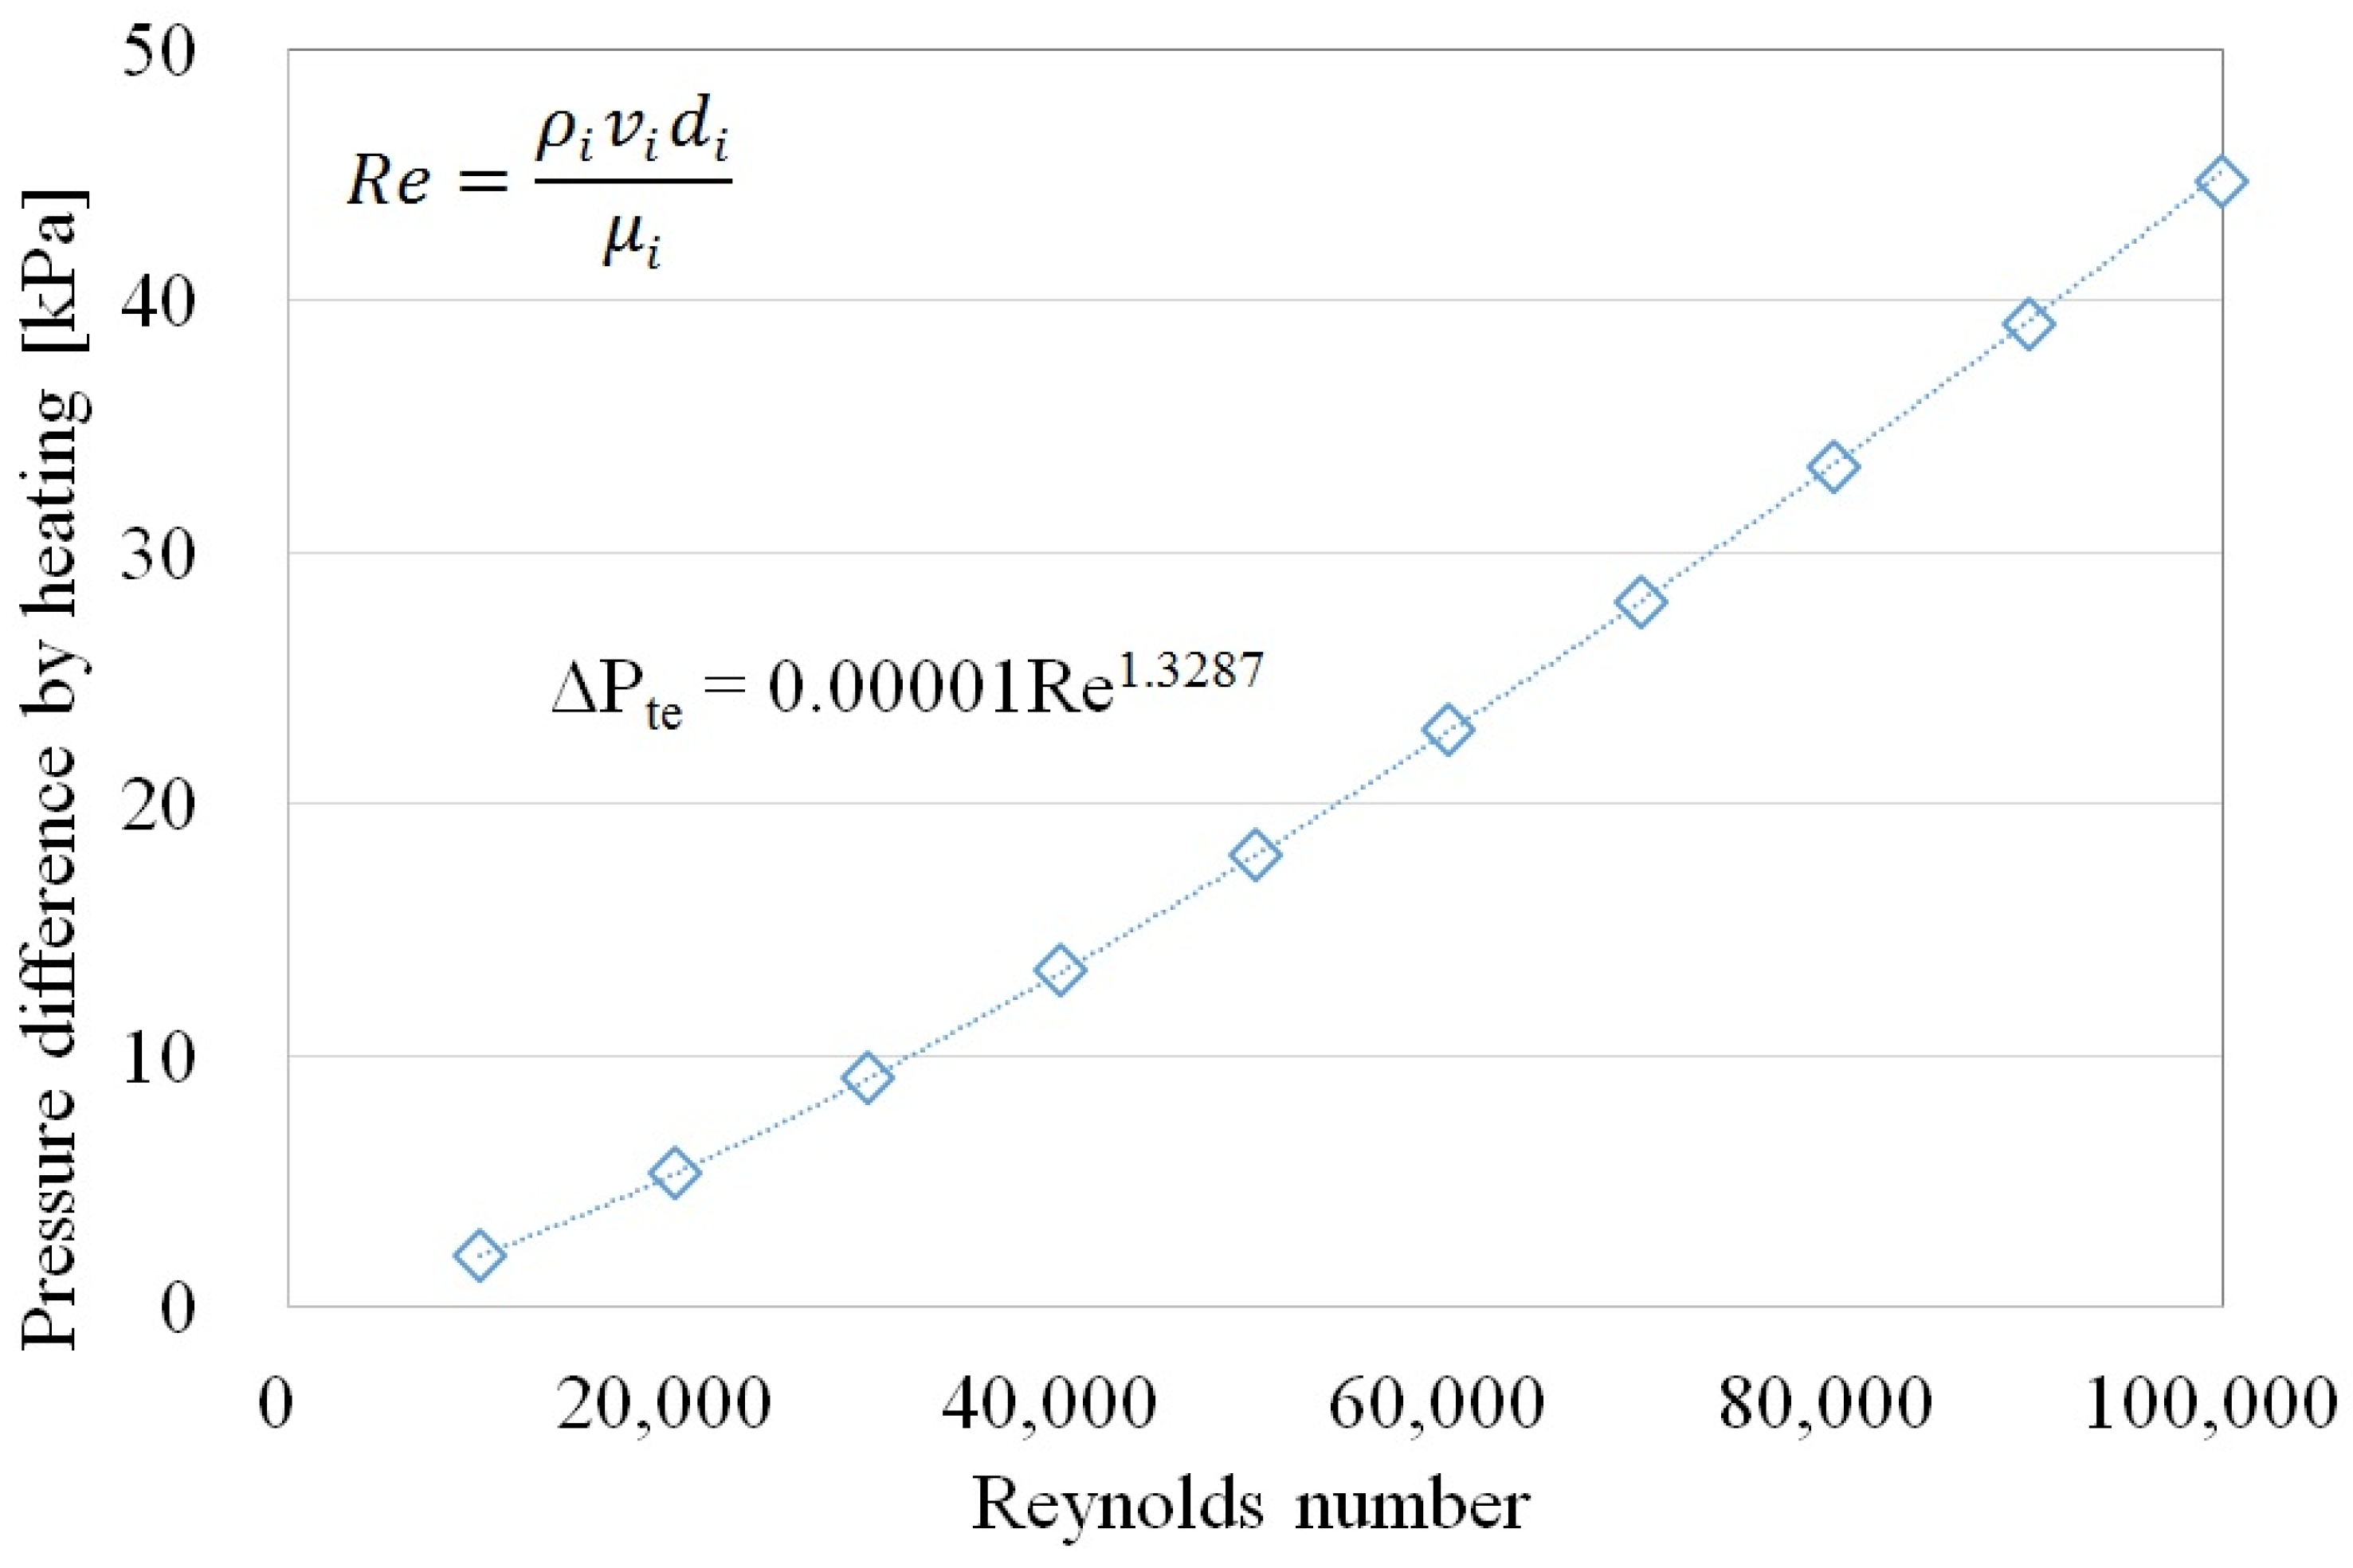
Figure 16.
Comparisons of the calculation results and experimental test results (inlet temperature 151.9 °C approximately).
Figure 16.
Comparisons of the calculation results and experimental test results (inlet temperature 151.9 °C approximately).

Table 1.
Specification of the sensors.
| Sensor | Operating Range | Uncertainty |
|---|---|---|
| Temperature sensor (T, k-type thermocouple) | −200–1250 °C | ±0.02 °C |
| Pressure transducer (P, diaphragm type) | 0–1000 kPa | ±4.71 kPa |
| Mass flowmeter (MF, vortex flowmeter) | 0.02–47.6 t/h | ±0.35 kg/h |
© 2018 by the authors. Licensee MDPI, Basel, Switzerland. This article is an open access article distributed under the terms and conditions of the Creative Commons Attribution (CC BY) license (http://creativecommons.org/licenses/by/4.0/).
Share and Cite
MDPI and ACS Style
Jang, J.; Oh, S.; Cho, C.; Park, S.-R. Design and Experimental Study of HTSG for Waste to Energy: Analysis of Pressure Difference. Energies 2018, 11, 1815. https://doi.org/10.3390/en11071815
AMA Style
Jang J, Oh S, Cho C, Park S-R. Design and Experimental Study of HTSG for Waste to Energy: Analysis of Pressure Difference. Energies. 2018; 11(7):1815. https://doi.org/10.3390/en11071815
Chicago/Turabian StyleJang, Jeachul, Sunhee Oh, Chongpyo Cho, and Seong-Ryong Park. 2018. "Design and Experimental Study of HTSG for Waste to Energy: Analysis of Pressure Difference" Energies 11, no. 7: 1815. https://doi.org/10.3390/en11071815
Note that from the first issue of 2016, this journal uses article numbers instead of page numbers. See further details here.