1. Introduction
It is widely recognized that failures in power transformers usually lead to long outage times and great repair costs. Thus, substantial efforts have been devoted to diagnosing anomalous operation conditions in power transformers after they have been put into service [
1,
2,
3,
4,
5,
6,
7].
In recent years, many high voltage direct current (HVDC) power transmission projects have been constructed in China. When the HVDC transmission system operates in monopole Earth return mode, direct current will flow through the AC power transformer with grounded neutral, which causes DC bias problem [
8]. Normally, the magnetizing current of an AC power transformer is in a sine waveform and has a small amplitude. When DC bias occurs, it becomes seriously distorted and unsymmetrical in appearance. Meanwhile, the magnetic flux in AC transformer core becomes half-saturated and more leakage magnetic flux is present. Since transformer noise and vibration are mainly caused by magnetostriction force in the cores and electromagnetic force in the windings, distorted magnetizing currents will induce numerous high-order harmonic frequency components in the vibration forces. Consequently, local overheating, insulation damage, winding deformation, anomalous noise and vibration are generated in the transformers, which can lead to disastrous failures [
9,
10]. Therefore, DC bias is viewed as a great threat to the safe operation of AC power transformers.
In order to control the DC bias of power transformers in service, determination of DC bias condition is a primary issue. The most direct and simple method on-site is a neutral current test. A tong-type ammeter is placed at the transformer neutral by the operation staff. Then, the current value is displayed and manually recorded. However, a large number of AC power transformers are exposed to the influence of DC bias when the HVDC transmission system operates in monopole Earth return mode. These transformers are commonly tens of miles apart in distance. In this case, this off-line test method has obvious shortcomings of inefficiency and high labor costs. As an improved approach, the current-test based on-line monitoring technique is developed [
8]. Hall sensors are installed at the grounded neutral of power transformers. The measured current data are transmitted to remote server by GPRS network. This current on-line monitoring method enhances the test efficiency to some degree. However, in order to install the Hall sensor, the neutral disconnector usually has to be disconnected in advance for safety consideration in the field operation process. Moreover, these current-test based methods are precluded from DC bias diagnosis when applied to autotransformers with its neutral grounded by power capacitors. Because of the special winding structure, the primary and secondary coils of autotransformers have part of their turns in common, which offering the possibility of the direct current flowing from the secondary power grid to the primary and results in DC bias.
The vibration on transformer oil tank is caused by that of core and windings after a complex transmission process. Thus, the operation condition of transformer core and windings can be observed through vibration detection on the oil tank surface [
11,
12,
13,
14]. According to field test results, the vibrations of transformer oil tanks increase simultaneously with increasing direct current flowing into the neutral. Therefore, vibration tests can be employed as a substitute method to detect DC bias in power transformers.
Hitherto, some efforts have been devoted to investigate the vibration and noise characteristics of power transformers under DC bias conditions [
15,
16,
17,
18,
19,
20,
21,
22]. In these studies, the time- and frequency-domain characteristics of transformer noise and vibration in DC bias condition are tested, but only amplitude variation is not enough to recognize DC bias because of the inexplicit features and recognition methods [
18,
19,
20]. Some further investigations are carried out, in which some vibration features (e.g., spectral energy, waveform distortion ratio) of a DC-biased transformer are introduced [
21,
22], but how to optimize these features and realize automatic DC bias recognition for on-site application is never mentioned in these contributions.
One way to overcome these problems encountered in the process of determining DC bias condition is the application of vibration feature extraction and pattern recognition technology. With this technology, the DC bias status can be tested with no electrical contact with the power transformer and can be diagnosed automatically without manual intervention. Combined with data remote transmitting techniques, a distributed diagnosis network can be realized, which highly increases the safety, efficiency and effectiveness of DC bias tests.
The main purpose of this paper is to propose a systematic vibration-test based method to diagnose DC bias in power transformers. Although transformer vibrations are sensitive to many other factors like applied voltage, load current and harmonics, the influence of these factors are neglected in our study. On the one hand, the power quality of the power grid is strictly controlled, especially for the high voltage transformers over 500 kV. On the other hand, according to current studies, load current variation has a minor influence to the diagnosis result of DC bias because the frequency components of transformer vibration show nearly no discrepancy under different load currents. The organization of this paper is as follows: initially, in order to analyze the vibration variations, field vibration tests of a 500 kV autotransformer are carried out when the ±800 kV HVDC transmission system from Jiuquan to Hunan operated in ground return mode. Then, a few vibration features are defined and the extraction and recognition method are introduced. Finally, the proposed method is verified by field test data and a remote monitoring and automatic diagnostic prototype instrument based on this method is presented. The proposed method could provide technical support for DC bias detection and long-term monitoring of power transformers.
2. Field Vibration Tests
The ±800 kV Jiuquan-Hunan HVDC power transmission system starts from the Jiuquan converter station in Gansu Province and ends in the Shaoshan converter station in Hunan Province of China. In the trial operation process of the system with monopole Earth return mode, the transmitting power increases to 2000 MW in several stages within 150 min. A 500 kV single-phase autotransformer close to the grounding electrode is under the influence of DC bias. Its vibration is continuously measured during the power increasing process of the system.
2.1. Test Settings
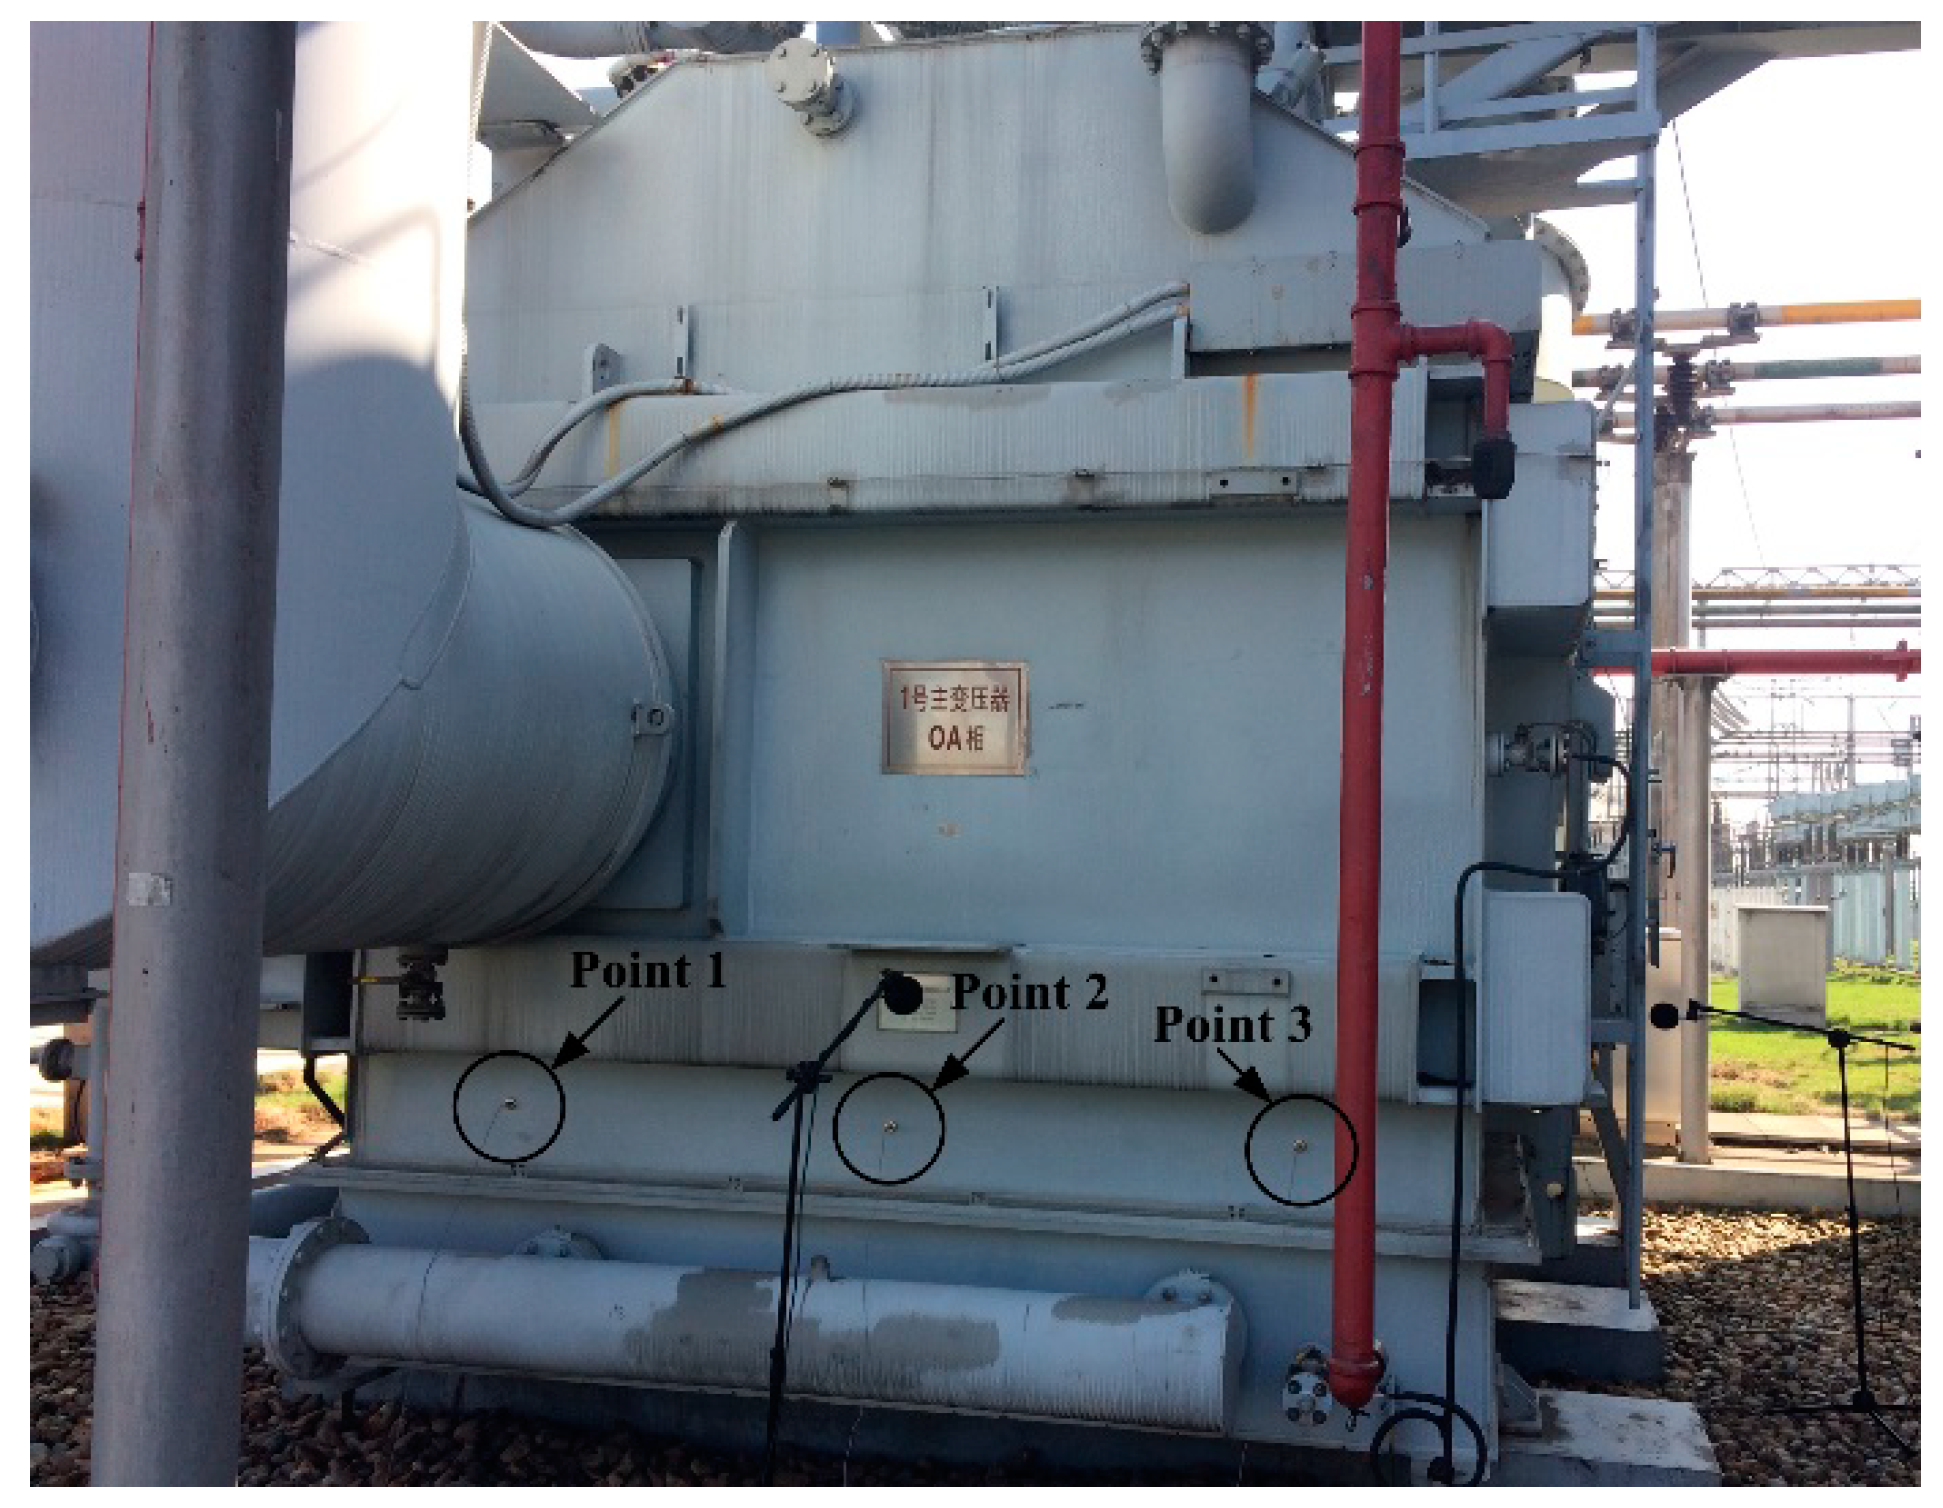
The frequency band of transformer vibration is commonly in the 50 Hz–2 kHz range. To detect the vibration in this range, a B&K 4534 accelerometer is used, which is a sensor with a frequency response range of 0.2 Hz–12.8 kHz. Its sensitivity and scope are 100 mV/g and ±70 g, respectively. The signals from the sensors are input to B&K 3053 data acquisition module for multi-channel synchronous sampling. The sampling frequency is 32,768 Hz. Location determination of the measurement point is always a practical issue encountered in the vibration test of power transformers. As the vibration on the oil tank surface is the composite result of the core and winding vibrations, gathering more information about both the core and winding is essential for effective vibration measurement. In addition, stiffeners on the outer surface increase the structure nonlinearity of the tank, leading to spectral and amplitude variation of the vibration signal. Thus, choosing the measurement positions is influential to the vibration test result. These positions should be sensitive to the vibrations of the core and windings. At these positions, the vibration signals have little attenuation and the spectra are not obviously influenced by the structure of the oil tank. According to the previous research achievement, three accelerometers are installed on the plane area roughly one-fourth of the transformer oil tank with magnetic seats [
11]. Locations of the vibration measurement points on a 500 kV autotransformer are shown in
Figure 1. These measurement points are uniformly distributed on the oil tank.
2.2. Vibration Test and Analysis
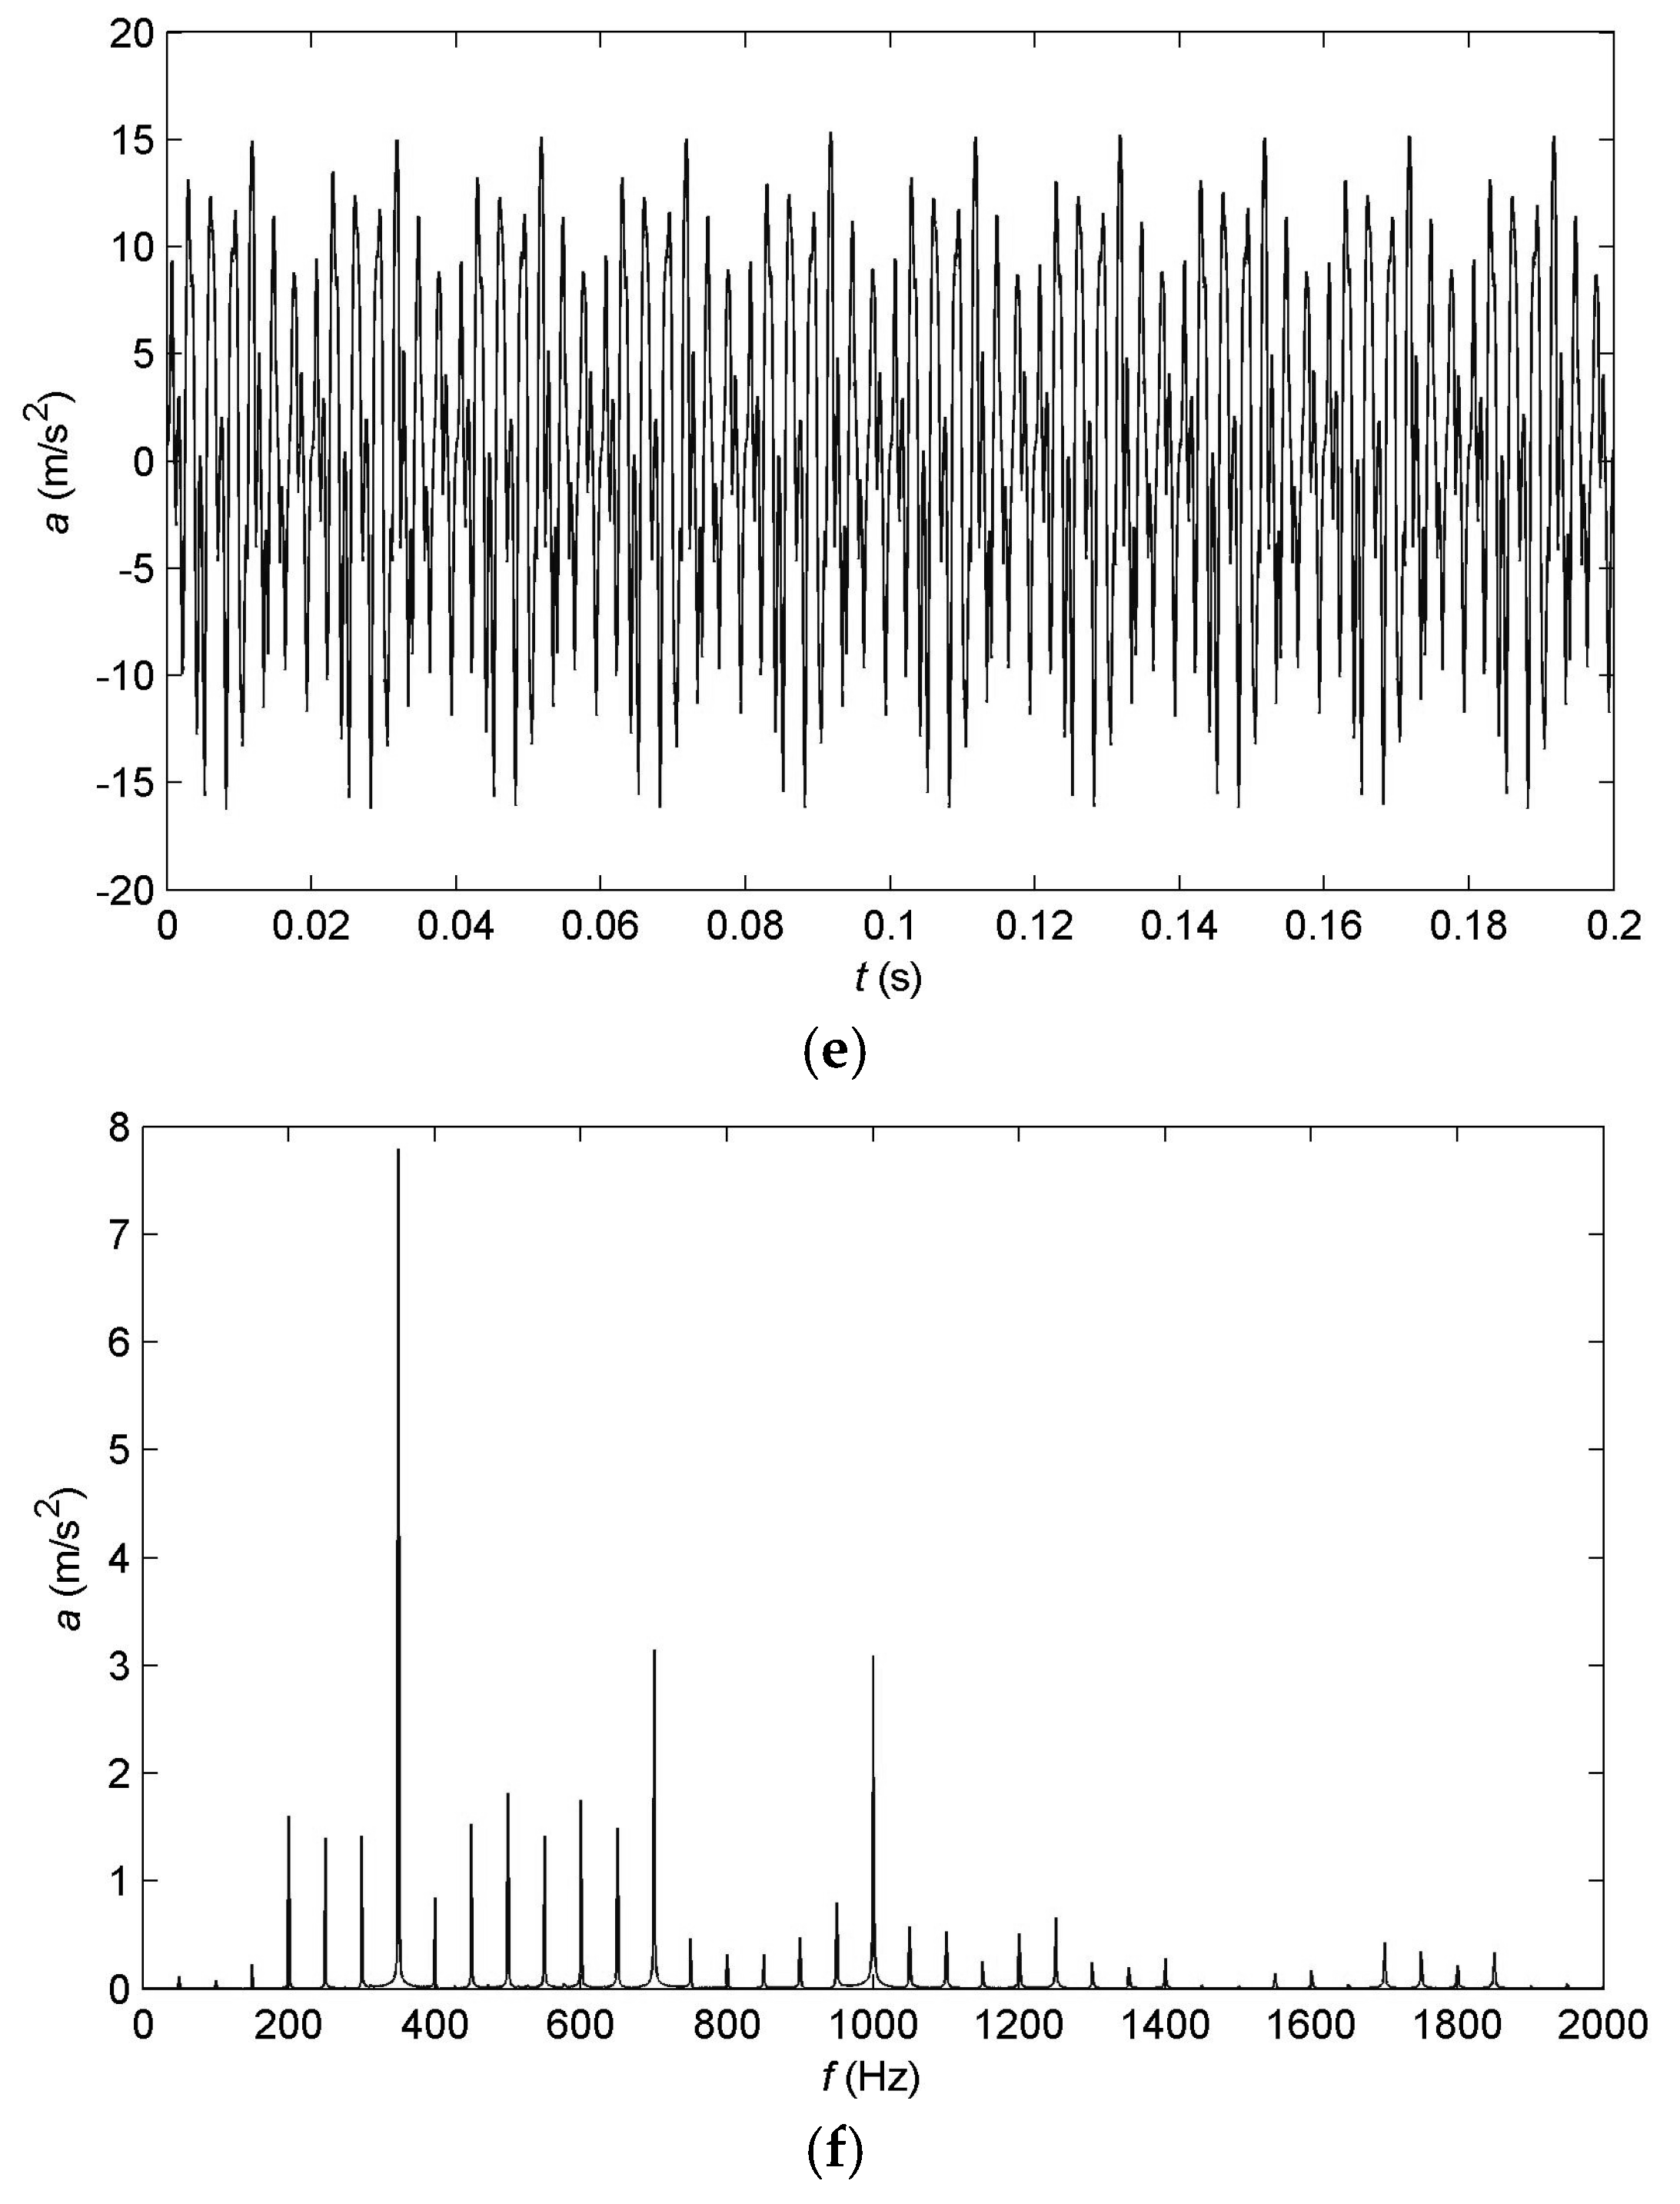
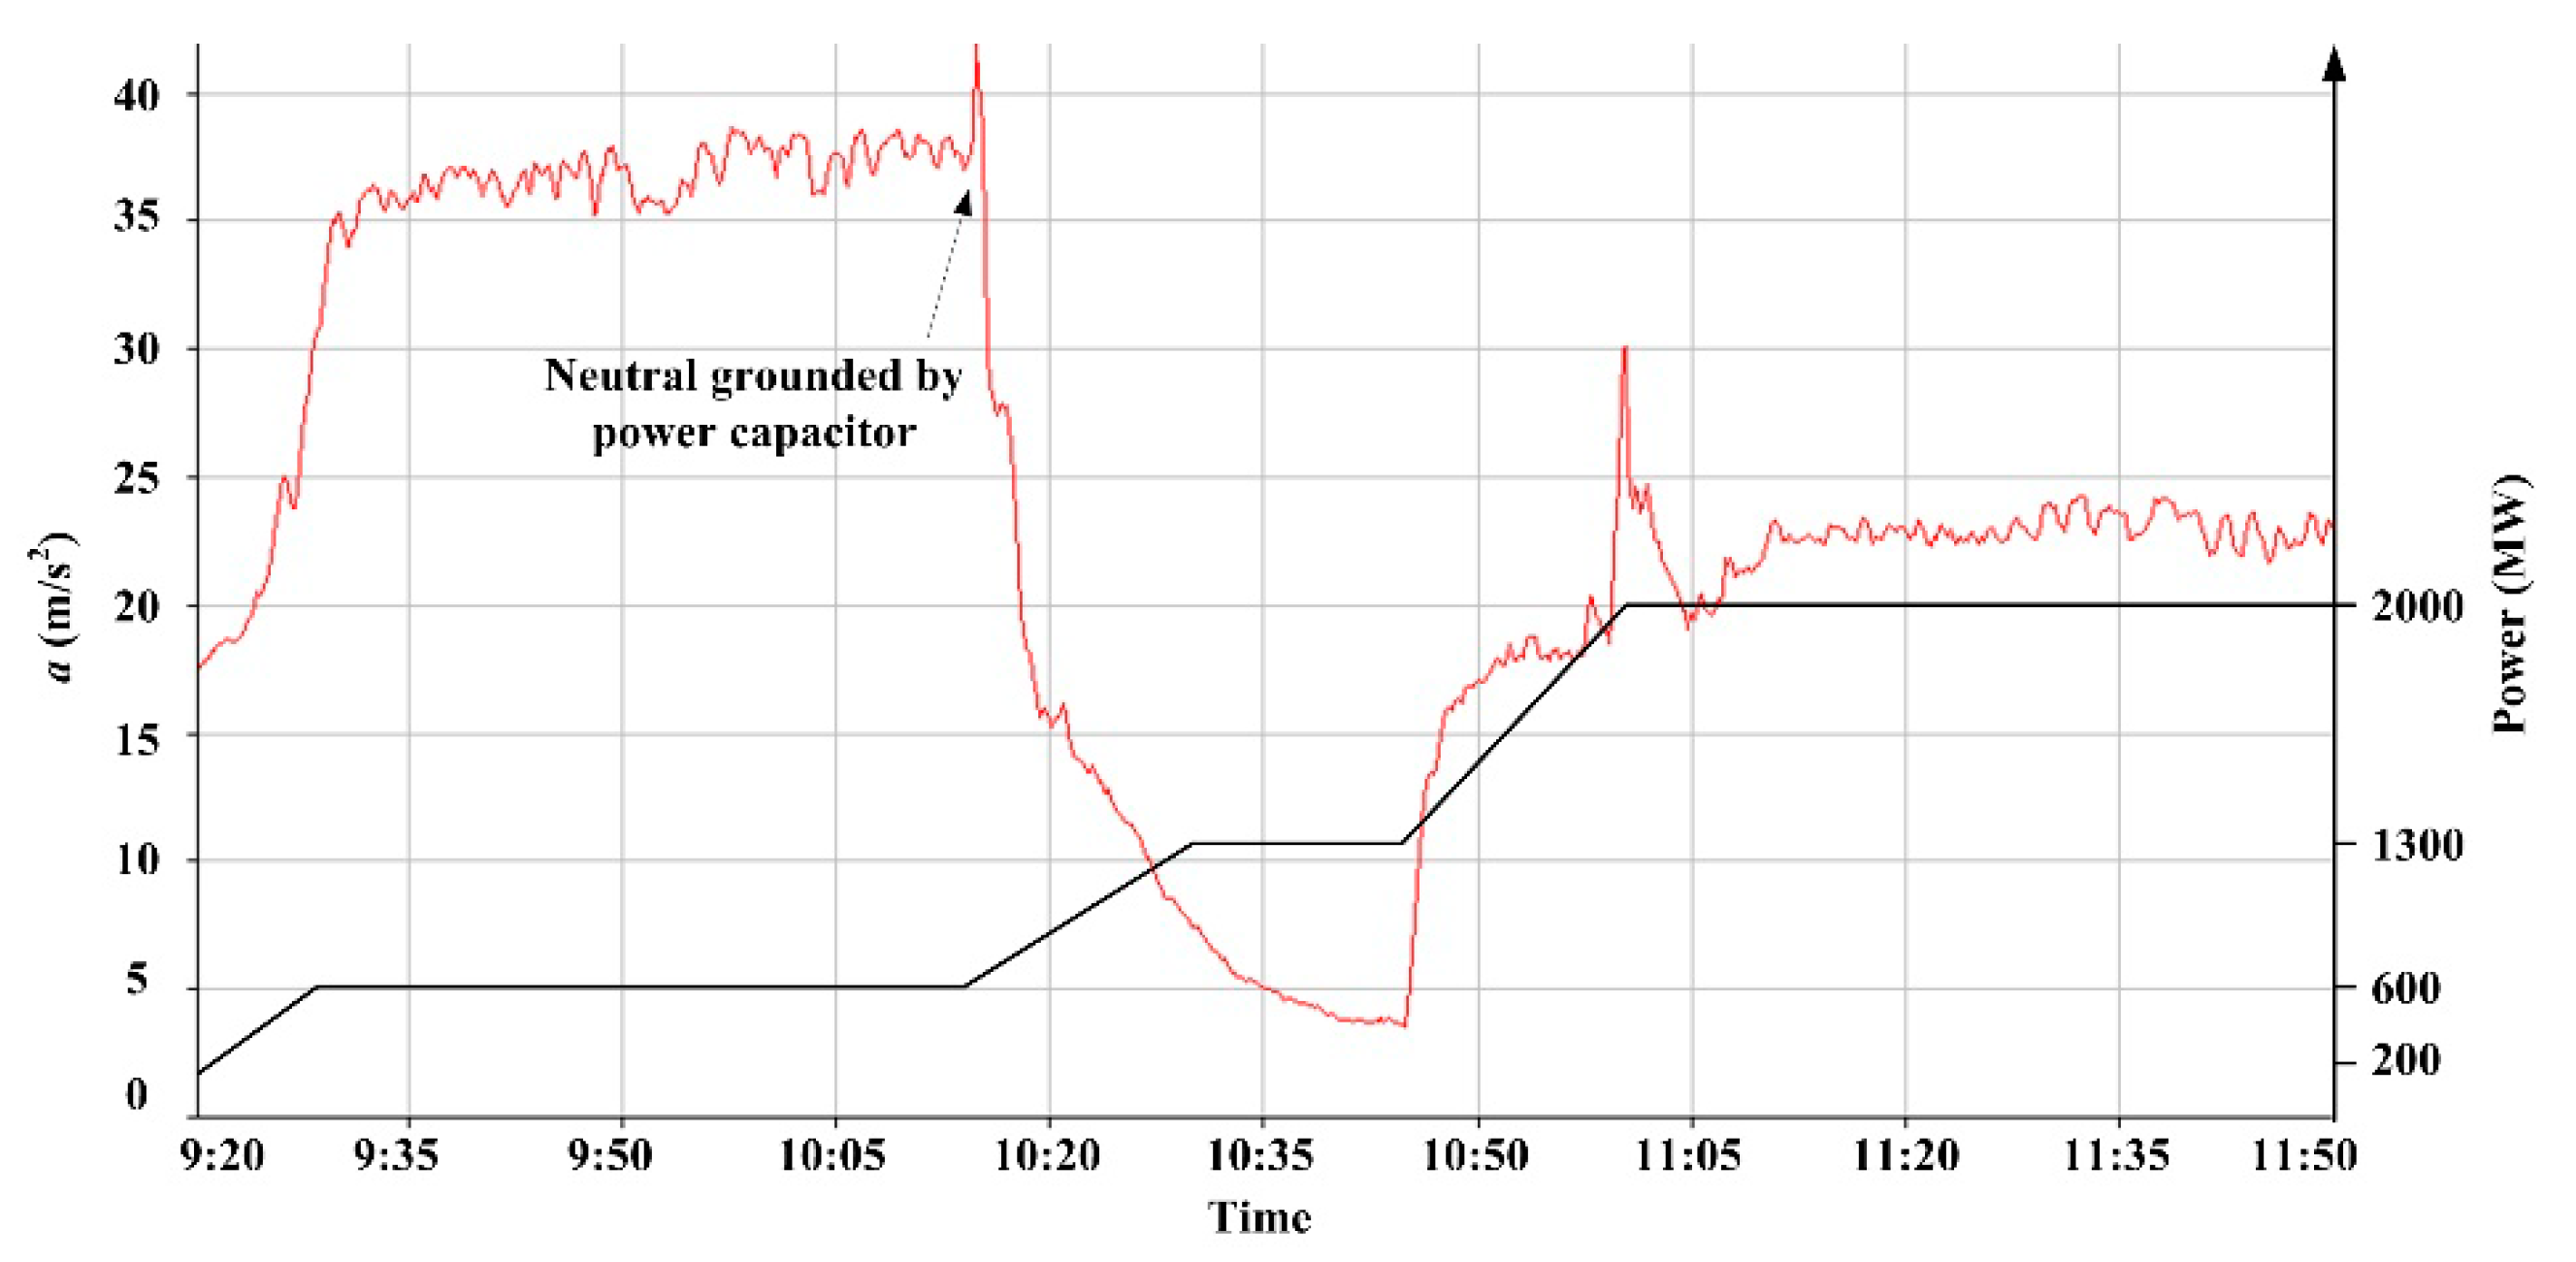
When DC bias occurs, vibration on the oil tank surface of power transformers will obviously increase. Without loss of generality, the vibration of measurement point 2 is chosen to detect the influence of DC bias on the autotransformer. The time varying process of the transformer vibration is shown in
Figure 2.
Before increasing the transmitting power of the UHVDC system, the transformer neutral is grounded with automatic switching power capacitor in advance. In normal conditions, the neutral is directly grounded. Once the direct current goes beyond the threshold value, the power capacitor will be automatically connected between the neutral and ground, blocking the passage of the direct current. When the transmitting power increases from 200 MW to 600 MW, the vibration acceleration increases from 17.5 m/s2 to 35.0 m/s2. It remains stable when the transmitting power becomes invariant. With the further increasing of transmitting power, the direct current flowing into the neutral reaches the threshold value 15.0 A and the power capacitor is connected. The vibration acceleration drops off rapidly to normal level even in this process the transmitting power is still rising up. However, sudden rise of vibration acceleration is found when the transmitting power increases from 1300 MW to 2000 MW. Obvious amplitude fluctuation presents when the transmitting power reaches 2000 MW. Finally, the vibration amplitude increased to 23.0 m/s2. Apparently, DC bias occurs again even after the blocking capacitor is used. In this condition, traditional current testing method fails to diagnosis DC bias in autotransformers.
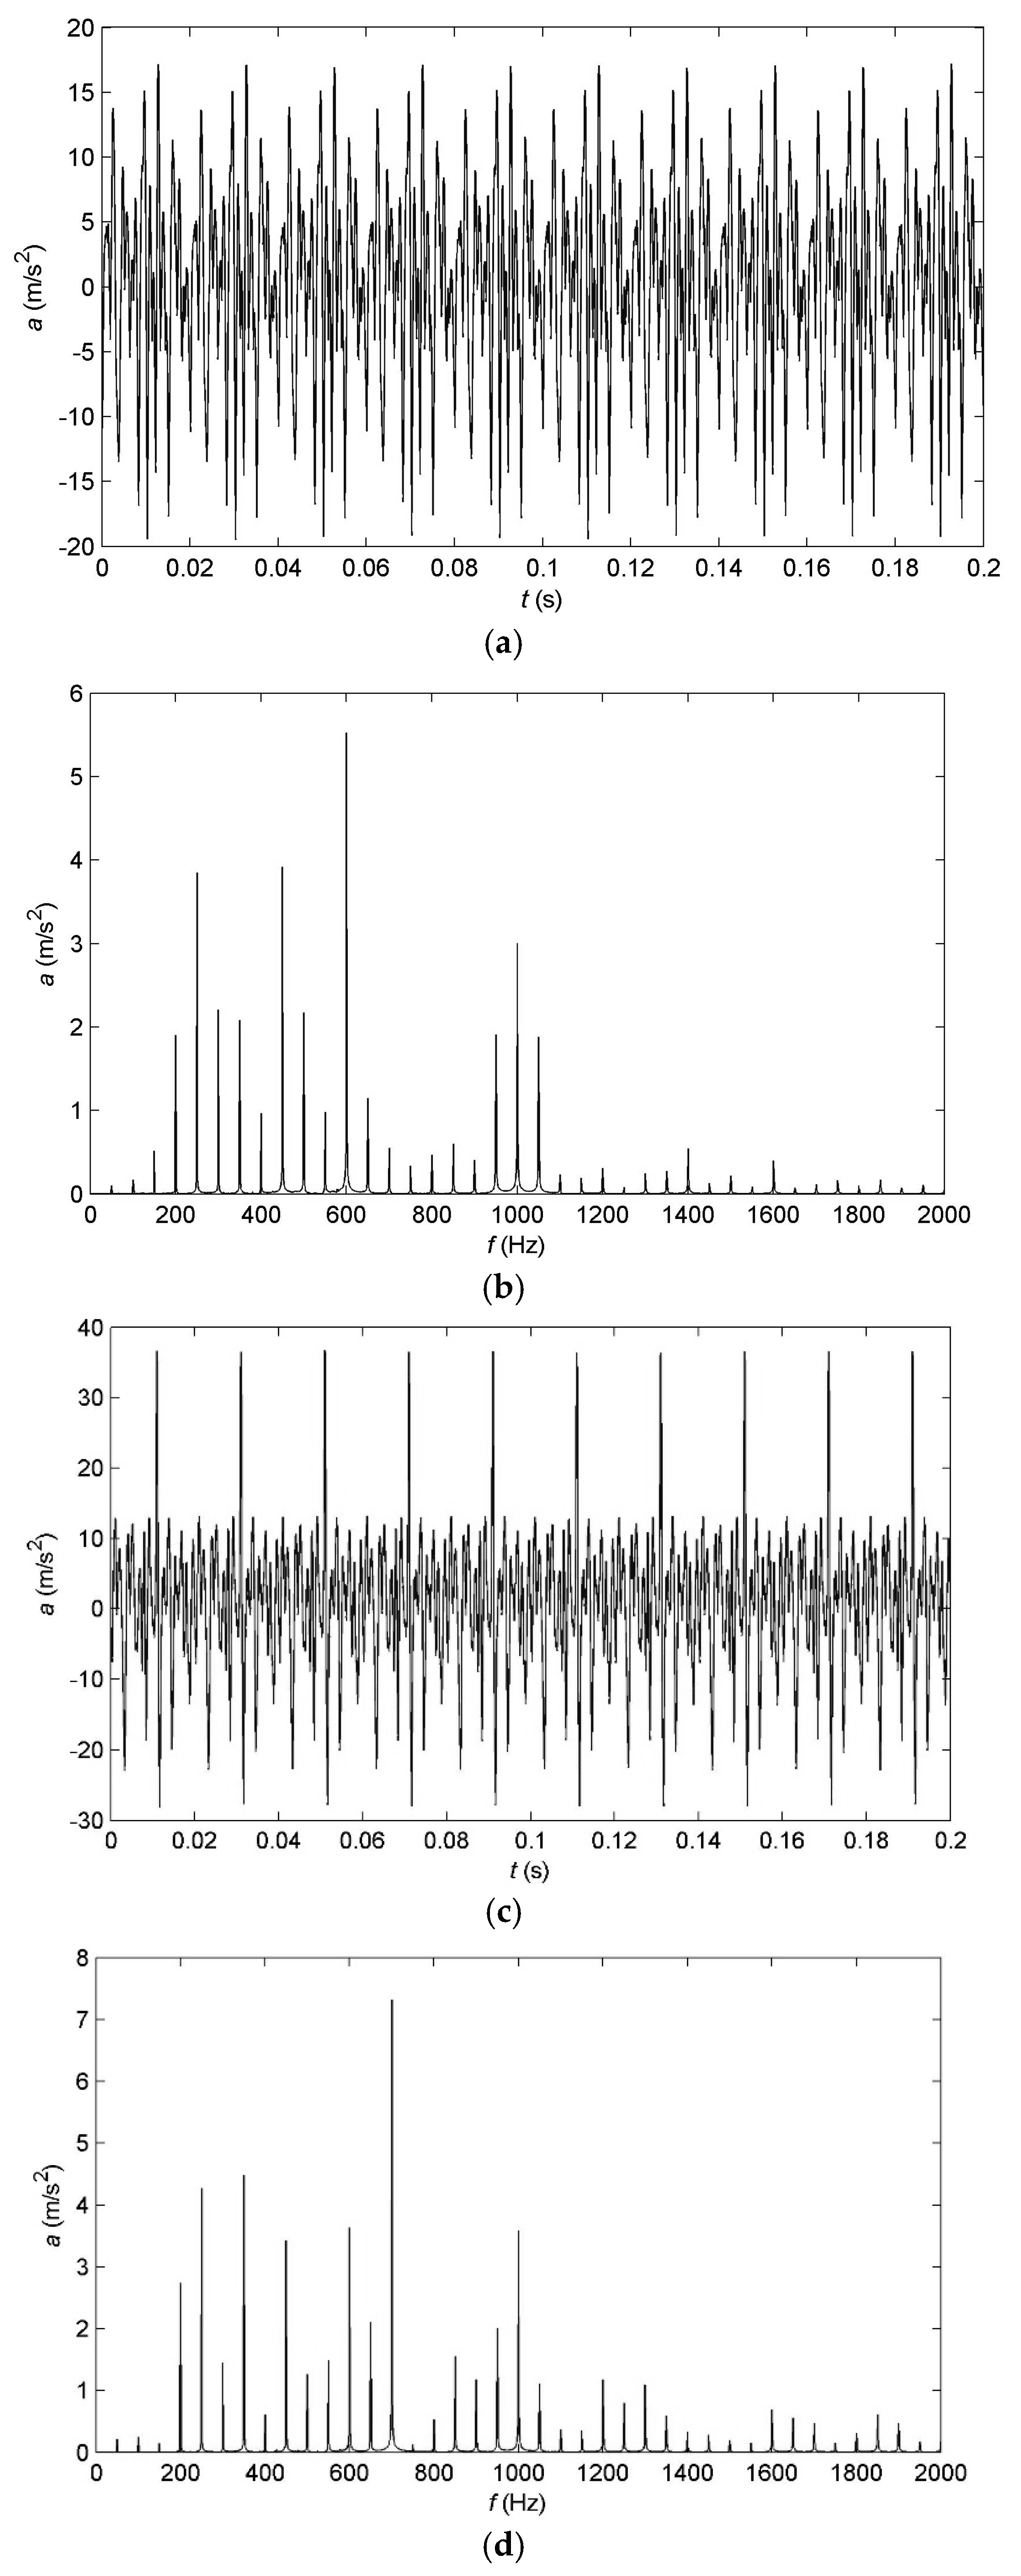
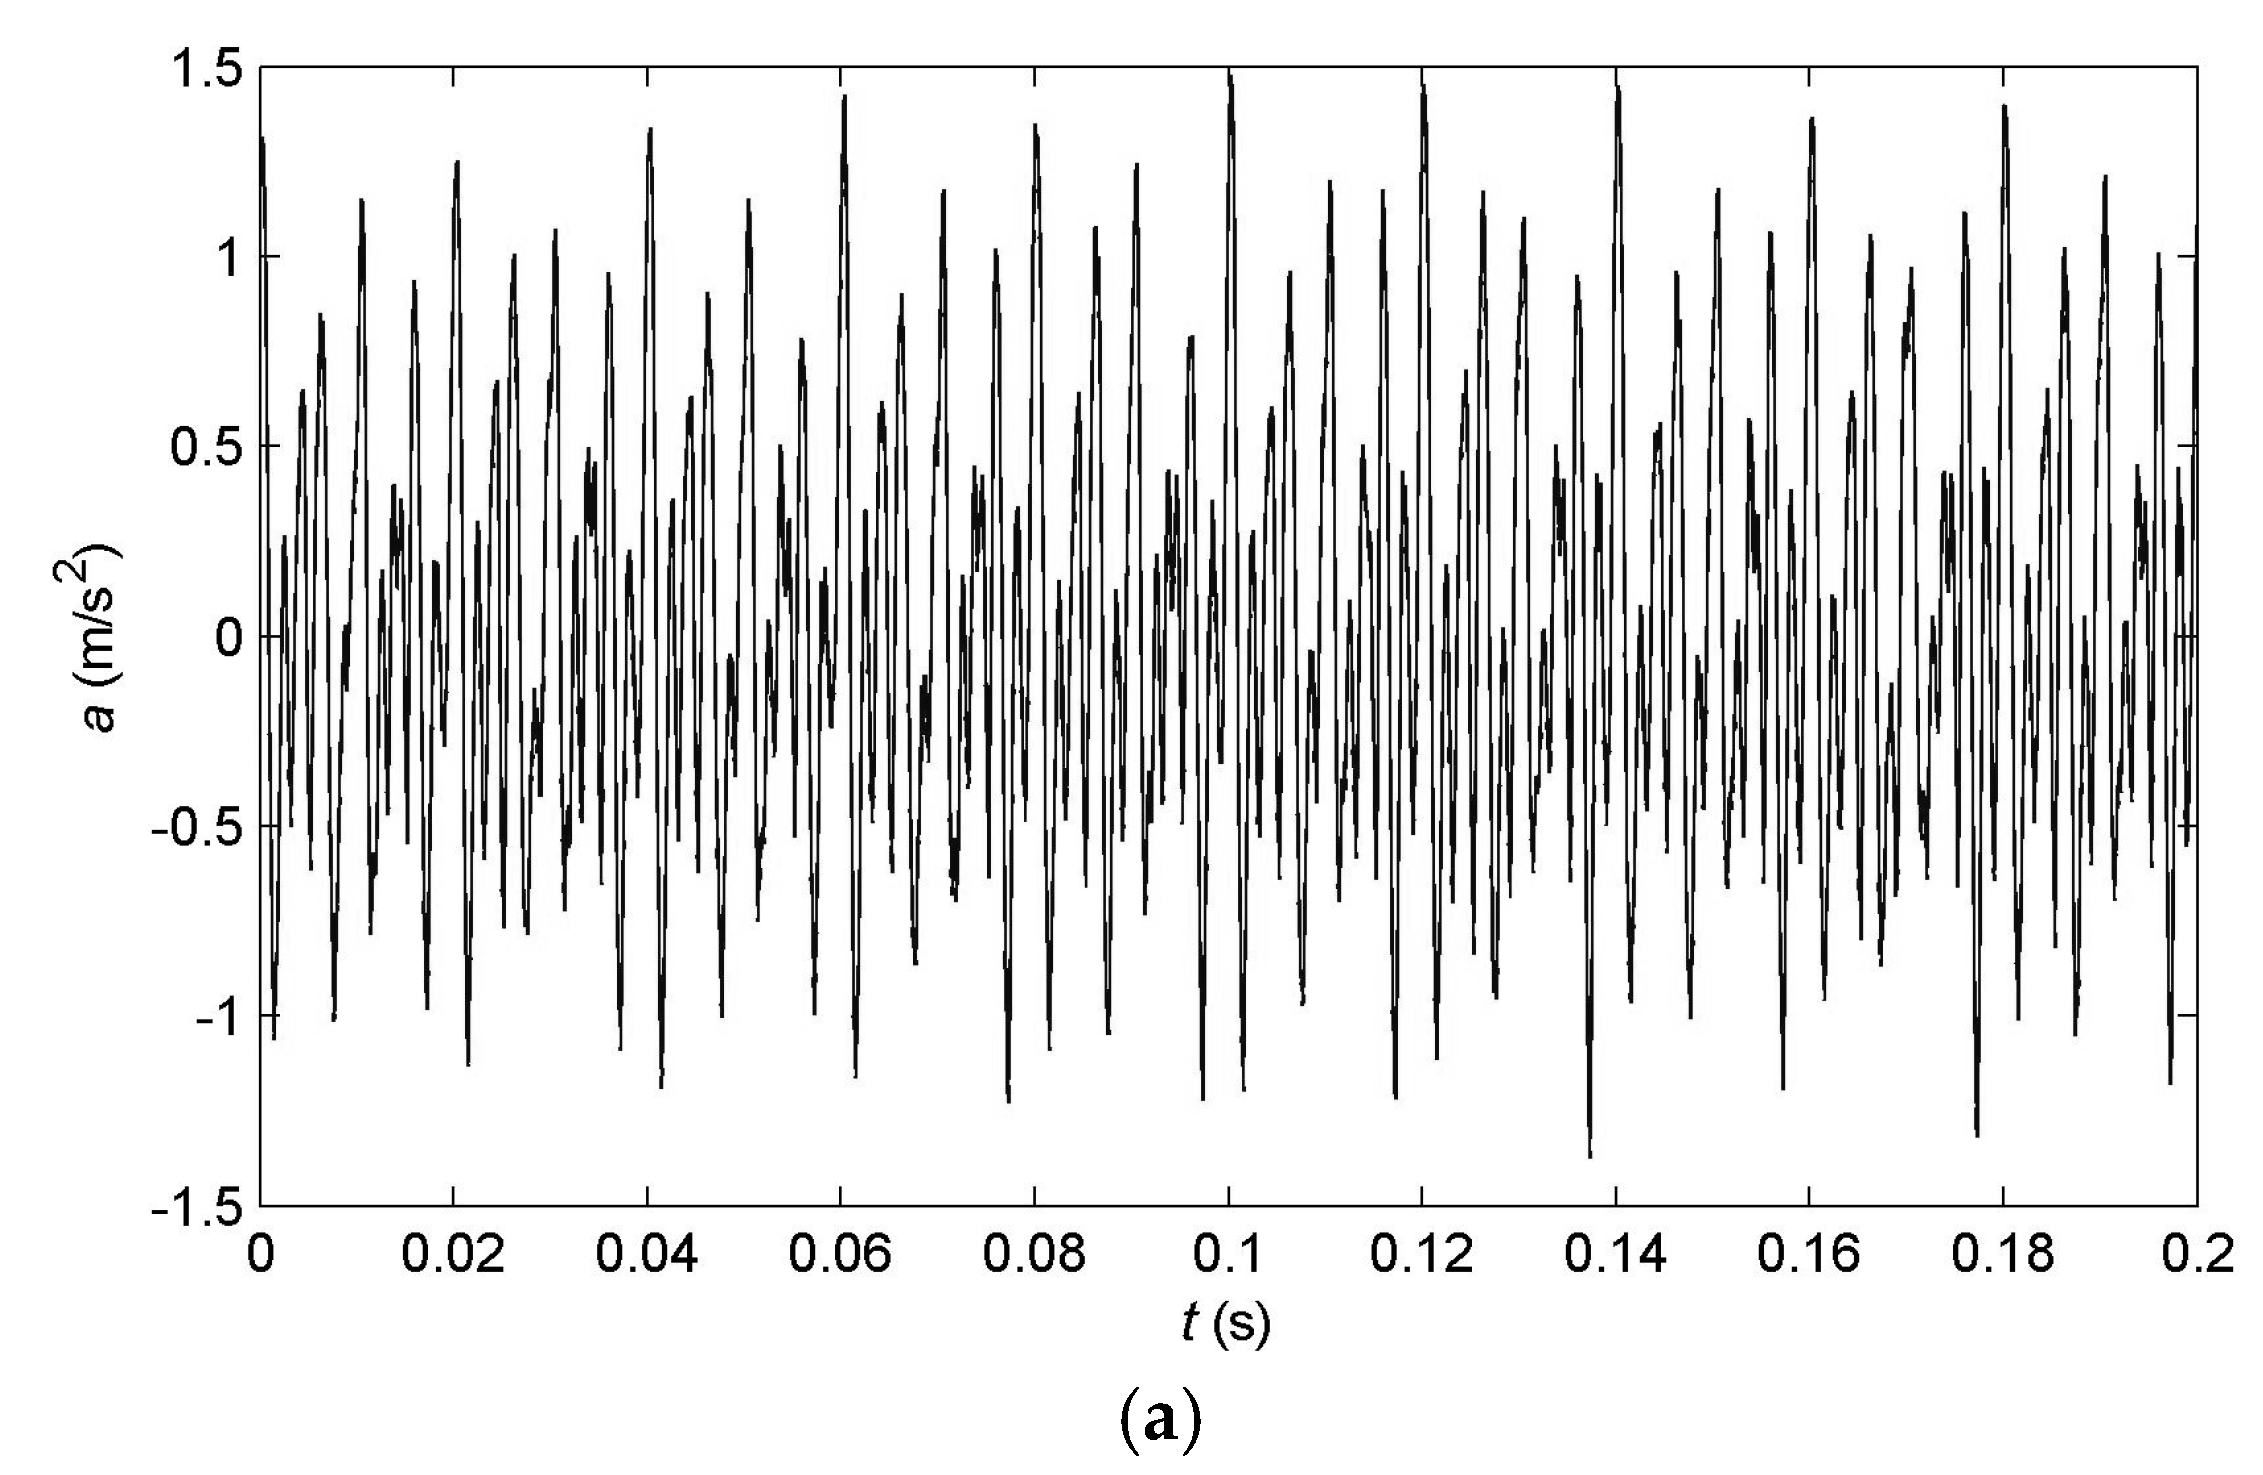
The transformer vibration in normal operation condition without DC bias is measured. As transformer vibration is approximately in stable state, the vibration could be viewed as a periodic signal in seconds. Fast Fourier transform is conducted to obtain the frequency spectrum. The vibration waveforms and spectrum distributions of the measurement points on the oil tank of the transformer without DC bias are given
Figure 3. As shown in
Figure 3a,c,e, in normal conditions, the vibration acceleration amplitude of the measurement point 1 to 3 are about 1.5 m/s
2, 2.2 m/s
2 and 1.7 m/s
2, respectively. The upper limits of the frequency in
Figure 3b,d,e are set to be 2 kHz for transformer vibration spectrum is mainly in this range. The majority of the frequency components are in the range of 1 kHz. The dominant frequencies of the three vibration measurement points are 200 Hz, 200 Hz and 300 Hz, respectively. As shown in
Figure 3b,d,e, the main frequency components of the transformer vibration without DC bias are at the integral multiples of 100 Hz.
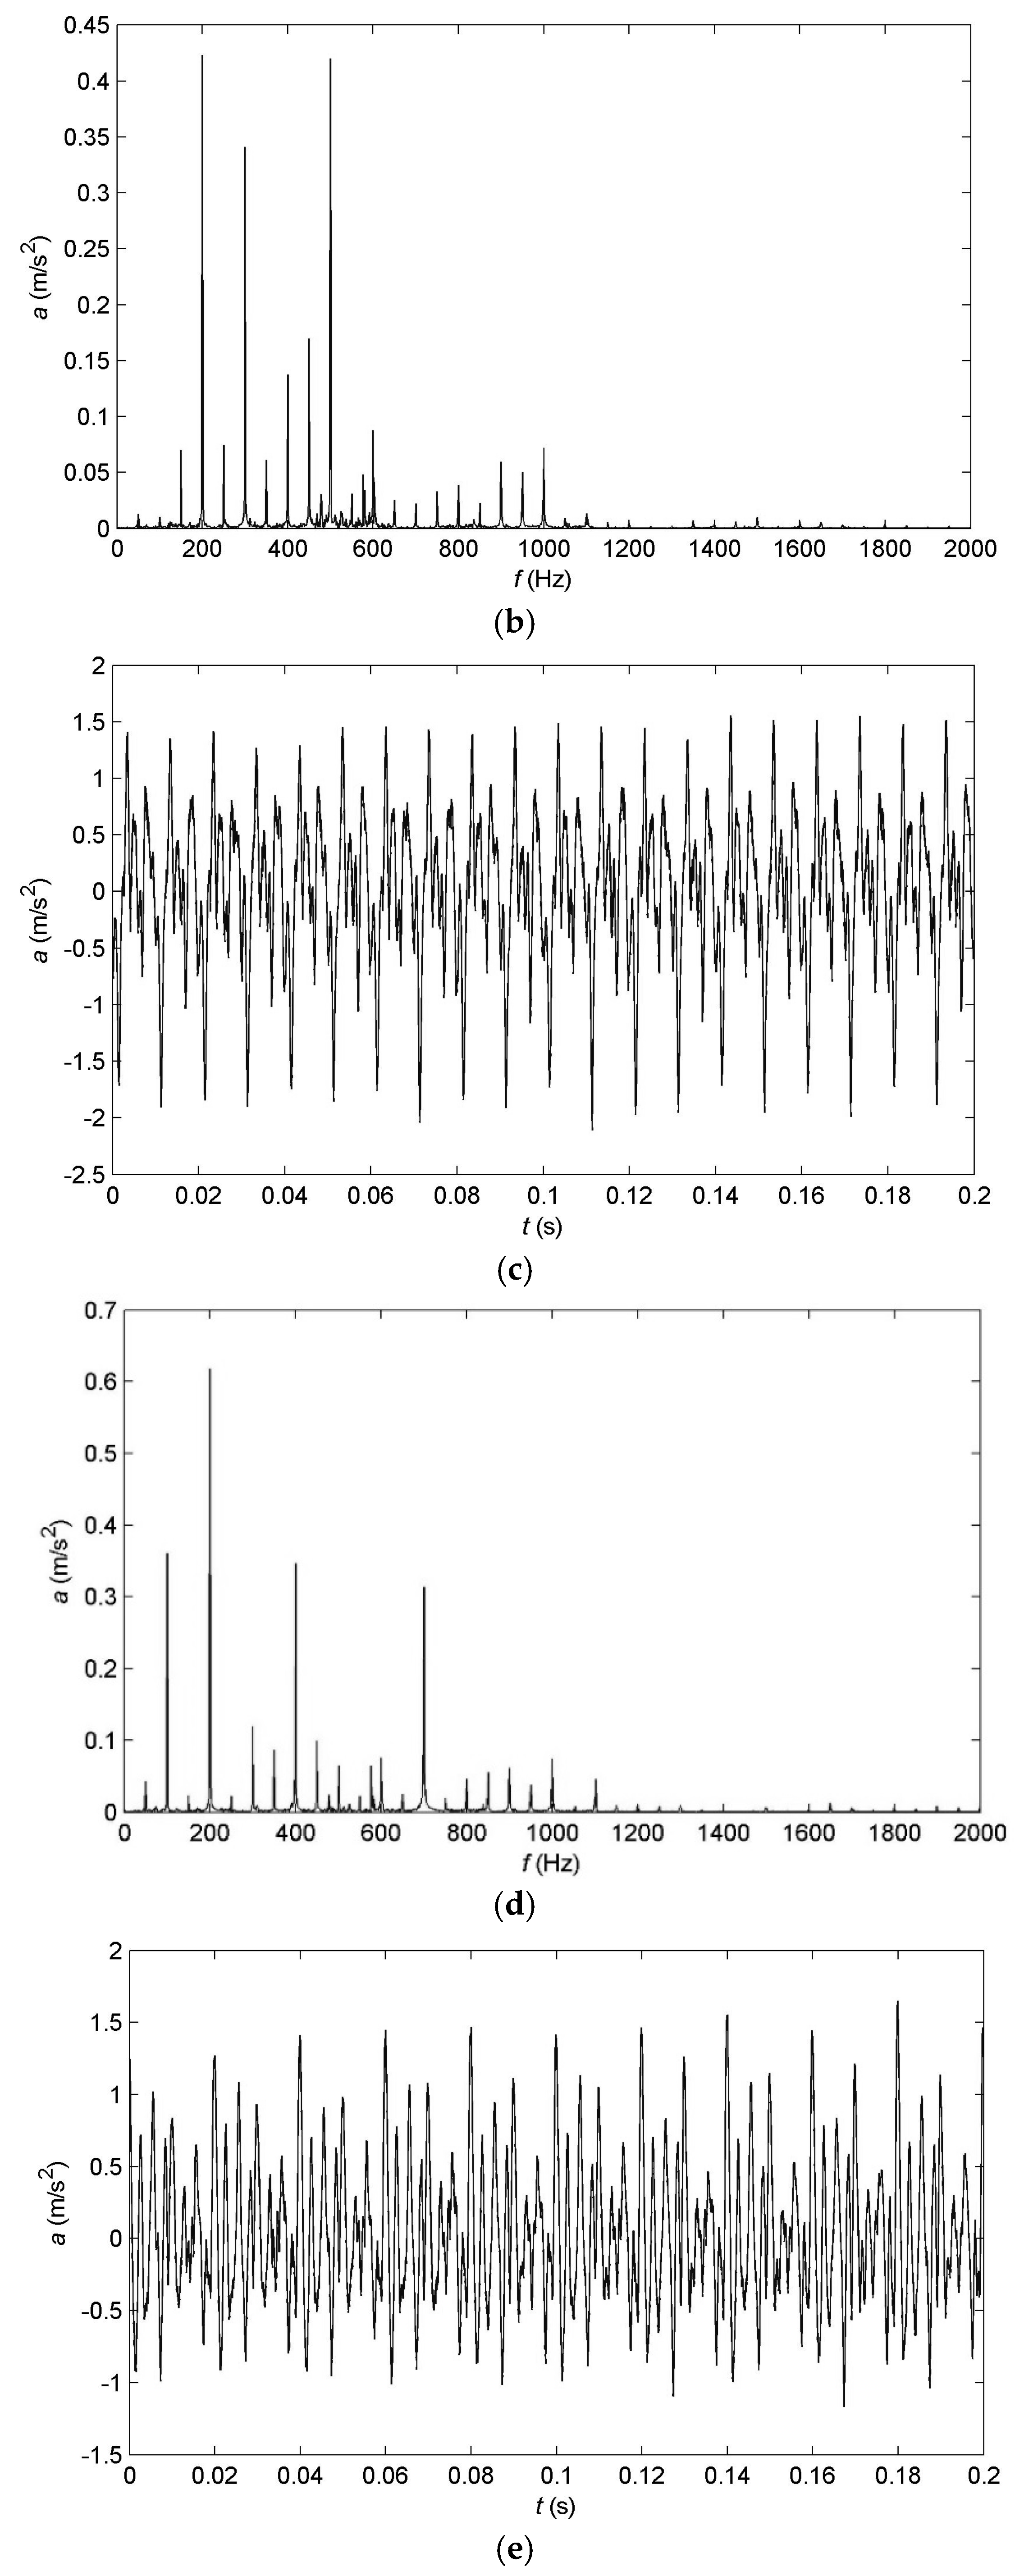
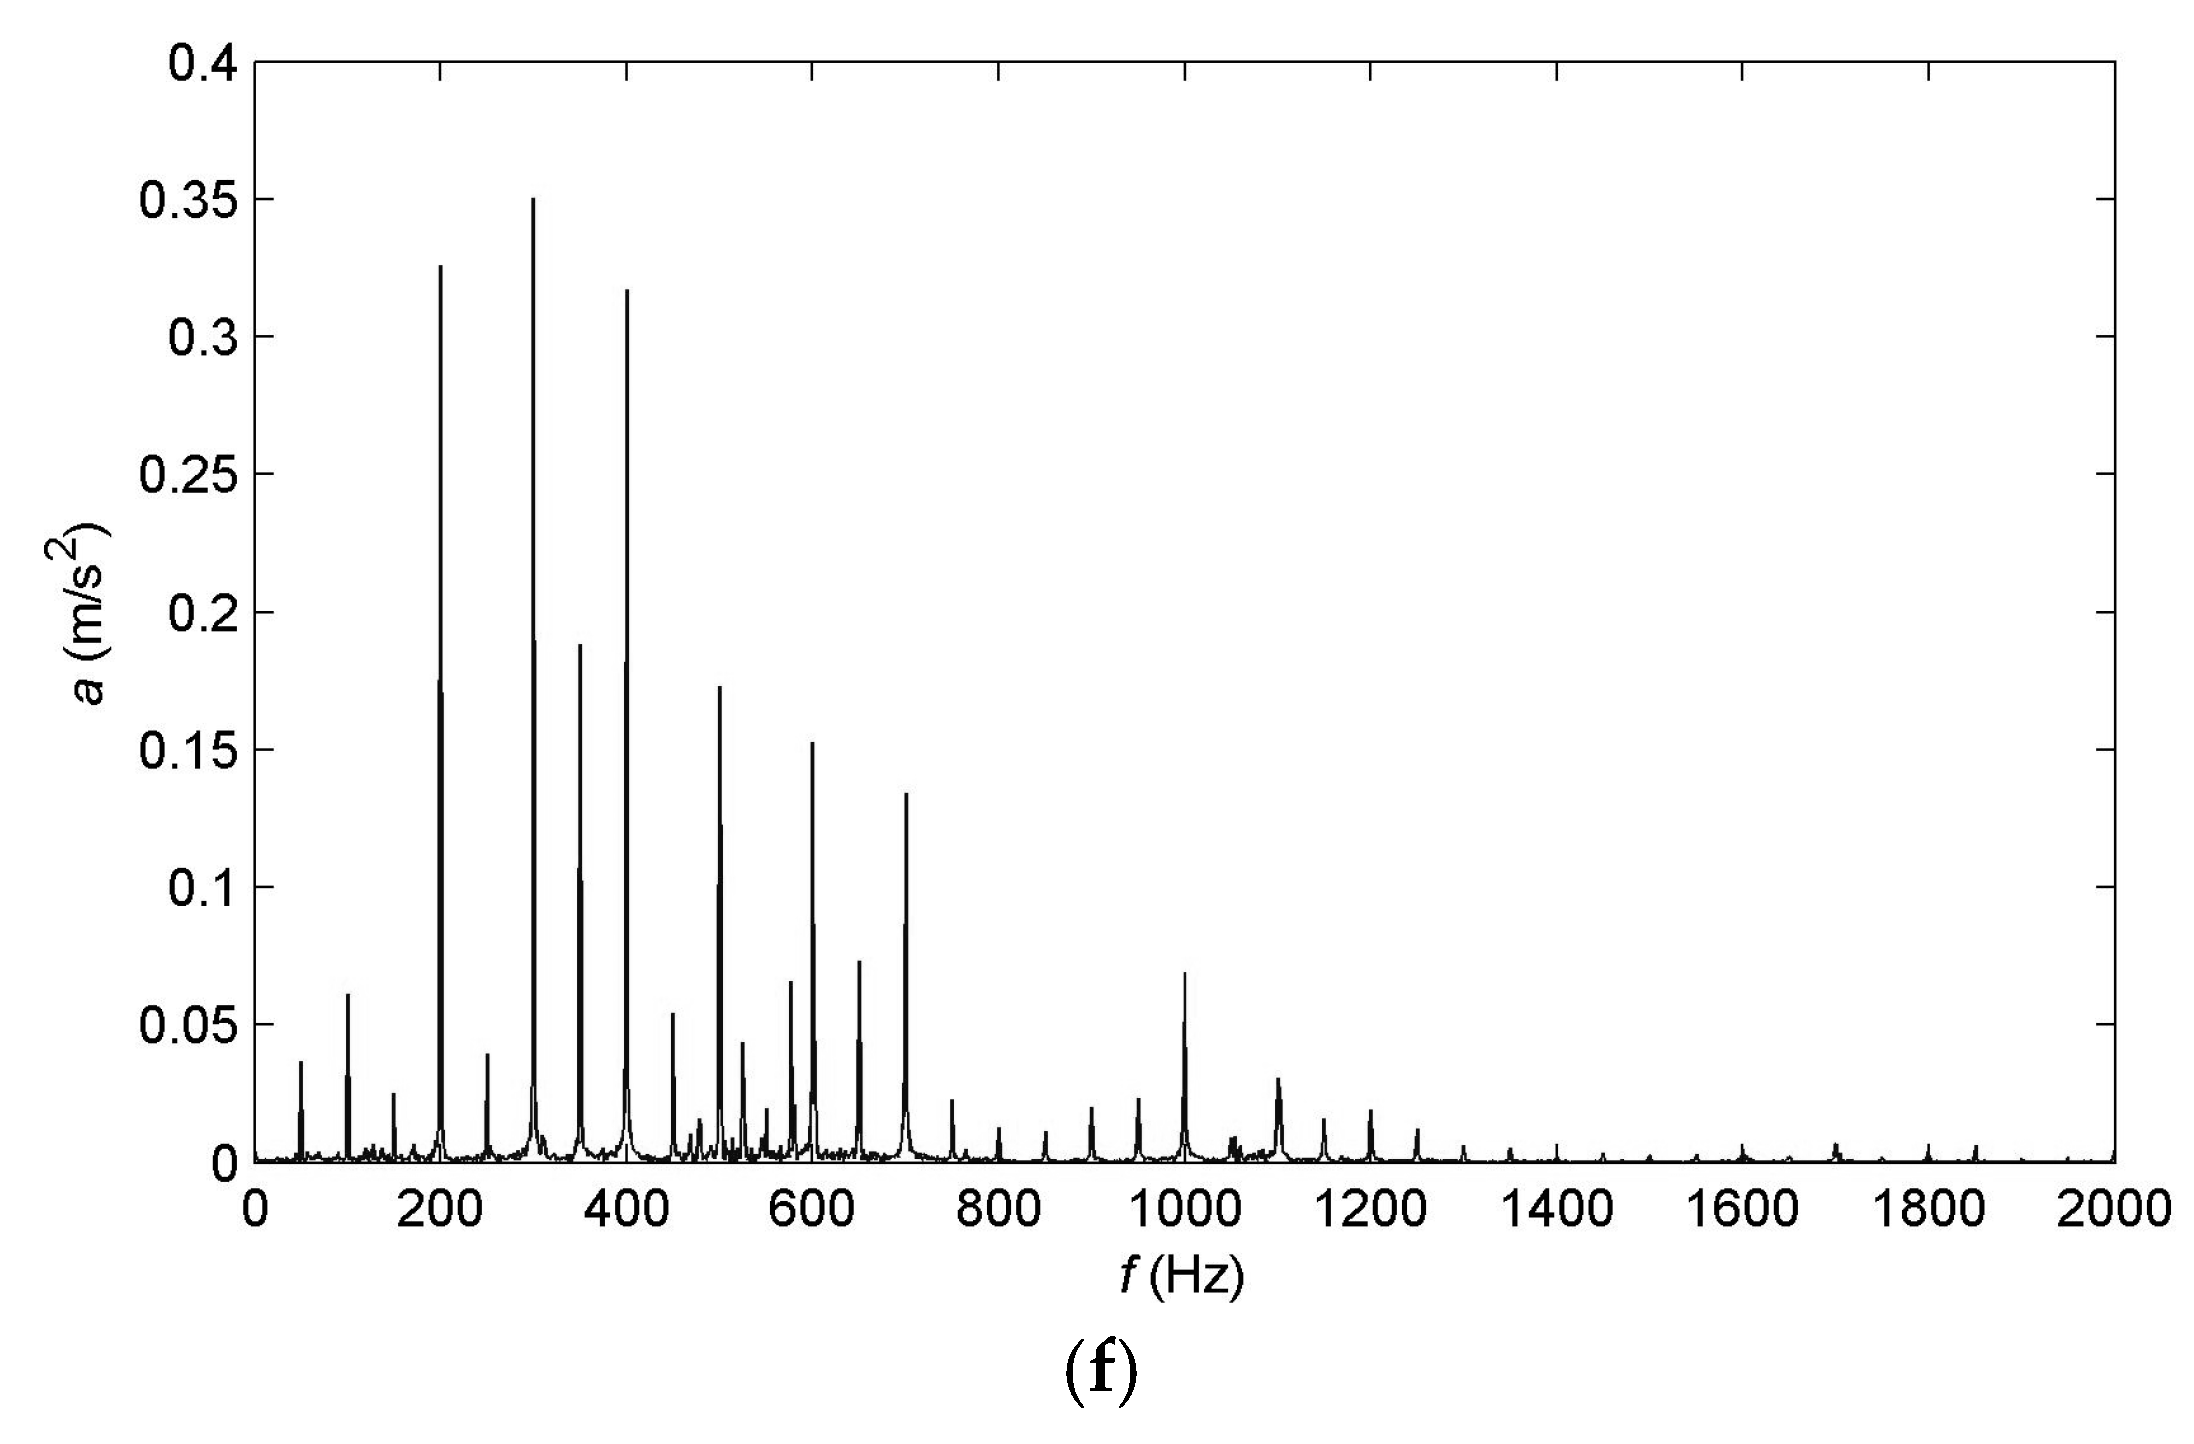
Compared with the waveform and spectrum distributions without DC bias, great changes can be observed compared to that of transformer vibration with DC bias, as shown in
Figure 4. The direct current flowing into the transformer is 10.6 A. As shown in
Figure 4a,c,e, the amplitudes of vibration acceleration of the three measurement points in the time domain rise to 19.8 m/s
2, 37.2 m/s
2 and 16.5 m/s
2, respectively. In the frequency domain, the range of frequency components increases from 1 kHz to 2 kHz.
As for the measurement point 1, the vibration amplitude is approximately 13 times the value under normal conditions. High-order harmonics of 50 Hz over 1 kHz present in the frequency spectrum. The amplitudes of many frequency components at odd times of 50 Hz increase to a large degree, such as 250 Hz, 350 Hz, 450 Hz, 550 Hz, 650 Hz, 850 Hz, 950 Hz and 1050 Hz. Moreover, the dominant frequency component changes form 200 Hz and 500 Hz to 600Hz. The vibration energy distribution in 2 kHz shows dramatic changes.
As for the measurement point 2, the vibration amplitude is approximately 17 times the value in normal condition. Like the measurement point 1, many high-order harmonics of 50 Hz over 1 kHz are generated in the frequency spectrum. Great increase of the vibration amplitudes is found at odd times of 50 Hz, such as 250 Hz, 350 Hz, 450 Hz, 550 Hz, 650 Hz, 850 Hz, 950 Hz and 1050 Hz. Moreover, the dominant frequency component becomes 700 Hz and the amplitudes of the frequency components over 1 kHz increase in a large degree. While, for some components like 100 Hz, 200 Hz and 400 Hz, the vibration energy proportion decreases dramatically.
Regarding measurement point 3, the vibration amplitude is approximately 10 times the normal value. Like the measurement point 1 and 2, high-order harmonics over 1 kHz and odd harmonics of 50 Hz shows large increase especially for the component of 350 Hz, which surpasses 200 Hz, 300 Hz and 400 Hz and becomes the dominant frequency. It is found from the comparison of
Figure 3 and
Figure 4 that DC bias has a great impact on transformer vibration characteristics.
3. Diagnostic Method
As described before, a vibration-based method could be used to diagnose DC bias in power transformers. The proposed diagnostic method is based on the following steps:
• Database construction
Many vibration datasets with known DC bias status are collected in advance. A suitable feature extraction method is used to process these datasets. Then, vibration features are calculated and saved, forming the feature sets. Each feature set is identified with a DC bias status. Finally, feature database is constructed with feature sets and their corresponding DC bias status.
• Field data acquisition
Vibration of the power transformer to be diagnosed is tested. FFT is conducted to the tested vibration signal. The obtained result will be used in the feature extraction process.
• Feature extraction
Based on frequency spectrum analysis, some rough features are defined. Features of the field test data are calculated and dealt with the dimensional reduction method. After this process, the rough features are de-correlated and principal features are obtained, decreasing the calculation amount of the diagnostic method.
• Pattern recognition
The feature database is used to train the classifier of the pattern recognition method. In order to obtain the best recognition accuracy, some important parameters in the recognition method are optimized. Then, the extracted principal features of the power transformers to be diagnosed are identified with spatial distance based method.
4. Feature Extraction
Vibration features should be sensitive to the DC bias status of power transformers. As sudden variation commonly does not occurs to transformer vibration, the time-domain features such as vibration amplitude or its envelope are not considered in this paper. The frequency-domain features based on FFT analysis and wavelet packet decomposition are proposed to detect DC bias. In order to make the measured results representative, frequency spectra of the three vibration measurement points are averaged.
4.1. Feature Definitions
4.1.1. Odd-to-Even Harmonic Ratio
Comparison between the spectra of transformer vibration with and without DC bias shows apparent change of energy ratio between the odd and even harmonics of 50 Hz. The feature odd-to-even harmonic ratio is defined by:
where
N = 40 is the vibration harmonic number of 50 Hz in the frequency range of 2 kHz,
and
are the vibration amplitudes of the even and odd harmonics of 50 Hz, respectively.
4.1.2. Spectral Complexity
In addition to the energy change of the harmonics multiple of 50 Hz, another distinction is the number increase of the harmonics. The feature called spectral complexity is defined by the following formula:
where
is the
i-th harmonic amplitude,
is the energy ratio of the
i-th harmonic.
The spectral complexity feature supplies useful information on the dispersion degree of the frequency components in the vibration spectrums. Larger value of this feature means more dispersive energy of the frequency components in the range of 2 kHz.
4.1.3. Wavelet Packet Energy Distribution
Wavelet-based signal processing techniques are effective tools for vibration feature extraction, which are widely used to diagnose anomalies in power apparatuses [
23,
24,
25,
26]. In this paper, the wavelet packet decomposition (WPD) method is employed to extract transformer vibration features in DC bias condition. WPD is a generalization of wavelet decomposition for multiresolution analysis. In WPD, both the detail and approximation coefficients are decomposed, subdividing the whole frequency band of the vibration signal into small segments. Hence, frequency components that contain high energy are easier to identify at different narrow bands. A wavelet packet function can be defined as [
27,
28]:
where
n is the modulation parameter,
l is the scale level,
k is the localization parameter.
The wavelet packet functions can be defined with the following sequence of recursive functions:
where
and
are respectively the low-pass and high-pass finite impulse filters.
The first two wavelet packet functions can be defined by a scale function and a mother wavelet function, i.e.,:
For
l levels of decomposition, WPD of vibration signal
f(
x) produces 2
l different sets of coefficients:
Each WPD sub-band signal corresponding to
can be reconstructed with:
The vibration signal of power transformer can be expressed as:
WPD sub-band energy is calculated by:
Hence, the total energy of vibration signal
f(
x) is:
Finally, the feature of wavelet packet energy distribution can be written as the vector:
4.2. Principal Component Analysis
The parameters Roe, H, and T comprise the vibration features of power transformers in DC bias conditions. Generally, these selected features are correlative. In order to reduce the dimensionality of vibration features, the principal component analysis (PCA) method is employed. It transforms high dimensional features to lower ones with equivalent information content.
Assuming
are the new chosen vibration features of DC bias obtained by linear combination of the original features
, the relation between original and new features can be expressed as [
29,
30]:
where
is coefficient of
nth original feature constitutes the
m-th principal component,
is the normalized coefficient matrix of the
m-th principal component,
A is the feature transformation matrix,
x is the original feature matrix.
The information content of each Principal component can be represented by its variance. Generally, minor features are chosen to characterize DC bias in the vibration feature extraction process for dimension reduction. The cumulative variance proportion
r can be calculated by:
where
is the variance of
,
is the covariance matrix.
Empirically, the first several features are proper to represent all the features when the cumulative variance proportion is over 85%.
5. Pattern Recognition
Recently, support vector machine (SVM)-based algorithms have been used as a powerful tool to solve the classification problems [
31]. The SVM is a machine learning algorithm. It tries to find out a hyper-plane to separate the data points according to their classes with the maximum distance. In that case, the hyper-plane is called the optimal hyper-plane. The least square SVM (LS-SVM) algorithm is a simplified version of SVM, which maintains the advantages and the attributes of the original SVM theory. It possesses excellent generalization performance and is associated with low computational costs [
32]. Compared with SVM, it requires less effort in model training. Attribute to these advantages, the LS-SVM algorithm is chosen to recognize the vibration features of DC-biased power transformers. The following is a brief account on the theory of LS-SVM.
Given the training data set {
xk,
yk} (
k = 1, 2, …,
M) with input samples
xk, binary class labels
yk ∈ {−1, 1} and sample number
M, the SVM formulations starts from the assumption that [
32]:
The classification hyper-plane is:
where
is the normal vector of the hyper-plane,
b is the bias term,
is the nonlinear function mapping input data into a higher dimensional feature space.
According to structural risk minimization, the solution of
and
b can be equivalent to the following minimization problem:
subject to:
with Lagrangian:
where
is the error variable,
is the Lagrange multiplier,
is the regularization parameter.
According to Karush-Kuhn-Tucker condition, the solution of above problem concludes in a constrained optimization with the conditions:
By eliminating
and
, the following linear equation set can be formulated:
where
I is the identity matrix.
After application of the Mercer condition, the LS-SVM classifier results into the following equation:
where
is the radial basis function kernel,
is the kernel parameter.
For the training problem of LS-SVM, performance of the LS-SVM algorithm is influenced by the regularization parameter and the kernel parameter [
33]. The grid search and cross validation approaches could be used to get the optimal parameters.
6. Feature Sensitivity Analysis
In order to verify the effectiveness of the vibration features to the change of DC bias condition, the time variation process of odd-to-even harmonic ratio and spectral complexity and the discrepancy of wavelet packet energy distribution have been analyzed. Vibration signals of the 500 kV power transformer in 1 h have been tested. During this period, the operation condition of power transformer changes from normal to DC bias.
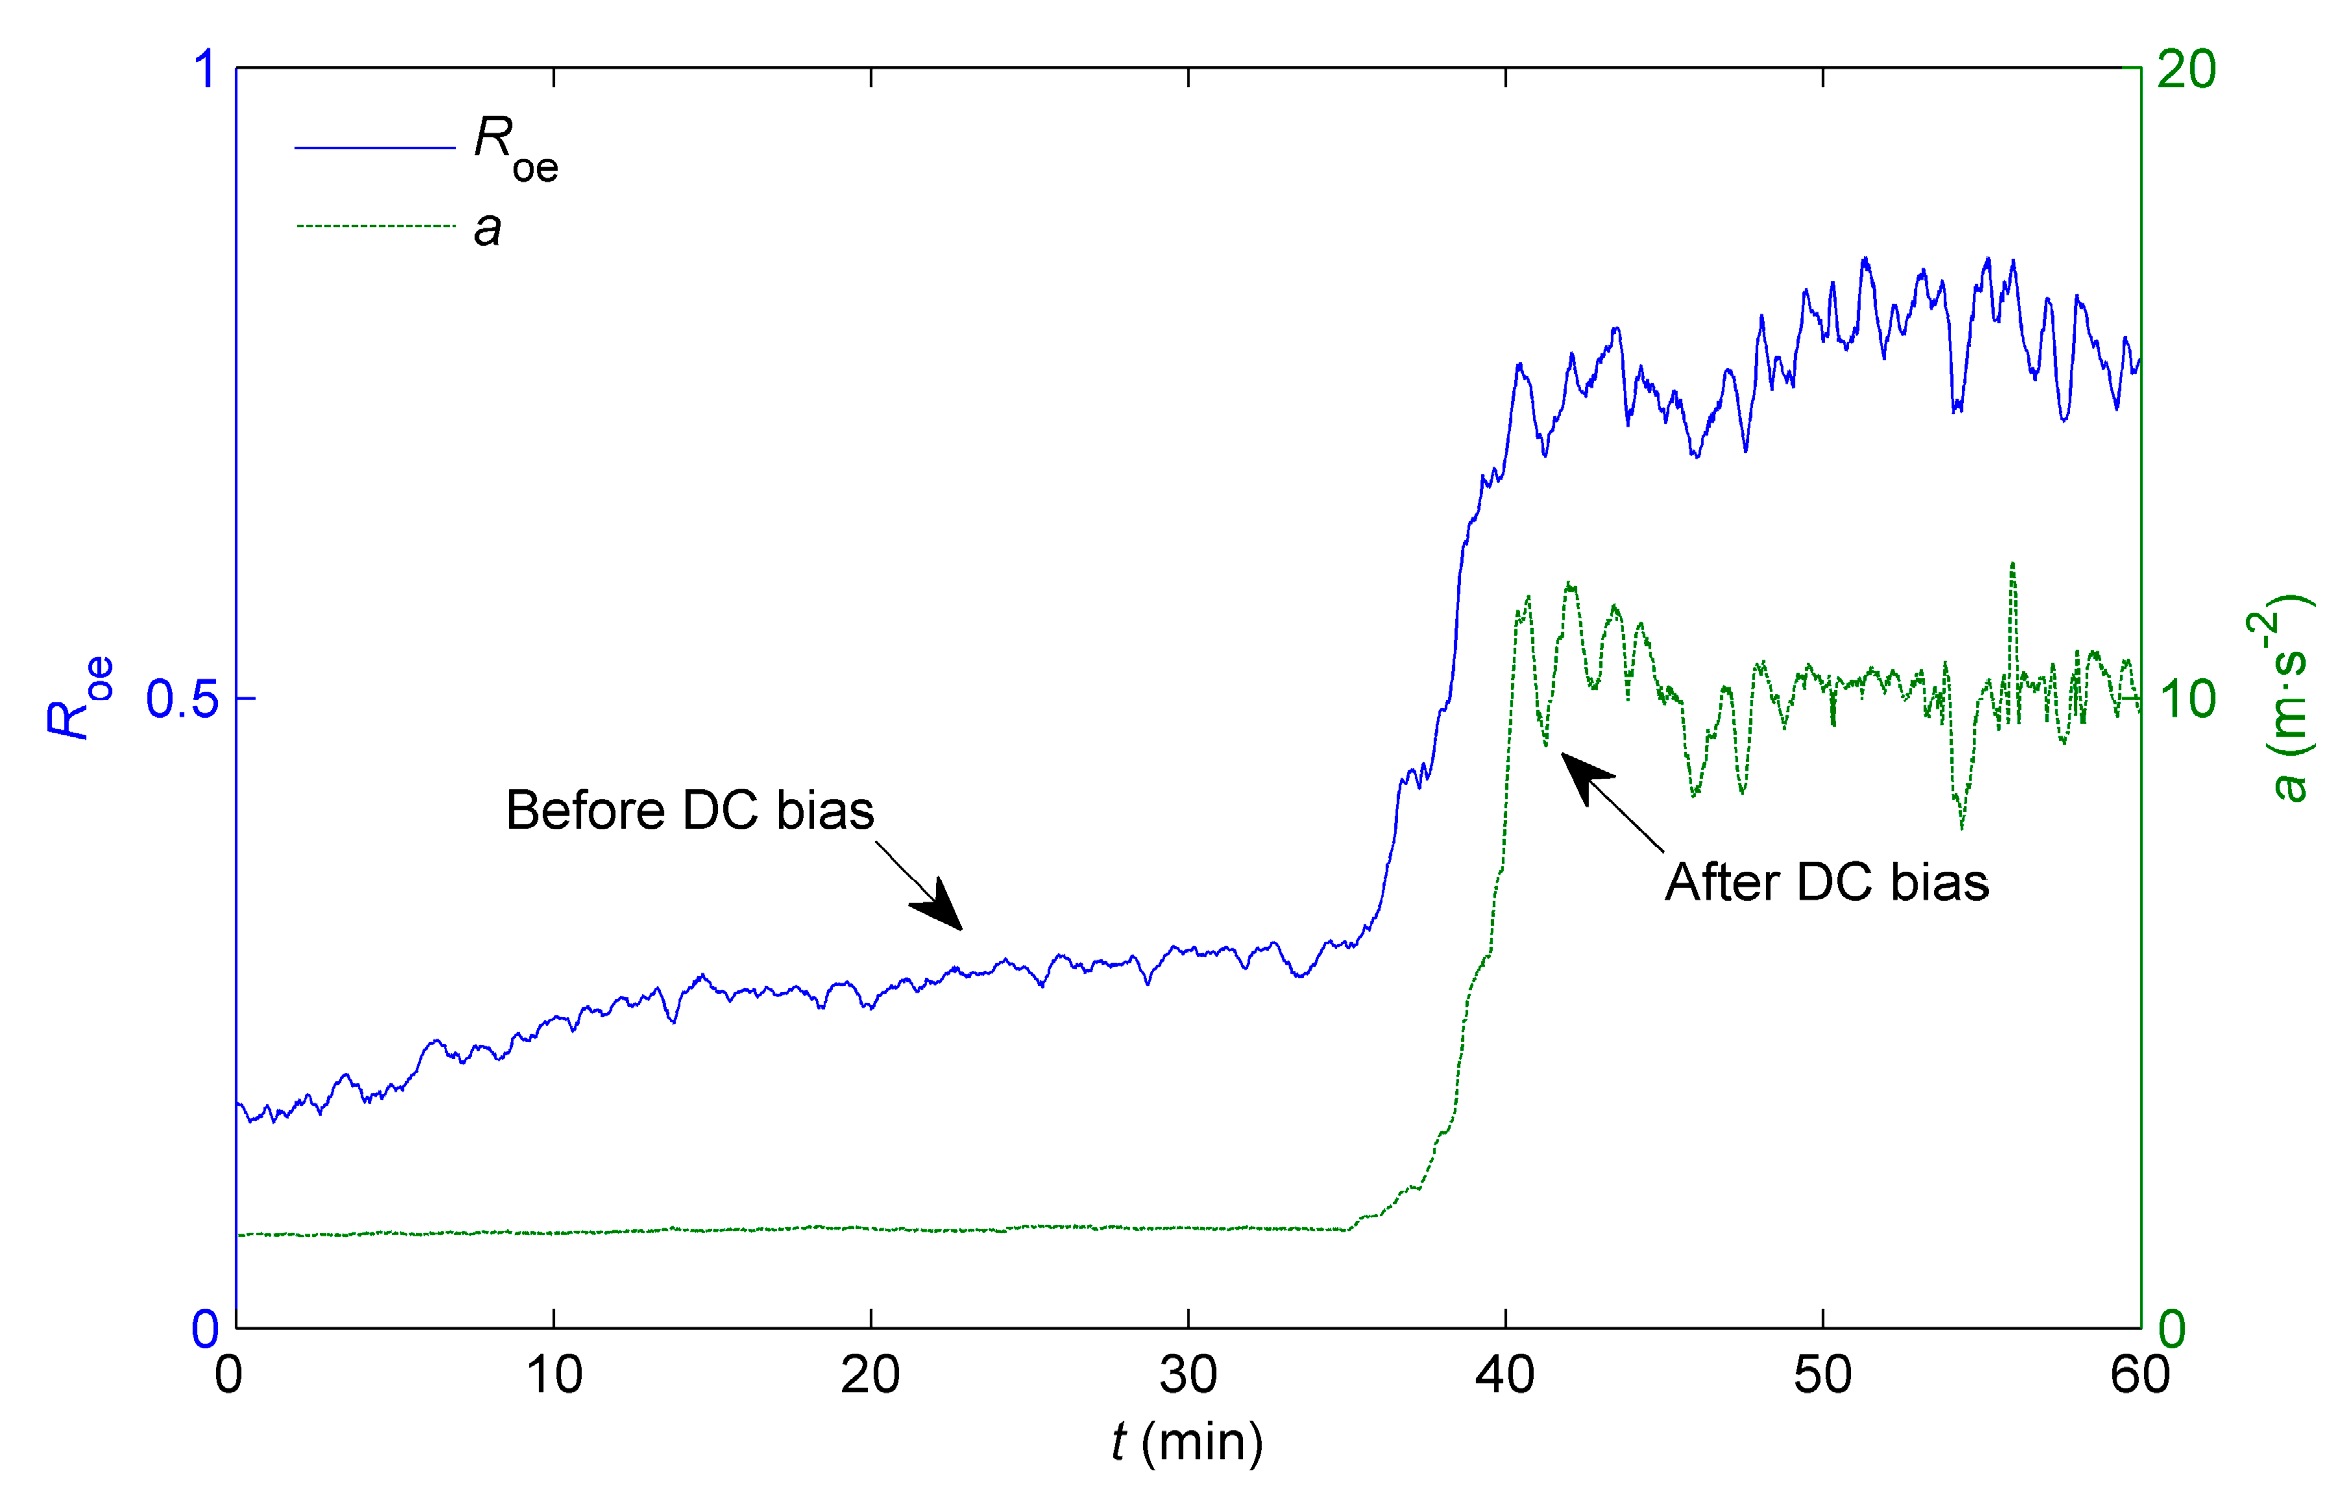
Figure 5 gives the time variation process of the feature
Roe and the vibration acceleration. In the first 30 min, DC bias is nearly absent. The transformer vibration amplitude a stays in a low level and increases gradually from 1.5 m/s
2 to 1.6 m/s
2, which variation is not obvious. However, an apparent increase can be observed in the curve of the feature
Roe from 0.16 to 0.30. In the next 10 min, sharp increase of both the feature
Roe and the vibration acceleration present. The feature
Roe and the vibration amplitude rise up to 0.77 and 11.56 m/s
2, respectively. After 40 min, both the feature
Roe and the vibration amplitude fluctuate at a high level. During the whole process, the variation of the feature
Roe can always keep in accordance with that of the vibration amplitude. It seems more sensitive than the vibration acceleration even when the direct current flowing in the neutral of power transformer is in small amplitude.
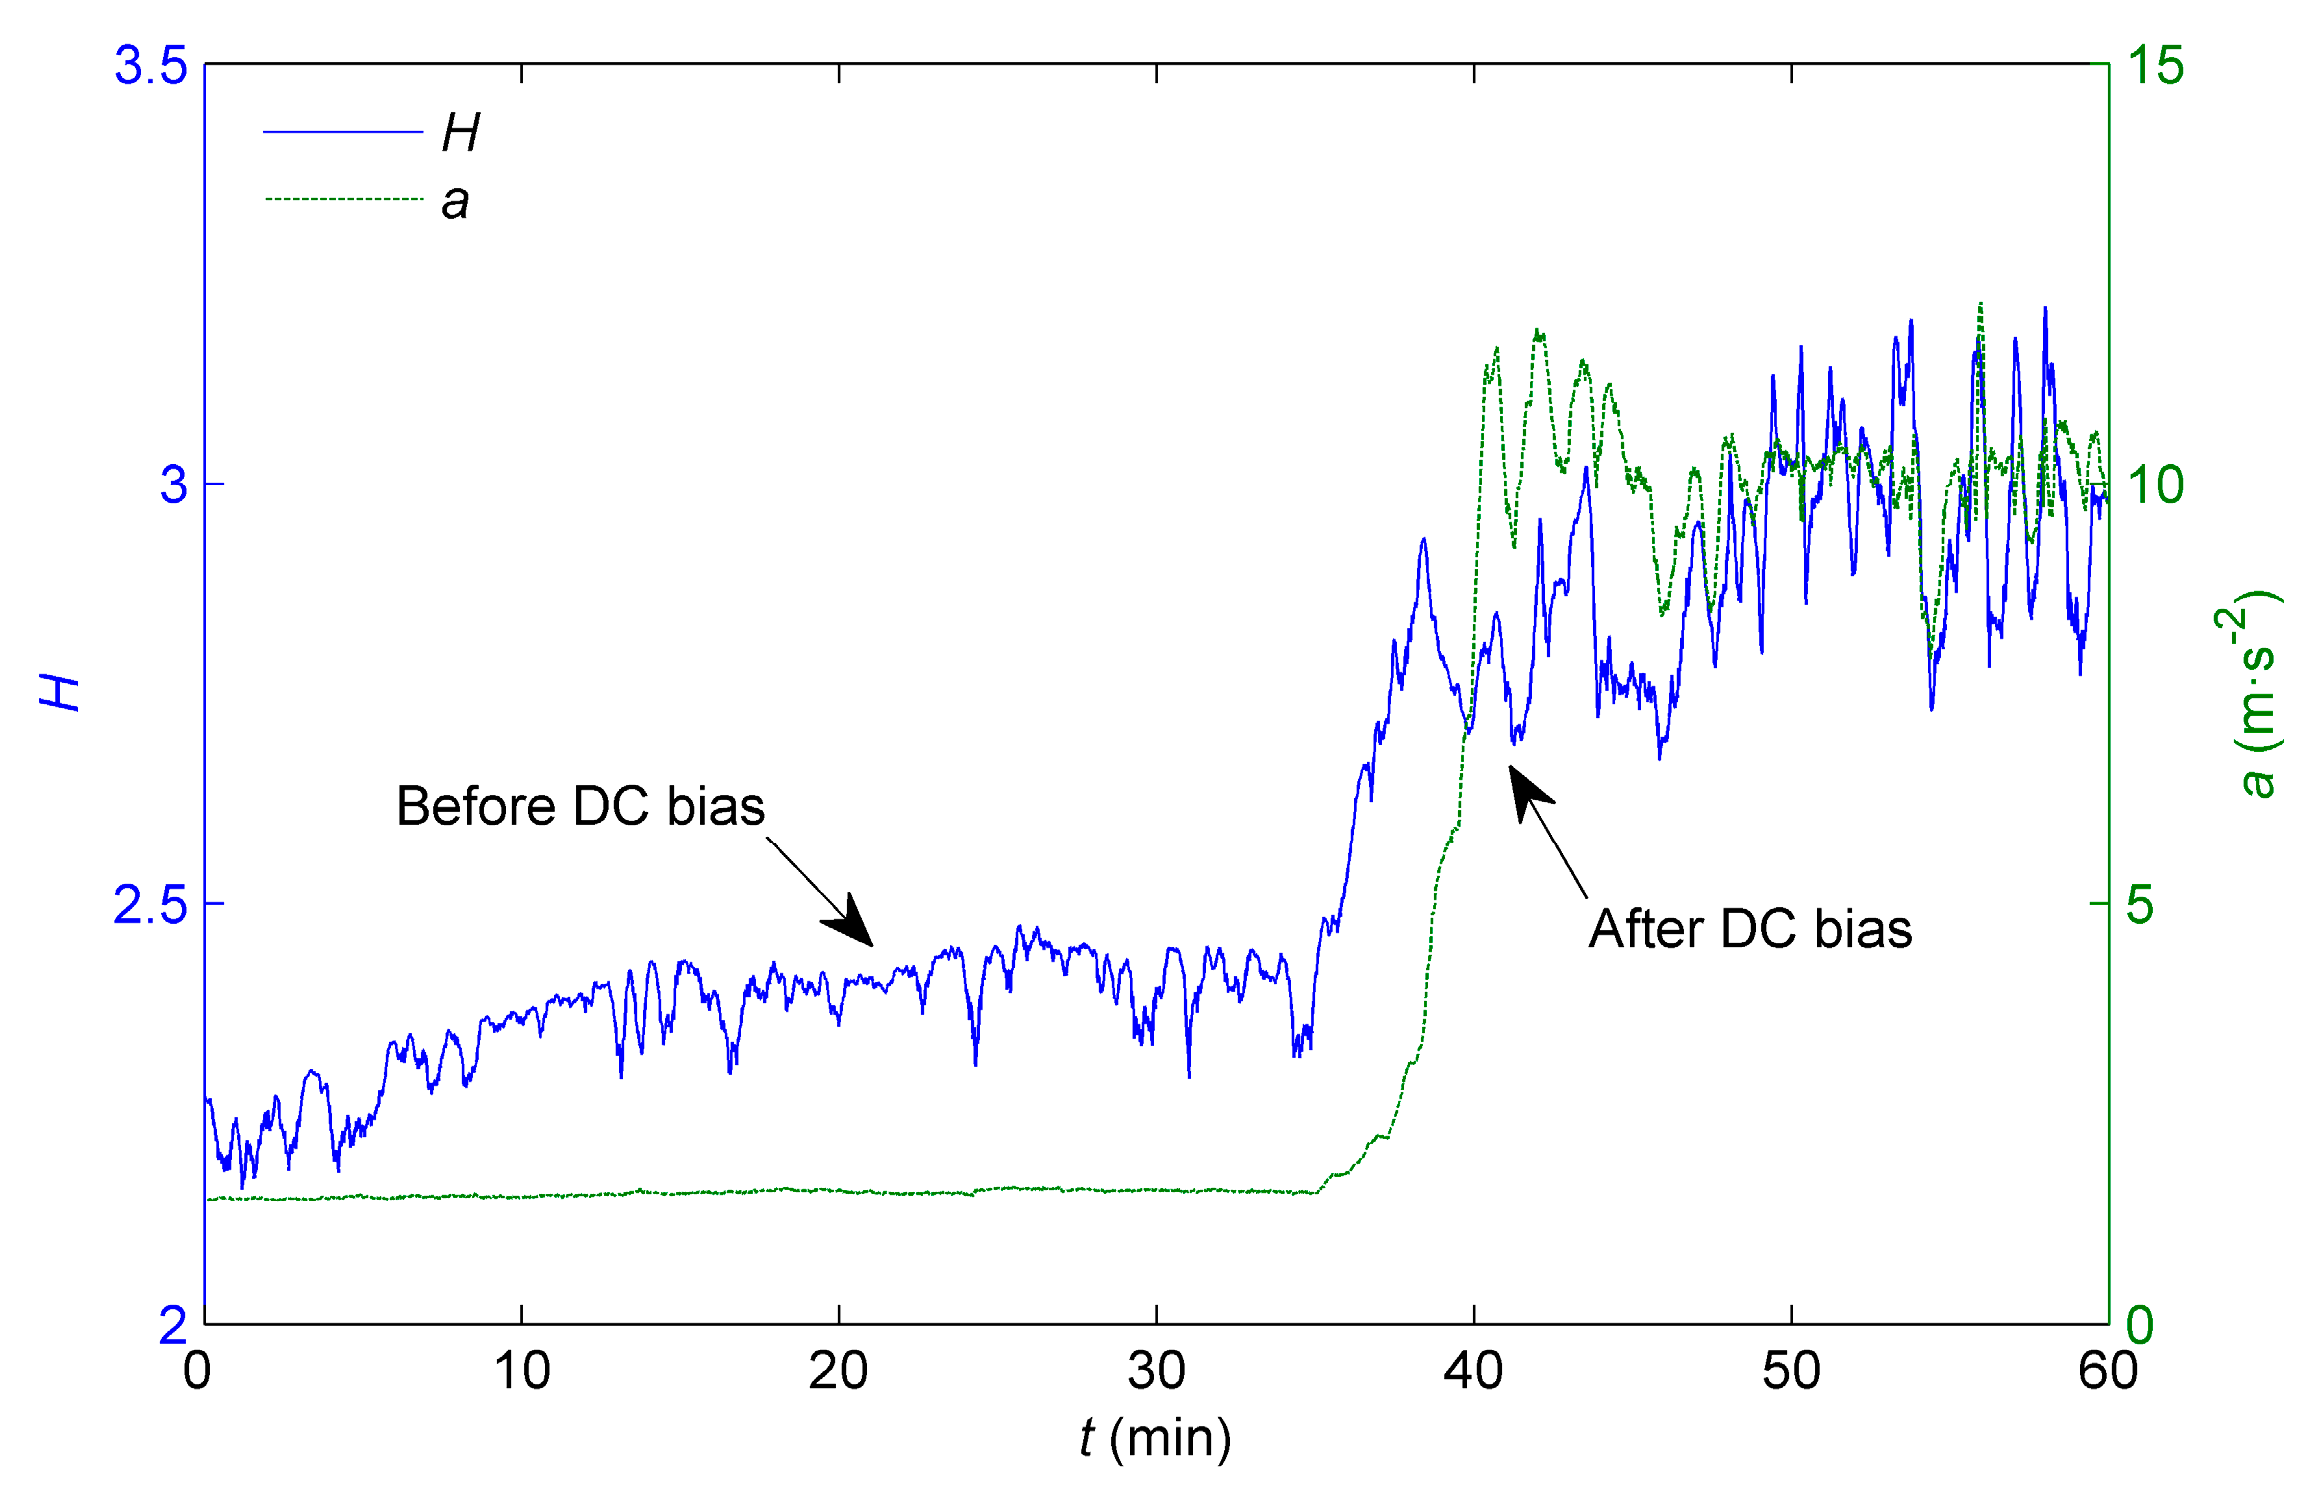
Figure 6 shows the time variation process of the feature
H and the vibration acceleration. Like the feature
Roe, the feature
H has a similar variation curve with the vibration acceleration amplitude. An obvious increase is also found in the first 30 min from 2.25 to 2.44. When DC bias occurs, the feature
H rises up to 2.94. Compared with vibration acceleration, higher degree of fluctuation can be observed from the curve of the feature
H, which means that the proposed feature is more sensitive to the DC bias status of power transformers.
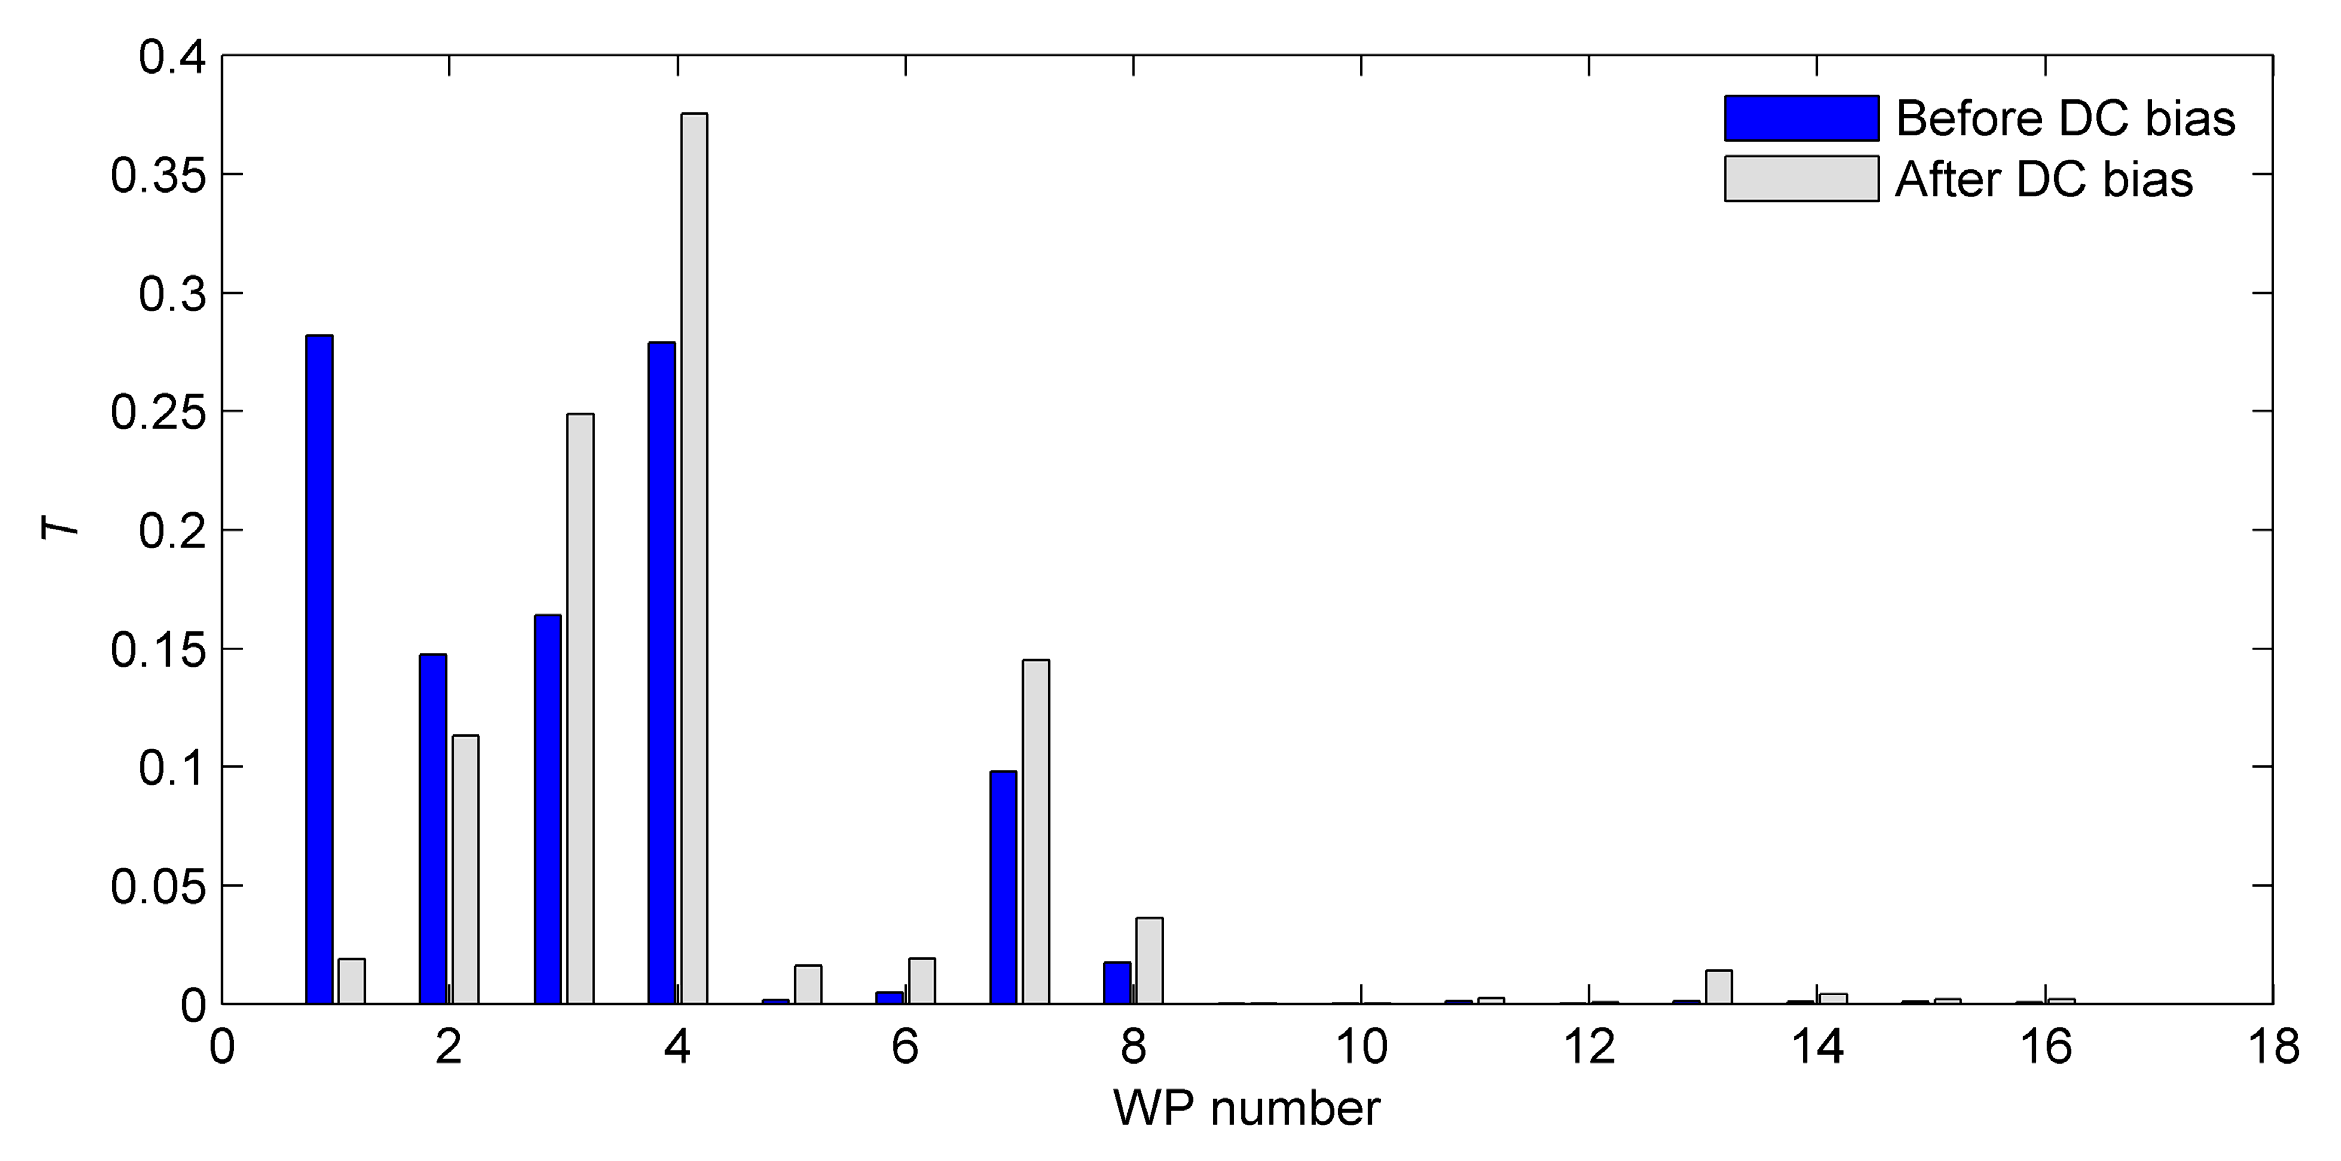
The wavelet packet energy distribution before and after DC bias is shown in
Figure 7. The db4 wavelet and Shannon entropy are used in the 4-level wavelet packet decomposition. In order to scatter the wavelet packet energy distribution and make it more uniformly distributed in the whole frequency band, the vibration signal is re-sampled from the frequency of 32,768 Hz to 4096 Hz. Based on the theory of wavelet packet (WP), the upper limit of the vibration frequency band is 2048 Hz after resample. The vibration energy is mainly distributed in the sub-bands of 1 to 8 after WPD, which is in the frequency range of 1024 Hz. Before DC bias occurs, the dominant vibration energy is in the frequency range of 0–128 Hz and 256–384 Hz. When DC bias occurs, the dominant vibration energy presents in the frequency range of 256–384 Hz. The vibration energies in the sub-bands 3 to 8 increase greatly compared with that of power transformers under normal operation conditions. Therefore, the wavelet packet energy distribution can be used as the vibration feature to detect DC bias.
7. Application of the Diagnostic Method
7.1. Principal Features Calculation
In the trial operation process of the ±800 kV Jiuquan-Hunan HVDC power transmission system with monopole Earth return mode, vibration of the 500 kV autotransformer is tested. The vibration signal in each 10 s is treated as a sample. Rough vibration features of each sample are calculated. The PCA method is used to extract the principal features of DC bias.
As for machine learning algorithm like LS-SVM, increasing training samples has the advantage of improving recognition accuracy. In total 126 vibration samples are used to train the classifier of LS-SVM, including 108 sets of DC bias samples classified with label “1” and 18 sets of normal samples classified with label “−1”. These DC bias samples are obtained when the HVDC system is operated in the transmitting power of 600 MW, 2000 MW, and 2100 MW, respectively. In each operation condition, 36 sets of vibration data are selected.
Eigenvalue of the covariance matrix of the original rough features are calculated and sorted. Then, the cumulative variance proportion of each principal feature is obtained:
It is observed that the cumulative variance proportion of the first two principal components reaches 97.9%. Thus, the information contained in the first two principal components is deemed enough to represent that of all the rough features. These two principal features are extracted as the vibration features of DC-biased power transformers.
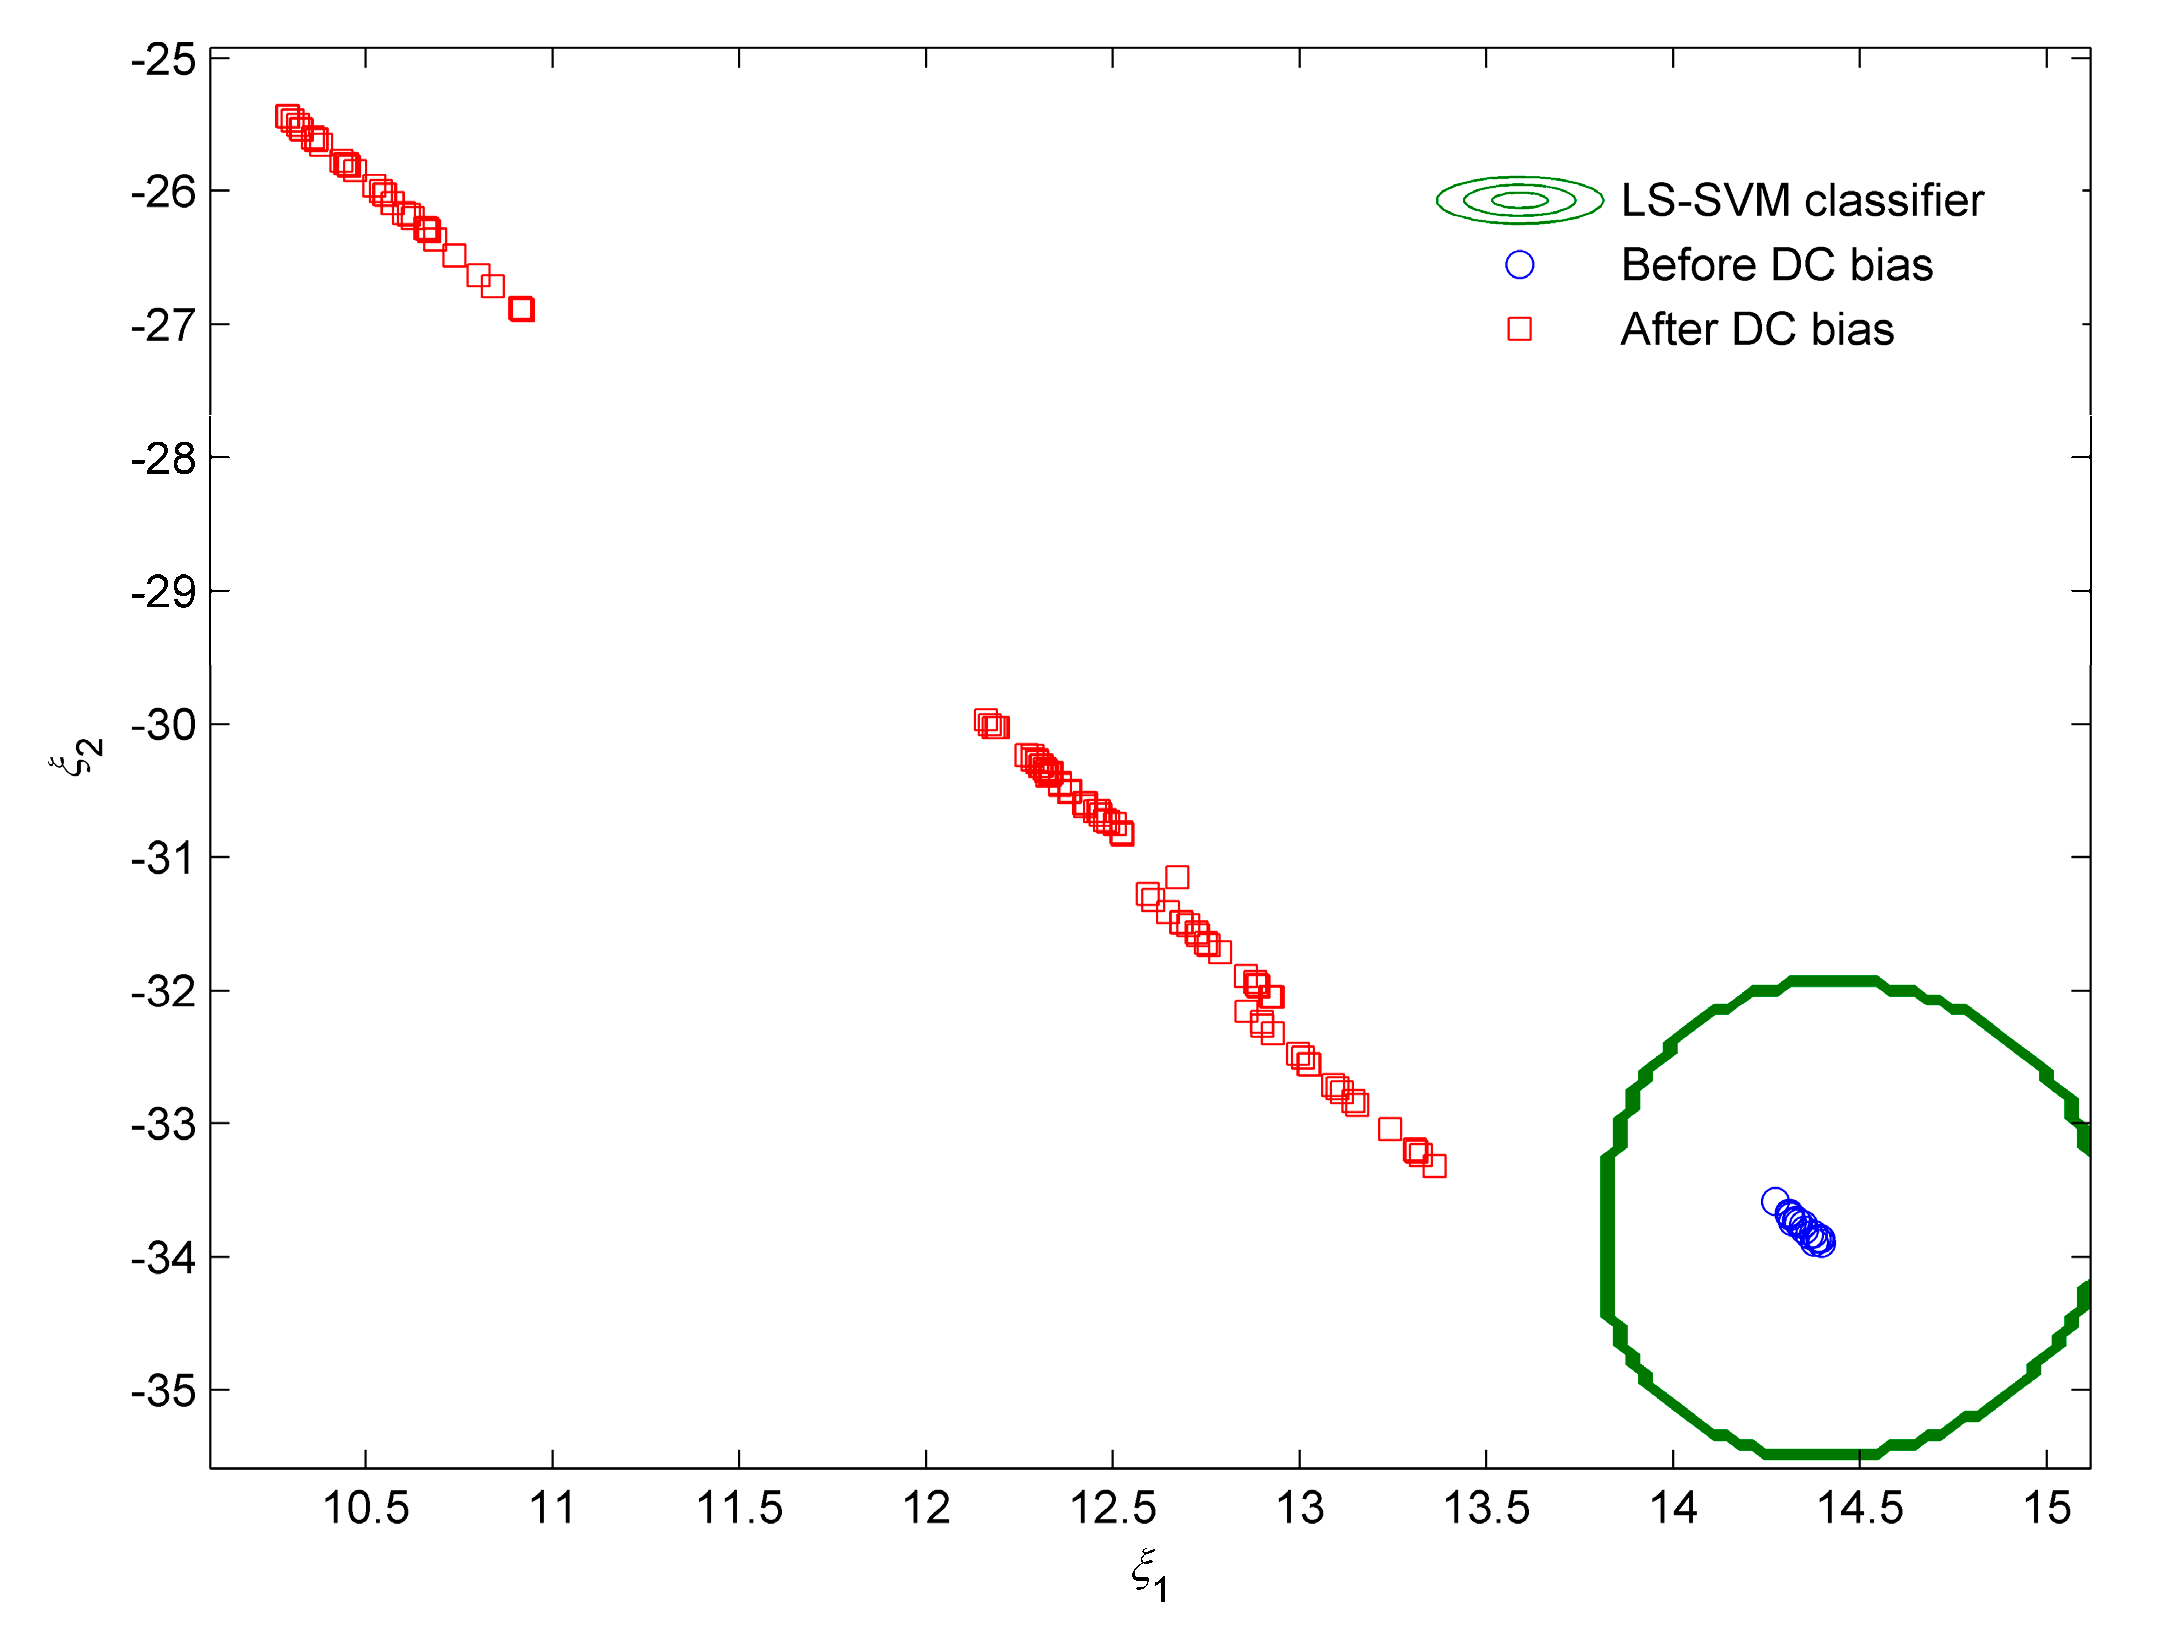
After PCA, the following feature transformation matrix is obtained and further used for principal features calculation of transformer vibration in DC bias condition. The consequent principal features are plotted in
Figure 8:
7.2. Recognition Results Verification
The calculated 126 sets of principal features are used to train the classifier of LS-SVM with a toolbox called LS-SVM lab [
34]. In the training process, it is important to determine the regularization parameter
and the kernel parameter
. Cross validation is an available method to obtain the optimized parameter pair
. The parameter pair (10, 0.2) is chosen to separate DC bias and normal samples. The classification result is shown in
Figure 8. All the training samples are successfully separated.
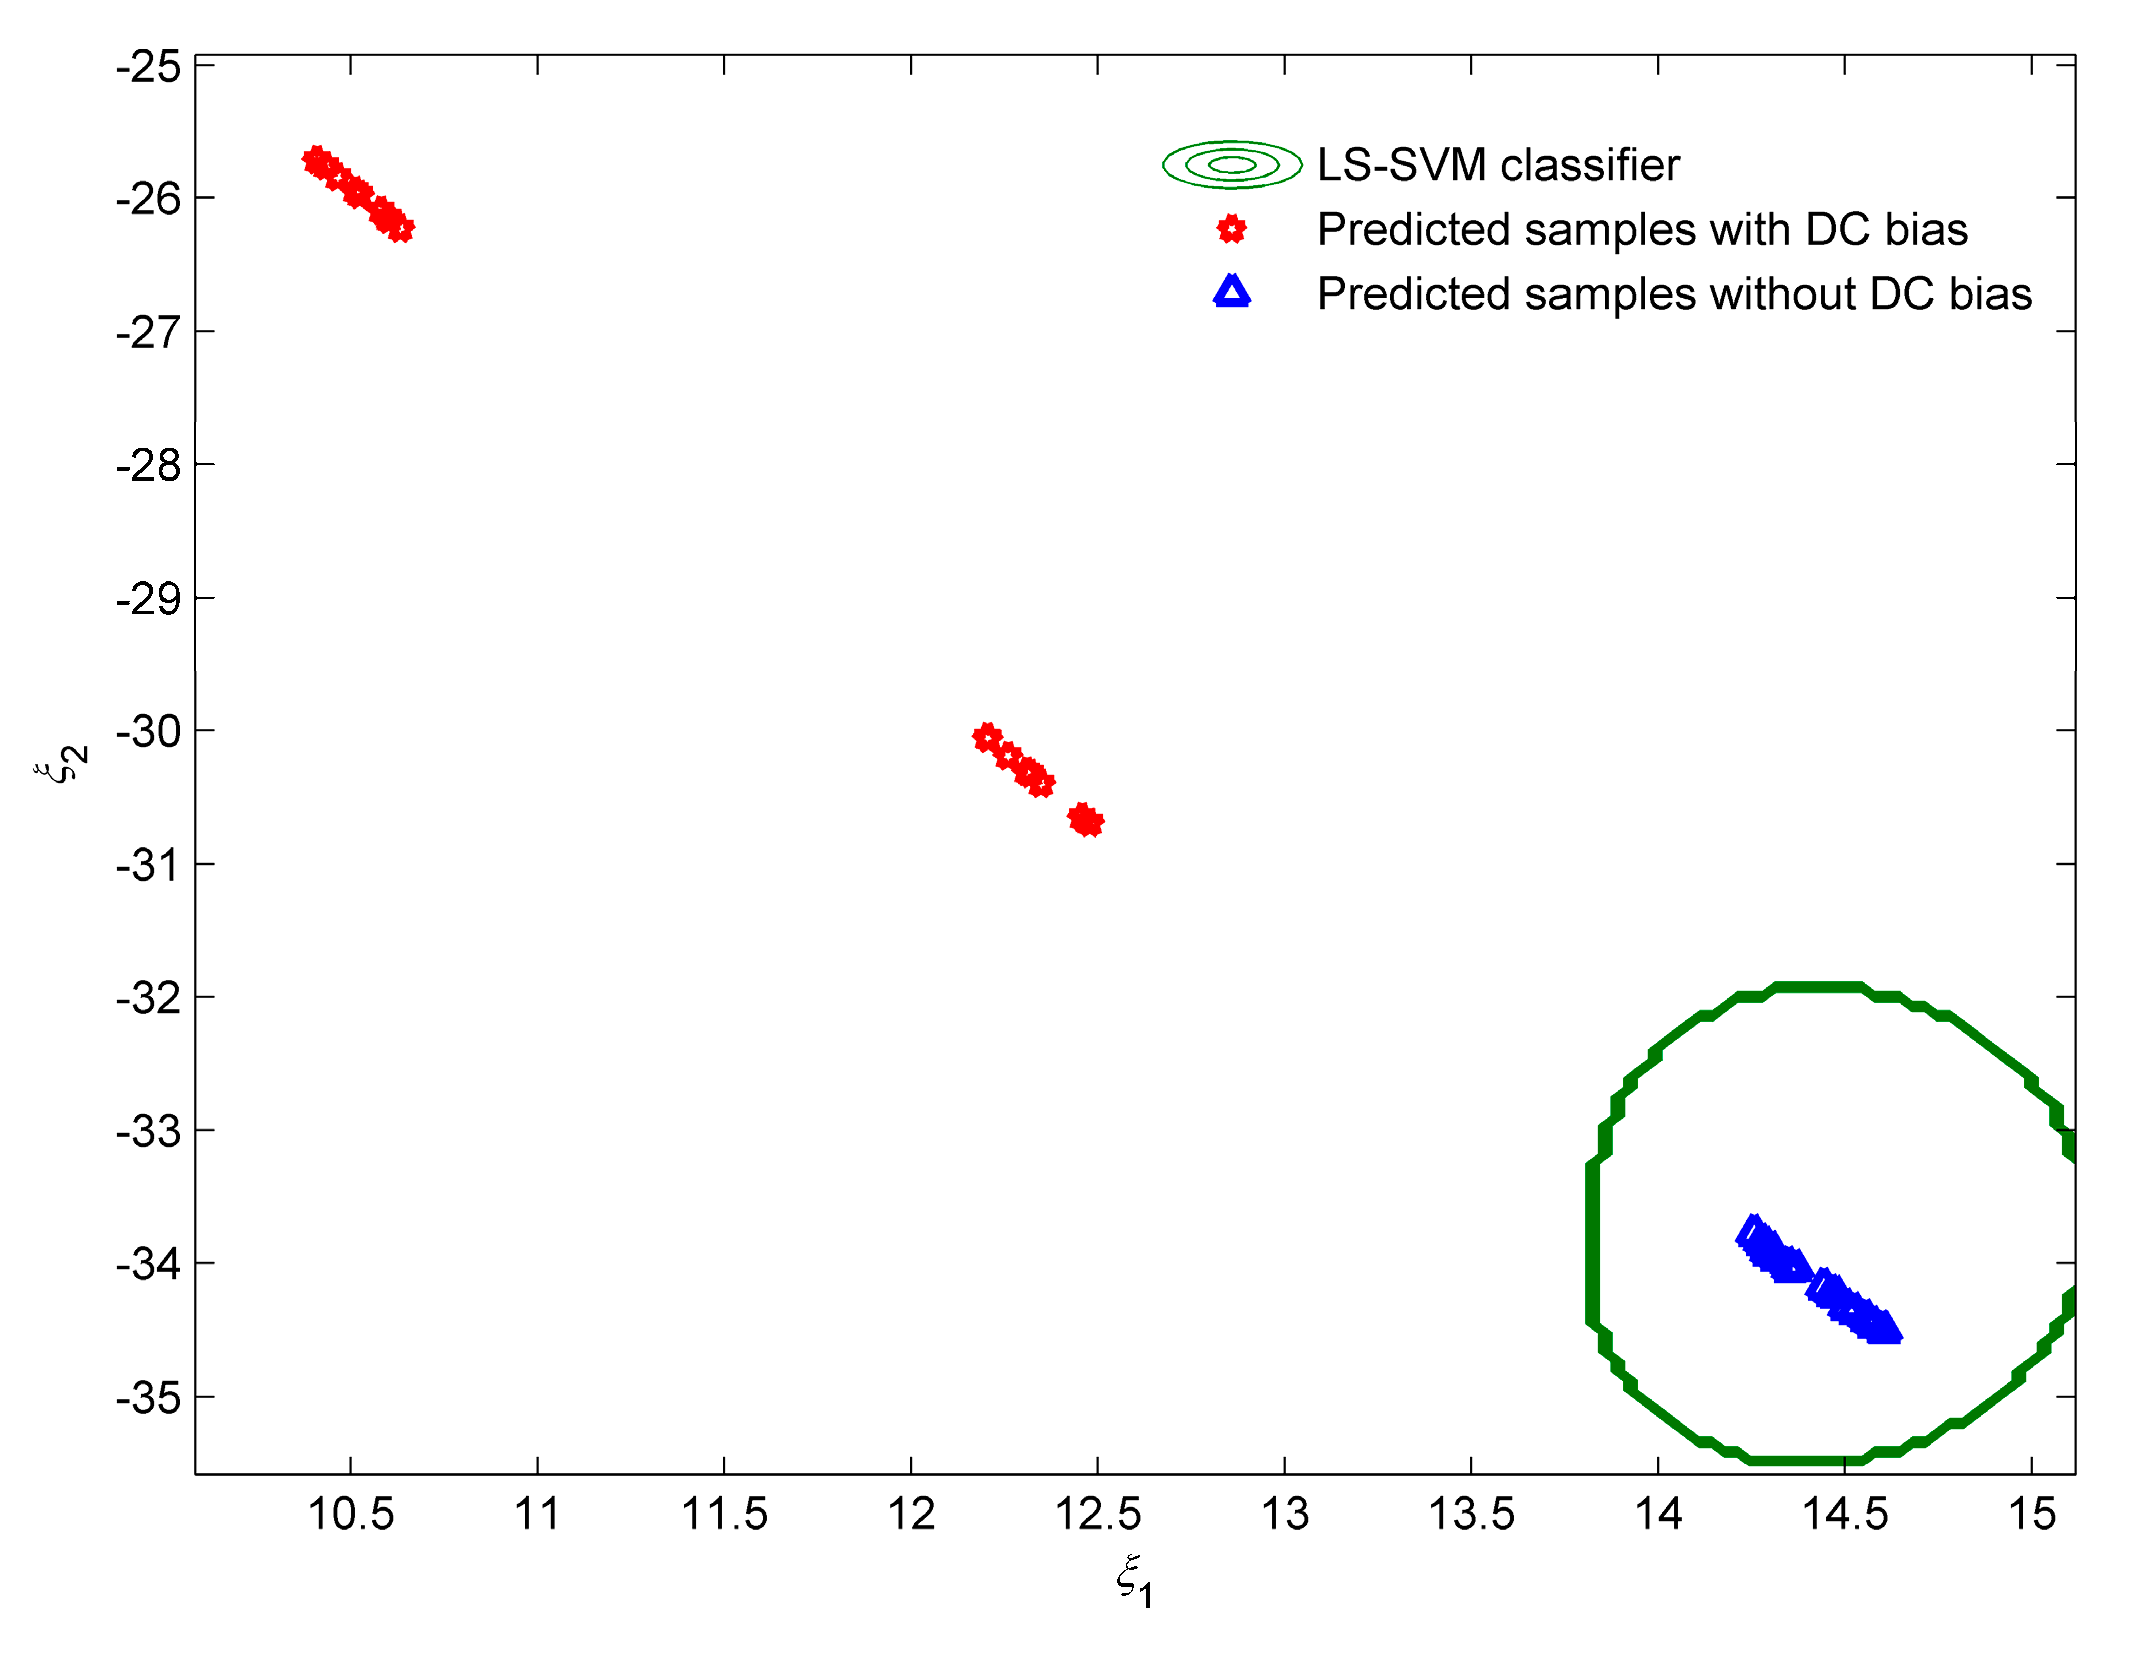
Another 36 sets of samples are used to test the effectiveness of the LS-SVM classifier in which 18 normal vibration samples and 18 DC-biased vibration samples are included. The rough features are calculated and transformed to the two-dimensional principal features with the matrix
A. As shown in
Figure 9, all the samples are correctly predicted, which verifies the proposed LS-SVM method in pattern recognition of DC bias.
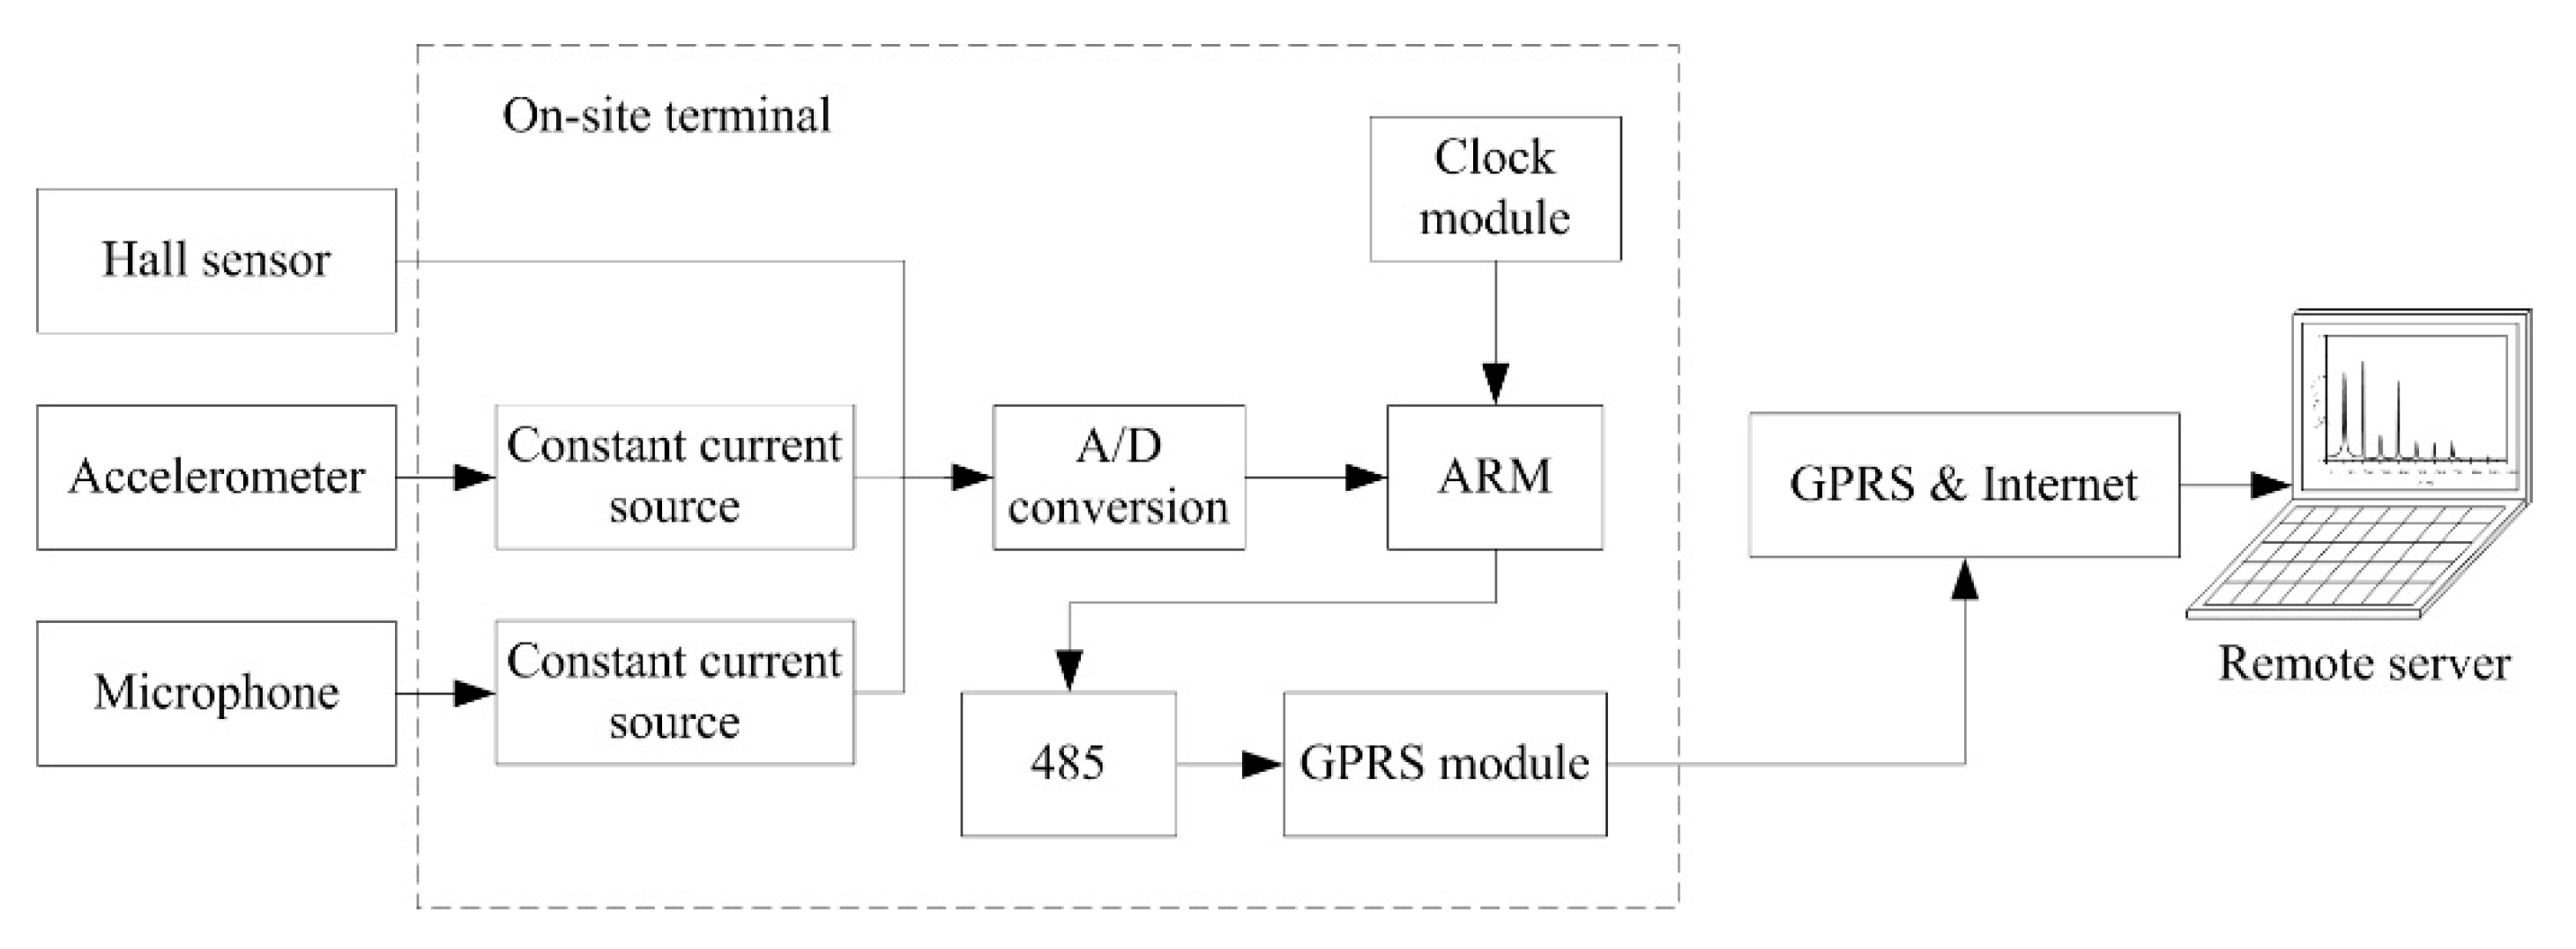
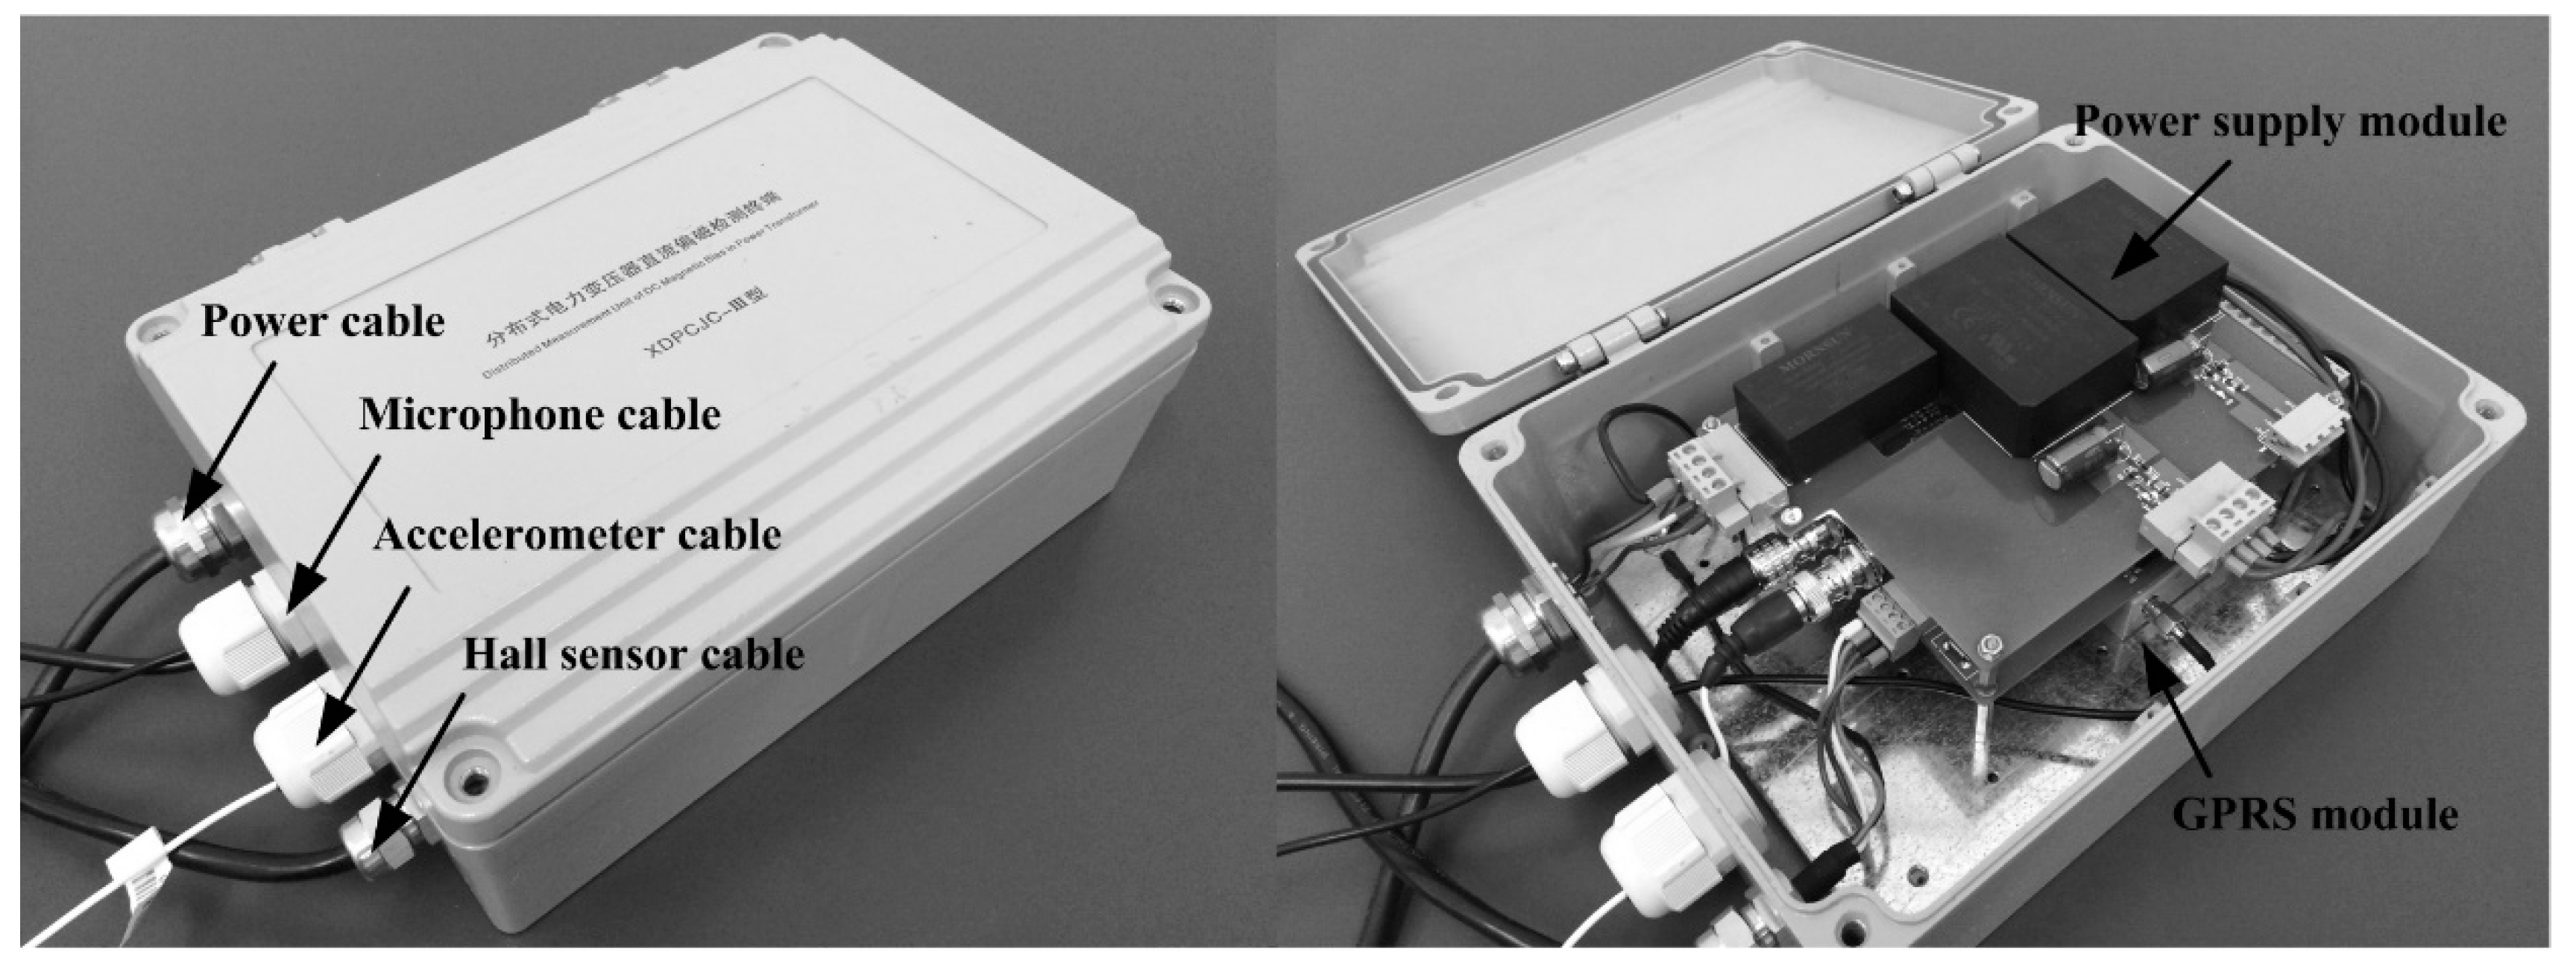
7.3. Field Application of the Diagnostic Method
The whole diagnostic algorithm is put into field application with a designed DC bias on-line monitoring device, which is composed of the sensors, on-site terminal and remote server, as shown in
Figure 10. An industrial integrated circuits piezoelectric (ICP) accelerometer (PCB model 603M170, IMI, New York, NY, USA) is used for outdoor vibration measurement of the power transformer. In addition to vibration, direct current and sound pressure level (SPL) of the power transformer are also measured in the device for comparison with Hall sensor (model HOS-50K2, Yuanxing, Zibo, China) and microphone (BSWA model MPA201, BSWA, Beijing, China), respectively. Considering the computational capacity, the on-site terminal is only used for data acquisition and transmission. The acquired vibration signal is transmitted to the remote server with GPRS network in each 5 s. On the remote sever, the time-domain vibration data is stored in the database and the procedures of spectral analysis, feature extraction, and pattern recognition are programmed. With the predefined LS-SVM classifier, the belonging class of the transformer vibration signal is identified automatically.
Figure 11 gives the prototype photograph of the device.
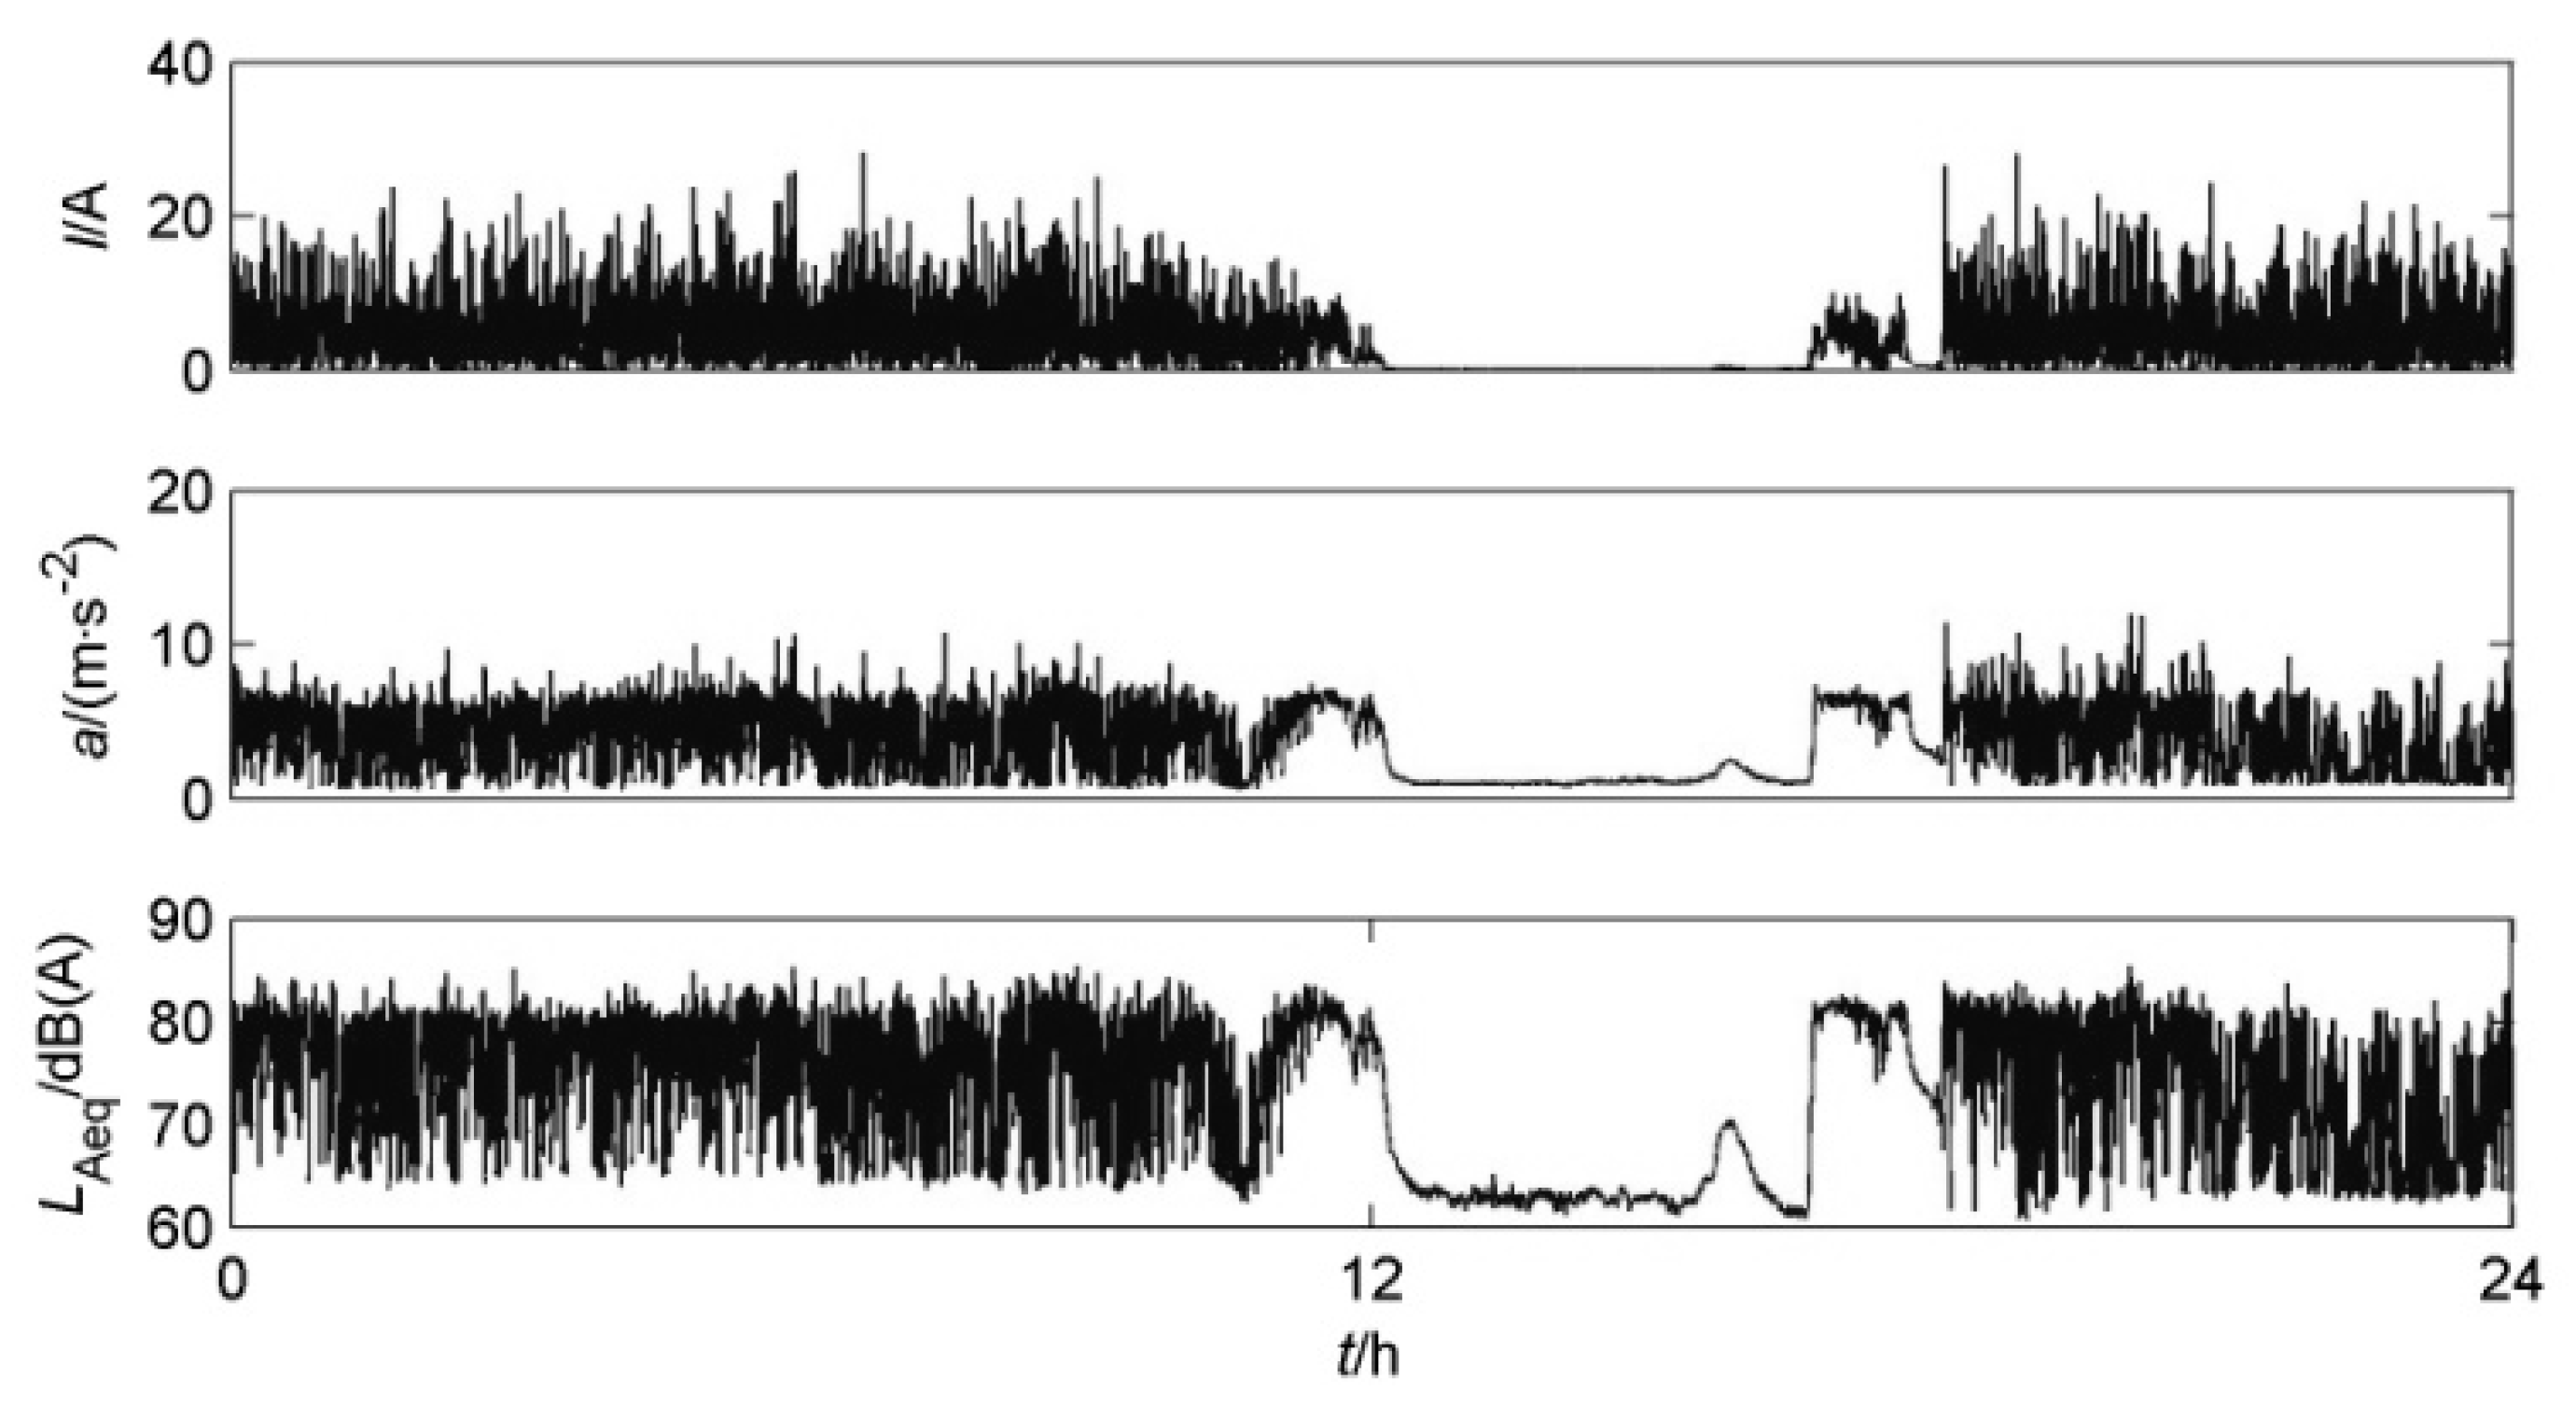
Vibration of a transformer under the influence of DC bias in 24 h is continuously measured with the device, as shown in
Figure 12. The maximum values of the vibration acceleration
a, direct current
I, and A-weighted SPL
LAeq are 12.0 m/s
2, 28.2 A, and 85.4 dB(A), respectively. The changing process of vibration is in good agreement with that of the direct current flowing into the neutral and the A-weighted SPL of the transformer. In the first 12 h, the transformer is DC-biased and the direct current is time varying. After 12 h, the direct current gradually decreases to zero and keeps normal for about 5 h. During this period, the A-weighted SPL and vibration amplitude of the transformer fall off to about 63.6 dB(A) and 1.0 m/s
2, respectively. It is interesting to observe that at 15.6 h a slight fluctuation of direct current occurs. At this moment, the direct current is only about 0.5 A, whereas, obvious increases of vibration and noise signals are found, which are 70.5 dB(A) and 2.5 m/s
2, respectively. It seems that a slight increase of direct current will cause rather large variation to transformer noise and vibration signals, but the relationship between the current value and the amplitudes of noise and vibration still needs further investigation. As for audible power transformer noise, it is usually influenced by the ambient noise of substations. For direct current test, electrical connection with power transformer is needed and does not work when used in DC bias diagnosis of the autotransformer in which the neutral is blocked with power capacitor. Therefore, vibration test based techniques seems much more advisable for DC bias detection of power transformers. With the device, the real-time statuses of DC bias in 12 transformers are monitored for a long time over 2 years in Hunan Province of China.
8. Discussion
Vibration feature selection is a critical issue in the DC bias diagnosis process. There are many ways to extract vibration features of DC bias in different contributions. The proposed features in this investigation have some of common points but also some clear dissimilarities with previous studies on vibration-based DC bias test methods.
In some studies, three parameters are selected to investigate the impact of DC bias on a three-phase 500 kV power transformer, which are the distribution percentage of spectral energy, energy ratio of odd and even harmonics and waveform distortion ratio [
22]. The usage of energy relative features especially the energy ratio of odd and even harmonics is similar with this study. However, the energy distribution feature is not the same. It seems more reasonable to divide the whole vibration frequency band into equal-width segments other than overlapped ones. In this case, the energy variation with and without DC bias is much more apparent especially in low frequency bands. Thus, the WPD seems to be a proper method. Moreover, the parameter waveform distortion ratio may be not reasonable for the amplitude of the basic frequency 100 Hz suffers a great change with and without DC bias. This parameter seems to be more meaningful when the amplitude of 100 Hz is invariant.
In addition to the energy ratio of odd and even harmonics, some other features like power-frequency (50 Hz) amplitude and mutual information are also proposed [
21]. Unlike the amplitude of the 100 Hz signal used in the waveform distortion ratio parameter, the vibration amplitude of power-frequency may be not obviously changed after the occurrence of DC bias. An insensitive feature will increase the computational cost of pattern recognition. Besides, the parameter calculation process of mutual information is more complex than that of the spectral complexity, while both the parameters reflect the dispersion degree of the frequency components in the vibration spectra.
One factor cannot be precluded is that these vibration features are commonly relative with each other, which means some common information included in different features are repetitively used. In order to avoid this problem, the PCA method is an available choice. However, this method is not mentioned in current literatures about DC bias diagnosis. It is believed that the application of PCA method will decrease the dimension of vibration features and make them more effective.
Another issue worth discussion is the generalization of the proposed technique. Actually, DC bias will cause variation of transformer vibration characteristics in the time- and frequency-domains. This is not related with the voltage rating of the transformer. For example, according to field test results, the vibration of a 220 kV three-phase transformer in DC bias condition has similar characteristics with that of a 500 kV single-phase transformer such as high harmonics over 1 kHz, energy proportion change of different frequency bands and presence of high-amplitude odd harmonics of 50 Hz. Thus, the proposed features are deemed also available for a transformer with different rating. Considering the generality of the PCA and LS-SVM algorithms, it is reasonable to deduce that the vibration signals of the transformers with different ratings are all included in the training data sets. Of course, in this case the classifier of LS-SVM may need further modification.
9. Conclusions
Vibration signals on the oil tank surface provide essential information about the operation state of power transformer. In this paper, the field vibration test of a 500 kV autotransformer is conducted under the influence of DC bias in the monopole trail operation stage of the ±800 kV Jiuquan-Hunan HVDC power transmission system. From the test results, it is proved that the vibration test method is effective at detecting DC bias in power transformers even if their neutral is blocked with a power capacitor. However, as transformer vibrations are also influenced by the factors such as load current and harmonics, vibration amplitude alone is not enough to characterize DC bias. The time-domain waveform and frequency-domain spectrum comparisons between normal and DC-biased vibrations of a power transformer are performed. In addition to vibration amplitude, it is revealed that DC bias changes the frequency spectrum distribution in frequency component and its energy proportion. Based on the comparison result, three features including odd-to-even harmonic ratio, spectral complexity, and wavelet packet energy distribution are proposed. From the sensitivity analysis, these features are proved effective to diagnose DC bias. The PCA method is employed to de-correlate these features and decreases the dimension from 18 to 2. The LS-SVM algorithm is proposed to classify and recognize the extracted features. A training process is conducted to determine the LS-SVM classifier with 126 sets of vibration samples. With this classifier, thirty six sets of state-unknown samples are successfully recognized. The proposed algorithm is verified effective in DC bias diagnosis of power transformers. Based on the algorithm, an on-line monitoring device is designed and put into field application. It could be used in the remote monitoring of the DC bias condition of power transformers.
