Article

A Robust Optimization for Designing a Charging Station Based on Solar and Wind Energy for Electric Vehicles of a Smart Home in Small Villages

1
Department of Mechanical Engineering, Graduate School of Kunsan National University, Gunsan 573-701, Korea
2
School of Mechanical & Automotive Engineering, Kunsan National University, Gunsan 573-701, Korea
*
Author to whom correspondence should be addressed.
Energies 2018, 11(7), 1728; https://doi.org/10.3390/en11071728
Submission received: 20 June 2018 / Revised: 27 June 2018 / Accepted: 28 June 2018 / Published: 2 July 2018

Abstract

:
In recent years, integration of electric vehicles (EVs) has increased dramatically due to their lower carbon emissions and reduced fossil fuel dependency. However, charging EVs could have significant impacts on the electrical grid. One promising method for mitigating these impacts is the use of renewable energy systems. Renewable energy systems can also be useful for charging EVs where there is no local grid. This paper proposes a new strategy for designing a renewable energy charging station consisting of wind turbines, a photovoltaic system, and an energy storage system to avoid the use of diesel generators in remote communities. The objective function is considered to be the minimization of the total net present cost, including energy production, components setup, and financial viability. The proposed approach, using stochastic modeling, can also guarantee profitable operation of EVs and reasonable effects on renewable energy sizing, narrowing the gap between real-life daily operation patterns and the design stage. The proposed strategy should enhance the efficiency of conventional EV charging stations. The key point of this study is the efficient use of excess electricity. The infrastructure of the charging station is optimized and modeled.

Graphical Abstract

1. Introduction

Renewable energy systems used as charging stations for electric vehicles (EVs) have become a major research issue; it is reported that the number of EVs in use is now more than 2 million globally [1]. One effective way to mitigate either the impacts of EVs on local power or facilitate charging EVs where local power is not available is integrating renewable energy systems with the charging infrastructure [2]. This will further decrease charging costs as well as emissions [3]. This concept is crucial and motivates a more detailed study of both cost–benefit justification and feasibility. The major challenge in using either solar or wind as a source of power is that wind or solar power may not be available when electricity is needed [4]. In fact, the fundamental drawback of renewable energies is fluctuations in power output, especially in photovoltaic (PV) systems [5]. Hence, it is essential to mitigate fluctuations in renewable energy output power. Integration of a battery energy storage system (ESS) can help to decrease this uncertainty in renewable energy generation, enhancing grid security and reliability. An ESS can also smooth variations in renewable energy power output over a desired time horizon [6].
The interaction between EVs and renewable energy systems has been widely investigated. The main body of the existing research can be categorized into three groups: cost analysis, performance and efficiency improvement, and emissions.
Studies in the first category are focused on reducing charging costs, electricity charging costs, and operational costs [7,8,9,10,11]. Efficiency and performance improvement of renewable energy utilization for EVs have also been studied [12,13,14,15]. In addition, several groups have examined decreasing emissions when EVs and renewable energy systems are incorporated into the electrical grid [16,17,18].
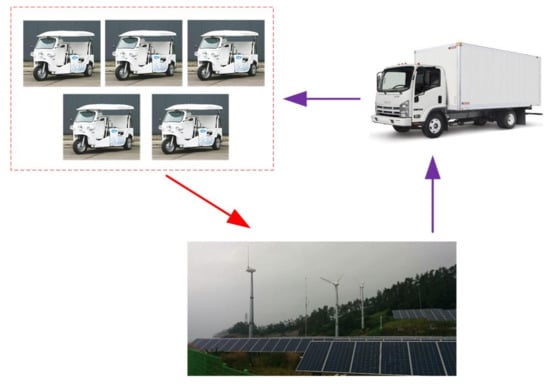
In this study, we investigated the optimum design of a hybrid renewable energy system on an island based on practical experiments for charging EVs. The objective of this paper is to present a novel strategy for renewable energy utilization for EVs. The proposed hybrid system consists of a PV system, a wind turbine (WT), and a power converter. In addition, we considered lithium-ion batteries to smooth out fluctuations in renewable energy power output. Particularly, this paper aims to extend the methods developed in [19,20,21]. A key limitation of these research works was that the effects of excess electricity on the charging electric vehicles were not considered. Hence, the key point of this study is the efficient use of excess electricity. We also considered a DC charging station for a smart home, where external battery chargers are used for fast charging and depleted batteries are exchanged for charged ones (i.e., battery switching) to power the EVs over a short period. It is worth noting that this standard is highly suitable for small communities where grid electricity is not available. A novel approach is then proposed for obtaining the minimum and maximum number of batteries with the optimum configurations by the solar and wind energy potential. Furthermore, it is shown that the WT plays an important role in the EV charging station; therefore, the effect of WTs on the overall system is also investigated.
The rest of paper is organized as follows. Section 2 presents the proposed framework for this study. The infrastructure of the proposed charging station is given in Section 3. The specific details of the system, as well as results, are discussed in Section 4. Section 5 concludes the paper.

2. Infrastructure of the Charging Station

Various charging stations have been developed in different countries. In practice, there are a several standards for different charging options using either alternating current (AC) or direct current (DC) stations, as well as different types of EVs. In this research, we considered a DC charging station for a smart home, where external battery chargers are used for fast charging and depleted batteries are exchanged for charged ones (i.e., battery switching) to power the EVs over a short period. It is worth noting that this standard is highly suitable for small communities where grid electricity is not available. We considered eTuk vehicles in our study, because they are well-suited to small remote areas for the transport of people and goods due to their small size and ability to access small spaces. Transport of batteries for the EVs can be accomplished in two ways (Figure 1): (1) replacing the discharged batteries with fully charged batteries brought by the EV operator from the local renewable energy station or (2) bringing fully charged batteries from the central station to the service stations by electric trucks. It was assumed that the process of charging batteries, undertaken by a trained driver, is quick, efficient, and effective. The proposed renewable energy charging station and how it works will be discussed in details in Section 3.

3. System Modeling and Specification

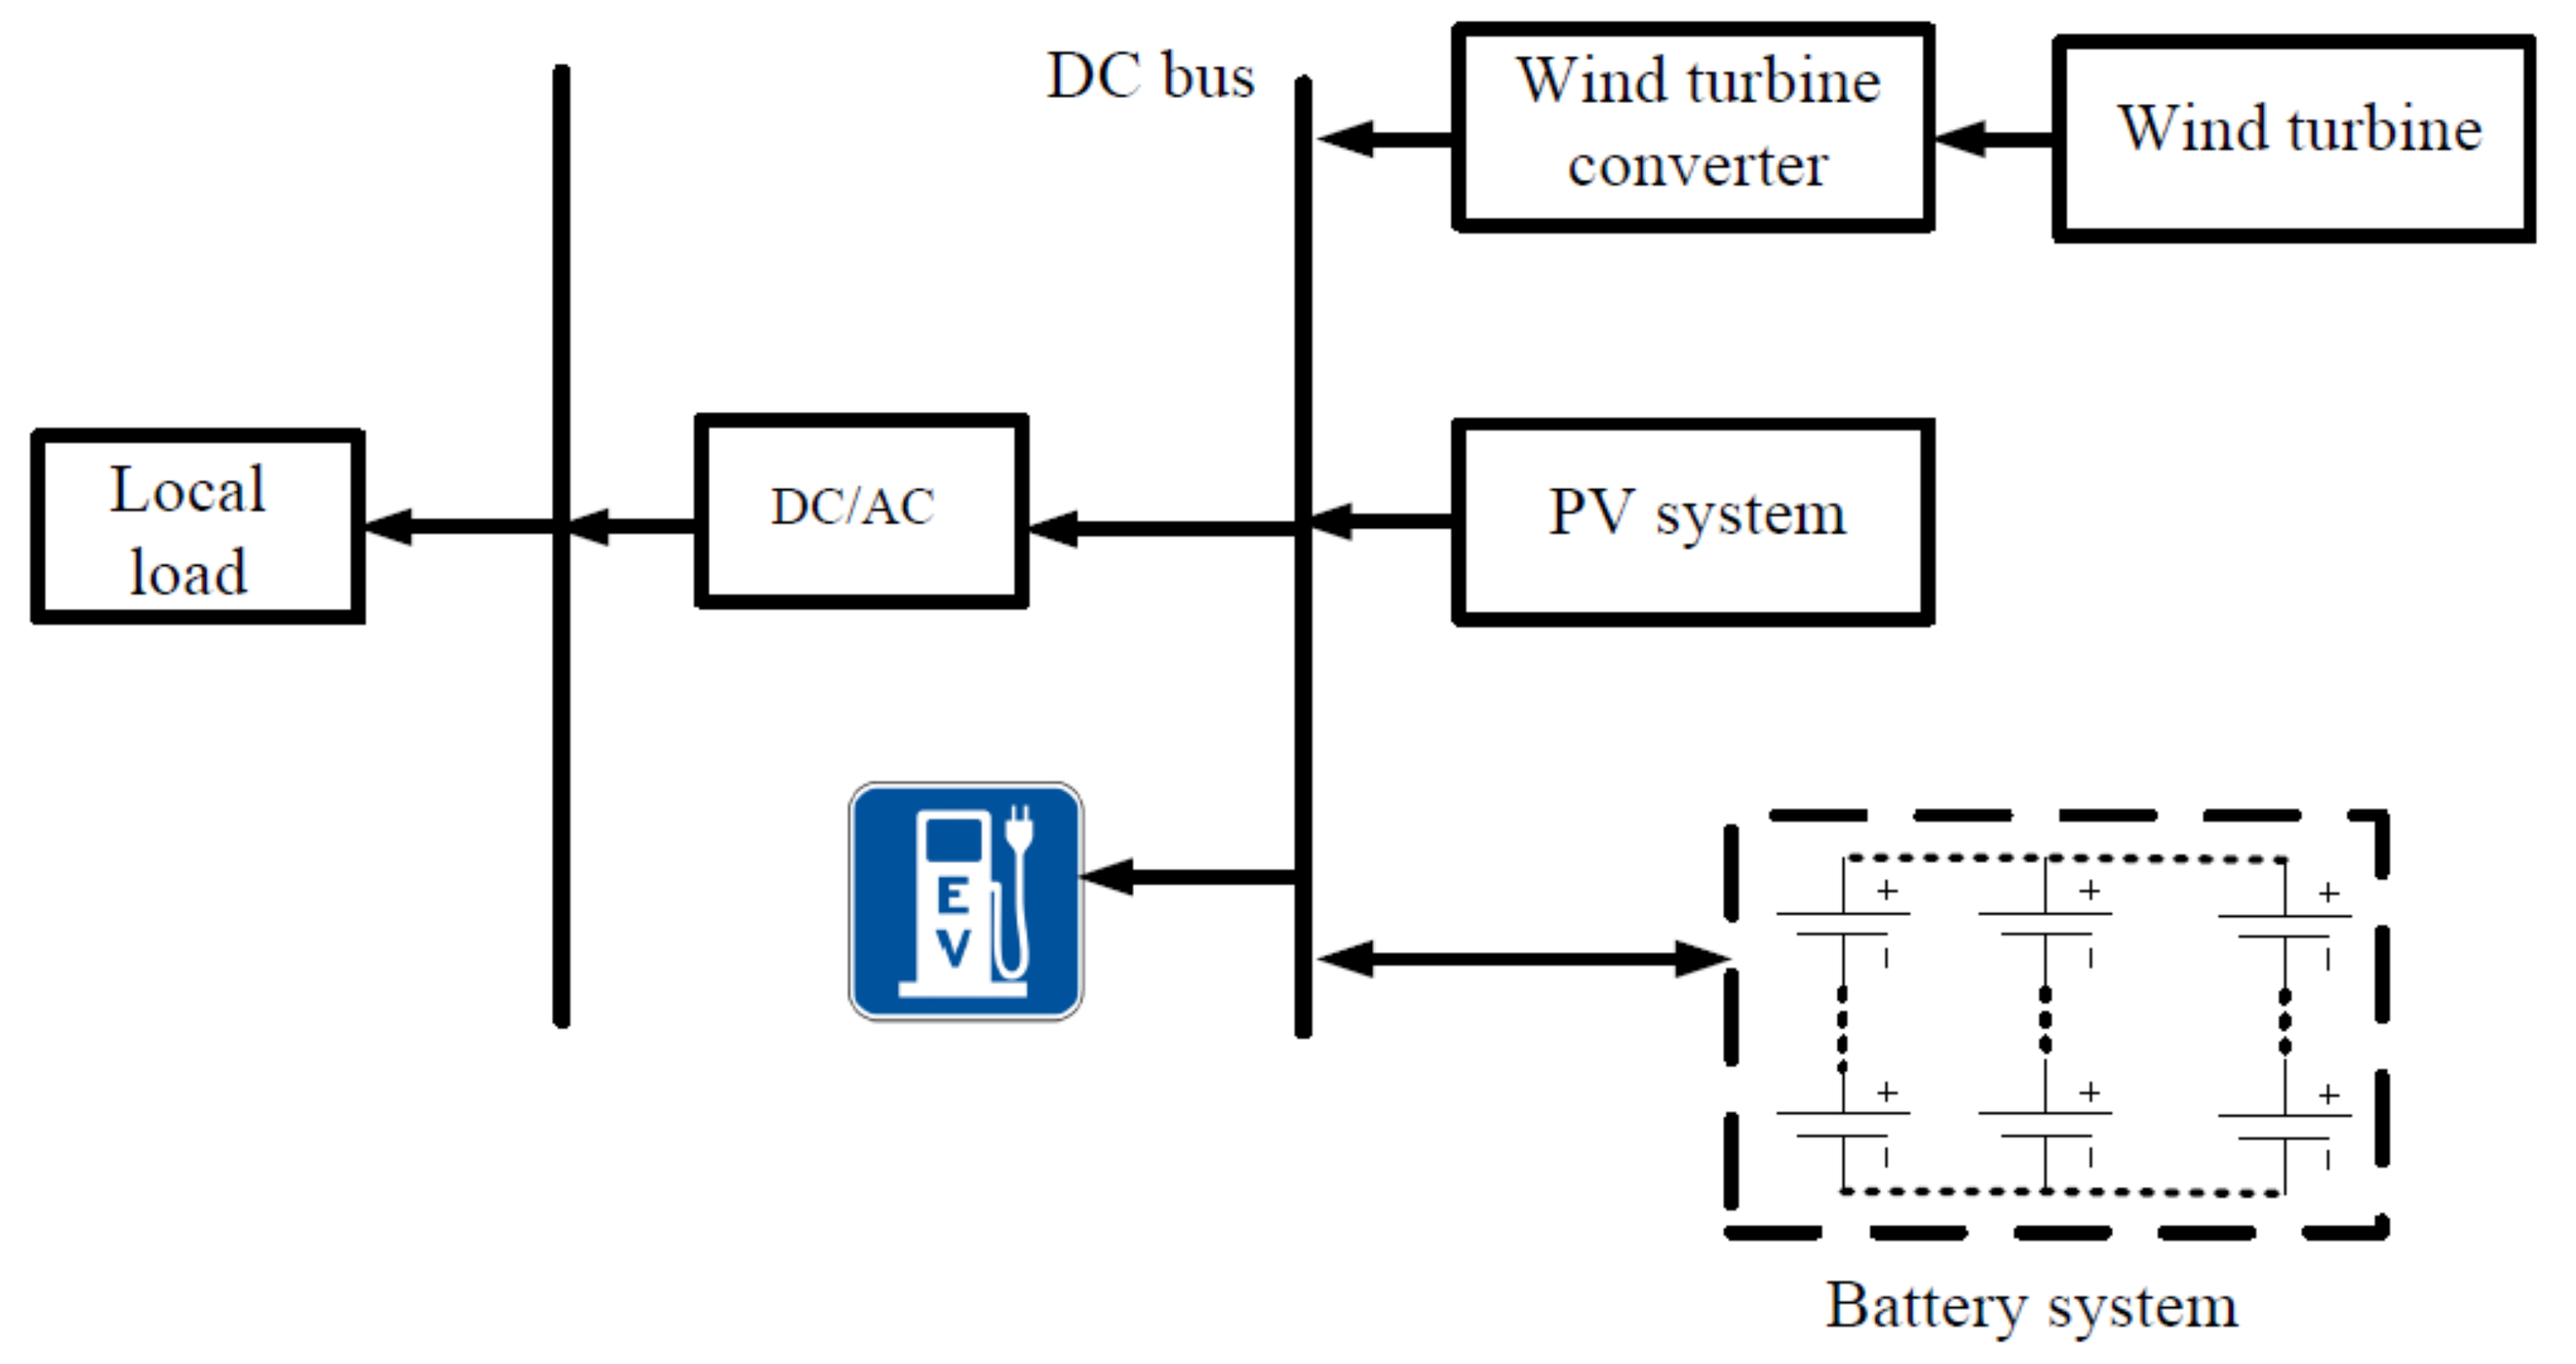
The proposed renewable energy charging stations consist of WTs, PV systems, an ESS and an inverter, as shown in Figure 2. Related assumptions and inputs, such as resource data of the proposed site, component parameters, load demand, and sensitivity variables, are given in the following section. In the next section, the optimization and sensitivity results are discussed.
In this study, the Weibull distribution is defined by [22]
f D ( τ ) = k c k τ k 1 exp [ ( τ c ) k ]
where k and c denote the shape factor and scale factor, respectively, of the Weibull distribution f D ( τ ) for a certain time τ. The maximum likelihood method described in [22] is used to estimate the Weibull distribution parameters k and c.
It should be noted that, apart from the energy rating limitation of battery systems, we have losses in the converter and battery current limits that should be taken into account to fully utilize the battery system. Therefore, to use the battery system efficiently in this application, the following limitations must be considered in the structure of the battery system:
  • SOC: The state of charge of a battery system indicates the available capacity of the battery system as a percentage of the rated capacity. The nominal or available capacity is given by the manufacturer and represents the maximum charge of the battery that can be stored. As neither depletion nor overcharge in the battery is desirable, the SOC of the battery must be kept within proper limits—between 30% and 100%. As such, the charge/discharge time of the battery system will be determined by the limitation in the SOC for the battery, as well as the energy left in the battery.
  • Depth of discharge (DOD): Cycle life is an important parameter of a battery system that decreases as the DOD increases. Many cell chemistries cannot tolerate deep discharge and may be permanently damaged after complete discharge. Thus, the DOD should be limited to an appropriate range to protect the battery from death and increase the cycle life of the battery. This range can be deduced from the limitation that SOC should not drop below a critical level.
  • Battery throughput: This corresponds to the amount of energy that can be cycled in the battery system during one year.
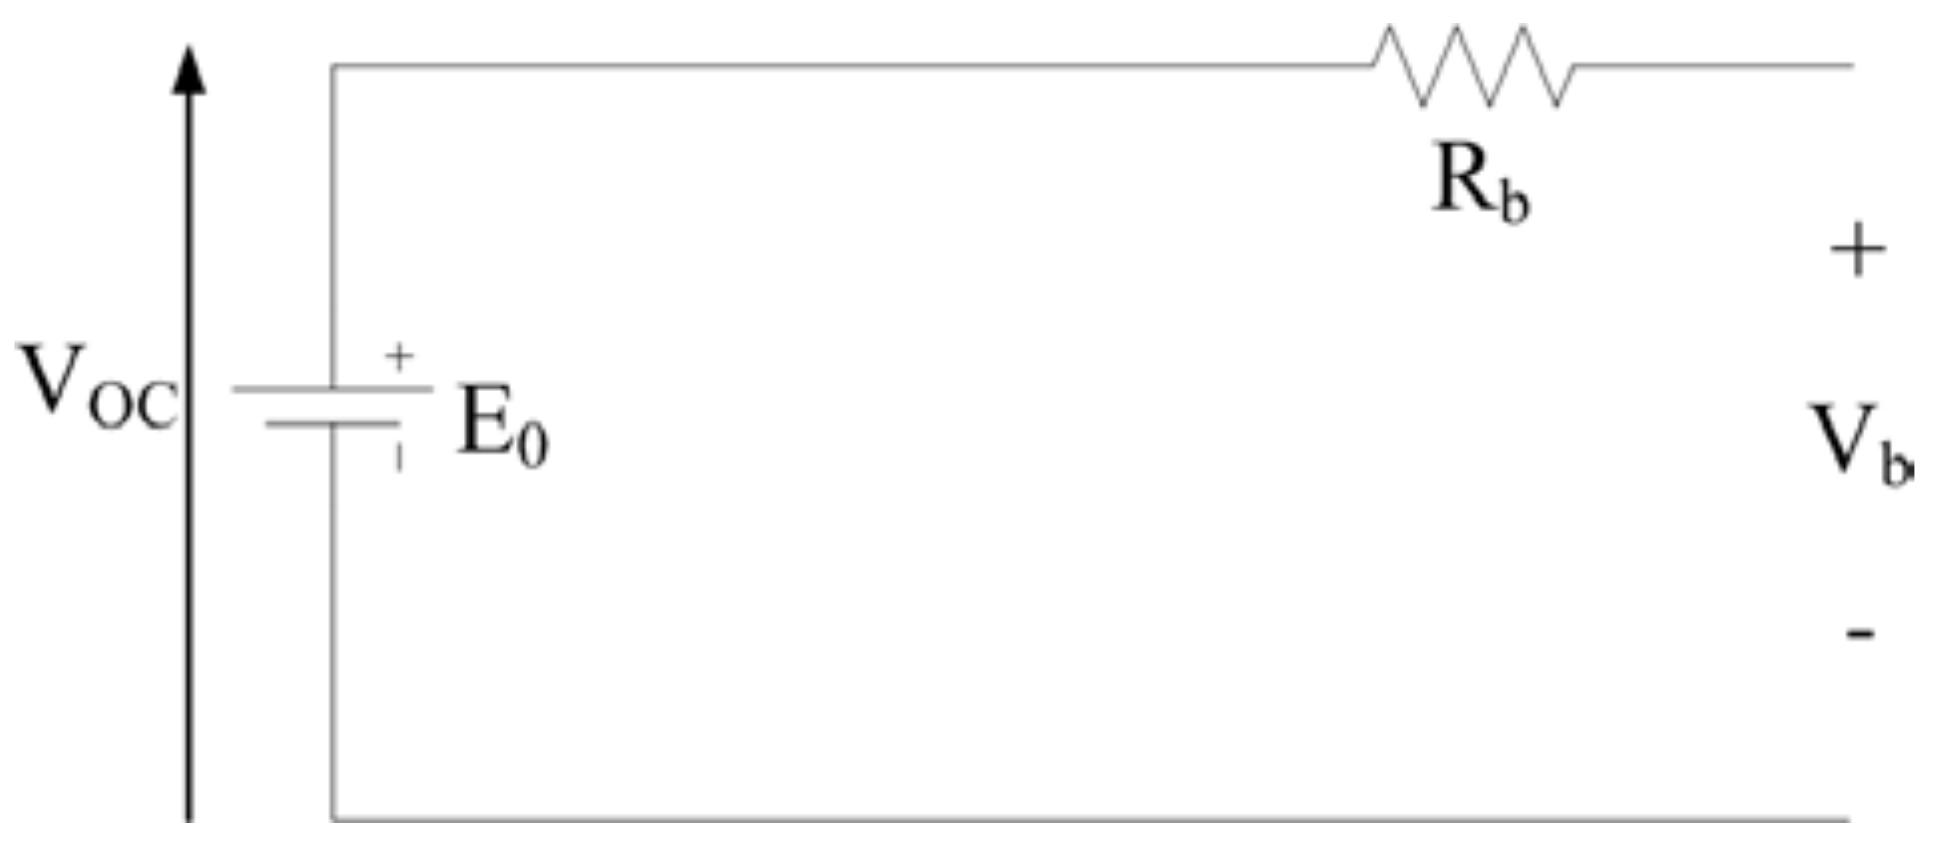
Developing a precise model of a battery system considering all specific factors is a complicated task. It has been said that a battery system can be modeled to consist of a resistor (Rb) in series with an ideal voltage source (E0). The open circuit voltage (VOC) gives the voltage across the battery. Meanwhile, the voltage across the resistor Rb and battery gives the terminal voltage of the battery Vb, as shown in Figure 3. Rb is a function of the SOC of the battery system (i.e., it varies depending on the SOC).
Hence, Rb can be expressed as
R b = R o S k
where Ro is the resistor of the battery in full charge (Ω) and k is the capacity coefficient. S is the SOC factor and varies from 0, fully discharged, to 1, fully charged, given as follows:
S = 1 A h C 10
where C10 denotes the 10 h capacity (Ah) at the reference temperature, h is the time of discharging (h), and A is the discharge current (A). From this, we can derive the relationship between the battery capacity and the discharge range as
C a p = F × I y
where Cap is the battery capacity (Ah), I is the discharge current (A), and F and y are constant values that can be obtained using the Peukert factor.
In this study, the lifetime throughput (Qlifetime,i) of the batteries is calculated as
Q l i f e t i m e , i = f i d i [ q max V n o m 1000 W / k W ]
where fi is the number of cycles to failure, di is the depth of discharge (%), qmax is the maximum capacity of the battery (Ah), and Vnom is the nominal voltage of the battery (V). It must be noted that a fraction for “d” must be used in Equation (5).
The proposed method and the logical approach presented in Ref. [19] was adopted in this study for optimal design of the system. The objective function of the study is considered as
Minimize C T = C M + C C
where CT, CM, and CC denote the total cost, the maintenance cost, and capital cost of the system, respectively.
The capital cost as well as the maintenance cost of the system are given as [19]
C C = j ( 1 + j ) n ( 1 + j ) n 1 × [ N W × C W + N P V × C P V + ( n L B ) × N B T × C B T + ( n L I n v ) × C I n v + C B ]
C M = [ C M W × t = 1 24 E W t + C M P V × t = 1 24 E P V t + C M B T + C M I n v + C M B ] × 365
where NW represents the number of wind turbines, CW is the unit cost of a wind turbine, NPV is the number of PV panels, CPV is the unit cost of PV panel, LB is the battery’s life span, NBT is the number of batteries, and CBT is the unit cost of a battery, LInv represents the life span of the inverter, CInv is the inverter cost, and CB is the cost of the backup generator. n is number of years for project lifetime and j represents the interest rate of the system. C M W is the maintenance cost of the wind turbine per kWh, and C M P V is the maintenance cost of the PV panel per kWh. C M B T , C M I n v , and C M B denote the maintenance cost of a battery, inverter, and backup generator, respectively.
The total energy generated by the wind turbines and PV systems at time t are evaluated as [19]:
E W t = P W t × Δ t
E P V t = P P V t × Δ t
where P W t , and E W t denote the power and energy generated by the wind turbines, respectively, Δ t is the study time. P P V t represents the power generated by the PV panels, E P V t is the energy generated by the PV panels.

4. Results and Discussion

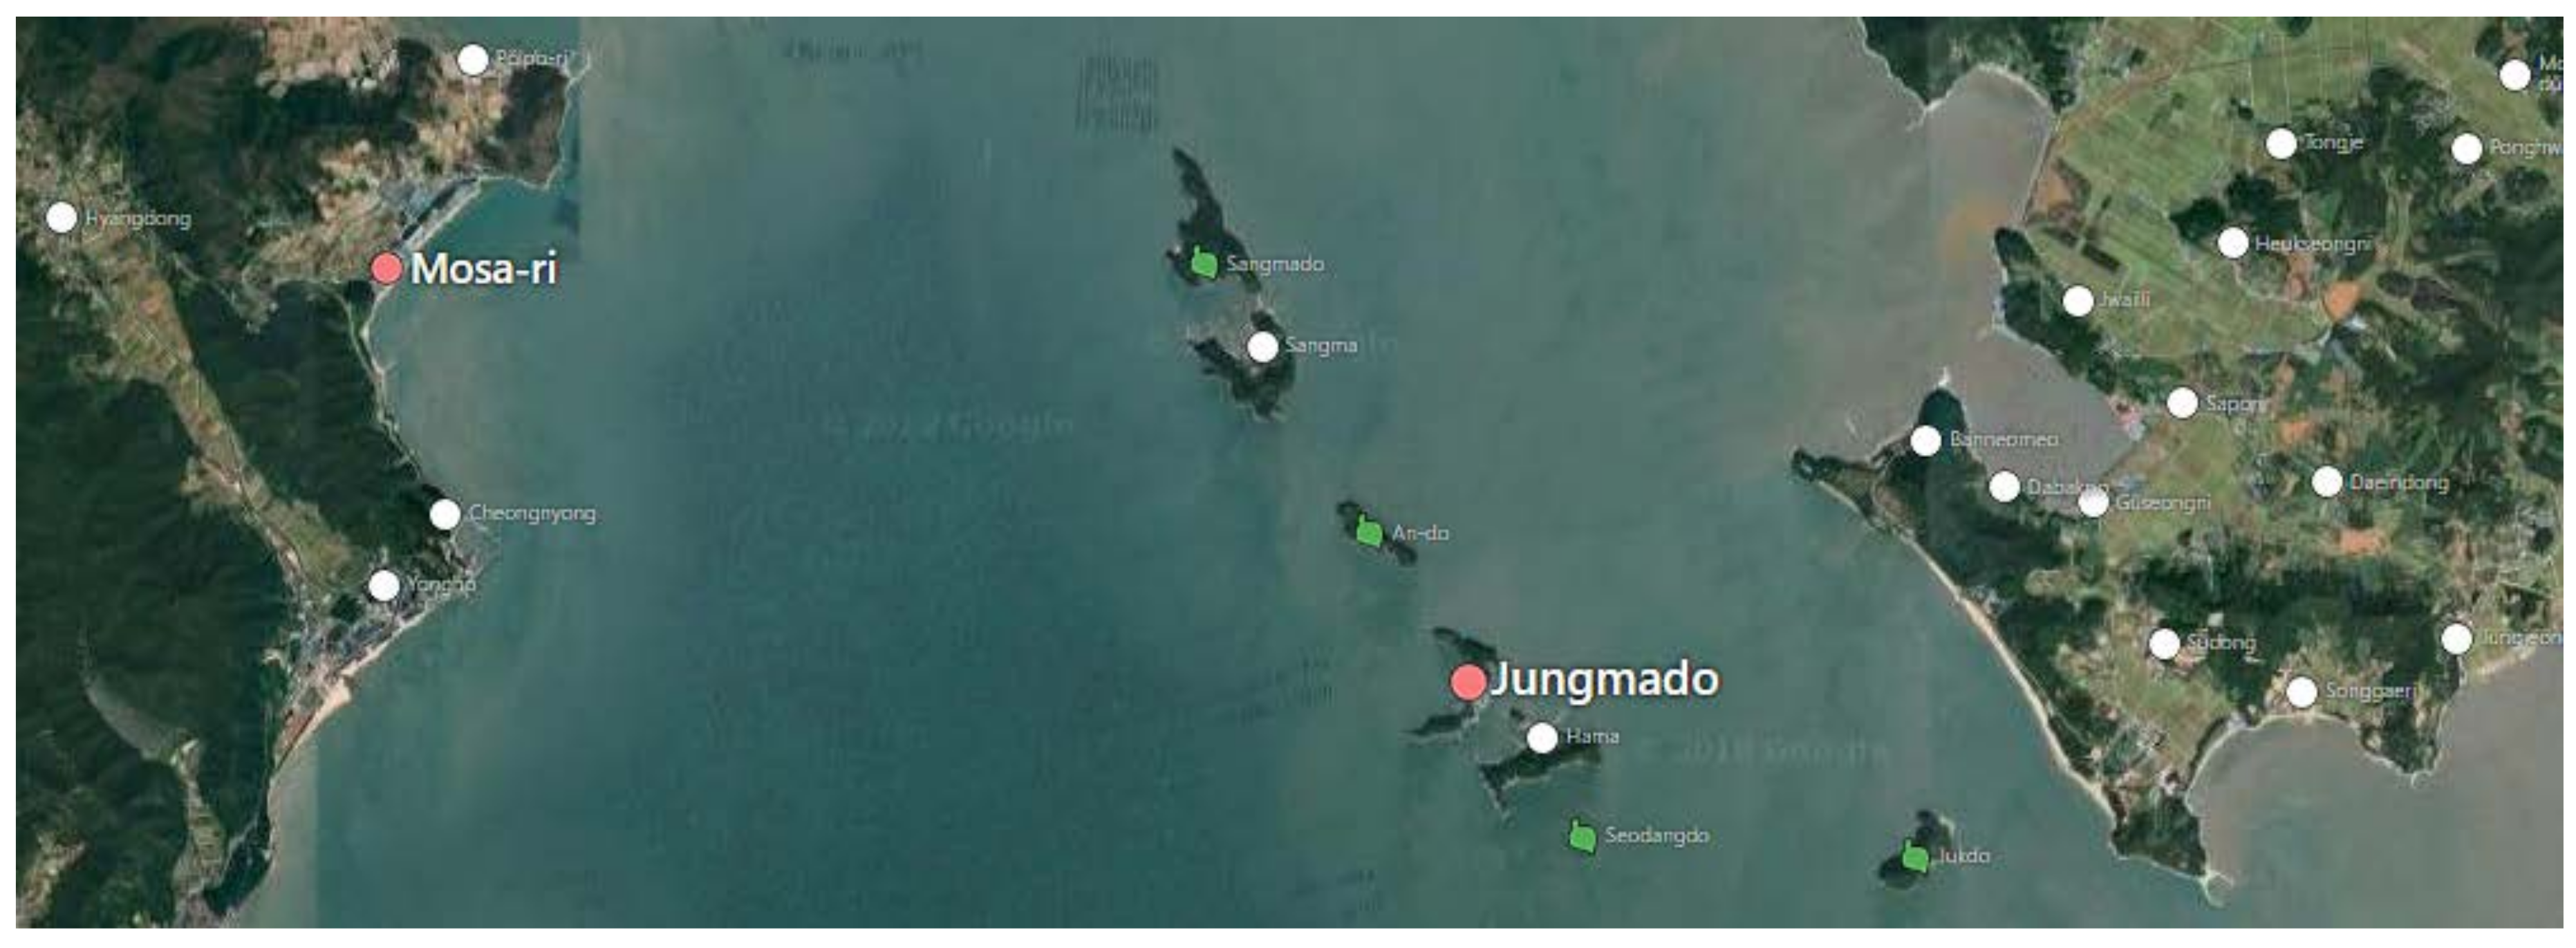
The site is located in the South Sea and is the smallest island of over 3000 islands in South Korea, with a population of 60 across 20 houses. This island is an off-grid system. The island has a latitude of 34.26° and longitude of 126.25. Figure 4 shows an aerial view of the proposed site in Jung-Ma-Do Island, South Korea, as indicated by ‘A’ in the figure.
The eTuk [23] is a small electric vehicle developed by the Tuktuk Factory. The characteristics of the eTuk are given in Table 1.
In addition, the infrastructure charging standard for EVs is given in Table 2. Home charging includes residential and workplace locations. Semipublic charging stations are those in workplaces, markets, and community facilities. Public charging stations are those in city centers, high streets, and tourist attractions.
Levels 1–3 are linked to the capacity of the charging station. Modes 1–3 are related to the protection types of the charging station. The charging station is designed using an external battery charger for fast charging in mode 4. In reality, depleted batteries are exchanged in mode 4. Mode 4 is well-suited to remote areas and has been considered in our study.
The following assumptions are made according to data from the Tuktuk Factory, as well as the IEC 61851-1 standard. The charging time of the EVs is considered to be fast charging (2 h); energy consumption per EV is 1 kWh/1km; charging time is between 6 a.m. and 7 a.m.; five EVs are considered to be implemented in the site, based on the population of the site (60 with twenty houses); 20% variation in day-to-day charging amount and 20% variation in time steps of the EVs are included. To model the EV as a DC load, a symmetric load profile was constructed, equal to the maximum load that the station could cover over the charging time.
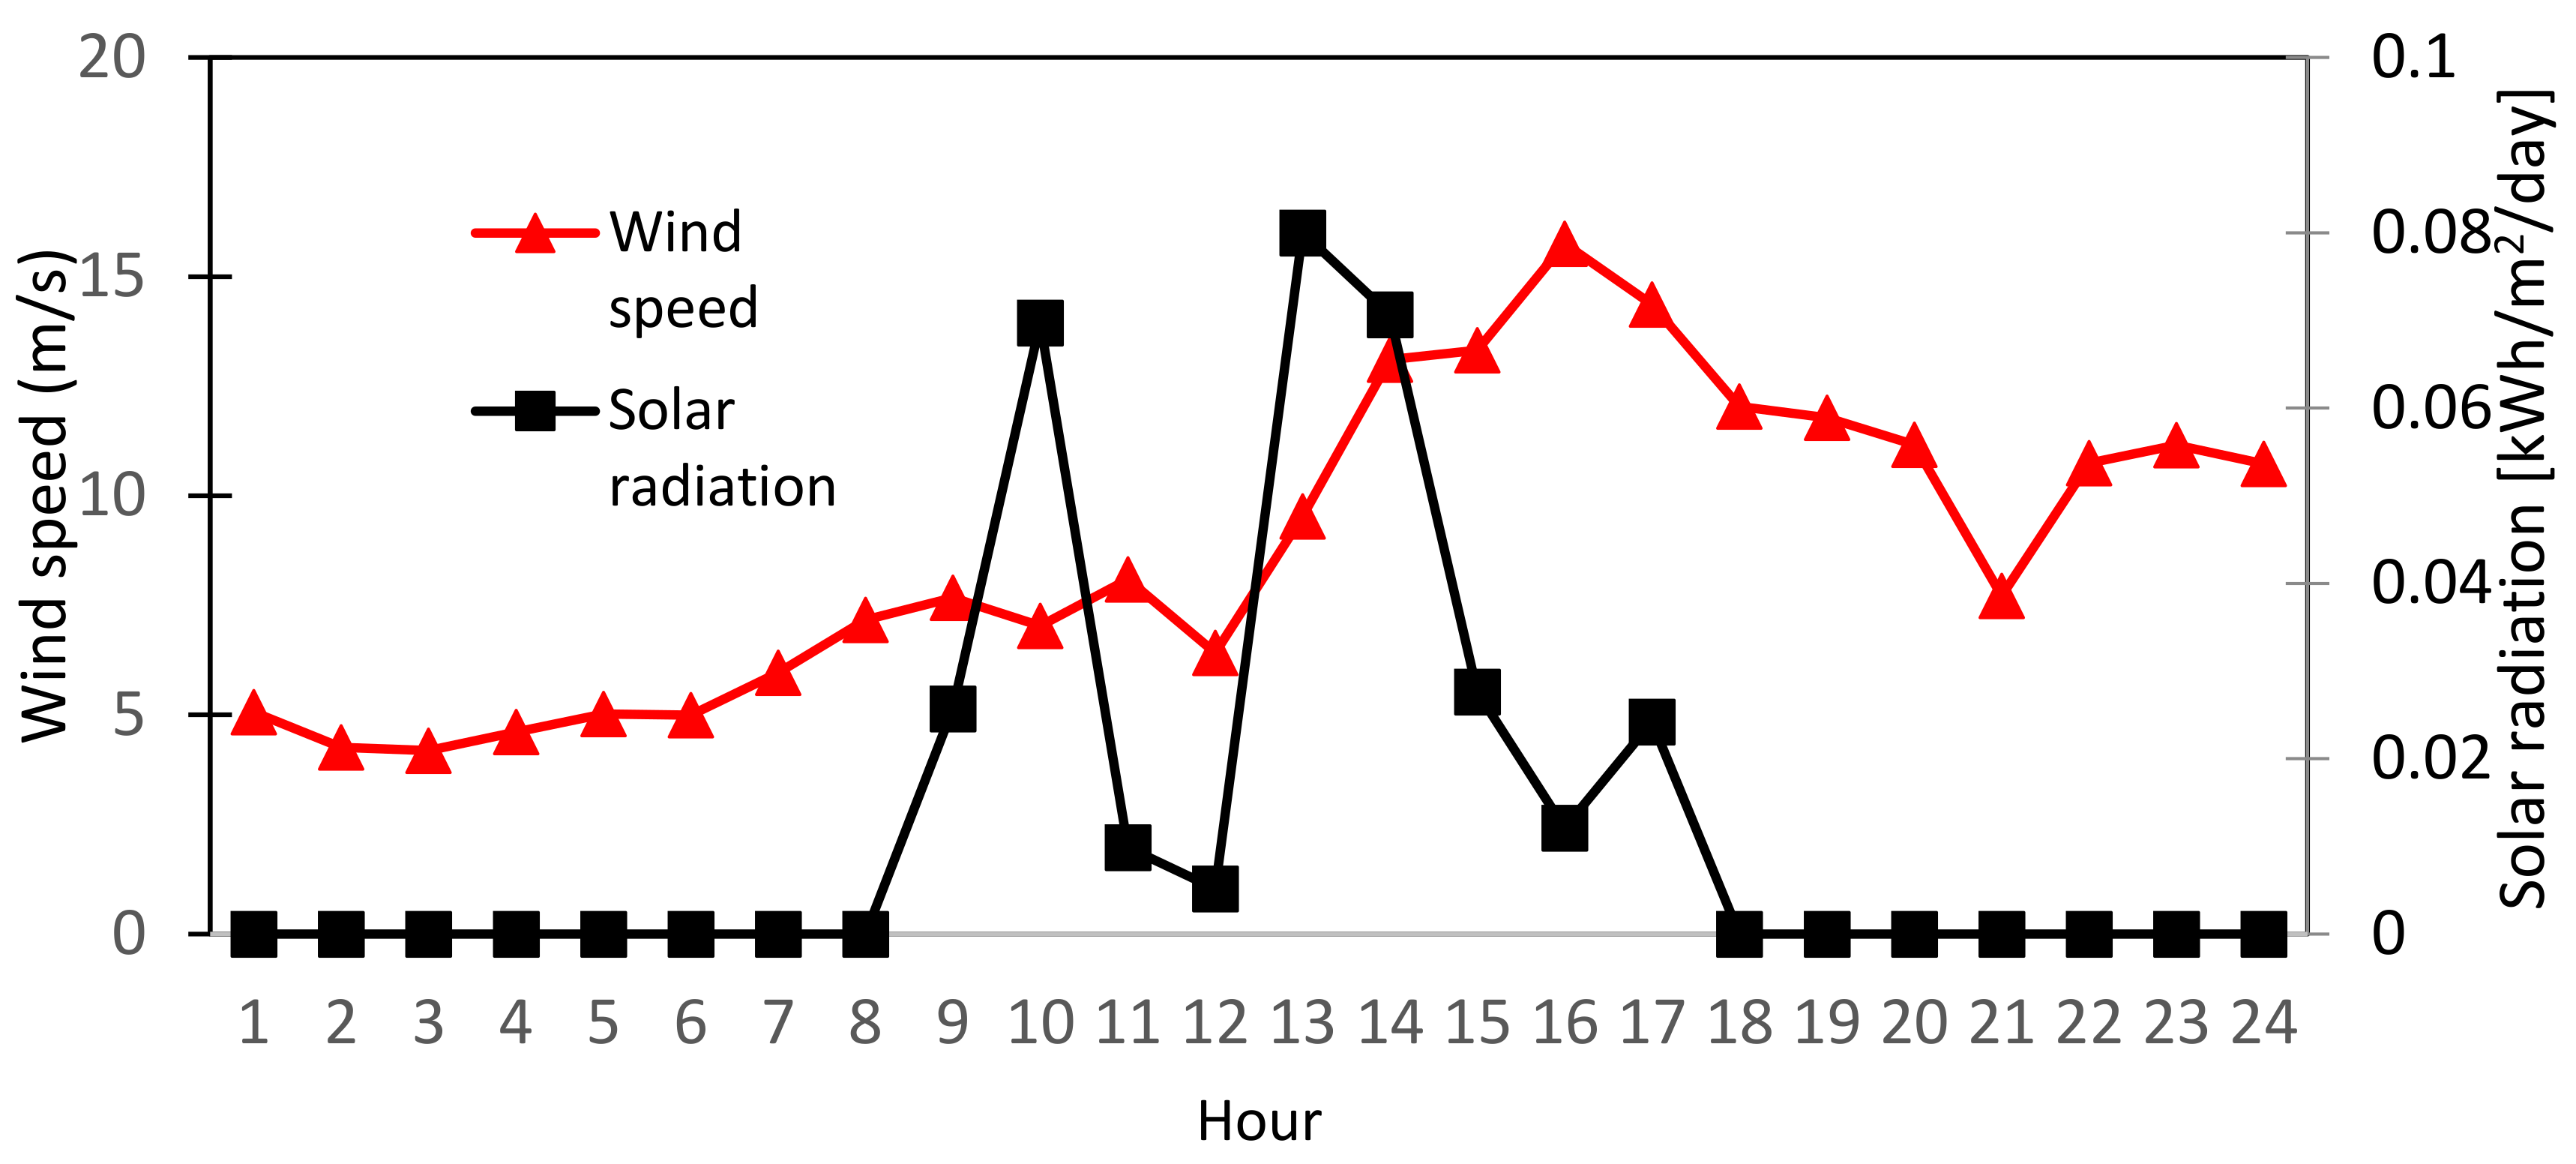
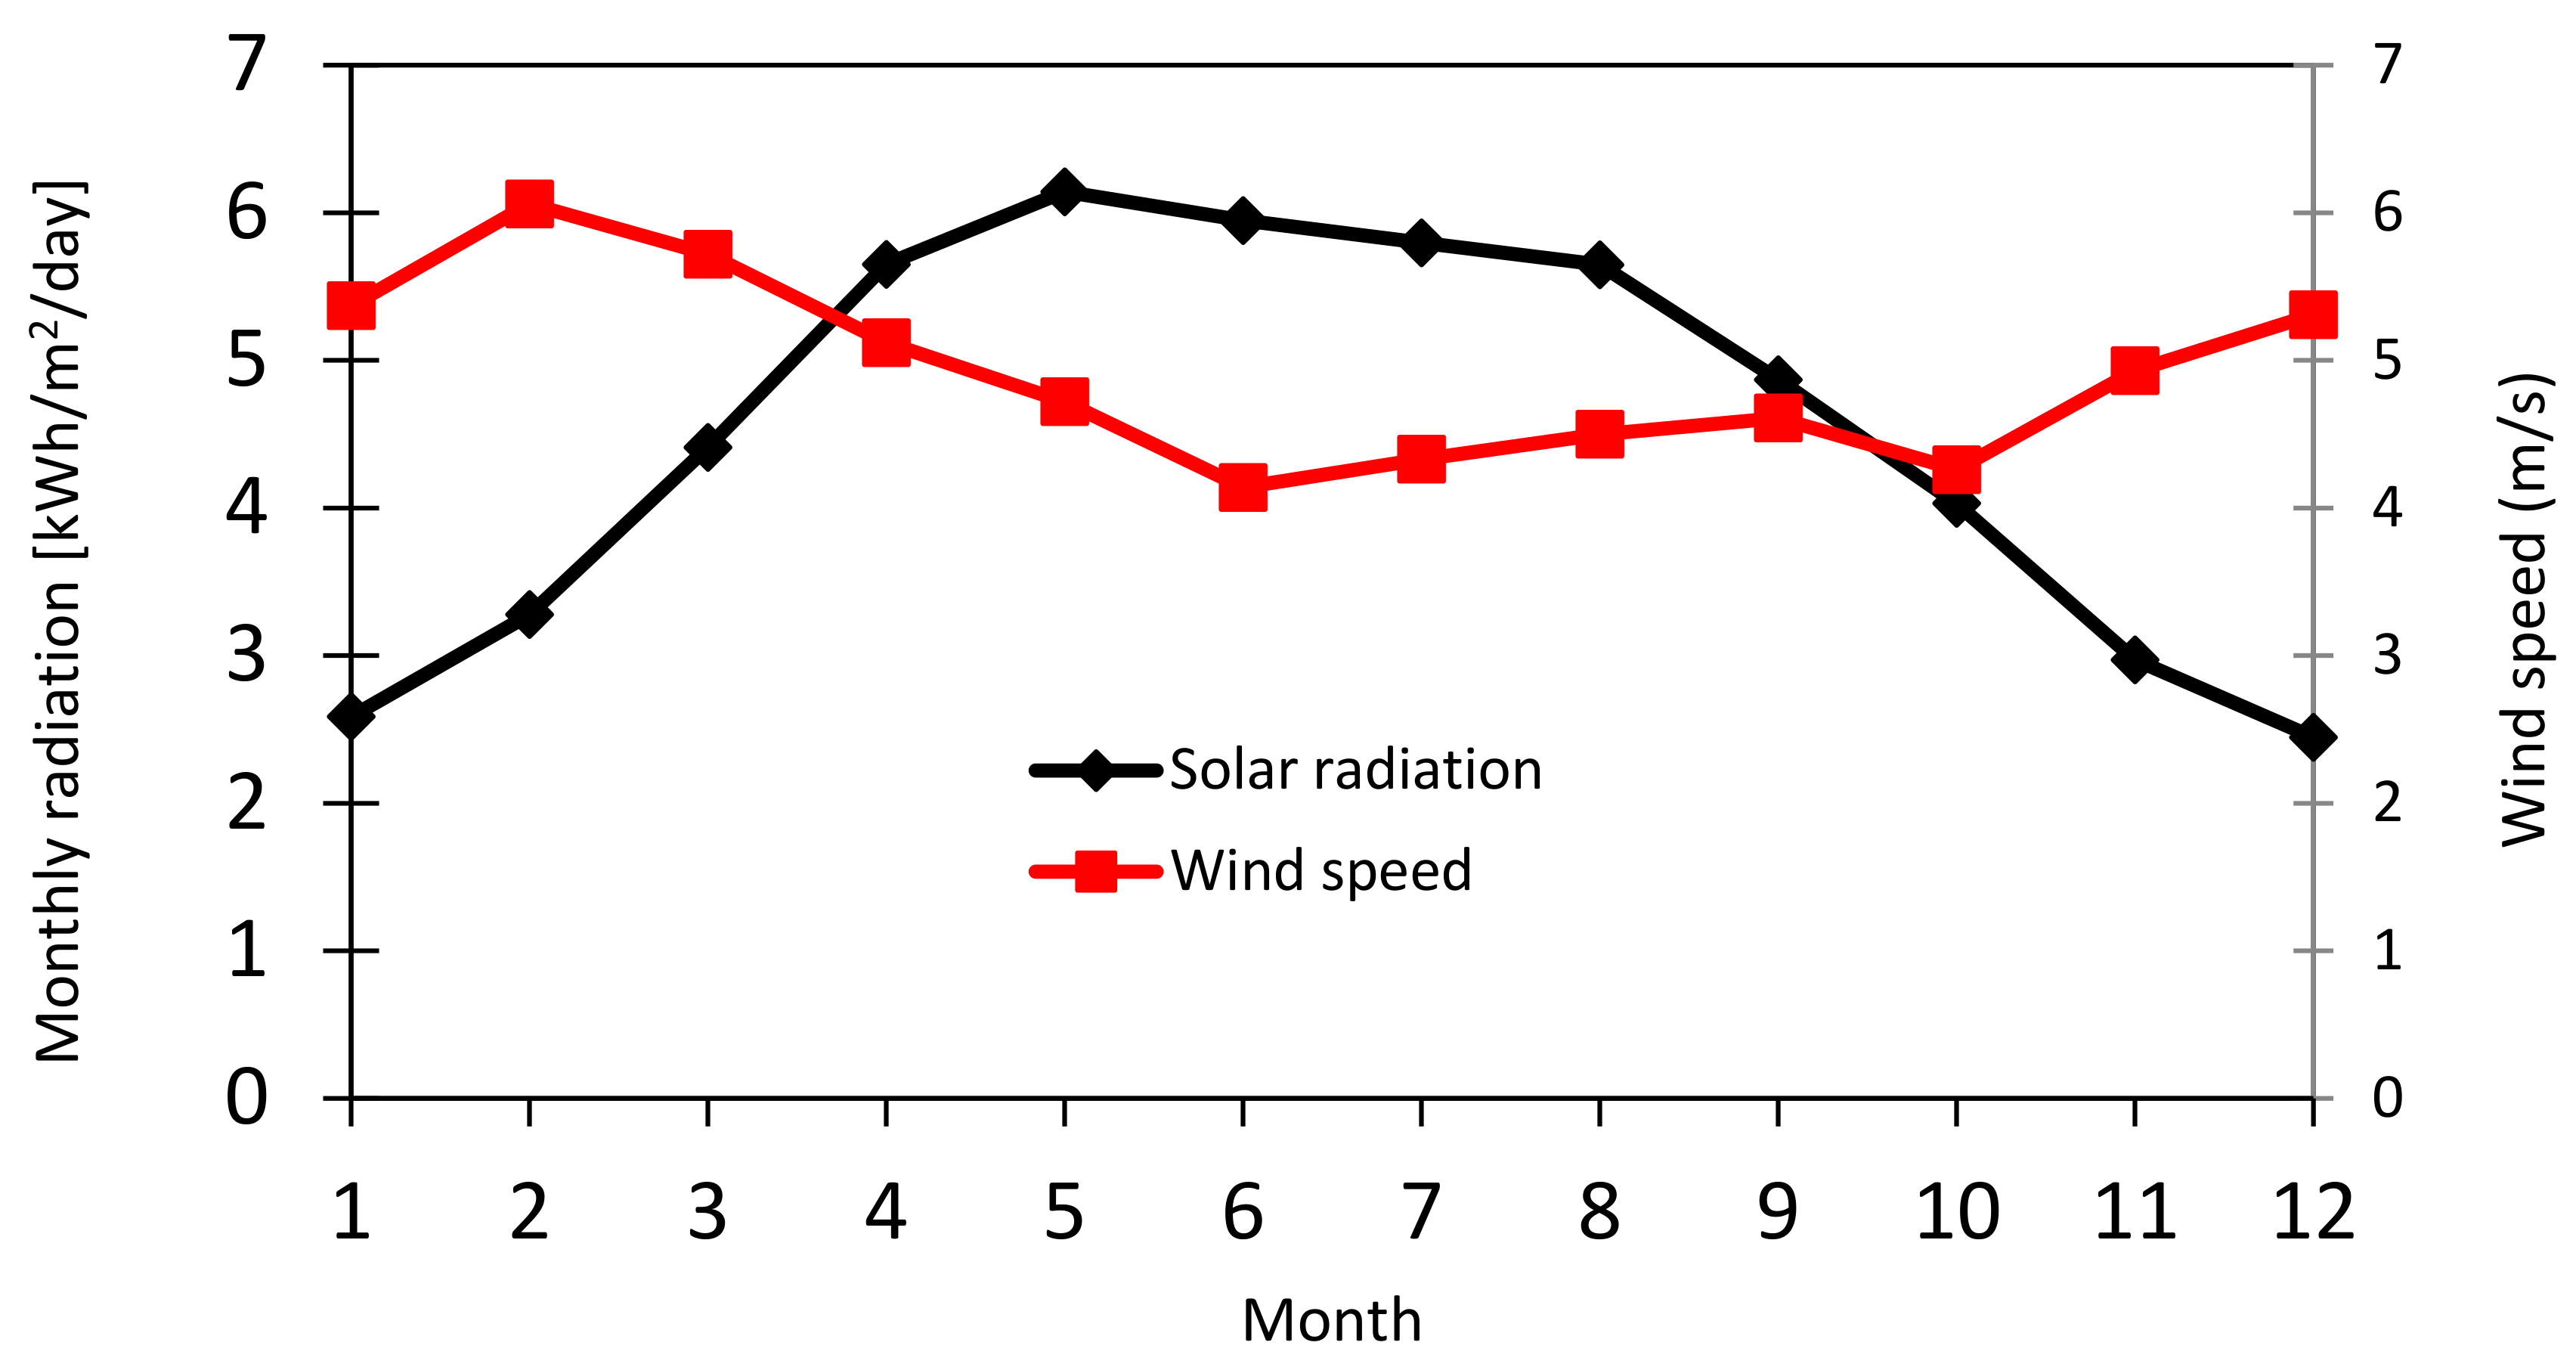
The daily and average monthly wind speed and solar radiation on the island are shown in Figure 5 and Figure 6; there was no solar radiation between 18:00 to 8:00 on 1 January. The monthly average wind speed ranged from approximately 4.140 m/s (June) to 6.06 m/s (February). The highest wind speed occurred in February. In addition, the monthly average solar radiation ranged between 2.5 and 6 kWh/m2/day. The highest value of solar radiation was recorded in May. The annual average monthly wind speed and solar radiation at the site were recorded as 4.92 m/s, and 4.48 kWh/m2/day, respectively. The annual wind speed was recorded as 4.92 m/s and the maximum wind speed as 29.70 m/s.
As mentioned in Section 3, the maximum likelihood method [22] is used to estimate the Weibull distribution parameters k and c, as shown in 
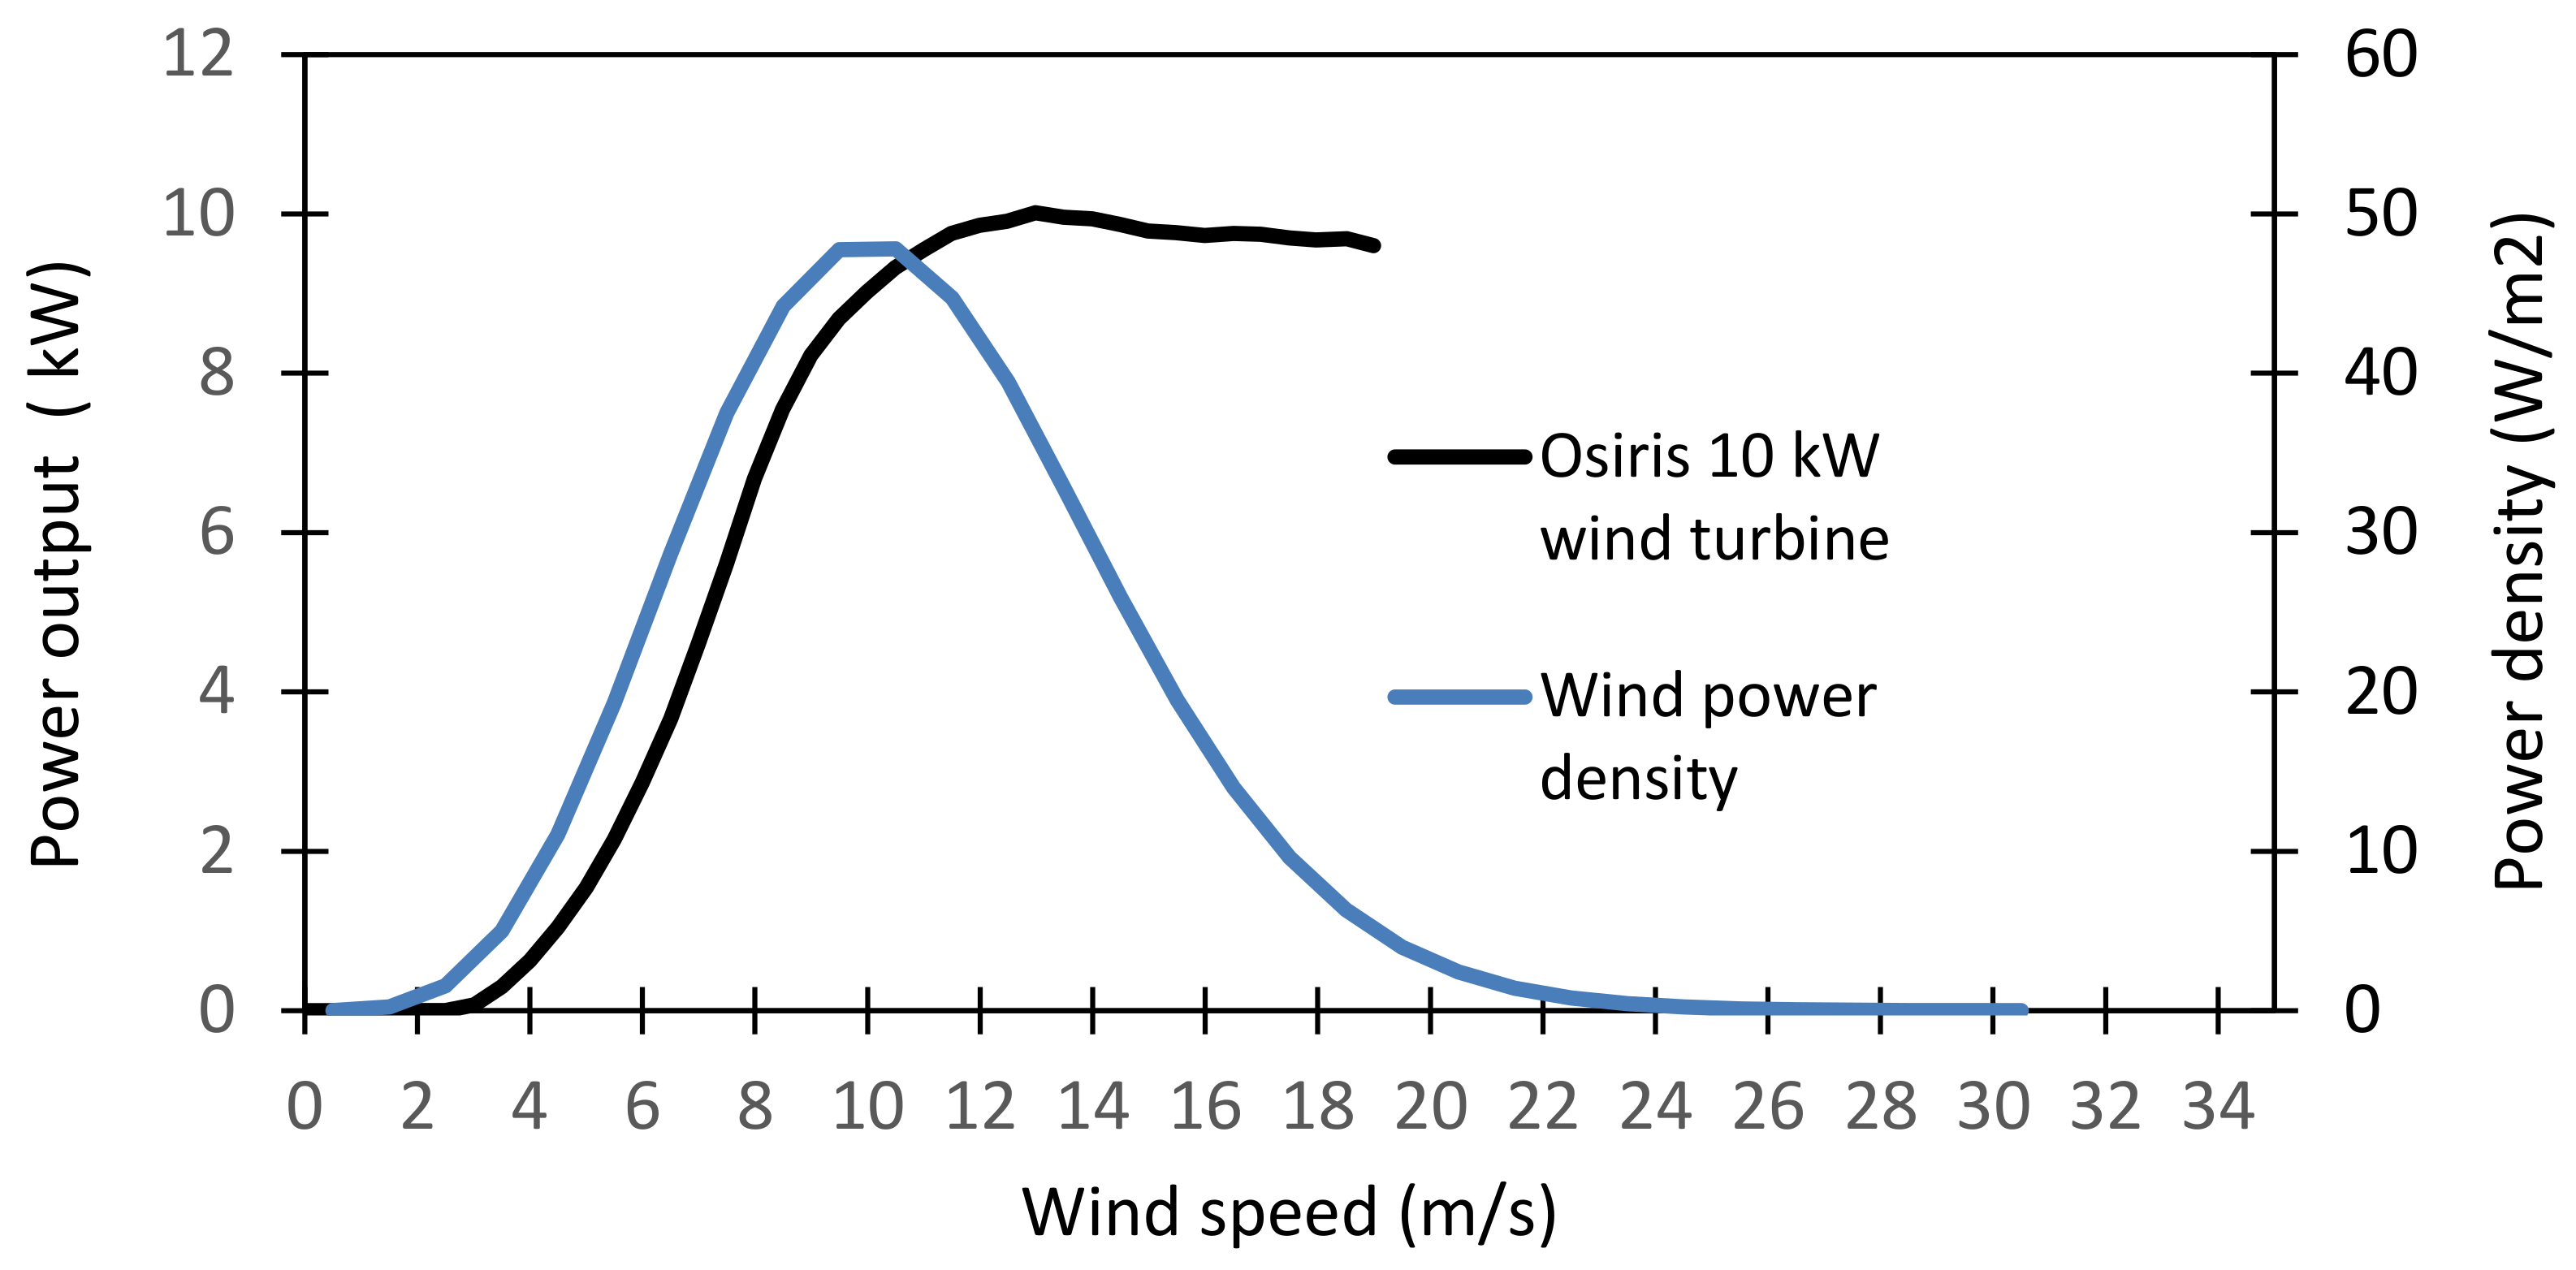
Figure 7. Additionally, the power curve of the Osiris 10 kW wind turbine is given in Figure 8. The wind turbine rated speed is 12.50 m/s. The cut-in and cut-out wind speeds are 2.4 m/s and 19 m/s, respectively. The wind power density, measured in watts per square meter, indicates how much energy is available at the site for conversion by a wind turbine.
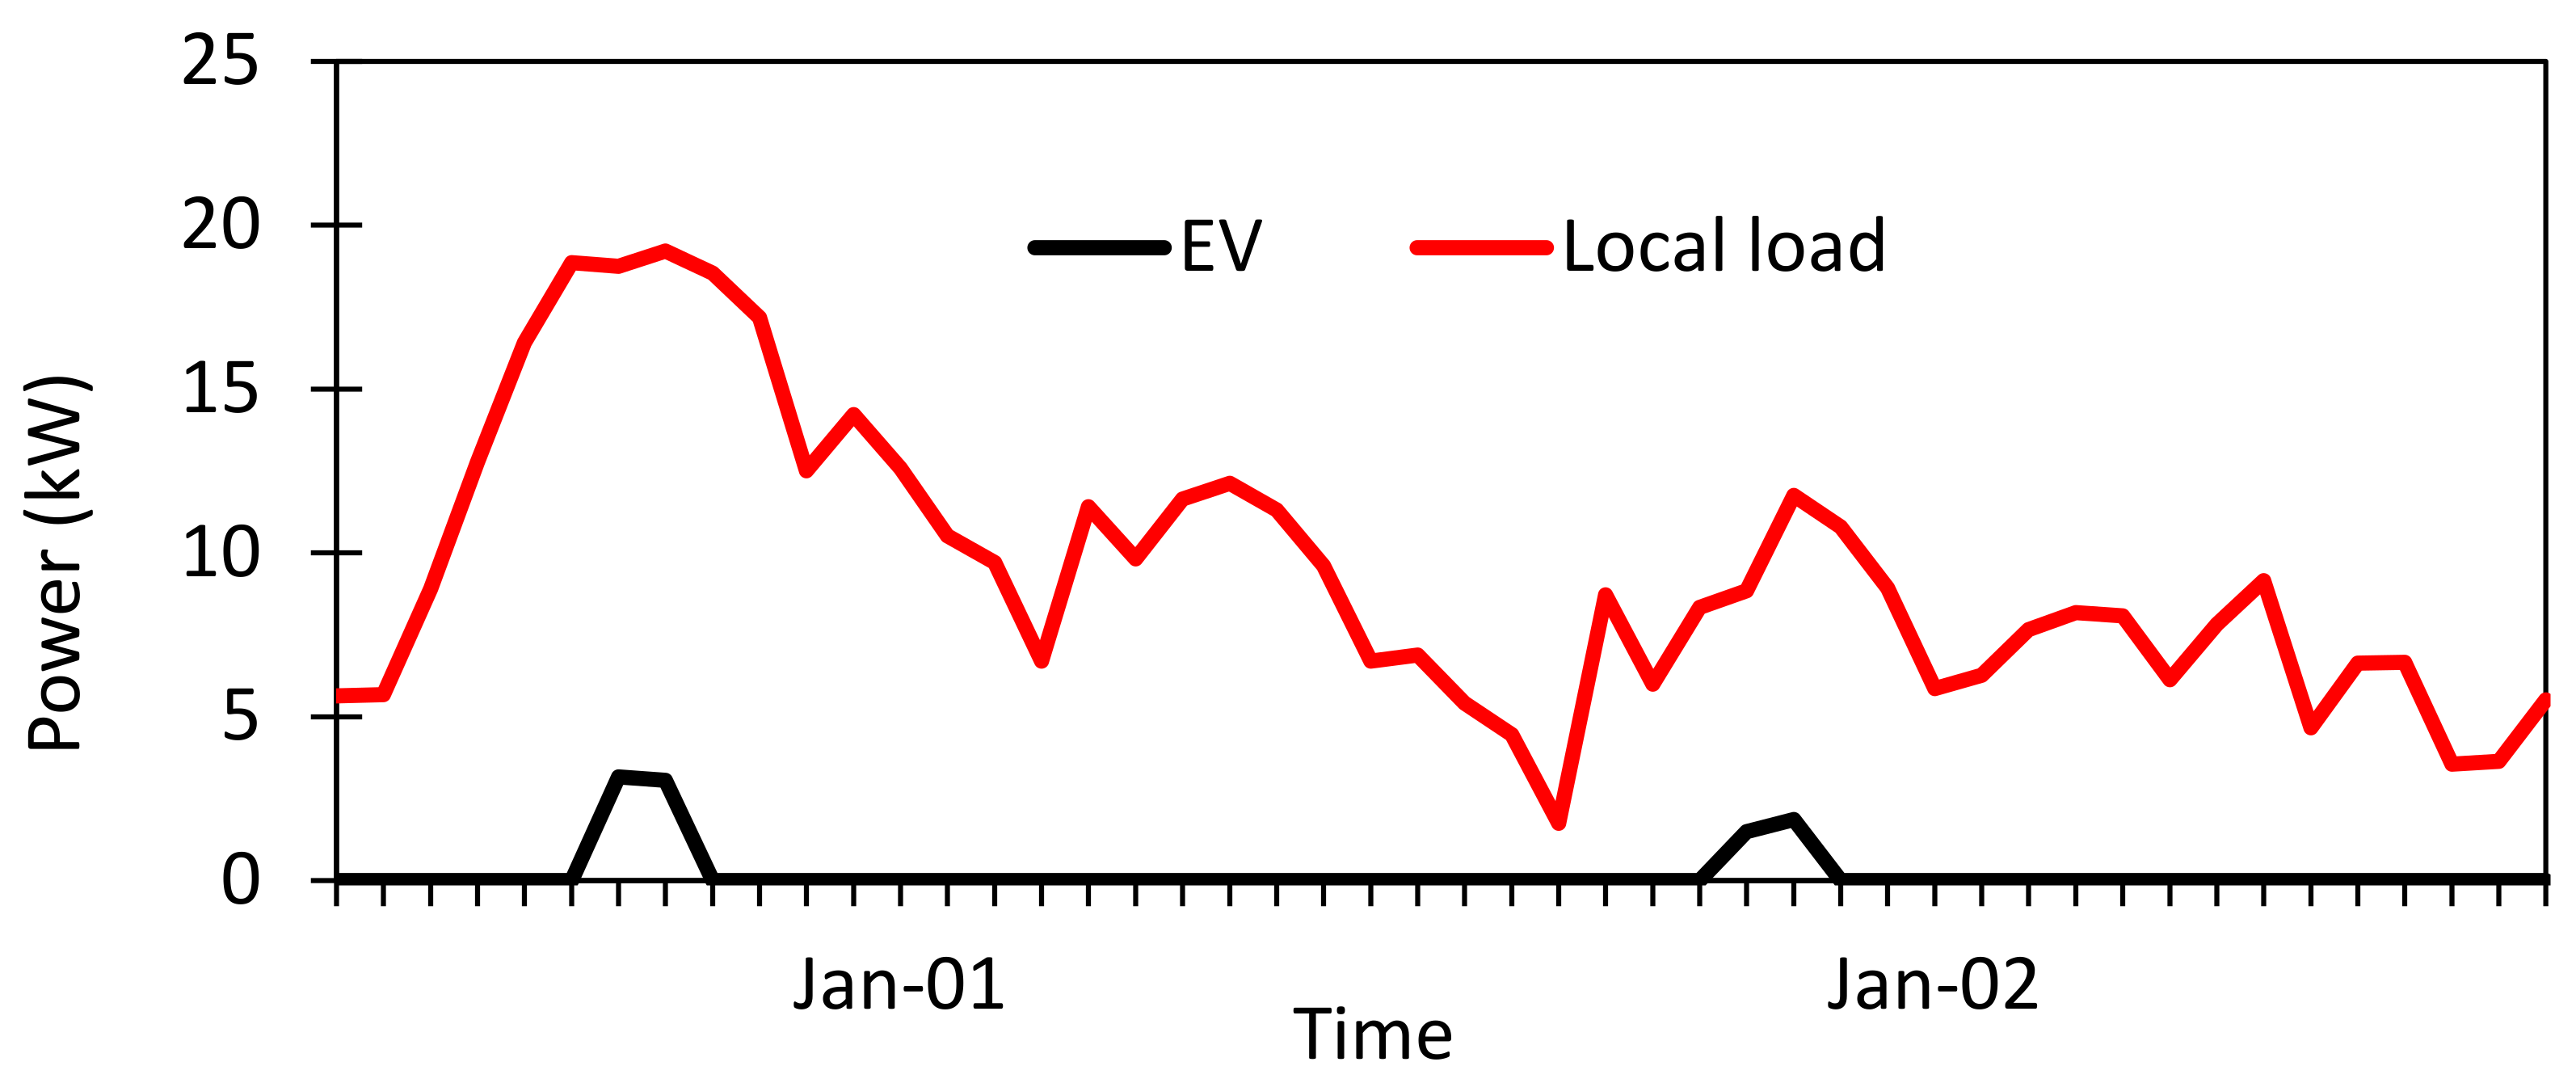
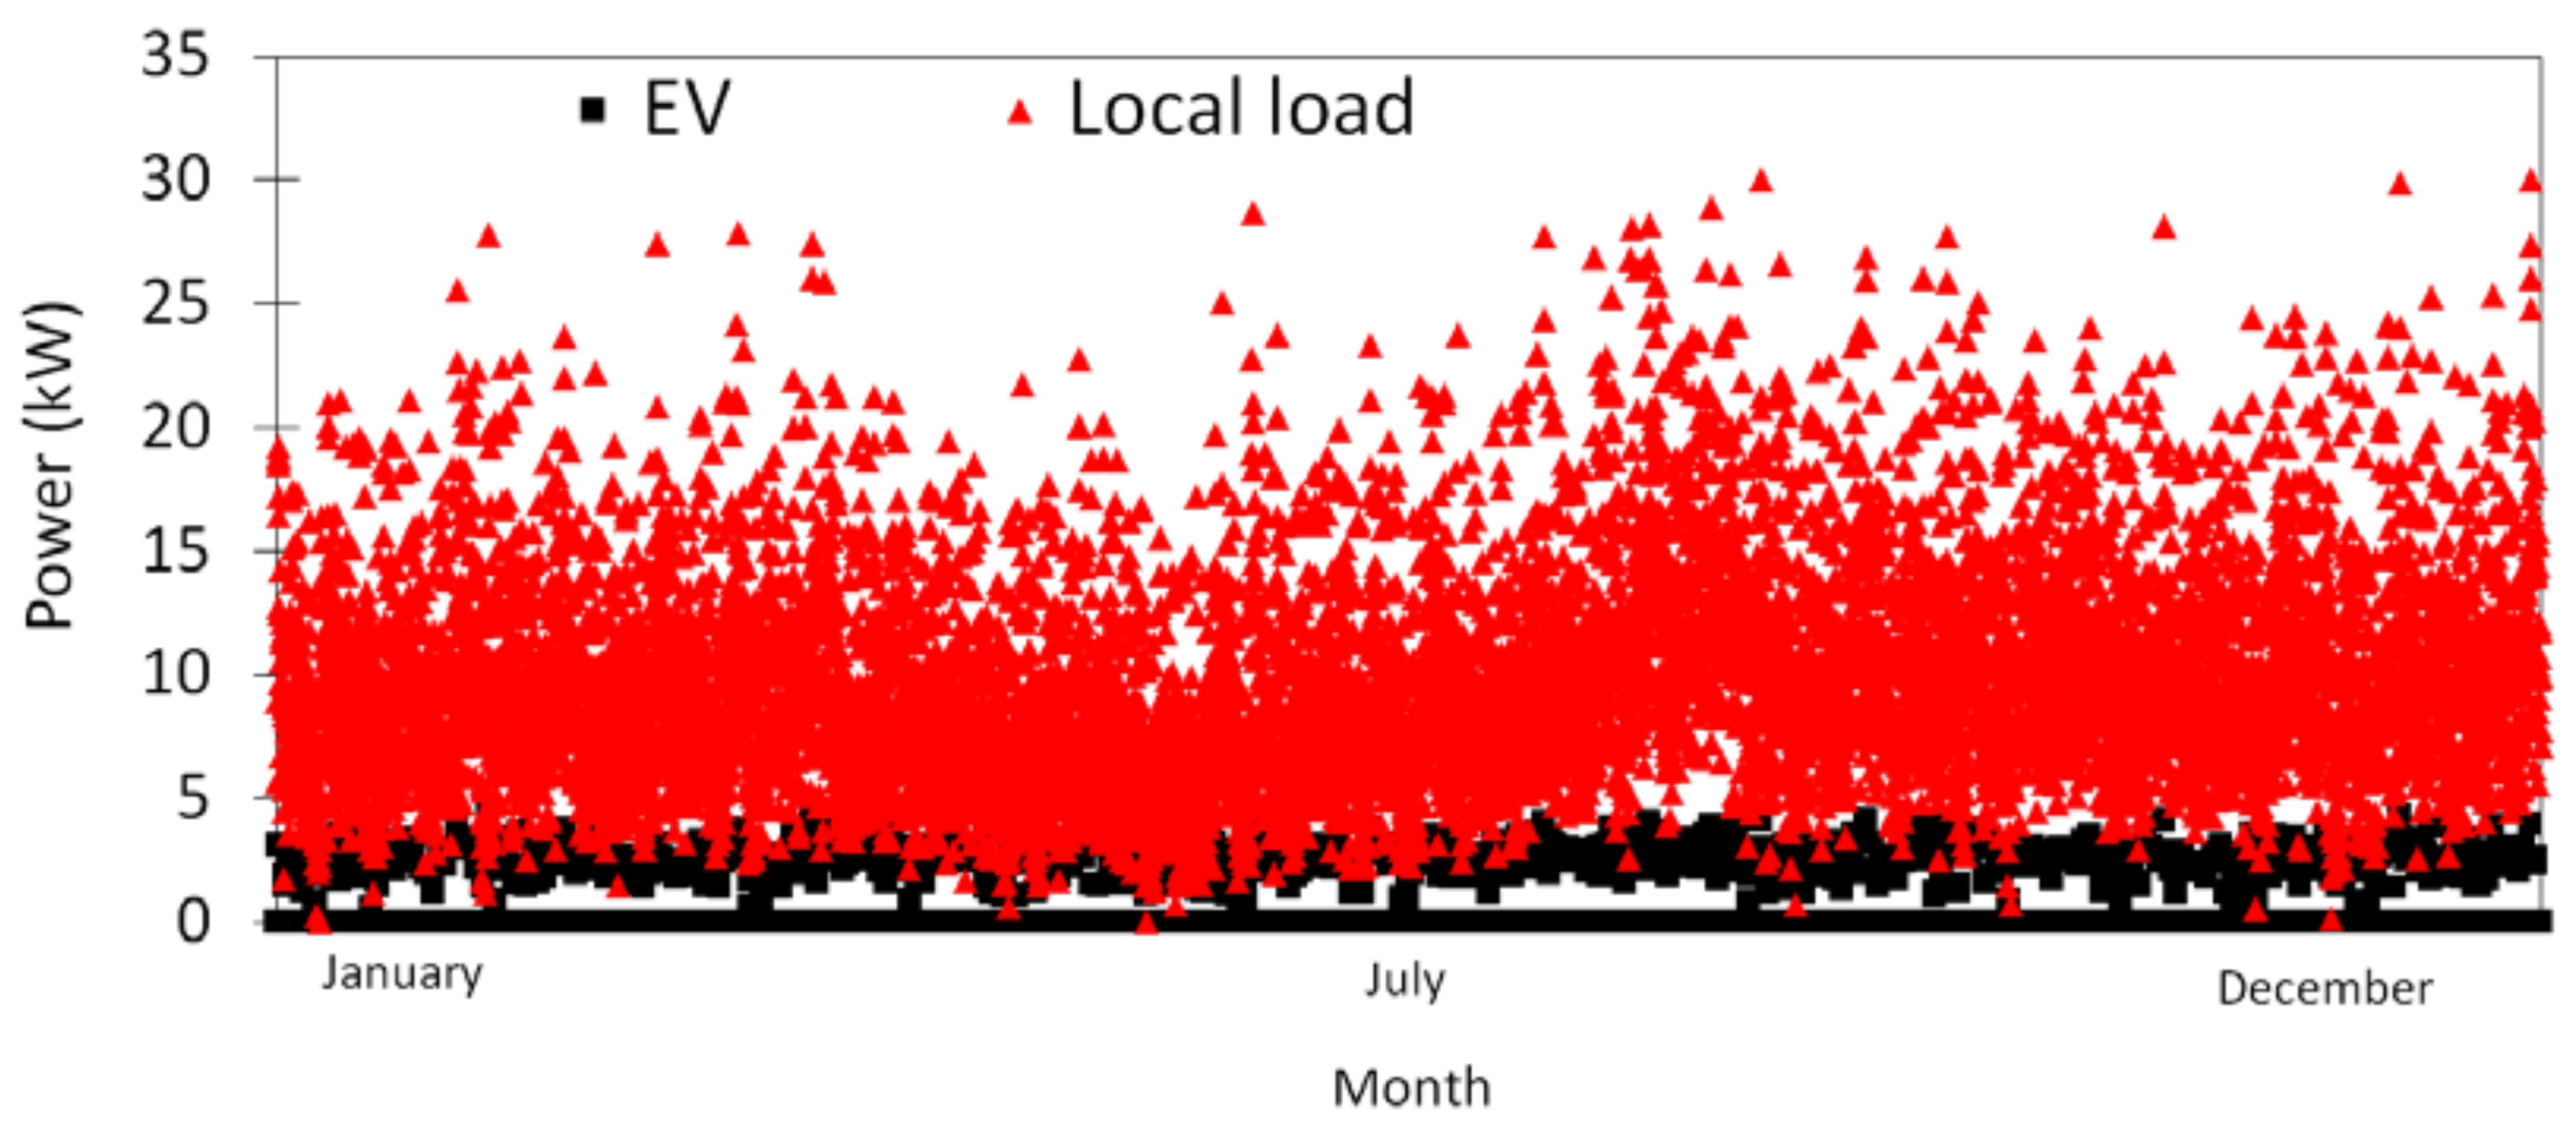
Figure 9 and Figure 10 show the load profile of the proposed site. To get an accurate load profile, the variation of the load was considered to be 20% with a time step of 20% per day. In Figure 10, local loads are presented in red triangles, where load of EVs is presented in black squares. The average energy and power demand was 234 kWh/d and 9.8 kW, respectively. The peak load at the site was estimated as 30.4 kW. The highest energy demand occurred in August. In addition, the load varied throughout the day, for instance from 5 kW to 16 kW on January 1st, with the highest peak of about 16 kW at 8:00.
The design detail for each component in the proposed system is provided in Table 3, Table 4, Table 5 and Table 6.
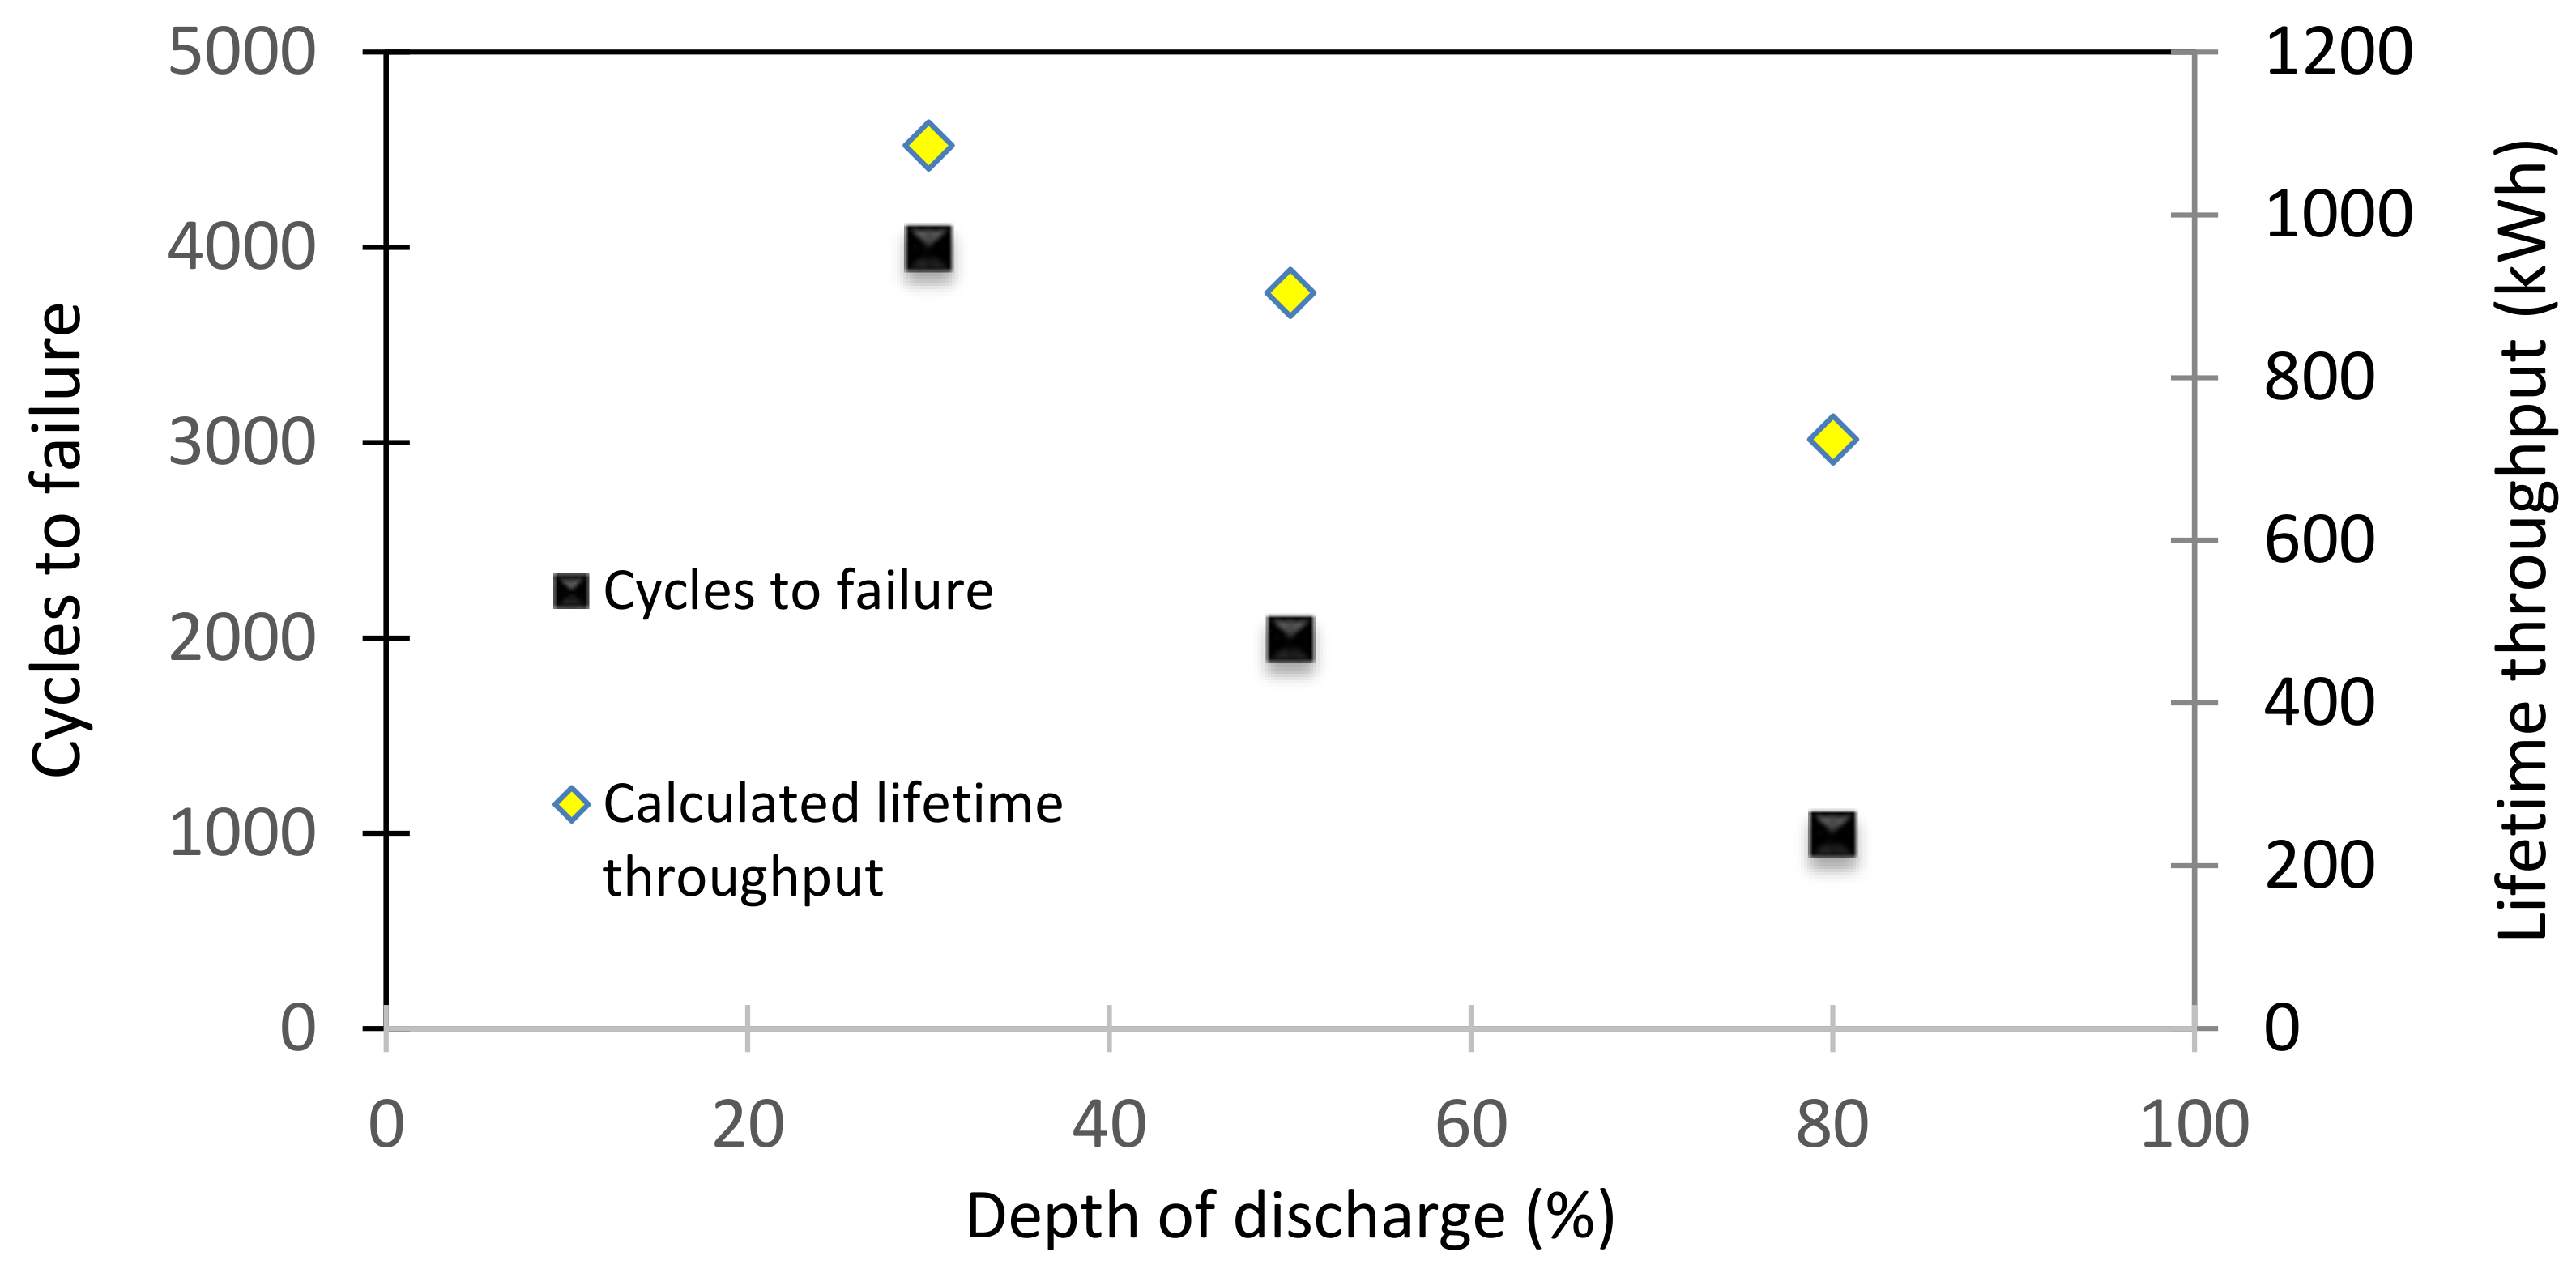
It is worth noting that the lifetime throughput of the single lithium-ion battery was estimated as 904.4 kWh and calculated according to Table 7. Figure 11 shows the lifetime curve of the lithium-ion battery. The lifetime curve reveals the number of cycles to failure versus the depth of the cycles. The lifetime throughput (Qlifetime,i) can be calculated from the lifetime curve of the battery as
Q l i f e t i m e , i = f i × d i × q max × V n o m 1000
where fi is the number of cycles to failure, di is the depth of discharge (%), qmax is the maximum capacity of the battery (Ah), and Vnom is the nominal voltage of the battery (v).
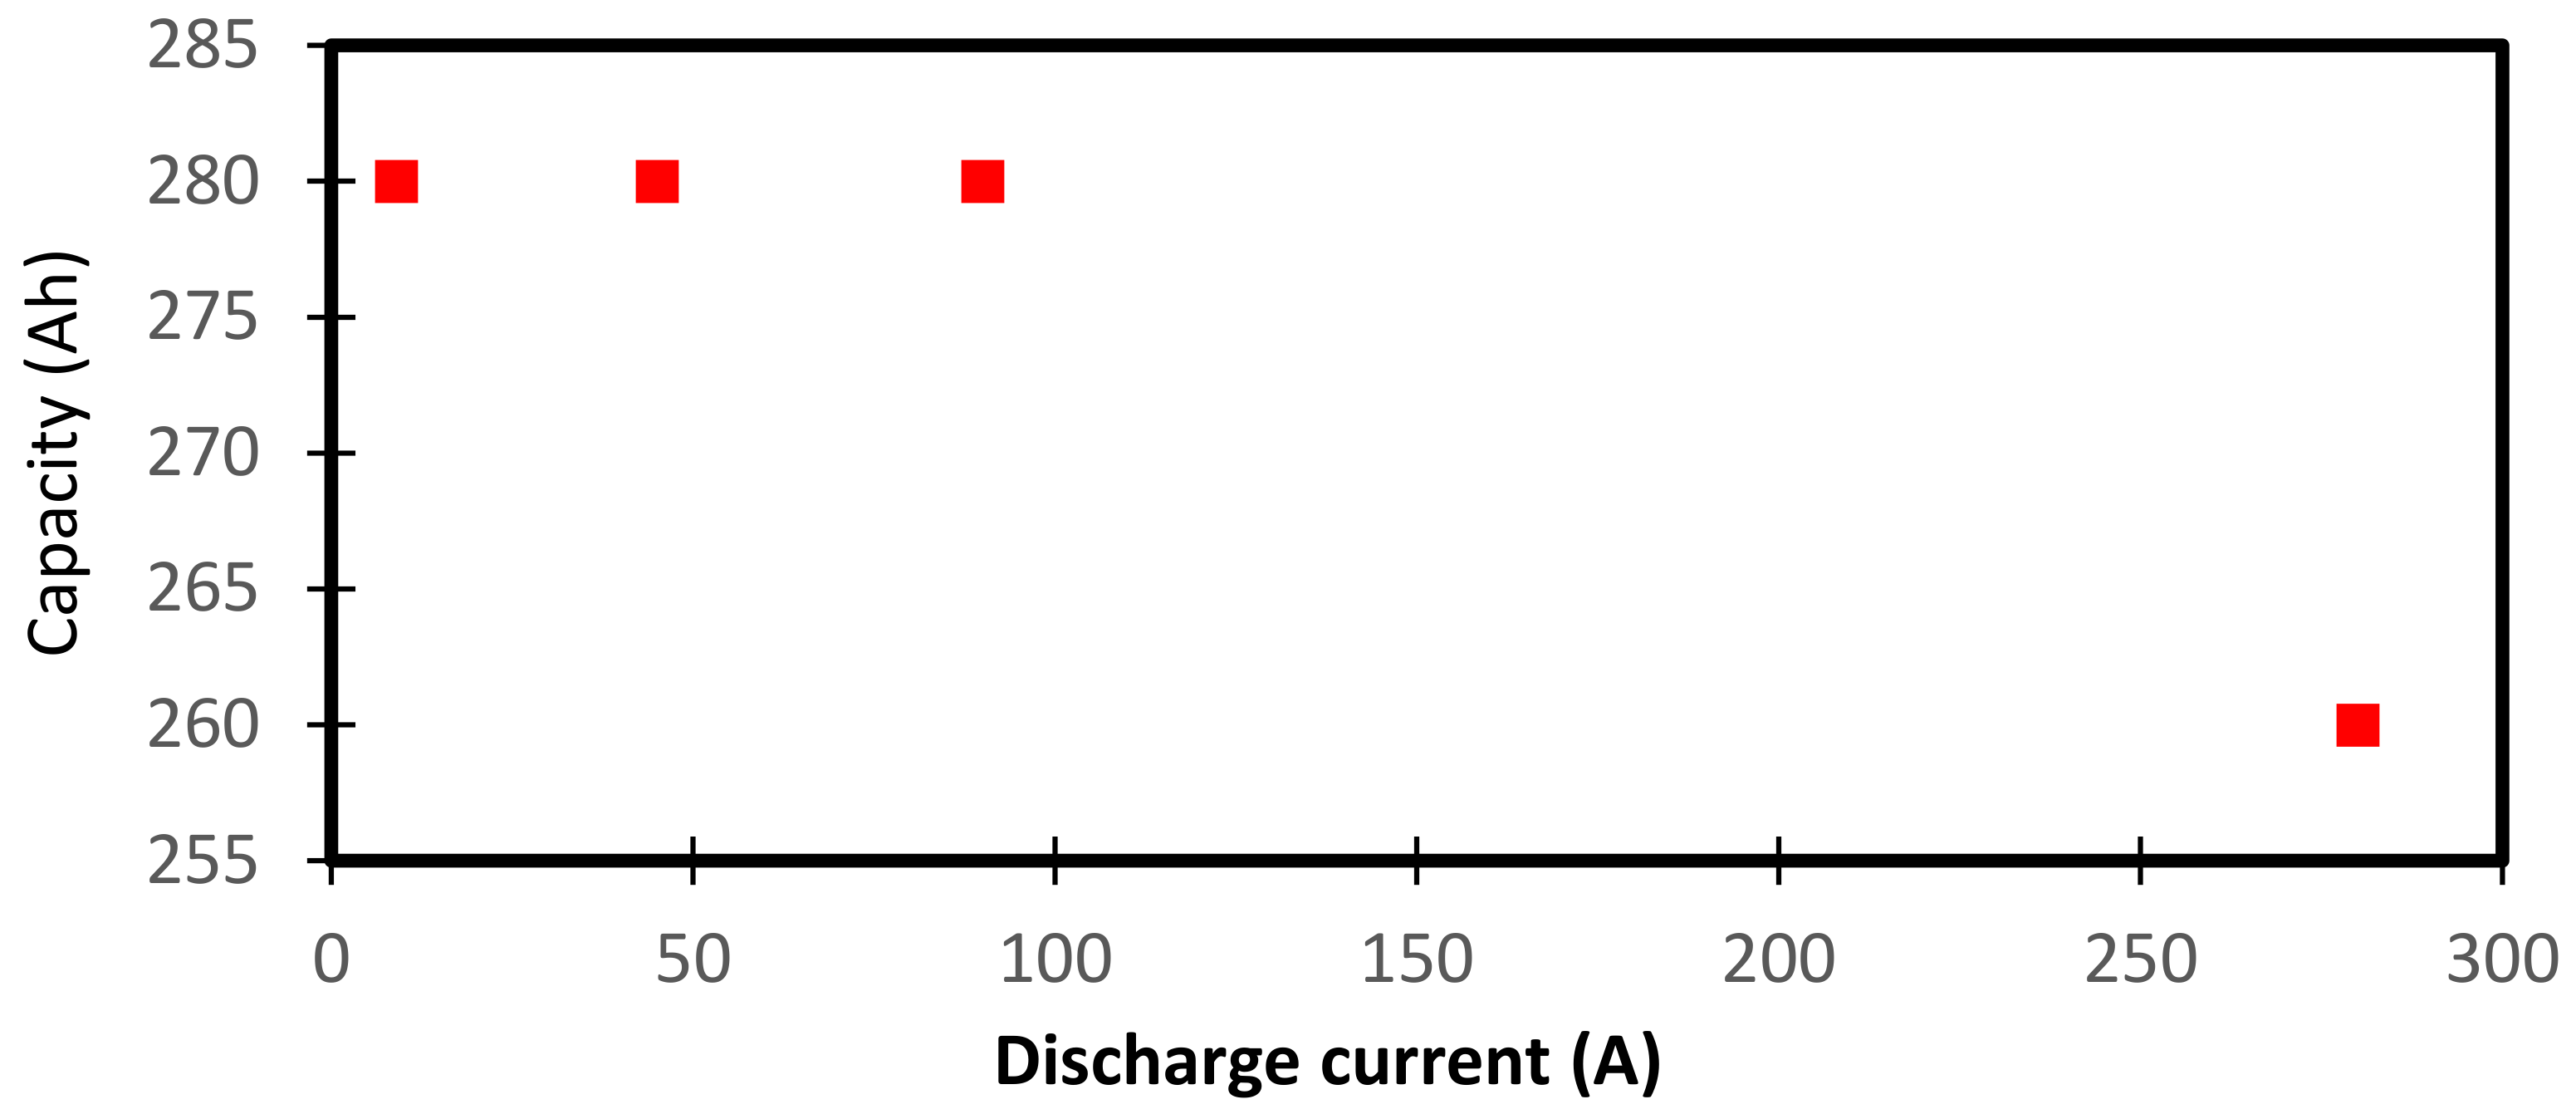
Figure 12 shows the capacity curve of the lithium-ion battery. Based on the kinetic battery model and the capacity curve of the batteries, we can calculate the maximum capacity, capacity ratio, and rate constant of the capacity, as reported in Table 6.
Based on the above meteorological data, component costs and load profile, several case studies were carried out to acquire the optimum configuration of the proposed hybrid renewable energy system. Table 8 and Table 9 show the optimum design of the proposed system according to a sensitivity analysis conducted on WTs and the ESS, respectively. The optimal system considering 368 batteries with 30 kW of inverter power had a total power of 130 kW with a 24% WT fraction and a 76% PV fraction. This combination resulted in the lowest net present cost (NPC) of $1,182,040. It is worth noting that the optimal case without considering EVs is 30 kW of WT, 130 kW of PV system, and 35 kW of inverter with 276 batteries, with a total NPC of $1,159,326. According to wind speed and solar radiation data at the site, capacity factors for the WT (25%) and PV systems (16%) were estimated. The WT capacity factor of 25% demonstrates the ratio of WT actual power output over 8760 h (one year of operation), to potential output power if operated at full capacity during the year.
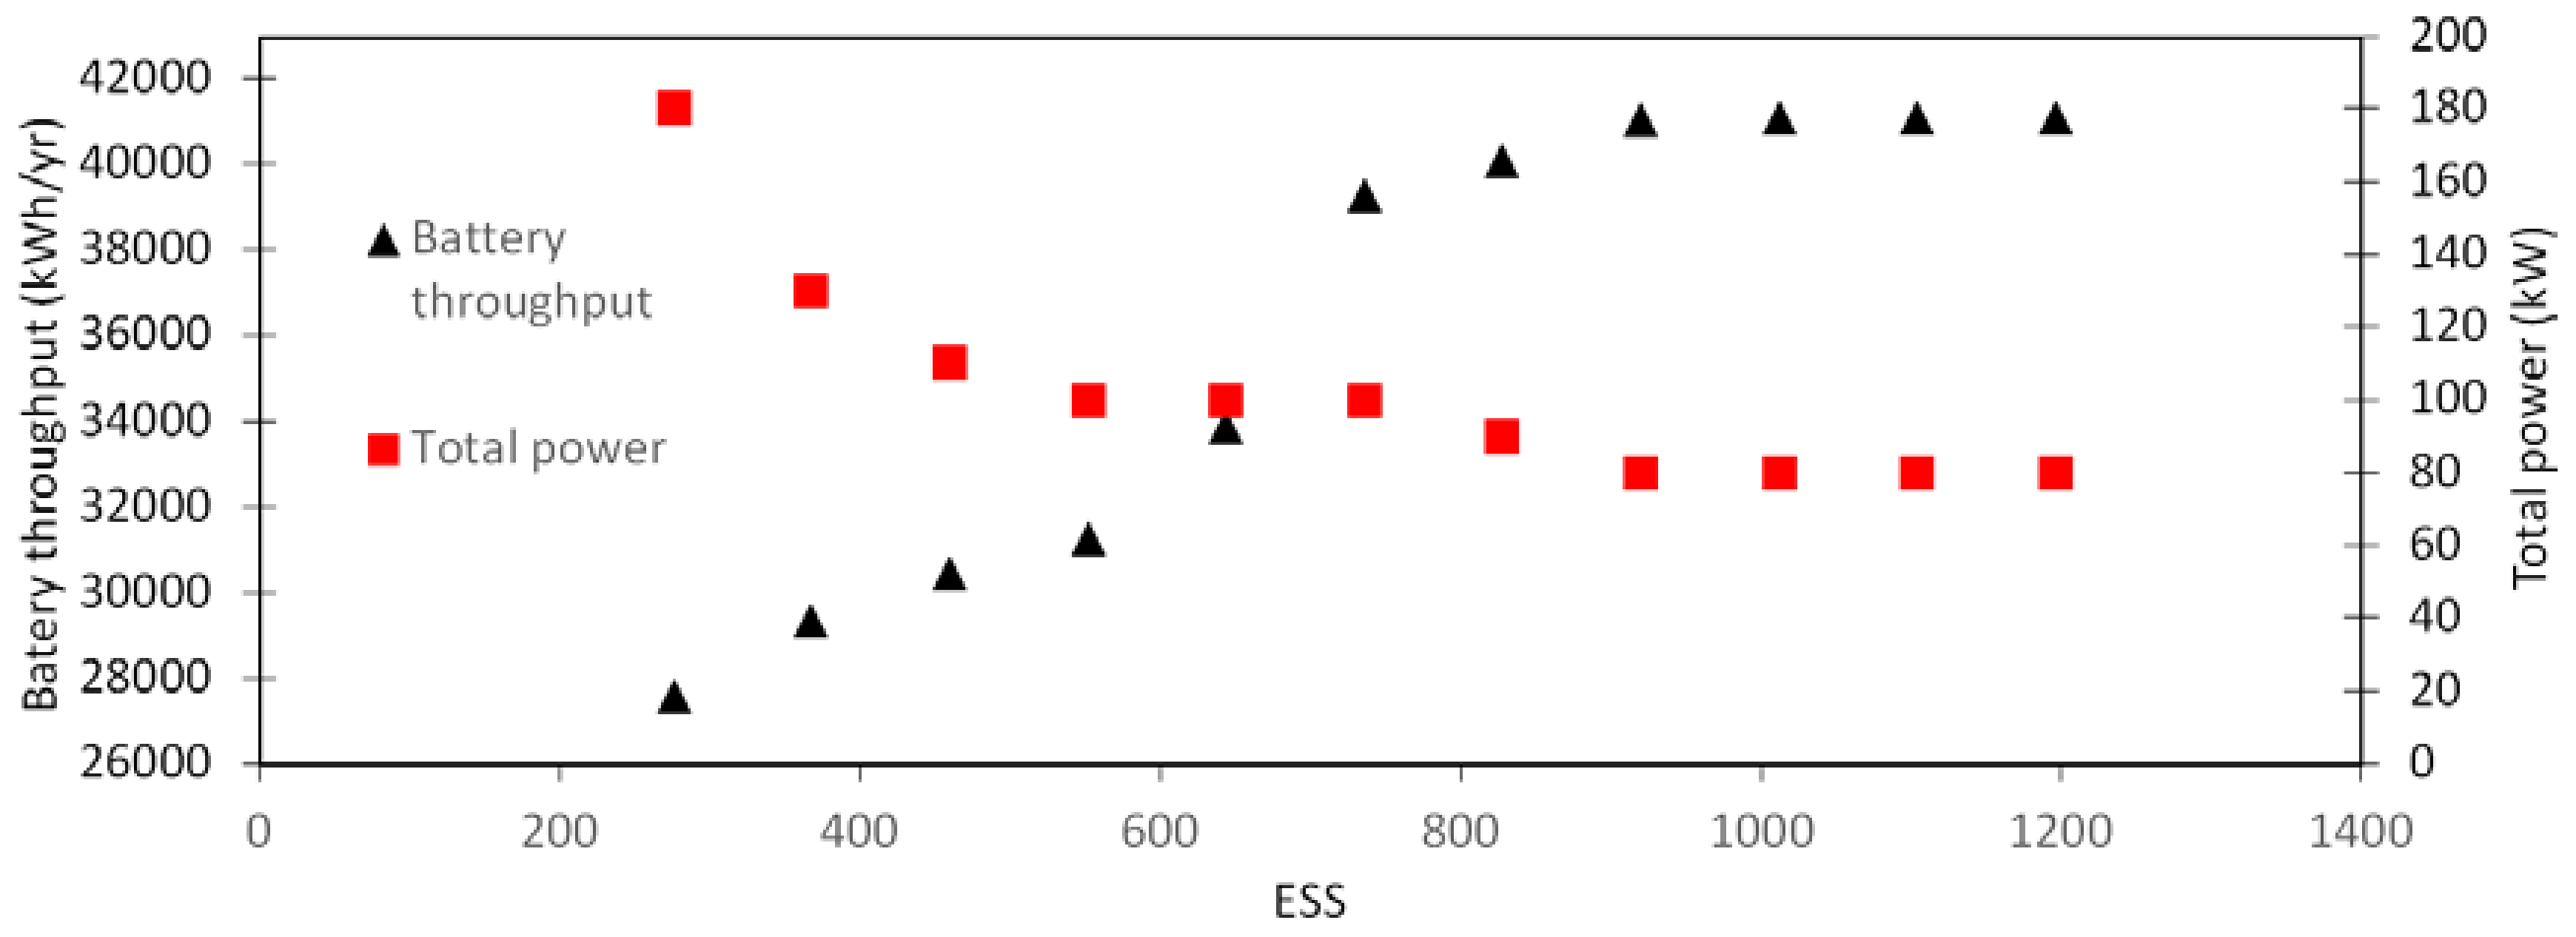
Figure 13 shows the optimum combination of PV and wind systems with increasing battery numbers, to obtain the minimum and maximum number of lithium-ion batteries.
We can see from Figure 13 that the total power can be dramatically reduced for systems with a large number of batteries. However, further decreases in wind turbines and PV panels were not observed (70 kW of PV system and 10 kW of WT system) as the number of batteries increased from 920 to 1196, as the ESS is not a power-generating component, and the minimum necessary renewable energy system (i.e., PV and wind system) should be implemented to match the load. Hence, the total number of batteries should range between 276 and 920. Explicitly, the minimum number of batteries was considered to be 92. However, this cannot be economically matched with the load. On the other hand, having more than 920 batteries had no effect on the renewable hybrid system combination because the load was already matched and no additional changes were observed in the system configurations. Therefore, the ESS must range between 276 and 920.
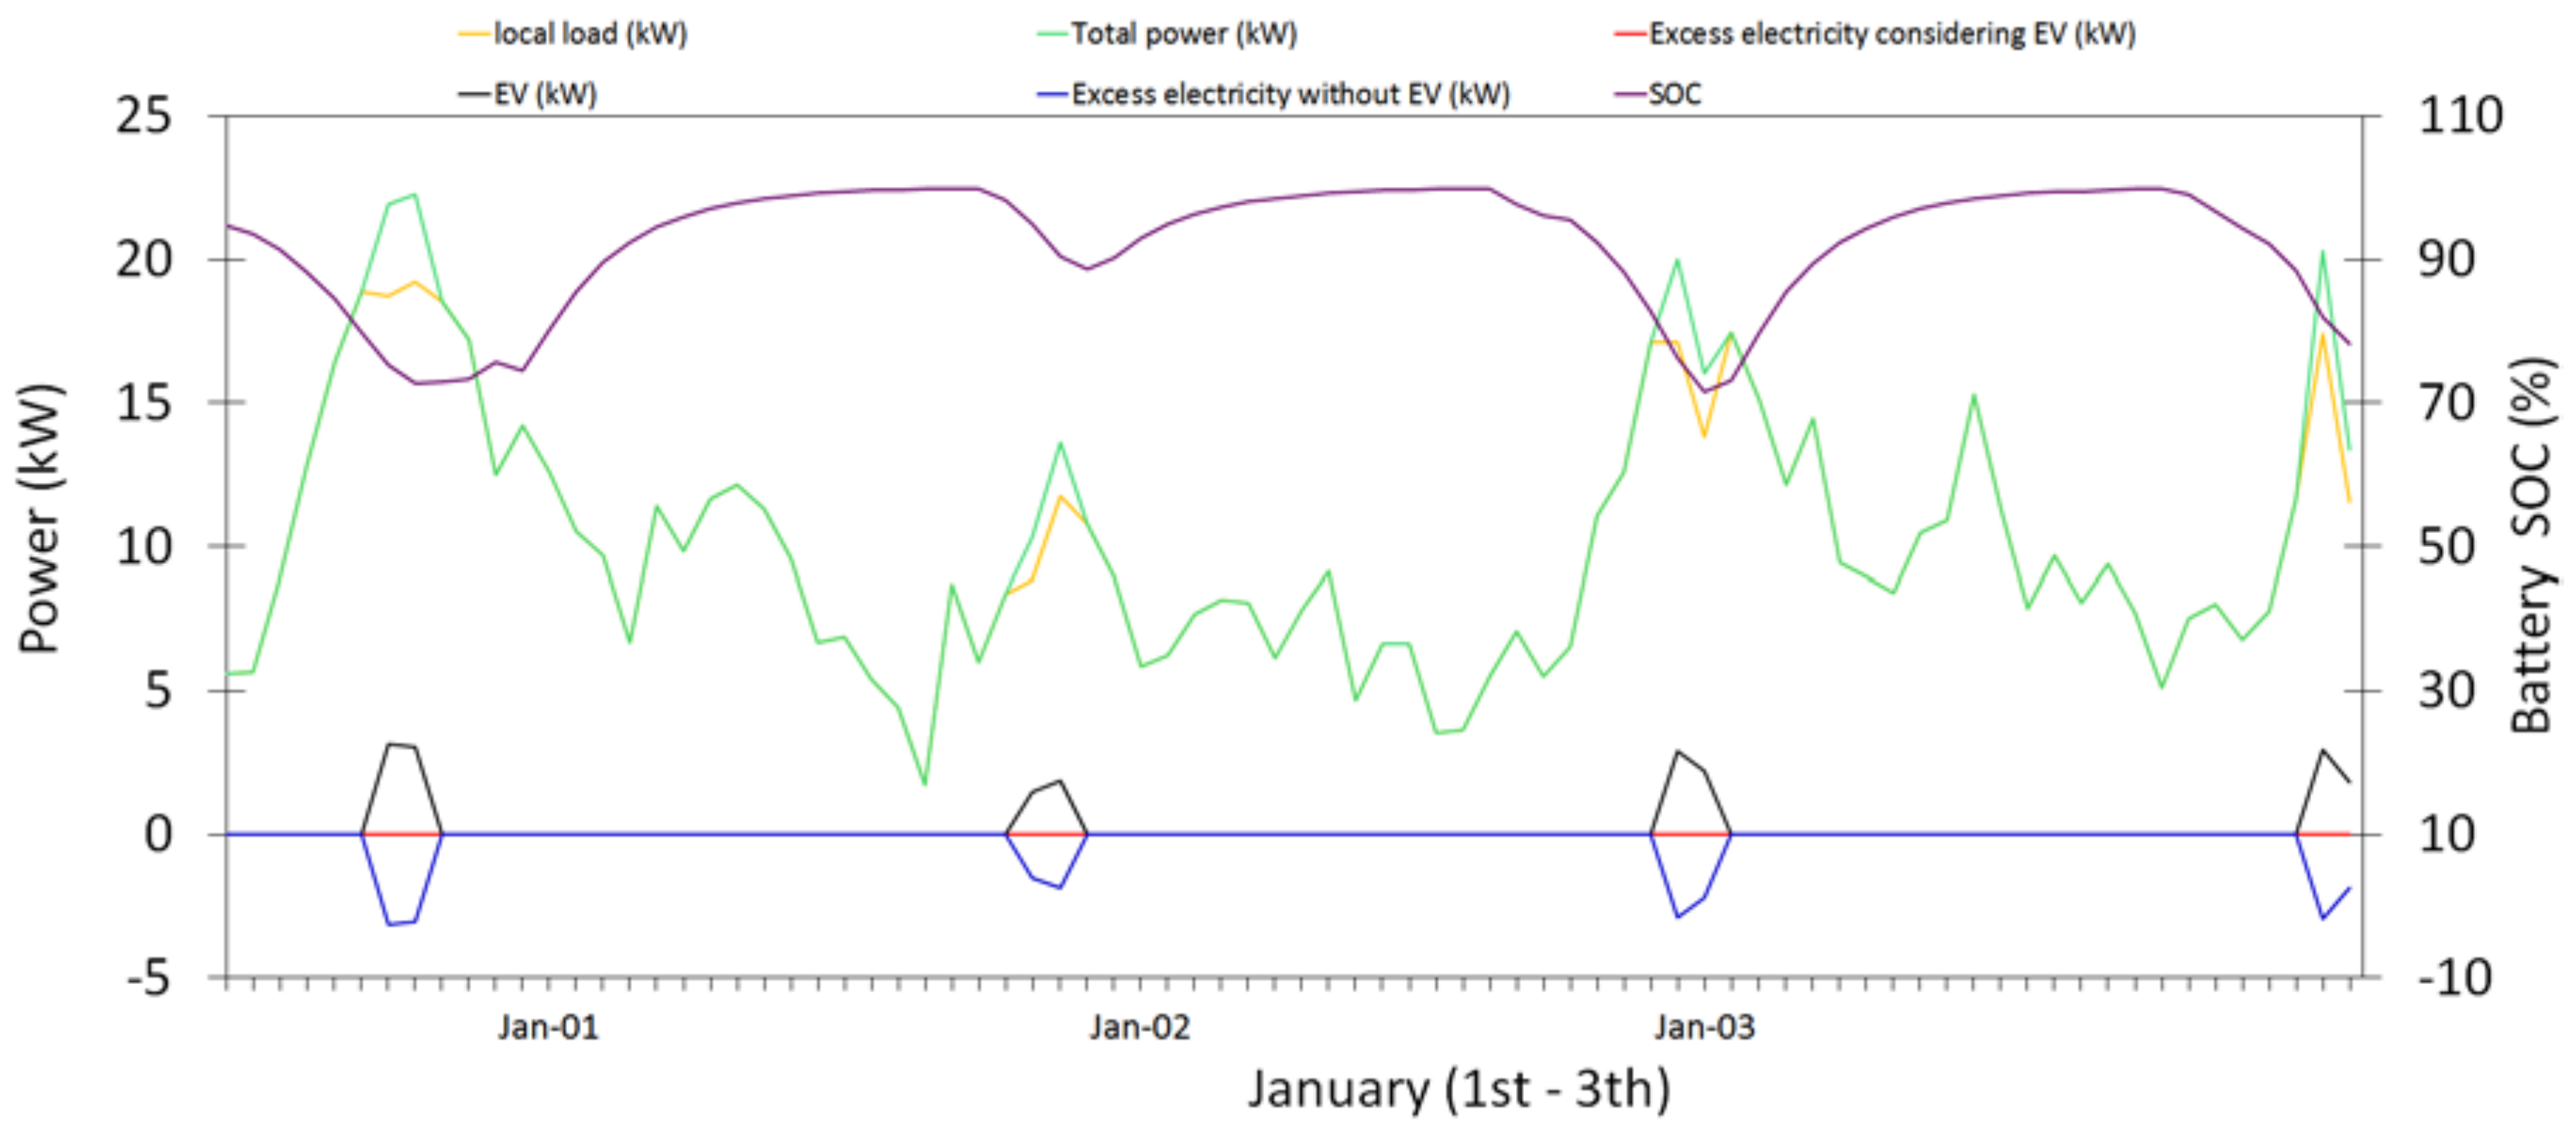
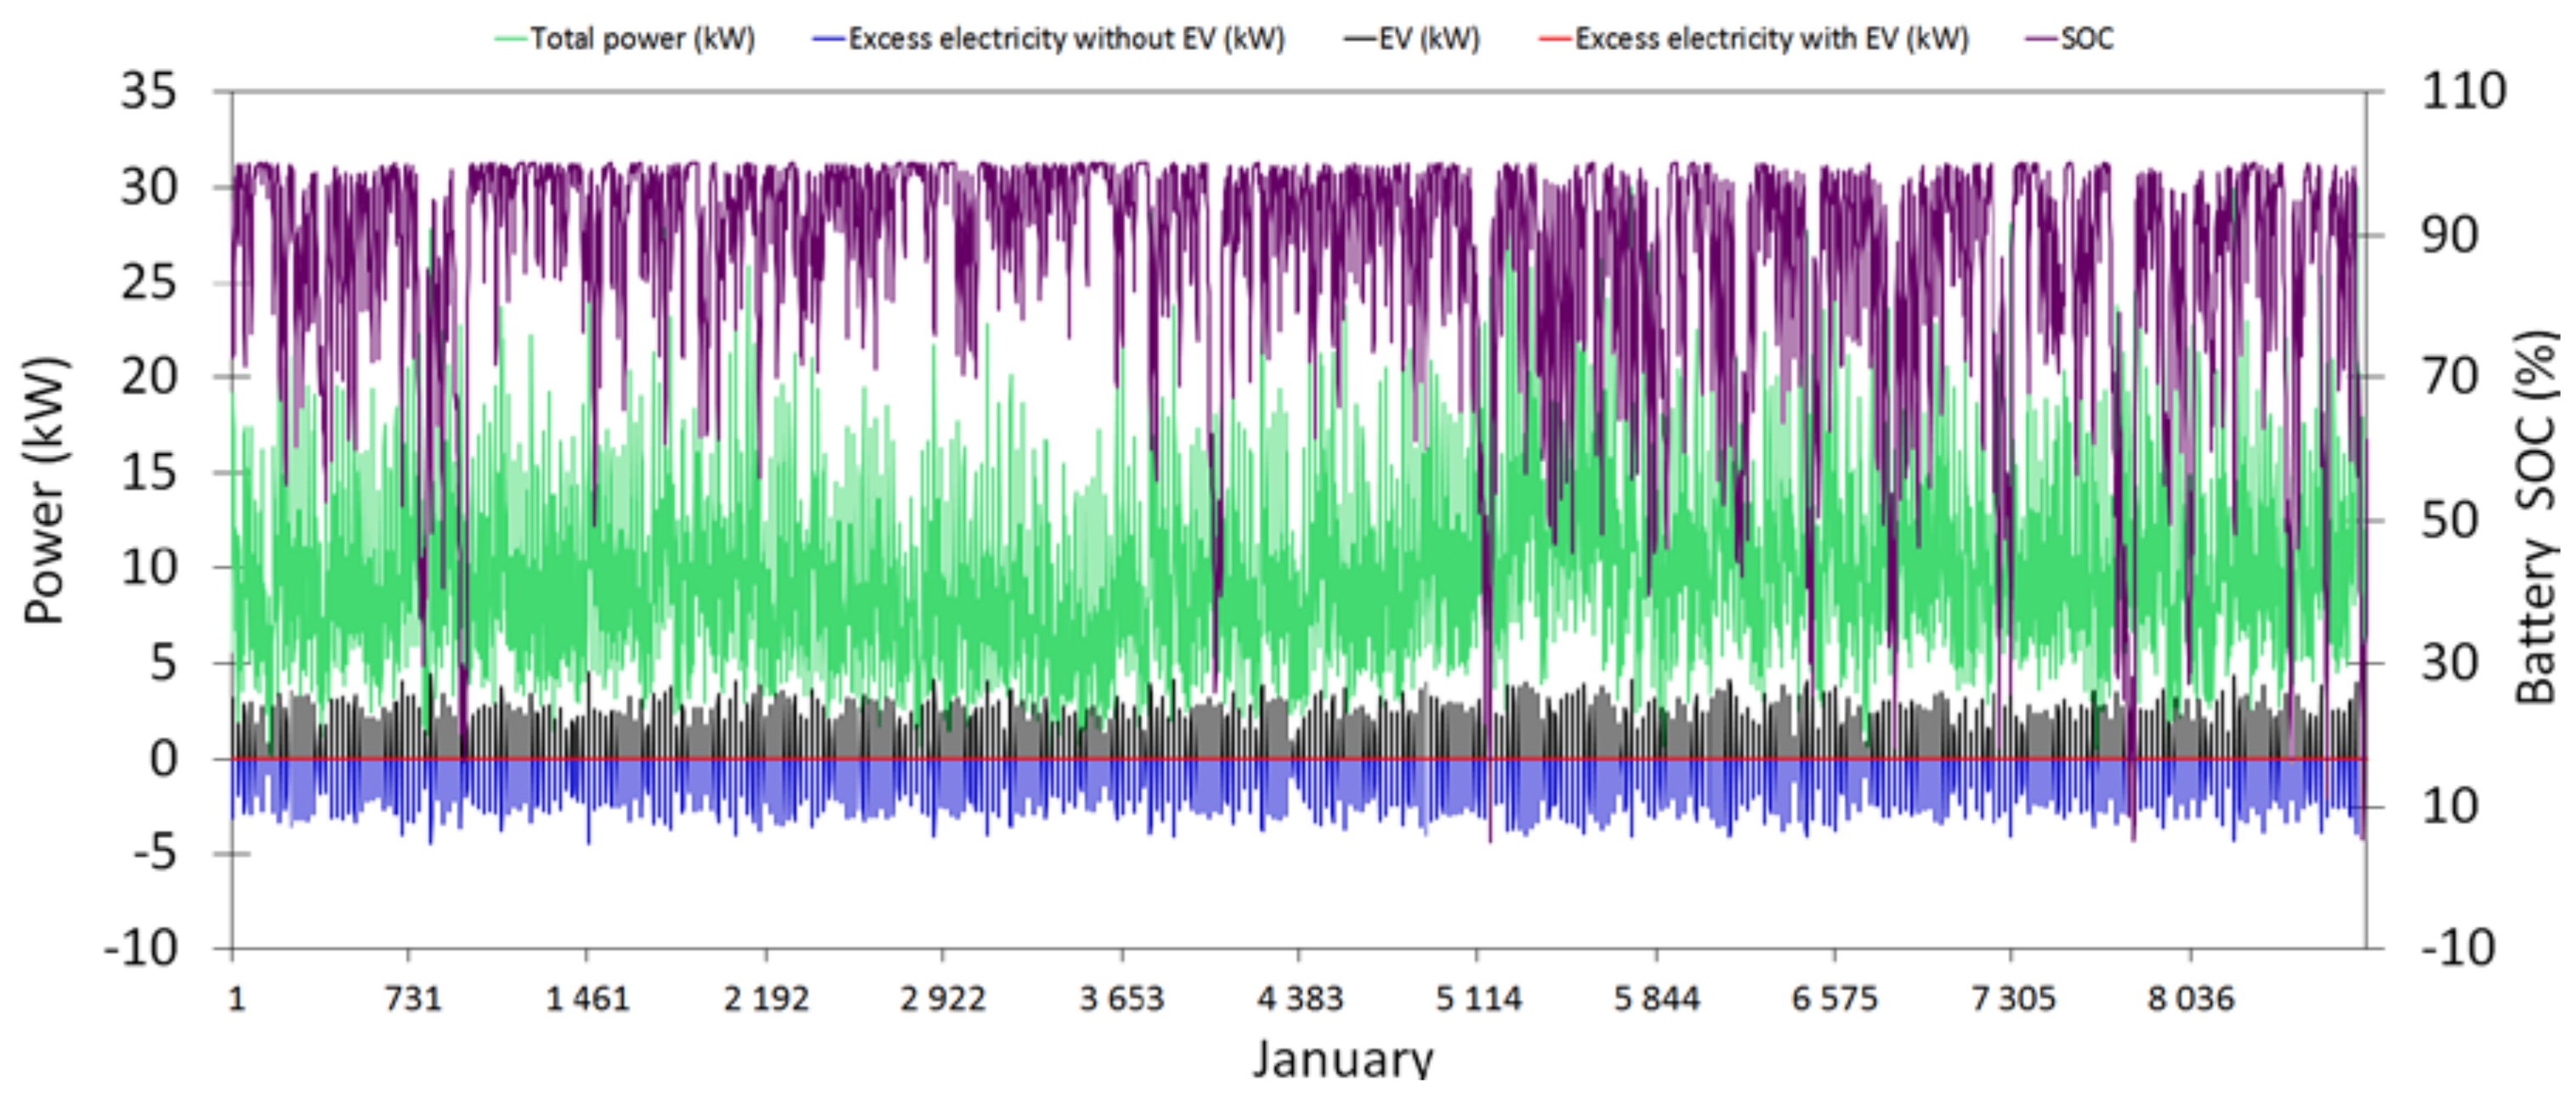
The relationship between SOC and excess electricity thus far is detailed in Figure 14 and Figure 15. The graph indicates that the ESS absorbs the energy once the PV and wind energy output power exceeds the load demand, and discharges the energy as the load exceeds the output power. As can be seen, once the load demand is satisfied, excess electricity was used to charge the EVs. The SOC of the batteries illustrates the amount of energy stored in the ESS as a percentage of the capacity. In the case of sufficient excess electricity to fully charge the battery, the energy will be used for charging EV batteries. It is necessary to point out that the operating reserve is considered to be 10% of the load, 25% of PV output, and 50% of WT output in this study. In addition, the maximum annual capacity shortage was assumed to be 0%. However, we observed depletion of the ESS, which occasionally occurred during the one-year simulation period. This issue is termed the unmet electricity load, 42.5 kWh (capacity shortage of 0.1%) for the system. In summary, excess electricity in the renewable energy system is used economically to charge the EV batteries. In this regard, the excess electricity (red line) of the entire system considering the EVs is zero.

5. Conclusions

EVs are likely to play an essential role in the Korean auto industry. It is estimated that EV integration in Jeju Island will increase by 100% by 2030. In this study, we investigated the use of renewable energy technologies in an EV charging station for a smart home in off-grid small communities. Five EVs were considered in this study. The characteristics of the EVs were taken from the Tuktuk company as well as the IEC 61851-1 standard. Different configurations were considered in the proposed ESS system. We determined that the optimal case can be achieved when 368 batteries with 30 kW (inverter) and a total power of 130 kW with a 24% WT fraction and 76% PV system fraction. This combination had the lowest NPC of $1,182,040. A single configuration was optimally tailored for the proposed charging station in terms of the total NPC to achieve a unique solution. However, further effort is required to investigate the details of the optimum design of a renewable energy charging station to provide practical information for designers in real installations. In other words, there are several aspects that must be taken into account when designing a renewable energy charging station for EVs. Here, we considered WT performance, optimal number of batteries, and range of batteries. Moreover, we determined the optimal ratio of solar and wind capacity to minimize the month-to-month fluctuation in energy availability using resource data. We considered the load profile to follow the availability of the renewable energy system, while still meeting the daily demand. Meanwhile, we explored the optimal size of the renewable energy system to the total energy demand during periods when wind and solar resources are at their maximum values. The key point of this study is the efficient use of excess electricity from the hybrid renewable energy by incorporating a system to charge the batteries of the EVs.

Author Contributions

A.A.: Original draft preparation, S.S.: Review and editing, J.S.M.: Fund acquisition, S.K.: Resources, J.H.L.: Supervision.

Acknowledgments

This work was supported by the Korea Institute of Energy Technology Evaluation and Planning (KETEP) and the Ministry of Trade, Industry & Energy (MOTIE) of the Republic of Korea (No. 20174030201670) and by the Ministry of Education (NRF-2016R1A6A1A03013567).

Conflicts of Interest

The authors declare no conflicts of interest.

References

  1. Hardmana, S.; Chandanb, A.; Tala, G.; Turrentine, T. The effectiveness of financial purchase incentives for battery electric vehicles—A review of the evidence. Renew. Sustain. Energy Rev. 2017, 80, 1100–1111. [Google Scholar] [CrossRef]
  2. Tarroja, B.; Eichman, J.D.; Zhang, L.; Brown, T.M.; Samuelsen, S. The effectiveness of plug-in hybrid electric vehicles and renewable power in support of holistic environmental goals: Part 2—Design and operation implications for load-balancing resources on the electric grid. J. Power Sources 2015, 278, 782–793. [Google Scholar] [CrossRef]
  3. Ajanovic, A.; Haas, R. Driving with the sun: Why environmentally benign electric vehicles must plug in at renewables. Sol. Energy 2015, 121, 169–180. [Google Scholar] [CrossRef]
  4. Mesarić, P.; Krajcar, S. Home Demand Side Management Integrated with Electric Vehicles and Renewable Energy Sources. Energy Build. 2015, 108, 1–9. [Google Scholar] [CrossRef]
  5. Fattori, F.; Anglani, N.; Muliere, G. Combining photovoltaic energy with electric vehicles, smart charging and vehicle-to-grid. Sol. Energy 2014, 110, 438–451. [Google Scholar] [CrossRef]
  6. Schuster, S.F.; Brand, M.J.; Berg, P.; Gleissenberger, M.; Jossen, A. Lithium-ion cell-to-cell variation during battery electric vehicle operation. J. Power Sour. 2015, 297, 242–251. [Google Scholar] [CrossRef]
  7. Bauer, S.; Suchaneck, A.; León, F.P. Thermal and energy battery management optimization in electric vehicles using Pontryagin's maximum principle. J. Power Sour. 2014, 246, 808–818. [Google Scholar] [CrossRef]
  8. Zahabi, S.A.H.; Miranda-Moreno, L.; Barla, Ph.; Vincent, B. Fuel economy of hybrid-electric versus conventional gasoline vehicles in real-world conditions: A case study of cold cities in Quebec, Canada. Transp. Res. Part D Transp. Environ. 2014, 32, 184–192. [Google Scholar] [CrossRef]
  9. Denholm, P.; Kuss, M.; Margolis, R.M. Co-benefits of large scale plug-in hybrid electric vehicle and solar PV deployment. J. Power Sources 2013, 236, 350–356. [Google Scholar] [CrossRef]
  10. Wang, Z.; Wang, L.; Dounis, A.I.; Yang, R. Integration of plug-in hybrid electric vehicles into energy and comfort management for smart building. Energy Build. 2012, 47, 260–266. [Google Scholar] [CrossRef]
  11. Atia, R.; Yamada, N. More accurate sizing of renewable energy sources under high levels of electric vehicle integration. Renew. Energy 2015, 81, 918–925. [Google Scholar] [CrossRef]
  12. Tarroja, B.; Eichman, J.D.; Zhang, L.; Brown, T.M.; Samuelsen, S. The effectiveness of plug-in hybrid electric vehicles and renewable power in support of holistic environmental goals: Part 1—Evaluation of aggregate energy and greenhouse gas performance. J. Power Sources 2014, 257, 461–470. [Google Scholar] [CrossRef]
  13. Schuller, A.; Flath, C.M.; Gottwalt, S. Quantifying load flexibility of electric vehicles for renewable energy integration. Appl. Energy 2015, 151, 335–344. [Google Scholar] [CrossRef]
  14. Verma, A.; Raj, R.; Kumar, M.; Ghandehariun, S.; Kumar, A. Assessment of renewable energy technologies for charging electric vehicles in Canada. Energy 2015, 86, 548–559. [Google Scholar] [CrossRef]
  15. Romo, R.; Micheloud, O. Power quality of actual grids with plug-in electric vehicles in presence of renewables and micro-grids. Renew. Sustain. Energy Rev. 2015, 46, 189–200. [Google Scholar] [CrossRef]
  16. Schill, W.; Gerbaulet, C. Power system impacts of electric vehicles in Germany: Charging with coal or renewables? Appl. Energy 2015, 156, 185–196. [Google Scholar] [CrossRef] [Green Version]
  17. Carrión, M.; Zárate-Miñano, R. Operation of renewable-dominated power systems with a significant penetration of plug-in electric vehicles. Energy 2015, 90, 827–835. [Google Scholar] [CrossRef]
  18. Jochem, P.; Babrowski, S.; Fichtner, W. Assessing CO2 emissions of electric vehicles in Germany in 2030. Transp. Res. Part A Policy Pract. 2015, 78, 68–83. [Google Scholar] [CrossRef]
  19. Ahadi, A.; Kang, S.K.; Lee, J.H. A novel approach for optimal combinations of wind, PV, and energy storage system in diesel-free isolated communities. Appl. Energy 2016, 170, 101–115. [Google Scholar] [CrossRef]
  20. Vermaak, H.J.; Kusakana, K. Design of a photovoltaic–wind charging station for small electric Tuk–tuk in DR Congo. Renew. Energy 2014, 67, 40–45. [Google Scholar] [CrossRef]
  21. Ye, B.; Jiang, J.; Miao, L.; Yang, P.; Li, J.; Shen, B. Feasibility study of a solar-powered electric vehicle charging station model. Energies 2015, 8, 13265–13283. [Google Scholar] [CrossRef]
  22. Akdag, S.A.; Dinler, A. A New Method to Estimate Weibull Parameters for Wind Energy Applications. Energy Convers. Manag. 2009, 50, 1761–1766. [Google Scholar] [CrossRef]
  23. Tuktuk Company. Available online: http://www.tuktukfactory.nl/ (accessed on 16 May 2016).
  24. Osiris wind turbine. Available online: http://www.osirisenergy.com/ (accessed on 16 May 2016).
Figure 1. Proposed infrastructure at the study site.
Energies 11 01728 g001
Figure 2. Proposed renewable energy charging station.
Energies 11 01728 g002
Figure 3. Battery model.
Energies 11 01728 g003
Figure 4. Geographical layout of the proposed location, Jung-Ma-Do Island, South Korea (Google Maps, 2015).
Energies 11 01728 g004
Figure 5. Daily radiation and wind speed at the site (1 January).
Energies 11 01728 g005
Figure 6. Monthly average radiation and wind speed at the island.
Energies 11 01728 g006
Figure 7. Weibull distribution probability at the island, (scale factor: 5.53 m/s; shape factor: 1.79 extracted by the maximum likelihood method [22]).
Energies 11 01728 g007
Figure 8. Power–speed characteristic curve of the Osiris 10 kW wind turbine [24].
Energies 11 01728 g008
Figure 9. Daily variation in local load and electric vehicle (EV) power for 1 and 2 January.
Energies 11 01728 g009
Figure 10. Yearly load profile at the island.
Energies 11 01728 g010
Figure 11. Lifetime curve of the lithium-ion battery.
Energies 11 01728 g011
Figure 12. Capacity curve of the lithium-ion battery system.
Energies 11 01728 g012
Figure 13. Battery energy capacity and total power.
Energies 11 01728 g013
Figure 14. Relationship between the excess electricity and charging EV batteries.
Energies 11 01728 g014
Figure 15. Relationship between the monthly variation in excess electricity and charging EV batteries.
Energies 11 01728 g015
Table 1. eTuk characteristics [23].
ItemsSpecification
Electric motorDC motor
Maximum speed50 km/h
Passengers3
Maximum payload300 kg
Outline (length × width × height)2980 × 1410 × 1850 (mm)
Battery optionsLead acid or lithium-ion
Table 2. Charging standard for infrastructure.
ItemsSpecification
Home chargingLevel 1/2, mode ½
Semipublic chargingLevel 2, mode 2
Public chargingLevel 2/3, mode 2/3, DC charging (mode 4)
Table 3. Characteristics of the photovoltaic (PV) system.
ItemsSpecification
Cost of photovoltaic array ($/kW )2613.45
Replacement cost of photovoltaic array ($/kW )2287.75
Operation and maintenance cost of PV array ($/kW/yr)17.56
Working life of the photovoltaic modules (yr)20
Table 4. Characteristics of the wind turbine (WT) system.
ItemsSpecification
Capital cost of wind turbine ($/kW)6793.30
Replacement cost of wind turbine ($/kW)5248.50
Operation and maintenance cost ($/kW/yr)97.55
Operational life of wind turbine (yr)20
Hub height (m)20
Table 5. Characteristics of the power converter.
ItemsSpecification
Capital cost of power converter ($/kW)2289.51
Replacement cost of power converter ($/kW)2074.87
Operation and maintenance cost of power converter ($/kW/yr)10.04
Lifetime of inverter (yr)20
Efficiency of inverter (%)95
Capacity relative to inverter (%)100
Efficiency of rectifier (%)85
Table 6. Characteristics of the battery system.
ItemsSpecification
Nominal capacity (Ah)280
Nominal voltage for one cell (V)3.2
Number of cells in the battery module *92
Capital cost ($/kWh)652
Replacement cost ($/kWh)652
Operation and maintenance cost ($/kWh/yr)21.74
Initial state of charge (%)95
Minimum state of charge (%) 5
Round trip efficiency (%)95
Float life (yr)10
Maximum charge rate (A/Ah) 0.321429
Maximum charge current (A) 140
Maximum discharge current (A) 280
Maximum capacity (Ah)282.634
Capacity ratio c[-]0.822
Rate constant k[1/h] 2.758
* Note that the bus voltage for the lithium-ion battery is 294 V. The number of cells in one battery module is 92.
Table 7. Lifetime throughput calculation parameters of the lithium-ion battery.
Depth of Discharge (%)Cycles to Failure
801000
502000
304000
Table 8. Optimization results of the proposed hybrid renewable energy charging station.
WT (kW)102030405060708090100
WT fraction (%)5.2613.3323.0733.3341.665041.1747.055052.63
PV (kW)180130100807060100909090
PV fraction (%)94.7386.6676.9266.6658.335058.8252.945047.36
Total power (kW)190150130120120120170170180190
Inverter (kW)35353030303530353030
ESS (EA)368368368368368368276276276276
NPC ($1,000,000)1.271.21.181.21.261.331.41.471.541.63
Cost of energy ($/kWh)1.141.081.061.081.131.201.261.321.391.46
Operating cost ($1000)32313132333532333536
Initial capital ($1000)858795773789831884985103810951163
WT: wind turbine; PV: photovoltaic; ESS: energy storage system; NPC: net present cost.
Table 9. Optimization results of the proposed charging station as a function of the ESS.
ESS Strings3456789101112
WT (kW)30303030201010101010
PV (kW)1501008070809080707070
Inverter (kW)30303030303530353030
NPC ($1,000,000)1.21.181.241.341.421.511.591.711.821.95
Cost of energy ($/kWh)1.081.061.121.211.281.361.431.531.641.76
Operating cost ($1000)28313641465055606671
Initial capital ($1000)8447737818158338638859309791039

