Article

Drivers of Wettability Alteration for Oil/Brine/Kaolinite System: Implications for Hydraulic Fracturing Fluids Uptake in Shale Rocks

1
Department of Petroleum Engineering, Curtin University, 26 Dick Perry Avenue, Kensington 6151, Australia
2
State Key Laboratory of Oil and Gas Reservoir Geology and Exploitation, Southwest Petroleum University, Chengdu 610500, China
*
Author to whom correspondence should be addressed.
Energies 2018, 11(7), 1666; https://doi.org/10.3390/en11071666
Submission received: 8 May 2018 / Revised: 15 June 2018 / Accepted: 21 June 2018 / Published: 26 June 2018

Abstract

:
Hydraulic fracturing technique is of vital importance to effectively develop unconventional shale resources. However, the low recovery of hydraulic fracturing fluids appears to be the main challenge from both technical and environmental perspectives in the last decade. While capillary forces account for the low recovery of hydraulic fracturing fluids, the controlling factor(s) of contact angle, thus wettability, has yet to be clearly defined. We hypothesized that the interaction of oil/brine and brine/rock interfaces governs the wettability of system, which can be interpreted using Derjaguin–Landau–Verwey–Overbeek (DLVO) and surface complexation modelling. To test our hypothesis, we measured a suit of zeta potential of oil/brines and brine/minerals, and tested the effect of ion type (NaCl, MgCl2 and CaCl2) and concentrations (0.1, 1, and 5 wt %). Moreover, we calculated the disjoining pressure of the oil/brine/mineral systems and compared with geochemical modelling predictions. Our results show that cation type and salinity governed oil/brine/minerals wettability. Divalent cations (Ca2+ and Mg2+) compressed the electrical double layer, and electrostatically linked oil and clays, thus increasing the adhesion between oil and minerals, triggering an oil-wet system. Increasing salinity also compressed the double layer, and increased the site density of oppositely charged surface species which made oil and clay link more strongly. Our results suggest that increasing salinity and divalent cations concentration likely decrease water uptake in shale oil reservoirs, thus de-risking the hydraulic fracturing induced formation damage. Combining DLVO and surface complexation modelling can delineate the interaction of oil/brine/minerals, thus wettability. Therefore, the relative contribution of capillary forces with respect to water uptake into shale reservoirs, and the possible impairment of hydrocarbon production from conventional reservoirs can be quantified.

1. Introduction

Oil and natural gas remains as important primary resources in this century [1]. Due to the decline of oil and natural gas production from conventional reservoirs, the gravitation towards unconventional resources development receives broad scientific interest [2]. Such resources are reserved in shale rocks with nano-Darcies level permeability, although the presence of small natural fracture may trigger an effective permeability higher than the order of nano-Darcies [3]. Due to the extremely low matrix permeability, the production is associated with hydraulic fracturing, which can activate pre-existing fractures and create new fractures, thus enhancing permeability by improving the connectivity [2]. Hydraulic fracture stimulation generally refers to a process of injecting high pressure fluids into the formations or rocks through wellbore to create fractures which are filled with high permeable engineered materials, termed as proppant, to keep the created fracture open. The created hydraulic fractures act as the highly conductive flow paths enabling hydrocarbon (oil and gas) to flow at an economic rate. Once the hydraulic fracture stimulation job is successfully completed, the injection is ceased. As a result, the proppant contained in the fracturing fluid remains within the fracture, keeping the fractures open, and allowing recovery of fracturing fluids and hydrocarbon from the rocks or formations through the wellbore. However, hydraulic fracturing triggers low recovery of fracturing fluids (usually <30% [4]), which raises concerns from both technical and environmental aspects. Several mechanisms have been proposed to understand why the fracturing fluids disappeared, e.g., remaining in fracture network [4,5], creating new fractures [6,7], hydration of clay minerals [8,9], capillary pressure [5,6,7,10], and osmotic flow [11,12].
While water uptake is attributed to a complex oil/brine/rock interaction due to physio-chemical processes [2], understanding of the controlling factor(s) which drives these processes is incomplete. Thus, there is a pressing need to quantify the contribution of these process in particular in capillary forces associated with water uptake.
In this context, Fakcharoenphol et al. [12] used a laminated core from Middle Bakken formation to conduct spontaneous imbibition experiment. Their experimental results show that low salinity water (20,000 ppm KCl) significantly improves spontaneous imbibition recovery compared to high salinity water (282,000 ppm). In addition, Xu et al. [13] conducted spontaneous imbibition test in shale rocks using brines with different salinity (deionized water 10, and 20 wt % NaCl). Their experiment results show that increasing the NaCl concentration decreases the brine uptake for all samples. Moreover, they also observed that increasing the concentration of NaCl prevents the expansion and physical alteration of shale samples. It is worth noting that all above outlined studies have been carried out at core-scale, although it is well known that ion type, ionic strength, clay minerals and oil composition have a considerable impact on oil/brine/minerals interaction, thus wettability [14,15].
Therefore, to further understand the controlling factors of wettability alteration, Roshan et al. [2] conducted a suit of contact angle on shale samples with an oil and aqueous solutions with various ion types and concentration. Their results show that bivalent ions increase contact angle compared to monovalent ions, suggesting that ion type and concentration significantly affect the interaction of oil/brine/shale system, thus wettability, which is also demonstrated by the physical model they developed based on the diffuse double layer theory. However, a quantitative work remains to be made to provide a practical and reliable framework to design the water chemistry of fracturing fluids, thus avoiding the technical and environmental issues associated with water-uptake.
To provide such framework, we further explored the nature of the physio-chemical process to understand the controlling factor(s) of the wettability of oil/brine/shale system, thus capillary forces, with respect to water uptake. In addition, there is a clear lack of systematic investigation of oil/brine/shale interaction for brines containing major exchangeable cations (Na+, Ca2+, and Mg2+) at various concentrations. In this work, we particularly focused on how edge-charged clays affect the system wettability. In particular, kaolinite was used to investigate the effect of ion type and concentration on oil/brine/minerals system wettability. We measured zeta potential of oil/brines and brine/mineral as a function of salinity and ion type to calculate disjoining pressure of oil/brine/mineral system. Moreover, we performed a geochemical study to investigate the effect of ion type and concentration on the number of surface species at oil/brine and brine/mineral. Finally, we compared disjoining pressure calculations with geochemical modelling predictions to quantitatively examine the controlling factors of wettability alteration.

2. Fluids and Procedures

2.1. Oil

While oil composition affects the interaction of oil/brine/minerals system [16,17], we did not focus on the composition effect in this study. Rather, to test our hypothesis, we used an oil from a reservoir in the northwest of China to examine the effect of ion type and salinity on zeta potential of oil/brine and brine/minerals, and surface chemistries, thus wettability. The asphalthene content in the crude oil was 4.96 wt %. The density of oil sample was 0.78 g/cm3 with viscosity of 8.2 mPa·s at temperature of 50 °C. Oil sample used in the experiment was degassed and centrifuged at 5000 rpm for two hours to avoid any inaccuracy during zeta potential tests.

2.2. Brines

Given that water chemistries play a significant role in the interaction of oil/brine/rock system [18], thereby wettability, aqueous ionic solutions (NaCl, CaCl2 and MgCl2) with concentrations (0.1, 1, and 5 wt %) were used to examine the zeta potential of oil/brines and brines/minerals. Prior to zeta potential tests, aqueous ionic solutions were filtered using an evacuator through two layers of filter papers to avoid impurity and any dissolved gas to affect the results. Note that pH was not adjusted during the zeta potential tests.

2.3. Minerals

Minerology of shale rocks affects oil/brine/minerals system wettability. Shale oil reservoirs mainly consist of clays (50–70%), while a small amount of quartz, feldspar remain in reservoirs [7]. Moreover, clays comprise basal charged clays (e.g., smectite, illite, and chlorite) [19], and edge-charged clays (kaolintie) [20]. Due to the different crystal structures, basal charged clays and edge-charged clays have different surface chemistries [21]. In this work, we particularly focused on how edge-charged clays affect the system wettability. In particular, kaolinite was used to investigate the effect of ion type and concentration on oil/brine/minerals system wettability.

2.4. Experimental Procedure

Zeta potential of oil/brine and solid/brine interfaces were measured through Zetasizer Nano ZS manufactured by Malvern. All the measurements were conducted at 25 °C. Samples of oil/brine and solid/brine were prepared referring to the procedure proposed by Zhang [22]. The solutions of oil/brine were prepared at volume ratio of 1:8. The solid/brine samples were prepared by putting 2 wt % of solids powder to brines. The solid powders were added to aqueous ionic solutions and stirred by a mixing rod until the solid powers were well-distributed. Then, the supernatant liquor was extracted using syringes to put into the measurement cell after the majority of solids particles deposited at the bottom of the tube. The standard deviation of zeta potential measurements was ±2 mV.

3. Theoretical Background

Thermodynamics of the thin films was used to determine the interdependence of spreading, contact angle and capillary pressure using the DLVO theory and Laplace–Young Equation [15]. The intermolecular forces comprise of the van der Waals, electrical and structural forces [15,23].
Π T o t a l = Π V a n d e r W a a l s + Π e l e c t r i c a l + Π s t r u c t u r a l
where Π T o t a l is the disjoining pressure of the specific intermolecular interactions which reflects the interactive forces between the interface of water/oil and water/rock. A brief introduction of the forces and calculation procedures were presented below.

3.1. Van der Waals Forces

The Van der Waals forces are considered to be negative for crude oil/brine/rock systems and the structural and the electrostatic forces are positive forces. The Van der Waals and structural forces are assumed to be same at all values of water film thickness and molarity. The London–van der Waals force between the two similar materials is usually attractive; therefore, this force is recognized as the strength of the attachment between to solids. The retarded London–van der Waals attractive force is expressed as below [15]:
Π V a n ( h ) = A ( 15.96 h / λ + 2 ) 12 π h 3 ( 1 + 5.32 h / λ ) 2
where A is the Hamaker constant in an oil/water/solid system, λ is the London wavelength, and h is the distance between the two interfaces.
The Hamaker constant for a film system is calculated from the experimentally measured data for two identical bodies in a vacuum. These experimental values are in agreement with the theoretical calculation.
A = 3 4 k T ( ε 1 ε 3 ε 1 + ε 3 ) ( ε 2 ε 3 ε 2 + ε 3 ) + 3 H 4 π v 1 ( ε 1 ( i v ) ε 3 ( i v ) ε 1 ( i v ) + ε 3 ( i v ) ) ( ε 2 ( i v ) ε 3 ( i v ) ε 2 ( i v ) + ε 3 ( i v ) ) d v
where ε 1 , ε 2 , and ε 3 are the static dielectric constants; k is the Boltzmann constant; ε 1 ( i v ) , ε 2 ( i v ) , and ε 3 ( i v ) are the electronic absorption terms; and T is the temperature in kelvin. The Hamaker constant for oil/silica in water is approximately 1 × 10⁻²⁰ J [15]. Melrose [24] used Hamaker constants ranging from 0.3 to 0.9 × 10⁻²⁰ J. In this study, 0.81 × 10⁻²⁰ J was used as the Hamaker constant, and the London wavelength was assumed to be 100 nm [15].

3.2. Electrostatic Forces

These forces are the result of the development of the charges between interacting surfaces. The charges can be formed either by dissociation of the surface charges or adsorption of the charges onto an uncharged surface. The electrical double layer force is estimated using zeta potentials and is approximated by [25]:
Π e l e c t r i c a l ( h ) = n b k B T ( 2 ψ r 1 ψ r 2 cosh ( κ h ) ψ r 1 2 ψ r 2 2 ( sinh ( κ h ) ) 2 )
where ψ r 1 and ψ r 2 are the reduced potential, κ is the reciprocal Debye–Huckel double layer length, n b is the ion density in the bulk solution, and k B is the Boltzmann constant.
The Debye–Huckel reciprocal length, κ , is
κ = 2 e 2 z 2 n b ε 0 ε r k B T
where e is the electron charge, 1.60 × 10⁻¹⁹ C; ε 0 is the dielectric permittivity of vacuum, 8.854 × 10⁻¹²; ε r is relative permittivity of an electrolyte solution used in the core-flooding experiments, which is assumed to be 78.4; and z is valence of a symmetrical electrolyte solution, z = 1 for NaCl.

3.3. Structural Forces

The structural forces are short-range interactions over a distance of less than 5 nm compared with the London–van der Waals and electrical double layer forces which are considered are long-range interactions. The structural interaction is calculated from [26]:
Π s t r u c t u r e = A k exp ( h h s )
where A k is the coefficient and h s is the characteristic decay length for the exponential model. In this study, it is assumed that the coefficient is 1.5 × 10¹⁰ Pa and the decay length is 0.05 nm [26].

4. Results and Discussion

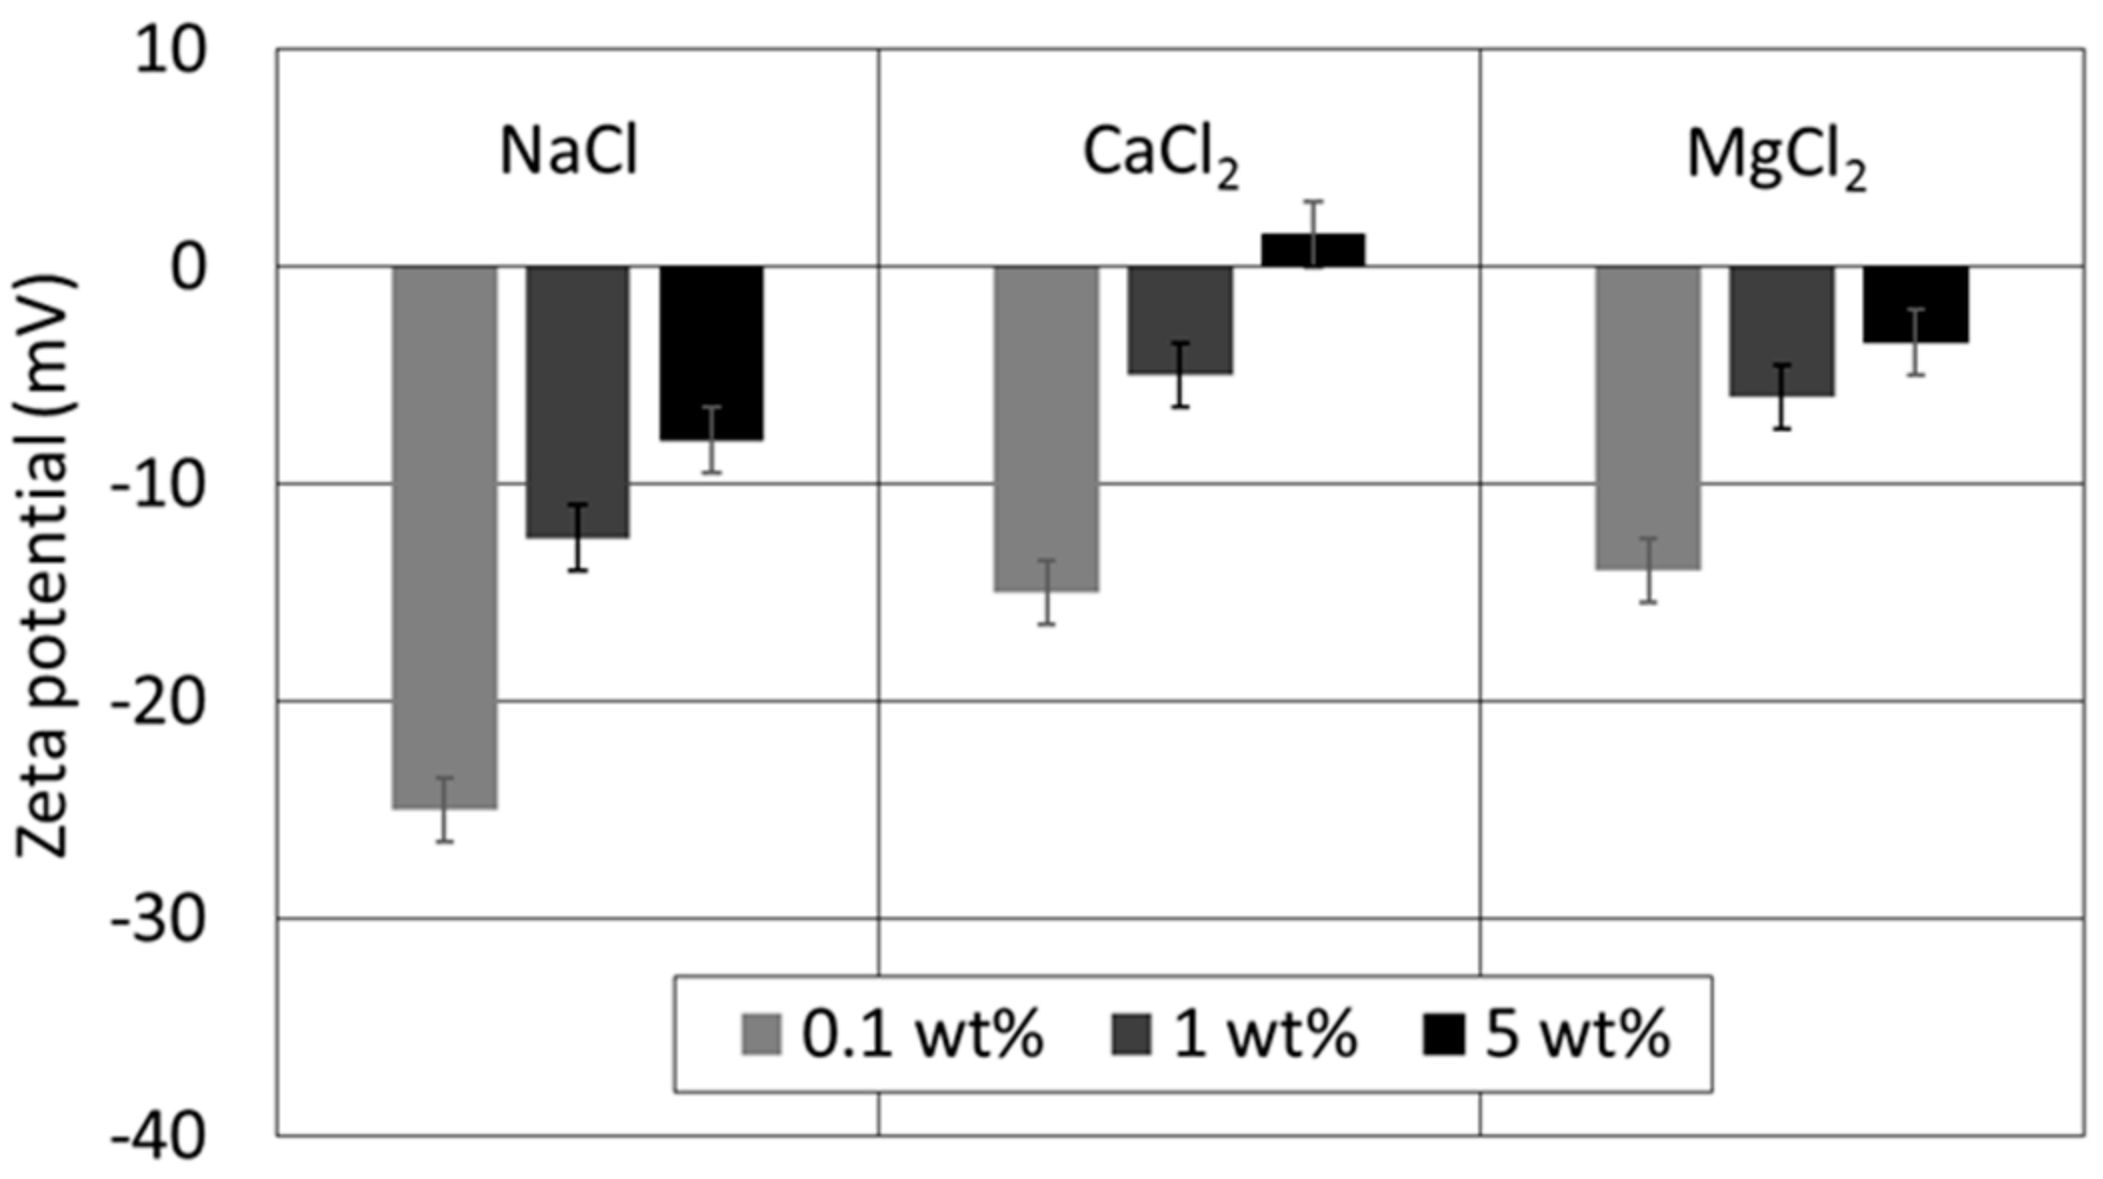
4.1. Effect of Ion Type and Concentration on Zeta Potential of Oil/Brines

Ion type significantly affected zeta potential of oil/brine at a given concentration (Figure 1). Monovalent cations, Na+, gave a strongly negative zeta potential compared to divalent cations, e.g., Ca2+ and Mg2+. To be more specific, at the concentration of 1 wt %, equivalent to 10,000 mg/L, while all zeta potentials of oil/NaCl were negative, NaCl gave a stronger negative zeta potential (−12.5 mV) compared to CaCl2 (−5.2 mV) and MgCl2 (−6.1 mV). Similar trend was also observed by Nasralla et al. [27], who showed that NaCl yields a more negative zeta potential compared to CaCl2 and MgCl2 using two different crude oils. This is because divalent cations, e.g., Ca2+ and Mg2+, have a much stronger affinity towards oil surfaces due to a double charge number compared to Na+, thus compressing electrical double layer [28]. This also suggests that ion type may need to be manipulated to design the hydraulic fracturing fluids, thus wettability.
Moreover, zeta potential appeared to be more negative with decreasing salinity for a given ion type. For example, in the presence of NaCl, zeta potential decreased from −8 to −25 mV with decreasing salinity. Similarly, zeta potential of oil/CaCl2 decreased from −6 to −13 mV with decreasing salinity. Likewise, in the presence of MgCl2, zeta potential also decreased from −3.5 to −14 mV with decreasing salinity. The same trend of the zeta potential variation with concentration were also observed by Nasralla et al. [27] who showed that zeta potential becomes less negative with increasing salinity. This is because the massive counter ions compress diffuse layer, thus reducing its thickness, which in return leading to a less negative zeta potential [28].

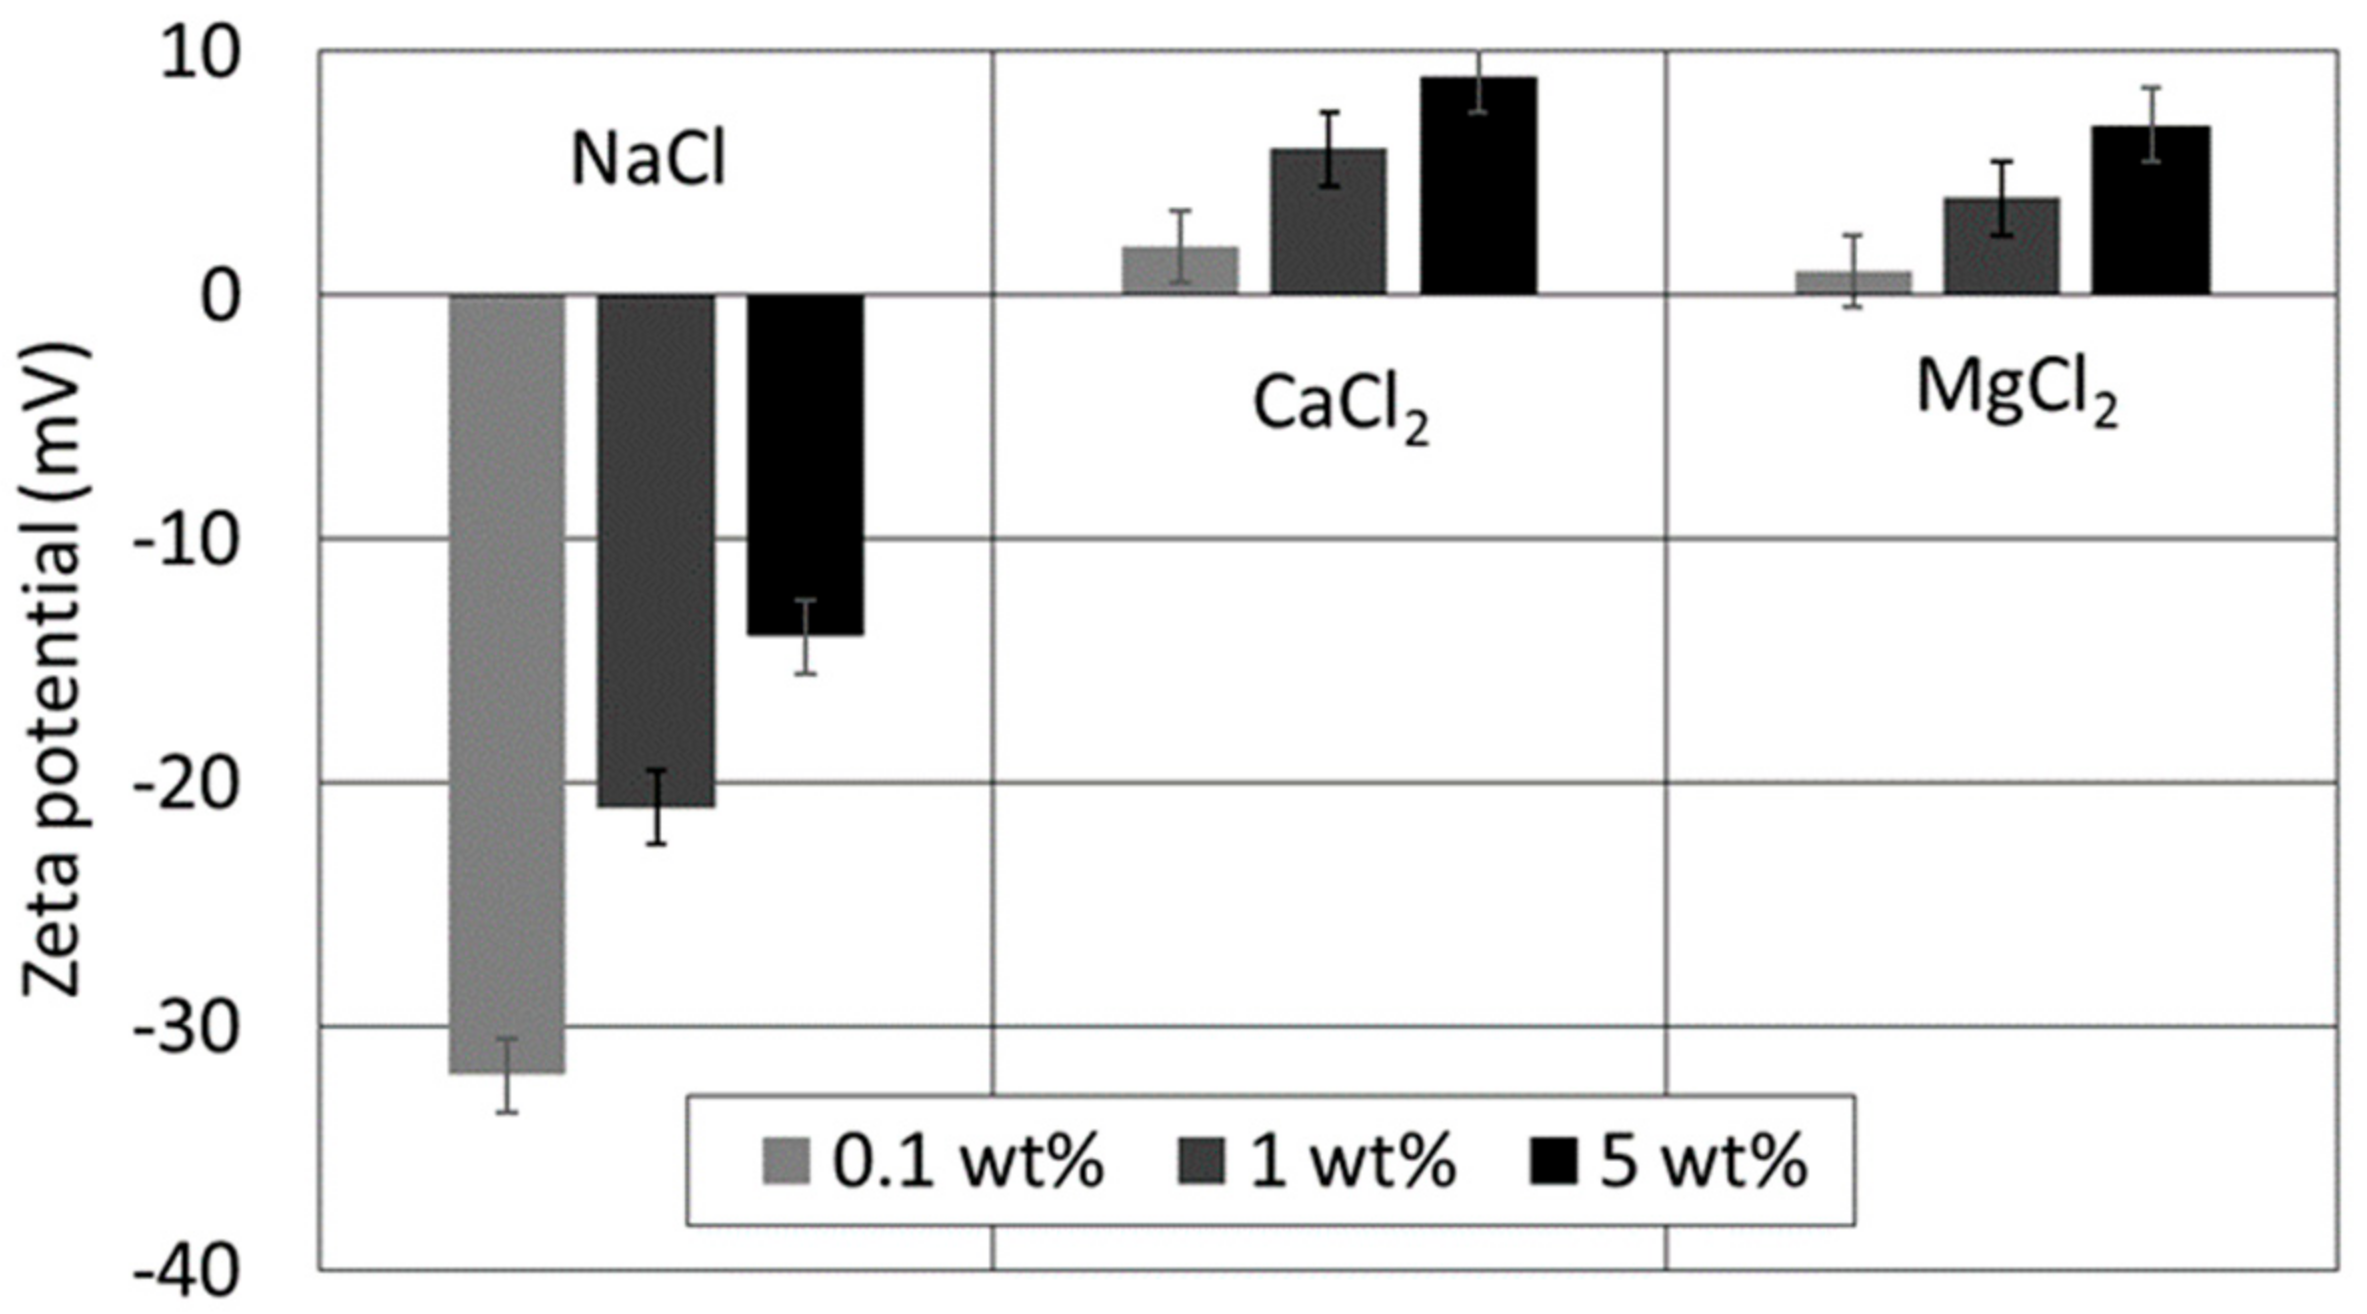
4.2. Effect of Ion Type and Concentration on Zeta Potential of Brine/Kaolinite

Similar to the zeta potential of oil/brine, ion type strongly affected the zeta potential of brine/kaolinite at a given concentration. To be more specific, divalent cations (e.g., Ca2+ and Mg2+) gave positive zeta potential for all concentrations (Figure 2). Rather, monovalent cations (Na+) gave negative zeta potential for all concentrations (Figure 2). For instance, at the concentration of 1 wt %, zeta potential in the presence of NaCl was −21 mV. However, zeta potential increased to 6 and 4 mV in the presence of CaCl2 and MgCl2, respectively. Similar results were also observed by Nasralla et al. [27], who showed that divalent cations (Ca2+ and Mg2+) trigger positive charges at the interface of brine/kaolinite. It is worth noting that Ca2+ appears to give a stronger positive zeta potential compared to Mg2+ (Figure 2). This is largely because Ca2+ has a stronger charge density as a results of a small hydration radius than Mg2+ [14].
Zeta potential of brine/kaolinite increased with increasing concentration for a given ion type. For example, in the presence of NaCl, zeta potential increased from −32 to −14 mV with increasing salinity from 0.1 to 5 wt %. Similarly, in the presence of CaCl2, zeta potential increased from 2 to 9 mV with increasing salinity. Likewise, MgCl2 caused zeta potential to increase from 1 to 7 mV as salinity increases from 0.1 to 5 wt %. Together, zeta potential results suggest that increasing concentration likely triggers attractive forces between oil/brine and brine/kaolinite, thus less water-wet or oil-wet system. Thus, the capillary force acts as a drag force to avoid hydraulic fracturing water uptake. To further validate our hypothesis, disjoining pressure computation and surface complexation modelling were performed in Section 4.3.

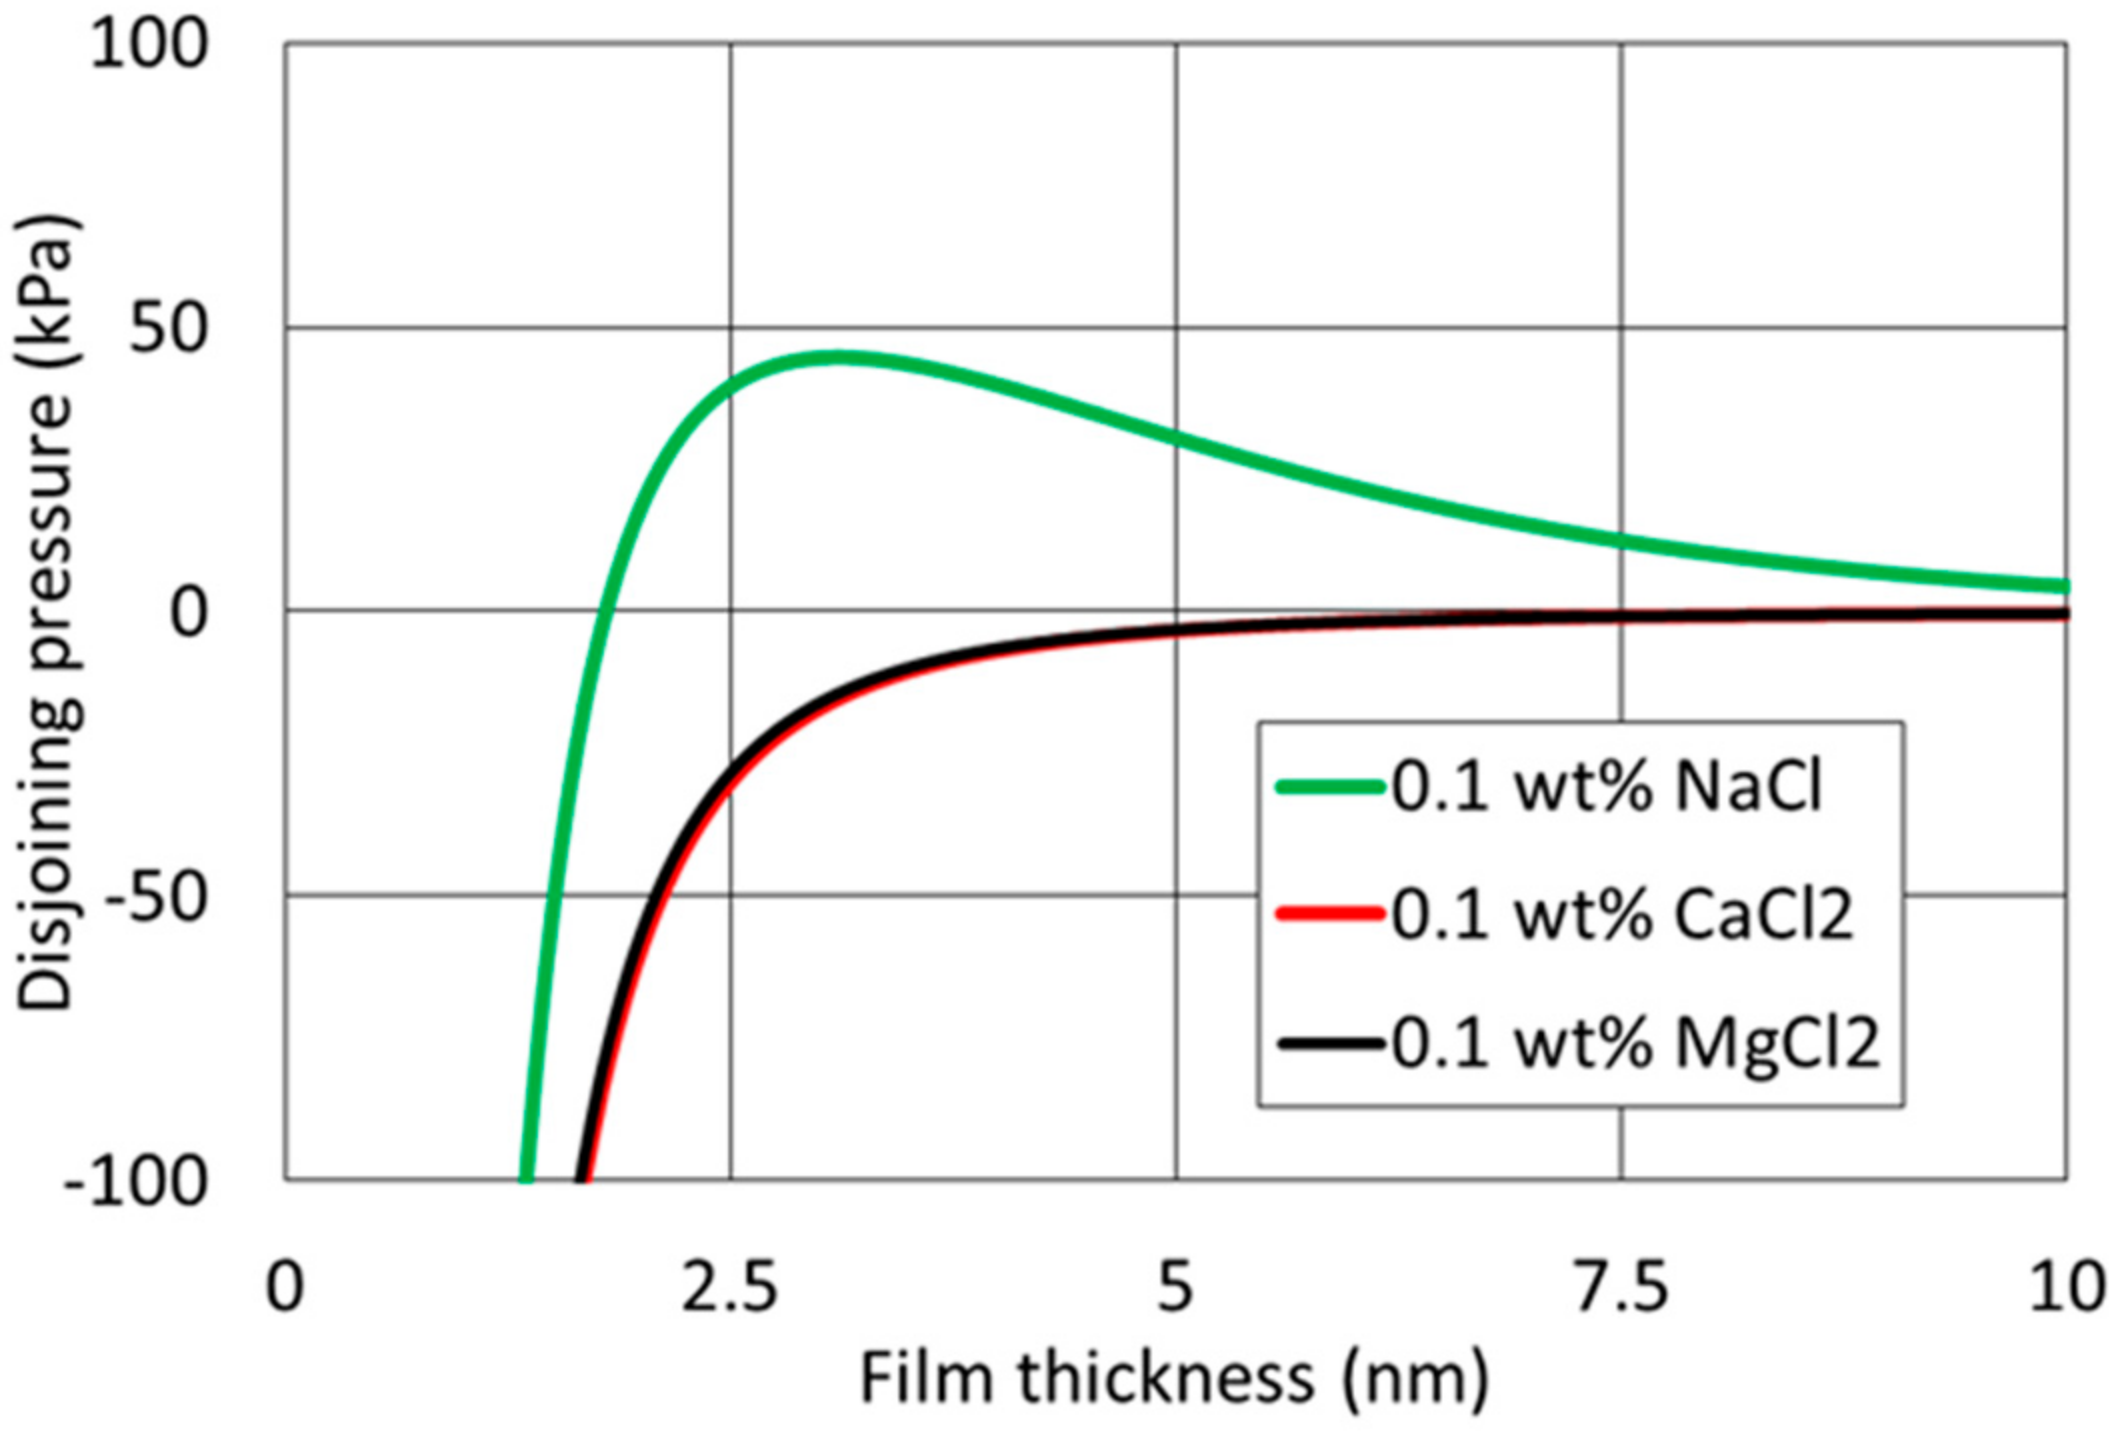
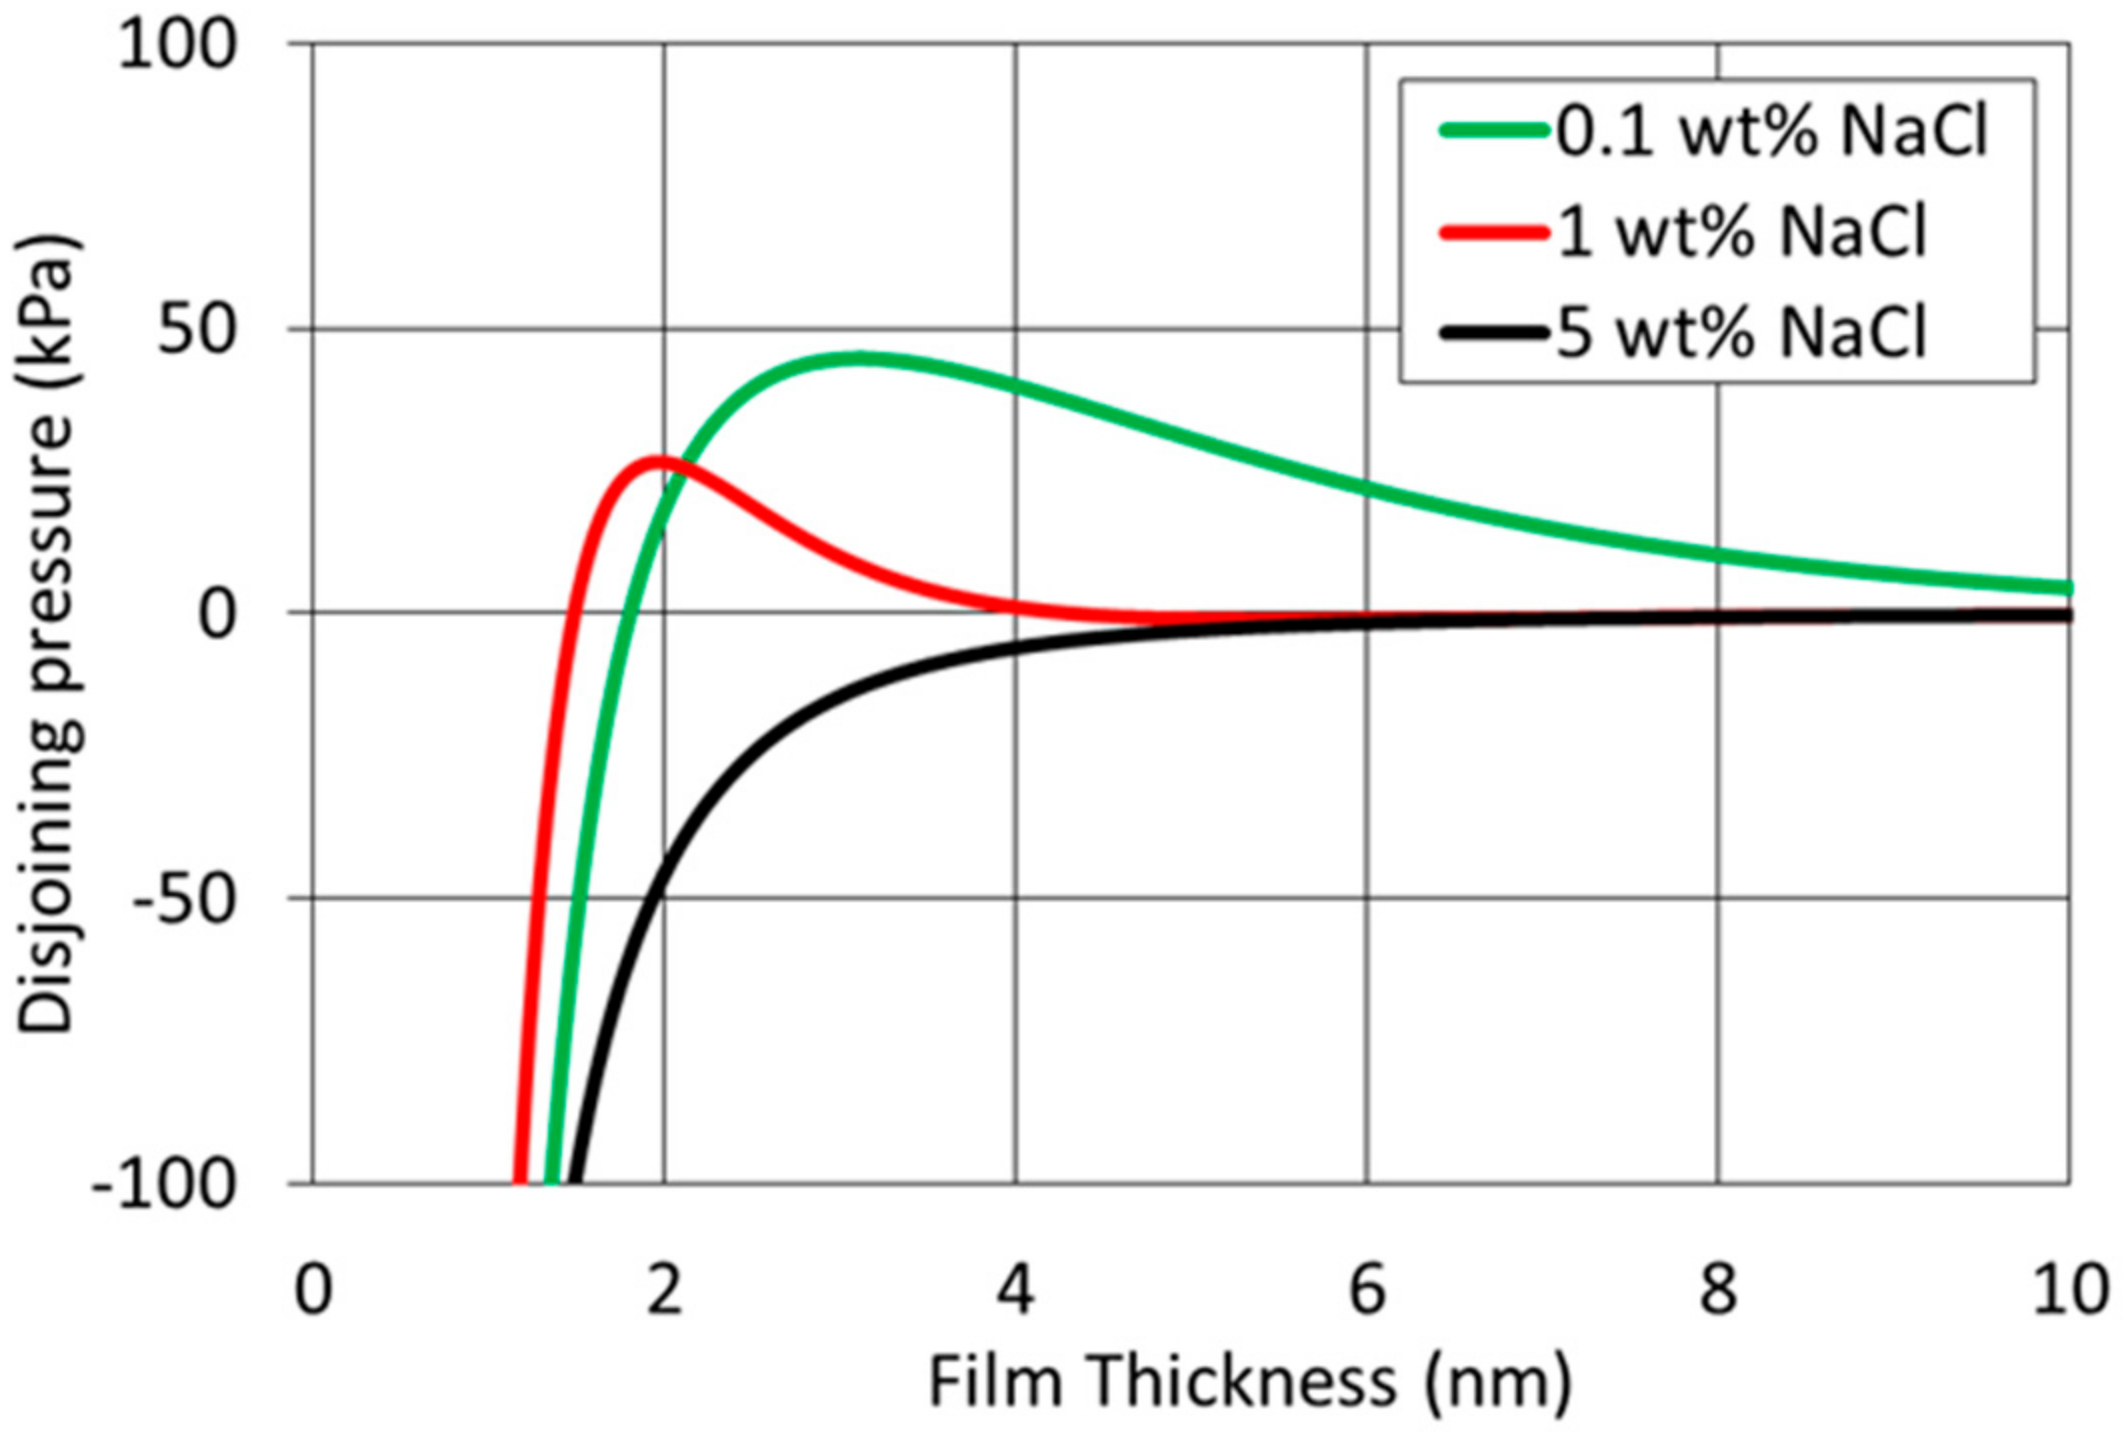
4.3. Effect of Cation Type and Concentration on Disjoining Pressure

Divalent cations (Ca2+, Mg2+) gave rise to negative disjoining pressures (Figure 3) even in the presence of 0.1 wt % concentration, suggesting an oil-wet system. Rather, monovalent cations triggered positive disjoining pressures (Figure 3), implying a water-wet system at the same salt concentration. It is worth mentioning that negative disjoining pressures mean attractive forces, and positive disjoining pressures mean repulsive forces [14]. It is also worth noting that van der Waals interactions and structural forces are largely insensitive to electrolyte type, concentration and pH [29]. These forces were therefore considered as fixed in this study. Figure 3 illustrates that both MgCl2 and CaCl2 generated attractive forces between interfaces of oil/brine and brine/kaolinite at the concentration of 0.1 wt %. This is because divalent cations (e.g., Ca2+ and Mg2+) significantly compress the electrical double layer due to a higher charge density than monovalent cations (Na+) [30], thus lower double-layer expansion force, or even generating attractive electrical double layer force due to the opposite polarity of the zeta potential of oil/brine and brine/kaolinite [31]. For example, MgCl2 and CaCl2 with concentration of 0.1 wt % generated opposite polarity of zeta potential of oil/brine and brine/kaolinite (Figure 1 and Figure 2), thus yielding negative disjoining pressure profiles, showing a monotonically decrease with increasing in the separation distance. Overall, the divalent cation (Mg2+ and Ca2+) triggers negative disjoining pressures with a concentration of 0.1 wt %, suggesting that increasing divalent cations likely shifts wettability towards more oil-wet, thus avoiding capillary forces induced water uptake into shale oil reservoirs. Rather, removing divalent cations from the hydraulic fracturing fluids may increase the thickness of electrostatic double layer, thus increasing the capillary pressure and imbibition rate [9].
Increasing concentration shifted disjoining pressure from positive to negative (Figure 4), meaning altering system from water-wet to oil-wet. Given that the electrolytes concentration affects the Debye Length [32], which in return impacts the double layer expansion [31], we examined the effect of concentration of monovalent cation (NaCl) on disjoining pressure. Figure 4 shows that 0.1 and 1 wt % concentration of monovalent cation (Na+) resulted in positive disjoining pressures, but the disjoining pressure exhibited a progressively more repulsive barrier at increasingly close separation with decrease of NaCl concentration. Rather, the disjoining pressure profiles given by 5 wt % NaCl were negative, and monotonically decreased with increasing the separation distance although the interface of oil/brine and brine/rock were negatively charged (Figure 4). This is because van der Waals forces are strongly negative [33]. Therefore, to convert the disjoining pressure from negative to positive, strongly negative zeta potential at interface of oil/brine and brine/minerals are much needed. It is worth noting that divalent cations effect on disjoining pressure at various concentration were not documented in this section because 0.1 wt % CaCl2 and MgCl2 already rendered negative disjoining pressures (Figure 3). Similar trend was also reported by Xie et al. [34] who showed that increasing NaCl concentration solution shifts the disjoining pressure from positive to negative due to reduced electrostatic screening, suggesting an oil-wet system.

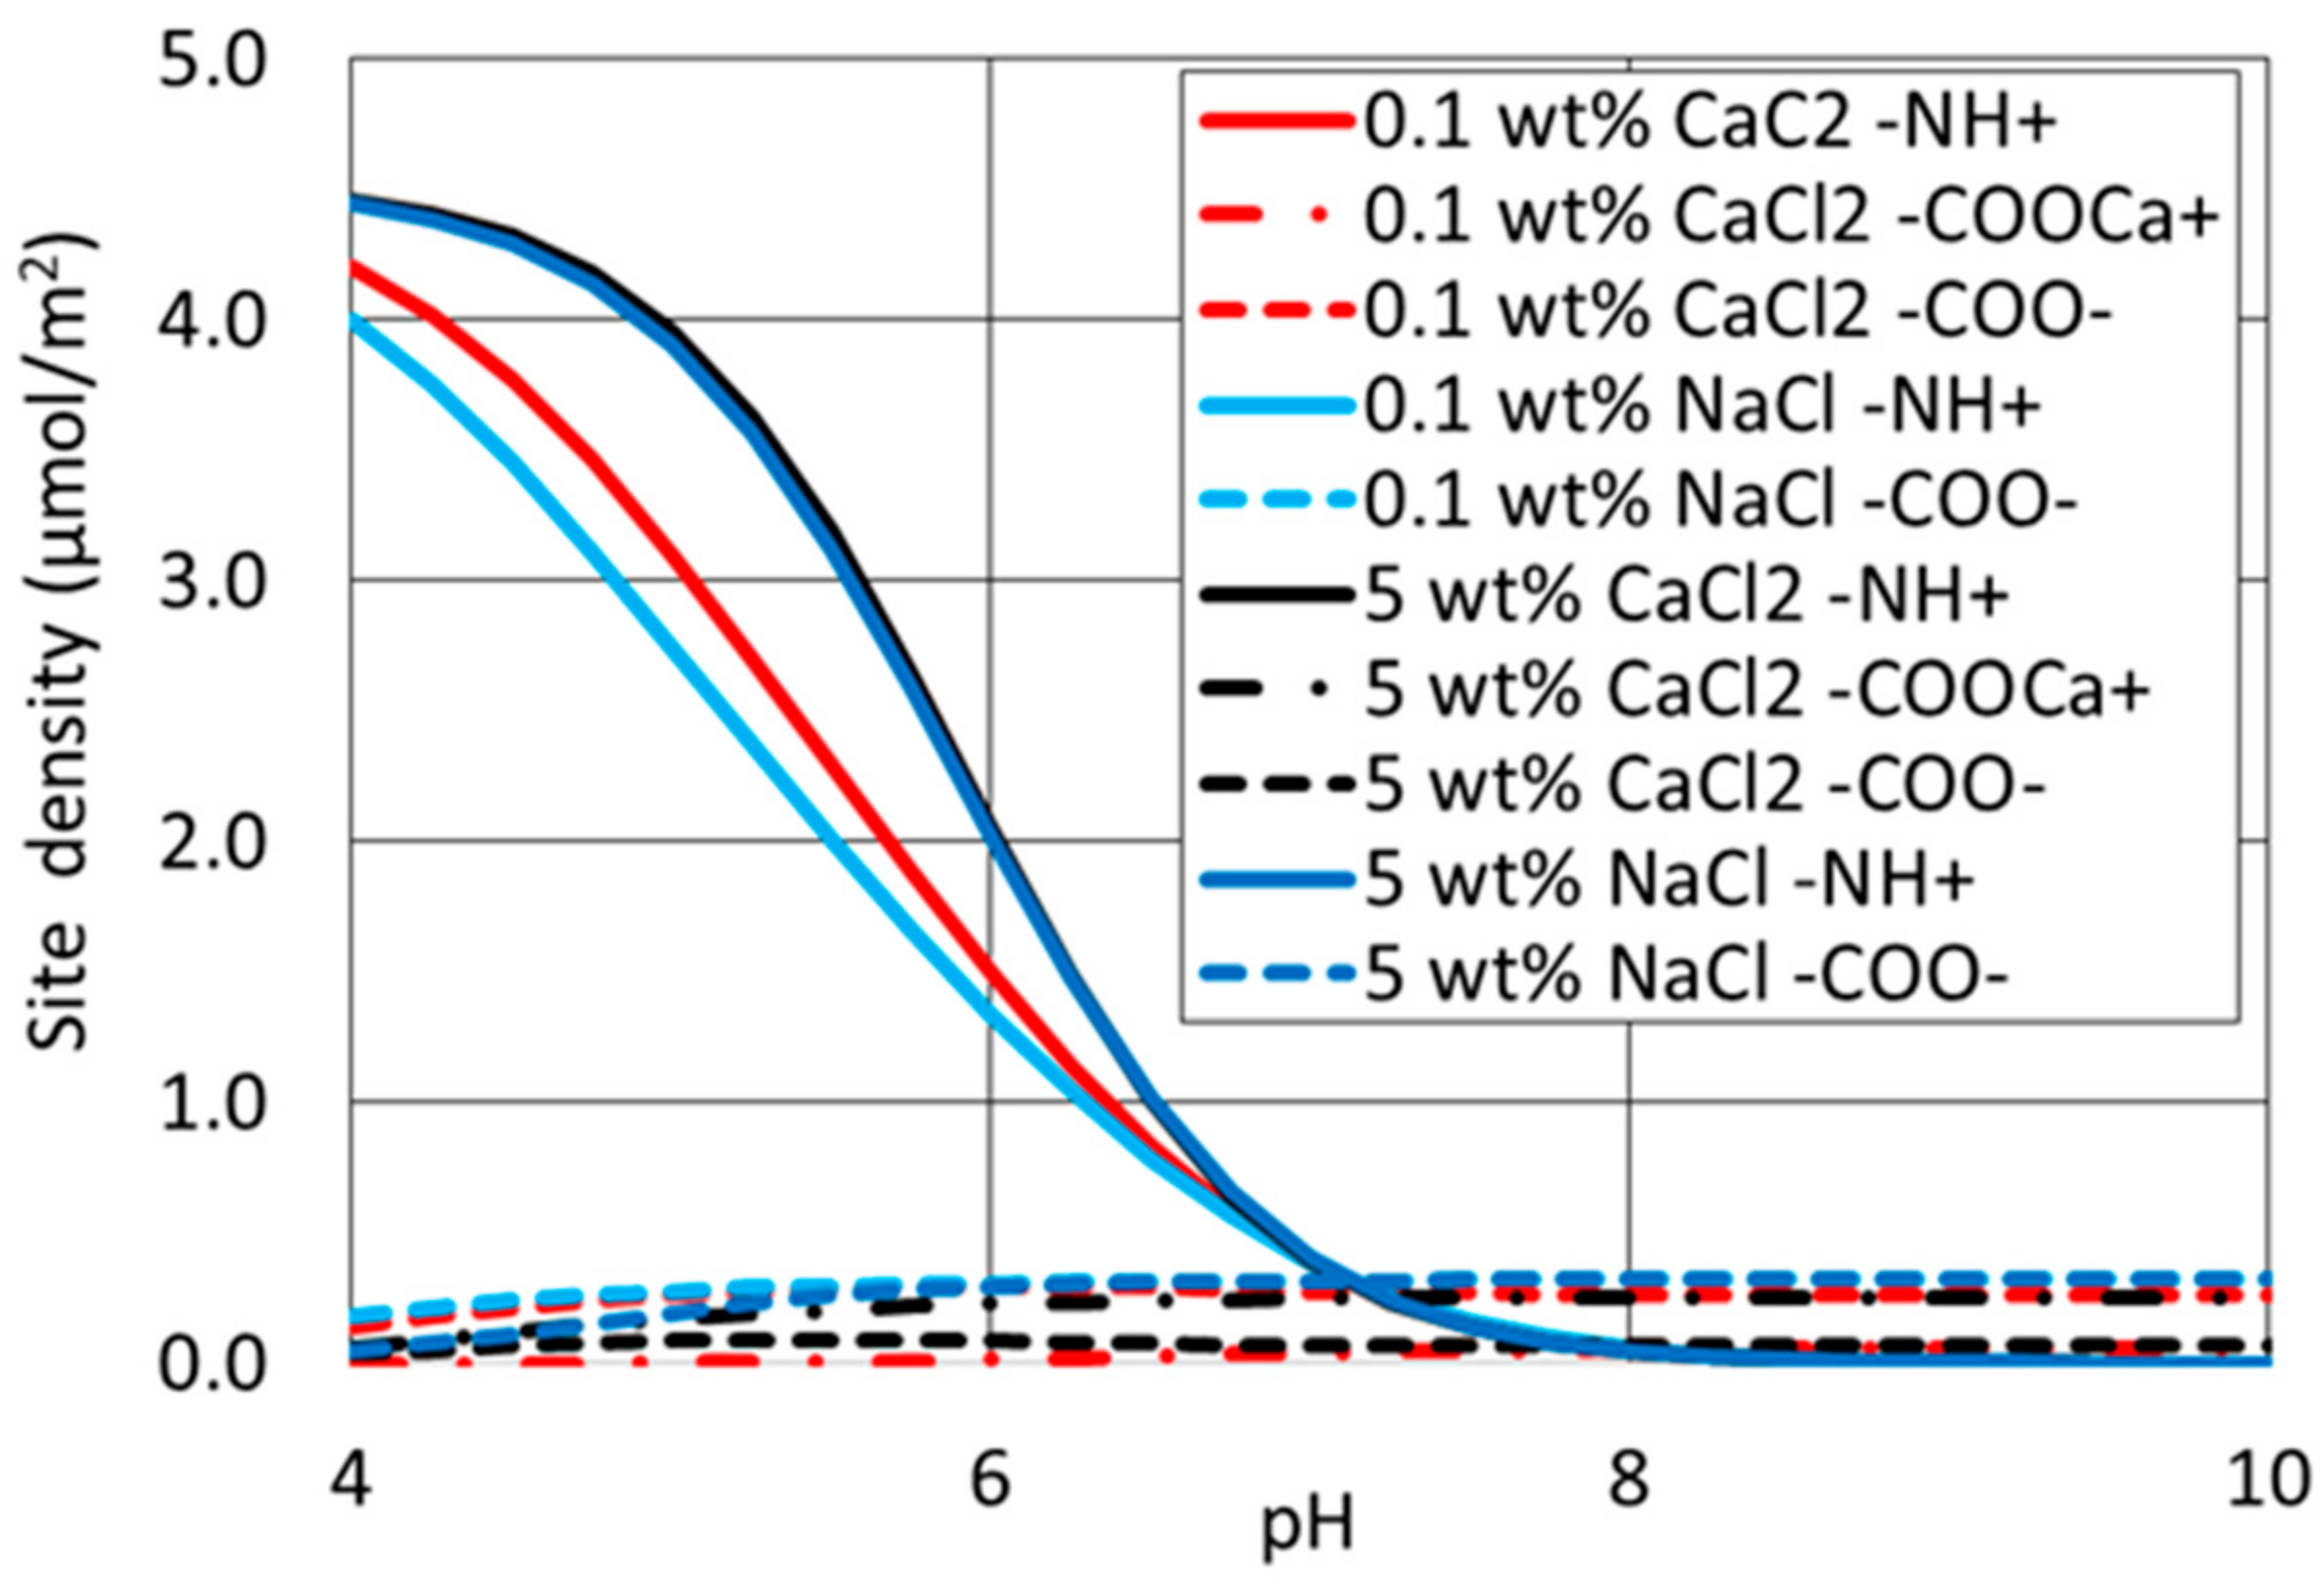
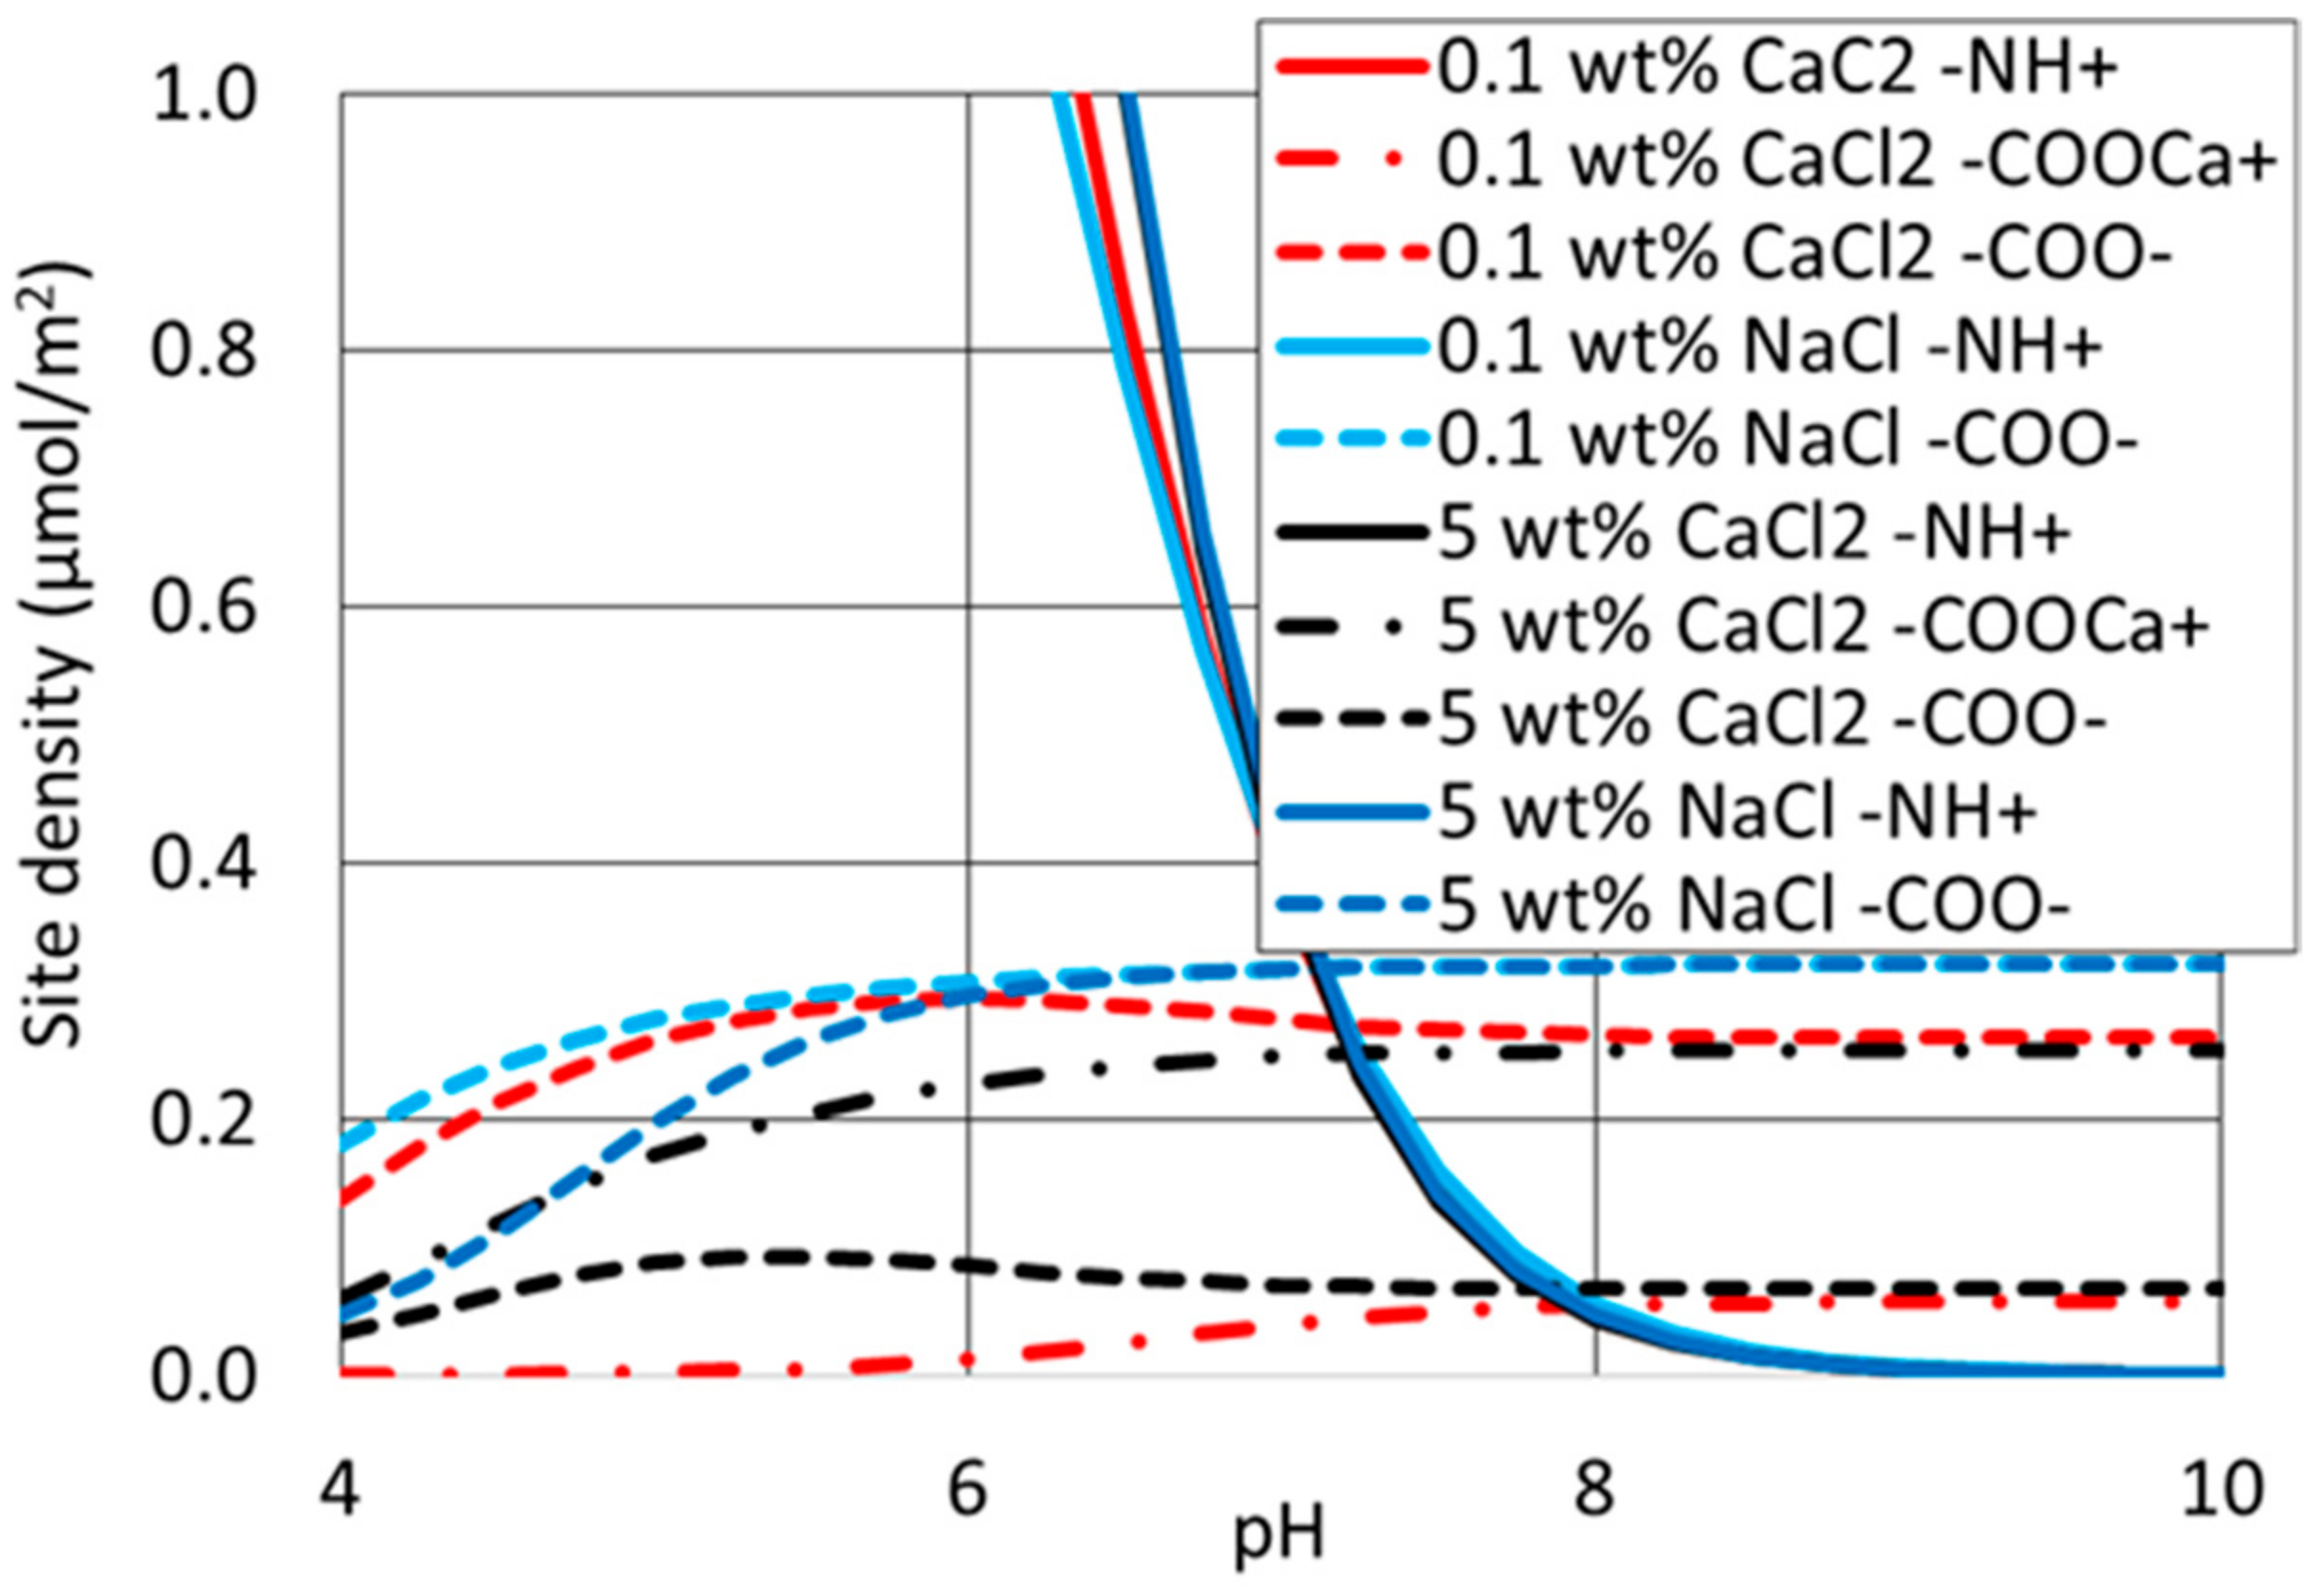
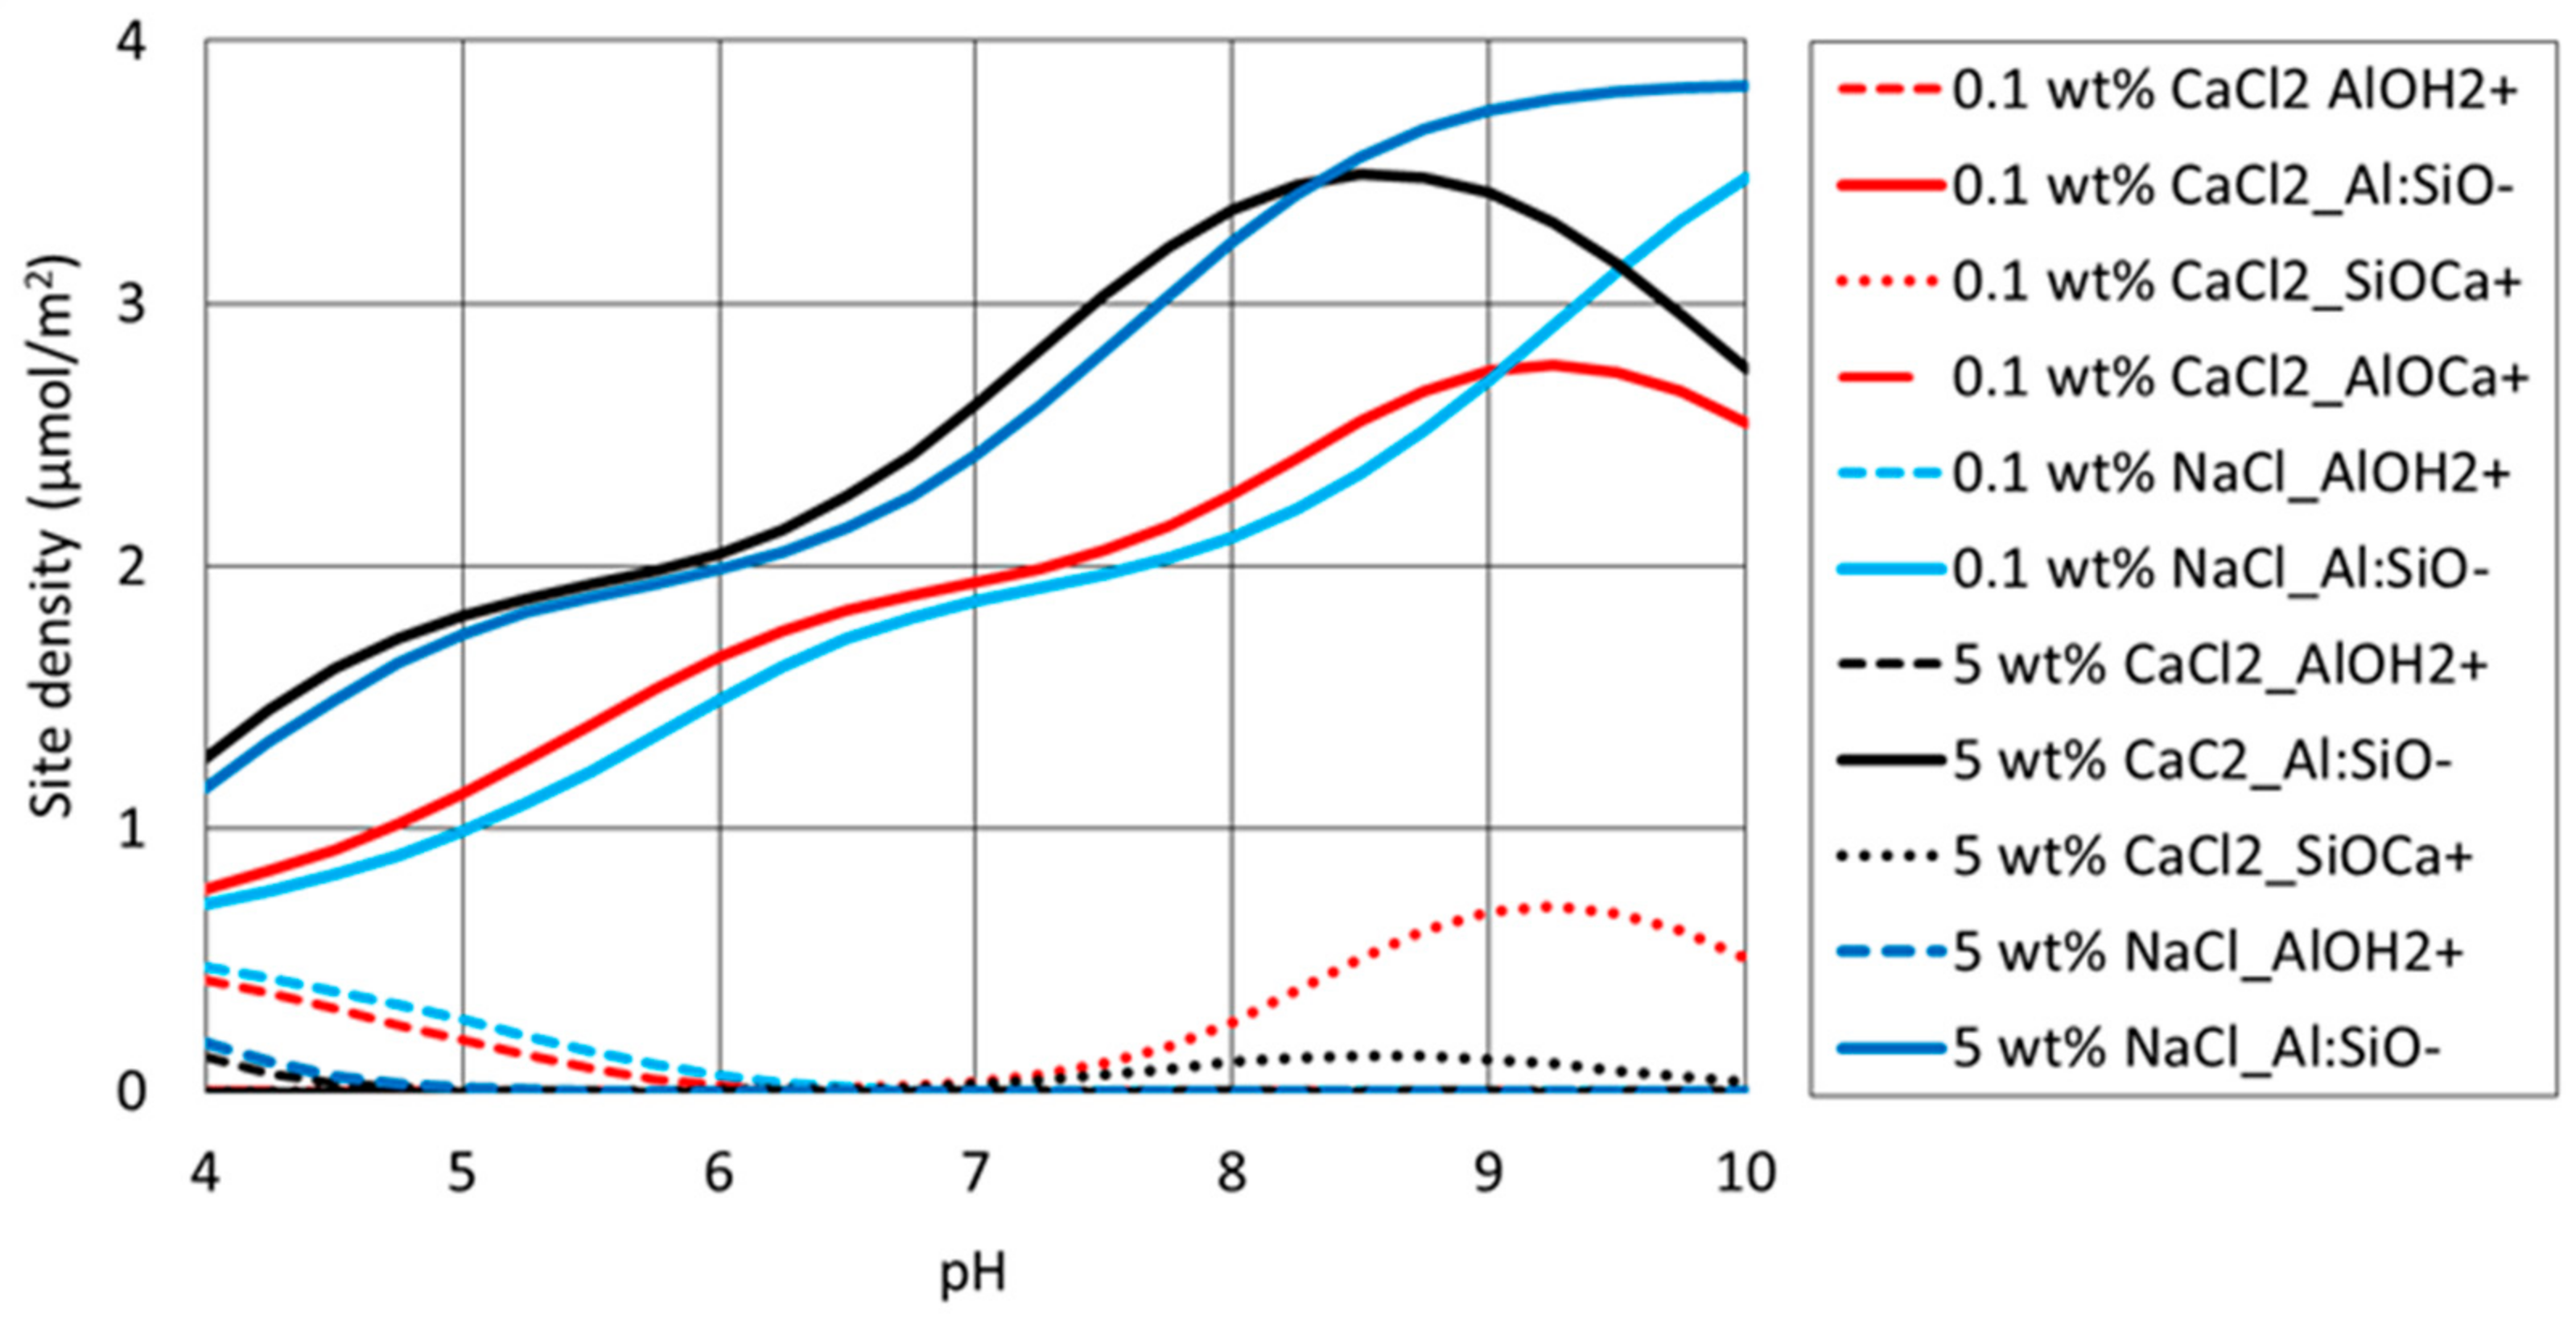
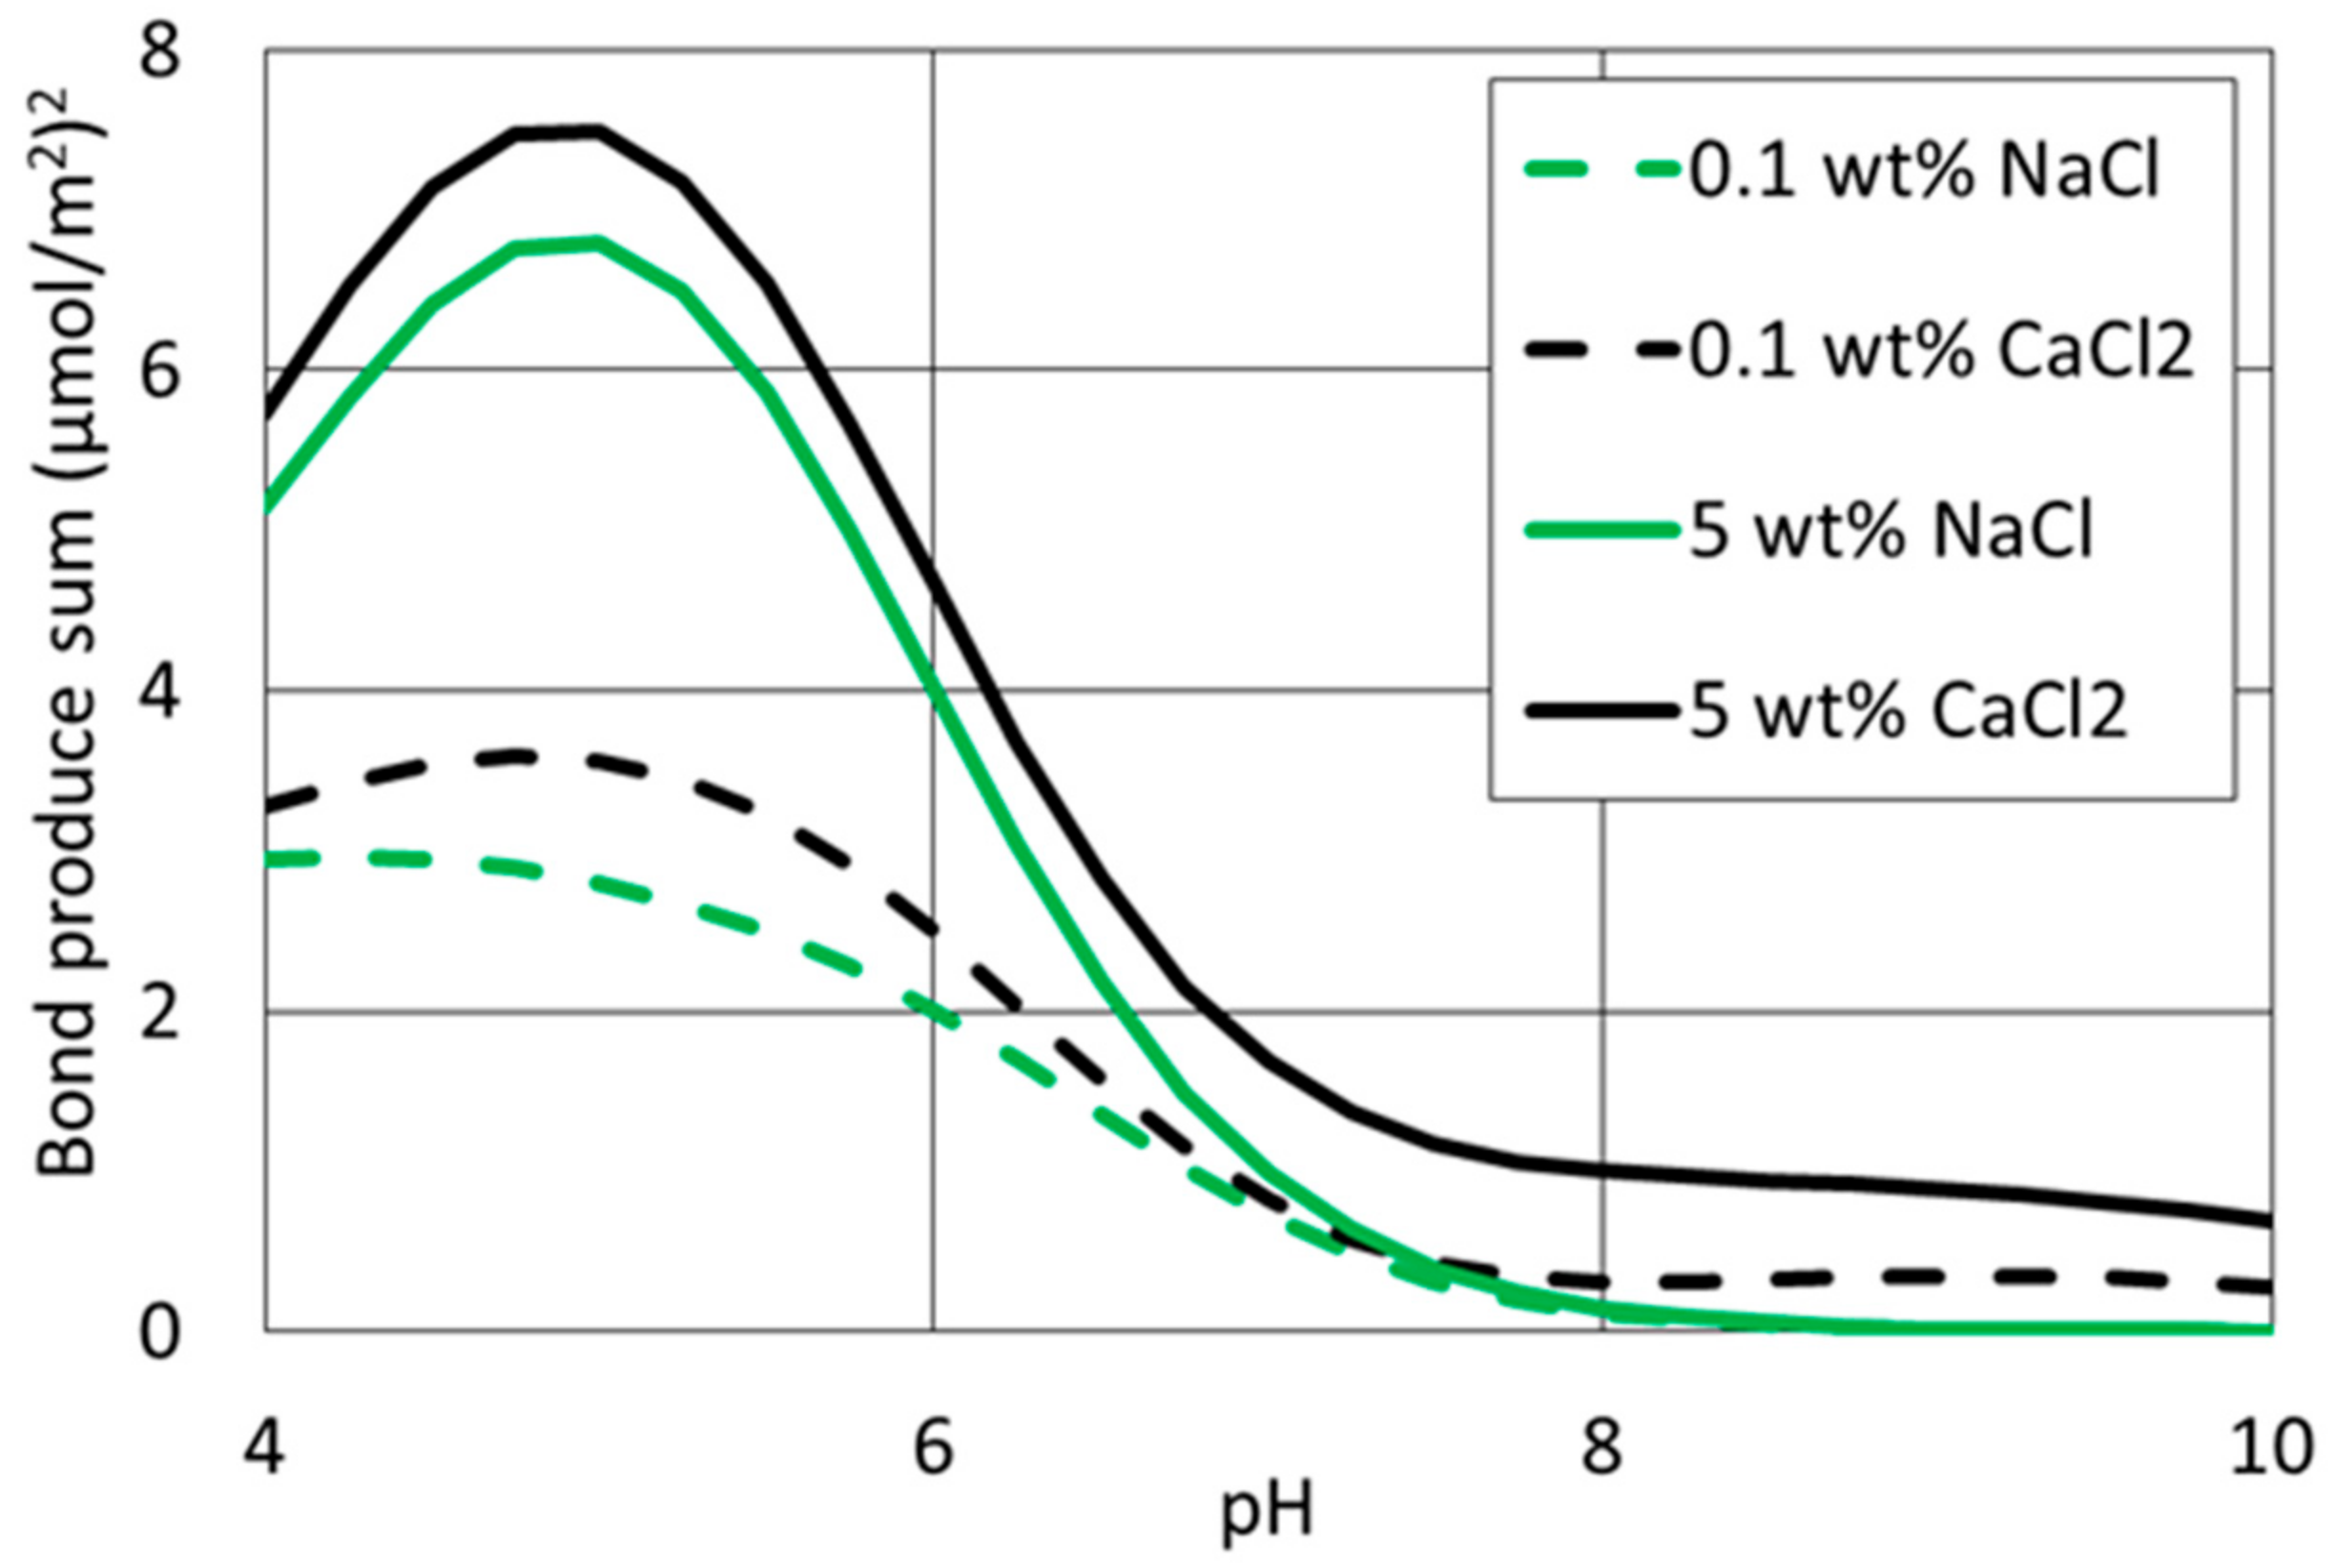
4.4. Surface Complexation Modelling

A geochemical model developed by Brady et al. [20] was used to calculate the number of charged species that are thought to cause local adhesion of the oil/brine interface to the brine/kaolinite interface, hence wetting. The bond product sum counts the number of electrostatic connections between the two. Surface complexation modelling (and DLVO theory) presumes an electric double layer at each interface and the existence of charged surface species whose concentrations depend upon the chemical makeup of the water and the oil and mineral surface [35]. In the surface complexation model, the kaolinite surface area was assumed as 10 m2/g with site density of 10 μmol/m2 [36]. The chemical reactions on the surface of kaolinite can be described by the reactions in Table 1. We used 25 °C Log K for all of the chemical reactions in Table 1 because water chemistry dominates the surface complexation of the oil/brine/rock system and temperature plays a secondary effect [35]. The surface species concentrations were calculated using PHREEQC version 3.3.9 (Parkhurst and Appelo 2013) and a diffuse layer surface model. Due to the fact that Ca2+ and Mg2+ have similar charge density, thus almost same disjoining pressure [34], we did not calculate the surface complexation in the presence of MgCl2, but NaCl and CaCl2 with concentration of 0.1 and 5 wt % were included this section. It is also worth noting that, in our geochemical modelling, we did not consider the interaction between non-polar oil and calcite surfaces, e.g., hydrogen bonding, van der Waals interaction, ligand bridging, etc.
Figure 5 shows that the number of -NH+ decreased with increasing pH regardless of ion type and concentration due to Reaction (1) shifting towards right-hand side. For example, in the presence of 0.1 wt% NaCl, the number of surface density of oil/brine decreased from 4.0 to almost 0 µmol/m2 as pH increased from 4 to 10. Similarly, the site density decreased from 4.2 to almost 0 µmol/m2 with increasing pH from 4 to 10 in the presence of 0.1 wt% CaCl2. Likewise, at concentration of 5 wt%, both NaCl and CaCl2 followed the same trend, showing that the number of site density decreased with increasing pH. The same trend was observed by Brady et al. [20], who showed that –NH+ decreases from 6.5 µmol/m2 to nearly 0 as pH increases from 4 to 9 in the presence of 1.0 M NaCl. This is attributed to Reaction (1) shifting towards right-hand side, thus decreasing the number of –NH+ with increasing pH.
Ion type regulated the type of surface species. For example, -COOCa+ and –COO appeared in the presence of CaCl2, whereas only –COO appeared in the presence of NaCl. This is because Reaction (3) does not take place with absence of Ca2+. Figure 6 shows the concentration of surface species at oil/brine surfaces for the concentration from 0 to 1 µmol/m2. Because the experimental oil had AN/BN around 0.08, the variation of –COO and –COOCa+ with pH is less pronounced compared to -NH+ (Figure 5).
Apart from pH and brine type, ion concentration also affected the number of surface species at oil/brine interfaces. For example, at pH < 6.5, increasing salinity increased the number of -NH+, whereas a shift was observed at pH = 6.5. Moreover, increasing CaCl2 increased the number of –COOCa+ due to Reaction (3) shifting towards right-hand side (Figure 6). For example, at pH = 6, 0.1 wt % CaCl2 showed –COOCa+ of 0.012 µmol/m2. Rather, 5 wt % CaCl2 showed –COOCa+ of 0.23 µmol/m2. On the contrary, the number of –COO decreased in the presence of 5 wt % CaCl2 compared to 0.1 wt % CaCl2. However, the concentration of NaCl did not affect the number of surface species of –COO (Figure 6) due to the absence of Ca2+. the concentration of ions influence the activity of H+ regardless of the ion type [20]. We believe that the high salinity compensates the degree of deprotonation, thus triggering more –NH+ in the high salinity brine.
Site density (>AlO + >SiO) of brine/kaolinite increased with increasing pH in the presence of NaCl regardless of concentration due to Reactions (5) and (6) shifting towards right-hand side (Figure 7). Given that >AlO and >SiO are negatively charged, both were added together and termed site density of >Al:SiO- (Figure 7). For example, the number of >Al:SiO- increased from 0.7 to 3.5 µmol/m2 as pH increased from 4 to 10 in the presence of NaCl at concentration of 0.1 wt %. The same trend was observed in the presence of NaCl at concentration of 5 wt %, but with higher site density. We believe this is largely because increasing NaCl concentration increases the activity coefficient of >AlO and >SiO. Electrolyte, CaCl2, followed the same trend as NaCl, whereas the number of >Al:SiO decreased as pH > 8.5 for 5 wt % CaCl2, and pH > 9.2 for 0.1 wt % CaCl2 (Figure 7). This shift stems from Reactions (7) and (8), showing that further increasing pH generates more >AlOCa+ and >SiOCa+ in line with Figure 7. It is worth noting that 0.1 wt % CaCl2 yielded a greater number of >SiOCa+ that 5 wt % CaCl2. We also believe increasing Ca2+ increasing the activity coefficient of >AlO and >SiO, thus more >Al:SiO, but less >SiOCa+. This implies that more bridges likely be generated between -COOCa+ and >Al:SiO in the presence of high concentration of Ca2+, thus a more oil-wet system.
Bond product sum (BPS) decreased with increasing pH as pH > 5 for all of the brines (Figure 8), implying a more water-wet system. For example, in the presence of 5 wt % CaCl2, bond product sum decreased from 7.4 to 0.7 µmol/m2 as pH increased from 5 to 10. Likewise, bond product sum decreased from 3.6 to 0.3 µmol/m2 in the presence of 0.1 wt % CaCl2 as pH increases from 4 to 10. Note that NaCl at concentration of 0.1 and 5 wt % followed the same trend with CaCl2 (Figure 8). Similar results were also observed by Brady et al. [20] who showed that increasing pH from 4 to 9 triggers BPS decreasing from 0.42 to almost 0 µmol/m2 using an oil with AN/BN = 0. Likewise, Xie et al. [35] showed that BPS decreases from 2.8 to 1.6 µmol/m2 with pH increases from 7 to 10 using an oil with AN = 3.98 and BN = 1.3 mg KOH/g. Together, BPS results suggest that increasing pH likely decreases the adhesion between oil/brine and brine/kaolinite, thus a more water-system, which in return facilitates water uptake in shales because capillary forces would be driving forces. It is worth noting that oil composition (AN/BN) also affects the variation of bond product sum with pH, which was also documented by Brady et al. [20].
Increasing salinity increased bond product sum at a given pH (Figure 8), suggesting a more oil-wet system. For example, at pH = 6, 5 wt % NaCl gave a BPS of 4 (µmol/m2)2, but 0.1 wt% NaCl gave a BPS of 2 (µmol/m2)2. Similarly, at pH = 6, 5 wt % CaCl2 gave a BPS of 4.7 (µmol/m2)2, whereas 0.1 wt % CaCl2 gave a BPS of 2.5 (µmol/m2)2. Similar results were also reported by Brady et al. [20], who showed that high salinity NaCl gave a BPS of 0.3 (µmol/m2)2, but low salinity NaCl leads to a BPS of 0.15 µmol/m2 using an oil with AN/BN = 0.
Divalent cations gave a higher bond product than monovalent cations at pH < 7.5 (Figure 8), suggesting that divalent cations may bridge the interface of oil/brine and brine/kaolinite, thus a more oil-wet system. For instance, at pH = 6, 0.1 wt % NaCl showed a BPS of 2 (µmol/m2)2, but 0.1 wt % CaCl2 showed 2.5 (µmol/m2)2, implying a more oil-wet system. Similarly, 5 wt % NaCl showed a BPS of 4 (µmol/m2)2, but CaCl2 showed a BPS of 4.7 (µmol/m2)2 at the same concentration. Similar results were also reported by Brady et al. [35], who showed that, at the same salinity level (142,430 mg/L), formation brine (with presence of divalent cations) triggers a greater BPS compared to softened brine (same salinity as formation brine, but with absence of divalent cations).
Therefore, we believe that injecting low salinity water or remove divalent cations from the hydraulic fracturing fluids likely causes a strong water-wet system, thus prevails water uptake due to capillary pressures acting as driving forces. In addition, note that low salinity water and softened brines (with absence of divalent cations) trigger a pH increase in a range of 1 to 3 due to ion exchange [21,37]. Thus, the bond product sum (Figure 8) would further decrease to exhibit a more water-wet system, favouring water uptake in shale reservoirs. This explains why Fakcharoenphol et al. [12] observed low salinity water (20,000 ppm KCl) significantly improves spontaneous imbibition recovery compared to high salinity water (282,000 ppm). This also explains why Xu et al. [13] observed that increasing the NaCl concentration decreases the brine uptake for all samples.

5. Implications and Conclusions

Hydraulic fracturing appears to be a cost-effective means to unlock the hydrocarbon resources from shale gas and shale oil reservoirs. However, low recovery of hydraulic fracturing fluids has been the centre of attention from technical and environmental perspectives [2]. In this study, we measured a suite of zeta potentials of oil/brines and brine/minerals, and tested the effect of ion type (NaCl, MgCl2 and CaCl2) and concentrations (0.1, 1, and 5 wt %). Further, we combined disjoining pressure and geochemical modelling to gain a deeper understanding of wettability of oil/brine/minerals system.
Disjoining pressure results show that divalent cations (Ca2+ and Mg2+) compressed the double layer, thus increasing the adhesion between oil and minerals, and triggering an oil-wet system [27,34]. Surface complexation shows that divalent cations (Ca2+ and Mg2+) electrostatically linked oil and clays [35]. Together, increasing divalent cations (Ca2+ and Mg2+) increases oil–clay adhesion, thereby producing a more oil-wet system.
Disjoining pressure shows that increasing salinity compressed the double layer, thus producing a more oil-wet system. Surface complexation shows that increasing salinity increased the site density of oppositely charged surface species, which made oil and clay link more strongly [35]. Together increasing salinity increases oil–clay adhesion, thus producing a more oil-wet system.
Surface complexation shows that pH changes the number of charged surface species at oil and clay surfaces, which increases oil–clay adhesion in those cases where the surface species on the oil and clay are oppositely charged [20]. DLVO shows that pH changes the zeta potential, thus alters the double layer expansion and disjoining pressure [27].
In conclusion, combining surface complexation modelling and DLVO theory sheds light on water uptake into shale oil and gas reservoirs during hydraulic fracturing. We believe that the combination of the approaches can be also used to understand the wetting in the presence of edge charged clays (e.g., illite, smectite, and chlorite), and organic matters.

Author Contributions

Q.X. performed the zeta potential tests and wrote the manuscript. Y.C. performed the surface complexation modelling. L.Y. provided methodology and resources. A.S. and M.M.H. contributed from the scientific significance including editing the content, and improved the paper. All authors contributed to scientific discussions.

Funding

This work was supported by a grant from the Natural Science Foundation of China (No. 51674209), Sichuan Province Youth Science and technology innovation team project for unconventional reservoir damage control (2016TD0016).

Acknowledgments

We would be grateful for constructive comments from anonymous reviewers. We also appreciate helpful conversations with Patrick V. Brady for the surface complexation modelling.

Conflicts of Interest

The authors declare no conflict of interest.

References

  1. Pierre Gadonneix, A.S.; Liu, T. 2013 World Energy Issues Monitor; Pierre Gadonneix, World Energy Council: London, UK, 2013. [Google Scholar]
  2. Roshan, H.; Al-Yaseri, A.Z.; Sarmadivaleh, M.; Iglauer, S. On wettability of shale rocks. J. Colloid Interface Sci. 2016, 475, 104–111. [Google Scholar] [CrossRef] [PubMed]
  3. Sheng, J.J. Critical review of field EOR projects in shale and tight reservoirs. J. Pet. Sci. Eng. 2017, 159, 654–665. [Google Scholar] [CrossRef]
  4. Engelder, T.; Cathles, L.M.; Bryndzia, L.T. The fate of residual treatment water in gas shale. J. Unconv. Oil Gas Resour. 2014, 7, 33–48. [Google Scholar] [CrossRef]
  5. Dehghanpour, H.; Zubair, H.A.; Chhabra, A.; Ullah, A. Liquid Intake of Organic Shales. Energy Fuels 2012, 26, 5750–5758. [Google Scholar] [CrossRef]
  6. Ghanbari, E.; Dehghanpour, H. Impact of rock fabric on water imbibition and salt diffusion in gas shales. Int. J. Coal Geol. 2015, 138, 55–67. [Google Scholar] [CrossRef]
  7. Dehghanpour, H.; Lan, Q.; Saeed, Y.; Fei, H.; Qi, Z. Spontaneous Imbibition of Brine and Oil in Gas Shales: Effect of Water Adsorption and Resulting Microfractures. Energy Fuels 2013, 27, 3039–3049. [Google Scholar] [CrossRef]
  8. Makhanov, K.; Habibi, A.; Dehghanpour, H.; Kuru, E. Liquid uptake of gas shales: A workflow to estimate water loss during shut-in periods after fracturing operations. J. Unconv. Oil Gas Resour. 2014, 7, 22–32. [Google Scholar] [CrossRef]
  9. Binazadeh, M.; Xu, M.; Zolfaghari, A.; Dehghanpour, H. Effect of Electrostatic Interactions on Water Uptake of Gas Shales: The Interplay of Solution Ionic Strength and Electrostatic Double Layer. Energy Fuels 2016, 30, 992–1001. [Google Scholar] [CrossRef]
  10. Roshan, H.; Andersen, M.S.; Rutlidge, H.; Marjo, C.E.; Acworth, R.I. Investigation of the kinetics of water uptake into partially saturated shales. Water Resour. Res. 2016, 52, 2420–2438. [Google Scholar] [CrossRef]
  11. Roshan, H.; Ehsani, S.; Marjo, C.E.; Andersen, M.S.; Acworth, R.I. Mechanisms of water adsorption into partially saturated fractured shales: An experimental study. Fuel 2015, 159, 628–637. [Google Scholar] [CrossRef]
  12. Fakcharoenphol, P.; Kurtoglu, B.; Kazemi, H.; Charoenwongsa, S.; Wu, Y.-S. The Effect of Osmotic Pressure on Improve Oil Recovery from Fractured Shale Formations; Society of Petroleum Engineers: Woodlands, TX, USA, 2014. [Google Scholar]
  13. Xu, M.; Dehghanpour, H. Advances in Understanding Wettability of Gas Shales. Energy Fuels 2014, 28, 4362–4375. [Google Scholar] [CrossRef]
  14. Buckley, J.S.; Takamura, K.; Morrow, R.N. Influence of electrical surface charges on the wetting properties of crude oils. SPE Reserv. Eng. 1989, 4, 332–342. [Google Scholar] [CrossRef]
  15. Hirasaki, G.J. Wettability: Fundamentals and surface forces. SPE Form. Eval. 1991, 6, 217–226. [Google Scholar] [CrossRef]
  16. Matthiesen, J.; Hassenkam, T.; Bovet, N.; Dalby, K.N.; Stipp, S.L.S. Adsorbed Organic Material and Its Control on Wettability. Energy Fuels 2017, 31, 55–64. [Google Scholar] [CrossRef]
  17. Wu, J.; Liu, F.; Yang, H.; Xu, S.; Xie, Q.; Zhang, M.; Chen, T.; Hu, G.; Wang, J. Effect of specific functional groups on oil adhesion from mica substrate: Implications for low salinity effect. J. Ind. Eng. Chem. 2017, 56, 342–349. [Google Scholar] [CrossRef]
  18. Myint, P.C.; Firoozabadi, A. Thin liquid films in improved oil recovery from low-salinity brine. Curr. Opin. Colloid Interface Sci. 2015, 20, 105–114. [Google Scholar] [CrossRef] [Green Version]
  19. Brady, P.V.; Bryan, C.R.; Thyne, G.; Li, H. Altering wettability to recover more oil from tight formations. J. Unconv. Oil Gas Resour. 2016, 15, 79–83. [Google Scholar] [CrossRef] [Green Version]
  20. Brady, P.V.; Morrow, N.R.; Fogden, A.; Deniz, V.; Loahardjo, N. Electrostatics and the Low Salinity Effect in Sandstone Reservoirs. Energy Fuels 2015, 29, 666–677. [Google Scholar] [CrossRef]
  21. Austad, T.; Rezaeidoust, A.; Puntervold, T. Chemical Mechanism of Low Salinity Water Flooding in Sandstone Reservoirs; Society of Petroleum Engineers: Tulsa, Oklahoma, USA, 2010. [Google Scholar]
  22. Zhang, D. Surfactant-Enhanced Oil Recovery Process for a Fractured, Oil-Wet Carbonate Reservoir; RICE University: Houston, TX, USA, 2006. [Google Scholar]
  23. Busireddy, C.; Rao, D.N. Application of DLVO Theory to Characterize Spreading in Crude Oil-Brine-Rock Systems. In Proceedings of the SPE/DOE Symposium on Improved Oil Recovery, Tulsa, OK, USA, 22–26 April 2004; Society of Petroleum Engineers: Tulsa, Oklahoma, USA, 2004. [Google Scholar]
  24. Melrose, J. Interpretation of mixed wettability states in reservoir rocks. In Proceedings of the SPE Annual Technical Conference and Exhibition, New Orleans, LA, USA, 26–29 September 1982. [Google Scholar]
  25. Gregory, J. Interaction of unequal double layers at constant charge. J. Colloid Interface Sci. 1975, 51, 44–51. [Google Scholar] [CrossRef]
  26. Hirasaki, G. Interfacial Phenomina in Petroleum Recovery; Marcel Dekker: New York, NY, USA, 1991; Chapter 3. [Google Scholar]
  27. Nasralla, R.A.; Nasr-El-Din, H.A. Impact of cation type and concentration in injected brine on oil recovery in sandstone reservoirs. J. Pet. Sci. Eng. 2014, 122, 384–395. [Google Scholar] [CrossRef]
  28. Chen, L.; Zhang, G.; Wang, L.; Wu, W.; Ge, J. Zeta potential of limestone in a large range of salinity. Colloids Surf. A Physicochem. Eng. Asp. 2014, 450, 1–8. [Google Scholar] [CrossRef]
  29. Tokunaga, T.K. DLVO-based estimates of adsorbed water film thicknesses in geologic CO2 reservoirs. Langmuir 2012, 28, 8001–8009. [Google Scholar] [CrossRef] [PubMed]
  30. Nyström, R.; Lindén, M.; Rosenholm, J.B. The Influence of Na+, Ca2+, Ba2+, and La3+ on the ζ Potential and the Yield Stress of Calcite Dispersions. J. Colloid Interface Sci. 2001, 242, 259–263. [Google Scholar] [CrossRef]
  31. Takahashi, S.; Kovscek, A.R. Wettability estimation of low-permeability, siliceous shale using surface forces. J. Pet. Sci. Eng. 2010, 75, 33–43. [Google Scholar] [CrossRef]
  32. Israelachvili, J.N. Chapter 14—Electrostatic Forces between Surfaces in Liquids. In Intermolecular and Surface Forces, 3rd ed.; Israelachvili, J.N., Ed.; Academic Press: San Diego, CA, USA, 2011; pp. 291–340. [Google Scholar]
  33. Israelachvili, J.N. Chapter 13—Van der Waals Forces between Particles and Surfaces. In Intermolecular and Surface Forces, 3rd ed.; Israelachvili, J.N., Ed.; Academic Press: San Diego, CA, USA, 2011; pp. 253–289. [Google Scholar]
  34. Xie, Q.; Saeedi, A.; Pooryousefy, E.; Liu, Y. Extended DLVO-based estimates of surface force in low salinity water flooding. J. Mol. Liq. 2016, 221, 658–665. [Google Scholar] [CrossRef]
  35. Xie, Q.; Brady, P.V.; Pooryousefy, E.; Zhou, D.; Liu, Y.; Saeedi, A. The low salinity effect at high temperatures. Fuel 2017, 200, 419–426. [Google Scholar] [CrossRef]
  36. Brady, P.V.; Thyne, G. Functional Wettability in Carbonate Reservoirs. Energy Fuels 2016, 30, 9217–9225. [Google Scholar] [CrossRef]
  37. RezaeiDoust, A.; Puntervold, T.; Austad, T. Chemical Verification of the EOR Mechanism by Using Low Saline/Smart Water in Sandstone. Energy Fuels 2011, 25, 2151–2162. [Google Scholar] [CrossRef]
Figure 1. Zeta potential of oil/brine with various ion types and concentrations.
Energies 11 01666 g001
Figure 2. Zeta potential of brine/kaolinite with various ion types and concentrations.
Energies 11 01666 g002
Figure 3. Total disjoining pressure, under constant reduced potential, versus interfacial separation of kaolinite and Oil A with presence of various cation types.
Energies 11 01666 g003
Figure 4. Total disjoining pressure, under constant reduced potential, versus interfacial separation of kaolinite and Oil A with presence of various concentration of NaCl.
Energies 11 01666 g004
Figure 5. Site density on surfaces of oil/brine vs. pH at various ion type and concentration.
Energies 11 01666 g005
Figure 6. Site density on surfaces of oil/brine vs. pH at various ion type and concentration (this is a plot to particularly observe the site density in a range of 0 to 1 µmol/m2).
Energies 11 01666 g006
Figure 7. Site density on brine/kaolinite surfaces vs. pH at various ion type and concentration.
Energies 11 01666 g007
Figure 8. Bond product sum vs. pH with various ion type and concentration.
Energies 11 01666 g008
Table 1. Surface complexation model input parameters [20].
InterfaceReactionLog K (25 °C)Reaction
oil/brine-NH+ ↔ -N + H+−6.01
-COOH ↔ -COO- + H+−5.02
-COOH + Ca2+ ↔ -COOCa+ + H+−3.83
kaolinite/brine>AlOH2+ ↔ >AlOH + H+−3.04
>AlOH ↔ >AlO + H+−3.85
>SiOH ↔ >SiO + H+−7.06
>AlOH + Ca2+ ↔ >AlOCa+ + H+−9.77
>SiOH + Ca2+ ↔ >SiOCa+ + H+−9.78
>AlOH + CaOH+ ↔ >AlOCaOH + H+−4.59
>SiOH + CaOH+ ↔ >SiOCaOH + H+−4.510
Note: where “>” denotes a site on the clay surfaces while “-” denotes a site on the oil surface. Also, in the surface complexation modelling, acid number = 0.2 and base number = 2.6 mg (KOH/g) of the oil, which were used to calculate the oil/brine surface species.

