Article

Valorization of Waste Wood as a Solid Fuel by Torrefaction

1
Waste & Biomass Energy Technology Center, Kongju National University, 1223-24 Cheonan-Daero, Seobuk, Chungnam 330-717, Korea
2
Department of Environmental Engineering, Kongju National University, 1223-24 Cheonan-Daero, Seobuk, Chungnam 330-717, Korea
*
Author to whom correspondence should be addressed.
Energies 2018, 11(7), 1641; https://doi.org/10.3390/en11071641
Submission received: 8 May 2018 / Revised: 31 May 2018 / Accepted: 15 June 2018 / Published: 23 June 2018
(This article belongs to the Special Issue Biofuel and Bioenergy Technology)

Abstract

:
The aim of this study was to investigate the optimal temperature range for waste wood and the effect torrefaction residence time had on torrefied biomass feedstock. Temperature range of 200–400 °C and residence time of 0–50 min were considered. In order to investigate the effect of temperature and residence time, torrefaction parameters, such as mass yield, energy yield, volatile matter, ash content and calorific value were calculated. The Van Krevelen diagram was also used for clarification, along with the CHO index based on molecular C, H, and O data. Torrefaction parameters, such as net/gross calorific value and CHO increased with an increase in torrefaction temperature, while a reduction in energy yield, mass yield, and volatile content were observed. Likewise, elevated ash content was observed with higher torrefaction temperature. From the Van Krevelen diagram, it was observed that at 300 °C the torrefied feedstock came in the range of lignite. With better gross calorific value and CHO index, less ash content and nominal mass loss, 300 °C was found to be the optimal torrefaction temperature for waste wood.

1. Introduction

In recent years, biomass has obtained remarkable attention because of the potential it holds to replace the energy derived from fossil fuel. Biomass is considered to be an important renewable fuel and the most widespread technology, and can be grouped into thermochemical (torrefaction, pyrolysis, combustion, etc.), chemical (alkaline hydrolysis, etc.) and biochemical (fermentation, anaerobic digestion, etc.) categories [1]. Biomass can be considered as a flexible source of energy as it can be transformed into numerous energy products, for instance, bio-oil, syngas, and so forth. However, biomass has numerous challenges, such as but not limited to, high moisture content, poor grindability, hydroscopicity, low heating value, fibrous in nature, and so forth. [2,3]. These challenges confine the combustion performance and escalate the handling and transportation cost of biomass. Therefore, in order to overcome these challenges, several pretreatment approaches have been suggested. Thermal degradation of woody biomass is a complex topic in itself and comprises of numerous fractions with various thermal behaviors [4].
One of the promising approaches is to pretreat the biomass in the temperature range from 200–300 °C in an inert environment, described as torrefaction. Torrefaction improves the dimensional stability and durability of the wood [5]. This advancement can be curbed by the wood’s moisture; therefore, the reduction of the wood’s moisture content is a must. In addition, the grindability of the wood increases with torrefaction and reduces the energy required [6]. This reduction in wood commination serves as major advantages for numerous energy derived applications, such as co-firing, cement kilns, steel industry, coke, and so forth. [7]. Moreover, torrefied biomasses are more suitable for further energy conversion processes, such as fast pyrolysis [8], gasification [9], and in the steel industry, as a substitute for coke [10]. However, Koppenjan et al. [11] highlights the need to address numerous issues, such as energy integration, volatile gases handling and the applicability of feedstock for the advancement of torrefaction technologies. In addition, in spite of these advantages, some of the detrimental effects are related to torrefaction degradation of strength and toughness [12,13]. The reduction in the cohesive nature of wood is associated with the disintegration of the hemicellulose matrix and depolymerization of cellulose during torrefaction [14]. Although not spread in a large commercial scale, there has been an enormous amount of studies for torrefaction of biomass in the last decade. For instance, a comprehensive study by Rodriques et al. [15] evaluates the potential torrefaction enhancement for production of bioenergy in Portugal. Similarly, Li et al. [16] highlights the advantages of carbon dioxide torrefaction, such as elevated thermal stability and combustion reactivity. In addition, Benavente and Fullana [17] utilized two-phase olive mill waste (TPOMW) to determine the optimum torrefaction temperature range, and concluded that torrefaction of TPOMW around 200 °C min−1 is best for energy utilization. The assessment of the overall product yield, right from the production of the raw materials to the utilization of the final energy, can be carried out by conducting Life Cycle Assessment scenarios [18].
Decisive parameters like temperature, residence time, or properties of torrefaction products, have crucial impact on torrefaction behavior, properties of the torrefied product, and comprehensive mass and energy conversion efficacy [19]. However, the characteristic feature of the biomass material used for torrefaction cannot be overlooked. The main objective of the present work is to study the effect torrefaction has on the thermochemical properties of wood. The torrefied wood properties are based on the Gross Calorific Value (GCV) (MJ/kg), elemental composition, proximate and gas analysis, and energy yield (Yenergy (%)) and mass yield (Ymass (%)). The result of this work is to define the optimal torrefaction temperature range for waste wood suitable for other energy conversion processes or energy production use.

2. Materials and Methods

The following sections elaborate the reactor, equations and experimental setup of the process for this study.

2.1. Materials

In this study, waste wood was investigated. The mixed waste wood collected from a waste wood collection center in Cheonan, South Korea was first screened, and all the non-woody and coarse parts were removed. The waste wood was homogeneously mixed and dried at 105 °C for 24 h for the torrefaction experiment. In Table 1, the properties of waste wood indicates about 13.5% moisture content, 1.5% ash content and 20.6 MJ/kg GCV. The inorganic components of the raw waste wood are referred as “other” in the table.

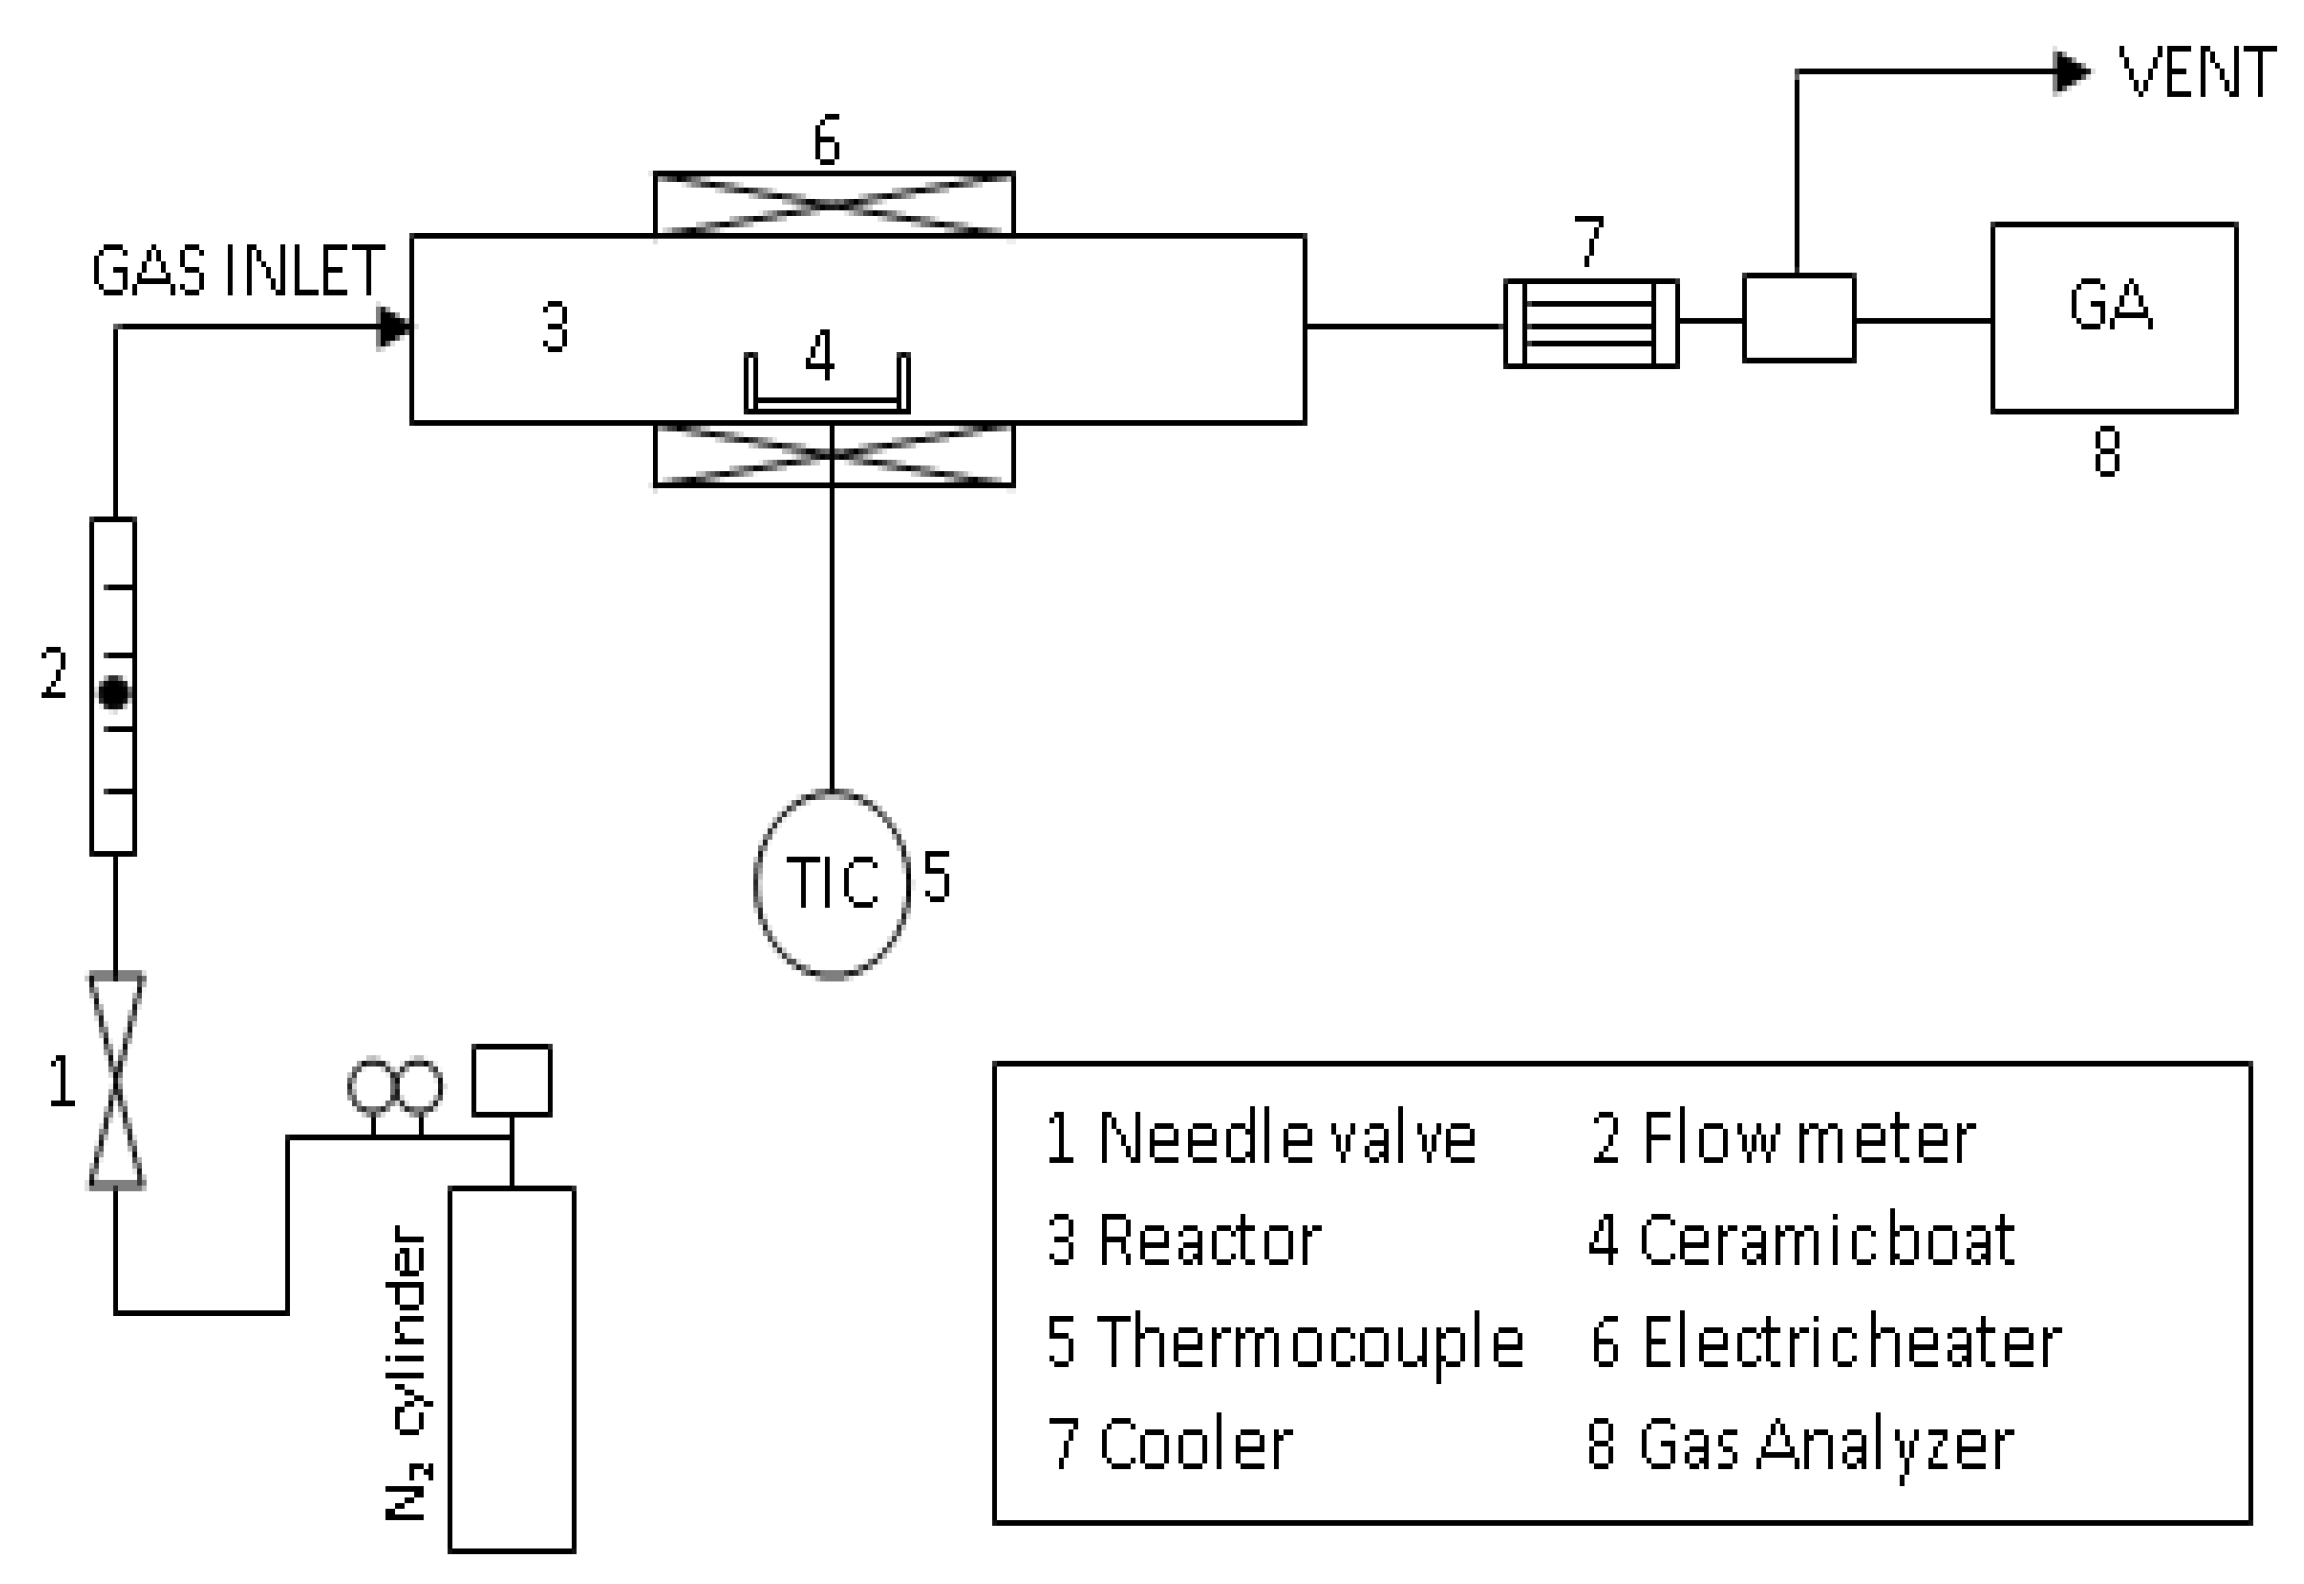
2.2. Torrefaction Experiment Setup and Procedure

The schematic diagram of the horizontal tubular reactor used for this study is illustrated in Figure 1. The internal diameter and length of the reactor were 150 mm and 60 mm, respectively. For each experimental run, 20 g of sample were weighed and flushed with nitrogen (21 min−1) until the level of oxygen was below 1%. Torrefaction was then carried out for the temperature range of 200–400 °C for a residence time of 0–50 min. After completion of each experiment, the sample was removed from the reactor and was weighed. The initial and final weights of the samples were measured to determine mass yield (Ymass (%)), which was calculated with Equation (1):
Mass   Yield   ( Y mass ( % ) ) = mass   after   torrefaction mass   of   raw   sample ×   100 %
In addition, the GCV of the raw and torrefied biomass was measured using bomb calorimeter (Parr Instrument Co., Model 1672, Moline, IL, USA) and the energy yield (Yenergy (%)) was calculated using Equation (2):
Energy   Yield   ( Y energy ( % ) ) = Y mass × HHV   ( torrefied   sample ) HHV ( raw   sample ) × 100 %
Thermogravimetric analysis (TGA) was carried out using a thermogravimetric analyzer (TA Instruments, Q50, New Castle, DE, USA), 5 mg of sample was placed in a crucible and the experiment was conducted in an inert environment with a nitrogen flow rate of 60 mL·min−1. The temperature range was allowed to rise up to 600 °C during various heating rates, ranging from 10–30 °C·min−1. The changes in the atomic composition of waste wood were investigated by using the Van Krevelen diagram. It is constructed using the molar ratio of hydrogen:carbon (hydrogen index) as the ordinate to the molar ratio of oxygen:carbon (oxygen index) in the abscissa. The raw and torrefied waste wood were plotted, and the specific location of these plots helped to identify the alterations in the atomic composition of torrefied waste wood.

3. Results and Discussions

In this study, parameters such as thermogravimetric analysis, effect of torrefaction temperature and residence time on torrefied product, and heavy metal analysis were used for the determination of optimal temperature range for torrefaction of waste wood.

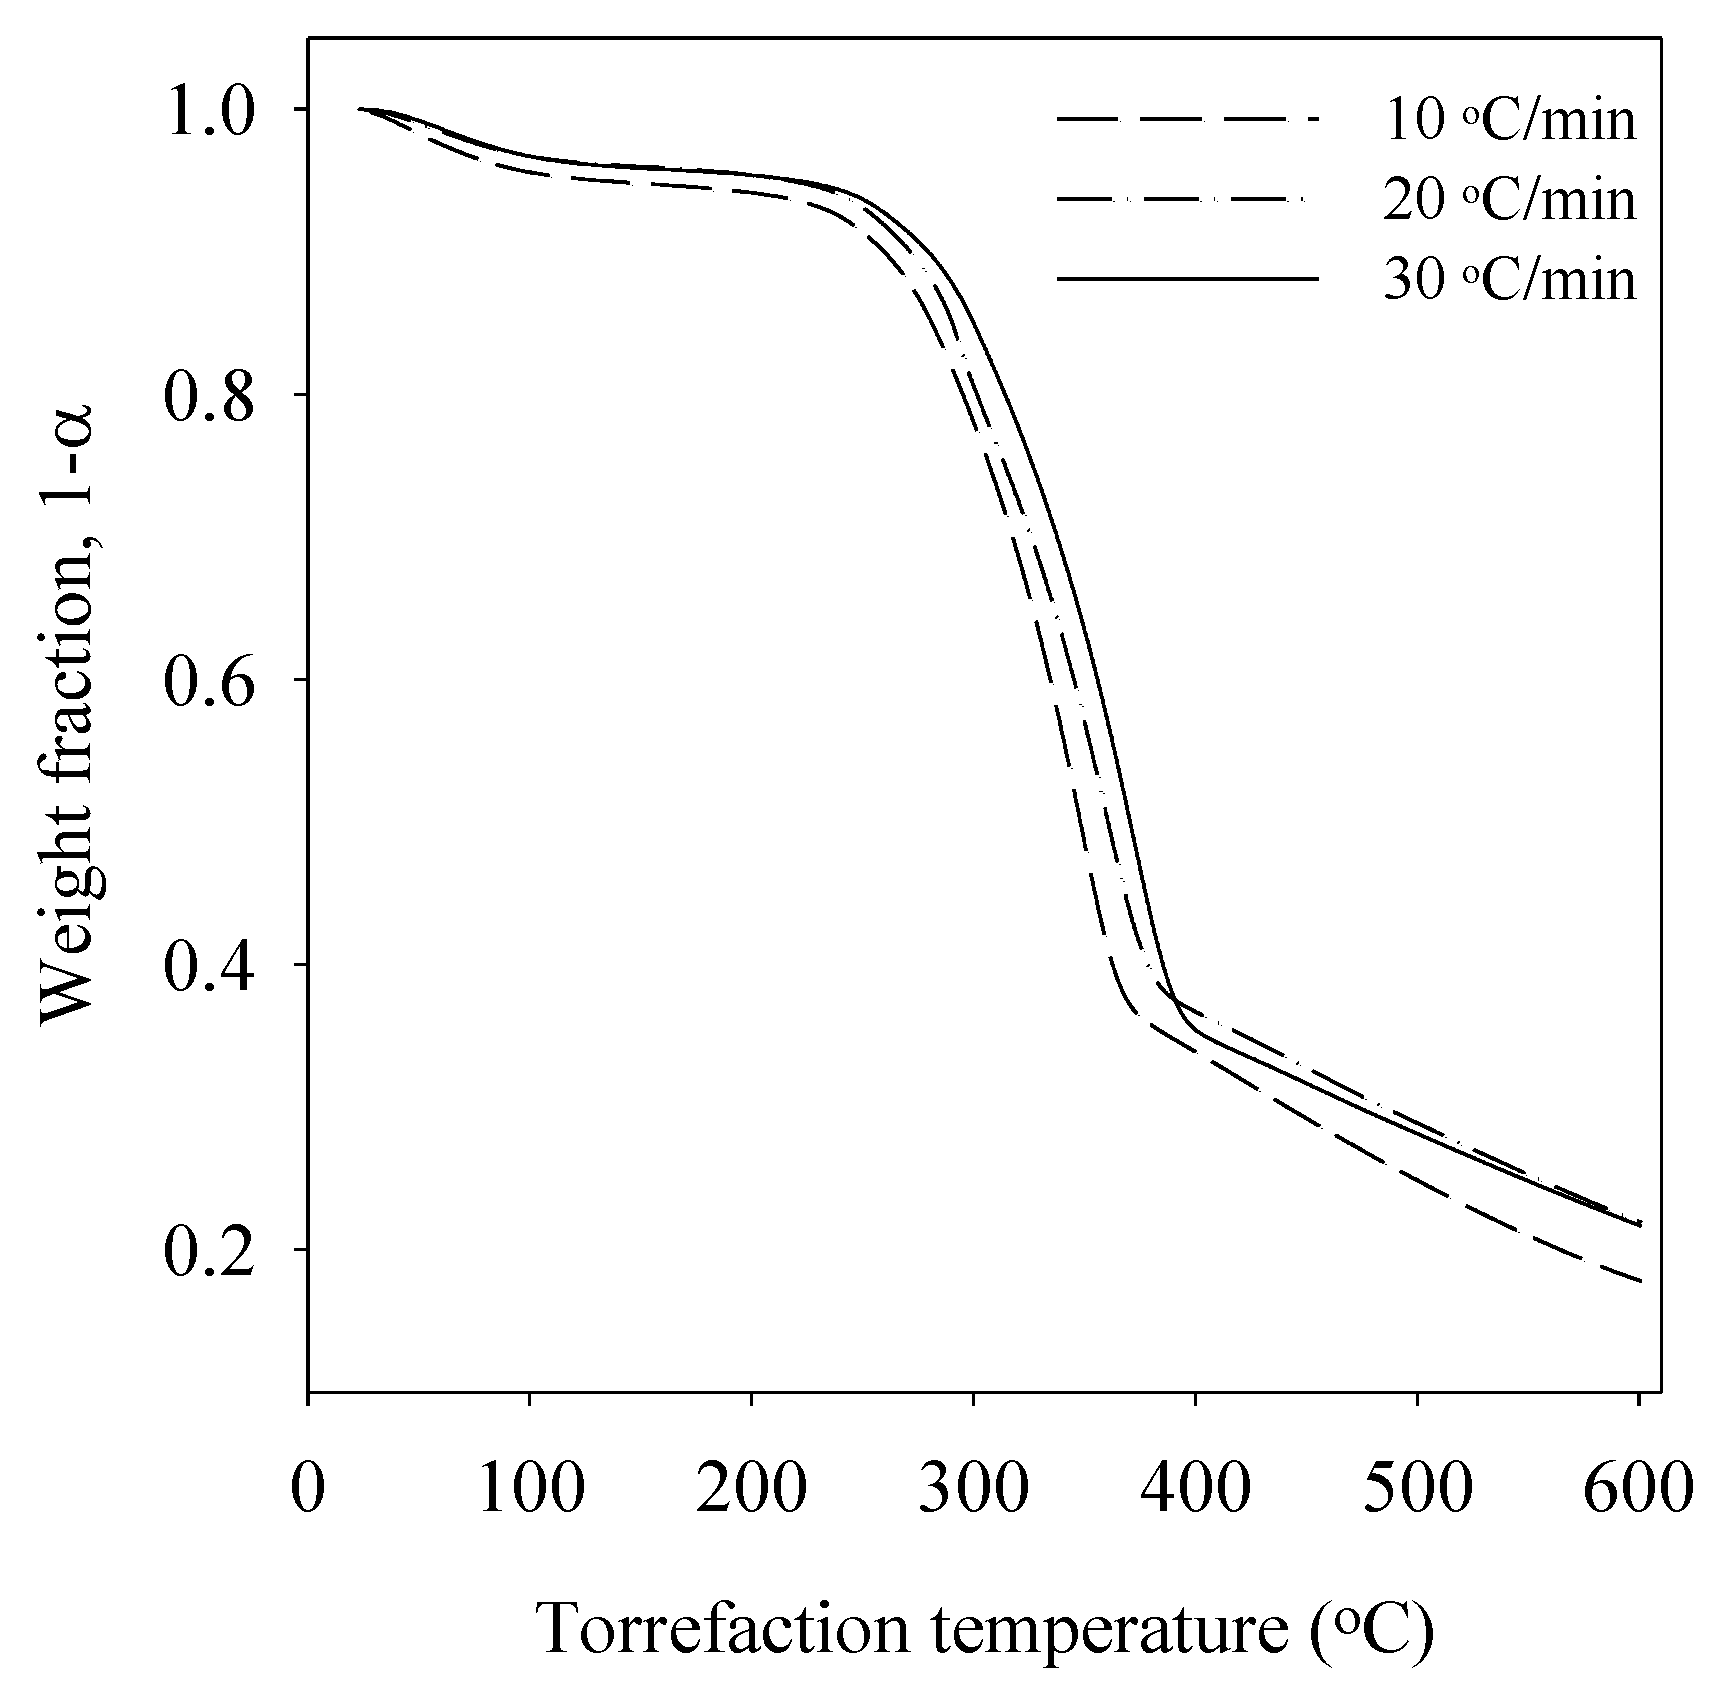
3.1. Thermogravimetric Analysis

The weight loss characteristics of waste wood as a function of torrefaction temperature are illustrated in Figure 2. It can be seen from the figure, that until 250 °C, there was no significant weight loss for all three heating rates. However, the bulk weight loss of the waste wood is in the temperature range of 250–370 °C. There was an insignificant difference in the weight loss with respect to heating rate, i.e., although the weight loss for the heating rate of 30 °C·min−1 was highest followed by 20 °C·min−1 and the lowest was for 10 °C and the differences were minimal. After the main decomposition, i.e., after 370 °C, weight loss was relatively slow.

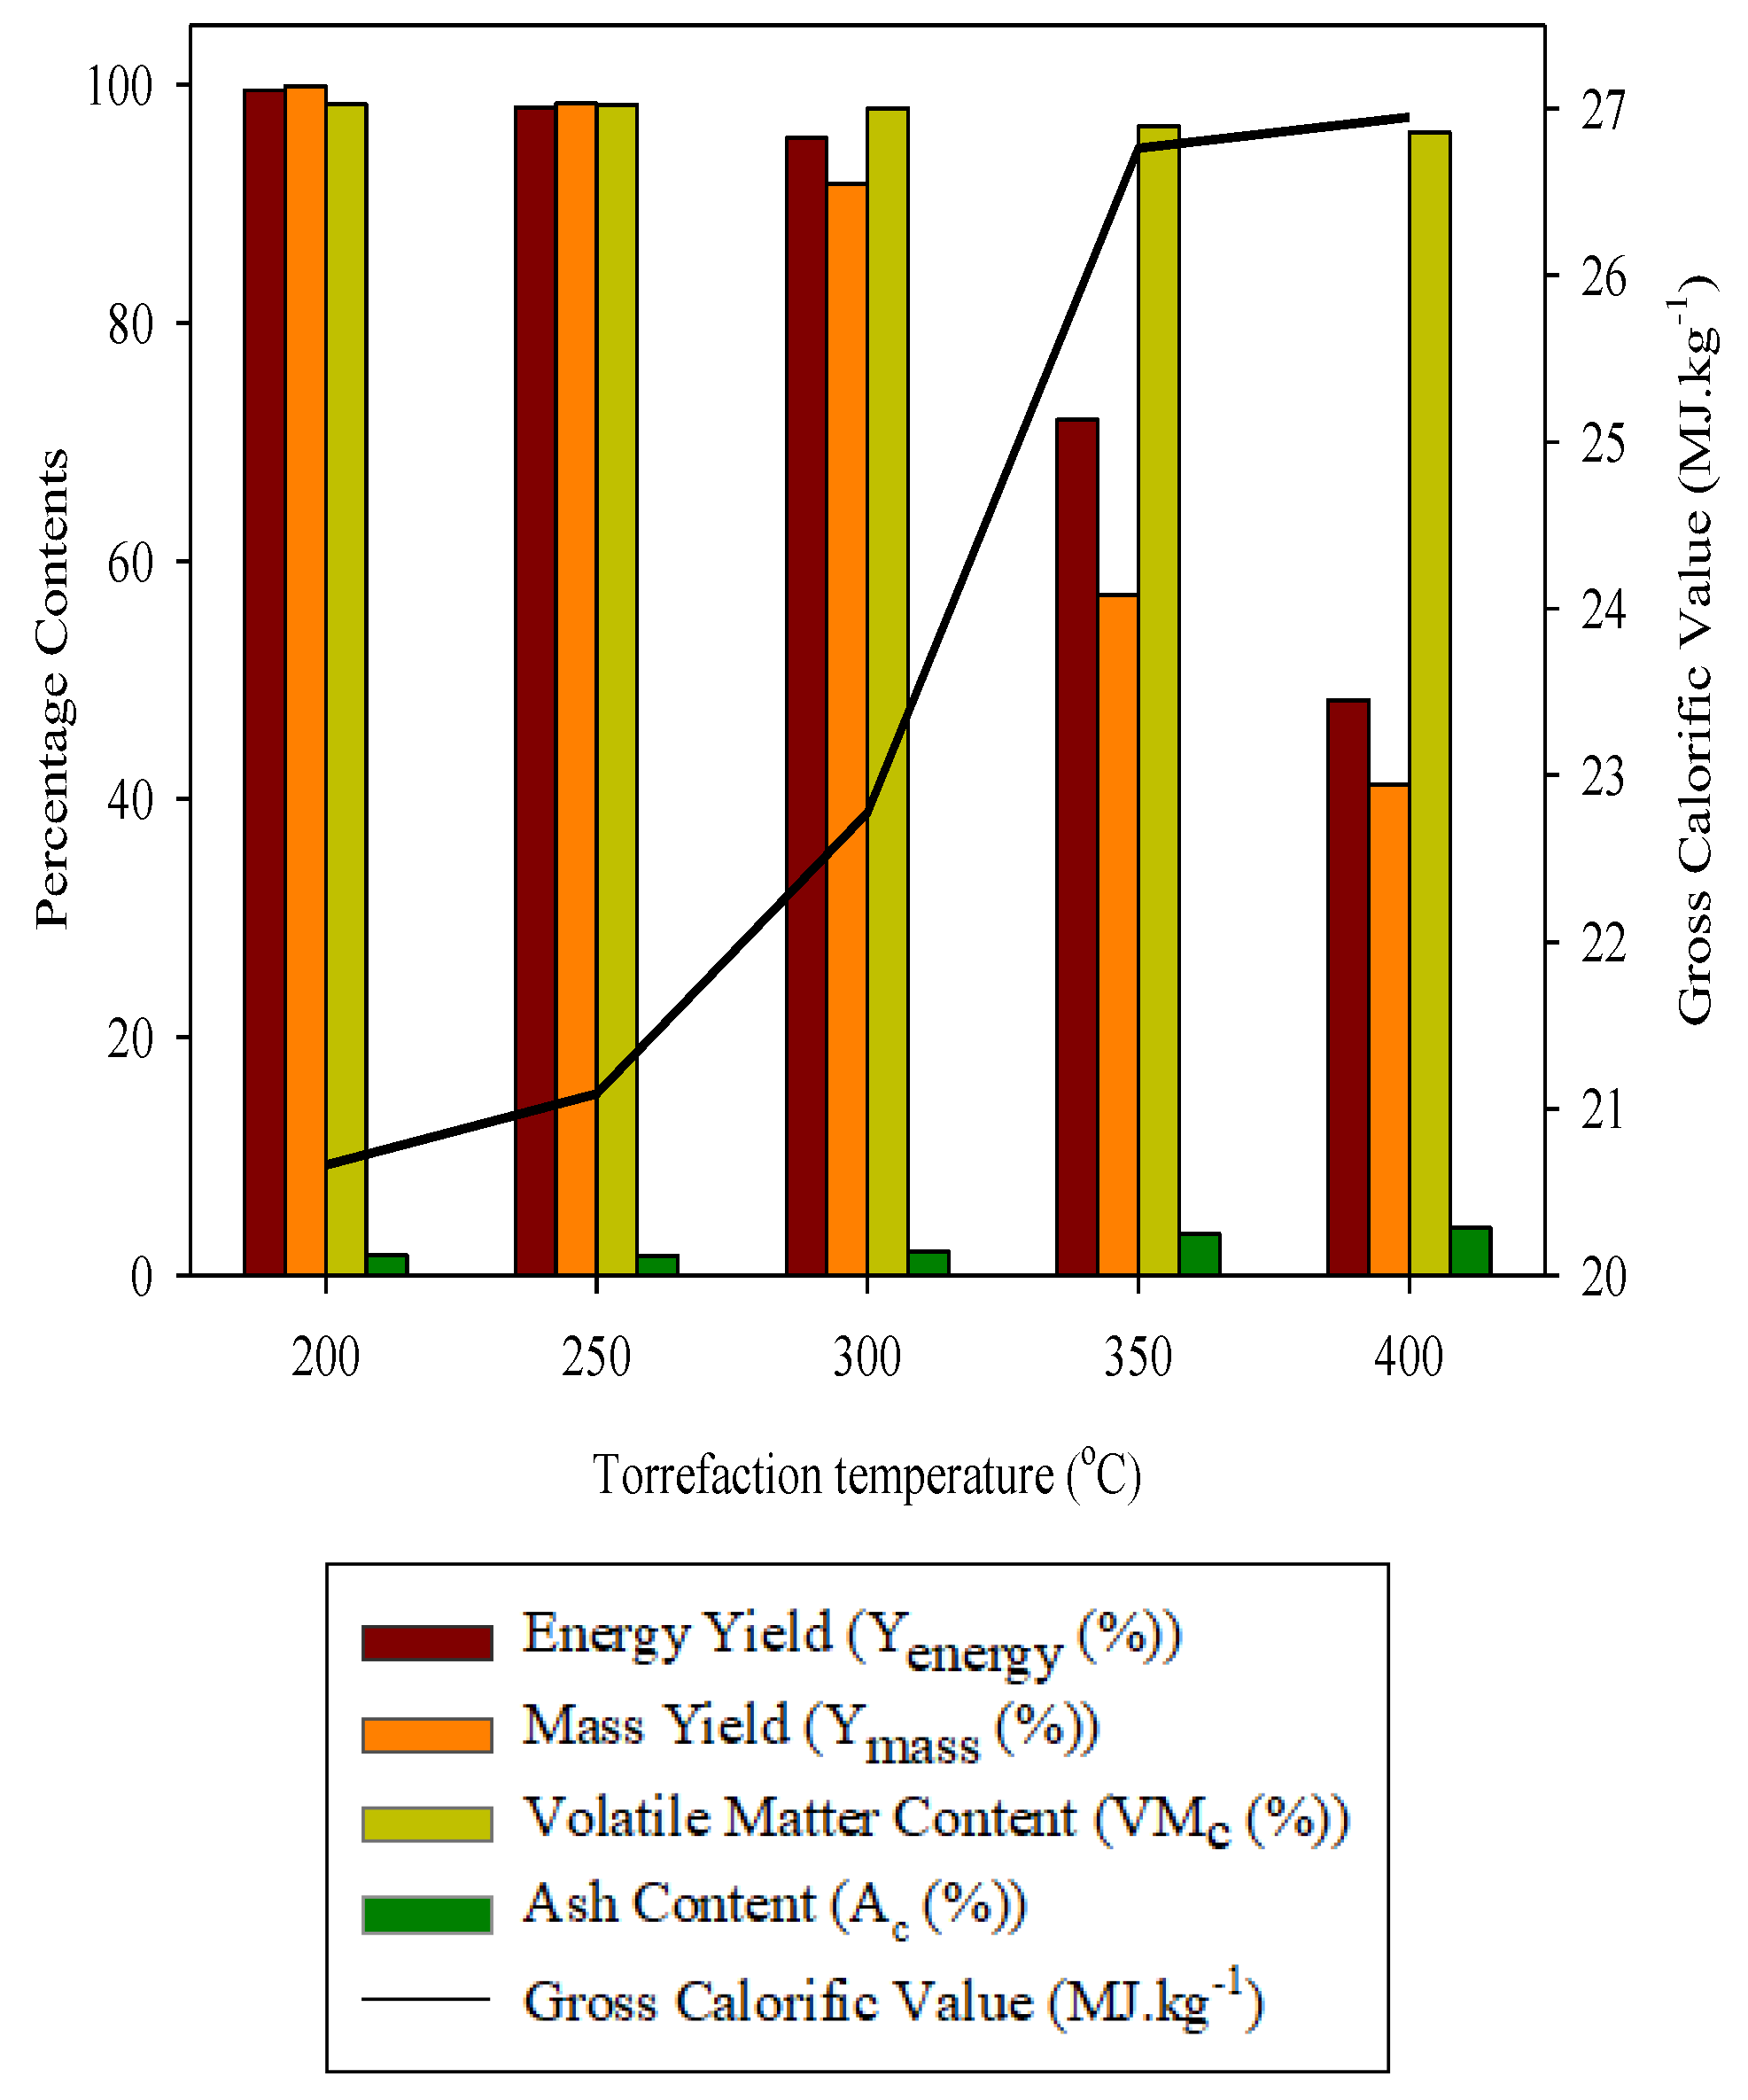
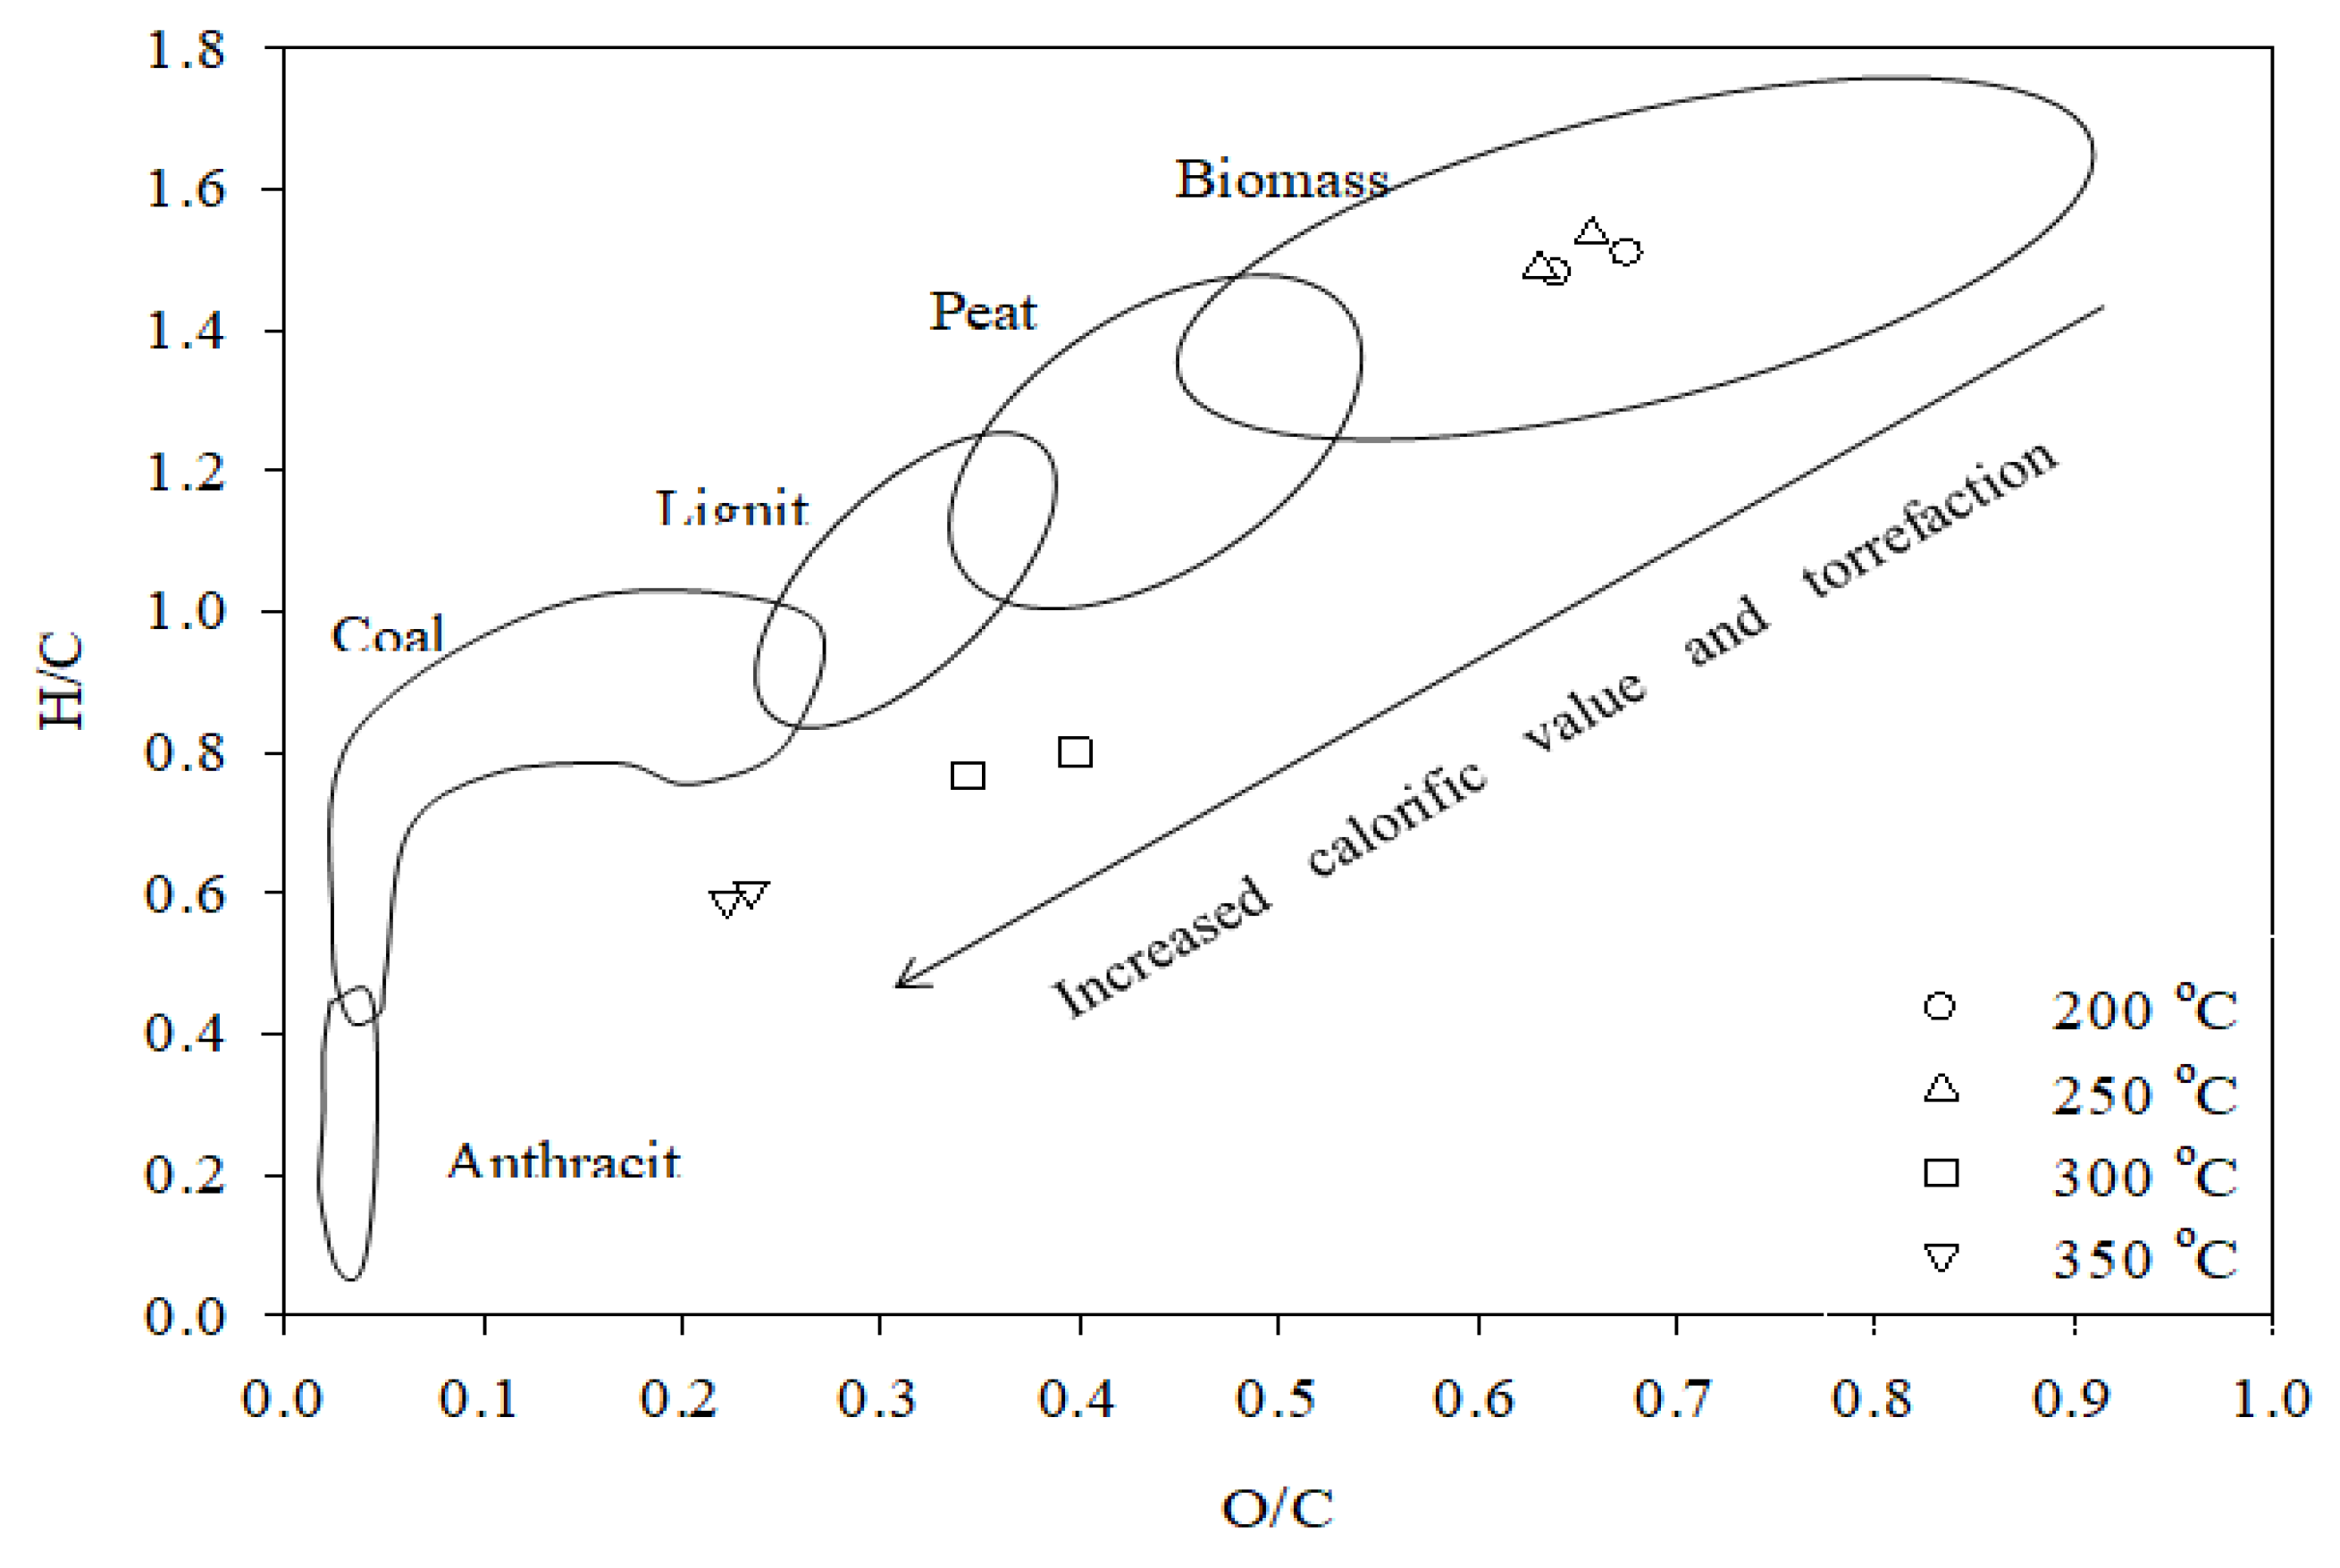
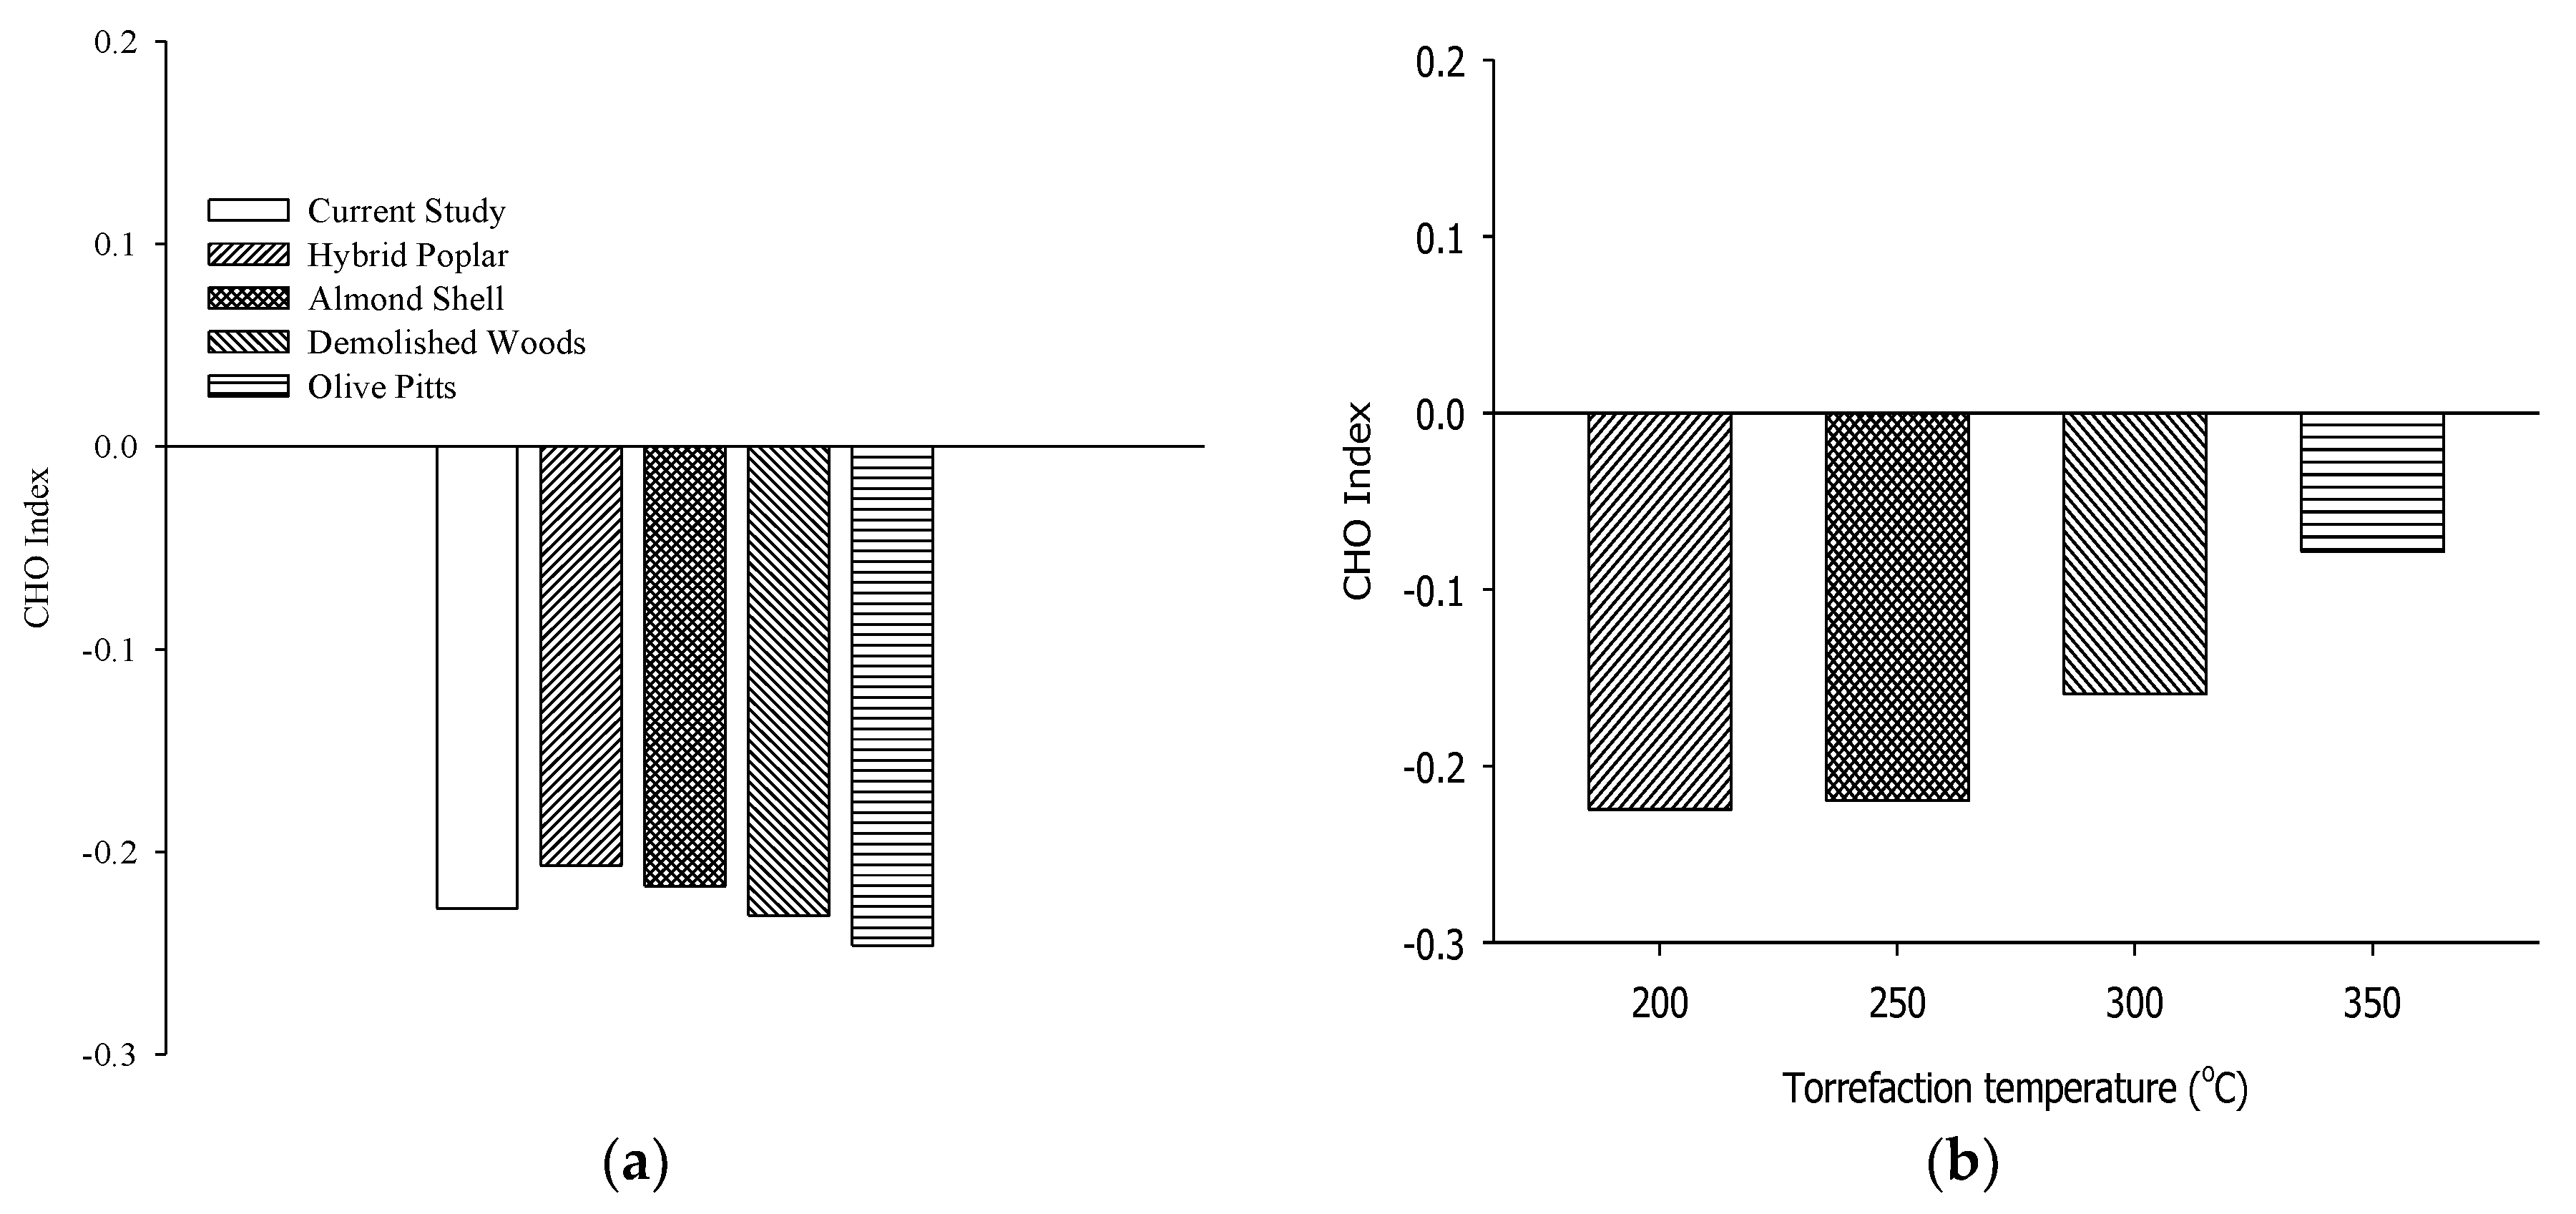
3.2. Effect of Temperature on Torrefaction Parameters

The effect of temperature on torrefaction parameters, such as Ymass %, Yenergy (%), volatile matter (VMc (%)), GCV (MJ/kg), and ash content (Ac (%)), are illustrated in Figure 3. It can be seen from the graph that overall, there is a decrease in Yenergy (%), Ymass (%), and VMc (%), with an increase in torrefaction temperature. Conversely, there is an increase in GCV (MJ/kg), and Ac (%), with increase in torrefaction temperature.
As from the Figure 3, it can be observed that until 300 °C, the mass loss was not significant after which there was a loss of 42.77% at 350 °C. This drastic alteration of mass loss can be attributed to the drying process and thermal degradation of stable wood constituents [7,20,21]. Similar changes can be observed for Yenergy (%), where a significant reduction of 27.80% was observed at 350 °C. In contrast, an increment in the GCV (MJ/kg) is observed with increase in torrefaction temperature. At elevated torrefaction temperature, VMc (%) decreases while the Ac (%) increases, the results obtained in this study is well supported by the results obtained by Pelaez-Samaniego et al. [22] for ponderosa pine wood species.
The GCV (MJ/kg) is one of the most important characteristics of a solid fuel. Although with increasing torrefaction temperature, the GCV (MJ/kg) of the biomass feedstock keeps increasing; it must be noted that Ymass (%) decreases with elevated torrefaction temperature. The loss of mass can reach a point where the torrefaction process is regarded as incomplete. Therefore, this study aims to provide the optimal range of temperatures that totally benefit torrefaction. Therefore, the temperature range of 250–350 °C was taken into account to further investigating the effect of torrefaction residence time on torrefied waste wood for this study.
Coal contains higher percentage of carbon than biomass due to which the GCV (MJ/kg) of coal is much higher than that of biomass. The importance of the hydrogen and oxygen index on the GCV (MJ/kg) of waste wood is illustrated in Figure 4, presenting the Van Krevelen diagram, a graphical illustration which portrays the decomposition of waste wood during torrefaction. During the pretreatment, waste wood undergoes physiochemical changes that involve the loss or gain of integral amounts of elemental composition, such as C, H, N, and O, leading to specific changes in the Van Krevelen diagram. From the Van Krevelen diagram, it can be seen that as the torrefaction temperature increases the molar ratio, i.e., H/C and O/C ratio decreases, bringing the waste wood closer towards lignite and coal. Figure 4 also clearly indicates, that as the temperature increases to 300 °C, the waste wood appears closer to lignite. Torrefaction temperatures above 250 °C, the Van Krevelen plot demonstrates that the elemental composition of waste wood is shifted towards that of coal and lignite. During torrefaction, carbon dioxide and water is released making the torrefied product more valuable for thermal treatment processes, such as gasification and combustion. Similar observations have been made by Granados et al. [23], and have reasoned it due to the large decomposition of cellulose and hemicellulose leaving a lignin-rich material. In addition, not many changes are observed around 200–250 °C, and the product is still in the range of biomass. Thus, from Figure 3 and Figure 4, the optimal torrefaction temperature for waste wood is 300 °C, with elevated GCV (MJ/kg), nominal mass loss, and less Ac (%).
To describe the oxidation state of organic compound present in organic materials, Mann et al. [24] suggested the use of the CHO index, defined as:
  CHO =   2 [ O ] [ H ] [ C ]
where, [O], [C] and [H] are mole fraction of oxygen, carbon, and hydrogen, respectively. Figure 5a shows the CHO index values of waste wood (current study) and for different lignocellulosic biomass obtained from [25], and Figure 5b denotes the CHO index obtained in this study with respect to torrefaction temperature. The higher the CHO index, the greater the number of oxygenated compounds. Whereas, a lower CHO index refers to the lowered amount of oxygenated compounds, denoting a relatively lower amount of oxygen and higher amount of relative hydrogen content. The increase in torrefaction temperature leads to a decrease the amount of oxygen and hydrogen, which in turn increases the relative amount of carbon content, which provides a good CHO index. This value can be correlated to the Van Krevelen diagram and an increase in GCV (MJ/kg) as well.

3.3. Effect of Residence Time on Torrefaction Parameters

The effect of torrefaction residence time on Yenergy (%), Ymass (%), VMc (%), Ac (%) and GCV (MJ/kg) is shown in Table 2. Holding time or residence time can be described as the total amount of time the biomass feedstock is inside the torrefaction reactor [26]. The residence time had a significant effect on all of the parameters except for VMc (%), where the overall decrease at 300 °C was 1.6% at 50 min residence time. Additionally, at 50 min residence time, the Ymass (%) decreased by 59% at 350 °C for 50 min and Ac (%) increased by 82% at 300 °C for 50 min residence time. In addition, the GCV (MJ/kg) showed an increment of 24.75% at 250 °C for 50 min residence time.
The Yenergy (%) and Ymass (%) demonstrates significant alterations at elevated residence time. However, this conversion rate may vary depending on the type of biomass used, for instance, agricultural residue demonstrates higher conversion rate compared to woody biomass because of the higher hemicellulose content [27]. In addition, a study by Chen et al. [20] reflects on how the polymeric structure of feedstock influences the reactivity of the torrefaction reaction.
Various works have shown that the effect of torrefaction temperature has a more pronounced effect than residence time, for instance, Chin et al. [28] concluded that although the GCV (MJ/kg) increased with both residence time and temperature, the value was more influenced by torrefaction temperature. In contrast, the present study has found that the overall increase in the GCV (MJ/kg) is comparable for both temperature and residence time.

3.4. Heavy Metal Analysis of Waste Wood

The heavy metal analysis of the waste wood and the torrefied products for temperature ranging from 250 °C to 400 °C (Table 3). The presence of heavy metals has a potentially damaging effect on human physiology and other biological systems, when the tolerance levels are exceeded. It is important to state that the cadmium problem in biomass utilization is caused by the technology itself. It is imported via deposition onto the forest. The source of this deposition is the dissipation of cadmium by anthropogenic processes, most notably fossil energy use [29]. The Cd, Pb and Cr content of the raw WW were 20.02, 16.02 and 4.61 mg/kg, respectively (Table 2). Hg and As were not detected. From Table 2, it was found that the concentrations of heavy metals increased following torrefaction. This is due to the fact that the heavy metals were relatively concentrated by reducing of volatile components in the biomass.

4. Conclusions

In the present work, waste wood under the influence of torrefaction residence time and temperature was investigated. The results showed that there was an increase in the GCV (MJ/kg) of waste wood with the increase in torrefaction temperature and residence time. However, after 350 °C, there was a negligible increase in the GCV (MJ/kg), but the mass loss was maximum; therefore, for 0–50 min residence time, the temperature range of 250–350 °C was taken into consideration. Comparing the present data with the Van Krevelen diagram, we found that with an increase in torrefaction severity the torrefied biomass behaved more like lignite and coal. Also, the CHO index showed a positive influence with an increase in torrefaction temperature, i.e., the amount of oxygenated compound decreased. Unlike other works, the effect of both residence time and temperature were significant on Yenergy (%), Ymass (%), VMc (%), Ac (%) and GCV (MJ/kg) of the waste wood. However, a decisive conclusion cannot be made and more investigation considering other torrefaction parameters, such as grindability and heat-induced variations must be studied in detail. Calculating all of the parameters, 300 °C was considered as an optimal torrefaction temperature for waste wood, i.e., higher GCV (MJ/kg), lesser mass loss, comparatively low Ac (%) and the properties resembling more towards lignite.

Author Contributions

J.P. and S.K. were responsible for the overall experiment, data analysis and arrangement along with preparation of the manuscript. S.C.O. was the supervisor of the project and was mainly responsible for the data and manuscript confirmation. All the authors were equally responsible for finalizing the manuscript and submission.

Funding

This work was supported by a Grant from the Human Resources Development Program (No. 20154030200940) of the Korea Institute of Energy Technology Evaluation and Planning (KETEP) funded by the Ministry of Trade, Industry and Energy of the Korean government.

Conflicts of Interest

The authors declare no conflict of interest.

References

  1. Biochemical Conversion of Biomass in Liquid Transportation Fuels from Coal and Biomass: Technological Status, Costs, and Environmental Impacts; The National Academies Press: Washington, DC, USA, 2009; pp. 117–162.
  2. Doddapaneni, T.R.K.C.; Konttinen, J.; Hukka, T.I.; Moilanen, A. Influence of torrefaction pretreatment on the pyrolysis of Eucalyptus clone: A study on kinetics, reaction mechanism and heat flow. Ind. Crops Prod. 2016, 92, 244–254. [Google Scholar] [CrossRef]
  3. Van der Stelt, M.; Gerhauser, H.; Kiel, J.; Ptasinski, K. Biomass upgrading by torrefaction for the production of biofuels: A review. Biomass Bioenergy 2011, 35, 3748–3762. [Google Scholar] [CrossRef]
  4. Peng, J.H.; Bi, H.T.; Lim, C.J.; Sokhansanj, S.A. Study on density, hardness, and moisture uptake of torrefied wood pellets. Energy Fuels 2013, 27, 967–974. [Google Scholar] [CrossRef]
  5. Kamdem, D.; Pizzi, A.; Jermannaud, A. Durability of heat-treated wood. Holz als Roh-und Werkstoff 2002, 60, 1–6. [Google Scholar] [CrossRef]
  6. Bridgeman, T.; Jones, J.; Williams, A.; Waldron, D. An investigation of the grindability of two torrefied energy crops. Fuel 2010, 89, 3911–3918. [Google Scholar] [CrossRef] [Green Version]
  7. Phanphanich, M.; Mani, S. Impact of torrefaction on the grindability and fuel characteristics of forest biomass. Bioresour. Technol. 2011, 102, 1246–1253. [Google Scholar] [CrossRef] [PubMed]
  8. Boateng, A.; Mullen, C. Fast pyrolysis of biomass thermally pretreated by torrefaction. J. Anal. Appl. Pyrolysis 2013, 100, 95–102. [Google Scholar] [CrossRef]
  9. Svoboda, K.; Pohořelý, M.; Hartman, M.; Martinec, J. Pretreatment and feeding of biomass for pressurized entrained flow gasification. Fuel Process. Technol. 2009, 90, 629–635. [Google Scholar] [CrossRef]
  10. Thrän, D.; Witt, J.; Schaubach, K.; Kiel, J.; Carbo, M.; Maier, J.; Ndibe, C.; Koppejan, J.; Alakangas, E.; Majer, S. Moving torrefaction towards market introduction–Technical improvements and economic-environmental assessment along the overall torrefaction supply chain through the SECTOR project. Biomass Bioenergy 2016, 89, 184–200. [Google Scholar] [CrossRef]
  11. Koppejan, J.; Sokhansanj, S.; Melin, S.; Madrali, S. Status overview of torrefaction technologies. IEA Bioenergy Task 2012, 32, 1–54. [Google Scholar]
  12. Stamm, A.J. Thermal degradation of wood and cellulose. Ind. Eng. Chem. 1956, 48, 413–417. [Google Scholar] [CrossRef]
  13. Stanzl-Tschegg, S.; Beikircher, W.; Loidl, D. Comparison of mechanical properties of thermally modified wood at growth ring and cell wall level by means of instrumented indentation tests. Holzforschung 2009, 63, 443–448. [Google Scholar] [CrossRef]
  14. Bergman, P.C.; Boersma, A.; Zwart, R.; Kiel, J. Torrefaction for Biomass Co-Firing in Existing Coal-Fired Power Stations “Biocoal”; Report No.ECN-C-05-013; Energy Centre of Netherlands: Petten, The Netherlands, 2005. [Google Scholar]
  15. Rodrigues, A.; Loureiro, L.; Nunes, L.J.R. Torrefaction of woody biomasses from poplar SRC and Portuguese roundwood: Properties of torrefied products. Biomass Bioenergy 2018, 107, 55–65. [Google Scholar] [CrossRef]
  16. Li, S.-X.; Zou, J.-Y.; Li, M.-F.; Wu, X.-F.; Bian, J.; Xue, Z.-M. Structural and thermal properties of Populus tomentosa during carbon dioxide torrefaction. Energy 2017, 124, 321–329. [Google Scholar] [CrossRef]
  17. Benavente, V.; Fullana, A. Torrefaction of olive mill waste. Biomass Bioenergy 2015, 73, 186–194. [Google Scholar] [CrossRef] [Green Version]
  18. Christoforou, E.A.; Fokaides, P.A. Life cycle assessment (LCA) of olive husk torrefaction. Renew Energy 2016, 90, 257–266. [Google Scholar] [CrossRef]
  19. Prins Mark, J.; Ptasinski, K.; Janssen, F. Torrefaction of wood Part 2. Analysis of products J. Anal. Appl. Pyrolysis 2006, 77, 35–40. [Google Scholar] [CrossRef]
  20. Chen, W.H.; Kuo, P.C. A study on torrefaction of various biomass materials and its impact on lignocellulosic structure simulated by a thermogravimetry. Energy 2010, 35, 2580–2586. [Google Scholar] [CrossRef]
  21. Hill, S.J.; Grigsby, W.J.; Hall, P.W. Chemical and cellulose crystallite changes in Pinus radiata during torrefaction. Biomass Bioenergy 2013, 56, 92–98. [Google Scholar] [CrossRef]
  22. Pelaez-Samaniego, M.R.; Yadama, V.; Garcia-Perez, M.; Lowell, E.; McDonald, A.G. Effect of temperature during wood torrefaction on the formation of lignin liquid intermediates. J. Anal. Appl. Pyrolysis 2014, 109, 222–233. [Google Scholar] [CrossRef] [Green Version]
  23. Granados, D.; Basu, P.; Chejne, F.; Nhuchhen, D. Detailed investigation into torrefaction of wood in a two-stage inclined rotary torrefier. Energy Fuels 2016, 31, 647–658. [Google Scholar] [CrossRef]
  24. Mann, B.F.; Chen, H.; Herndon, E.M.; Chu, R.K.; Tolic, N.; Portier, E.F.; Chowdhury, T.R.; Robinson, E.W.; Callister, S.J.; Wullschleger, S.D. Indexing permafrost soil organic matter degradation using high-resolution mass spectrometry. PLoS ONE 2015, 10. [Google Scholar] [CrossRef] [PubMed]
  25. Jenkins, B.; Baxter, L.; Miles, T., Jr.; Miles, T. Combustion properties of biomass. Fuel Process. Technol. 1998, 54, 17–46. [Google Scholar] [CrossRef]
  26. Strandberg, M.; Olofsson, I.; Pommer, L.; Wiklund-Lindström, S.; Åberg, K.; Nordin, A. Effects of temperature and residence time on continuous torrefaction of spruce wood. Fuel Process. Technol. 2015, 134, 387–398. [Google Scholar] [CrossRef]
  27. Bridgeman, T.G.; Jones, J.M.; Shield, I.; Williams, P.T. Torrefaction of reed canary grass, wheat straw and willow to enhance solid fuel qualities and combustion properties. Fuel 2008, 87, 844–856. [Google Scholar] [CrossRef]
  28. Chin, K.; H’ng, P.; Go, W.; Wong, W.; Lim, T.; Maminski, M.; Paridah, M.; Luqman, A. Optimization of torrefaction conditions for high energy density solid biofuel from oil palm biomass and fast growing species available in Malaysia. Ind. Crops Prod. 2013, 49, 768–774. [Google Scholar] [CrossRef]
  29. Narodoslawsky, M.; Obernberger, I. From waste to raw material—The route from biomass to wood ash for cadmium and other heavy metals. J. Hazard. Mater. 1996, 50, 157–168. [Google Scholar] [CrossRef]
Figure 1. Schematic diagram of the horizontal tubular reactor used in this study.
Energies 11 01641 g001
Figure 2. TGA analysis of waste wood with respect to torrefaction temperature.
Energies 11 01641 g002
Figure 3. Effect of torrefaction temperature on Energy Yield (Yenergy (%)), Mass Yield (Ymass (%)), Volatile Matter (VMc (%)), Ash Content (Ac (%)) and Gross Calorific Value (GCV (MJ/kg)).
Energies 11 01641 g003
Figure 4. Van Krevelen diagram of waste wood with respect to torrefaction temperature.
Energies 11 01641 g004
Figure 5. CHO index values of (a) biomass feedstocks (data adapted from Reference [21]) (b) waste wood with respect to torrefaction temperature.
Energies 11 01641 g005
Table 1. Properties of waste wood (raw).
Elemental Analysis (wt %) aC46.96
H5.90
N3.07
O42.30
S0.07
Cl0.57
Other1.13
Heavy Metal Analysis (mg/kg)Cd20.02
Pb16.02
Cr4.61
HgND
AsND
Moisture (%) b 13.5
Volatile fraction (%) b 85.0
Ash (%) b 1.5
GCV (MJ/kg) a 20.6
LHV (MJ/kg) b 17.81
a Dry Basis; b Wet Basis; LHV (Lower Heating Value).
Table 2. Effect of torrefaction residence time on Energy Yield (Yenergy (%)), Mass Yield (Ymass (%)), Volatile Matter (VMc (%)), Ash Content (Ac (%)) and Gross Calorific Value (GCV (MJ/kg)).
0 min Residence Time
250 °C300 °C350 °C
Yenergy (%)99.5898.1071.85
Ymass (%)99.8891.7057.16
VMc (%)98.3498.0396.52
Ac (%)1.651.973.47
GCV (MJ/kg)21.0822.7726.76
10 min Residence Time
250 °C300 °C350 °C
Yenergy (%)87.1059.1549.87
Ymass (%)79.8453.0639.68
VMc (%)97.8997.3896.21
Ac (%)2.112.613.79
GCV (MJ/kg)23.0923.7326.75
20 min Residence Time
250 °C300 °C350 °C
Yenergy (%)70.2756.4443.41
Ymass (%)62.5547.9633.11
VMc (%)97.5596.3395.72
Ac (%)2.453.67 4.27
GCV (MJ/kg)23.7725.0627.92
30 min Residence Time
250 °C300 °C350 °C
Yenergy (%)74.2353.4552.66
Ymass (%)65.4543.8738.33
VMc (%)96.3995.8795.61
Ac (%)3.604.134.39
GCV (MJ/kg)24.0025.9429.25
40 min Residence Time
250 °C300 °C350 °C
Yenergy (%)82.8157.3154.74
Ymass (%)74.2645.1239.61
VMc (%)96.6596.2595.31
Ac (%)3.353.754.68
GCV (MJ/kg)23.5927.0429.42
50 min Residence Time
250 °C300 °C350 °C
Yenergy (%)89.2459.0053.00
Ymass (%)71.7944.4239.57
VMc (%)97.4196.3995.74
Ac (%)2.583.604.26
GCV (MJ/kg)26.3128.2828.52
Table 3. Heavy metal concentration of WW as a function of the torrefaction temperature.
Heavy Metal (mg/kg) Raw250 °C300 °C350 °C
Cd20.0224.5194.25103.66
Pb16.0222.1762.1488.52
Cr4.617.3425.6529.44
HgNDNDNDND
AsNDNDNDND
ND = Not Detected.

