Article

An Experimental Study of the Solar Collection Performance of Liquid-Type Solar Collectors under Various Weather Conditions

Platform of Inter/Transdisciplinary Energy Research, Kyushu University, Fukuoka 8128581, Japan
Energies 2018, 11(7), 1626; https://doi.org/10.3390/en11071626
Submission received: 10 May 2018 / Revised: 19 June 2018 / Accepted: 19 June 2018 / Published: 21 June 2018

Abstract

:
To design and use a solar heating system properly, it is very important to evaluate the performance of its solar collector. Because the solar collection efficiency of a solar collector depends on the amount of solar radiation, the conditions of the heating medium (e.g., flow rate and inlet temperature), and the outside air temperature, it is necessary to consider the performance of the solar collector in actual weather conditions that are likely to prevail when using the system for heating and hot water. In the present study, test equipment was manufactured to measure the efficiency of solar collectors. Using this equipment, the heating characteristics of seven types of solar collectors were measured. In addition, the amount of solar heat collected per unit area was calculated for seven regions in Japan to compare the solar collection performance for different weather conditions, such as the outside temperature and the amount of solar radiation. In addition, the amount of solar heat collected per unit area was calculated for seven regions in Japan to compare the solar collection performance for different weather conditions, such as outside temperature and the amount of solar radiation. The results show that the solar collection performance is climate dependent and that it is necessary to select a suitable collector for each region through a preliminary examination of the solar collection in the initial design stage.

1. Introduction

The rate of energy self-sufficiency in Japan is very low (7.0%) when nuclear power is excluded [1]. By contrast, a great deal of energy is consumed by heating, especially in the northern regions, despite improvements in housing insulation. In China and South Korea, it has become popular to use solar energy to heat water, and more such solar heating systems are expected to be used for heating in the future. In Japan, the Tohoku region (which was affected by the Great East Japan Earthquake of 2011) has been demanding heating that uses natural energy, thereby reducing its dependence on fossil fuels and power lines [2].
Studies of various forms of natural energy (e.g., geothermal, wind, and hydroelectric) are progressing, but the main interest is in solar energy, because it is abundant and efficient [3,4]. However, in the case of solar energy, because it is available only during the daytime and the available energy changes depending on weather conditions and regions, proper design is required for efficient utilization. To design and use a solar heating system properly, it is very important to evaluate the performance of its solar collector. Because the solar collection efficiency of the solar collector depends on the amount of solar radiation, the conditions of the heating medium (e.g., flow rate and inlet temperature), and the outside air temperature, it is necessary to consider the performance of the solar collector in the actual weather conditions that are likely to prevail when using the system for heating and hot water [5,6,7].
For these reasons, various studies have been conducted to assess the performance of solar collectors. Fan Zhou [8] presented and validated a mathematical model with a prototype experiment of a flat-plate solar collector. Amer [9] measured the performance of a flat-plate solar collector experimentally for different inlet temperatures of the heating medium. In particular, the amount of solar heat collection was calculated from the difference between the average temperature of the heating medium and the outside temperature and from the heat lost from the entire solar collector to the surrounding air. The inlet temperature of the heating medium was set between 30 °C and 80 °C, and the results were compared for different measuring times (11:30–12:30 or 10:30–14:30) and time intervals (1 s or 60 s). Kanayama [10] calculated the heat balance among solar collector components (e.g., transmission material and absorbing plate) and calculated the convective heat conductance of the air space, the transmittance of the material, and the absorption rate of the solar collector. Michaelides [11] measured the performance of a solar collector attached to a hot water tank. The experiments were carried out with a 2.72-m2 flat-plate solar collector inclined at an angle of 42° and with a 68-L (600-mm-tall) hot water storage tank insulated with 50 mm of polyurethane. From the measurements, the amount of solar collection, its efficiency, and the temperatures of the upper and lower parts of the tank were represented by simple formulae.
Dong Zhang [12] proposed a solar collector with a dual function for air and water heating based on a flat-plate solar water collector. Huang [13] developed a formula for energy efficiency by calculating the amount of the solar collection, its efficiency, and the heat loss to evaluate the performance of a solar collector. Nie [14] measured the performance of an evacuated solar collector by using a solar simulator to change the amount of solar radiation, the outside temperature, and the flow rate. Wei [15] suggested a way to improve the solar collection efficiency by changing the structure of a flat-plate collector. Zukowski [16] measured the collection performance of ceramic collectors in relation to the flow rate. Chen [17] investigated traditional full-scale metal solar collectors and solar collector specimens fabricated from polymeric materials. S. Tamvakidis [18] examined a hybrid solar system for heating a farrowing house. The research results indicated that the proposed system contributed to energy savings to a great extent. Y. Gao [19] measured the thermal performance of a U-pipe evacuated solar tube collector and suggested a model of the heat transfer between the U-pipe and fin in detail. In addition, the validity of the heat transfer model was examined by comparing the efficiency of the collector according to experimental conditions. Through the proposed model, a design for the collector was suggested. Jie Deng [20,21,22,23] suggested a dynamic thermal performance prediction model for predicting the performance of solar collectors. Although various studies on the performance of solar collectors have been carried out, these have usually involved performance tests in different geographic locations, using different measuring techniques. Therefore, it is difficult to compare the performance of different collectors based on disparate research results. To compare the performance of solar collectors objectively, it is necessary to subject them to the same experimental conditions in the same location. In a study by D. Sowmy [24], the efficiency of a solar collector was tested using a solar simulator under the same conditions. In addition, the validity of the experiment was evaluated through an uncertainty analysis. In this study, the performance of a collector in laboratory conditions was evaluated to show uncertainties depending on the measurement conditions. E. Azad [25] designed three types of collectors and analyzed their performance through experiments. It was proposed to increase the number of heat pipes and to increase the effective absorber area as a method of increasing the performance of the heat pipe collector. As a study on the performance differences of a collector according to regional characteristics, Fan [26] has experimented on the change of the thermal efficiency according to the solar radiation intensity, flow rate, wind speed, and so on. Also, by calculating the average collection efficiency for each of the 10 cities in China, the difference in the collection performance according to the local climate was shown. Furthermore, Zheng [27] analyzed a mathematical model for the change in the solar collection efficiency by surface area, solar radiation intensity, outside temperature, wind speed, and so on. Based on these results, the possibility of using solar heat in cold regions was examined.
In the present study, test equipment was manufactured to measure the efficiency of solar collectors based on the test method of ISO9806-1 [28] and the ASHRAE (American Society of Heating, Refrigerating and Air-Conditioning Engineers) standard [29,30]. Using this equipment, the heating characteristics of seven types of solar collectors were measured. In addition, the calculated annual collection amount of each solar collector under seven different sets of weather conditions were compared. In this study, the experiment was conducted to compare the performance of the collectors according to the external weather conditions. Based on the results, the differences of application effects in different climate conditions are shown. This study is a basic study for designing a solar collector suitable to a specific climate. The contents of this study are as follows. First, an experiment was conducted to understand the performance of the collector under the same conditions. In addition, differences in the solar heat collection performance in a region where the outside air temperature and the solar radiation intensity are different were determined. In the future, the relationship between the characteristics of each type of climate and the performance of the collector will be analyzed to design a solar collector suitable for the region.

2. Methodology

The solar collector experiments were carried out on the roof of Engineering Building 1 at the University of Tokyo. As shown in Figure 1, the system used in this study was designed and constructed according to the ISO (International Organization for Standardization) standard and was installed to examine the effects of outside temperature, solar radiation, wind speed, and wind direction on the solar collection performance. Furthermore, the heating medium inlet temperature of each collector was controlled to be the set point of the heat exchanger for heating or cooling. In particular, a resistance thermometer (PT100), a non-wetted electrode electromagnetic flow sensor, and an impeller-type flow sensor were used to make precise measurements of the heating medium temperature and flow rate. The heating medium used in this study was Nybrine NFP (propylene glycol, specific heat 3.45 J/kg∙K, specific gravity 1.03 at 40 °C), which is composed mainly of propylene glycol. To control the flow more accurately, a needle valve was installed on the inlet side of each collector.
To maintain constant inlet temperatures (T1 and T3) of the heating medium entering the solar collectors, two heat exchangers were used for cooling and heating. For example, if the set point of the inlet temperature was 40 °C and the outlet temperature was 50 °C, then the heat exchange with the cooling water at 25 °C would lower the heating medium temperature by 35 °C. Thereafter, the heating medium would be heated to its set temperature of 40 °C by heat exchange with hot water at 50 °C. Table 1 lists the various measurement targets and the equipment used to achieve them.

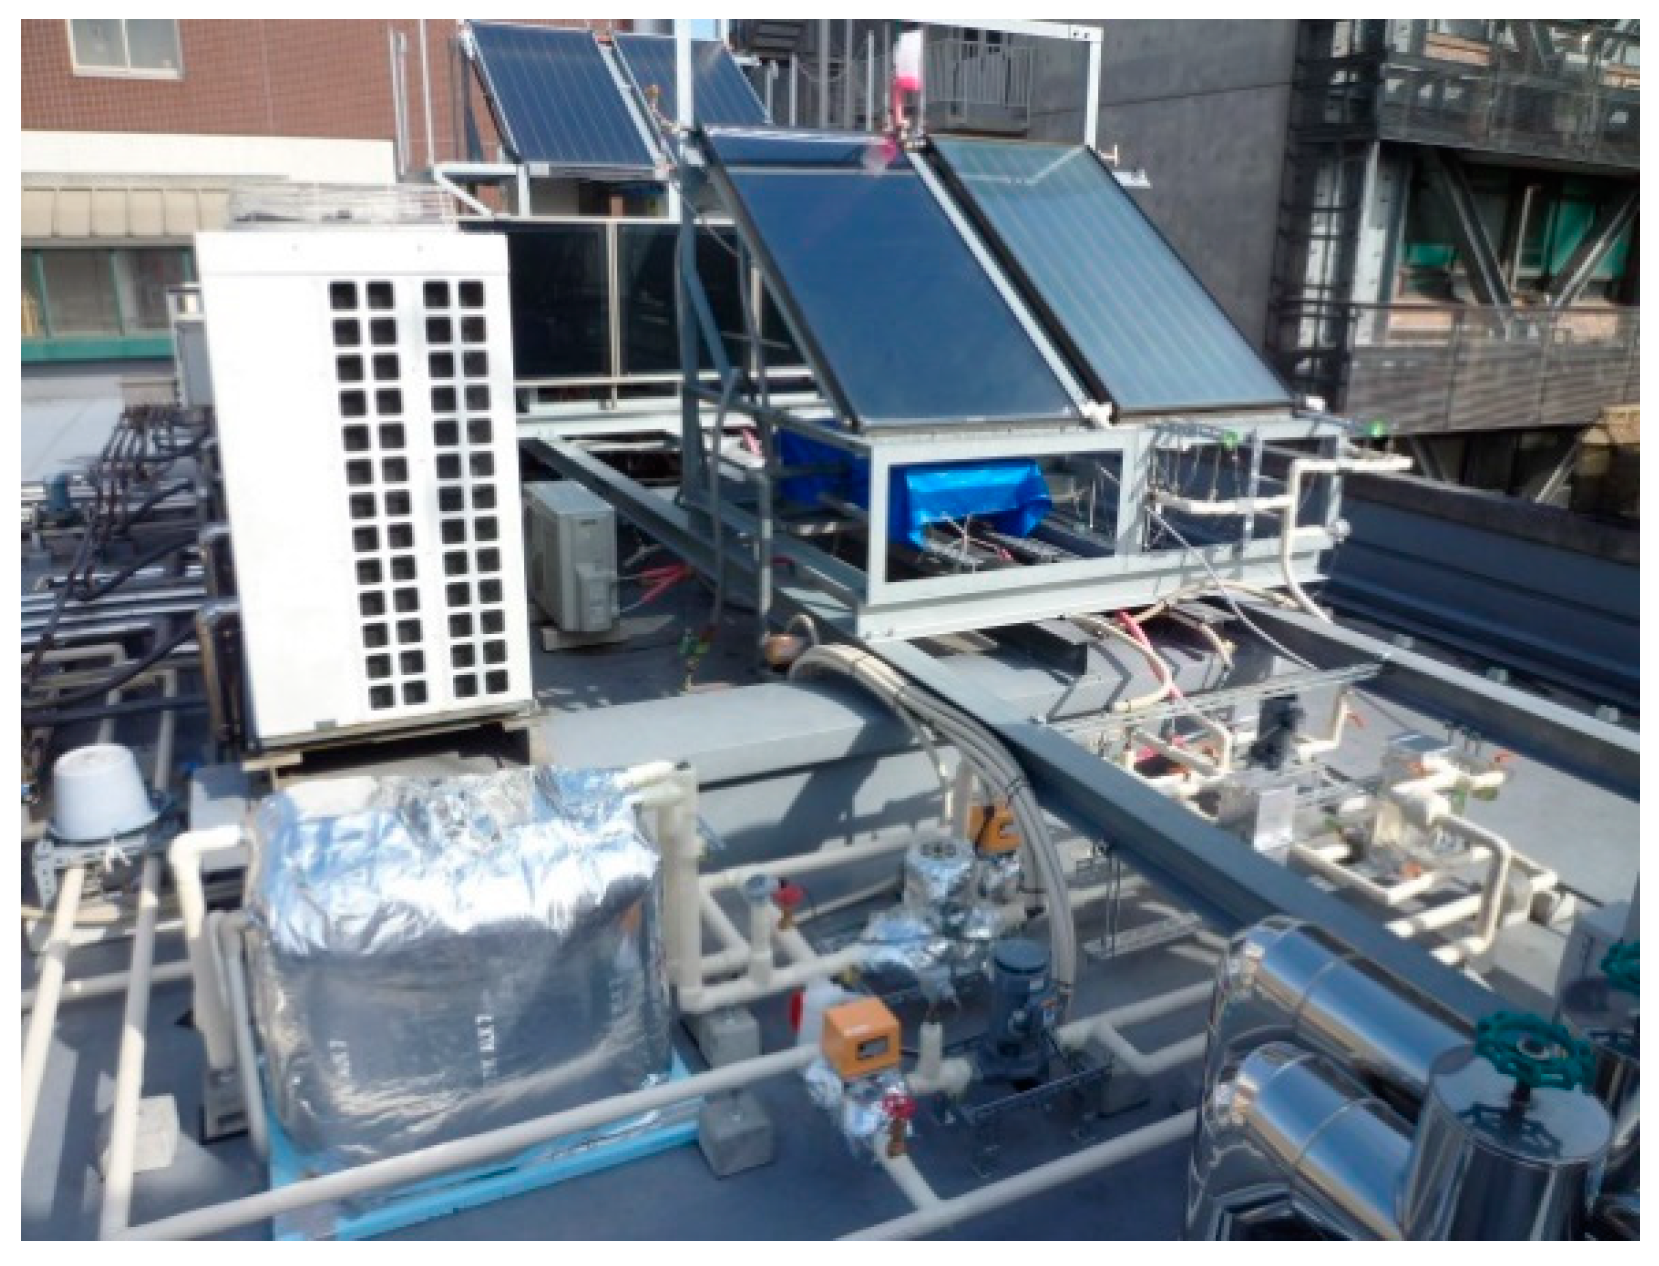
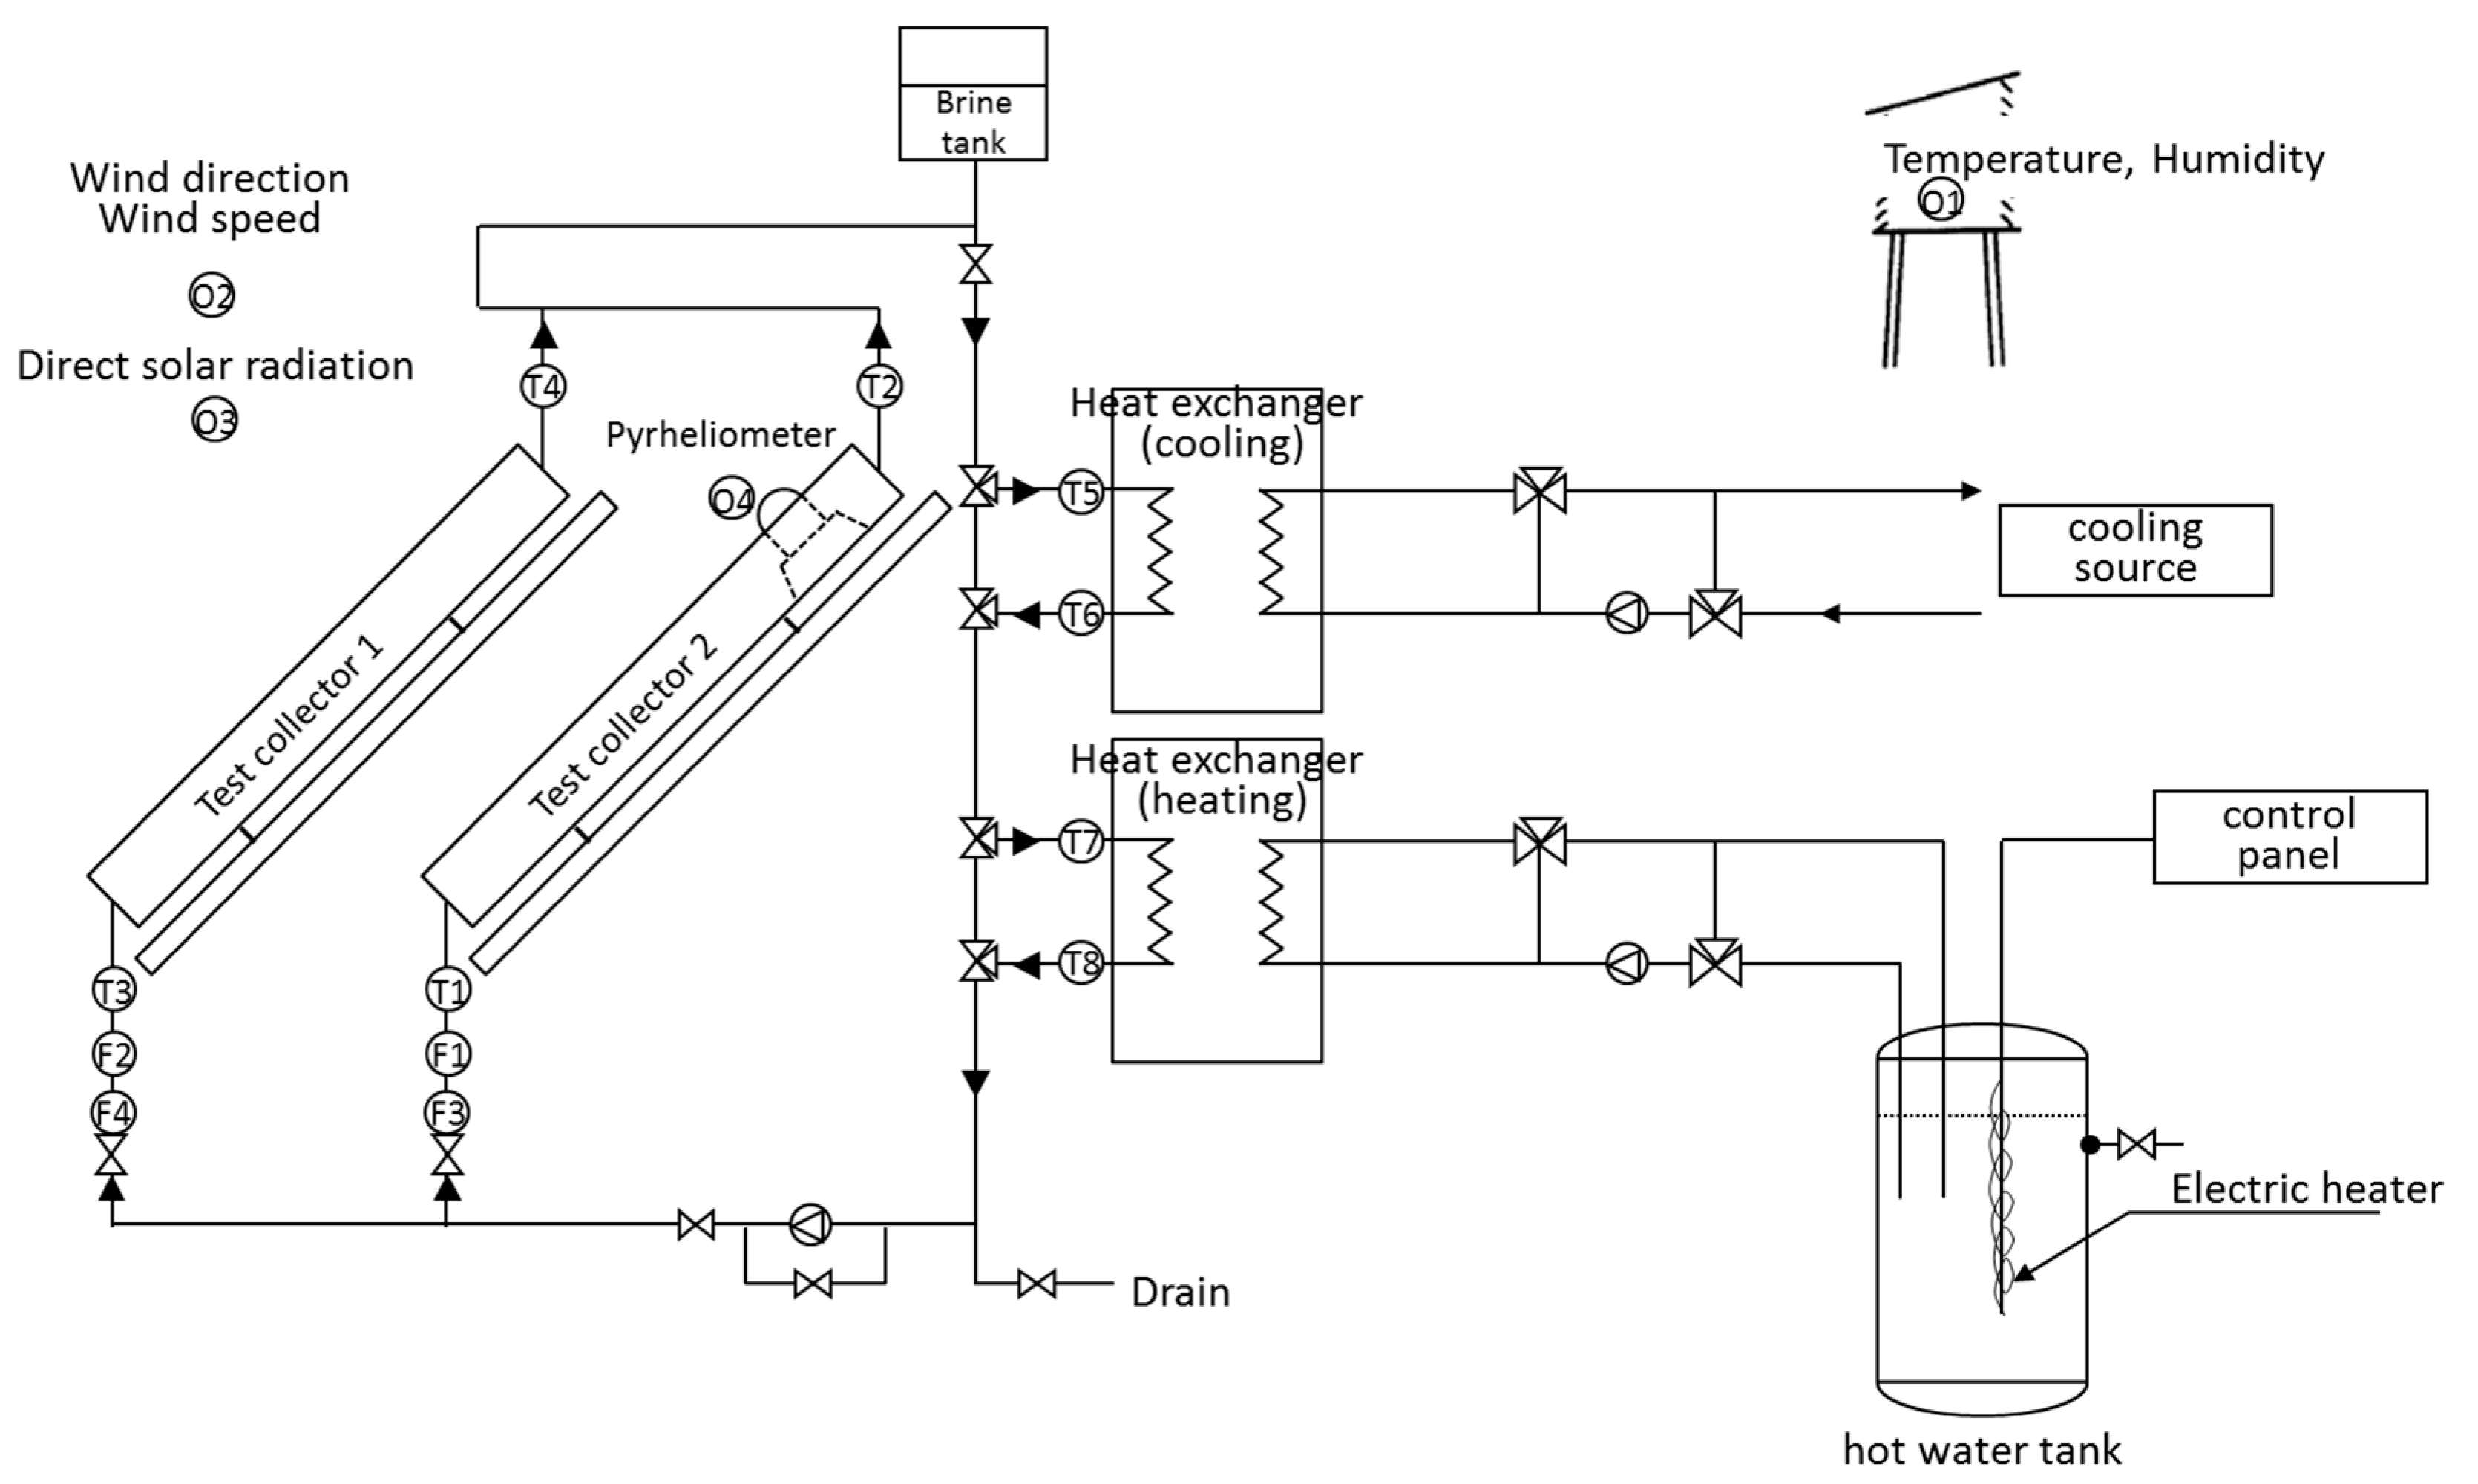
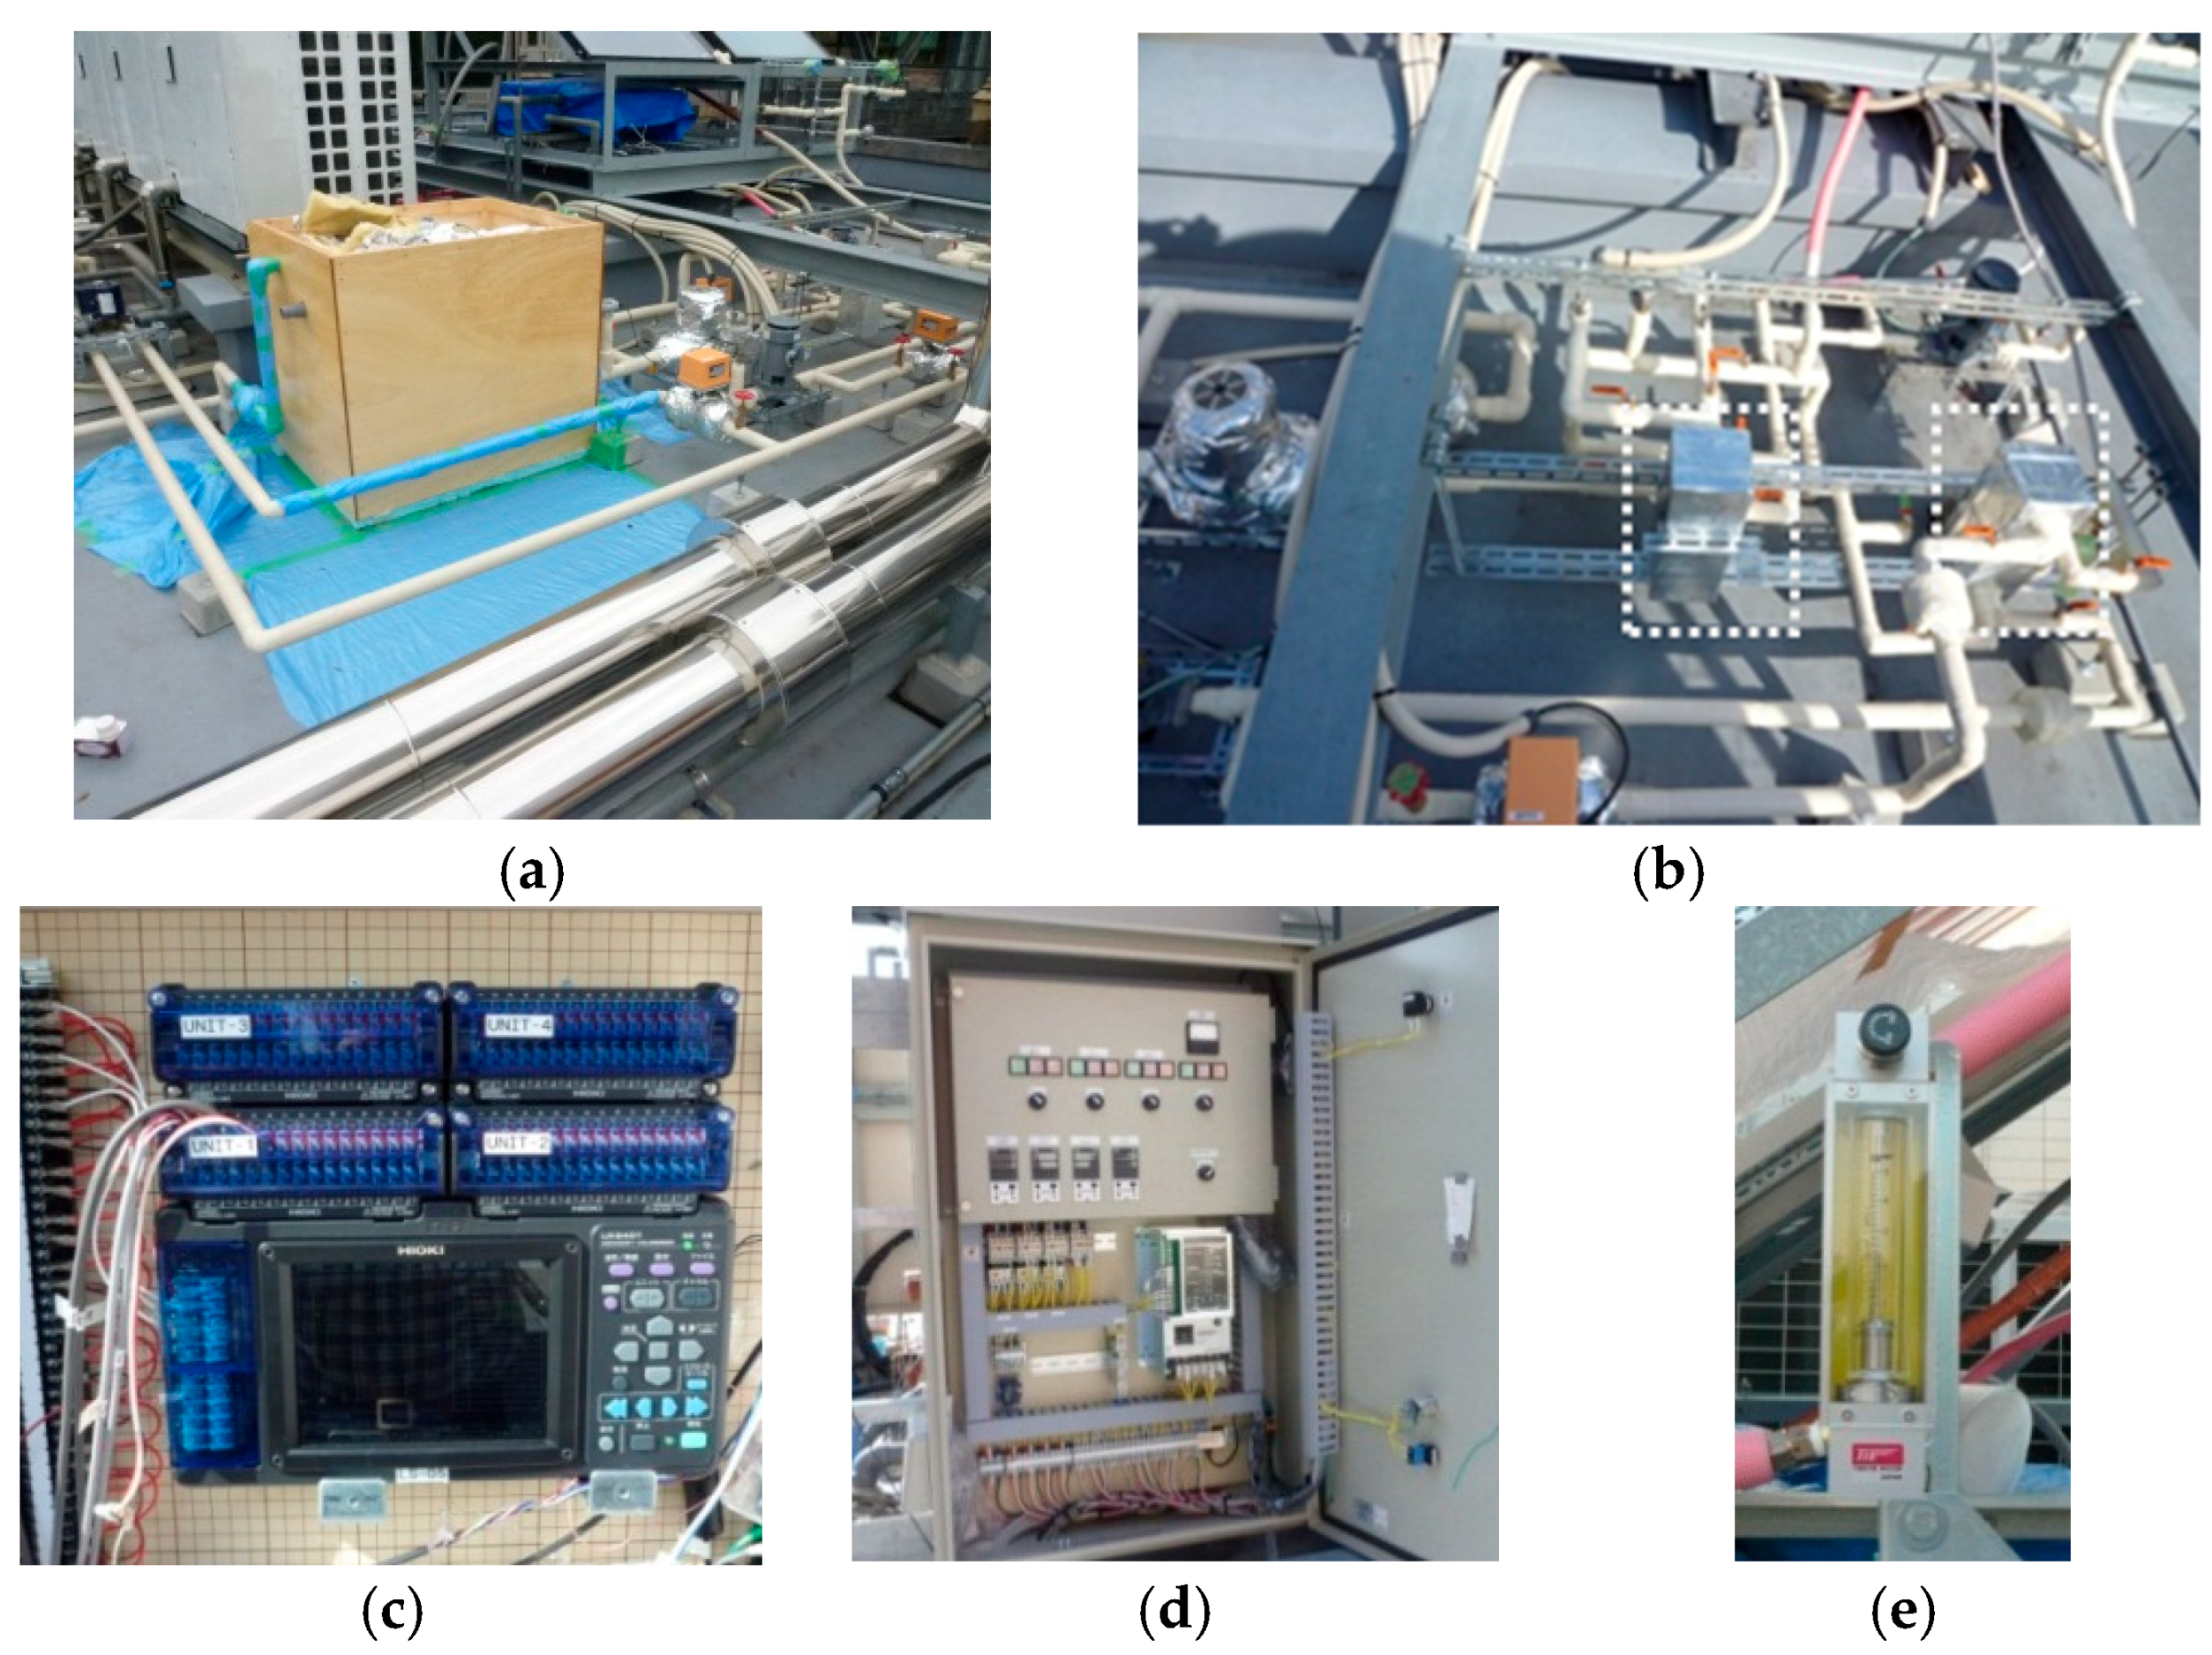
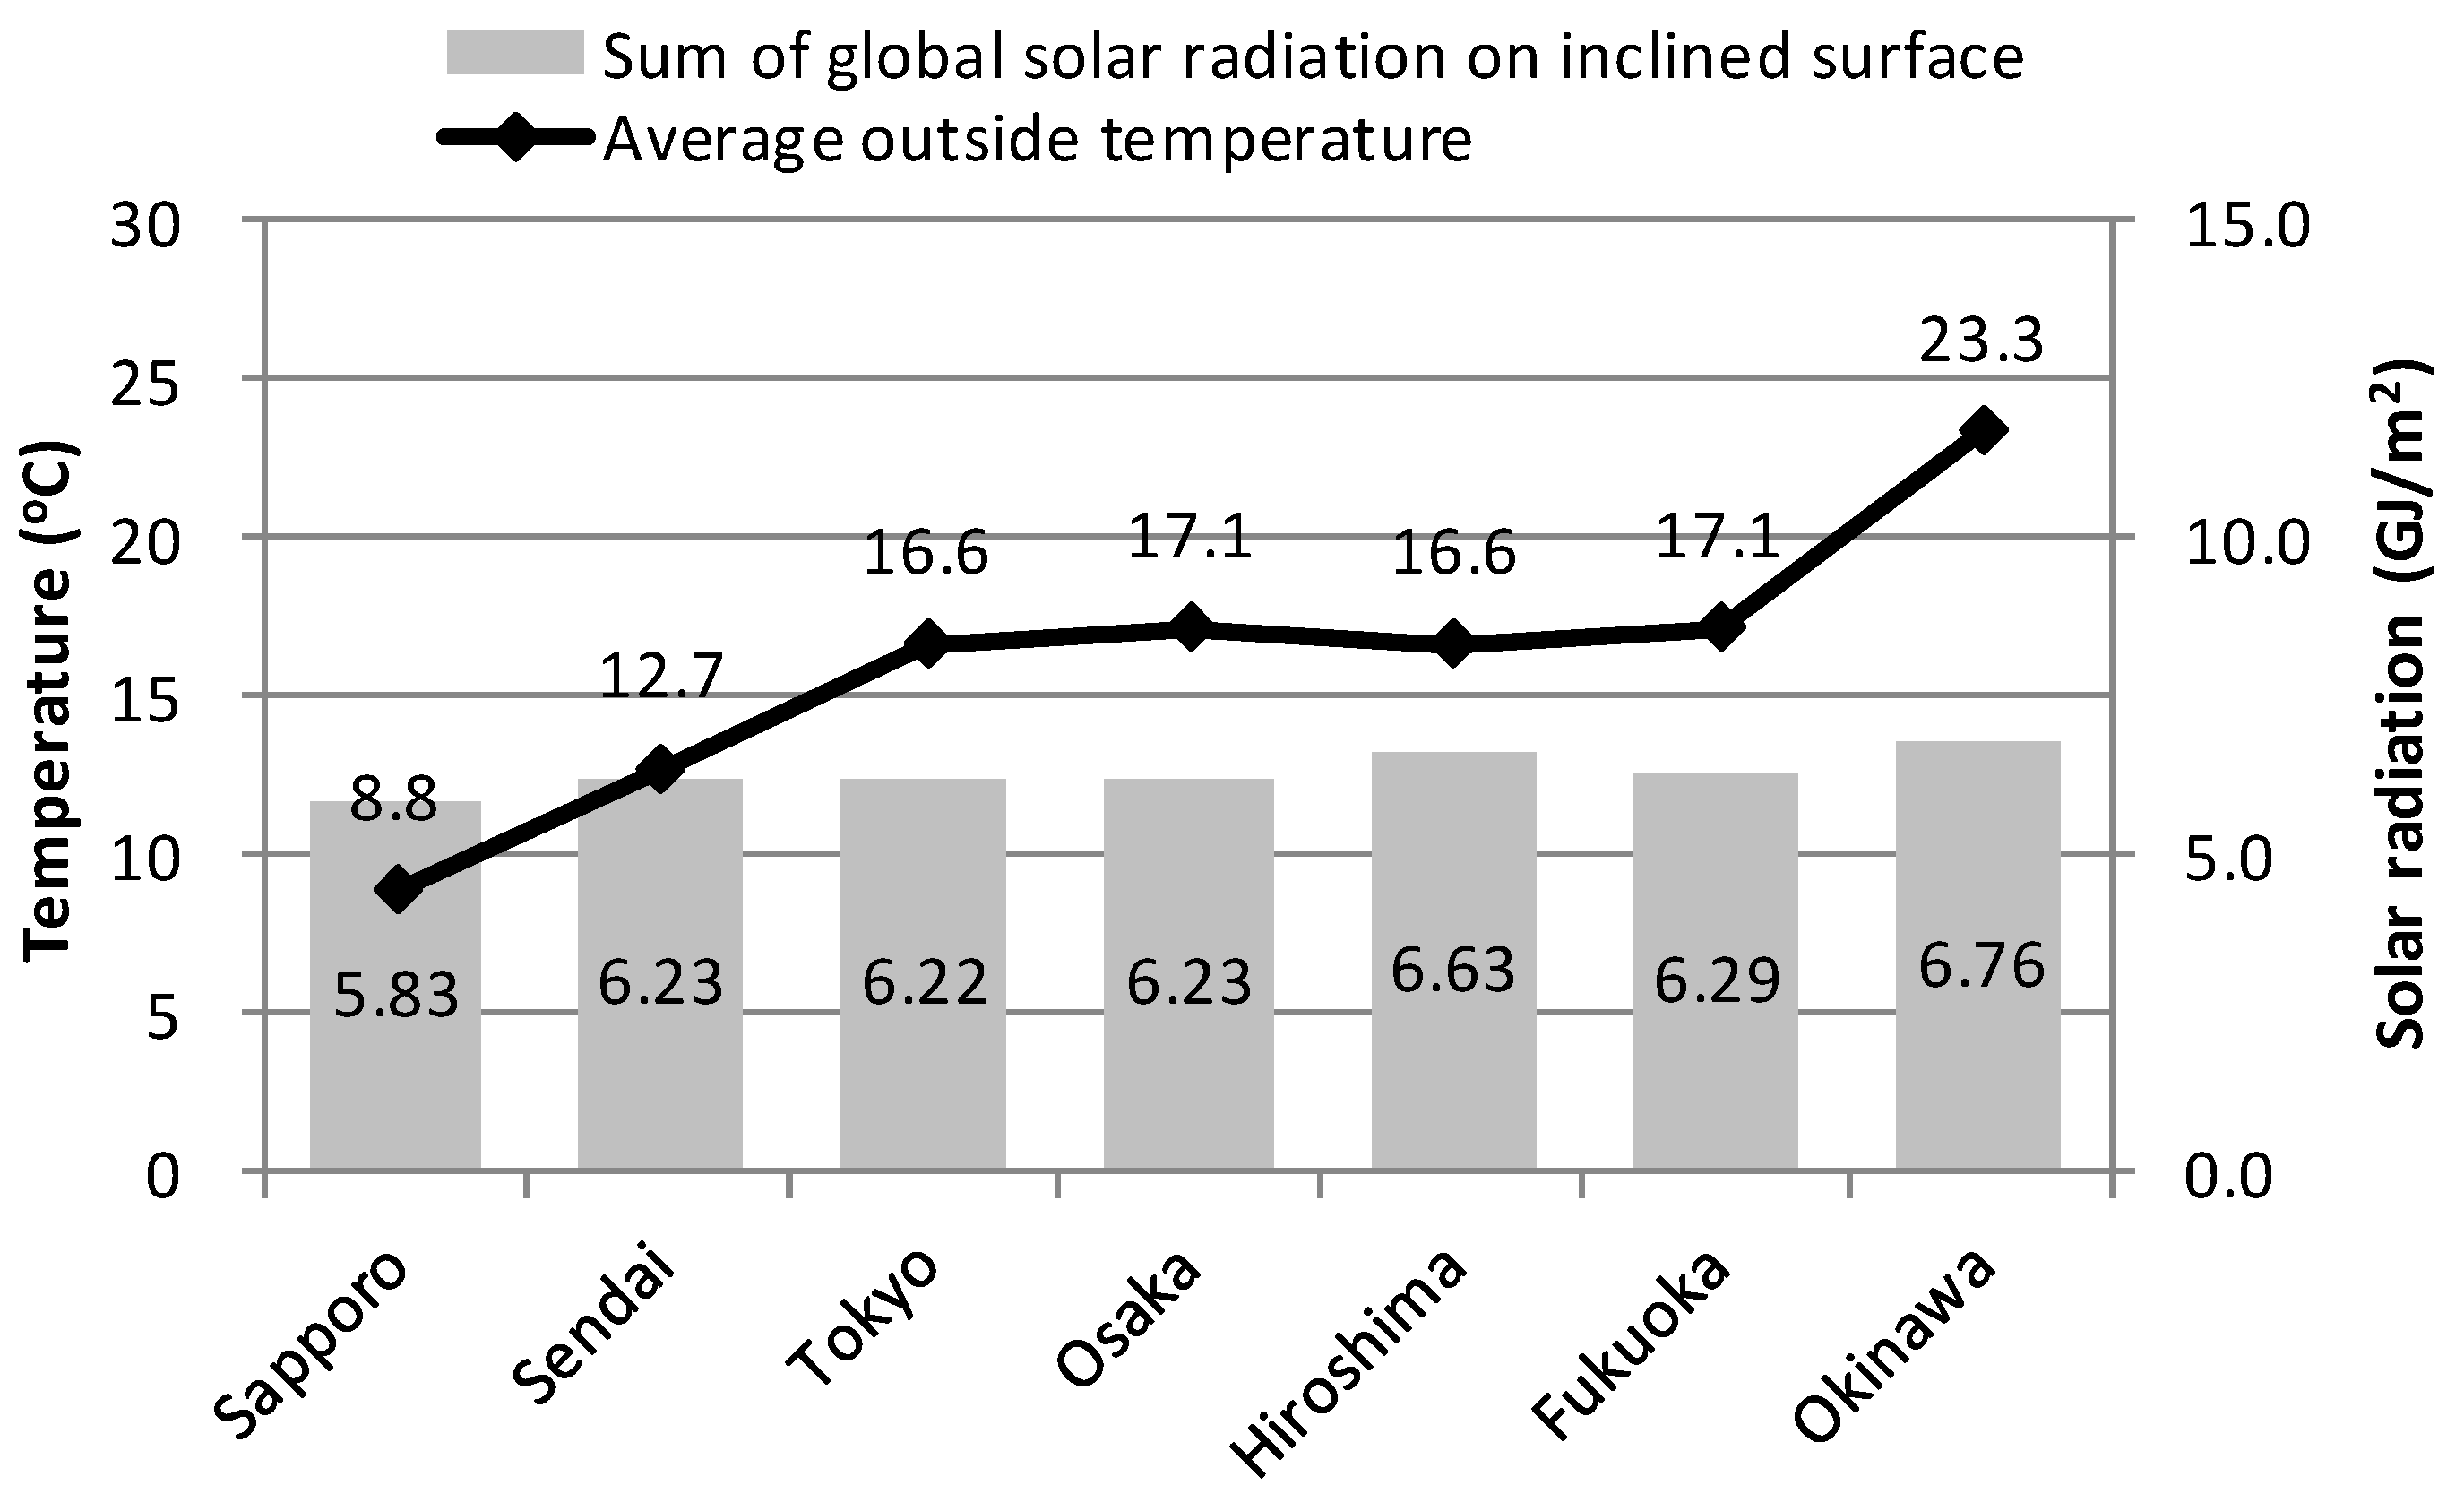
2.1. Measurement Conditions

In addition to a general plate-type solar collector, measurements were made of six other types of solar collectors. The experiments were carried out under conditions of the same flow rate and heating medium inlet temperature to compare the performances of the two solar collectors. Each case was measured for about one week. Each collector was measured for about a month with different heating medium inlet temperatures (40 °C and 60 °C) and flow rates (0.01 kg/s∙m2 and 0.02 kg/s∙m2). Figure 2 shows the collector performance testing equipment.
Each experiment was carried out for 24 h with a heating medium inlet temperature of 40 °C or 60 °C, a south-facing inclination of 35 °C, and a flow rate of 0.01 kg/s∙m2 or 0.02 kg/s∙m2. The performance of each solar collector was evaluated from the data for which the solar radiation was higher than 630 W/m2 and its variance was less than 50 W/m2.
For each collector, measurements were made over roughly a month using four different sets of inlet temperatures and flow rates, as listed in Table 2. The measurements were taken at 1-s intervals and were subsequently gathered into 5-min averages. Figure 3 shows the auxiliary experimental equipment.

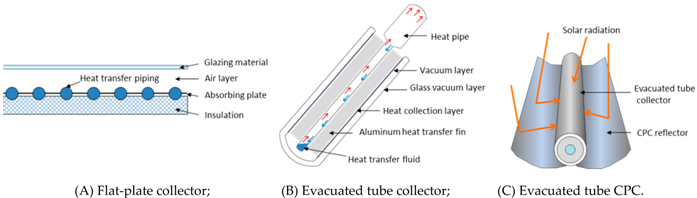
2.2. Solar Collectors

The performances of the seven solar collectors (including a general flat-plate one) were measured for different heating medium inlet temperatures (40 °C or 60 °C) and flow rates (0.01 or 0.02 kg/s∙m2). In these measurements, each case (1–6) was measured alongside the base case for comparison under the same weather conditions. Table 3 gives details about the solar collectors used in the experiments.
The solar collector of case 1 had 12 thin 55-mm evacuated tubes and a total area of 1.94 m2. The solar collector of case 2 had six evacuated tubes and was longer (2825 mm long and 115 mm wide) than a typical solar collector. A wider evacuated tube affords the advantage of a larger area with which to absorb solar radiation but has the drawback that the tube-exchanging cost increases when cracking occurs. Case 3 was an evacuated tube collector characterized by the inlet and outlet being placed under the panel. This made it easier to install this collector on a roof but runs the risk of reducing the solar collection efficiency because of heat convection.
Case 3 had 10 evacuated tubes, a total area of 1.82 m2, and a mass of 30 kg, making it the lightest of the featured systems. Case 4 was an evacuated tube compound parabolic concentrator (CPC) solar collector that had a reflective plate behind its evacuated tubes. The CPC reflector has the advantage of reducing the influence of the position of the sun, because it reflects solar radiation onto the evacuated tubes. The total area of case 4 was 2.28 m2, which was comparable to that of other common solar collectors while being shorter (1.39 m) and wider (1.64 m); with a mass of 37 kg, it was reasonably light.
Case 5 was a flat-plate solar collector that limits heat loss by having argon gas between its glazing and collector. Case 6 was also a flat-plate solar collector, in this case with a high transmittance of 96% owing to an anti-reflection (AR) coating. At 2.61 m2, case 6 had the largest area of the featured systems.

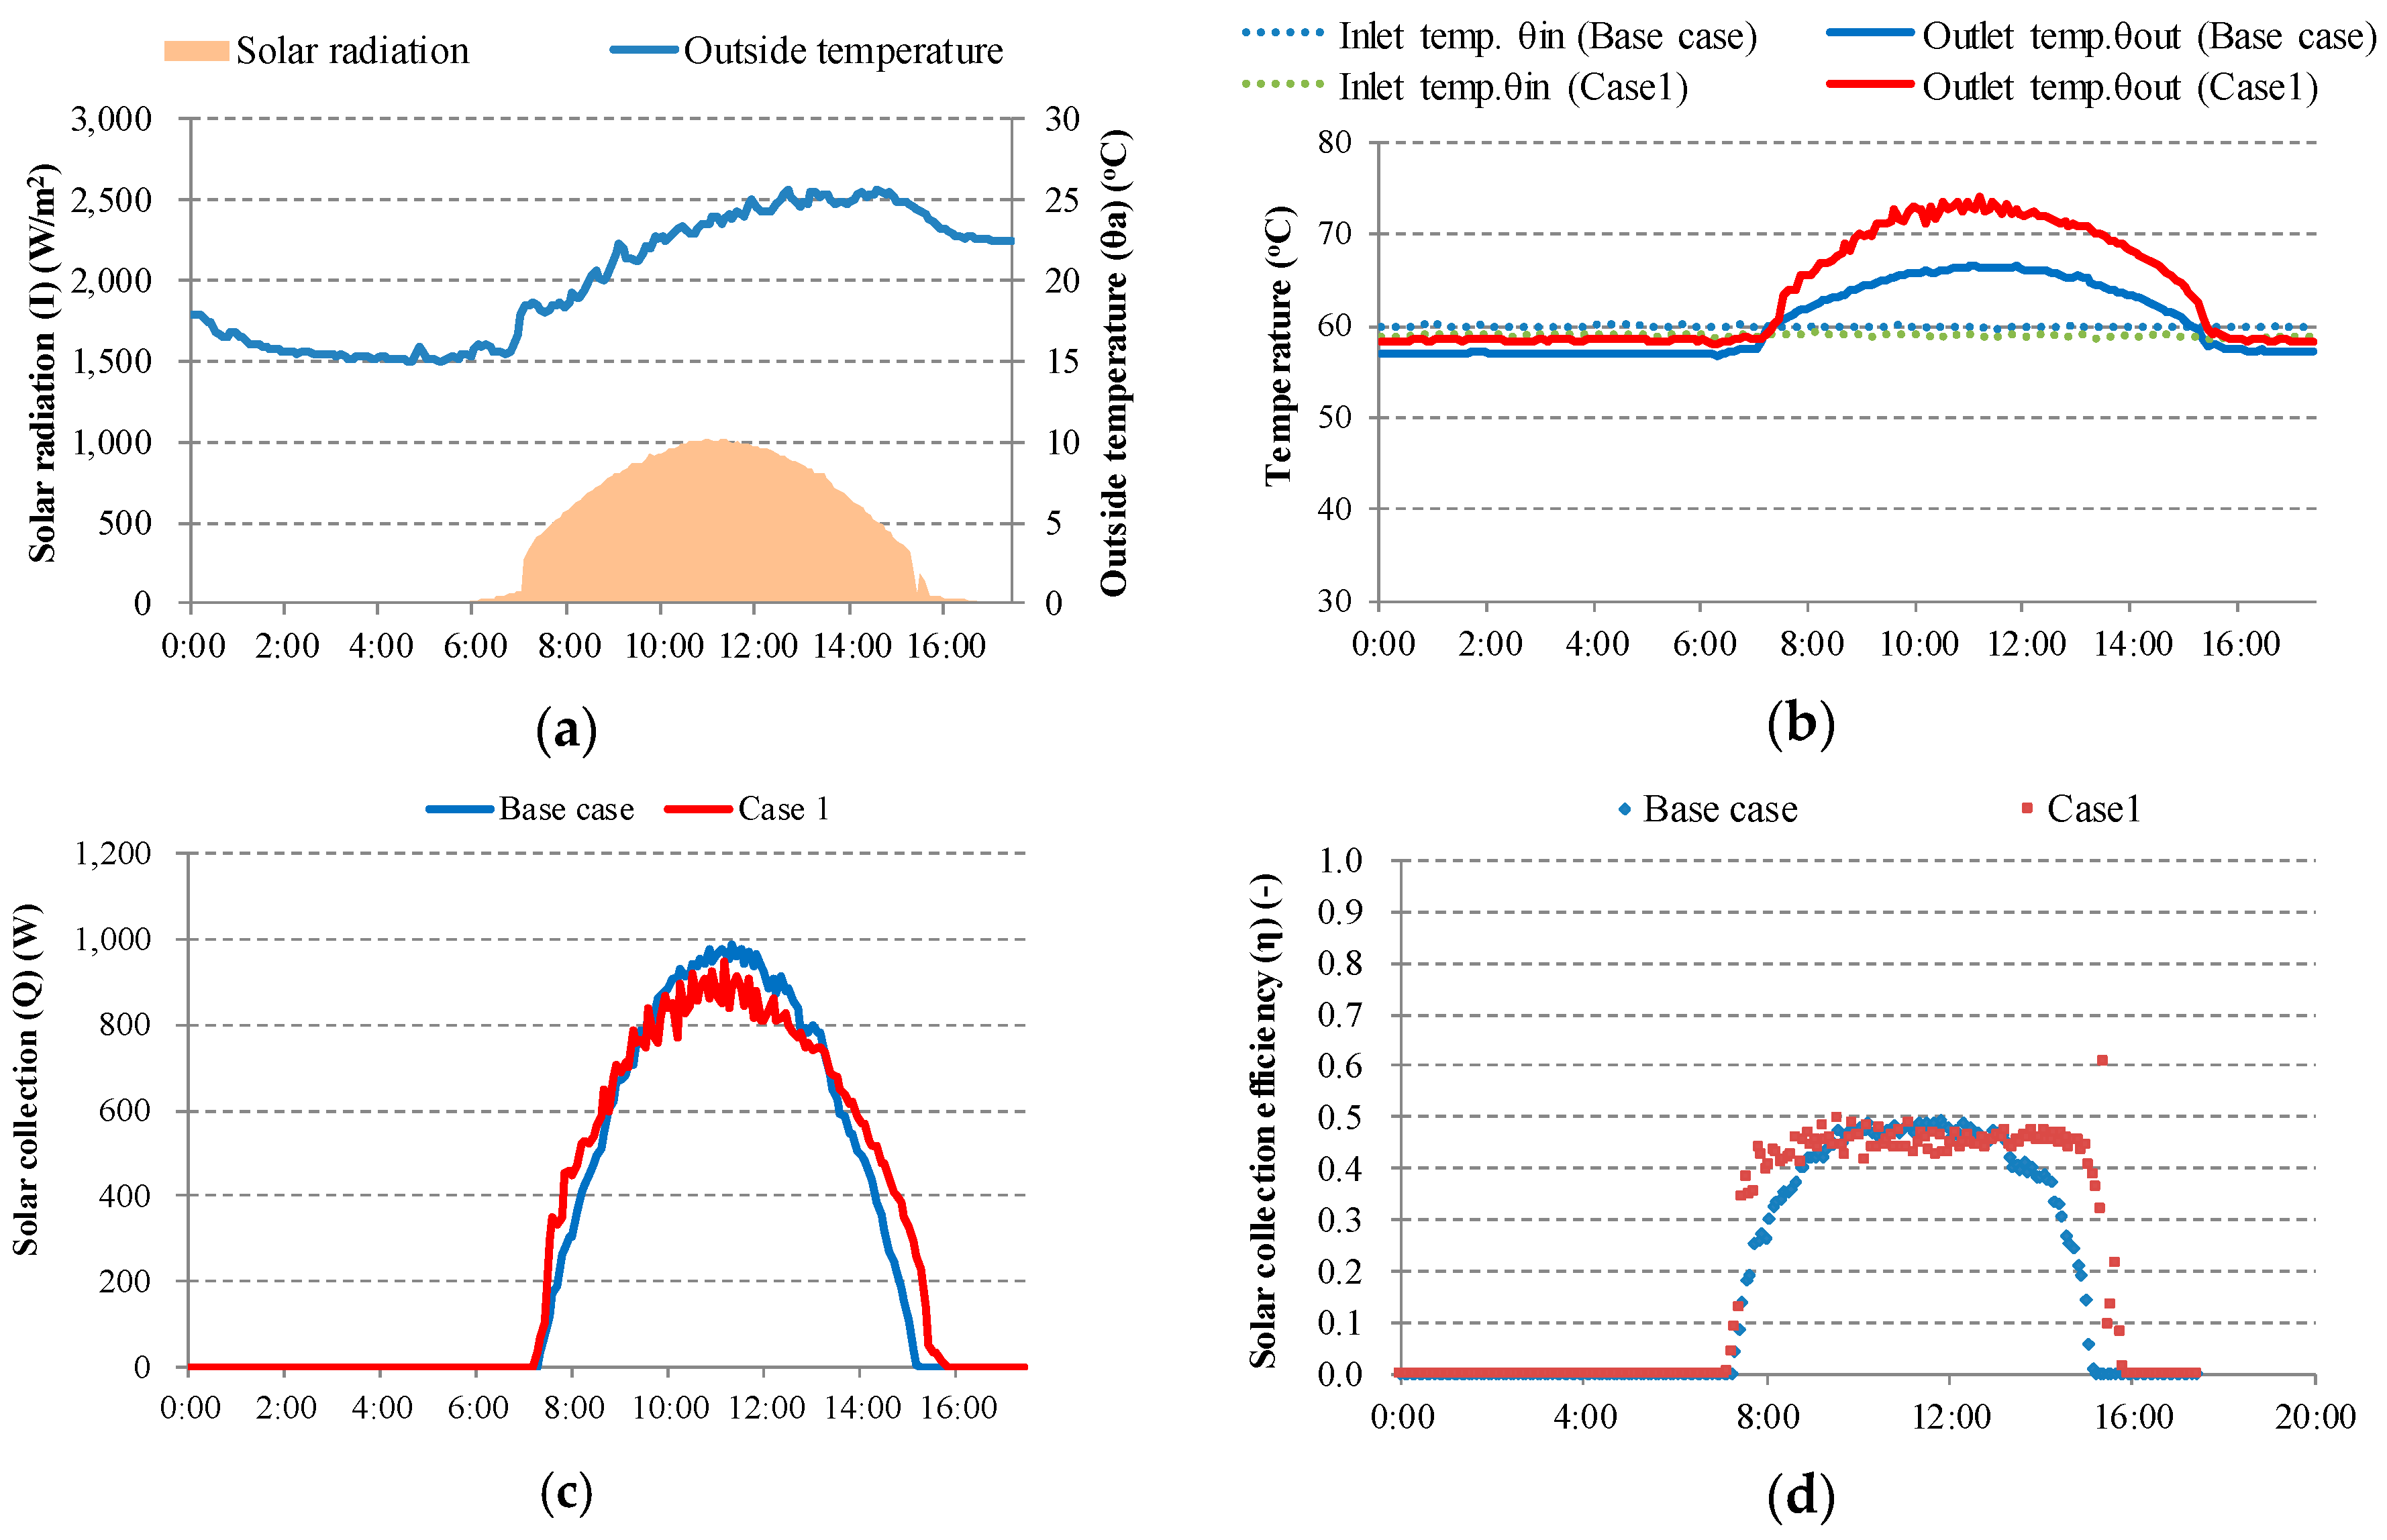
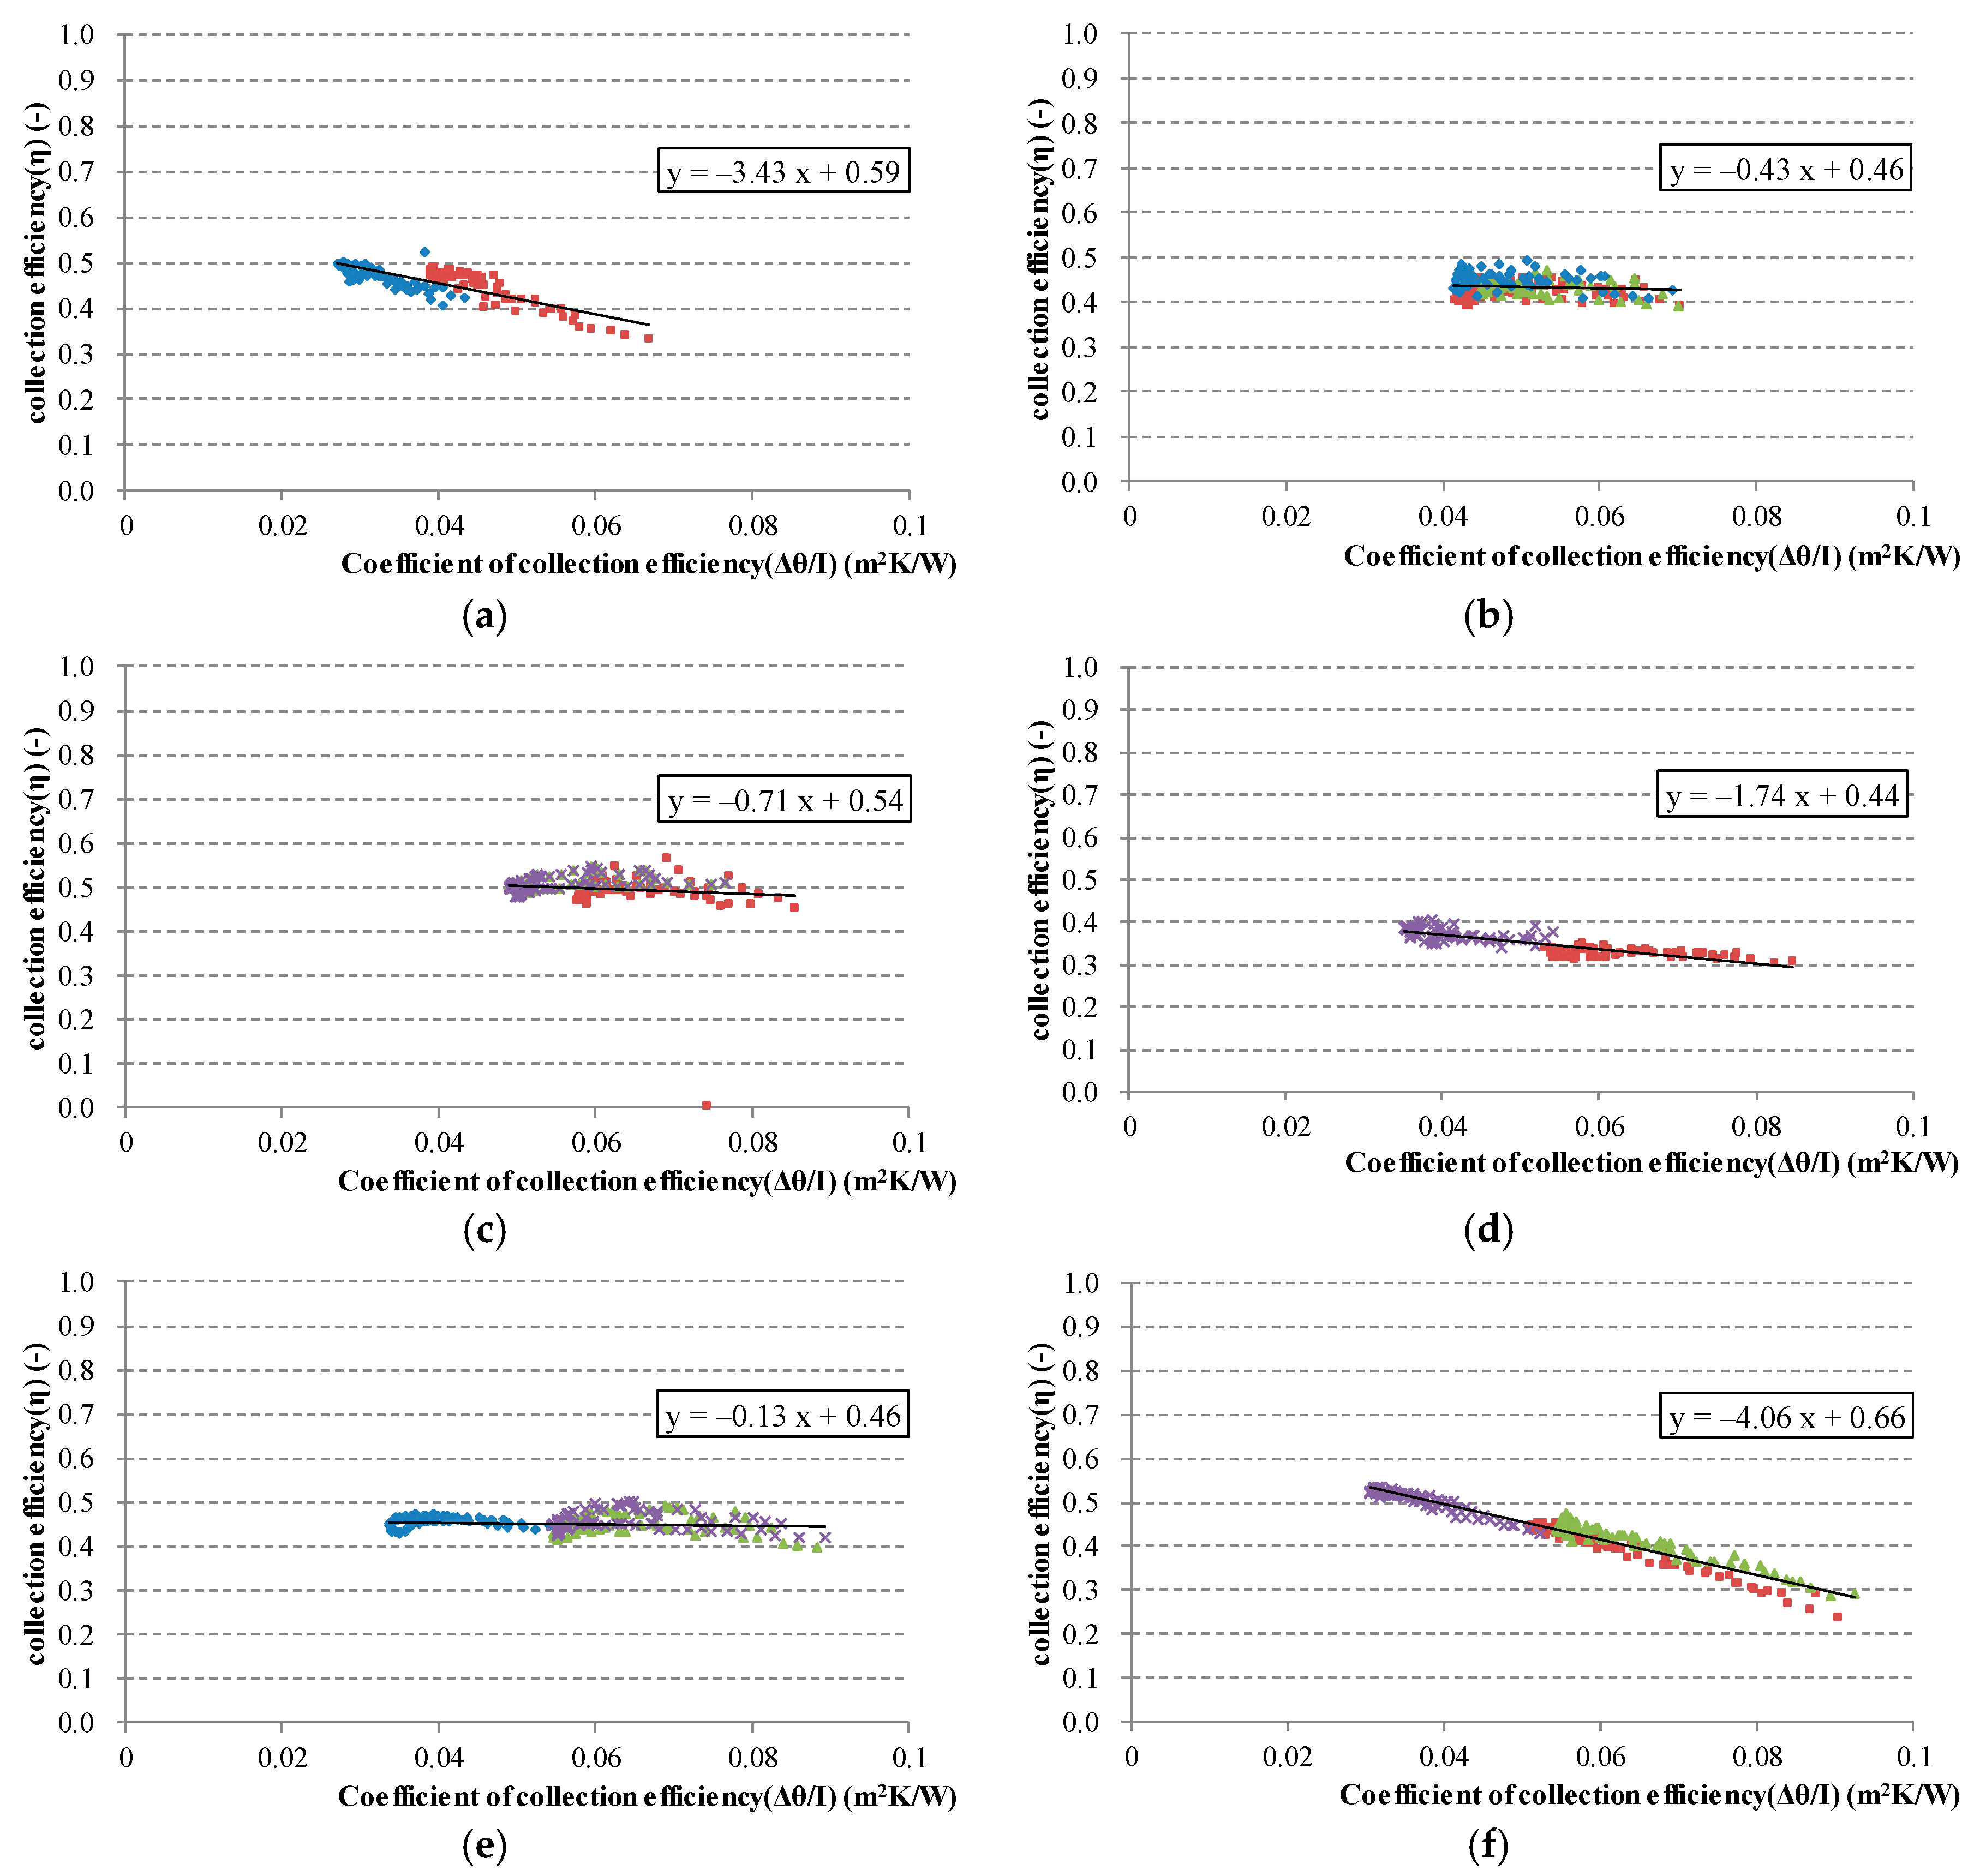
2.3. Calculation of Amount and Efficiency of Solar Collection

The amount and efficiency of the solar collection of each collector can be calculated using the following equations, which involve the horizontal and inclined solar radiation and the heating medium inlet and outlet temperatures of the solar collectors. The amount of the solar collection is calculated from the inlet/outlet temperature difference and the flow rate, and the efficiency of the solar collection is calculated from the ratio of the amount of the solar collection to the amount of the solar radiation.
Q = C × ρ × m × (Tout − Tin)
Q: amount of the solar collection (W);
C: specific heat of the heat transfer medium (J/kg∙K);
ρ: density of the heat transfer medium (kg/m3);
m: flow rate (m3/s);
Tout: outlet temperature of heating medium of the solar collector (°C);
Tin: inlet temperature of heating medium of the solar collector (°C);
η = Q/(I × A)
η: the solar collection efficiency (-);
I: inclined surface solar radiation (W/m2);
A: area of the solar collector (m2).
The instantaneous efficiency of the solar collector is defined as the ratio of the amount of the solar collection to the amount of solar radiation. It is possible to predict the efficiency of the solar collection by a characteristic diagram of the solar collection efficiency.
η = b0b1 × (ΔT/I)
ΔT = (TwTa);
Tw = (Tin + Tout)/2;
ΔT/I: the solar collection efficiency (m2 K/W);
Tw: average temperature of the heating medium in the collector (°C);
Ta: outside temperature (°C);
b0: overall solar absorptance (-);
b1: overall collector heat-loss coefficient (W/m2 K).

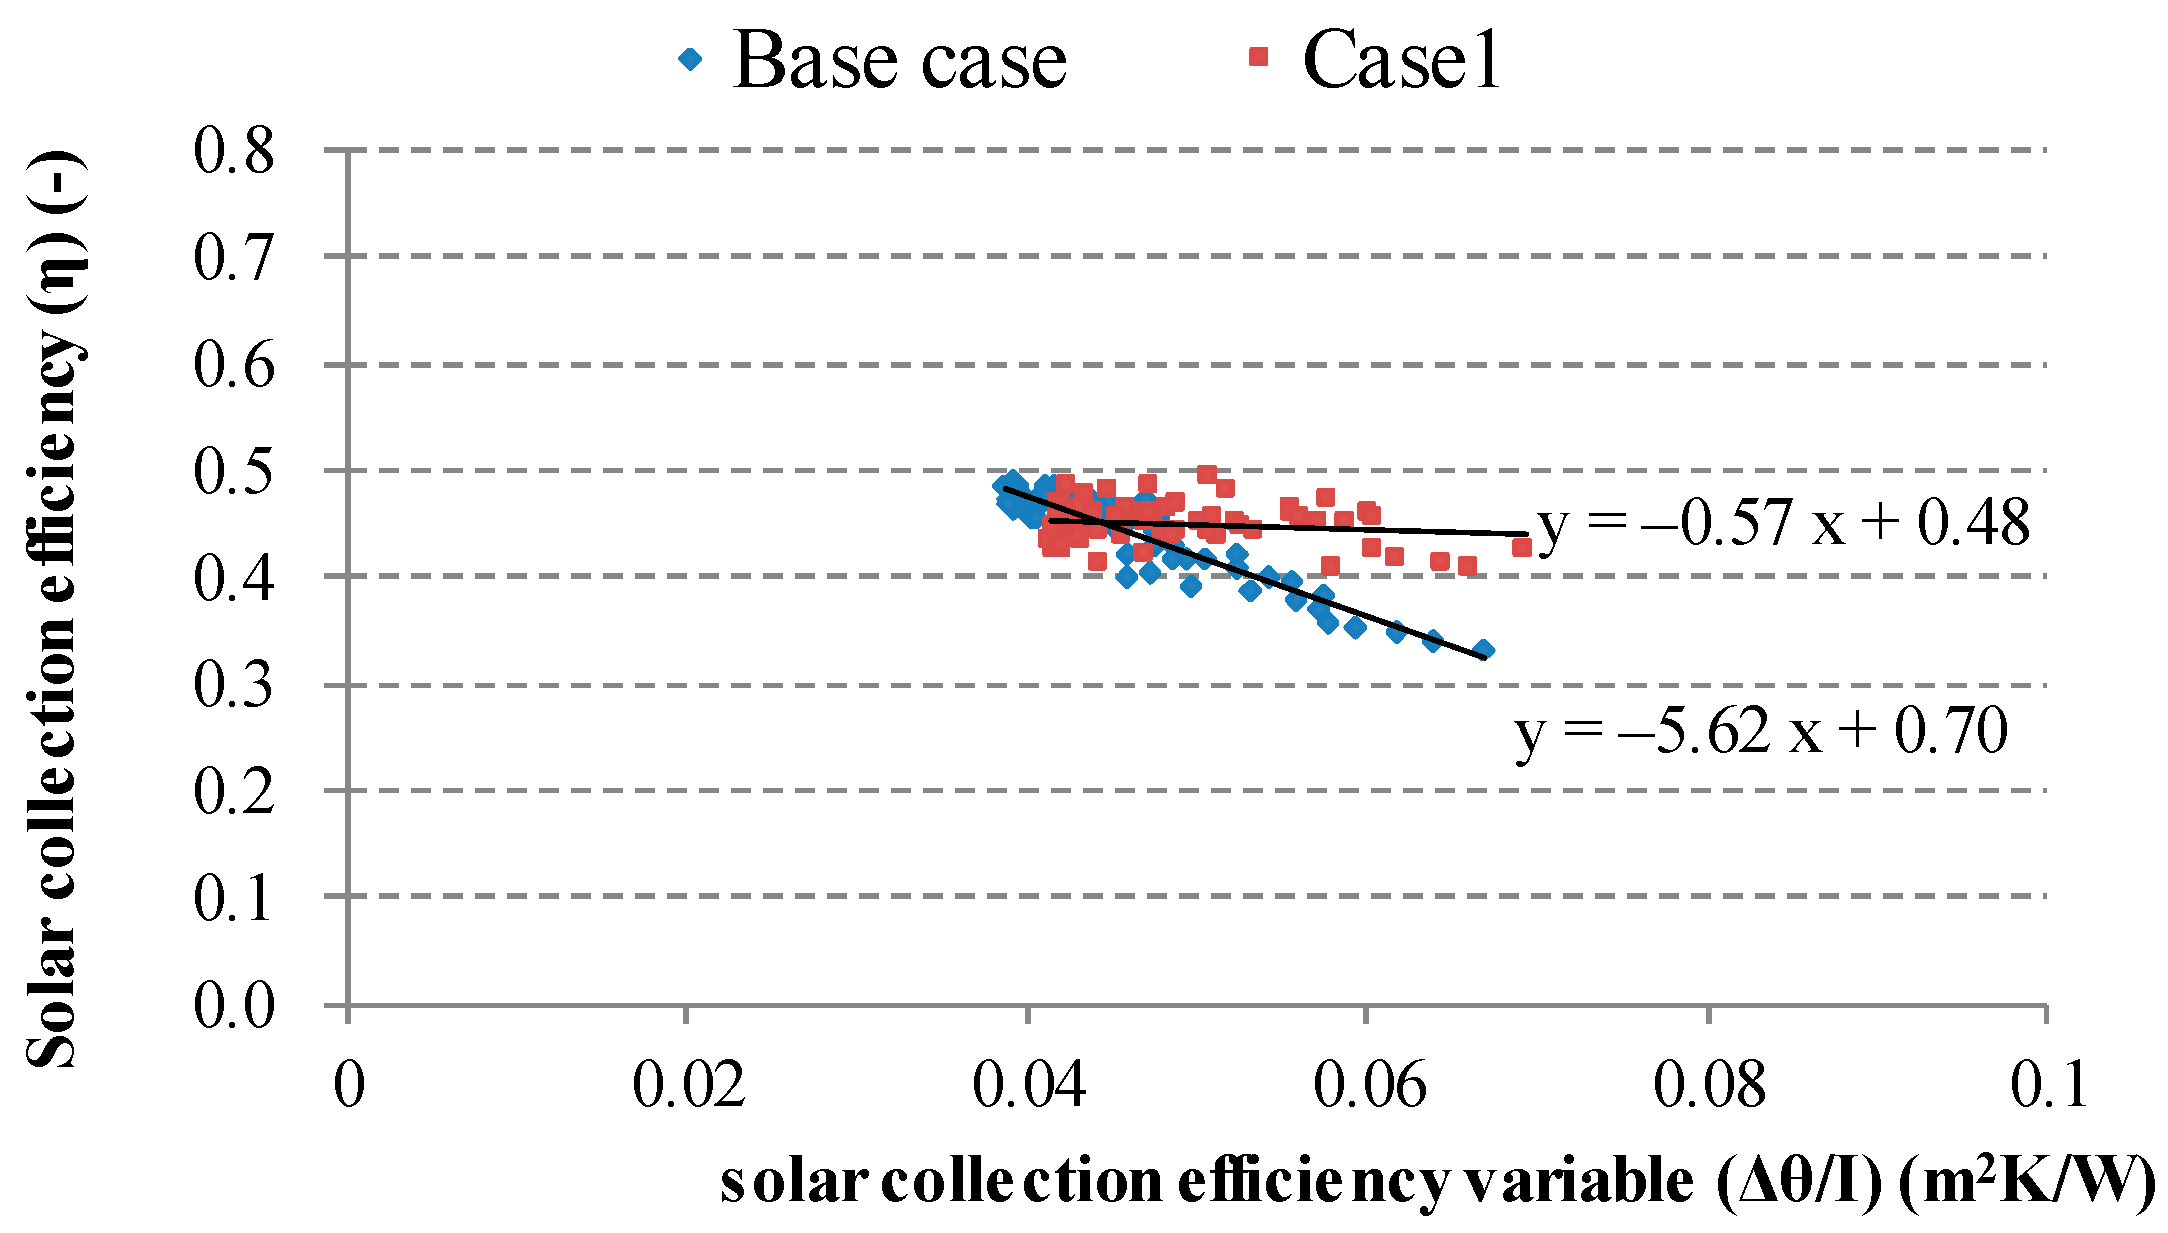
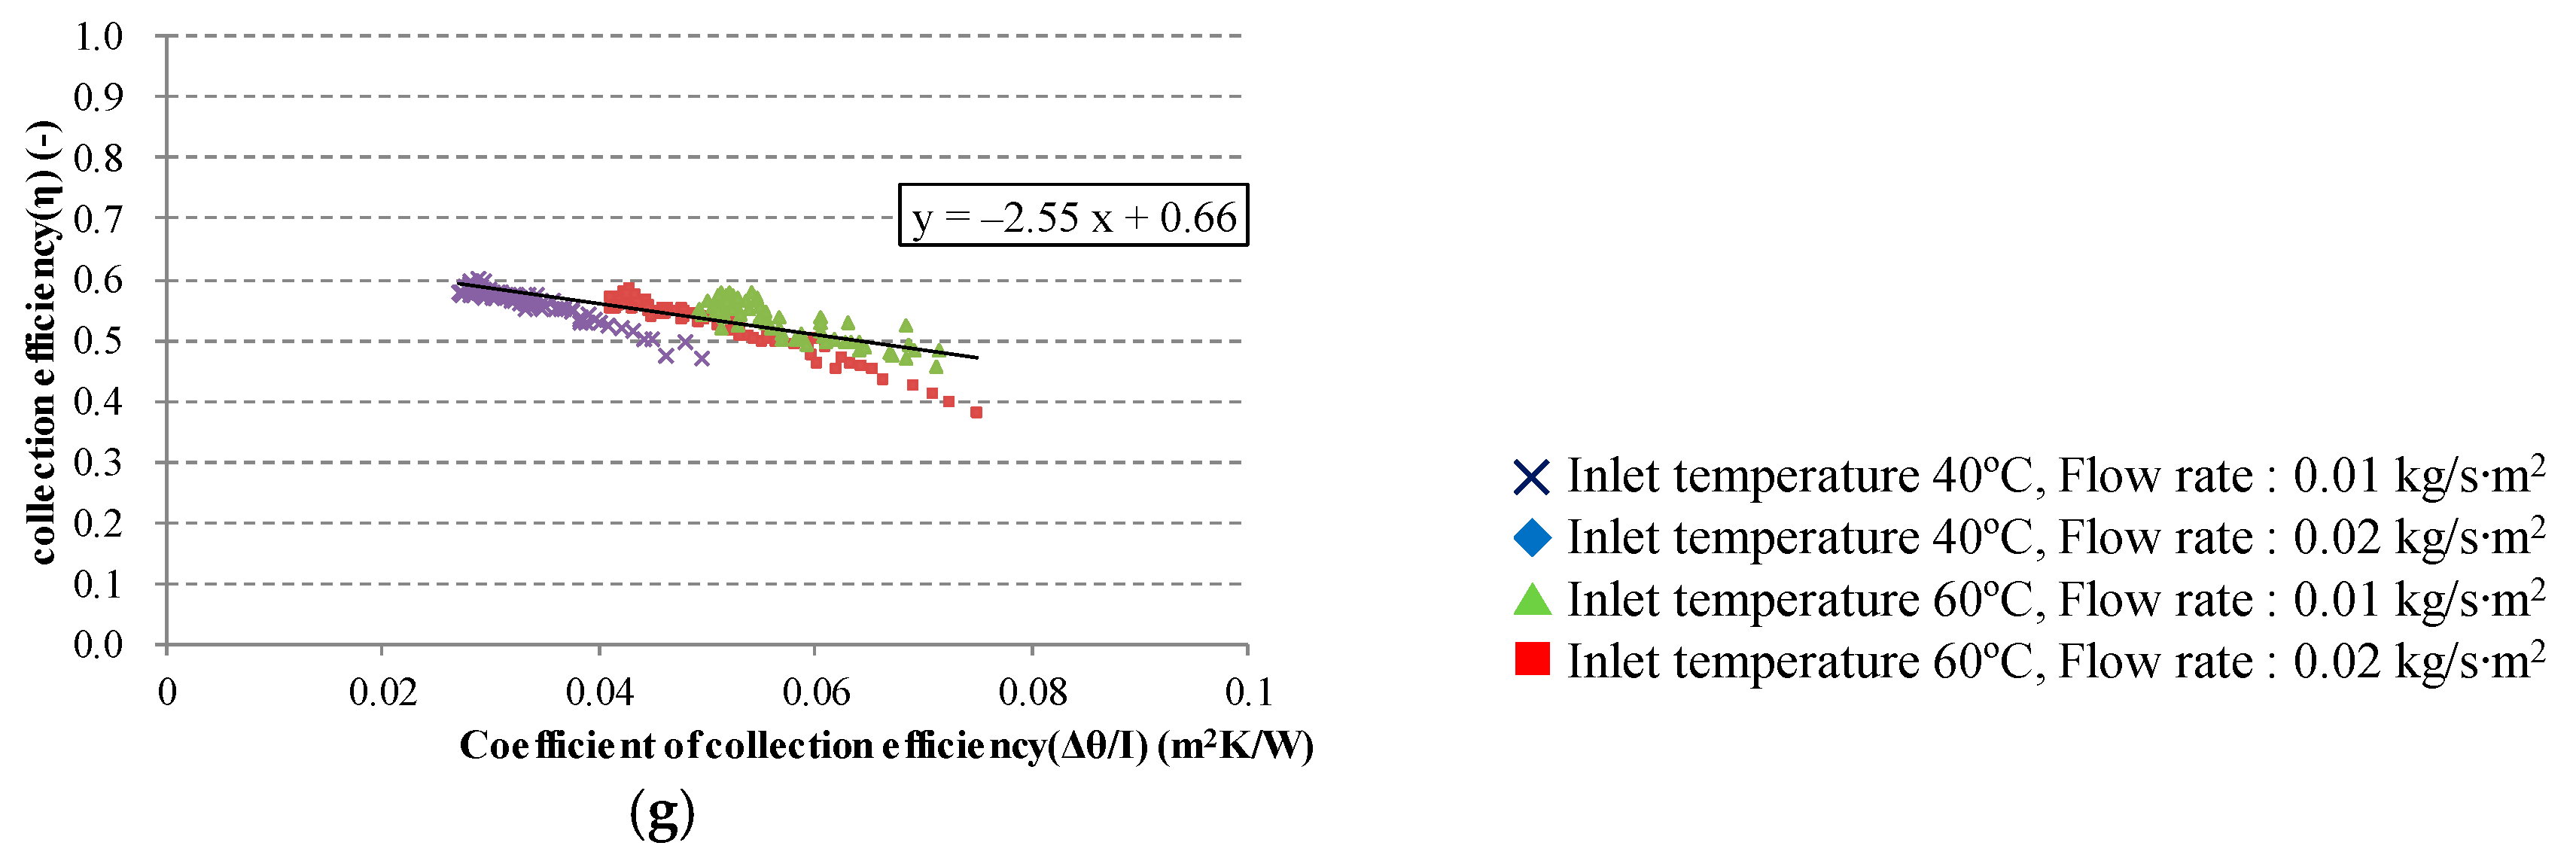
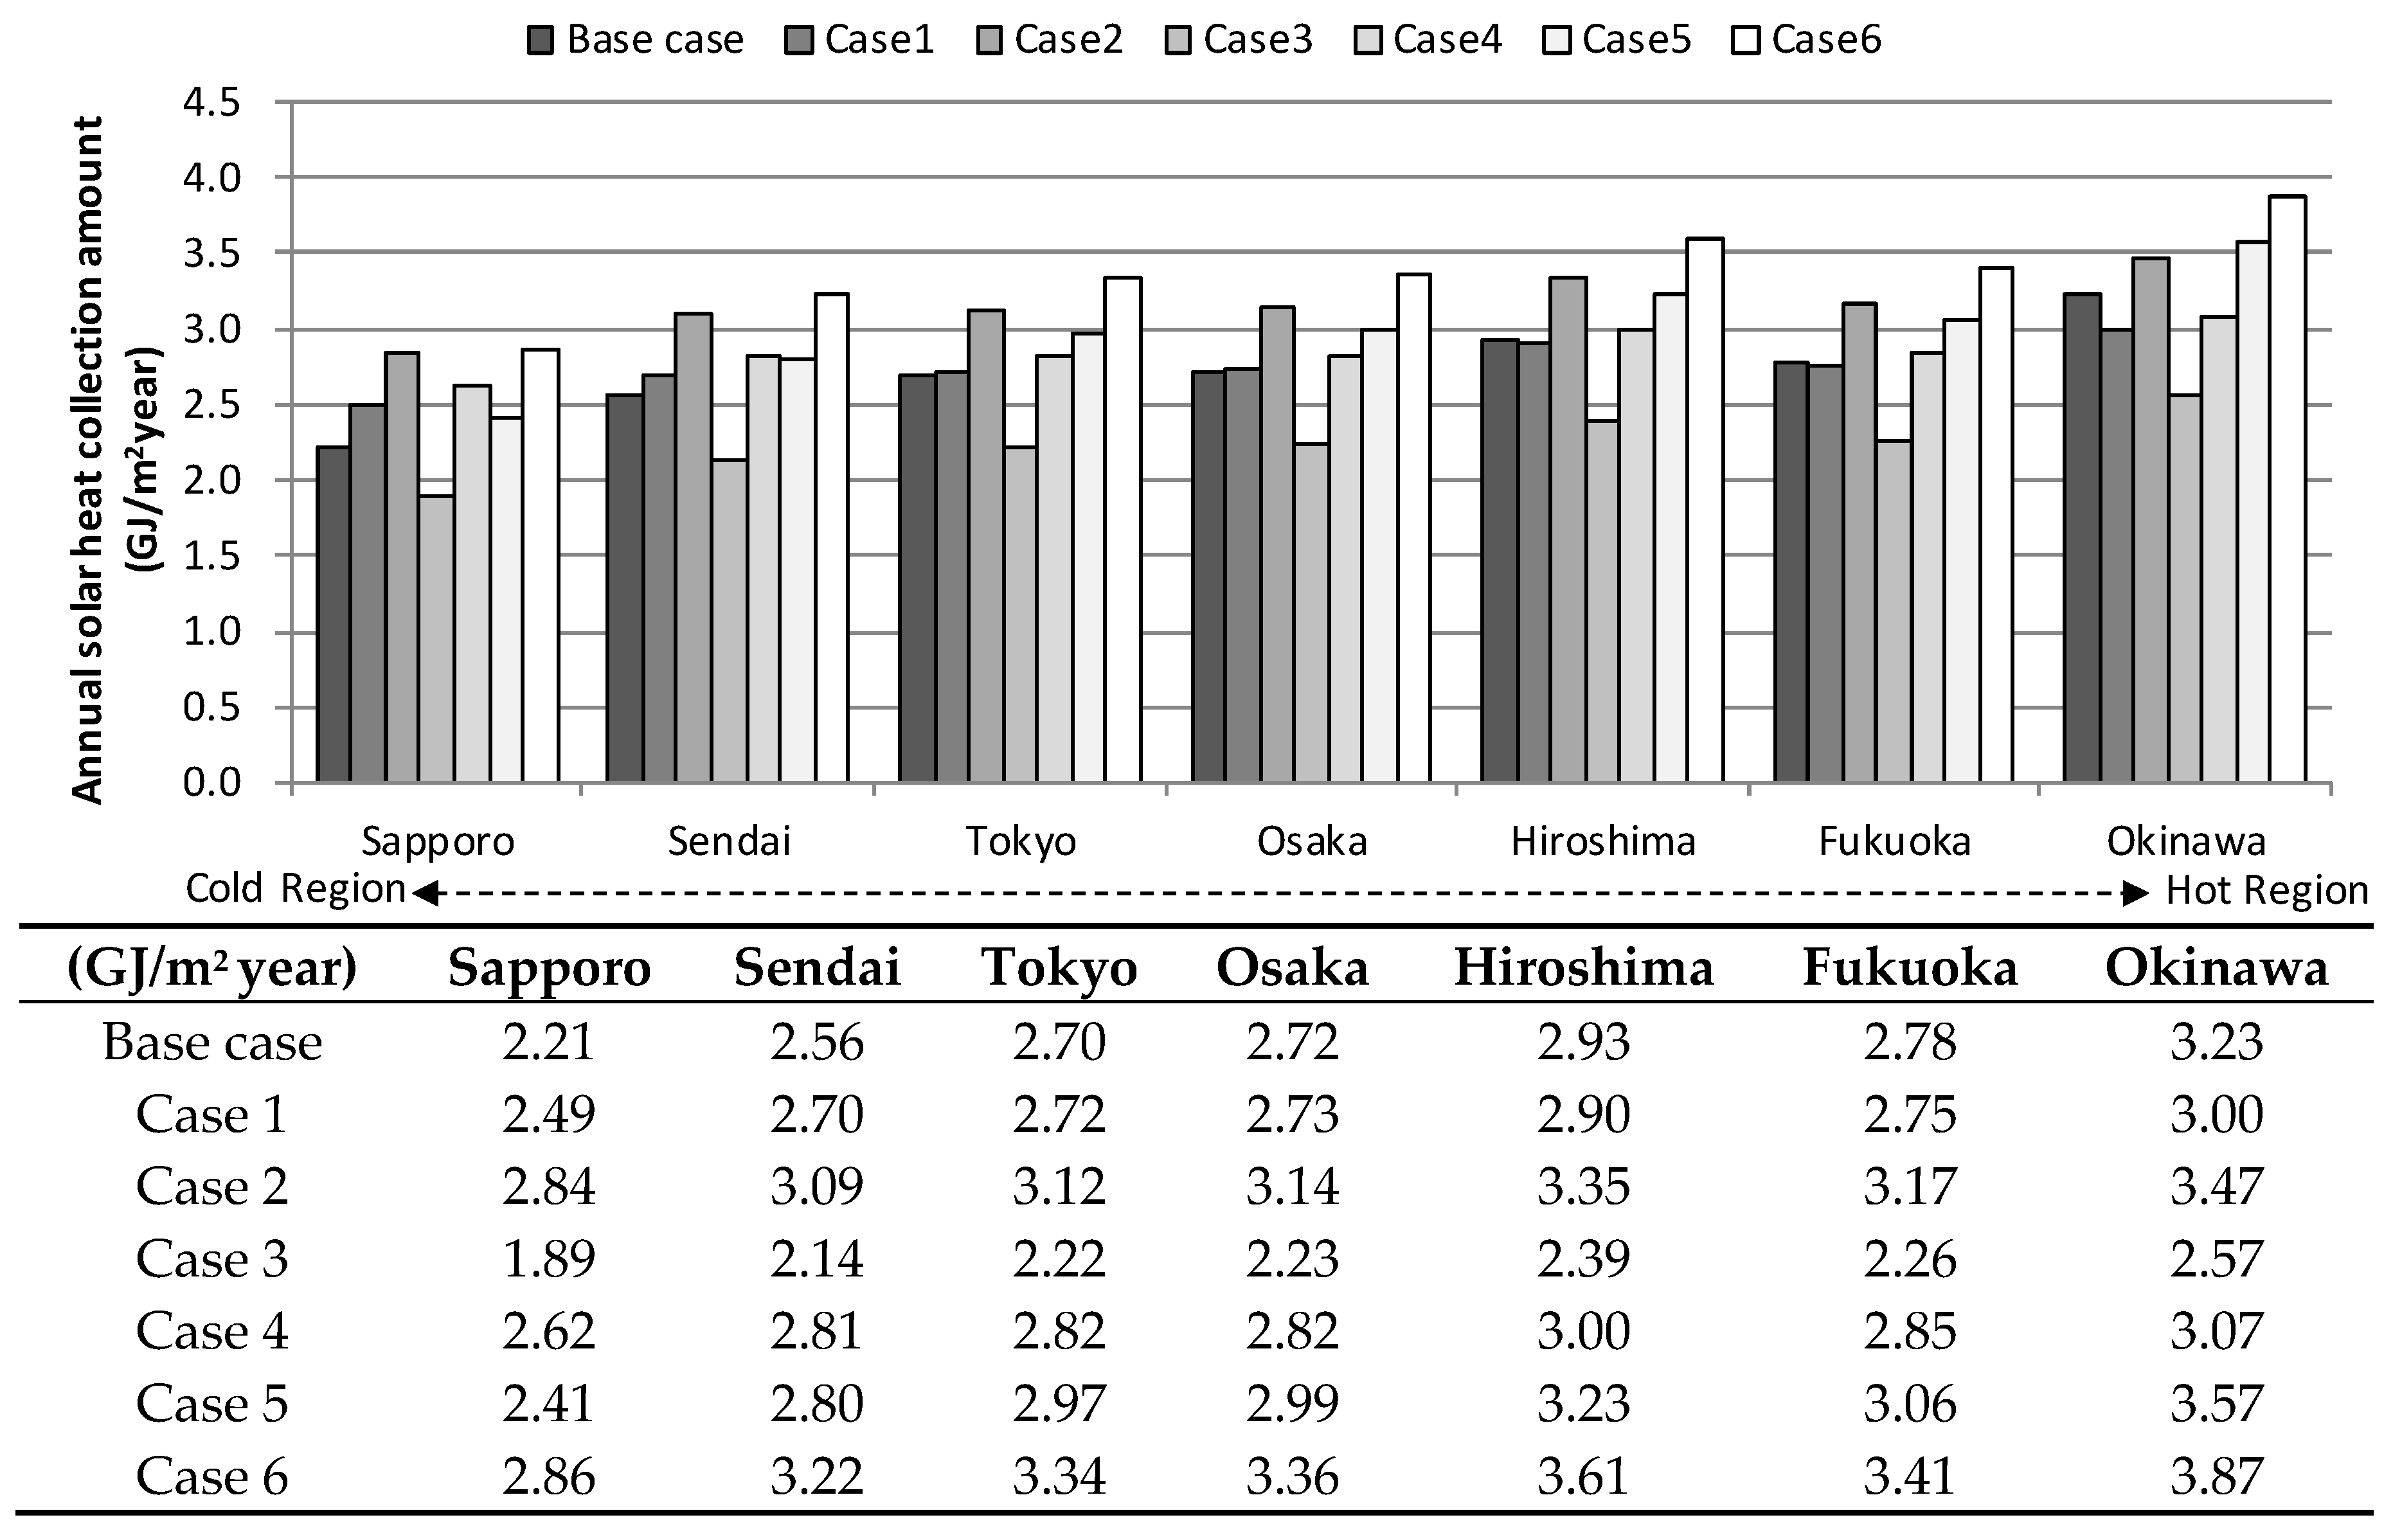
3. Experimental Results for Solar Collection Efficiency

Figure 4 shows the amount and efficiency of the solar collection of the base case and case 1 for an inlet temperature of 60 °C and a flow rate of 0.02 kg/s∙m2. Case 1 is compared with a general collector (base case) in relation to the outlet temperature, the amount of the solar collection, the solar collection efficiency, and the characteristic diagram of the solar collection efficiency.
The outlet temperature of case 1 is raised by roughly 13 °C at most for the 60 °C inlet temperature, which is roughly 6 °C higher than for the reference collector (base case). In the case of vacuum tubes (case 1), the efficiency of the solar collection remains approximately constant because less heat is lost to the surrounding air.
The solar efficiency curve is expressed by the linear equation or the quadratic equation of the parabola. In this study, the linear equation is used for the convenience of comparing the performance of the solar collectors [28]. As shown in Figure 5, the maximum solar collection efficiency of case 1 (b0), 0.48, is lower than that of the base case, 0.70. However, the solar collection efficiency of case 1 is better than that of the base case when the solar collection efficiency is high, such as when it is cold outside or the solar radiation is low, because the overall collector heat-loss coefficient (b1) of case 1, 0.57, is lower than that of the general collector, 5.62.
From the results for both inlet temperatures (40 °C and 60 °C) and flow rates (0.01 kg/s∙m2 and 0.02 kg/s∙m2) of the seven types of solar collector (i.e., the general collector and the six types of advanced solar collector), characteristic diagrams of the solar collection efficiency can be created. Because there were conditions under which no adequate results were measured, namely, low solar radiation (less than 630 W/m2) or high solar radiation variance (higher than 50 W/m2) [28], the characteristic diagrams of the solar collection efficiency are drawn based only on valid data. Figure 6 shows the characteristic diagram for each collector.
Table 4 lists the results for the characteristics of the solar collection efficiency (b0 and b1) and the root-mean-square error (RMSE) of linear regression. The average uncertainty of this solar collection efficiency experiment was 0.9–2.8%. From the results in Table 4, there are no significant differences in b0 or b1 despite changing the inlet temperature (measurements 1 and 2) and flow rate (measurements 3 and 4). The collectors with evacuated tubes (cases 1–4) have a higher slope (b1) but lower maximum solar collection efficiency (b0) than those for the flat-plate collectors (cases 5 and 6 and the base case). This means that the performance of the collectors may be changed depending on the installed climate.
Based on the extended Amedas weather data (for the standard year 2000) [31] of seven cities in Japan (Sapporo, Sendai, Tokyo, Osaka, Hiroshima, Fukuoka, and Okinawa), the annual solar collection per unit area of the collectors was calculated to investigate the changes in the solar collection owing to outside temperature and solar radiation. The collectors were installed at an angle of 30°. An average temperature of the heating medium in the collector (θw) of 40 °C was assumed, and there were no shadows from the surrounding buildings. Figure 7 shows the average outside temperature and the sum of global solar radiation on the inclined surface of each of the seven cities. Equations (4) and (5) are the solar direct/diffuse decomposition and the slope-side solar radiation equations, respectively [32].
Kc = (205163 + 0.333 sin h + 2022803 sin2 h) × IO × sin h
Kt = IG/(IO × sin h)
Id = IGIb × sin h
IG < KG
Ib = IO × (2.227 − 1.258sinh + 0.2396sin2h) × Kt3
IGKc
Ib = IO × (−0.43 + 1.43 × Kt)
Kc: contact point of linear and cubic equations (-);
IO: extraterrestrial solar radiation (MJ/(m2 h));
IG: global horizontal solar radiation (MJ/(m2 h));
h: solar altitude or elevation angle (°);
Kt: clearness index (-);
Ib: direct-beam solar radiation (MJ/(m2 h));
Id: diffuse horizontal solar radiation (MJ/(m2 h));
Iv = cosθ × Ib + φsky × Id
Iv: global solar radiation on inclined surface (MJ/m2 h);
θ: solar incident angle on inclined surface (°);
φsky: view factor against the sky on inclined plane (-).
Figure 8 shows the results of the solar collection per unit area based on the calculated solar radiation. In general, the order of the solar collection by collector type is similar in each region. However, case 4 has a larger solar collection than case 5 in cold regions, such as Sapporo and Sendai, because it has relatively low heat loss. By contrast, case 5 shows a larger solar collection in hot regions, because its reference heat efficiency (b0) is larger than that of case 4. In the conventional base case, less heat is collected in general than in case 1 or case 4. However, in hot regions such as Okinawa, the base case collects more heat than in case 1 and 4, because there is less heat loss. As described above, the solar collection performance varies depending on the outside temperature and solar radiation, and therefore, a preliminary examination is required when selecting a collector.

4. Conclusions

In this study, an experimental system that was compliant with ISO standards was prepared to evaluate the performance of seven liquid-type solar collectors. By using this experimental apparatus, the solar collection efficiency was measured for different heating medium inlet temperatures and flow rates, and the values were calculated for indices b0 and b1 of the solar collection performance of each collector. In addition, the amount of solar heat collected per unit area was calculated for seven regions in Japan to compare the solar collection performance for different weather conditions, such as the outside temperature and the amount of solar radiation. The results show that the solar collection performance is climate dependent and that it is necessary to select a suitable collector for each region through a preliminary examination of the solar collection in the initial design stage. For this consideration, it is necessary to carry out an experiment on the differences in solar heat collection according to region and to study the regional characteristics through a comparison with the calculated results. In addition, the design method for solar collectors for each climate should be presented through an analysis of the economic evaluation and characteristics of heat collection for selecting a suitable solar collector for each region.

Conflicts of Interest

The author declares no conflict of interest.

References

  1. Matsumoto, K.; Shiraki, H. Energy security performance in Japan under different socioeconomic and energy conditions. Renew. Sustain. Energy Rev. 2018, 90, 391–401. [Google Scholar] [CrossRef]
  2. Chapman, A.J.; Itaoka, K. Energy transition to a future low-carbon energy society in Japan’s liberalizing electricity market: Precedents, policies and factors of successful transition. Renew. Sustain. Energy Rev. 2018, 81, 2019–2027. [Google Scholar] [CrossRef]
  3. Kabir, E.; Kumar, P.; Kumar, S.; Adelodun, A.A.; Kim, K.H. Solar energy: Potential and future prospects. Renew. Sustain. Energy Rev. 2018, 82, 894–900. [Google Scholar] [CrossRef]
  4. González, D.F.; Ruiz-Bustinza, I.; Piñuela, J.; Verdeja, L.F.; Fernández-González, D.; Ruiz-Bustinza, Í.; González-Gasca, C.; Noval, J.P.; Mochón-Castaños, J.; Sancho-Gorostiaga, J. Ferromanganese alloy production improvement: Conversion of high manganese residues into new secondary raw materials for the steelmaking and ferroalloy industry. View project Investigation and evaluation of solar energy as energy source in the treatment of metallurgical by-products (P1701250238). View project Concentrated solar energy applications in materials science and metallurgy. Sol. Energy 2018, 170, 520–540. [Google Scholar] [CrossRef]
  5. Ge, T.S.; Wang, R.Z.; Xu, Z.Y.; Pan, Q.W.; Du, S.; Chen, X.M.; Ma, T.; Wu, X.N.; Sun, X.L.; Chen, J.F. Solar heating and cooling: Present and future development. Renew. Energy 2017, 126, 1126–1140. [Google Scholar] [CrossRef]
  6. Settino, J.; Sant, T.; Micallef, C.; Farrugia, M.; Spiteri Staines, C.; Licari, J.; Micallef, A. Overview of solar technologies for electricity, heating and cooling production. Renew. Sustain. Energy Rev. 2018, 90, 892–909. [Google Scholar] [CrossRef]
  7. Shams, S.M.N.; Mc Keever, M.; Mc Cormack, S.; Norton, B. Design and experiment of a new solar air heating collector. Energy 2016, 100, 374–383. [Google Scholar] [CrossRef]
  8. Zhou, F.; Ji, J.; Cai, J.; Yu, B. Experimental and numerical study of the freezing process of flat-plate solar collector. Appl. Therm. Eng. 2017, 118, 773–784. [Google Scholar] [CrossRef]
  9. Amer, E.H.; Nayak, J.K.; Sharma, G.K. Transient method for testing flat-plate solar collectors. Energy Convers. Manag. 1998, 39, 549–558. [Google Scholar] [CrossRef]
  10. Kanayama, K.; Baba, H. Analysis and experiment of the performance of a flat-plate solar collector considering the wavelength dependence. Sol. Wind Technol. 1989, 6, 51–58. [Google Scholar] [CrossRef]
  11. Michaelides, I.M.; Eleftheriou, P.C. An experimental investigation of the performance boundaries of a solar water heating system. Exp. Therm. Fluid Sci. 2011, 35, 1002–1009. [Google Scholar] [CrossRef]
  12. Zhang, D.; Li, J.; Gao, Z.; Wang, L.; Nan, J. Thermal performance investigation of modified flat plate solar collector with dual-function. Appl. Therm. Eng. 2016, 108, 1126–1135. [Google Scholar] [CrossRef]
  13. Huang, B.J.; Du, S.C. A Performance Test Method of Solar Thermosyphon Systems. J. Sol. Energy Eng. Trans. ASME 1991, 113, 172. [Google Scholar] [CrossRef]
  14. Nie, X.; Zhao, L.; Deng, S.; Lin, X. Experimental study on thermal performance of U-type evacuated glass tubular solar collector with low inlet temperature. Sol. Energy 2017, 150, 192–201. [Google Scholar] [CrossRef]
  15. Wei, L.; Yuan, D.; Tang, D.; Wu, B. A study on a flat-plate type of solar heat collector with an integrated heat pipe. Sol. Energy 2013, 97, 19–25. [Google Scholar] [CrossRef]
  16. Zukowski, M.; Woroniak, G. Experimental testing of ceramic solar collectors. Sol. Energy 2017, 146, 532–542. [Google Scholar] [CrossRef]
  17. Chen, G.; Doroshenko, A.; Koltun, P.; Shestopalov, K. Comparative field experimental investigations of different flat plate solar collectors. Sol. Energy 2015, 115, 577–588. [Google Scholar] [CrossRef]
  18. Tamvakidis, S.; Firfiris, V.K.; Martzopoulou, A.; Fragos, V.P.; Kotsopoulos, T.A. Performance evaluation of a hybrid solar heating system for farrowing houses. Energy Build. 2015, 97, 162–174. [Google Scholar] [CrossRef]
  19. Gao, Y.; Fan, R.; Zhang, X.Y.; An, Y.J.; Wang, M.X.; Gao, Y.K.; Yu, Y. Thermal performance and parameter analysis of a U-pipe evacuated solar tube collector. Sol. Energy 2014, 107, 714–727. [Google Scholar] [CrossRef]
  20. Deng, J.; Yang, X.; Wang, P. Study on the second-order transfer function models for dynamic tests of flat-plate solar collectors Part I: A proposed new model and a fitting methodology. Sol. Energy 2015, 114, 418–426. [Google Scholar] [CrossRef]
  21. Deng, J.; Yang, X.; Wang, P. ScienceDirect Study on the second-order transfer function models for dynamic tests of flat-plate solar collectors Part II : Experimental validation. Sol. Energy 2017, 141, 334–346. [Google Scholar] [CrossRef]
  22. Deng, J.; Ma, R.; Yuan, G.; Chang, C.; Yang, X. Dynamic thermal performance prediction model for the flat-plate solar collectors based on the two-node lumped heat capacitance method. Sol. Energy 2016, 135, 769–779. [Google Scholar] [CrossRef]
  23. Deng, J.; Yang, M.; Ma, R.; Zhu, X.; Fan, J.; Yuan, G.; Wang, Z. Validation of a simple dynamic thermal performance characterization model based on the piston flow concept for flat-plate solar collectors. Sol. Energy 2016, 139, 171–178. [Google Scholar] [CrossRef]
  24. Sowmy, D.S.; Schiavon Ara, P.J.; Prado, R.T.A. Uncertainties associated with solar collector efficiency test using an artificial solar simulator. Renew. Energy 2017, 108, 644–651. [Google Scholar] [CrossRef]
  25. Azad, E. Experimental analysis of thermal performance of solar collectors with different numbers of heat pipes versus a flow-through solar collector. Renew. Sustain. Energy Rev. 2018, 82, 4320–4325. [Google Scholar] [CrossRef]
  26. Fan, M.; Liang, H.; You, S.; Zhang, H.; Yin, B.; Wu, X. Applicability analysis of the solar heating system with parabolic trough solar collectors in different regions of China. Appl. Energy 2018, 221, 100–111. [Google Scholar] [CrossRef]
  27. Zheng, W.; Zhang, H.; You, S.; Fu, Y.; Zheng, X. Thermal performance analysis of a metal corrugated packing solar air collector in cold regions. Appl. Energy 2017, 203, 938–947. [Google Scholar] [CrossRef]
  28. International Organization for Standardization. Test Methods for Solar Collectors—Part 1: Thermal Performance of Glazed Liquid Heating Collectors Including Pressure Drop; ISO9806-1; International Organization for Standardization: Geneva, Switzerland, 1994. [Google Scholar]
  29. American Society of Heating, Refrigerating and Air-Conditioning Engineers. Thermal Environmental Conditions for Human Occupancy; ANSI/ASHRAE 55:2004; American Society of Heating, Refrigerating and Air-Conditioning Engineers: New York, NY, USA, 2004. [Google Scholar]
  30. American Society of Heating, Refrigerating and Air-Conditioning Engineers. Methods of Testing to Determine the Thermal Performance of Solar Collectors; ANSI/ASHRAE 93-1986 (RA 91); American Society of Heating, Refrigerating and Air-Conditioning Engineers: New York, NY, USA, 1991. [Google Scholar]
  31. Akasaka, H. Expanded AMeDAS weather data 1981-2000; Architectural Institute of Japan: Tokyo, Japan, 2005. [Google Scholar]
  32. Udagawa, M.; Kimura, K. The estimation of direct solar radiation from global radiation. Archit. Inst. Japan 1978, 267, 83–90. [Google Scholar] [CrossRef]
Figure 1. Schematic of experimental arrangement.
Energies 11 01626 g001
Figure 2. Collector performance testing equipment.
Energies 11 01626 g002
Figure 3. Auxiliary experimental equipment. (a) Hot water tank and pumps; (b) Heat exchanger; (c) Data logger; (d) Control panel; and (e) Needle valve.
Energies 11 01626 g003
Figure 4. Results of the solar collection performance (base case and case 1). (a) Weather data; (b) Inlet and outlet temperature; (c) Solar collection; (d) Solar collection efficiency.
Energies 11 01626 g004
Figure 5. Comparison of the solar collection efficiency (base case and case 1).
Energies 11 01626 g005
Figure 6. The solar collection efficiency characteristic diagrams of seven types of solar collectors and amount of the annual solar collection. (a) Base case; (b) Case 1; (c) Case 2; (d) Case 3; (e) Case 4; (f) case5; (g) Case 6.
Energies 11 01626 g006aEnergies 11 01626 g006b
Figure 7. Outside temperature and global solar radiation on inclined surface of each city.
Energies 11 01626 g007
Figure 8. Amount of the solar collection per unit area under seven different weather conditions.
Energies 11 01626 g008
Table 1. Measurement targets and measuring equipment.
ItemMeasurement TargetEquipment UsedRangeAccuracy
O1Outside temperature (°C) Composite meteorological equipment−50–60 °C±1.0%
Outside humidity (%)Composite meteorological equipment0–100%RH±1.0%
O2Wind direction (°)Anemometer0–360°±5.0°
Wind velocity (m/s)Anemometer0–40 m/s±0.3 m/s
O3Direct solar radiation (W/m2)Direct solar radiation meter0–4000 W/m2±0.2%
O4Inclined solar radiation (W/m2)Solar radiation meter0–4000 W/m²±0.5%
O5x-axis wind speed (m/s)Ultrasonic anemometer0–40 m/s±1.0%
O6y-axis wind speed (m/s)Ultrasonic anemometer0–40 m/s±1.0%
O7z-axis wind speed (m/s)Ultrasonic anemometer0–40 m/s±1.0%
T1Solar collector A inlet heating medium temperature (°C)Pt100−200–500 °C±0.15 °C
T2Solar collector A outlet heating medium temperature (°C)Pt100−200–500 °C±0.15 °C
T3Solar collector B inlet heating medium temperature (°C)Pt100−200–500 °C±0.15 °C
T4Solar collector B heating medium outlet temperature (°C)Pt100−200–500 °C±0.15 °C
T5Cooling solar exchanger inlet temperature (°C)T-type thermocouple−40–133 °C±1.0 °C
T6Cooling solar exchanger outlet temperature (°C)T-type thermocouple−40–133 °C±1.0 °C
T7Heating solar exchanger inlet temperature (°C)T-type thermocouple−40–133 °C±1.0 °C
T8Heating solar exchanger outlet temperature (°C)T-type thermocouple−40–133 °C±1.0 °C
F1Solar collector A flow rate (L/min)Impeller-type flow sensor1.5–20 L/min±5.0%
F2Solar collector B flow rate (L/min)Impeller-type flow sensor1.5–20 L/min±5.0%
F3Solar collector A flow rate (L/min)Electromagnetic flow sensor0.25–5 L/min±1.0%
F4Solar collector B flow rate (L/min)Electromagnetic flow sensor0.25–5 L/min±1.0%
Table 2. Measurement conditions.
Measurement
Measurement 1Inlet temperature: 40 °C; flow rate: 0.01 kg/s∙m2
Measurement 2Inlet temperature: 40 °C; flow rate: 0.02 kg/s∙m2
Measurement 3Inlet temperature: 60 °C; flow rate: 0.01 kg/s∙m2
Measurement 4Inlet temperature: 60 °C; flow rate: 0.02 kg/s∙m2
Table 3. Solar collectors used in the experiments.
CaseTypeDimensions (mm) Test PeriodWeight (kg)AppearanceRemark
BaseFlat plate2002 × 1002 × 60 (2.01 m2)
14 September 2012–3 February 2013
37 Energies 11 01626 i001-
1Evacuated tube1980 × 980 × 140 (1.94 m2)
14 September 2012–30 October 2012
53 Energies 11 01626 i002
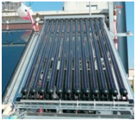
12 55-mm pieces of thin vacuum tube
2Evacuated tube2825 × 866 × 179 (2.45 m2)
1 November 2012–2 December 2012
60 Energies 11 01626 i003
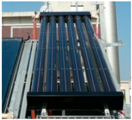
6 115-mm pieces of thick vacuum tube
3Evacuated tube2130 × 856 × 116 (1.82 m2)
4 December 2012–6 January 2013
30 Energies 11 01626 i004Inlet/outlet located on the lower
10 pieces of vacuum tube
4Evacuated tube (compound parabolic concentrator (CPC) reflector)1390 × 1640 × 120 (2.28 m2)
8 January 2013–3 February 2013
37 Energies 11 01626 i005Condensing plate behind vacuum tube
5Flat-plate2070 × 1145 × 90 (2.37 m2)
5 February 2013–14 March 2013
46 Energies 11 01626 i006Argon gas inclusion between glazing and collector
6Flat-plate2151 × 1215 × 110 (2.61 m2)
16 March 2013–10 May 2013
48 Energies 11 01626 i007
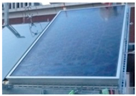
AR coating ⟶ transmittance 96%
Energies 11 01626 i008
Table 4. Solar collection efficiency characteristics and root-mean-square-error (RMSE).
Casesb0b1RMSE
Measurement 1Measurement 2Measurement 3Measurement 4
Base case0.59−3.430.023-0.016-
Case 10.46−0.430.0230.0160.022-
Case 20.54−0.710.0210.020-0.020
Case 30.44−1.740.014--0.014
Case 40.46−0.13-0.0240.0120.021
Case 50.66−4.060.0180.017-0.009
Case 60.66−2.550.0240.028-0.019

