The Periodic Characteristics of China’s Economic Carbon Intensity Change and the Impacts of Economic Transformation

Abstract
1. Introduction
2. Methodology
3. Decomposition Results
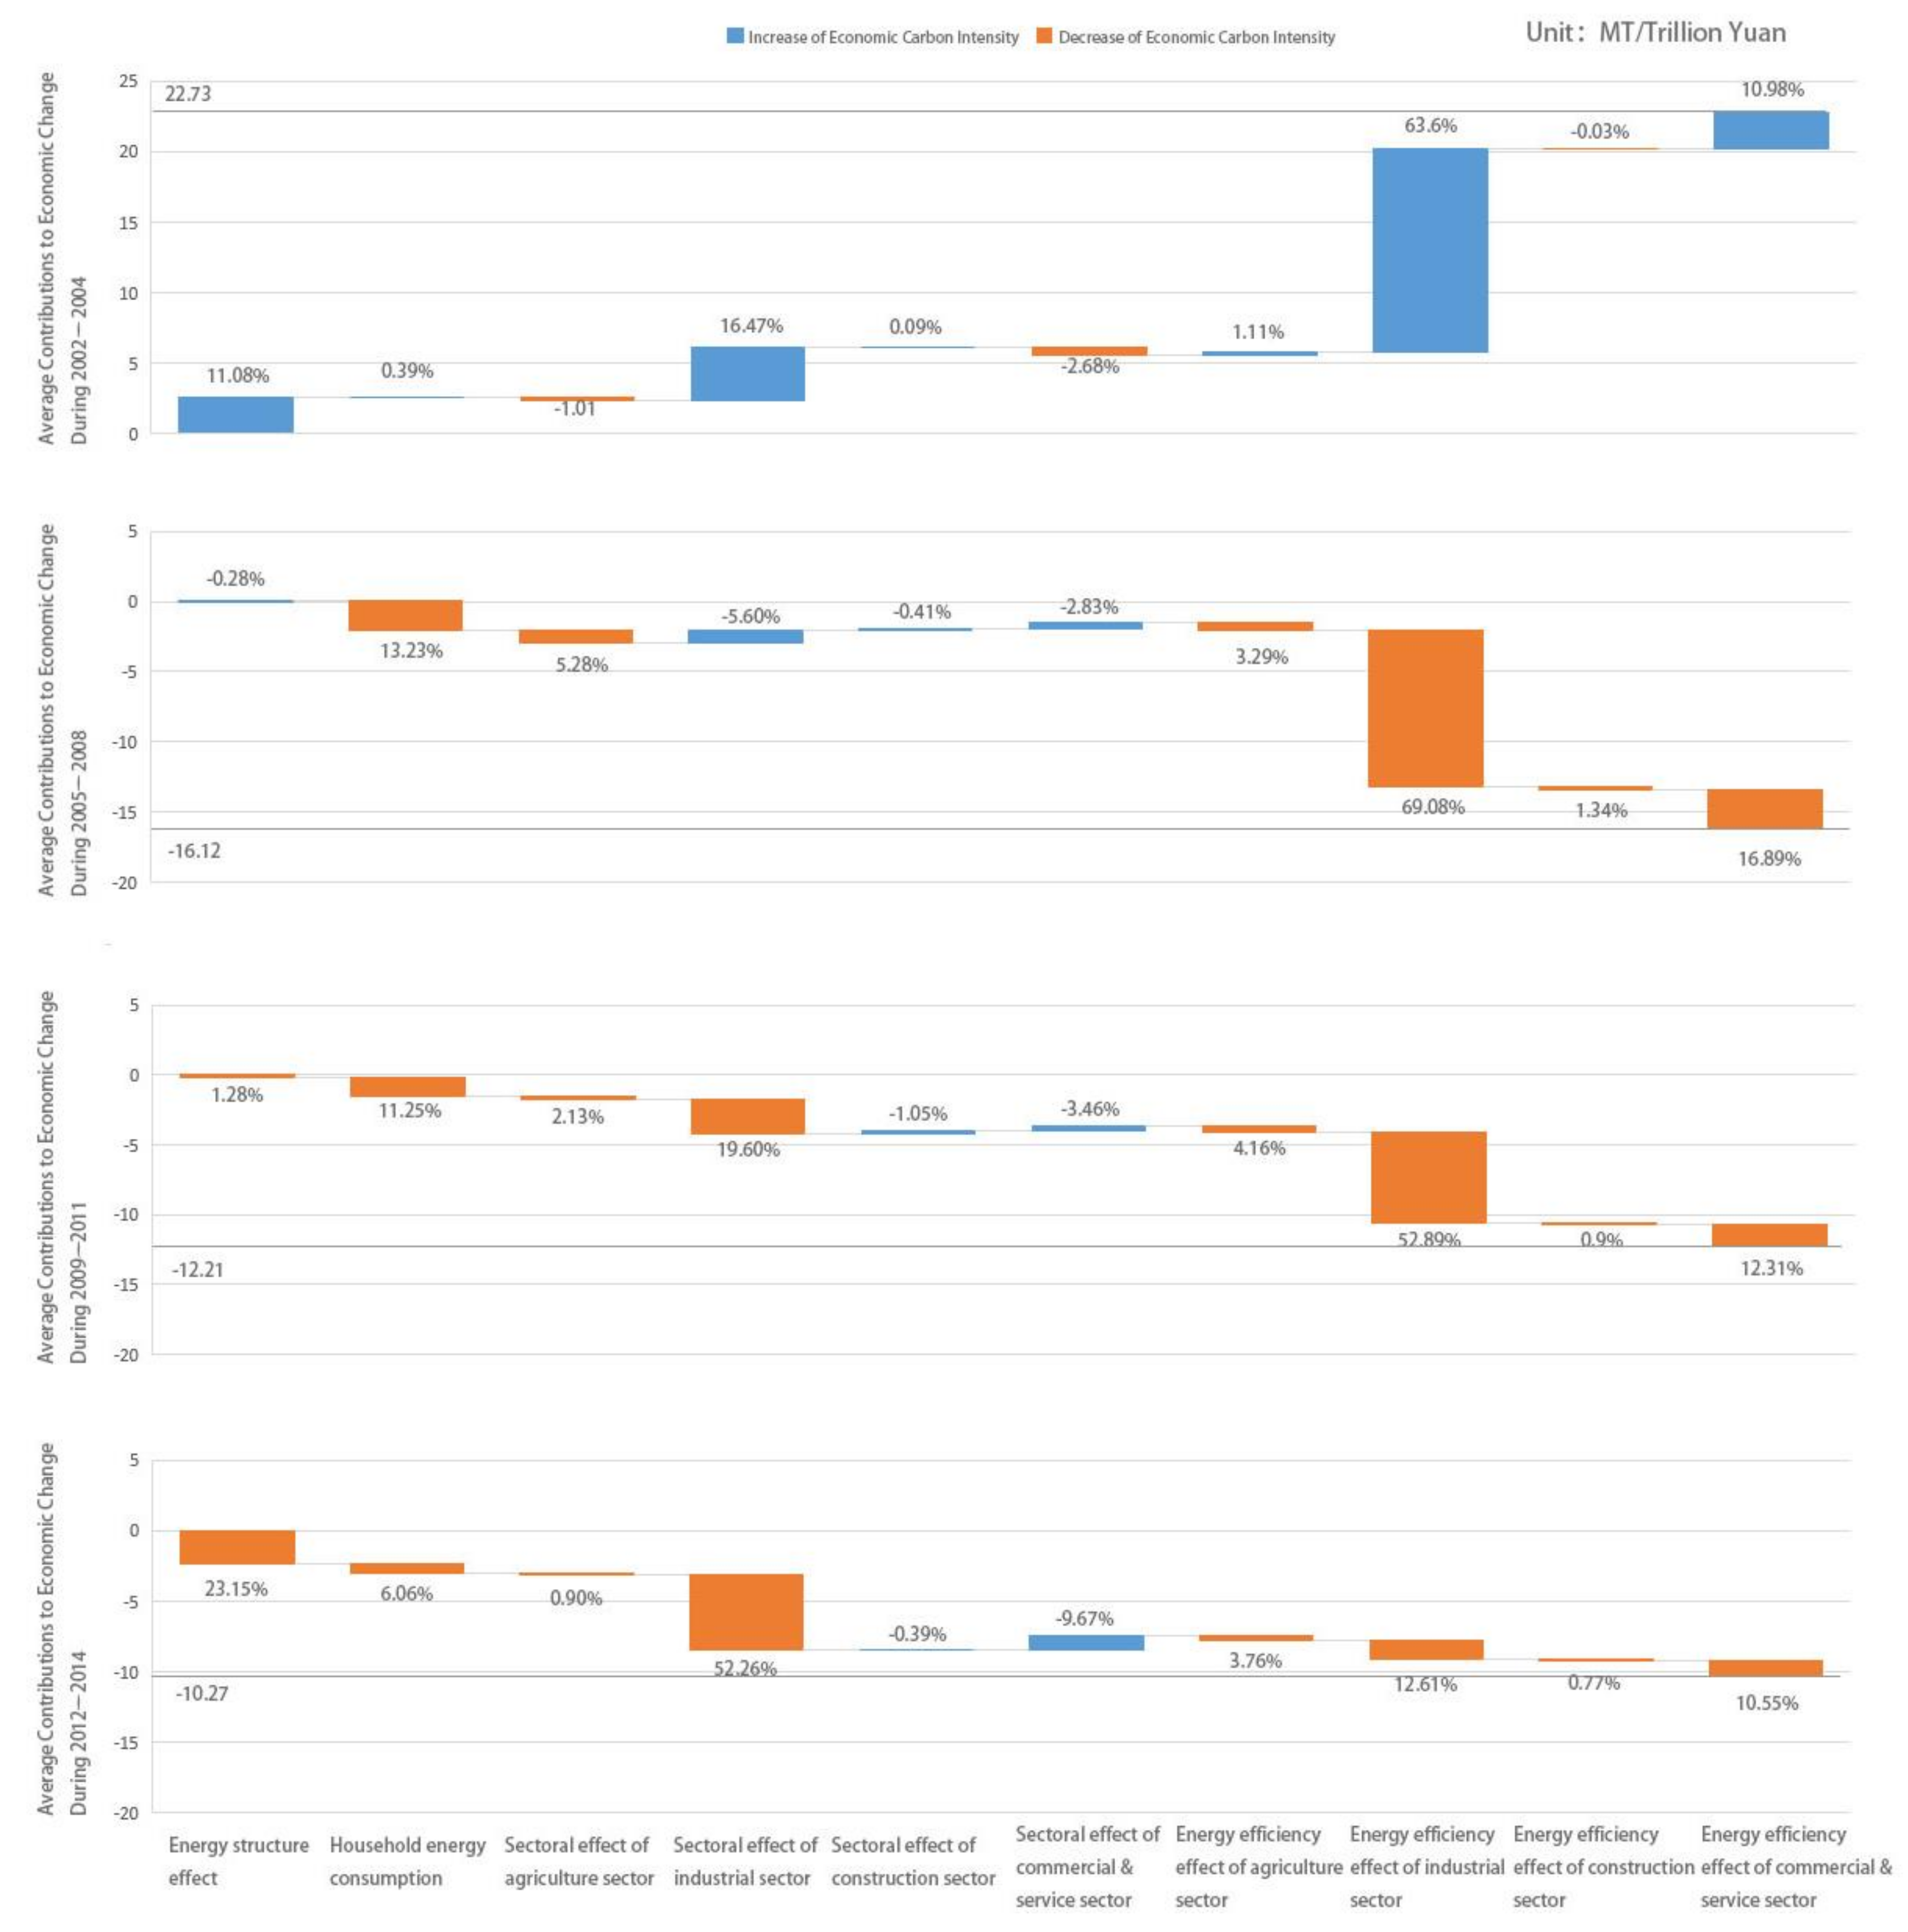
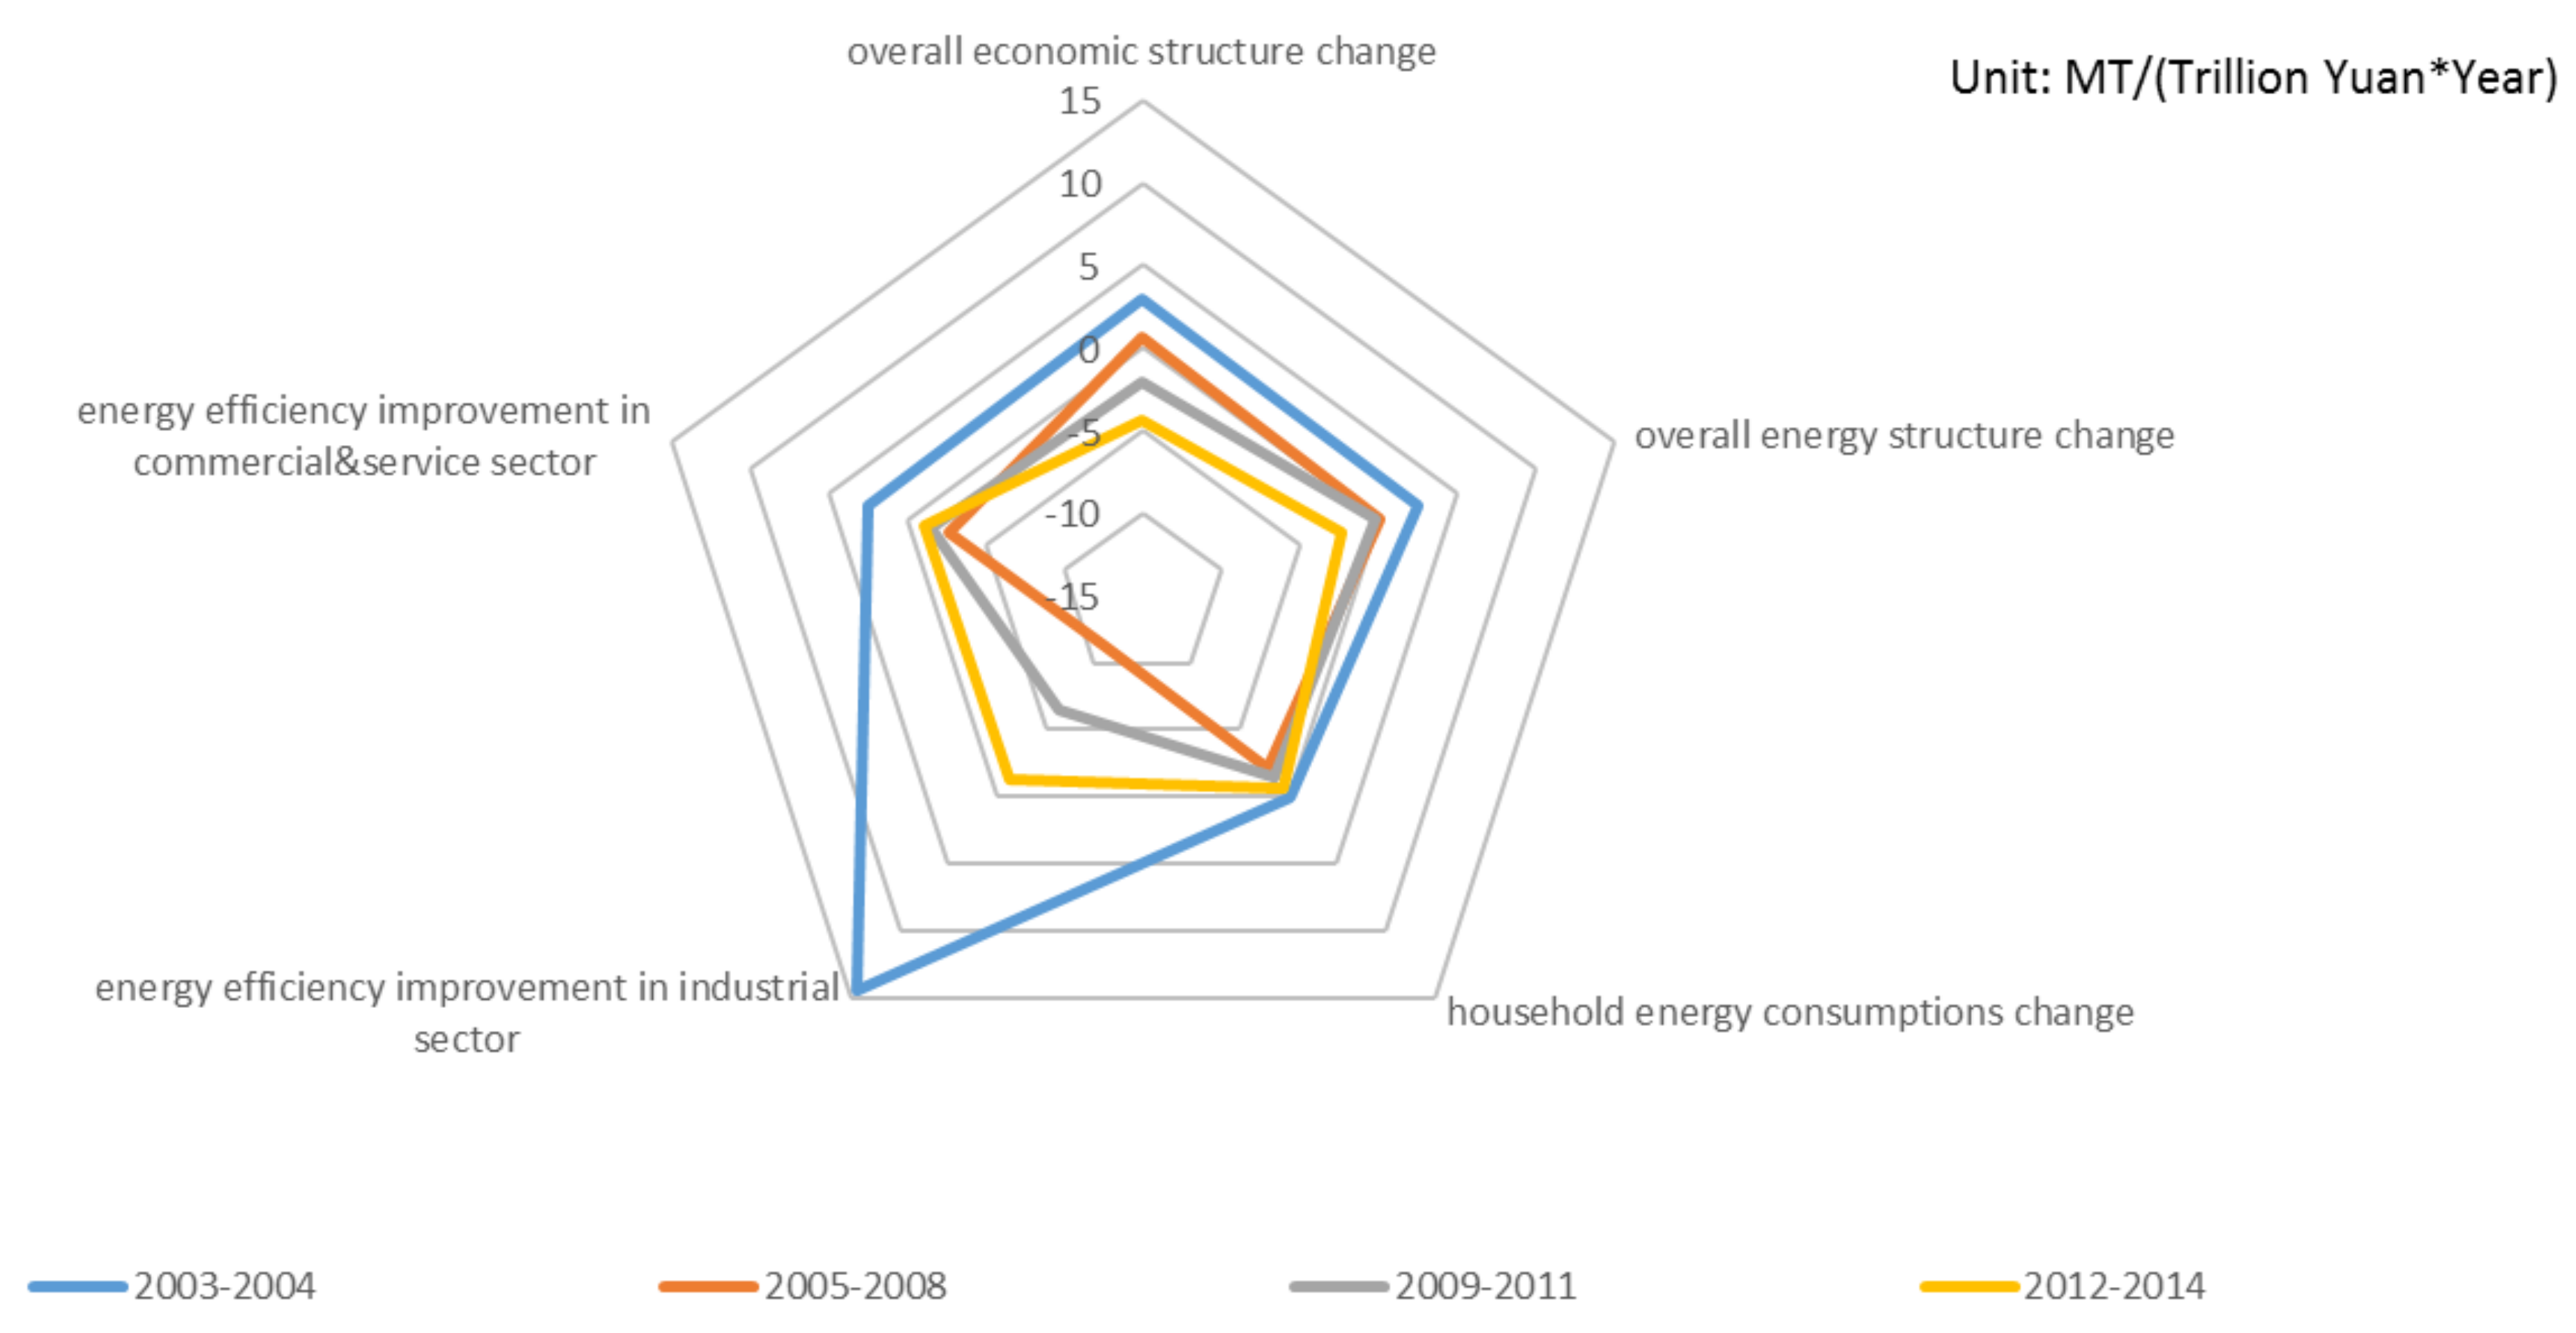
3.1. Overall Effect
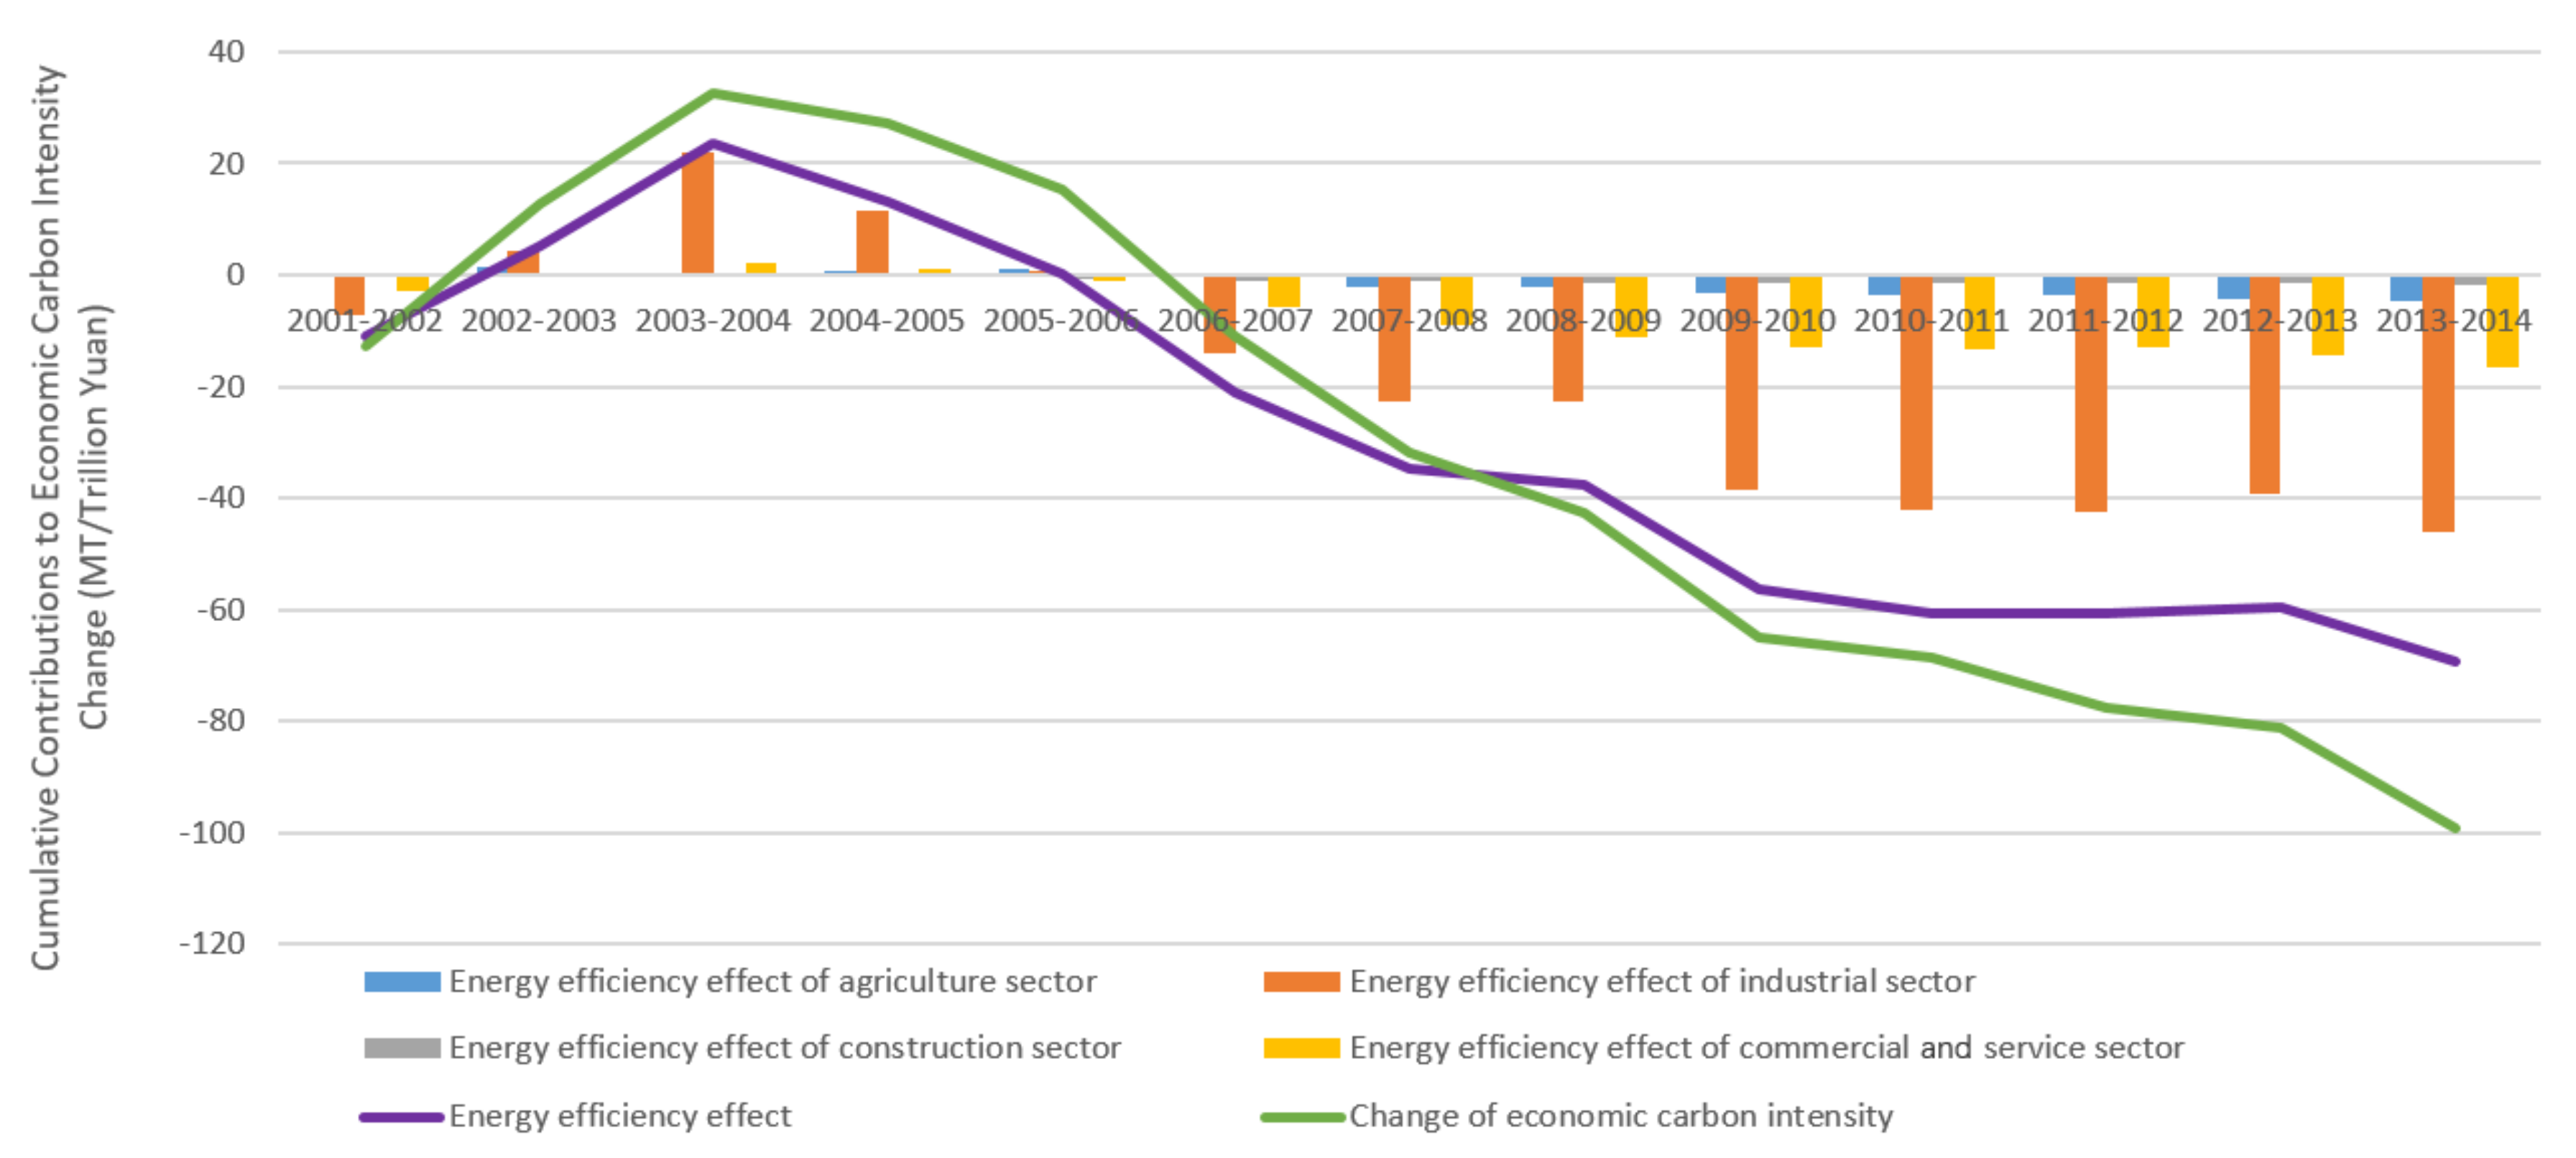
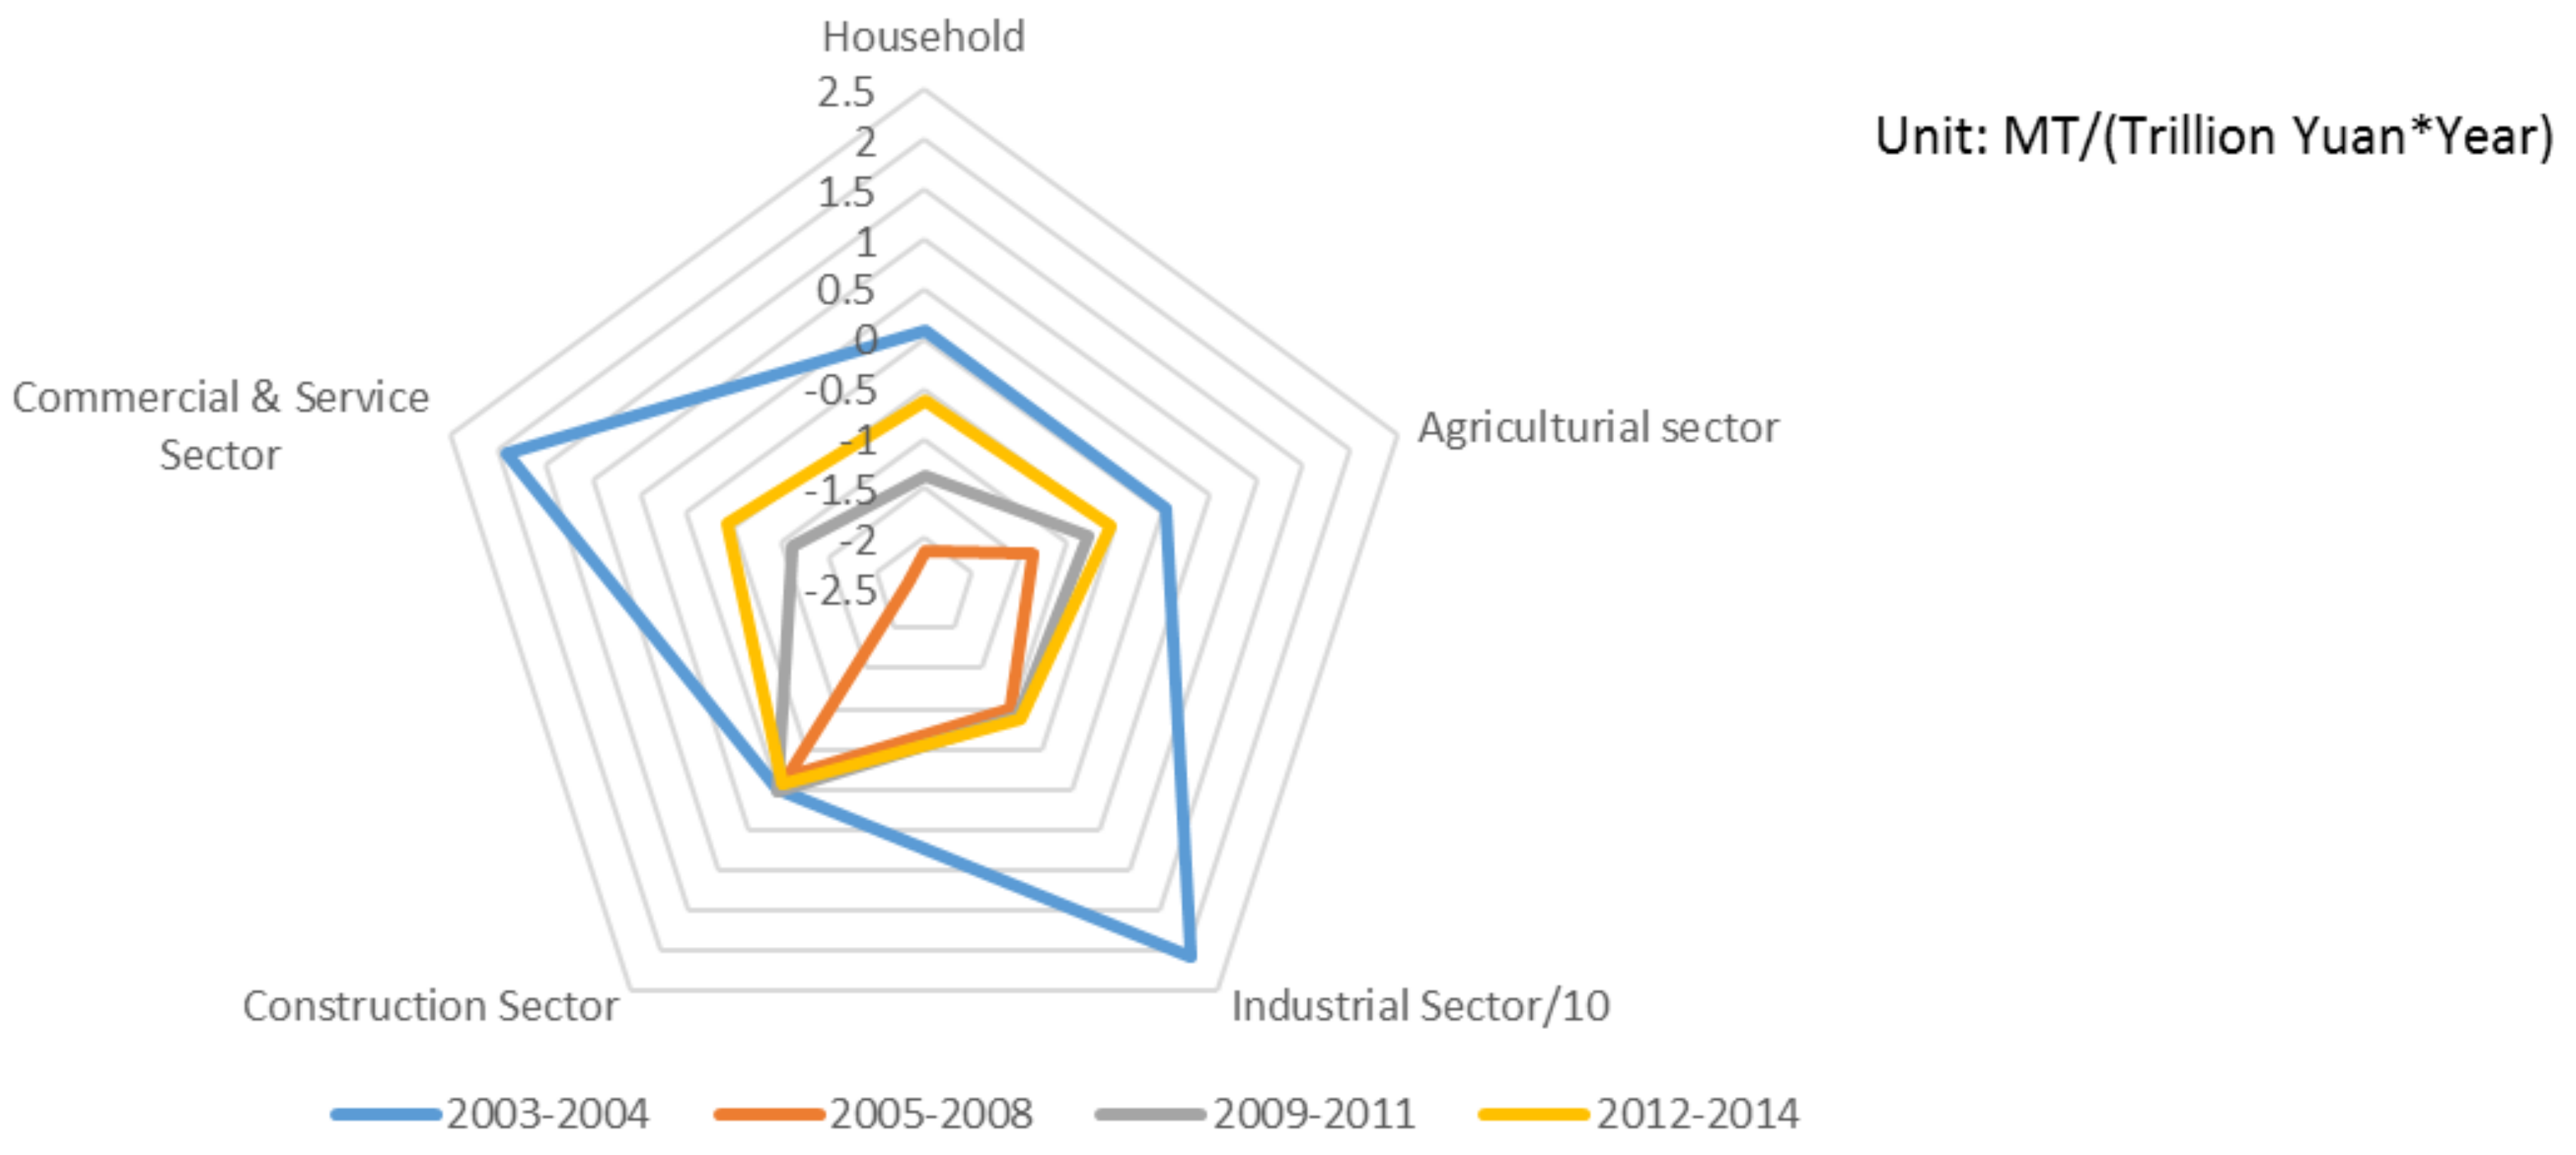
3.2. Energy Efficiency Effect
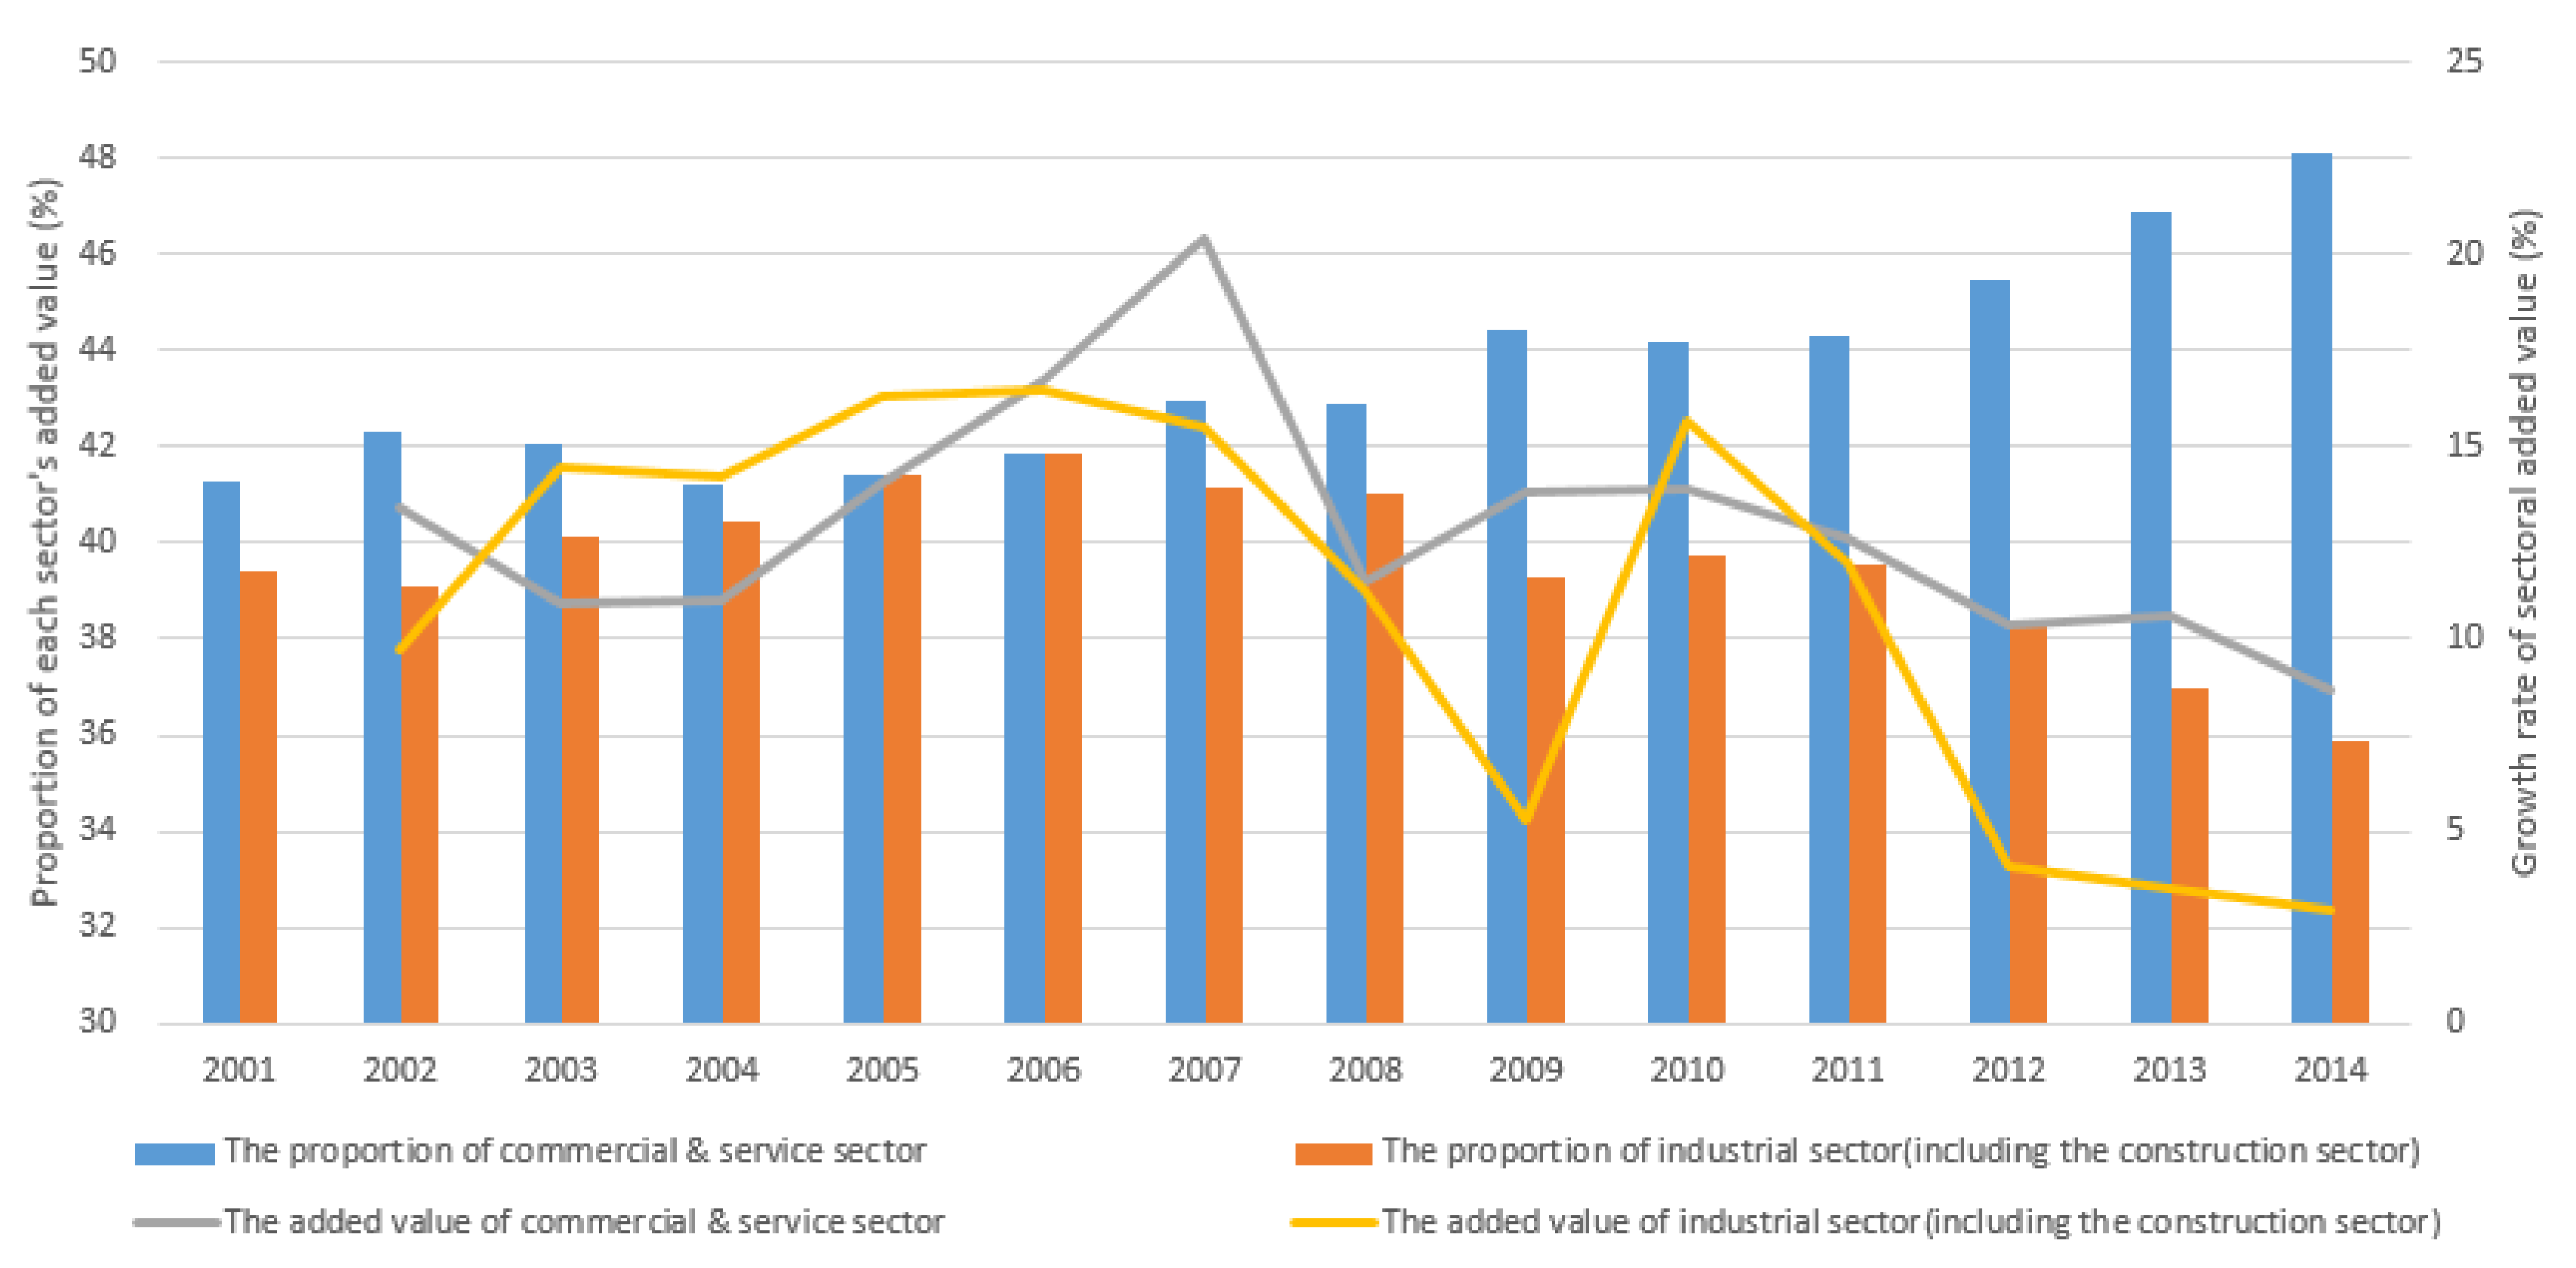
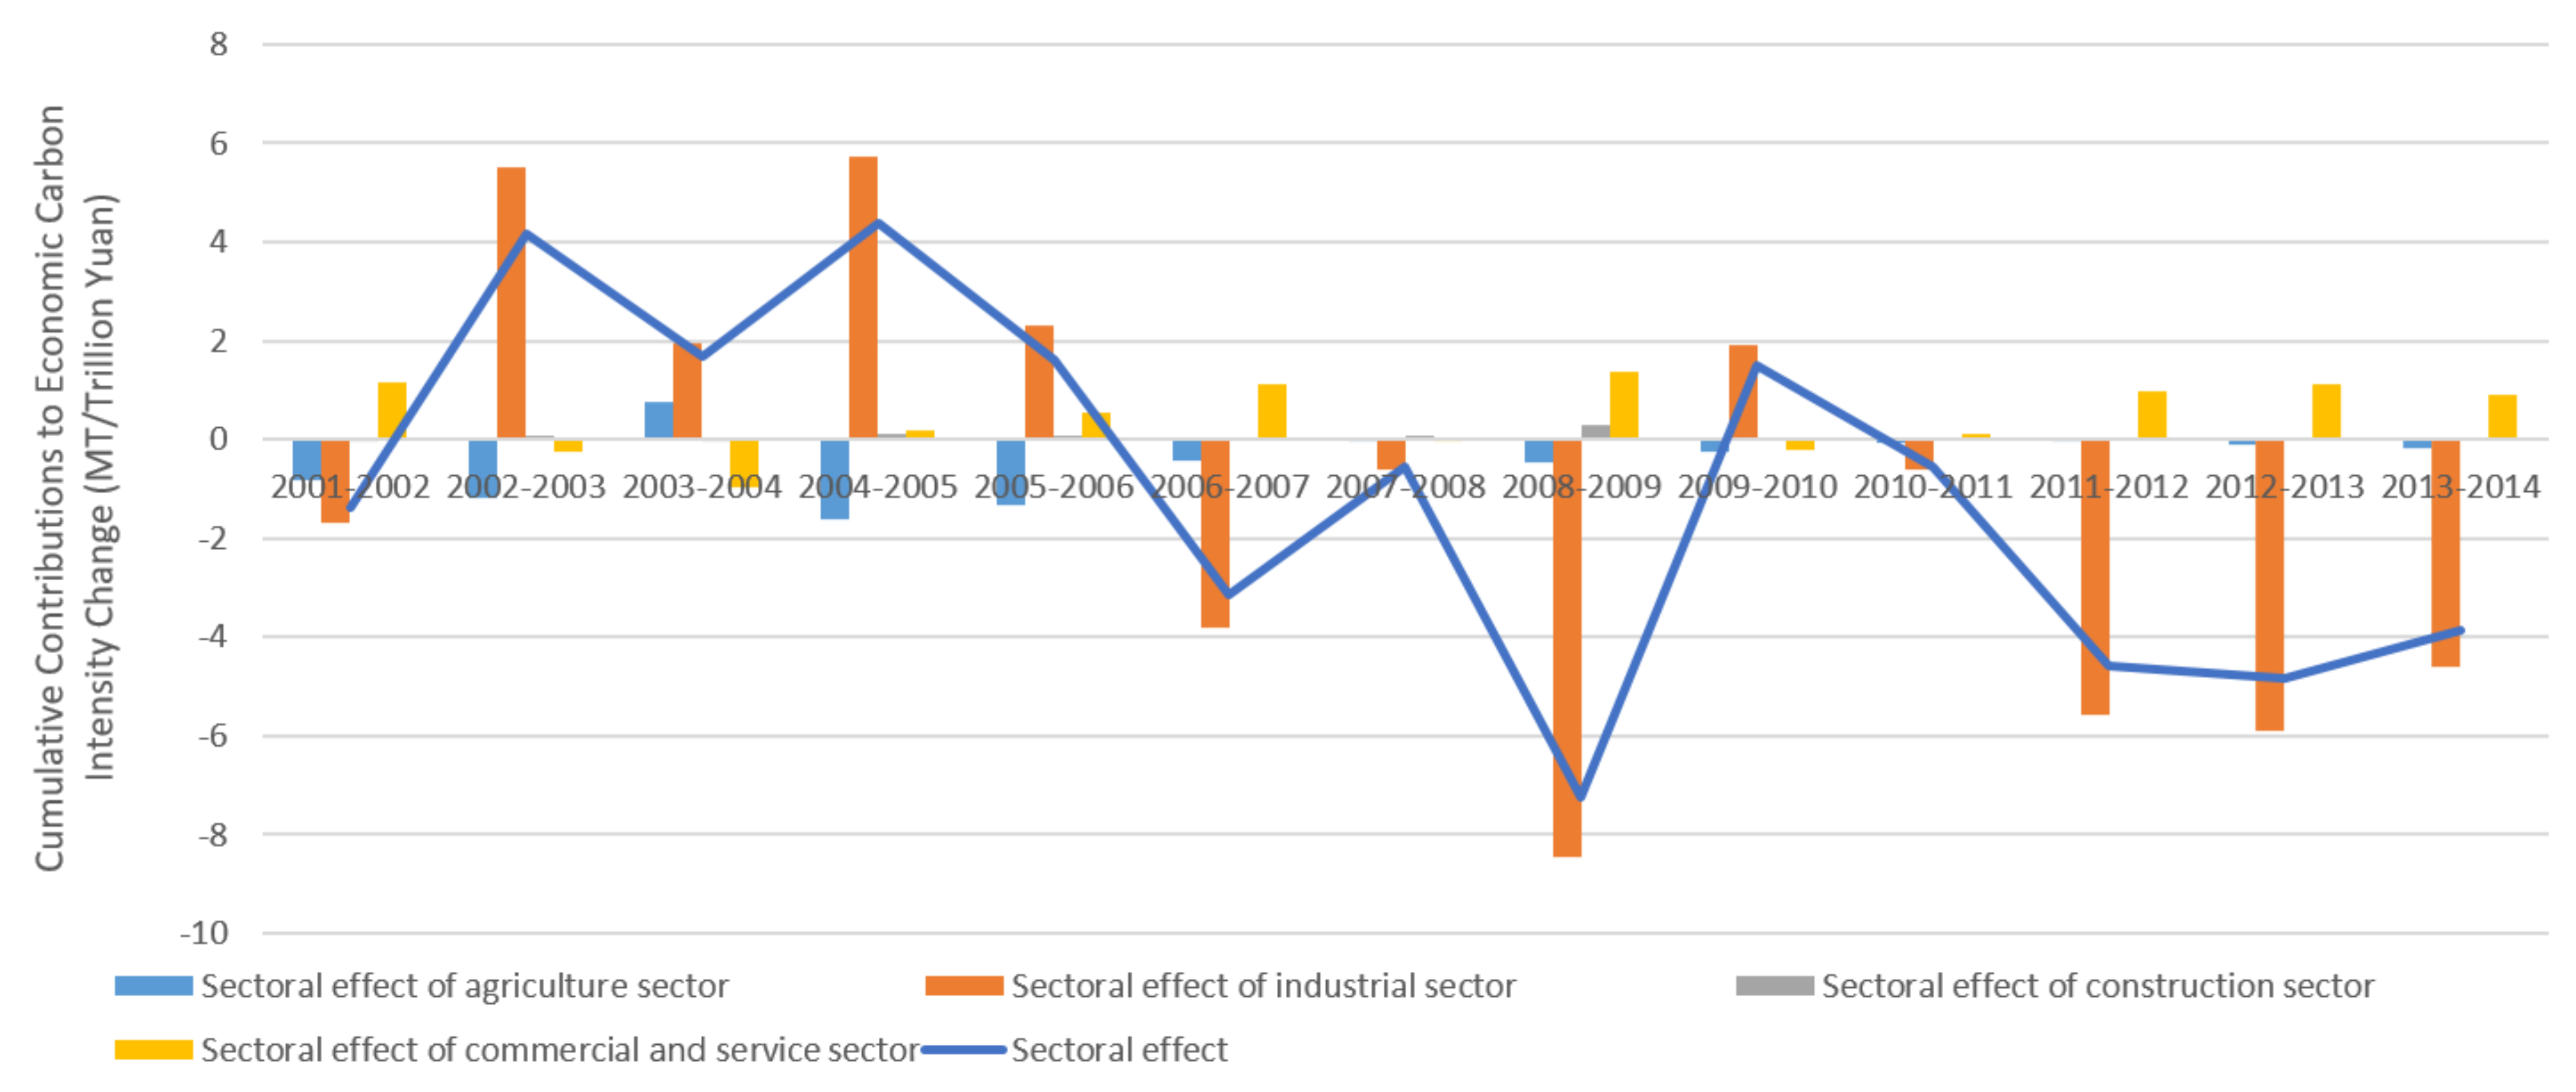
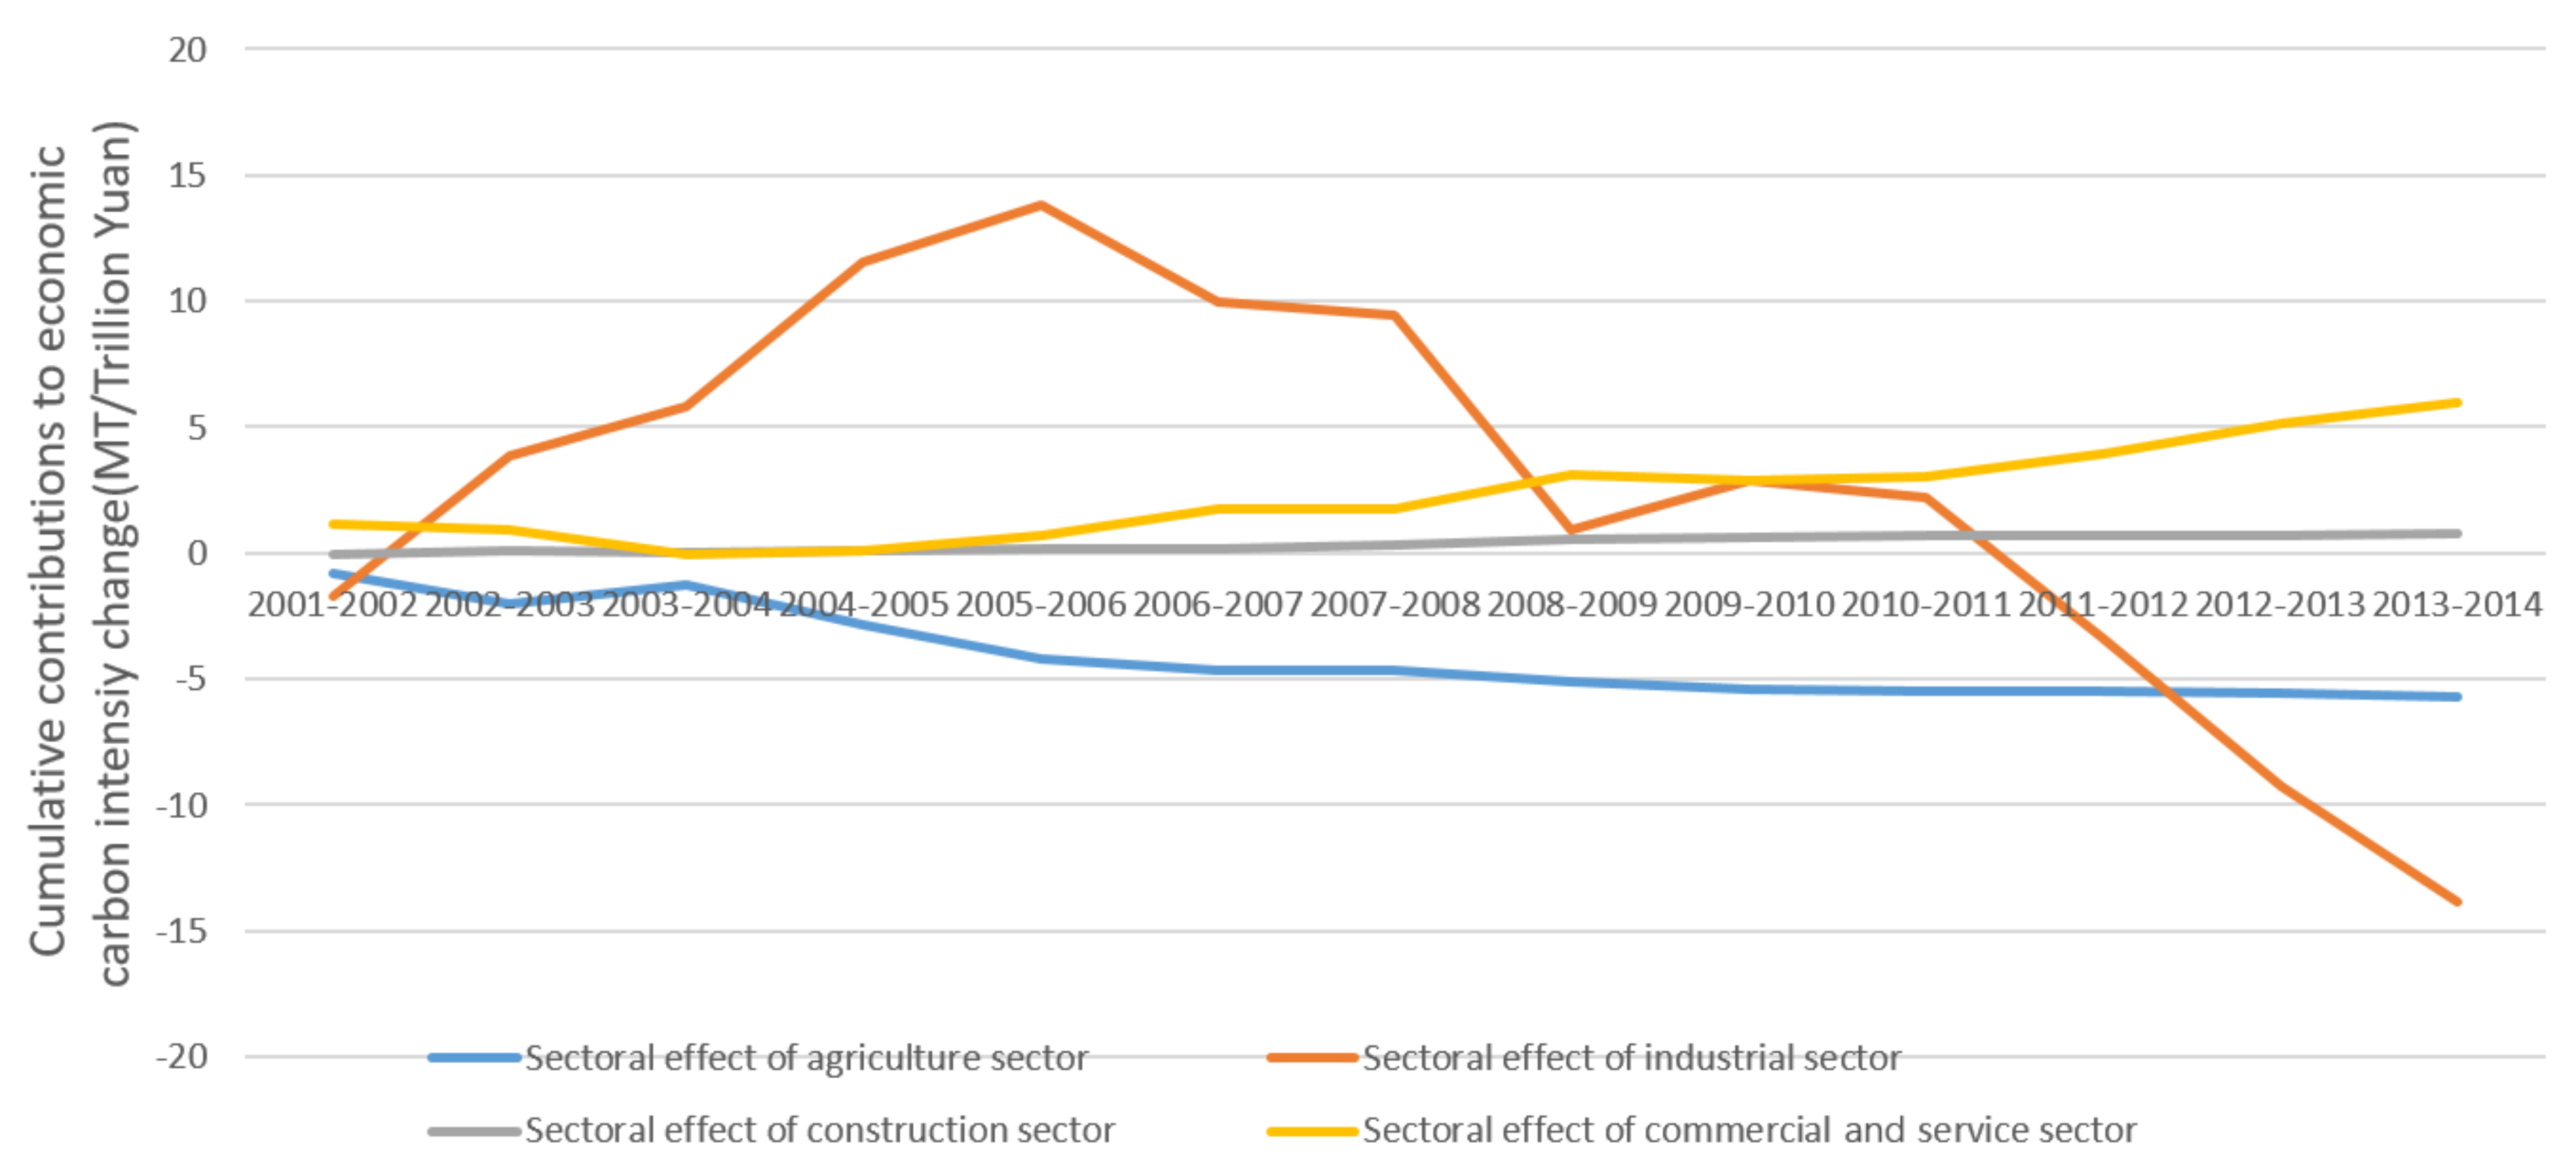
3.3. Sectoral Effect
3.4. Energy Structure Effect
3.5. Household Energy Consumption Effect
4. The Periodic Characteristics of China’s Carbon Emissions
4.1. The Stage Division of China’s Change in Economic Carbon Intensity Since Its Accession to the World Trade Organization
4.2. Characteristics and Differences of Various Carbon Emission Phases
4.3. Analysis of China’s GHG Emission Pathway in Different Phases
5. Conclusions
Acknowledgments
Author Contributions
Conflicts of Interest
References
- Guan, D.; Klasen, S.; Hubacek, K.; Feng, K.; Liu, Z.; He, K.; Geng, Y.; Zhang, Q. Determinants of stagnating carbon intensity in China. Nat. Clim. Chang. 2014, 4, 1017–1023. [Google Scholar] [CrossRef]
- International Energy Agency. World Energy Outlook Special Report: Energy and Climate Change. Available online: http://www.iea.org/publications/freepublications/publication/weo-2015-special-report-2015-energy-and-climate-change.html (accessed on 31 January 2018).
- National Bureau of Statistics PR China. China Statistical Yearbook 2015; China Statistics Press: Beijing, China, 2016.
- Doytch, N.; Uctum, M. Does the worldwide shift of FDI from manufacturing to services accelerate economic growth? A GMM estimation study. J. Int. Money Financ. 2011, 30, 410–427. [Google Scholar] [CrossRef]
- Hsieh, C.; Ossa, R. A global view of productivity growth in China. J. Int. Econ. 2016, 102, 209–224. [Google Scholar] [CrossRef]
- Inklaar, R.; Diewert, W.E. Measuring industry productivity and cross-country convergence. J. Econ. 2016, 191, 426–433. [Google Scholar] [CrossRef]
- Doytch, N.; Narayan, S. Does FDI influence renewable energy consumption? An analysis of sectoral FDI impact on renewable and non-renewable industrial energy consumption. Energy Econ. 2016, 54, 291–301. [Google Scholar] [CrossRef]
- Doytch, N.; Uctum, M. Globalization and the environmental impact of sectoral FDI. Econ. Syst. 2016, 40, 582–594. [Google Scholar] [CrossRef]
- Zhou, X.; Zhang, J.; Li, J. Industrial structural transformation and carbon dioxide emissions in China. Energy Policy 2013, 57, 43–51. [Google Scholar] [CrossRef]
- Zhang, Z. How far can developing country commitments go in an immediate post-2012 climate regime? Energy Policy 2009, 37, 1753–1757. [Google Scholar] [CrossRef][Green Version]
- Rong, F. Understanding developing country stances on post-2012 climate change negotiations: Comparative analysis of Brazil, China, India, Mexico, and South Africa. Energy Policy 2010, 38, 4582–4591. [Google Scholar] [CrossRef]
- Gilley, B. Authoritarian environmentalism and China’s response to climate change. Environ. Politics 2012, 21, 287–307. [Google Scholar] [CrossRef]
- Wang, W.; Xie, H.; Jiang, T.; Zhang, D.; Xie, X. Measuring the Total-Factor Carbon Emission Performance of Industrial Land Use in China Based on the Global Directional Distance Function and Non-Radial Luenberger Productivity Index. Sustainability 2016, 8, 336. [Google Scholar] [CrossRef]
- Zhang, L. Correcting the uneven burden sharing of emission reduction across provinces in China. Energy Econ. 2017, 64, 335–345. [Google Scholar] [CrossRef]
- Hou, J.; Teo, T.S.H.; Zhou, F.; Lim, M.K.; Chen, H. Does industrial green transformation successfully facilitate a decrease in carbon intensity in China? An environmental regulation perspective. J. Clean. Prod. 2018, 184, 1060–1071. [Google Scholar] [CrossRef]
- National Development and Reform Commission (NDRC). China’s Intended Nationally Determined Contribution: Enhanced Actions on Climate Change. Available online: http://www.sdpc.gov.cn/xwzx/xwfb/201506/t20150630_710204.html (accessed on 31 January 2018).
- Wang, Z.; Shi, C.; Li, Q.; Wang, G. Impact of Heavy Industrialization on the Carbon Emissions: An Empirical Study of China. Energy Procedia 2011, 5, 2610–2616. [Google Scholar] [CrossRef]
- Qi, T.; Weng, Y.; Zhang, X.; He, J. An analysis of the driving factors of energy-related CO2 emission reduction in China from 2005 to 2013. Energy Econ. 2016, 60, 15–22. [Google Scholar] [CrossRef]
- Liu, L.; Fan, Y.; Wu, G.; Wei, Y. Using LMDI method to analyze the change of China’s industrial CO2 emissions from final fuel use: An empirical analysis. Energy Policy 2007, 35, 5892–5900. [Google Scholar] [CrossRef]
- Xu, S.; He, Z.; Long, R. Factors that influence carbon emissions due to energy consumption in China: Decomposition analysis using LMDI. Appl. Energy 2014, 127, 182–193. [Google Scholar] [CrossRef]
- Wang, C.; Chen, J.; Zou, J. Decomposition of energy-related CO2 emission in China: 1957–2000. Energy 2005, 30, 73–83. [Google Scholar] [CrossRef]
- Li, W.; Shen, Y.; Zhang, H. A Factor Decomposition on China’s Carbon Emission from 1997 to 2012 Based on IPAT-LMDI Model. Math. Probl. Eng. 2015, 2015, 1–14. [Google Scholar] [CrossRef]
- Li, W.; Sun, S.; Li, H. Decomposing the decoupling relationship between energy-related CO2 emissions and economic growth in China. Nat. Hazards 2015, 79, 977–997. [Google Scholar] [CrossRef]
- Wang, G.; Chen, X.; Zhang, Z.; Niu, C. Influencing Factors of Energy-Related CO2 Emissions in China: A Decomposition Analysis. Sustainability 2015, 7, 14408–14426. [Google Scholar] [CrossRef]
- Chen, L.; Yang, Z. A spatio-temporal decomposition analysis of energy-related CO2 emission growth in China. J. Clean. Prod. 2015, 103, 49–60. [Google Scholar] [CrossRef]
- Xu, J.; Fan, Y.; Yu, S. Energy conservation and CO2 emission reduction in China’s 11th Five-Year Plan: A performance evaluation. Energy Econ. 2014, 46, 348–359. [Google Scholar] [CrossRef]
- Zhang, M.; Bai, C.; Zhou, M. Decomposition analysis for assessing the progress in decoupling relationship between coal consumption and economic growth in China. Resour. Conserv. Recycl. 2016, 129, 454–462. [Google Scholar] [CrossRef]
- Tang, X.; Jin, Y.; McLellan, B.C.; Wang, J.; Li, S. China’s coal consumption declining—Impermanent or permanent? Resour. Conserv. Recycl. 2016, 129, 307–313. [Google Scholar] [CrossRef]
- Zhang, Y.; Da, Y. The decomposition of energy-related carbon emission and its decoupling with economic growth in China. Renew. Sustain. Energy Rev. 2015, 41, 1255–1266. [Google Scholar] [CrossRef]
- Gu, A.; Lv, Z. Effects of Economic Structure Change on Carbon Emission of China: Analysis Based on IO-SDA Model. China Popul. Resour. Environ. 2016, 3, 37–45. [Google Scholar]
- Mi, Z.; Meng, J.; Guan, D.; Shan, Y.; Liu, Z.; Wang, Y.; Feng, K.; Wei, Y. Pattern changes in determinants of Chinese emissions. Environ. Res. Lett. 2017, 12, 74003. [Google Scholar] [CrossRef]
- Mi, Z.; Meng, J.; Guan, D.; Shan, Y.; Song, M.; Wei, Y.; Liu, Z.; Hubacek, K. Chinese CO2 emission flows have reversed since the global financial crisis. Nat. Commun. 2017, 8, 1712. [Google Scholar] [CrossRef] [PubMed]
- Wu, Y.; Zhang, W. The driving factors behind coal demand in China from 1997 to 2012: An empirical study of input-output structural decomposition analysis. Energy Policy 2016, 95, 126–134. [Google Scholar] [CrossRef]
- Xu, X.; Zhao, T.; Liu, N.; Kang, J. Changes of energy-related GHG emissions in China: An empirical analysis from sectoral perspective. Appl. Energy 2014, 132, 298–307. [Google Scholar] [CrossRef]
- Tan, Z.; Li, L.; Wang, J.; Wng, J. Examing the driving forces for improving China’s CO2 emission intensity using the decomposing method. Appl. Energy 2011, 88, 4496–7804. [Google Scholar] [CrossRef]
- Lin, J.; Liu, Y.; Hu, Y.; Cui, S.; Zhao, S. Factor decomposition of Chinese GHG emission intensity based on the Logarithmic Mean Divisia Index method. Carbon Manag. 2014, 5, 579–586. [Google Scholar] [CrossRef]
- Li, W.; Ou, Q. Decomposition of China’s Carbon Emissions Intensity from 1995 to 2010: An Extended Kaya Identity. Math. Probl. Eng. 2013, 2013, 1–7. [Google Scholar] [CrossRef]
- Fan, Y. Analyzing impact factors of CO2 emissions using the STIRPAT MOEDL. Environ. Impact Assess. Rev. 2006, 26, 377–395. [Google Scholar] [CrossRef]
- Wang, S.; Li, Q.; Fang, C.; Zhou, C. The relationship between economic growth, energy consumption, and CO2 emissions: Empirical evidence from China. Sci. Total Environ. 2016, 542, 360–371. [Google Scholar] [CrossRef] [PubMed]
- Chen, Q.; Su, L.; Ru, X. Carbon Emission and GDP: Causality Relationship in 6 Developed Countries. Ecol. Econ. 2010, 4, 52–55. [Google Scholar]
- Han, Y.; Lu, Y. The Relationship between Economic Growth and Environmental Quality: An Empirical Test on the Environmental Kuznets Curve of CO2. Econ. Theory Manag. 2009, 3, 5–11. [Google Scholar]
- Alam, M.M.; Murad, M.W.; Noman, A.H.M.; Ozturk, I. Relationships among carbon emissions, economic growth, energy consumption and population growth: Testing Environmental Kuznets Curve hypothesis for Brazil, China, India and Indonesia. Ecol. Indic. 2016, 70, 466–479. [Google Scholar] [CrossRef]
- Grubb, M.; Sha, F.; Spencer, T.; Agnolucci, P. A review of Chinese CO2 emission projections to 2030: The role of economic structure and policy. Clim. Policy 2015, 15 (Suppl. S1), S7–S39. [Google Scholar] [CrossRef]
- Salim, R.; Yao, Y.; Chen, G.; Zhang, L. Can foreign direct investment harness energy consumption in China? A time series investigation. Energy Econ. 2017, 66, 43–53. [Google Scholar] [CrossRef]
- Green, F.; Stern, N. China’s changing economy: Implications for its carbon dioxide emissions. Clim. Policy 2017, 4, 423–442. [Google Scholar] [CrossRef]
- Hilton, I.; Kerr, O. The Paris Agreement: China’s ‘New Normal’ role in international climate negotiations. Clim. Policy 2017, 1, 48–58. [Google Scholar] [CrossRef]
- Ang, B.W. Decomposition analysis for policymaking in energy. Energy Policy 2004, 32, 1131–1139. [Google Scholar] [CrossRef]
- National Development and Reform Commission (NDRC). Notice on the Issuance of the First Batch of GHG Accounting Methods and Reporting Guidelines for Enterprises in 10 Sectors (Trial). Available online: http://www.gov.cn/zwgk/2013-11/04/content_2520743.htm (accessed on 31 January 2018).
- National Bureau of Statistics PR China. China Energy Statistical Yearbook 2013; China Statistics Press: Beijing, China, 2014.
- National Bureau of Statistics PR China. China Energy Statistical Yearbook 2015; China Statistics Press: Beijing, China, 2016.
- Wang, N.; Chang, Y. The evolution of low-carbon development strategies in China. Energy 2014, 68, 61–70. [Google Scholar] [CrossRef]
- China State Council. Opinions of the State Council on Resolving the Contradiction of Serious Overcapacity. Available online: http://www.gov.cn/zhengce/content/2013-10/18/content_4854.htm (accessed on 31 January 2018).
- Cai, F. Demographic transition, demographic dividend, and Lewis turning point in China. China Econ. J. 2010, 2, 107–119. [Google Scholar] [CrossRef]
- Cai, F. China’s Economic Growth Prospects: From Demographic Dividend to Reform Dividend; Edward Elgar Publishing: Northampton, MA, USA, 2016. [Google Scholar]


| Category | Publications | Indicator Type | Method | Decomposition Level | Whether the Economic Phase/Stage Is Identified | Time Period |
|---|---|---|---|---|---|---|
| Research on Single Country Decomposition | Wang et al. (2011) | Quantity (CO2, heavy industry only) | Econometrics | Factors and sectors | No | 1978–2008 |
| Qi et al. (2016) | Quantity (CO2) | LMDI | Factors and sectors | No | 2005–2014 | |
| Liu et al. (2007) | Quantity (CO2, industry only) | LMDI | Factors and sectors | Yes (period divided by joining WTO) | 1998–2002; 2003–2005 | |
| S.C. Xu et al. (2014) | Quantity (CO2) | LMDI | Factors, sectors, and regions | No | 1995–2011 | |
| Wang et al. (2005) | Quantity (CO2) | LMDI | Factors | Yes (period divided by Reform and Opening) | 1957–1980;1981–2000 | |
| Li et al. (2015b) | Quantity (CO2) | LMDI | Factors and sectors | No | 1996–2012 | |
| Wang et al. (2015) | Quantity (CO2) | LMDI | Factors and sectors | No | 1996–2012 | |
| Li et al. (2015a) | Quantity (CO2) | LMDI | Factors and sectors | Yes (period divided by each Chinese five-year plan) | 1997–2012 | |
| Chen and Yang (2015) | Quantity (CO2) | LMDI | Factors, sectors, and regions | No | 1995–2011 | |
| J.H. Xu et al. (2014) | Quantity (CO2) | LMDI | Factors and sectors | No | 2005–2010 | |
| Guan et al. (2014) | Quantity (CO2) | M-E index | Factors and regions | Yes (2002 as starting year) | 2002–2009 | |
| Zhang et al. (2016) | Quantity (Coal) | LMDI | Factors | No | 1991–2003 | |
| Tang et al. (2018) | Quantity (Coal) | LMDI | Factors and sectors | Yes (period divided by each Chinese five-year plan) | 1997–2014 | |
| Zhang and Da (2015) | Quantity (CO2) & Intensity (CO2) | LMDI | Factors and sectors | No | 1996–2010 | |
| Gu and Lv (2016) | Quantity (CO2) | SDA | Factors and sectors | No | 1992/1997/2002/2007/2010 | |
| Mi et al. (2017a) | Quantity (CO2) | SDA | Factors and sectors | Yes (Analyzing the impact of 2008 financial crisis) | 2005/2007/2010/2012 | |
| Mi et al. (2017b) | Quantity (CO2) | SDA | Factors and sectors | Yes (Analyzing the impact of 2008 financial crisis) | 2007/2010/2012 | |
| Wu and Zhang (2016) | Quantity (CO2) | SDA | Factors and sectors | No | 1997/2002/2007/2012 | |
| X. Xu et al. (2014) | Intensity (CO2) | LMDI | Factors and sectors | Yes (period divided by each Chinese five-year plan) | 1996–2011 | |
| Tan et al. (2011) | Intensity (CO2) | LMDI | Factors, sectors and regions | No | 1998–2008 | |
| Lin et al. (2014) | Intensity (CO2) | LMDI | Factors and sectors | Yes (period divided by each Chinese five-year plan) | 1996–2010 | |
| Li and Ou (2013) | Intensity (CO2) | LMDI | Factors and sectors | No | 1995–2010 | |
| Economic Stage Analysis | Fan (2006) | Quantity (CO2) | Econometrics | Factors: different nations | No | 1975–2000 |
| Wang et al. (2016) | Quantity (CO2) | Econometrics | Factors: different nations | No | 1990–2012 | |
| Chen et al. (2010) | Quantity (CO2) | Econometrics | Factors: historical change in 6 nations | No | 1900s–2005 | |
| Han and Lu (2009) | Quantity (CO2) | Econometrics | Factors: different nations | No | 1980–2003 | |
| Alam et al. (2016) | Intensity (CO2) | Econometrics | Factors: different nations | No | 1971–2012 |
| Factors | 2001–2002 | 2002–2003 | 2003–2004 | 2004–2005 | 2005–2006 | 2006–2007 | 2007–2008 | 2008–2009 | 2009–2010 | 2010–2011 | 2011–2012 | 2012–2013 | 2013–2014 | Sum |
|---|---|---|---|---|---|---|---|---|---|---|---|---|---|---|
| SSagr | −0.81623 | −1.20372 | 0.74529 | −1.60643 | −1.33287 | −0.43618 | −0.03061 | −0.45788 | −0.24193 | −0.07947 | −0.00437 | −0.09831 | −0.17543 | −5.73813 |
| SSind | −1.69174 | 5.525319 | 1.963803 | 5.717241 | 2.308661 | −3.82177 | −0.5954 | −8.46697 | 1.910638 | −0.62327 | −5.59543 | −5.8899 | −4.61841 | −13.8772 |
| SScon | −0.02364 | 0.08941 | −0.04909 | 0.094425 | 0.074708 | 0.002236 | 0.091893 | 0.29355 | 0.042805 | 0.046861 | 0.043924 | 0.020183 | 0.054638 | 0.7819 |
| SSser | 1.137483 | −0.23957 | −0.9802 | 0.187573 | 0.558958 | 1.113242 | −0.03353 | 1.375133 | −0.20654 | 0.098938 | 0.960472 | 1.134866 | 0.884663 | 5.991497 |
| EFagr | −0.50738 | 1.94719 | −1.44353 | 0.784438 | 0.304517 | −1.35143 | −1.86051 | −0.19001 | −0.92393 | −0.41027 | 0.069671 | −0.70717 | −0.51977 | −4.80818 |
| EFind | −7.04822 | 11.45319 | 17.45878 | −10.1997 | −10.8247 | −14.7718 | −8.75383 | −0.01032 | −15.7662 | −3.59779 | −0.53456 | 3.205554 | −6.55798 | −45.9476 |
| EFcon | −0.28988 | −0.08634 | 0.074954 | −0.13636 | −0.14602 | −0.32028 | −0.25912 | −0.20108 | −0.12048 | −0.00829 | −0.0607 | −0.00352 | −0.17315 | −1.73026 |
| EFser | −2.96609 | 2.766373 | 2.224508 | −0.88873 | −2.27936 | −4.75551 | −2.97224 | −2.40915 | −1.83868 | −0.26158 | 0.498728 | −1.39064 | −2.35869 | −16.6311 |
| ESagr | −0.005 | 0.138794 | −0.09301 | 0.061363 | 0.058958 | 0.077238 | −0.11919 | −0.03615 | −0.05642 | 0.064583 | −0.03942 | −0.03135 | −0.06773 | −0.04735 |
| ESind | −0.62684 | 4.021569 | 0.988805 | 2.359813 | 0.755826 | 0.058597 | −2.79355 | 0.226184 | −1.98501 | 1.421973 | −3.57952 | 0.159389 | −2.49447 | −1.48724 |
| EScon | 0.010569 | 0.019459 | −0.04568 | 0.005439 | 0.017725 | −0.00017 | −0.04862 | −0.01042 | −0.02406 | 0.032316 | −0.04224 | −0.012 | −0.03228 | −0.12997 |
| ESser | 0.070744 | 0.40189 | −0.39324 | 0.239342 | 0.144896 | 0.130478 | −0.7702 | −0.00287 | −0.36404 | 0.266501 | −0.45786 | −0.02573 | −0.51211 | −1.2722 |
| HH | 0.037882 | 0.725949 | −0.54975 | −2.20941 | −1.61005 | −2.16653 | −2.54782 | −0.83045 | −2.95094 | −0.33975 | −0.35752 | 0.126553 | −1.63513 | −14.307 |
| Sum | −12.7183 | 25.55952 | 19.90163 | −5.59098 | −11.9688 | −26.2419 | −20.6927 | −10.7204 | −22.5248 | −3.38925 | −9.09882 | −3.51209 | −18.2058 | −99.2028 |
| Factors | 2001–2002 | 2002–2003 | 2003–2004 | 2004–2005 | 2005–2006 | 2006–2007 | 2007–2008 | 2008–2009 | 2009–2010 | 2010–2011 | 2011–2012 | 2012–2013 | 2013–2014 | Sum |
|---|---|---|---|---|---|---|---|---|---|---|---|---|---|---|
| SS | −1.39413 | 4.171439 | 1.679802 | 4.392813 | 1.609461 | −3.14247 | −0.56764 | −7.25617 | 1.504971 | −0.55695 | −4.5954 | −4.83316 | −3.85453 | −12.842 |
| (%) | 10.96% | 16.32% | 8.44% | −78.57% | −13.45% | 11.98% | 2.74% | 67.69% | −6.68% | 16.43% | 50.51% | 137.62% | 21.17% | 12.95% |
| EF | −10.8116 | 16.08042 | 18.31472 | −10.4403 | −12.9456 | −21.199 | −13.8457 | −2.81056 | −18.6493 | −4.27792 | −0.02686 | 1.104216 | −9.60959 | −69.1171 |
| (%) | 85.01% | 62.91% | 92.03% | 186.74% | 108.16% | 80.78% | 66.91% | 26.22% | 82.79% | 126.22% | 0.30% | −31.44% | 52.78% | 69.67% |
| ES | −0.55052 | 4.581713 | 0.456864 | 2.665958 | 0.977405 | 0.266139 | −3.73157 | 0.176745 | −2.42953 | 1.785373 | −4.11904 | 0.090309 | −3.10659 | −2.93676 |
| (%) | 4.33% | 17.93% | 2.30% | −47.68% | −8.17% | −1.01% | 18.03% | −1.65% | 10.79% | −52.68% | 45.27% | −2.57% | 17.06% | 2.96% |
| HH | 0.037882 | 0.725949 | −0.54975 | −2.20941 | −1.61005 | −2.16653 | −2.54782 | −0.83045 | −2.95094 | −0.33975 | −0.35752 | 0.126553 | −1.63513 | −14.307 |
| (%) | −0.30% | 2.84% | −2.76% | 39.52% | 13.45% | 8.26% | 12.31% | 7.75% | 13.10% | 10.02% | 3.93% | −3.60% | 8.98% | 14.42% |
| AGR | −1.32861 | 0.882261 | −0.79125 | −0.76063 | −0.96939 | −1.71038 | −2.01031 | −0.68404 | −1.22228 | −0.42516 | 0.025888 | −0.83684 | −0.76293 | −10.5937 |
| (%) | 10.45% | 3.45% | −3.98% | 13.60% | 8.10% | 6.52% | 9.72% | 6.38% | 5.43% | 12.54% | −0.28% | 23.83% | 4.19% | 10.68% |
| IND | −9.36679 | 21.00008 | 20.41139 | −2.12263 | −7.76025 | −18.5349 | −12.1428 | −8.25111 | −15.8406 | −2.79909 | −9.70951 | −2.52496 | −13.6709 | −61.3121 |
| (%) | 73.65% | 82.16% | 102.56% | 37.97% | 64.84% | 70.63% | 58.68% | 76.97% | 70.33% | 82.59% | 106.71% | 71.89% | 75.09% | 61.80% |
| CON | −0.30295 | 0.022535 | −0.01982 | −0.0365 | −0.05359 | −0.31822 | −0.21585 | 0.082053 | −0.10174 | 0.070889 | −0.05901 | 0.004664 | −0.15079 | −1.07833 |
| (%) | 2.38% | 0.09% | −0.10% | 0.65% | 0.45% | 1.21% | 1.04% | −0.77% | 0.45% | −2.09% | 0.65% | −0.13% | 0.83% | 1.09% |
| SER | −1.75786 | 2.928696 | 0.851065 | −0.46182 | −1.5755 | −3.51179 | −3.77597 | −1.03688 | −2.40926 | 0.103863 | 1.001337 | −0.28151 | −1.98613 | −11.9118 |
| (%) | 13.82% | 11.46% | 4.28% | 8.26% | 13.16% | 13.38% | 18.25% | 9.67% | 10.70% | −3.06% | −11.01% | 8.02% | 10.91% | 12.01% |
| Factors | EFagr | EFind | EFcon | EFser | EF | EC/GDP |
|---|---|---|---|---|---|---|
| EFagr | 1 | - | - | - | - | - |
| EFind | 0.2174 | 1 | - | - | - | - |
| EFcon | 0.1660 | 0.6740 ** | 1 | - | - | - |
| EFser | 0.4888 | 0.8103 ** | 0.8038 ** | 1 | - | - |
| EF | 0.3501 | 0.9860 ** | 0.7173 ** | 0.8887 ** | 1 | - |
| Econimic carbon Intensity | 0.4991 | 0.8974 ** | 0.6810 ** | 0.9093 ** | 0.9434 ** | 1 |
© 2018 by the authors. Licensee MDPI, Basel, Switzerland. This article is an open access article distributed under the terms and conditions of the Creative Commons Attribution (CC BY) license (http://creativecommons.org/licenses/by/4.0/).
Share and Cite
Zhang, P.; Duan, M.; Yin, G. The Periodic Characteristics of China’s Economic Carbon Intensity Change and the Impacts of Economic Transformation. Energies 2018, 11, 961. https://doi.org/10.3390/en11040961
Zhang P, Duan M, Yin G. The Periodic Characteristics of China’s Economic Carbon Intensity Change and the Impacts of Economic Transformation. Energies. 2018; 11(4):961. https://doi.org/10.3390/en11040961
Chicago/Turabian StyleZhang, Peng, Maosheng Duan, and Guangzhi Yin. 2018. "The Periodic Characteristics of China’s Economic Carbon Intensity Change and the Impacts of Economic Transformation" Energies 11, no. 4: 961. https://doi.org/10.3390/en11040961
APA StyleZhang, P., Duan, M., & Yin, G. (2018). The Periodic Characteristics of China’s Economic Carbon Intensity Change and the Impacts of Economic Transformation. Energies, 11(4), 961. https://doi.org/10.3390/en11040961