Article

3D Simulation of a Loss of Vacuum Accident (LOVA) in ITER (International Thermonuclear Experimental Reactor): Evaluation of Static Pressure, Mach Number, and Friction Velocity

by
Jean-François Ciparisse
1,*,†,
Riccardo Rossi
1,†,
Andrea Malizia
2 and
Pasquale Gaudio
1
1
Department of Industrial Engineering, University of Rome Tor Vergata, 00133 Rome, Italy
2
Department of Medicine and Prevention, University of Rome Tor Vergata, 00133 Rome, Italy
*
Author to whom correspondence should be addressed.
These authors contributed equally to this work.
Energies 2018, 11(4), 856; https://doi.org/10.3390/en11040856
Submission received: 28 February 2018 / Revised: 23 March 2018 / Accepted: 2 April 2018 / Published: 5 April 2018

Abstract

:
ITER (International Thermonuclear Experimental Reactor) is a magnetically confined plasma nuclear reactor. Inside it, due to plasma disruptions, the formation of neutron-activated powders, which are essentially made out of tungsten and beryllium, occurs. As many windows for diagnostics are present on the reactor, which operates at very low pressure, a LOVA (Loss of Vacuum Accident) could be possible and may lead to dust mobilisation and a toxic and radioactive fallout inside the plant. This study is aimed at reproducing numerically the first seconds of a LOVA in ITER, in order to get information about the dust resuspension risk. This work has been carried out by means of a CFD (Computational Fluid Dynamics) simulation of the beginning of the pressurisation transient inside the whole Tokamak. It has been found that the pressurization transient is extremely slow, and that the friction speed on the walls is very high, and therefore a high mobilization risk of the dust is expected on the entire internal surface of the reactor. It has been observed that a LOVA in a real-scale reactor is more severe than the one reproduced in reduced-scale facilities, as STARDUST-U, because the speeds are higher, and the dust resuspension capacity of the flow is greater.

1. Introduction

ITER (International Thermonuclear Experimental Reactor) is a magnetically confined plasma nuclear reactor, which is aiming at demonstrating the possibility to produce, when finally operated, more energy than that required to initiate it and to keep it running. ITER is designed to produce a ten-fold return on energy, i.e., a Q factor higher equal to 10, with a net power around 450–500 MW. However, ITER will not convert this heat energy into electrical energy. Providing positive net energy is not the only aim of ITER. This reactor will be fundamental to study the dynamics of burning plasma and improve its stability and duration. Furthermore, it will allow for testing the materials for the first wall and the divertor, and the tritium breeding technologies. At last, ITER has to demonstrate the safety characteristics of a fusion device [1,2,3].
Dust is one of the major safety issues inside fusion devices. In fact, inside the Tokamak, harmful and neutron-activated metallic powders are produced when plasma disruptions occur. The first wall materials, containing, carbon, tungsten, beryllium, and steel, are continuously hit by neutrons, which form during the fusion of deuterium and tritium, and therefore become progressively radioactive [4,5]. Carbon materials are considered one of the best candidates for plasma facing components, especially for the good thermo-mechanical properties of Carbon Fibre Composites (CFCs), its low atomic number, which decrease the Bremsstrahlung power, and its low influence in core contaminating, despite the high erosion trend [5,6,7]. A critical issue of carbon is the retention of tritium, which makes carbon dust extremely radioactive. Tungsten is a neutronic and heat flux resistant material. The good thermo-mechanical properties of tungsten make it the best candidate for the Plasma Facing Components (PFCs). Although, the impurities of tungsten must be estimated and controlled, since the large atomic number makes the dissipative Bremsstrahlung power very large. Tungsten powder is toxic [8,9,10,11]. Beryllium is fundamental in fusion reactors because of it is a neutron multiplier. The multiplication of neutrons is needed to achieve large Tritium Breeding Ratio (TBR). Beryllium dust is one of the most dangerous, because of its toxicity, which can cause the Chronic Beryllium Disease (CBD). The other candidate for the tritium breeding request is lead, which is more suitable in nature, but it has a lower cross-section and a higher atomic number [5,12]. Steel, with the minor elements of the alloy, will be used for structural aims in the blanket. Several alloys of steel have been deeply investigated to guarantee a low recycling limit time, lower than 100 years [13,14,15,16].
The production of dust inside Tokamaks is caused by several different mechanisms, called Plasma-Material Interactions (PMIs). There are several kinds of PMI, such as blistering, sputtering, and arcing [17,18,19,20,21]. The nature of the PMI and its energy determines the quantity and the shape of dust produced. The greatest part of eroded materials is deposited near to the high flux region, while the remaining dust goes to the coolest regions of the vessel. Several experimental studies have been conducted to investigate the characteristics of the dust expected in fusion devices. The average sizes of dust measured experimentally vary from 0.5 to 10 μm, with very large standard deviations, which means a large variability of dust size. Furthermore, also the shape of the dust strongly varies, and it depends on the PMI nature, its intensity and the dust material [22,23,24].
To analyse the plasma dynamics during ignition and operation, in order to get important information about the fusion phenomenon that takes place, many diagnostic tools are set in several points outside the toroidal chamber and have optical access to the inner reactor through ducts [1,25]. So, as the reactor is operated under the atmospheric pressure if a breach opens in the ducts or in the glass windows of the diagnostic instruments, a Loss of Vacuum Accident (LOVA) occurs. During a LOVA, air flows inside the reactor, cools down, and extinguishes the plasma. Furthermore, the dust that is contained in the reactors can be resuspended and exit the Tokamak. The resulting fallout outside it is likely to cause severe environmental contamination of the area of the power plant [26].
From the point of view of security, this kind of accident is one of the main concerns about the continuous operation of a fusion reactor. Since the preliminary studies that led to the construction of ITER, many researchers have investigated the consequences of a LOVA or of a LOCA (Loss of Coolant Accident), making hypotheses about the quantity of dust contained in the reactor, the diameter of the breach, the pressurisation rate, and the dust resuspension percentage [27,28,29].
In previous works, the authors tested different Computational Fluid-Dynamics models and boundary conditions and compared the numerical results with experimental measurements that were performed in a scaled vacuum vessel, called STARDUST [30], before and using an improved STADUST-Upgrade, the results showed a good capability of the numerical simulation to replicate well the real case [31,32].
In this work, the aim is to analyse, numerically, how the LOVA change in large vessel like ITER. As ITER has a huge internal volume (more than 2500 m3) and breaches are thought to be able to have a surface of 0.02 m2, the pressurisation transient is believed to be much longer than the one reproduced in reduced-scale vacuum vessels. Furthermore, friction due to the viscosity of the gas (air) has smaller importance for big objects, so the speed of the flow and its dust removing capability is expected to be higher for a real-scale object than for a reduced-scale one. A numerical simulation of the very first seconds of the pressurisation transient has been performed, in order to get information about the real severity of a LOVA in ITER. Here, an initial pressure of 100 Pa was considered to show what happens, not during the operation with an ignited plasma, but during a depressurisation transient of the vessel. The pressure and the Mach number fields over time is analysed and discussed. Furthermore, the authors show also the friction velocity on the wall of the vessel. This variable plays an important role in determining the resuspension ratio of dust [33,34,35,36].

2. Numerical Simulation Settings
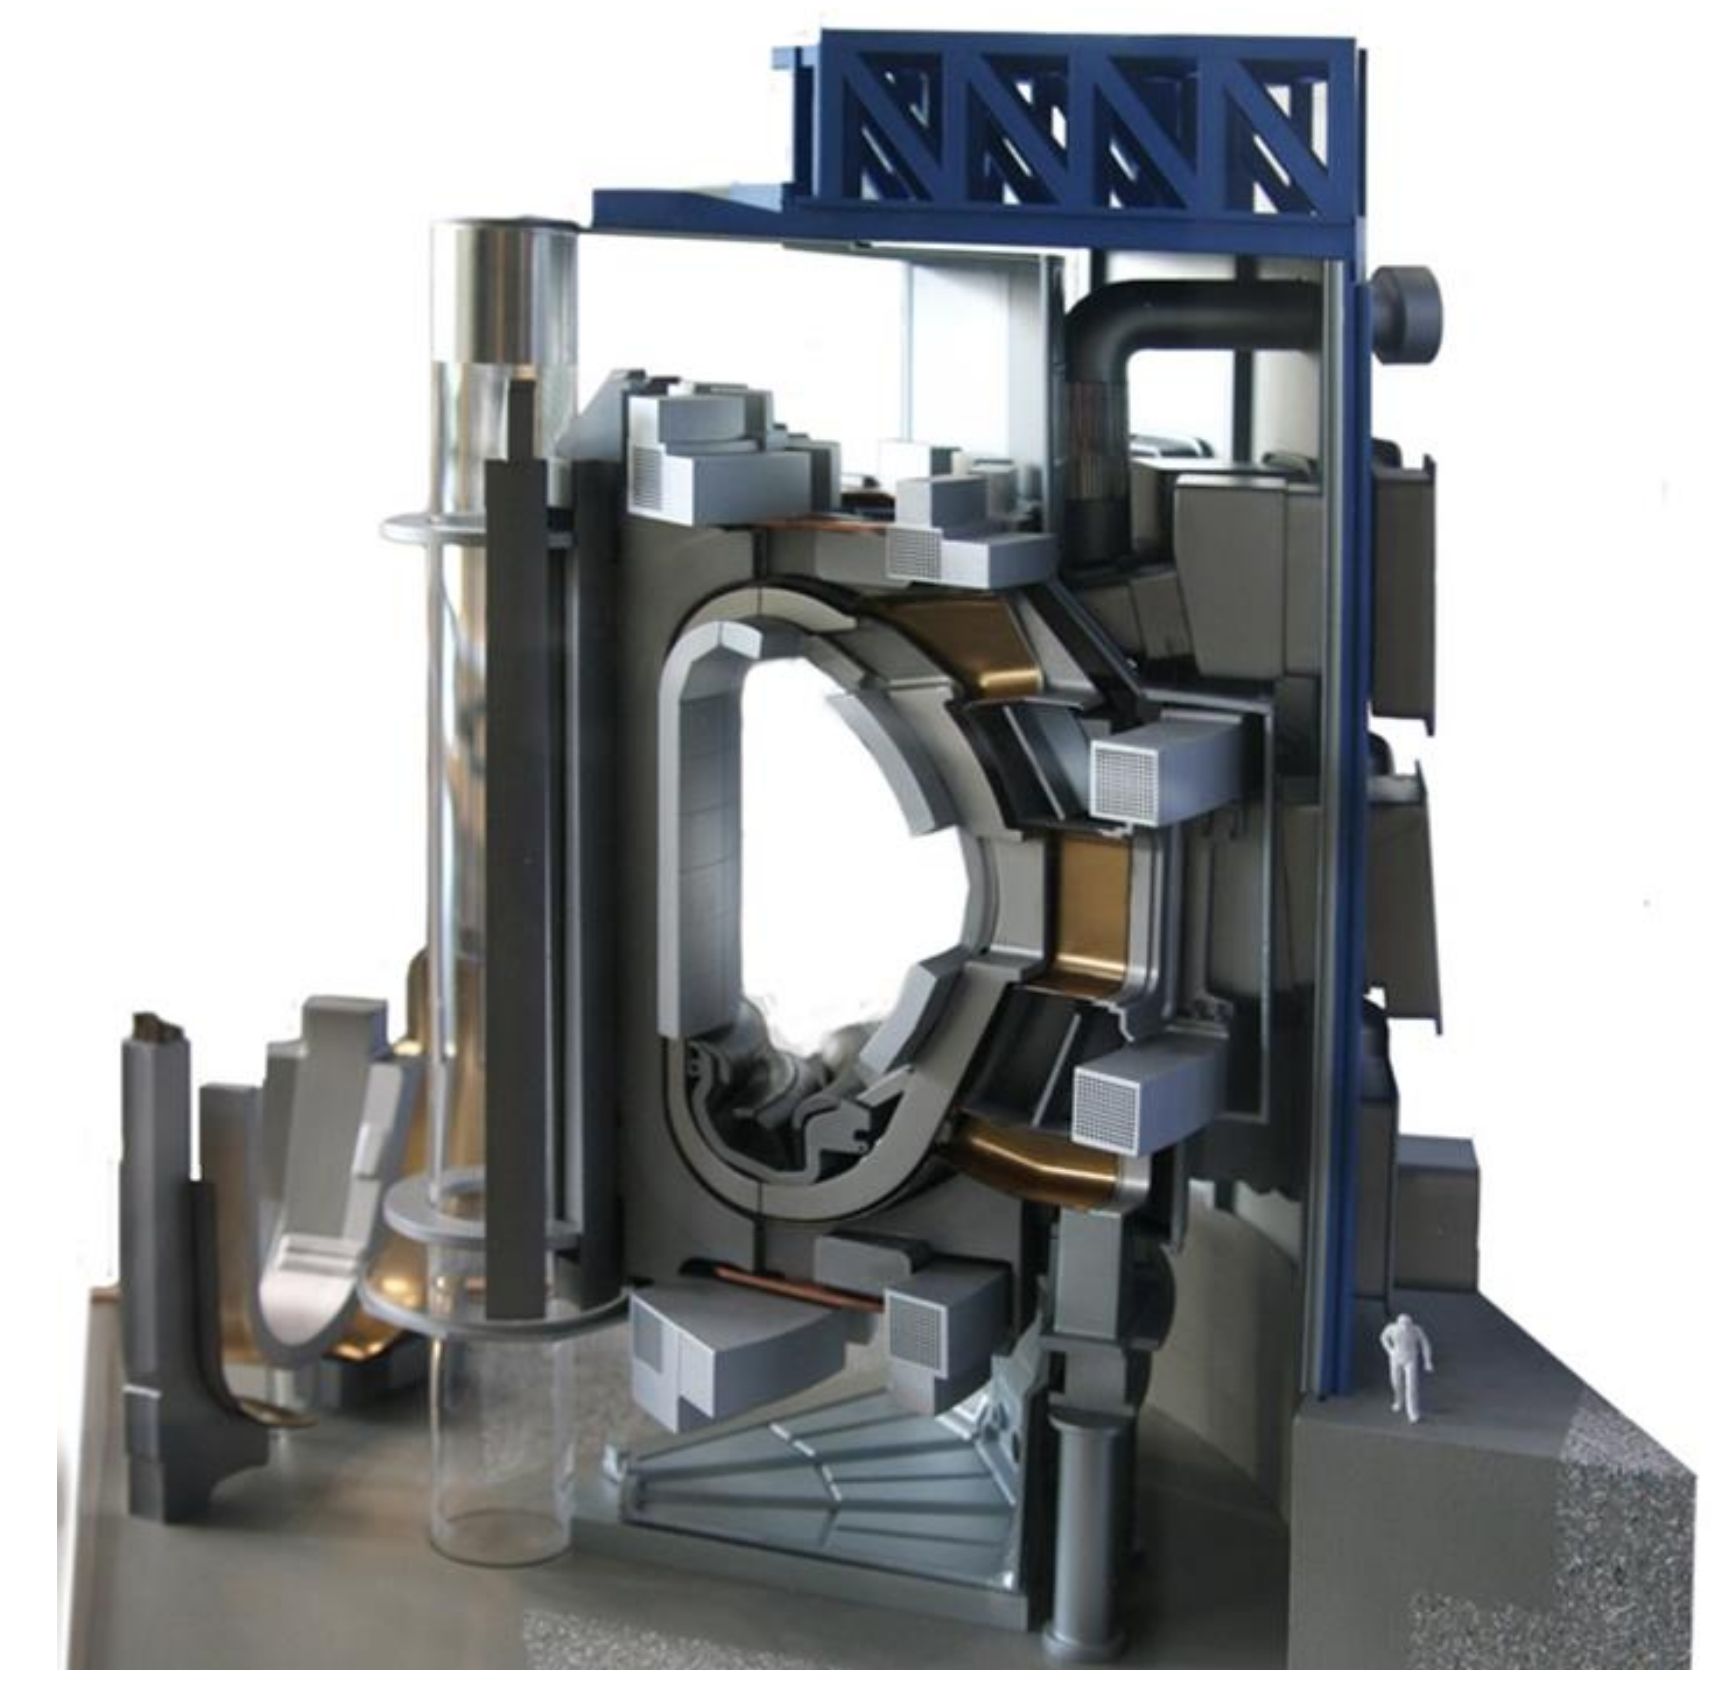
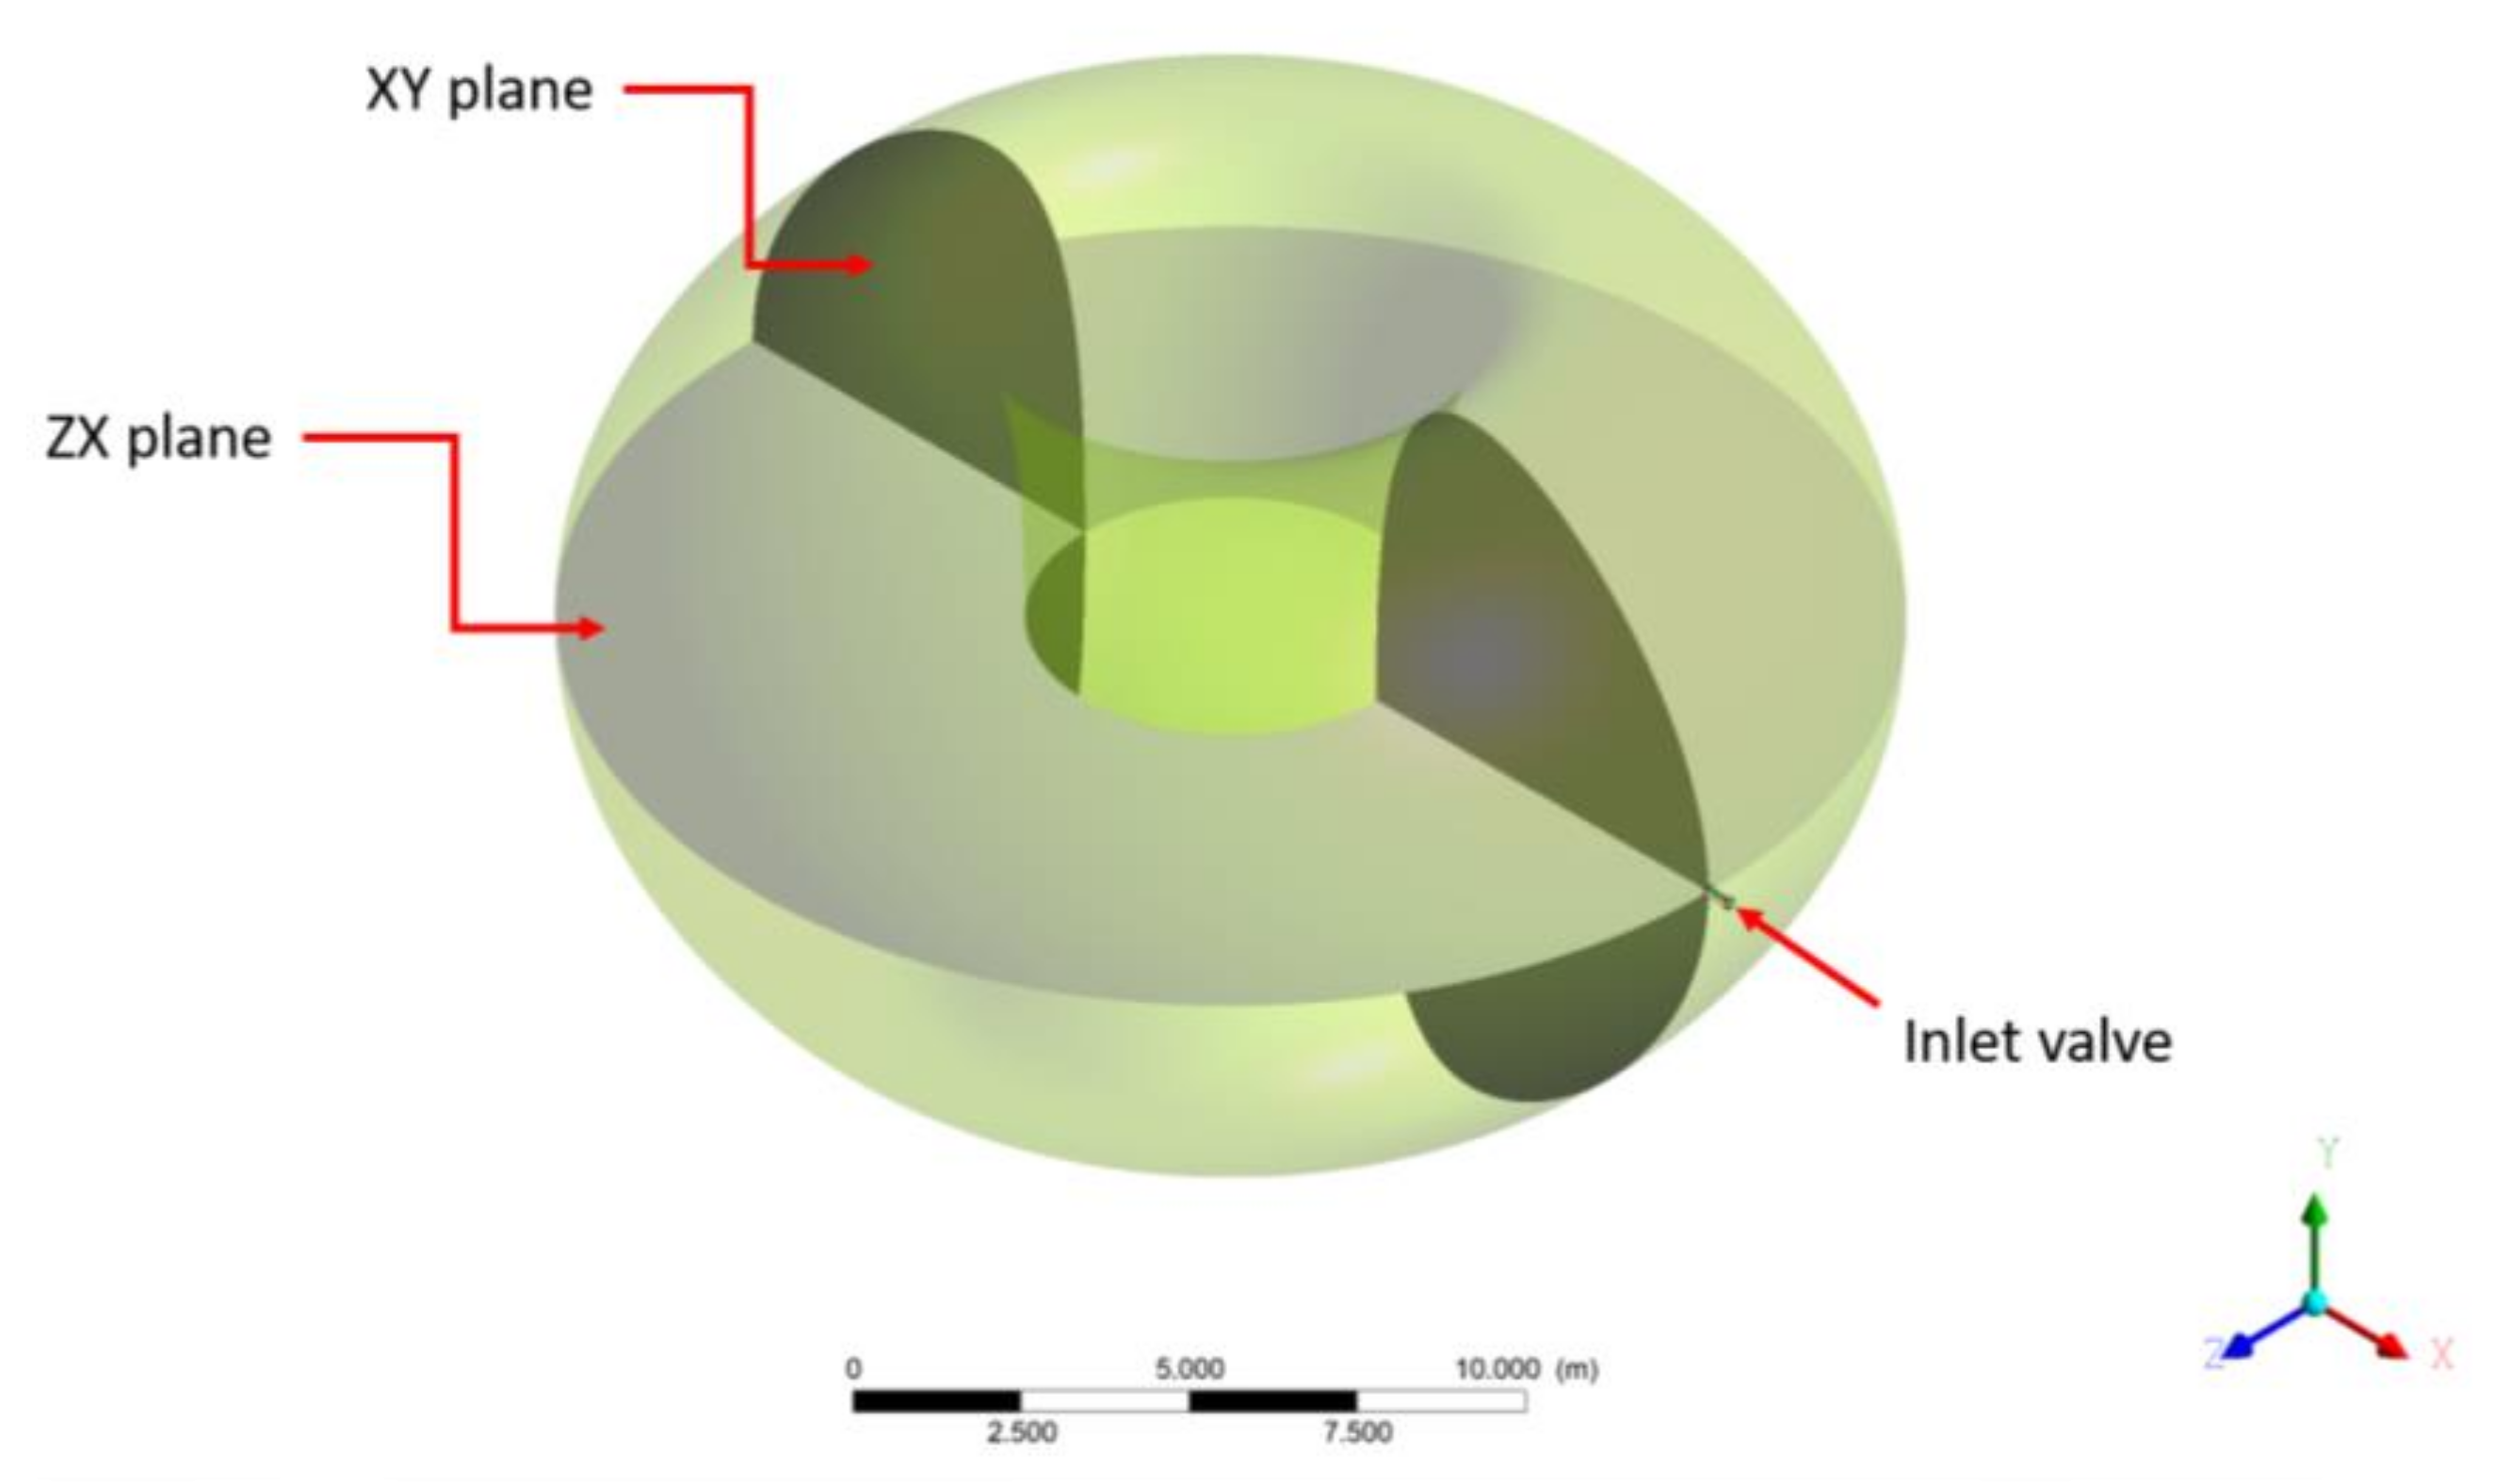
This section describes the geometry, the mathematical model, and the boundary conditions that are set to make the numerical simulation of a LOVA inside an ITER-like vessel. For this work, the code ANSYS finite-volume software CFX was used to carry out the transient simulations of the opening of the valve and of the pressurisation of the vacuum vessel.

2.1. Geometry

The geometry of the simulation has been built while considering the size and the shape of ITER. It is a torus with the major radius of 6.21 m and the minor radius of 2 m. The entire volume is 837 m3. The torus section is not circular, but it is a “D” shape. Figure 1 shows a concept design of a section of ITER and compares the sizes with an average human [37].
In this work, a simplified geometry of ITER has been built. The major and minor radii are equal to the ITER ones. It is assumed that a breach of 0.02 m2 cross section forms on a penetration line, the radius of the circular hole is therefore 16 cm, according to the GSSR report [38].
Figure 2 shows the geometry domain and the inlet valve, where the air is supposed to flow. A grid convergence study was performed to be sure that the final grid was fine enough to accurately mesh the domain. To do that, three grids were considered for each geometry (the coarse one with 1.8 million cells, the second one with 3 million cells and the third one with 5.2 million cells), and for each of them a 0.5-s simulation was carried out. The grid convergence indicator was the instantaneous maximum value of the friction speed reached on the walls of the Tokamak. It was found that with the coarse grid, this value was lower than for the two other ones, whereas the results were similar for the medium and the fine meshes. So, the final two-second simulation was performed using the finest grid.

2.2. Mathematical Model

The main equations that define the phenomenon are here described:
The ideal gas law, that is the equation of state for ideal gases (it neglects intermolecular attractions and molecular sizes).
p = ρ R T
where:
  • p is the pressure;
  • ρ is the density;
  • R is the specific gas constant, calculated as the universal gas constant divided by the molecular weight; and,
  • T is the temperature of the gas.
The next two equations express the relationship between absolute and static temperature and pressure in function of the Mach number.
T 0 = T · ( 1 + γ 1 2 · M 2 )
p 0 = p · ( 1 + γ 1 2 · M 2 ) γ γ 1
where:
  • T0 is the absolute temperature;
  • p0 is the absolute pressure;
  • γ is the heat capacity ratio; and,
  • M is the Mach number.
Then, the continuity equation or mass conservation law:
ρ t + · ( ρ V ) = 0
where:
  • t is the time variable;
  • V is the velocity vector of the element; and,
Navier-Stokes equations describe the momentum conservation, one for each direction:
ρ ( V t + ( V ) V ) = · ( ( p 2 3 ( μ + μ T ) ( · V ) 2 3 ρ k ) · I + ( μ + μ T ) ( V + ( V ) T ) )
where μ and μT are respectively the dynamic viscosity and the turbulent dynamic viscosity. k is the turbulent kinetic energy. While the first one is a property of the gas, the turbulent viscosity is a parameter used to simulate the turbulent dissipation at scales smaller than the mesh size, and is therefore a property of the flow.
The next equation represents the conservation of energy law:
ρ C p ( T t + V · T ) = · ( λ T ) + μ · ( V + ( V ) T 2 3 · ( · V ) · I ) : V + p t + V · p
where:
  • Cp is the mass-specific heat capacity constant of the gas (air); and,
  • λ is the thermal conductivity.
These equations describe the behavior of a monophase fluid. Thus, the use of a turbulence model is needed. The aim of this model is to determine the turbulent dynamic viscosity (μT). In this work, we used the k-ε model. It is a two-equation model that is used to solve two transported variables, the turbulence kinetic energy (k) and the rate of dissipation of turbulent kinetic energy (ε):
ρ ( k t + ( V ) k ) = · [ ( μ + μ T σ k ) k ] + P k ρ ϵ
ρ ( ϵ t + ( V ) ε ) = · [ ( μ + μ T σ ϵ ) ϵ ] + C ϵ 1 ϵ k P k C ϵ 2 ρ ϵ 2 k
where σk, σε, Cε1, and Cε2 are constants, where their values are shown in Table 1. Pk is calculated as follows:
P k = μ T · ( V : ( V + ( V ) T 2 3 · ( · V ) 2 ) 2 3 ρ k · ( · V )
Then, the turbulence viscosity (or eddy viscosity), is obtained as follows:
μ T = ρ C μ k 2 ϵ
where Cμ is another constant of the model, shown in Table 1.

2.3. Boundary Conditions and Outputs Variables

The initial pressure inside the Tokamaks is uniform and equal to 100 Pa. The initial temperature is equal to 20 °C (293.15 K) and only air is present inside the vessel. In the inlet section, a profile of pressure has been imposed and the air is free to flow inside with any mass flow rate (according to the fluid dynamics equation). The pressure function is:
p o = p i n + ( p a t m p i n ) ( 1 e t / τ )
where pin is the initial pressure inside the Tokamak, while τ is a time constant. A very small τ means a very fast isolation break, and the inlet pressure reaches the atmosphere pressure very soon. Contrariwise, large τ are more suitable for events where the isolation leakage is slow. In this work, τ is equal to 1 s. The inlet temperature has been set equal to 20 °C (293.15 K).
All of the walls are adiabatic and no-slip and impermeability conditions are imposed on them; their surface is assumed to be smooth. In addition to those equations, as the expansion of the gas causes a great drop of temperature, physical properties as viscosity and thermal conductivity cannot be considered to be constant. For both quantities, the Sutherland’s law was used:
μ = μ r e f · ( T T μ , r e f ) 3 / 2 · T μ , r e f + S μ T + S μ
λ = λ r e f · ( T T λ , r e f ) 3 / 2 · T λ , r e f + S λ T + S λ
The constants of this model are listed in Table 2.
Once all of the equations have been resolved, the primitive quantities listed above are post-processed to get information about the flow. The shear (or friction) velocity, which greatly affects the dust removal from the walls and therefore its resuspension, is calculated as:
u * = τ w ρ
where τ w is the local shear stress on the walls.
The time step was let free to adapt to the actual flow conditions, in order to ensure the good numerical stability of the implicit scheme (the Courant number never exceeded 4) and to accurately reproduce the transient flow. The duration of the transient is 2 s.

2.4. Model Validation

The mathematical model used in this work has been tested and validated with the experimental campaign in the scaled facility STARDUST-Upgrade [27]. At the moment, experimental data about LOVAs in TOKAMAKs do not exist, and then it is impossible to directly validate the model for these reactors.
The experimental and numerical studies performed by means of STARDUST-Upgrade led to an optimization of the accuracy of the model. An important role plays the boundary condition imposed at the inlet valve. It has been found that Equation (11) is the best fit of pressure profile in the intaking area, where the constant τ plays a crucial role. The larger is τ, the more severe is the accident. As we said, τ has been set equal to 1 s; that means that the accident is very fast. In a real scenario, τ may have very small values (~1 s), which means an immediate and large rupture of the isolation barriers, or large values (also hours), which implicates a gradual isolation leakage, where large pressure drops occur from the external environment to the vacuum chamber.

3. Results

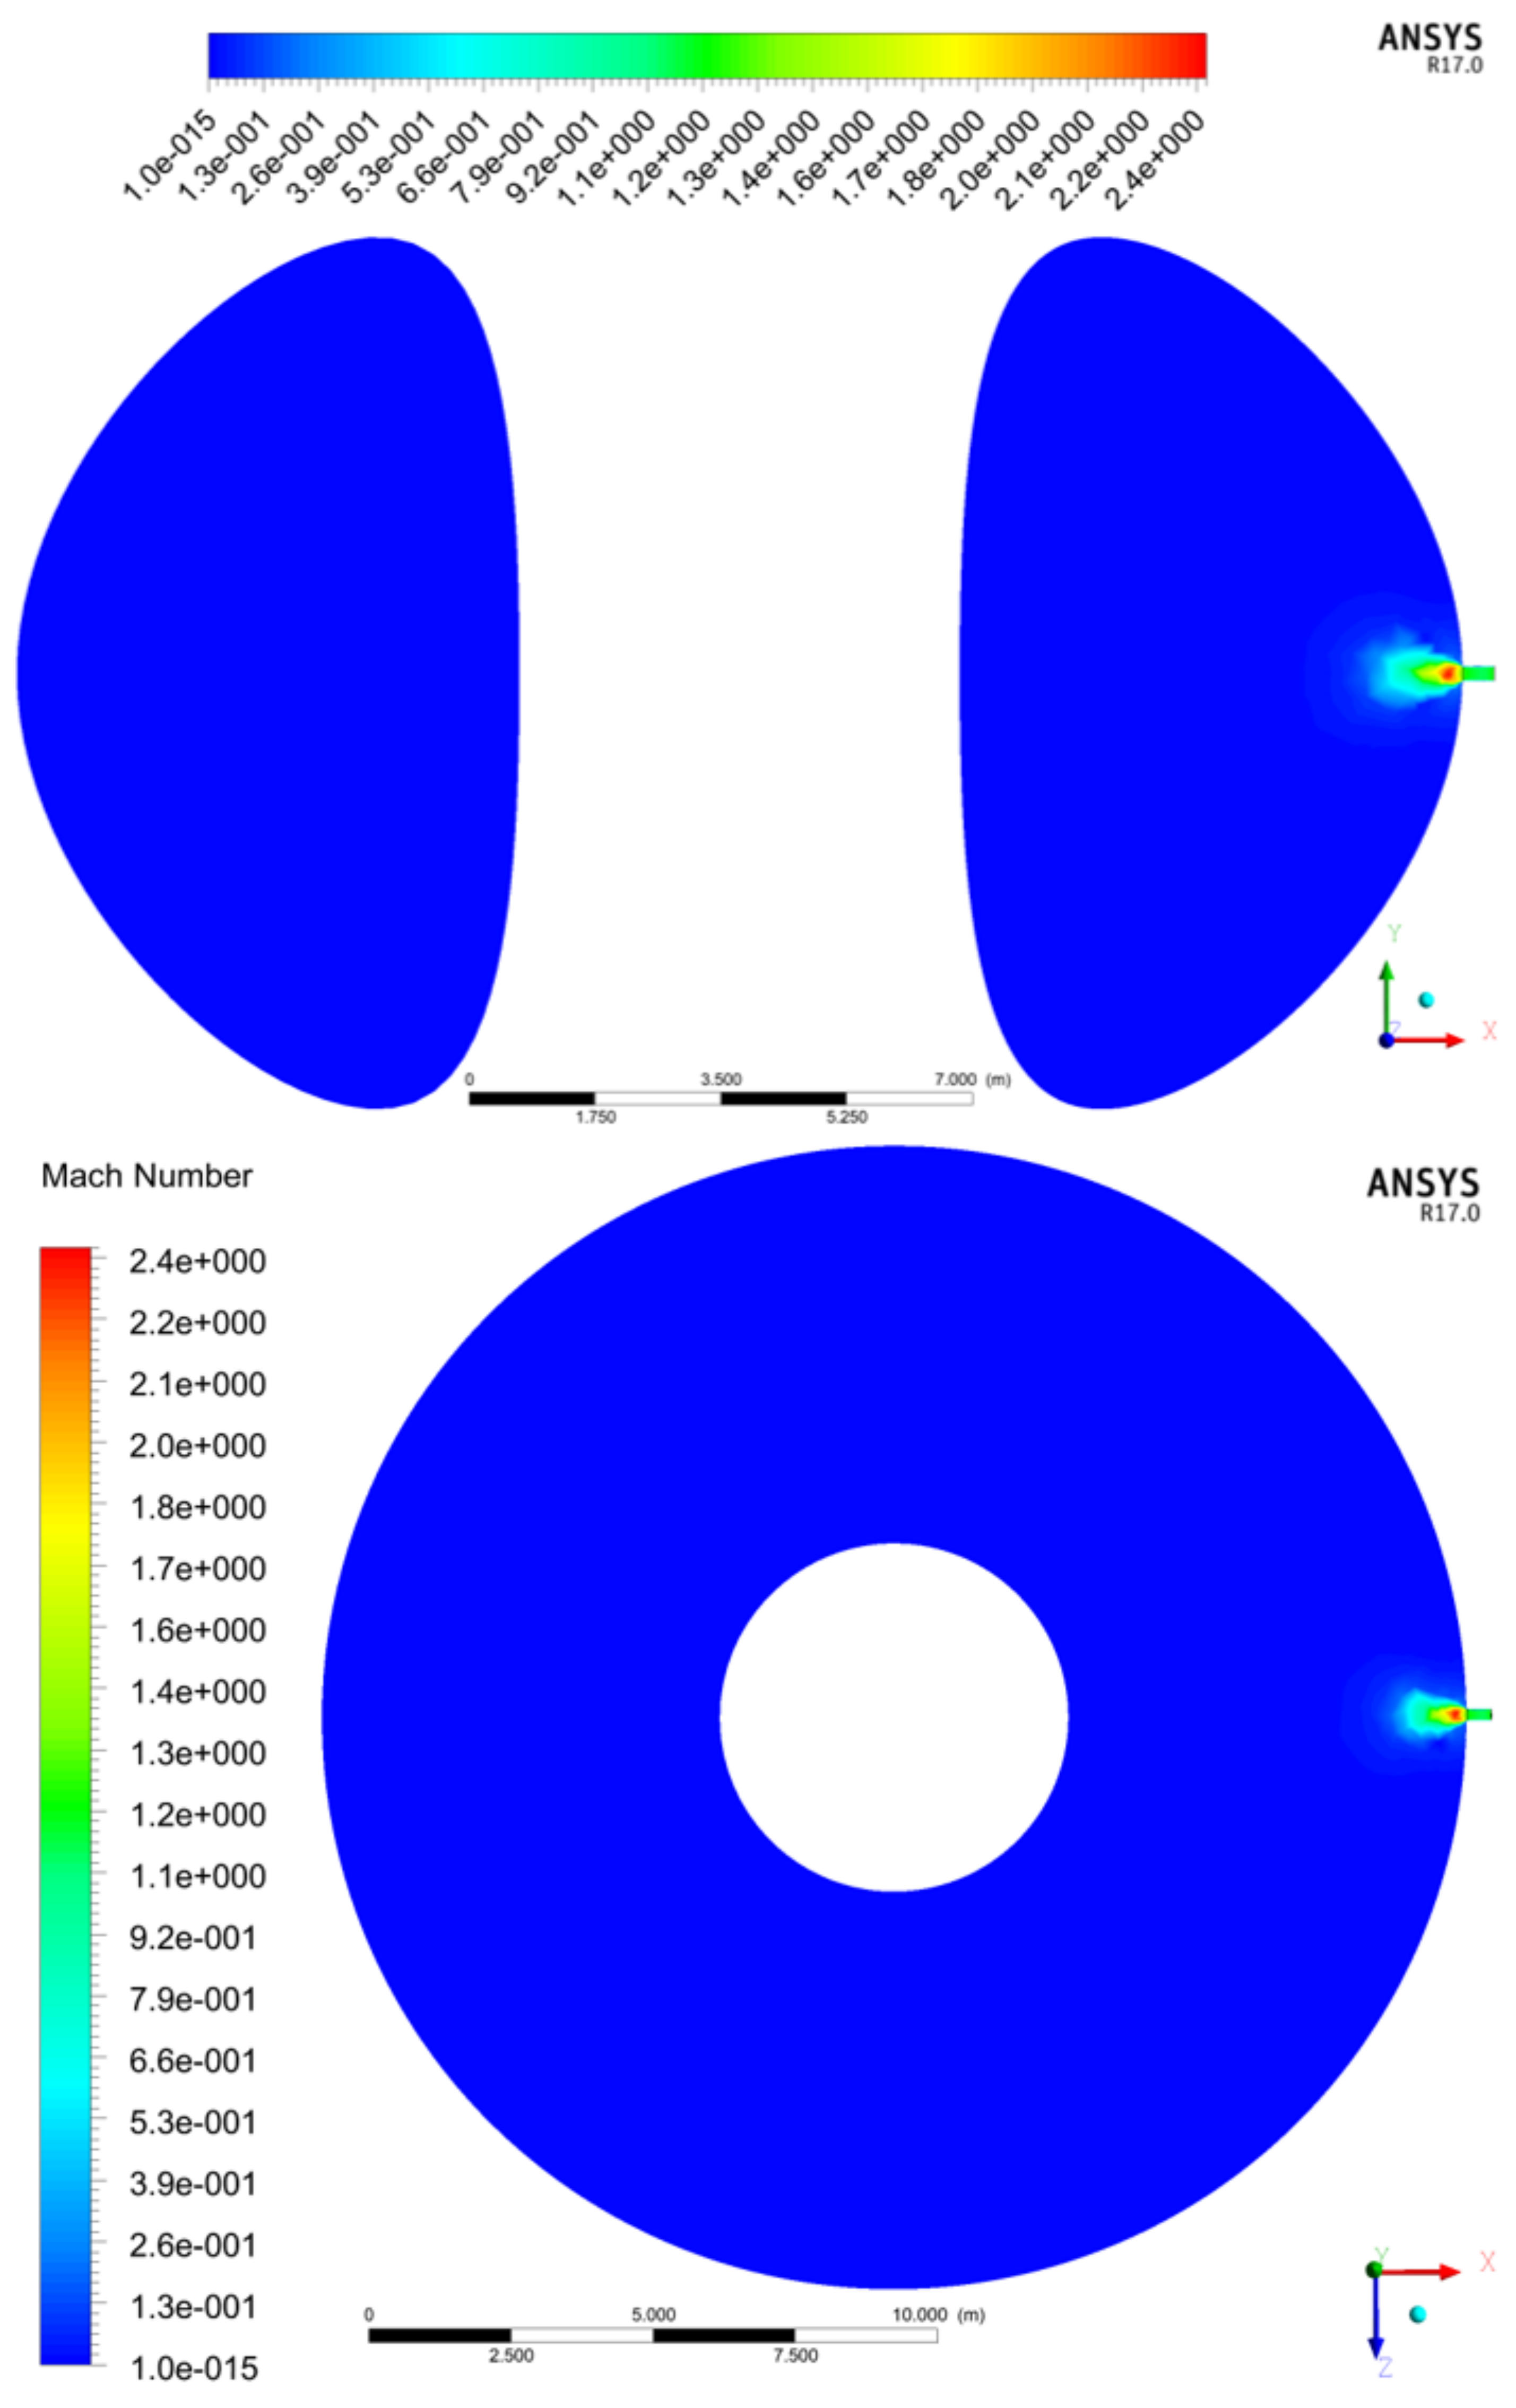
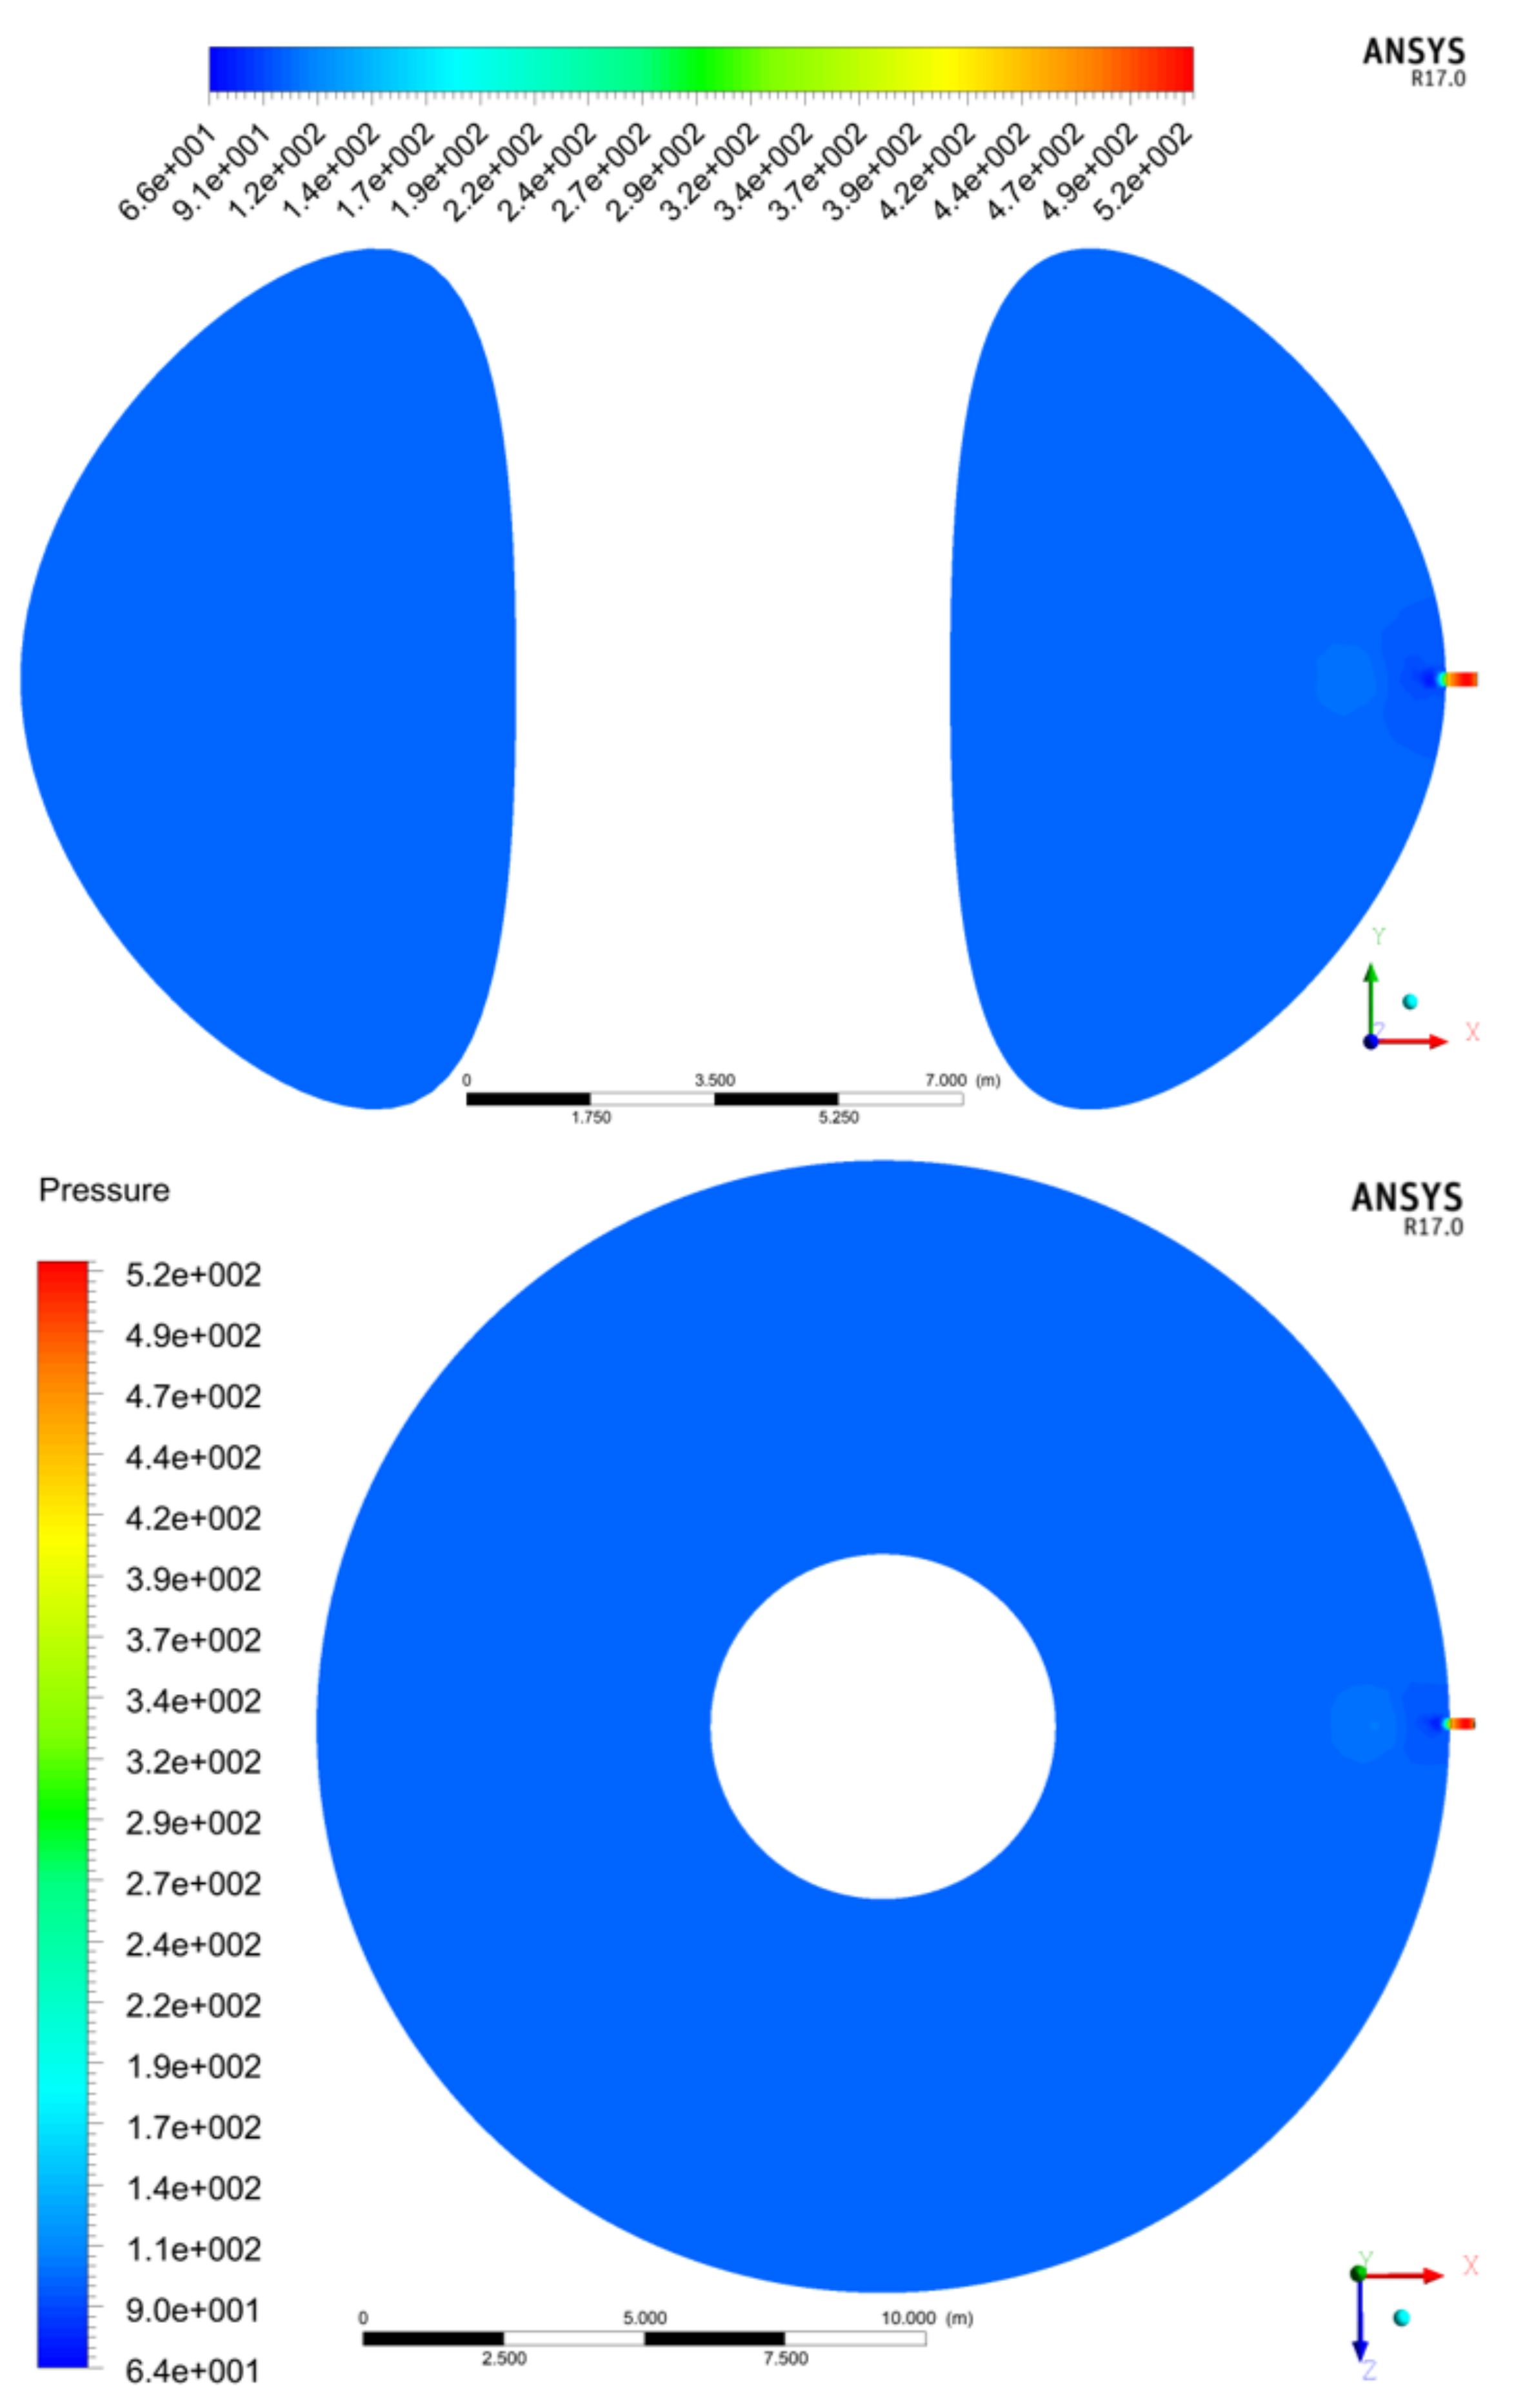
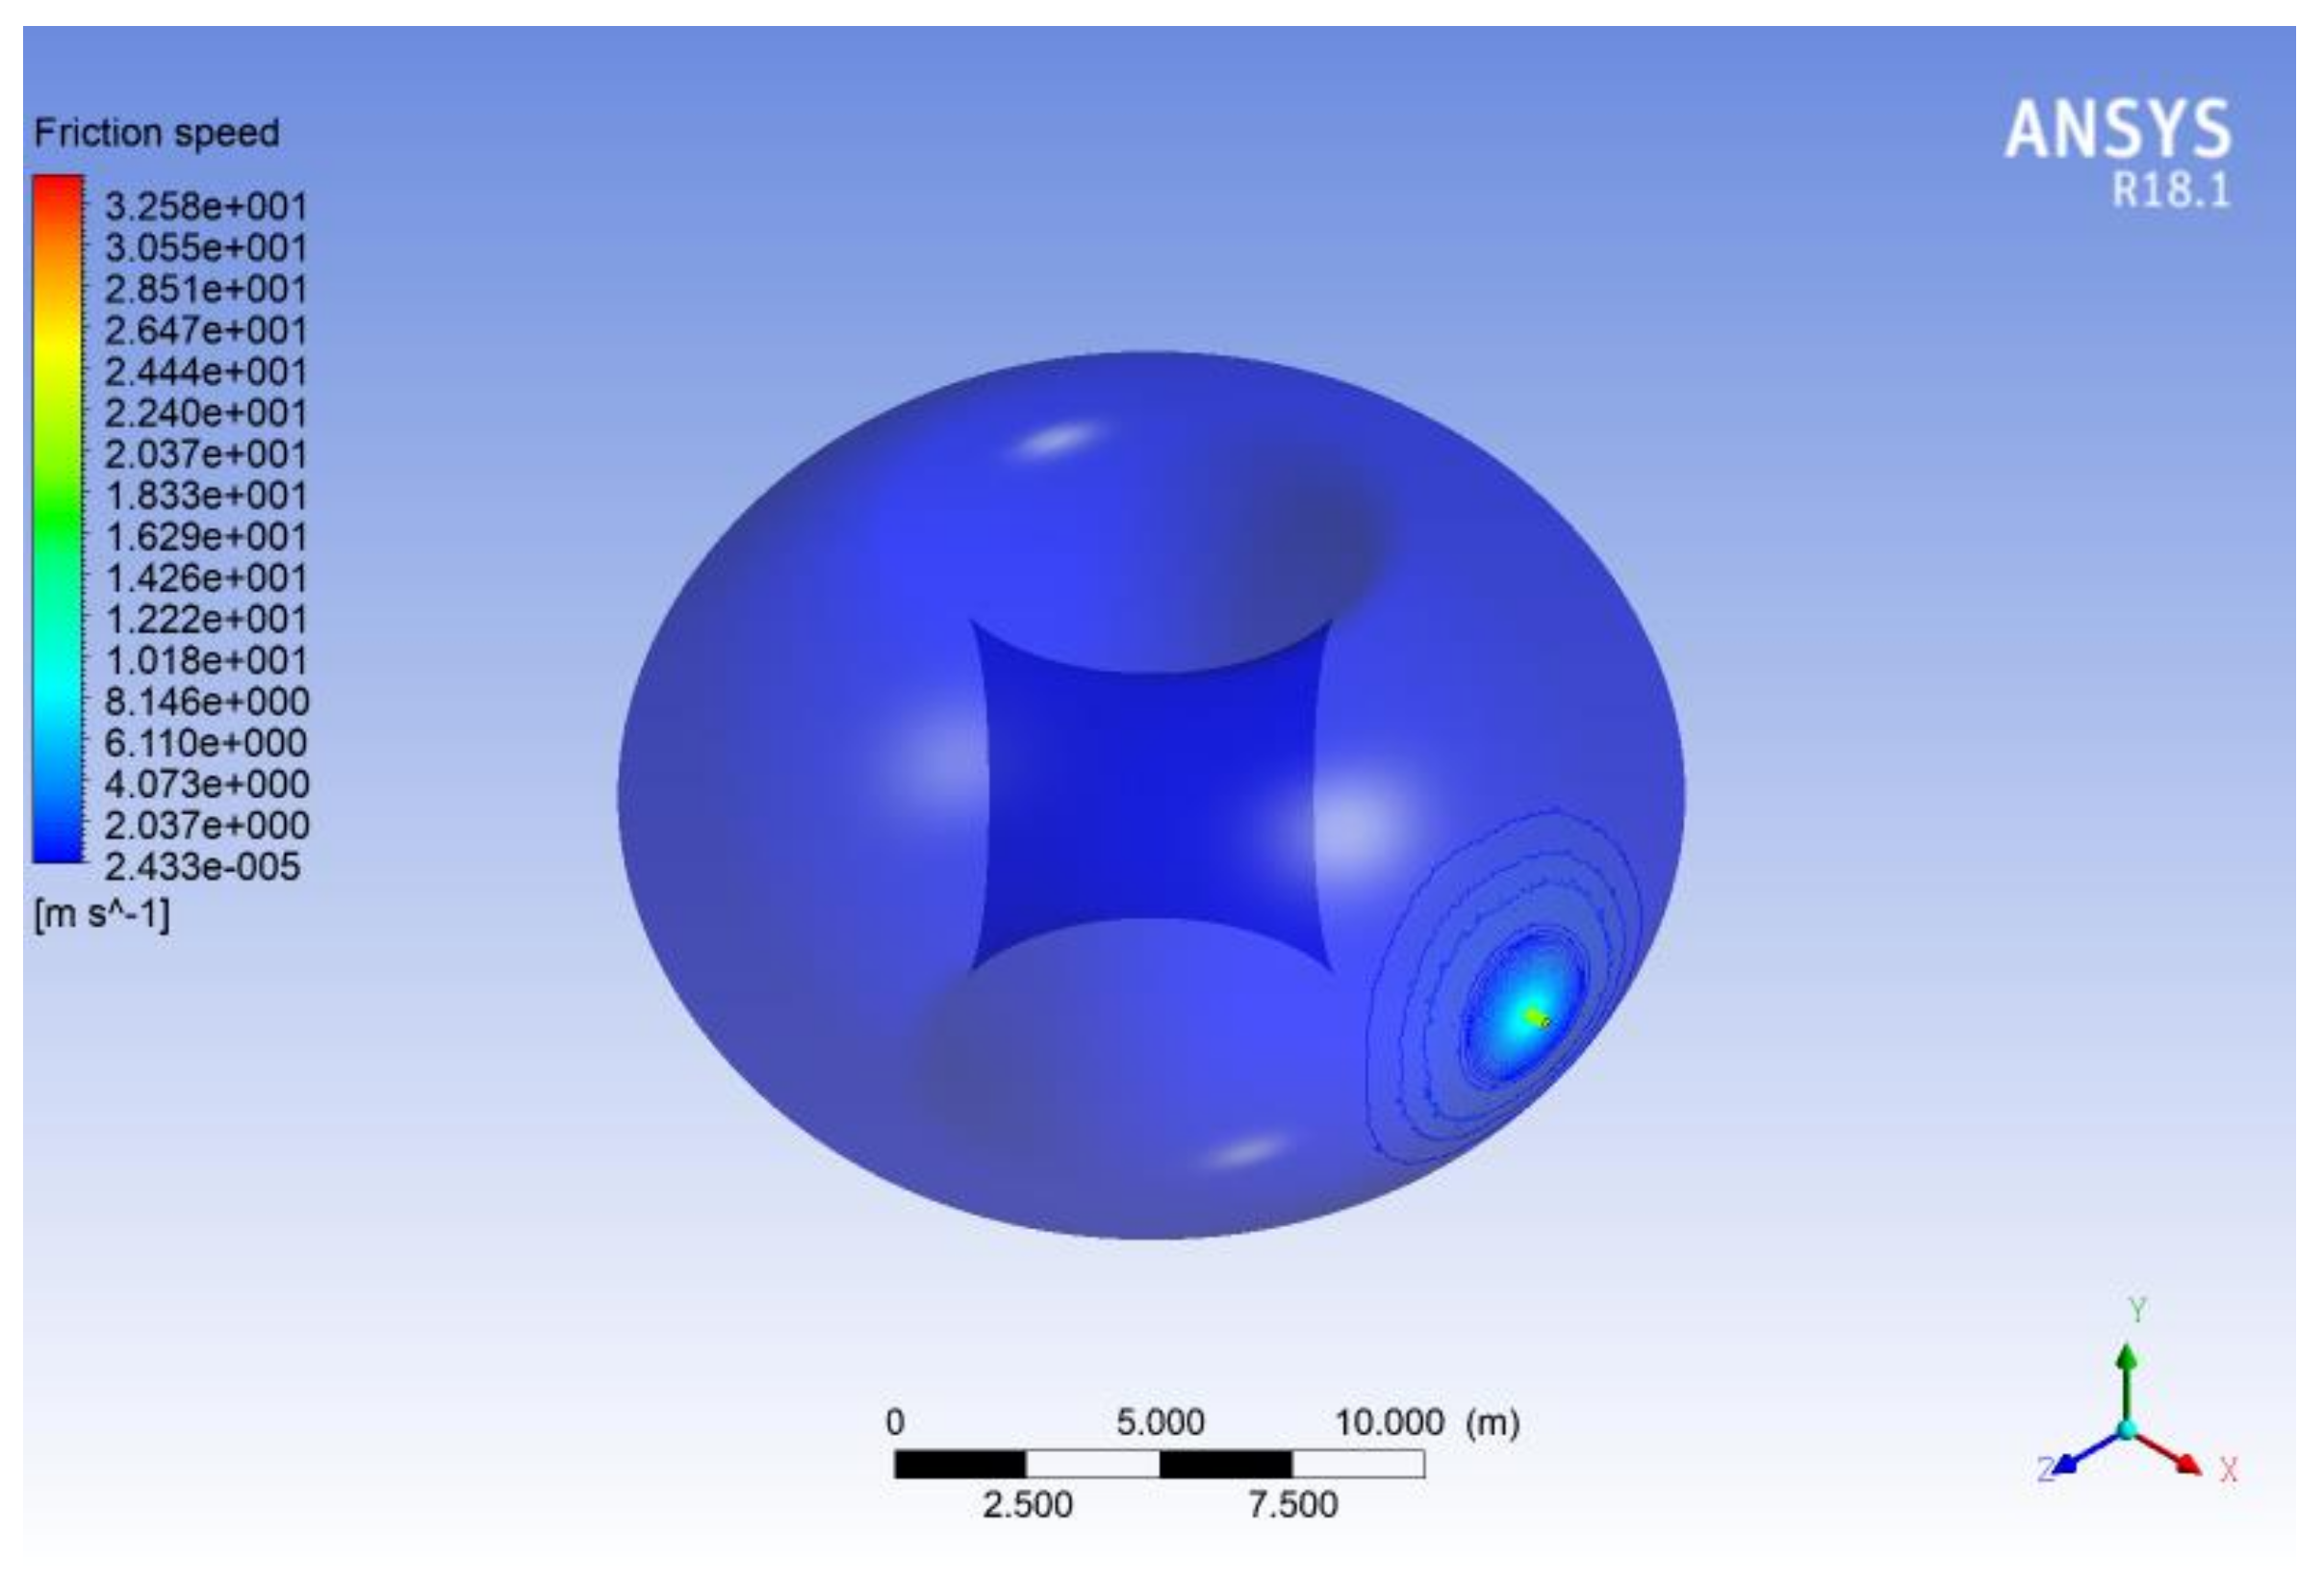
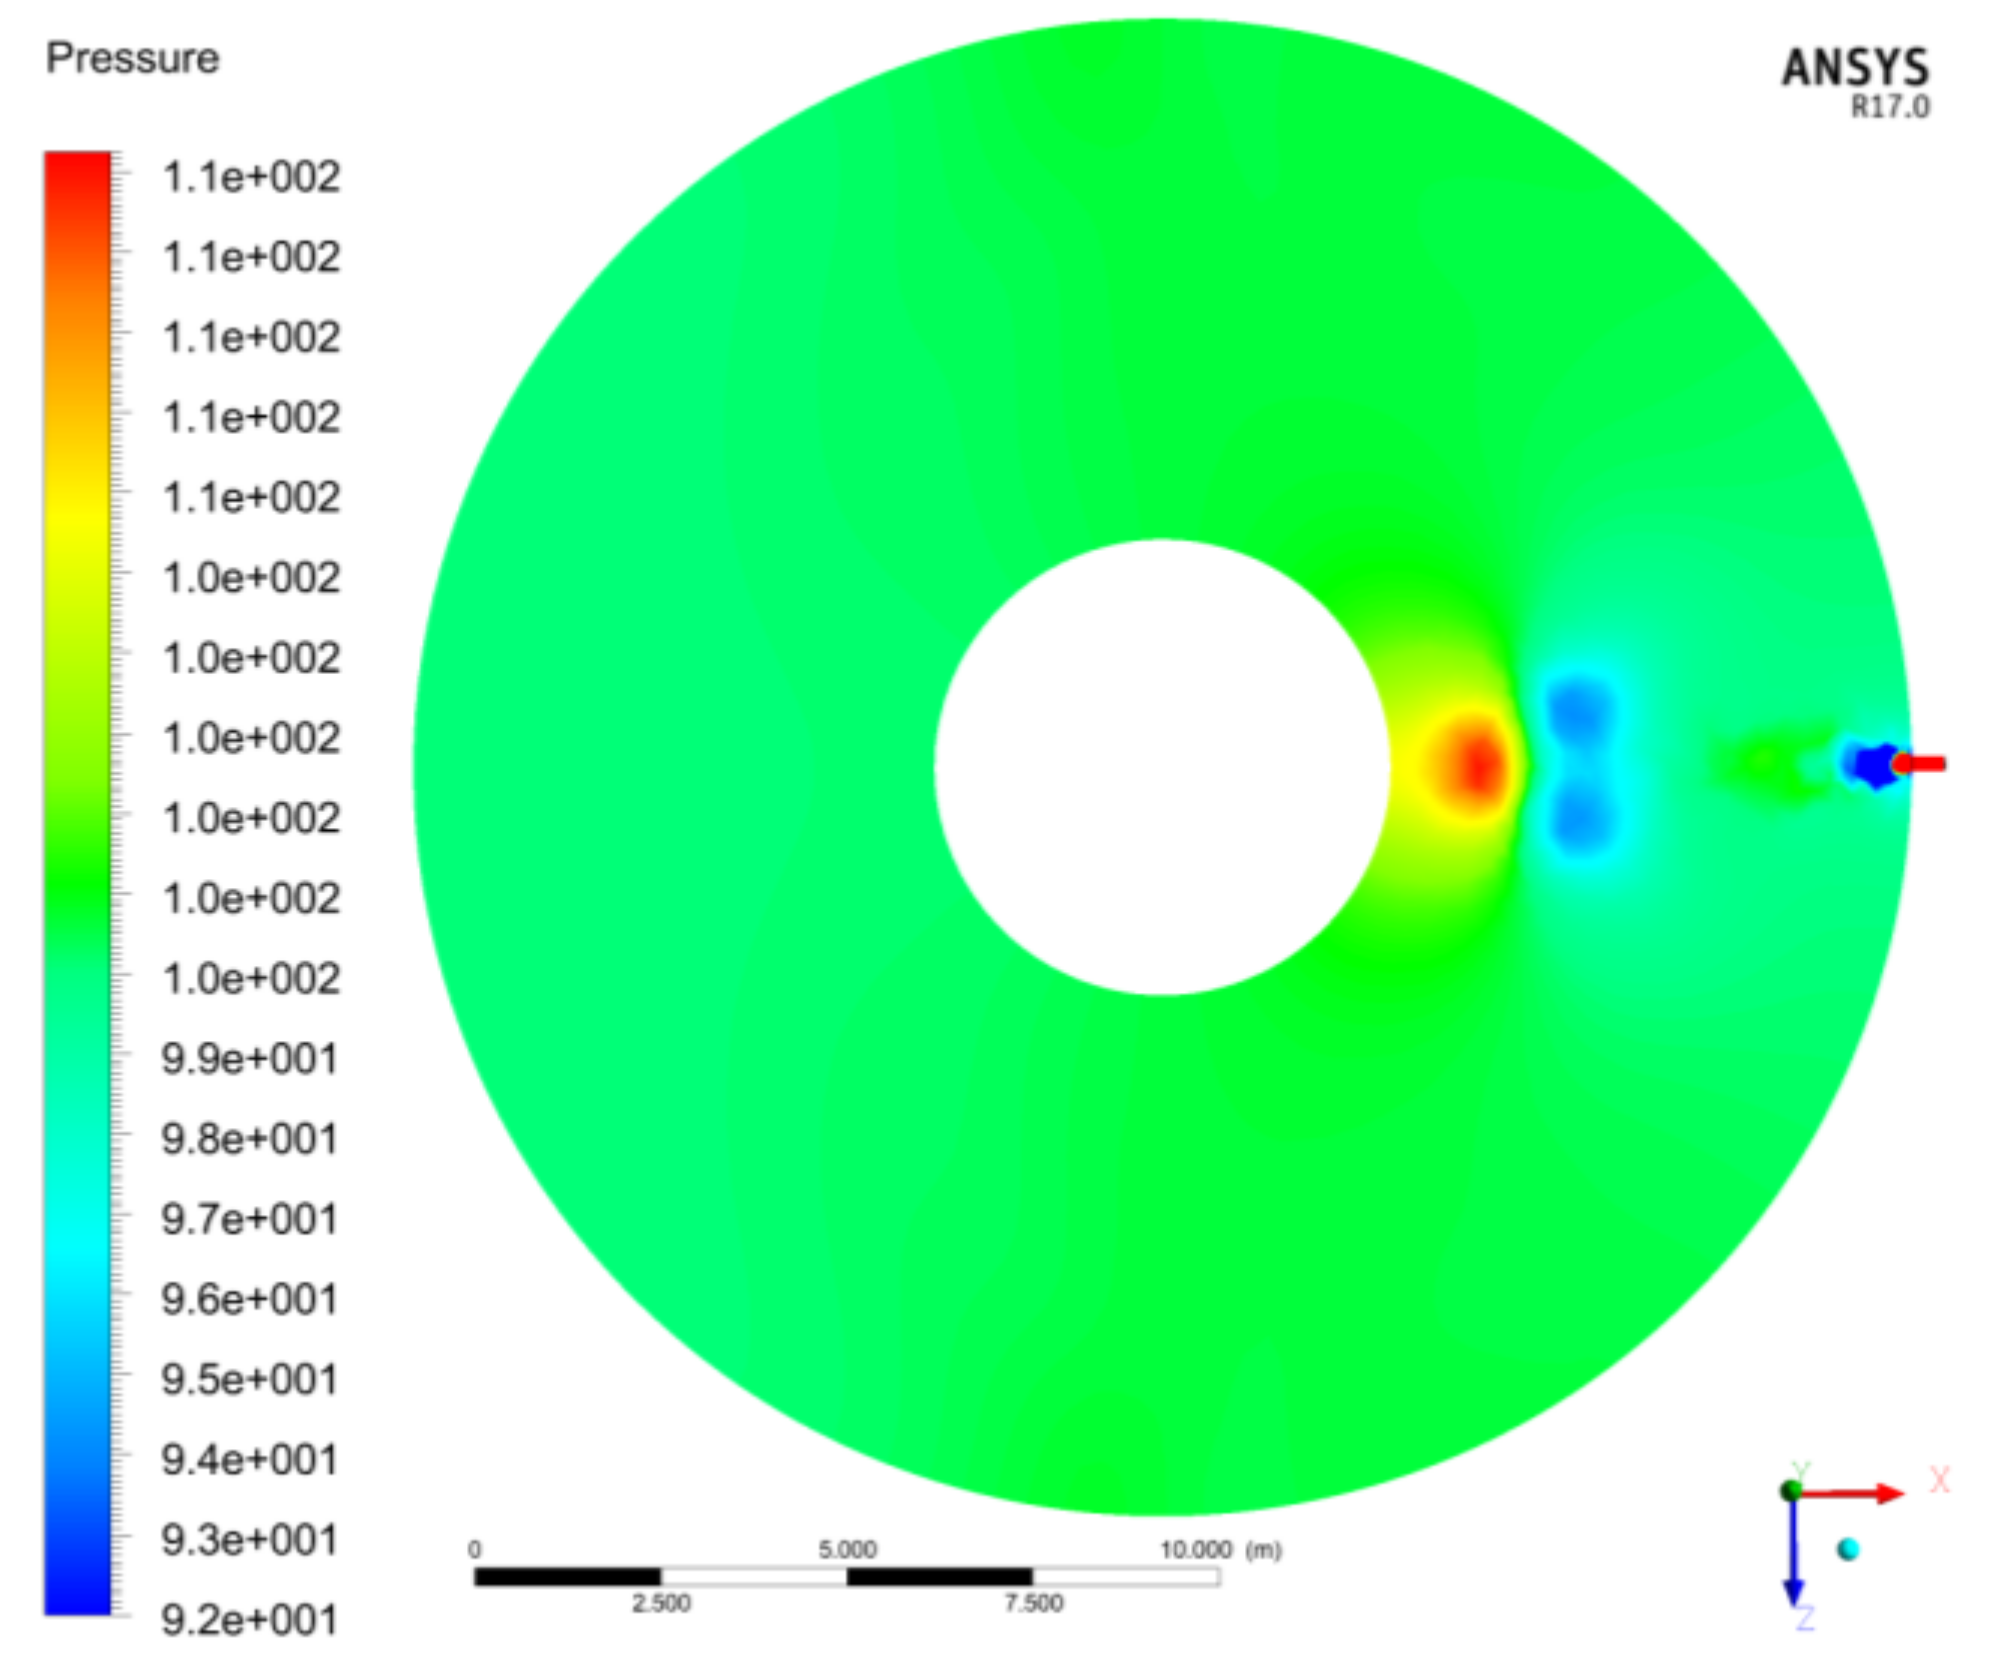
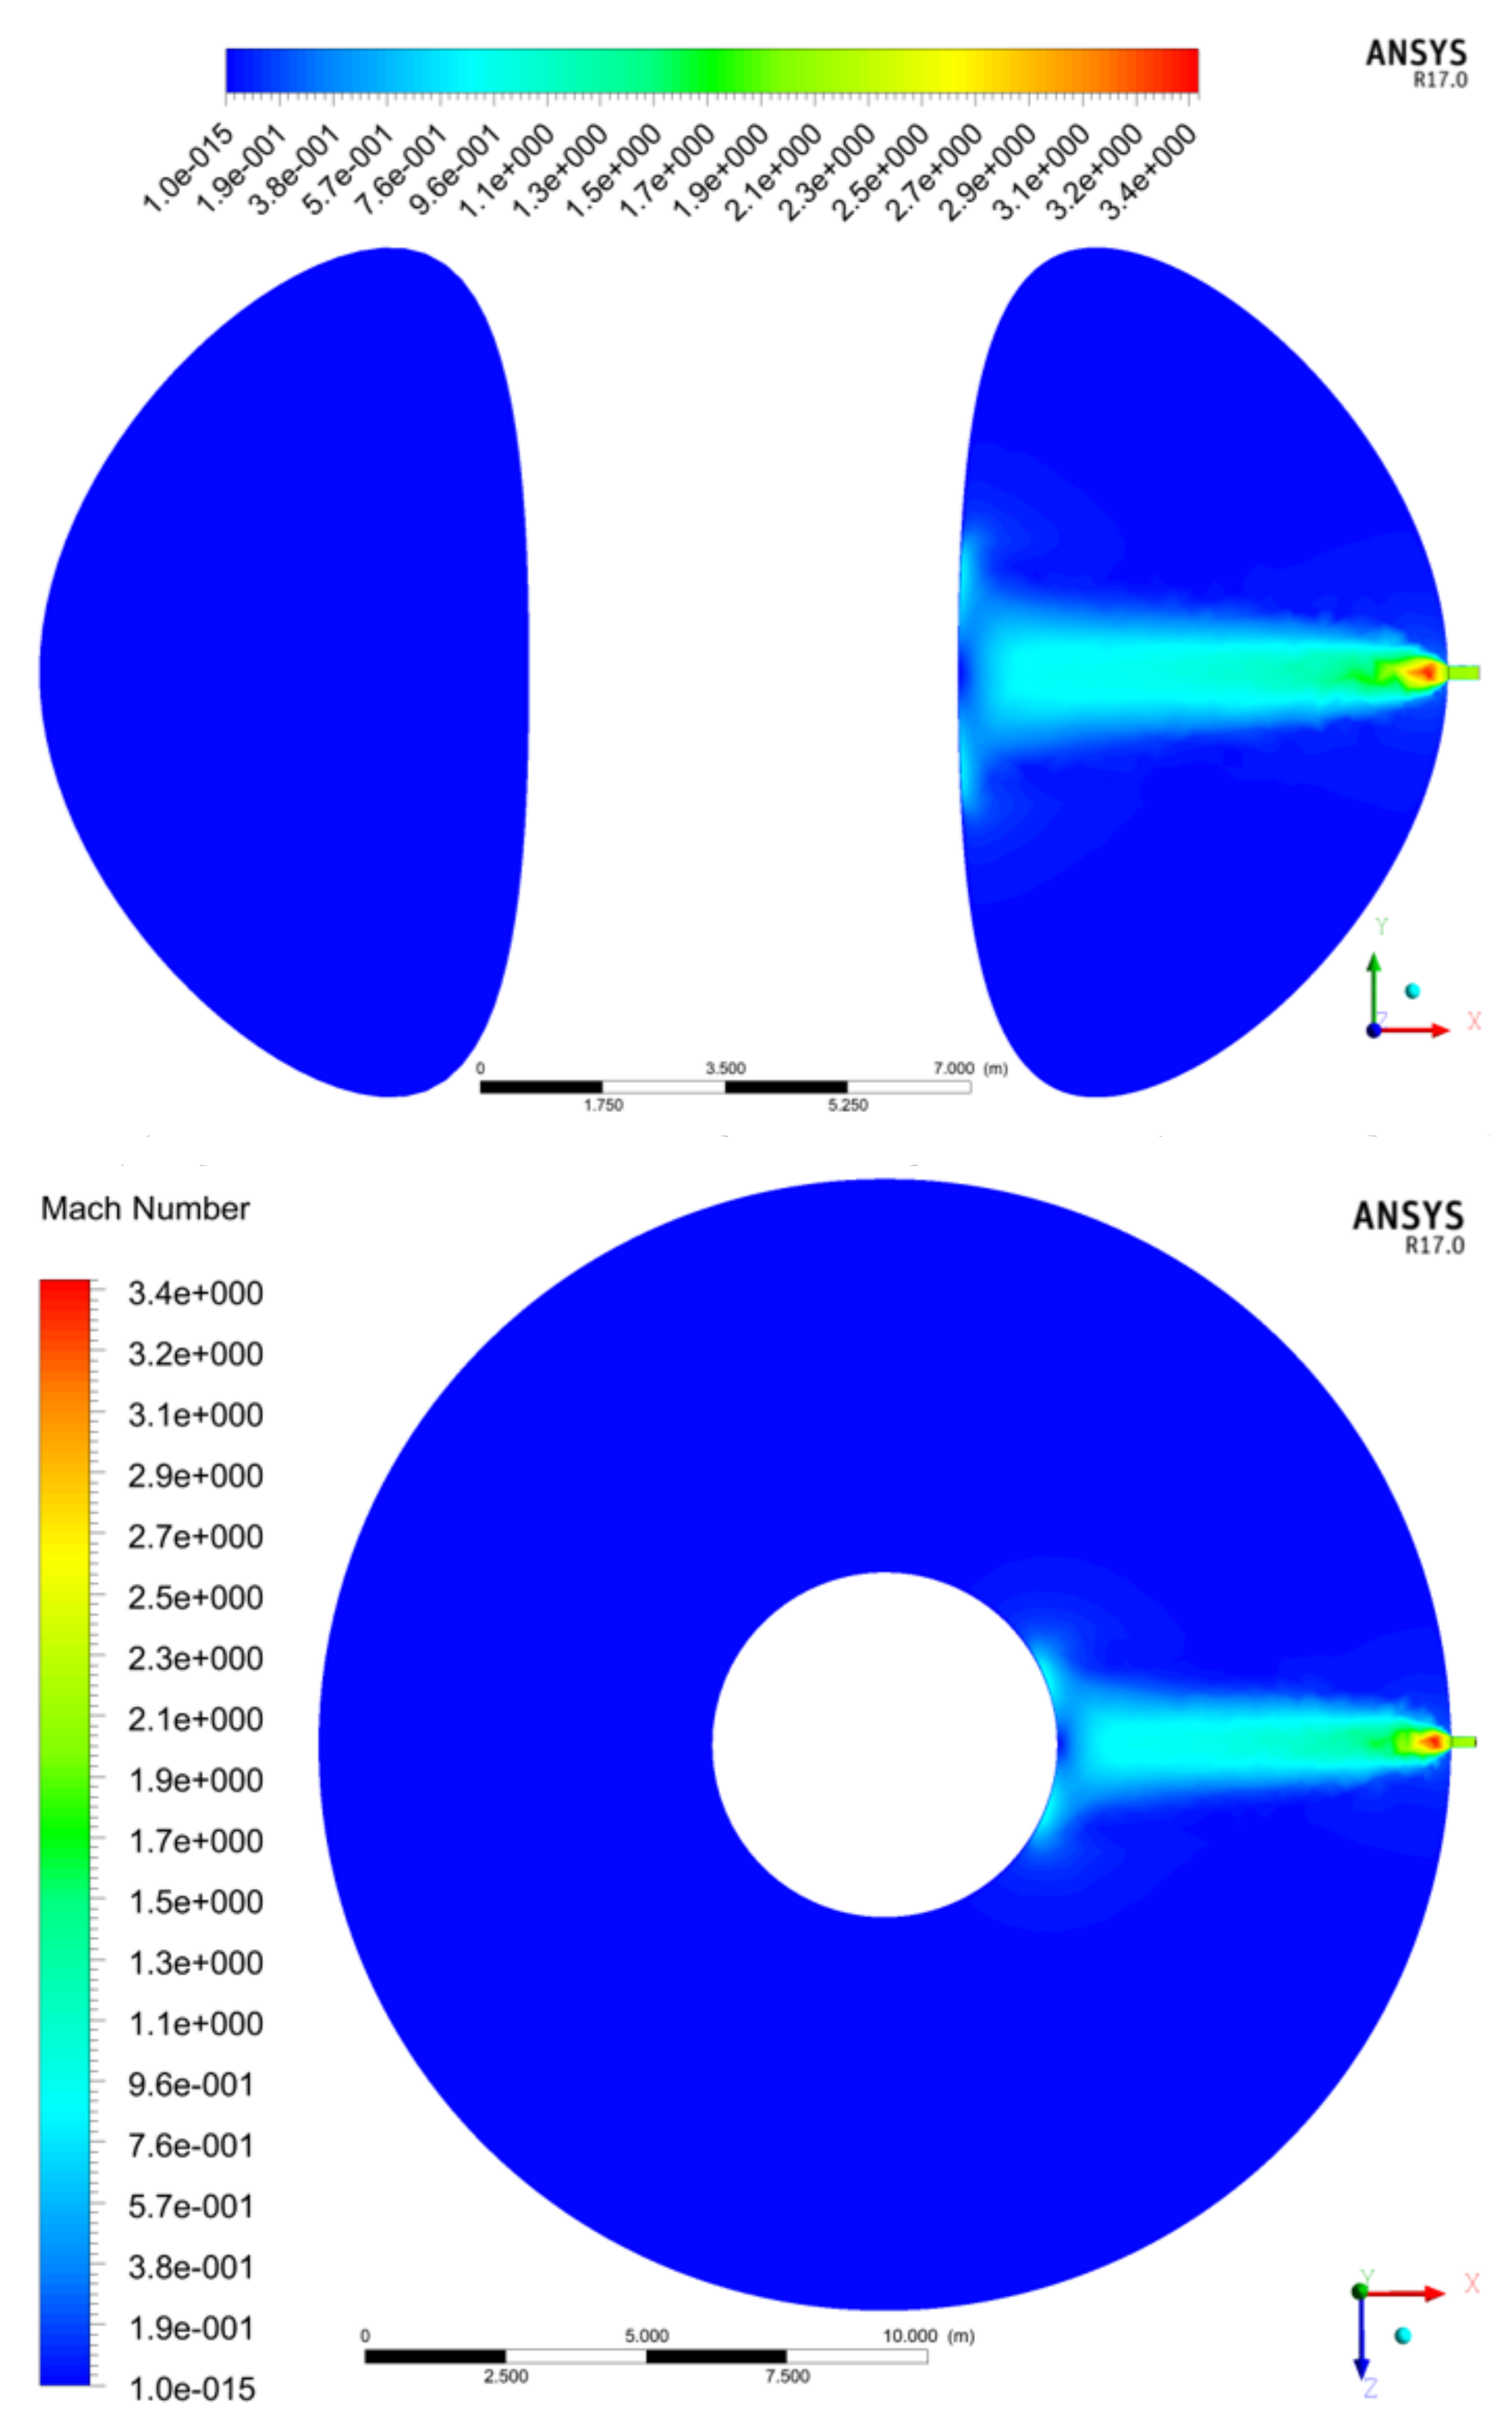
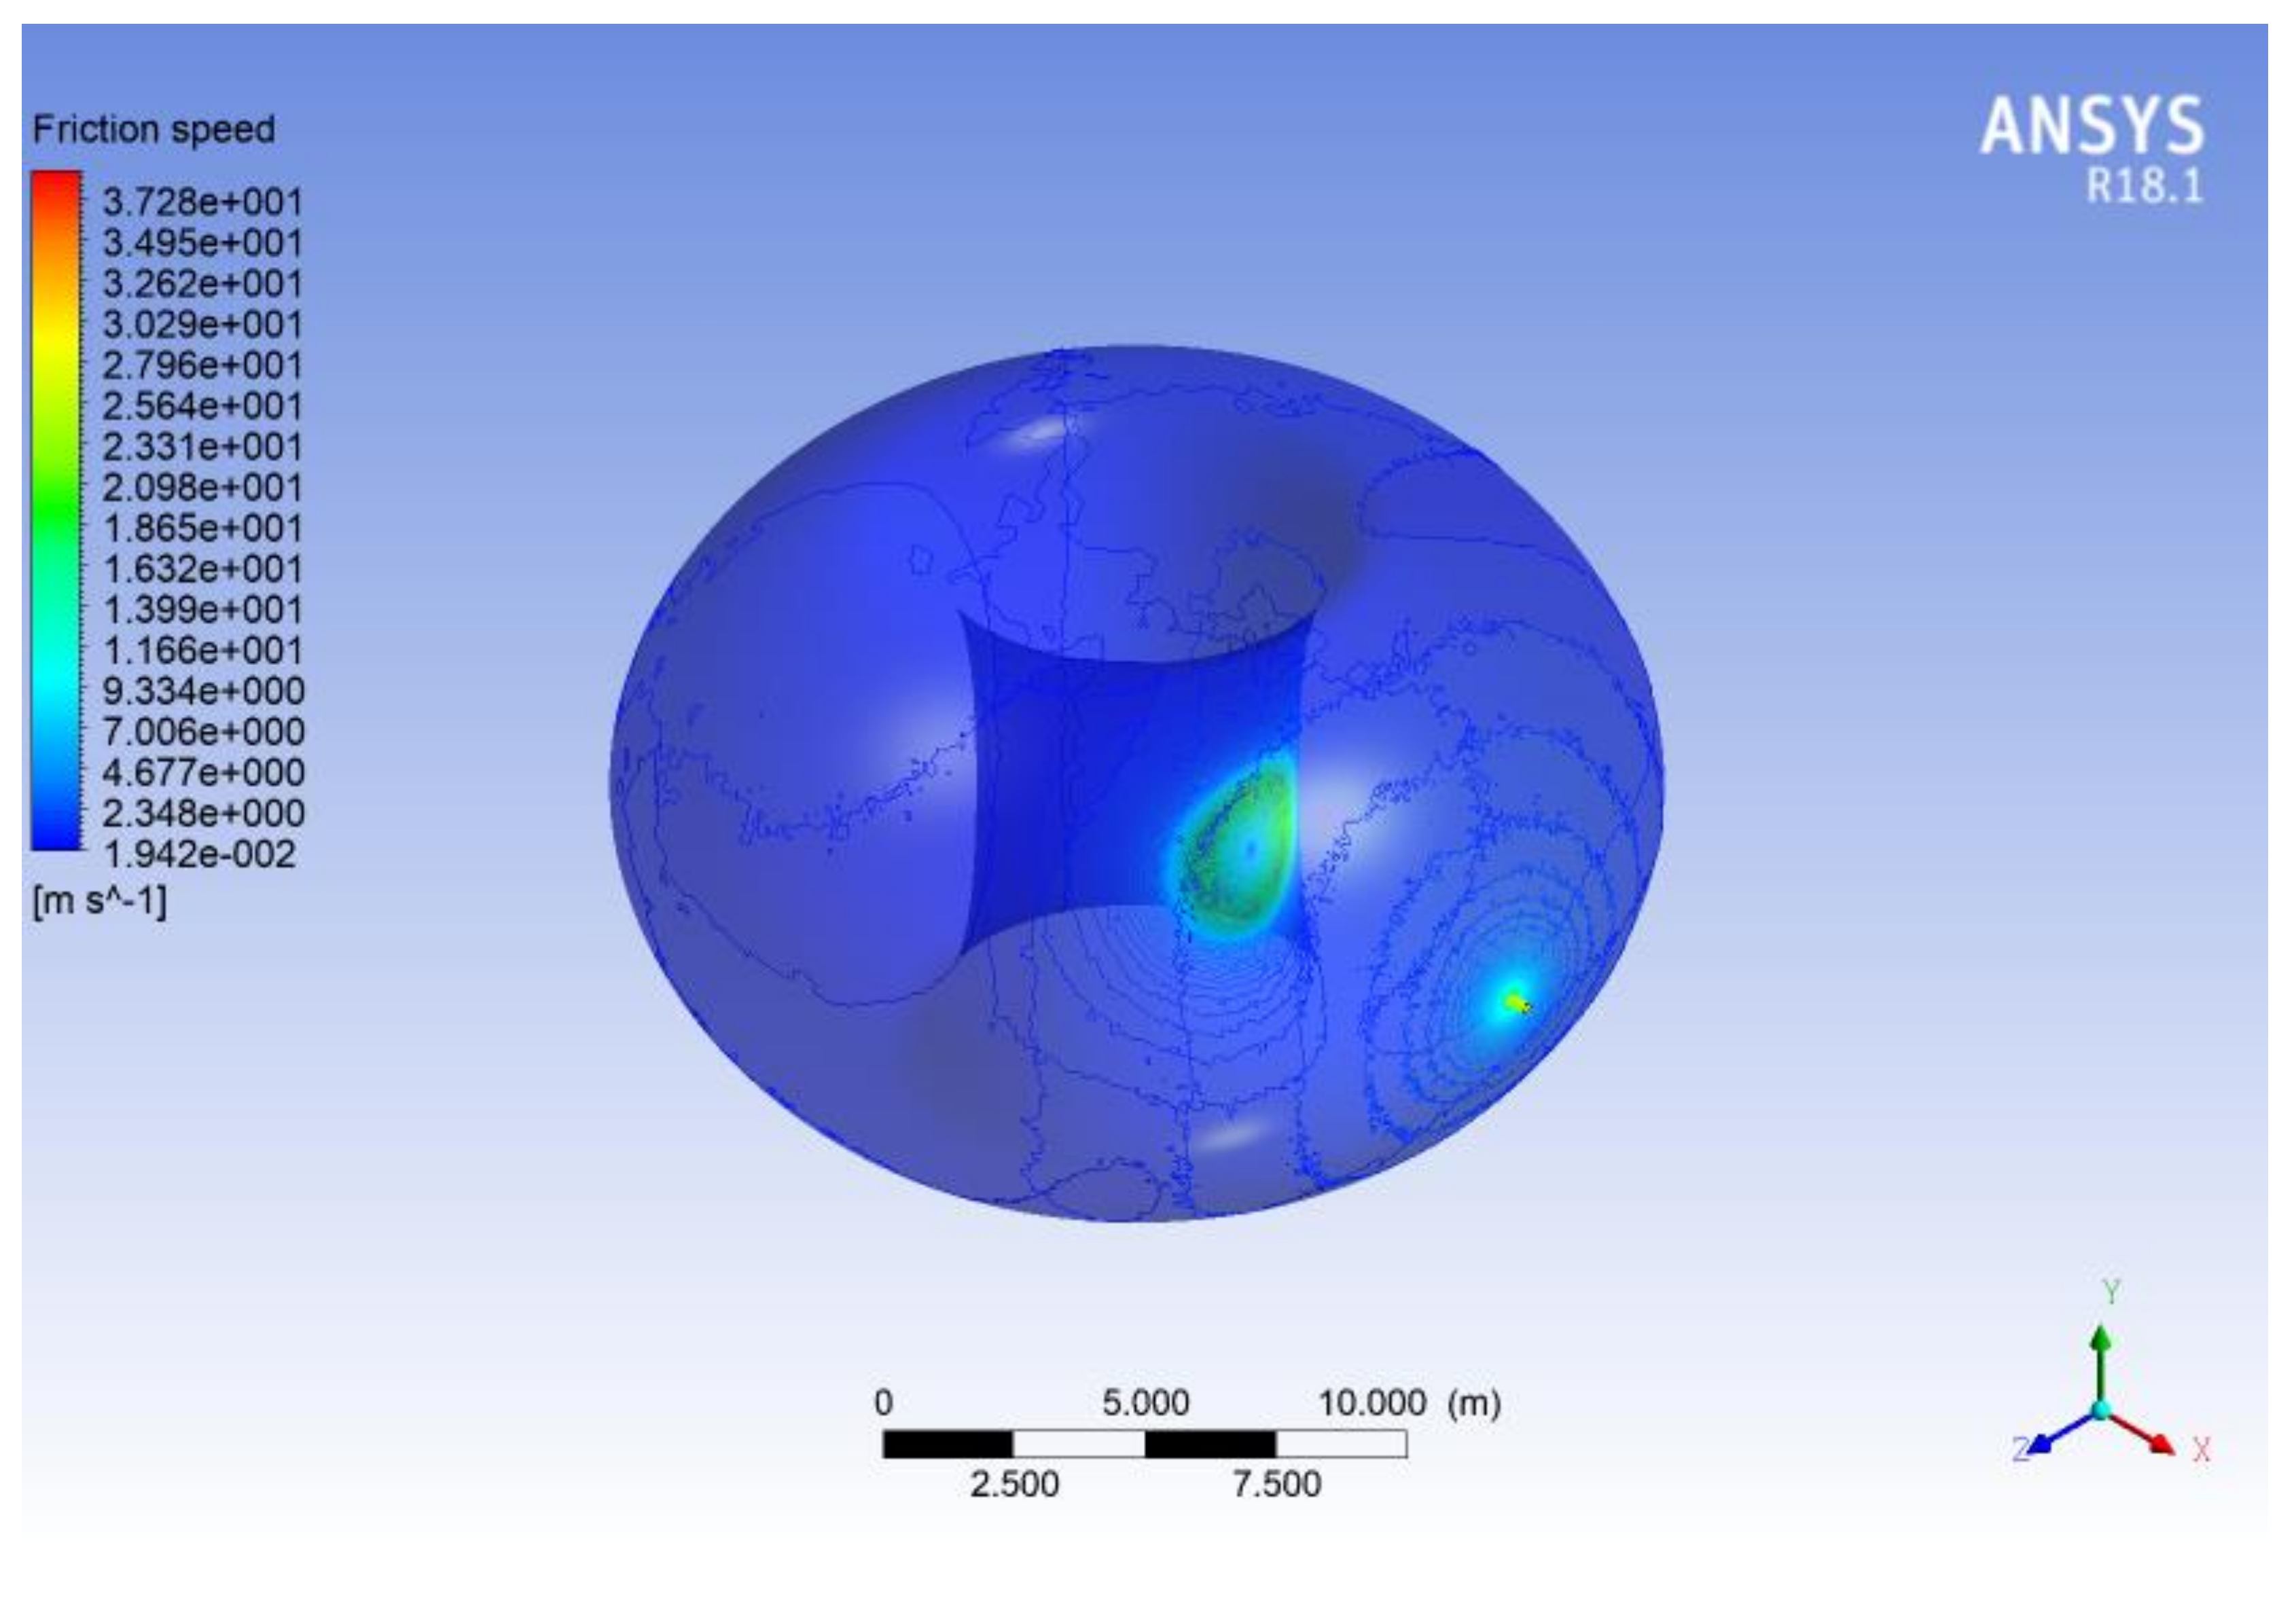
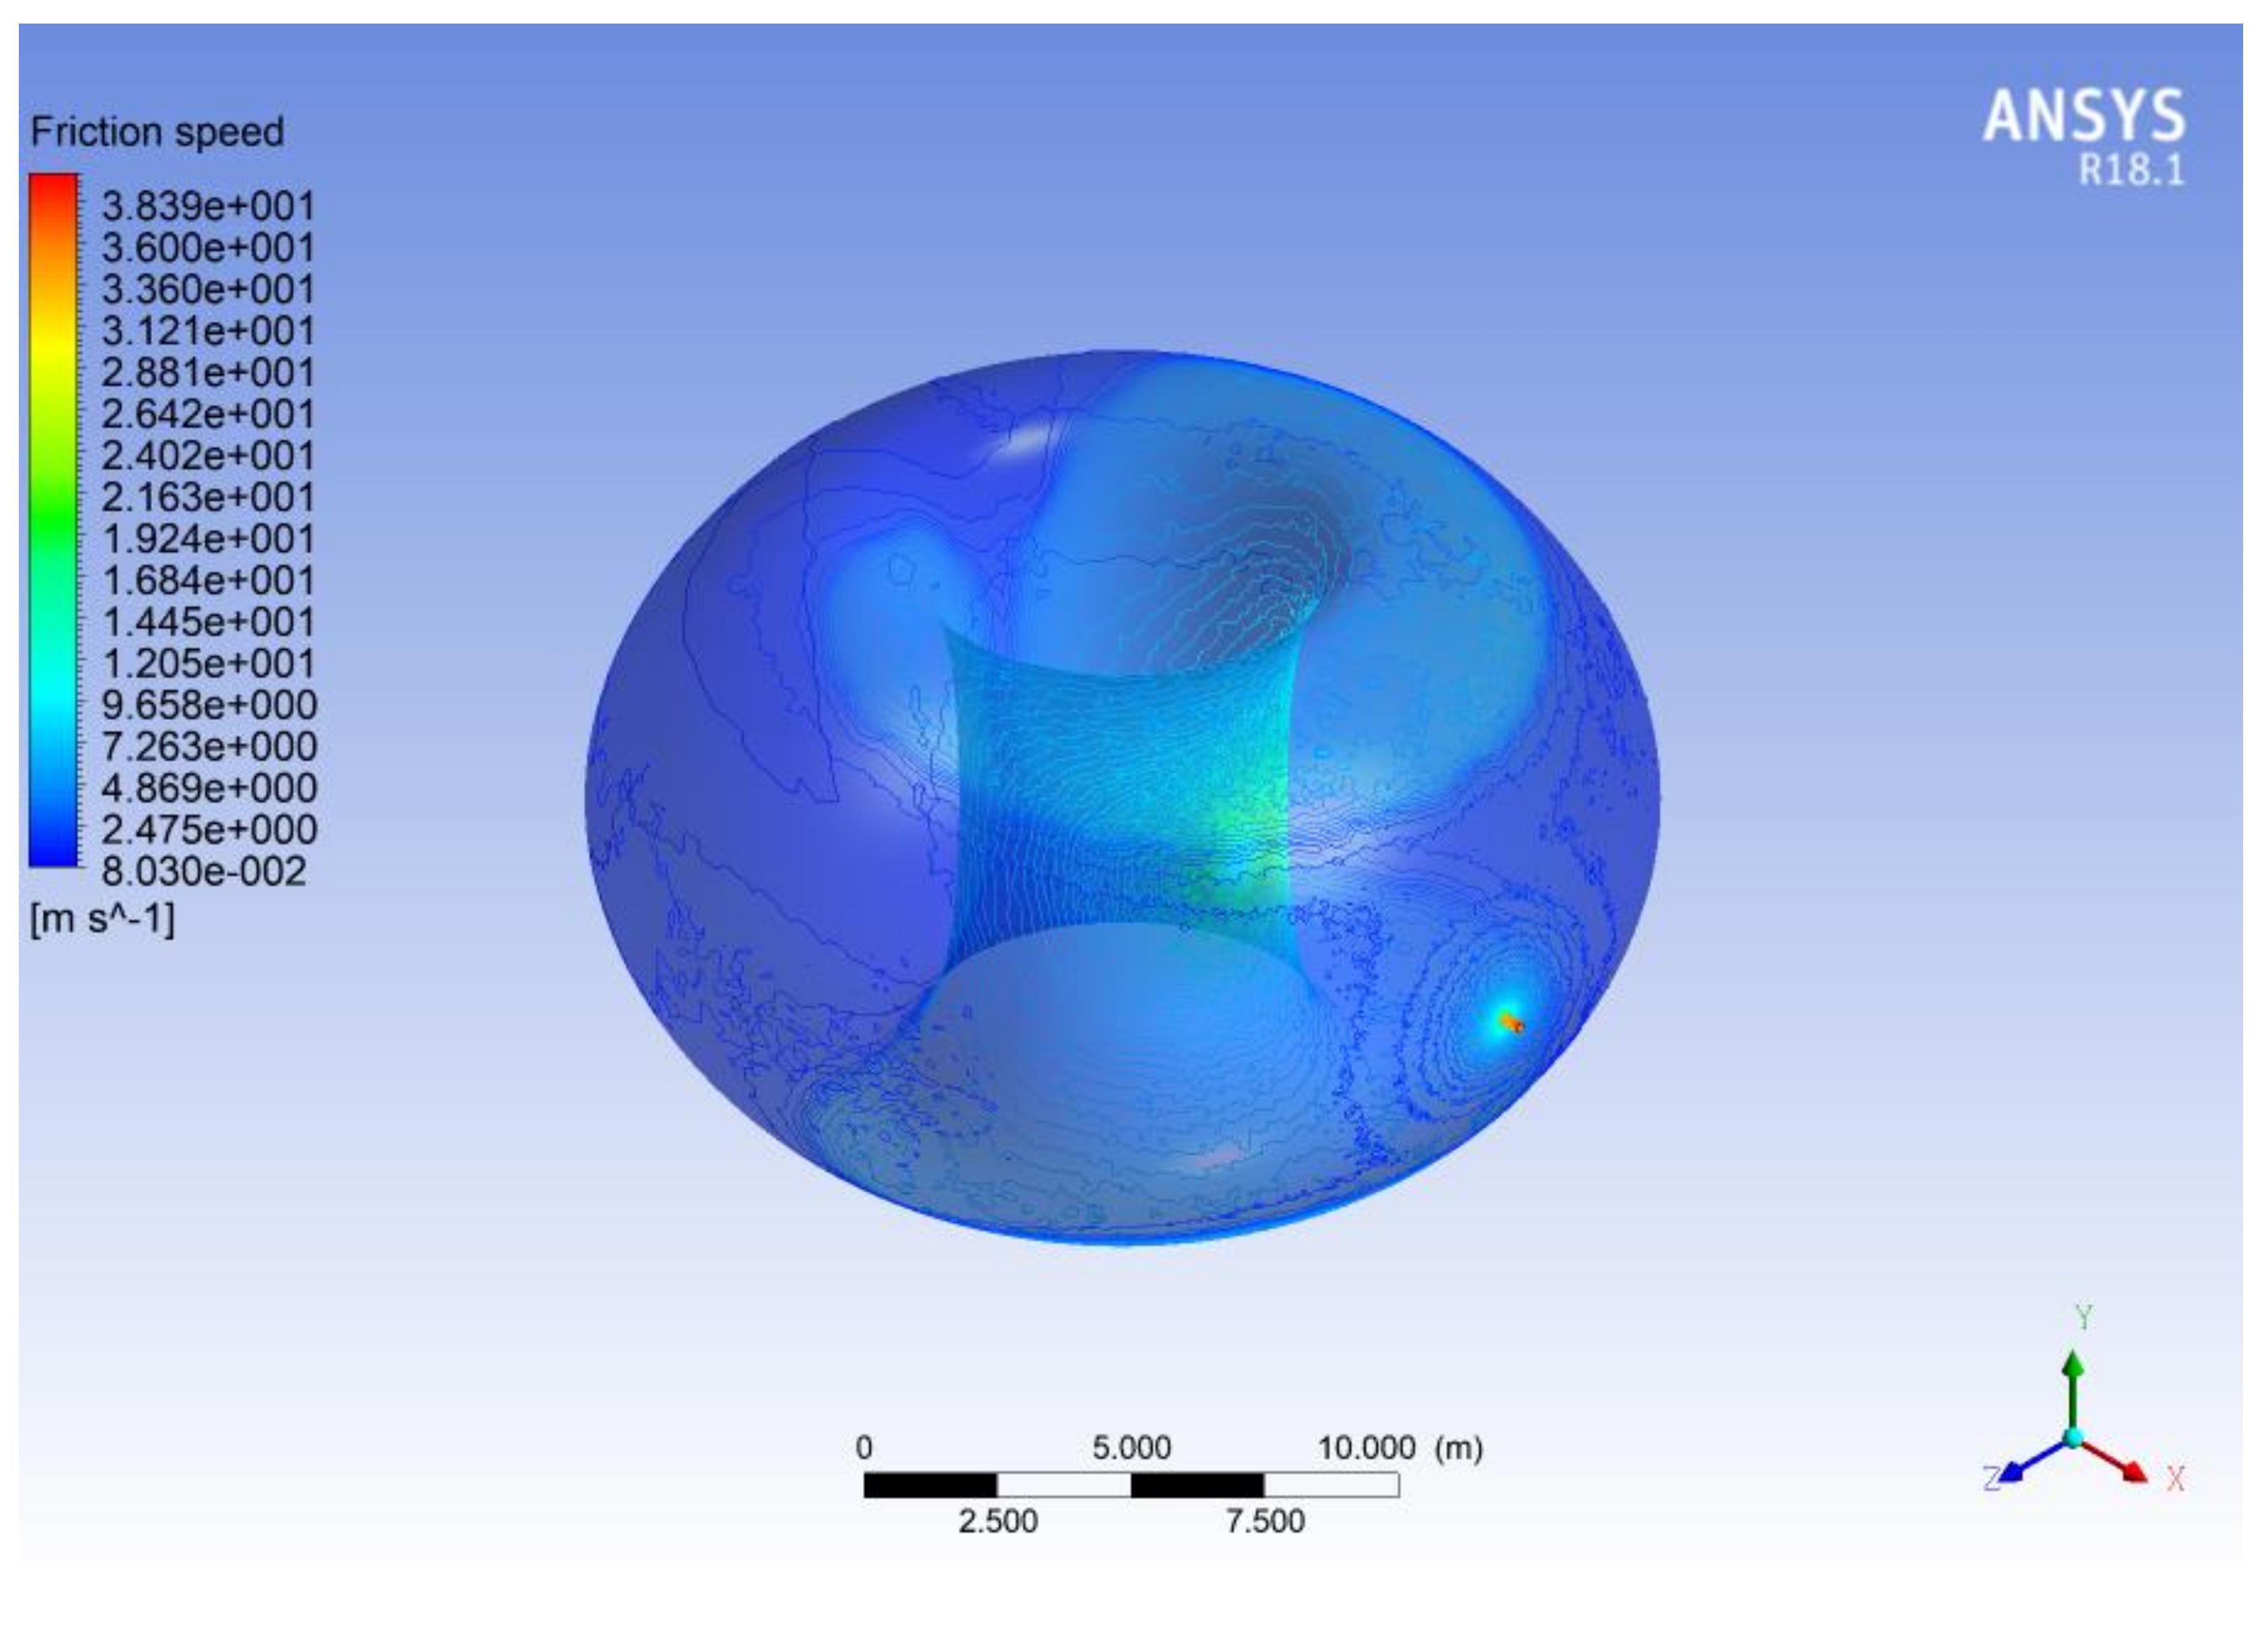
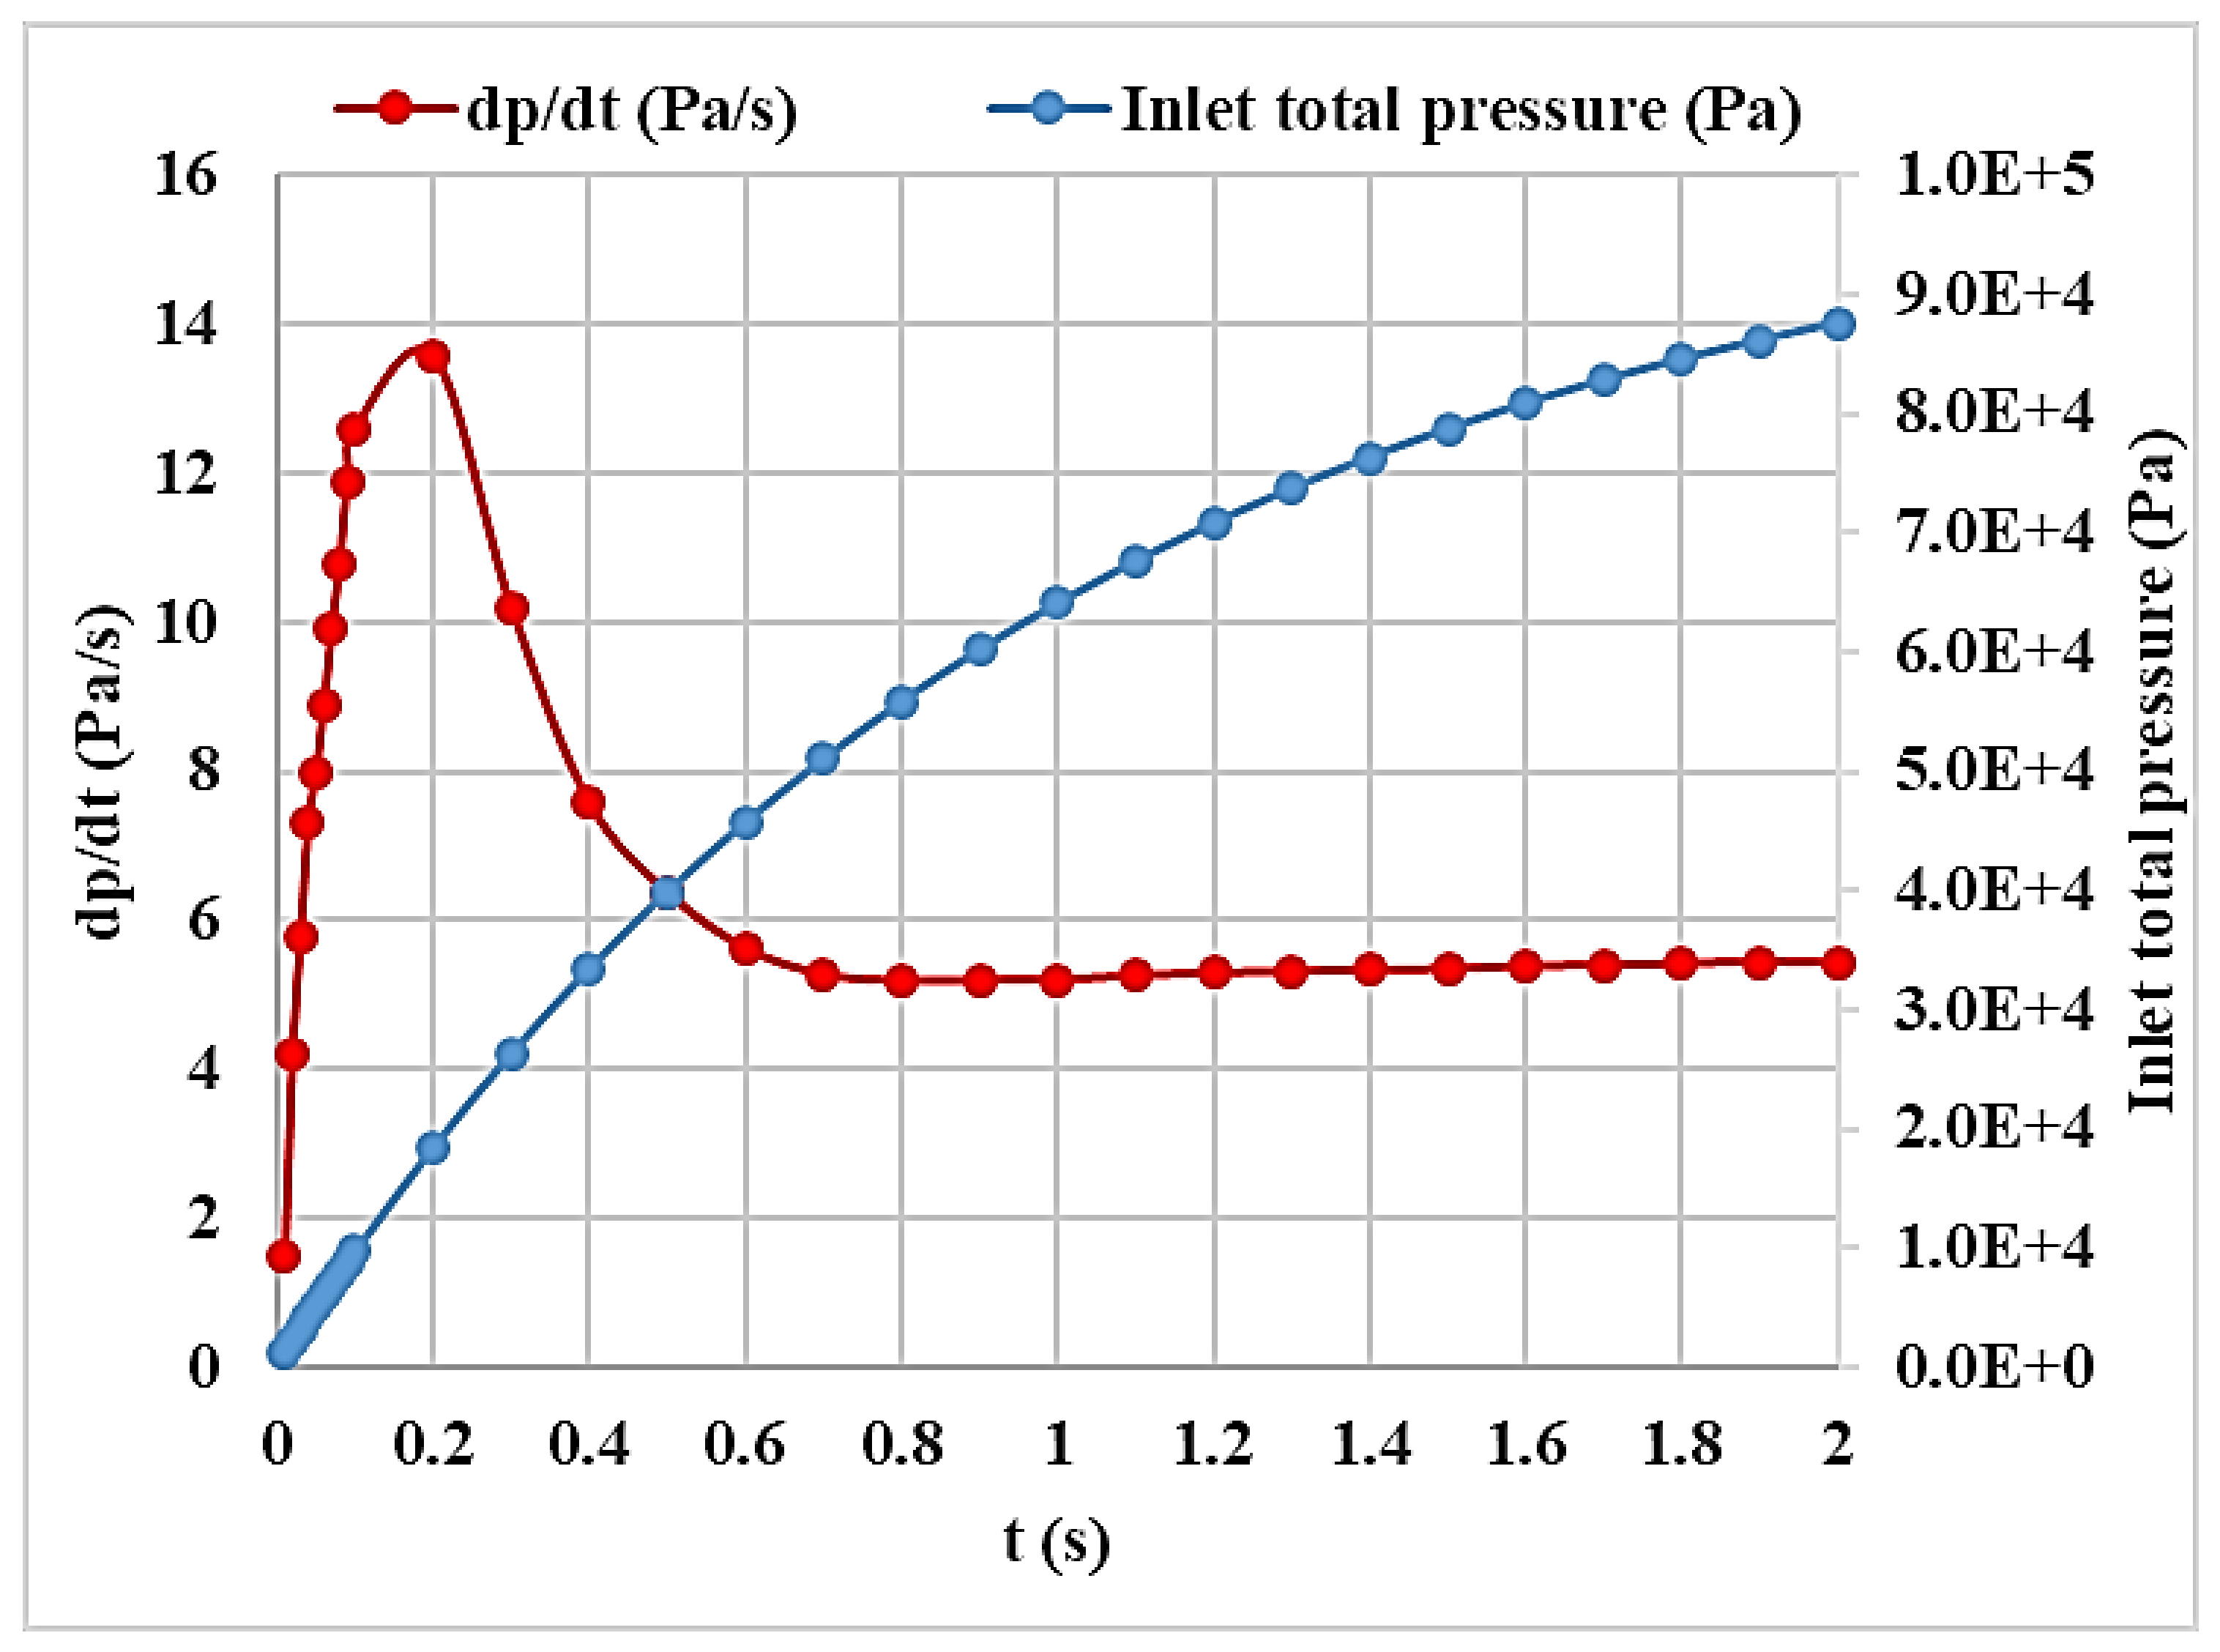
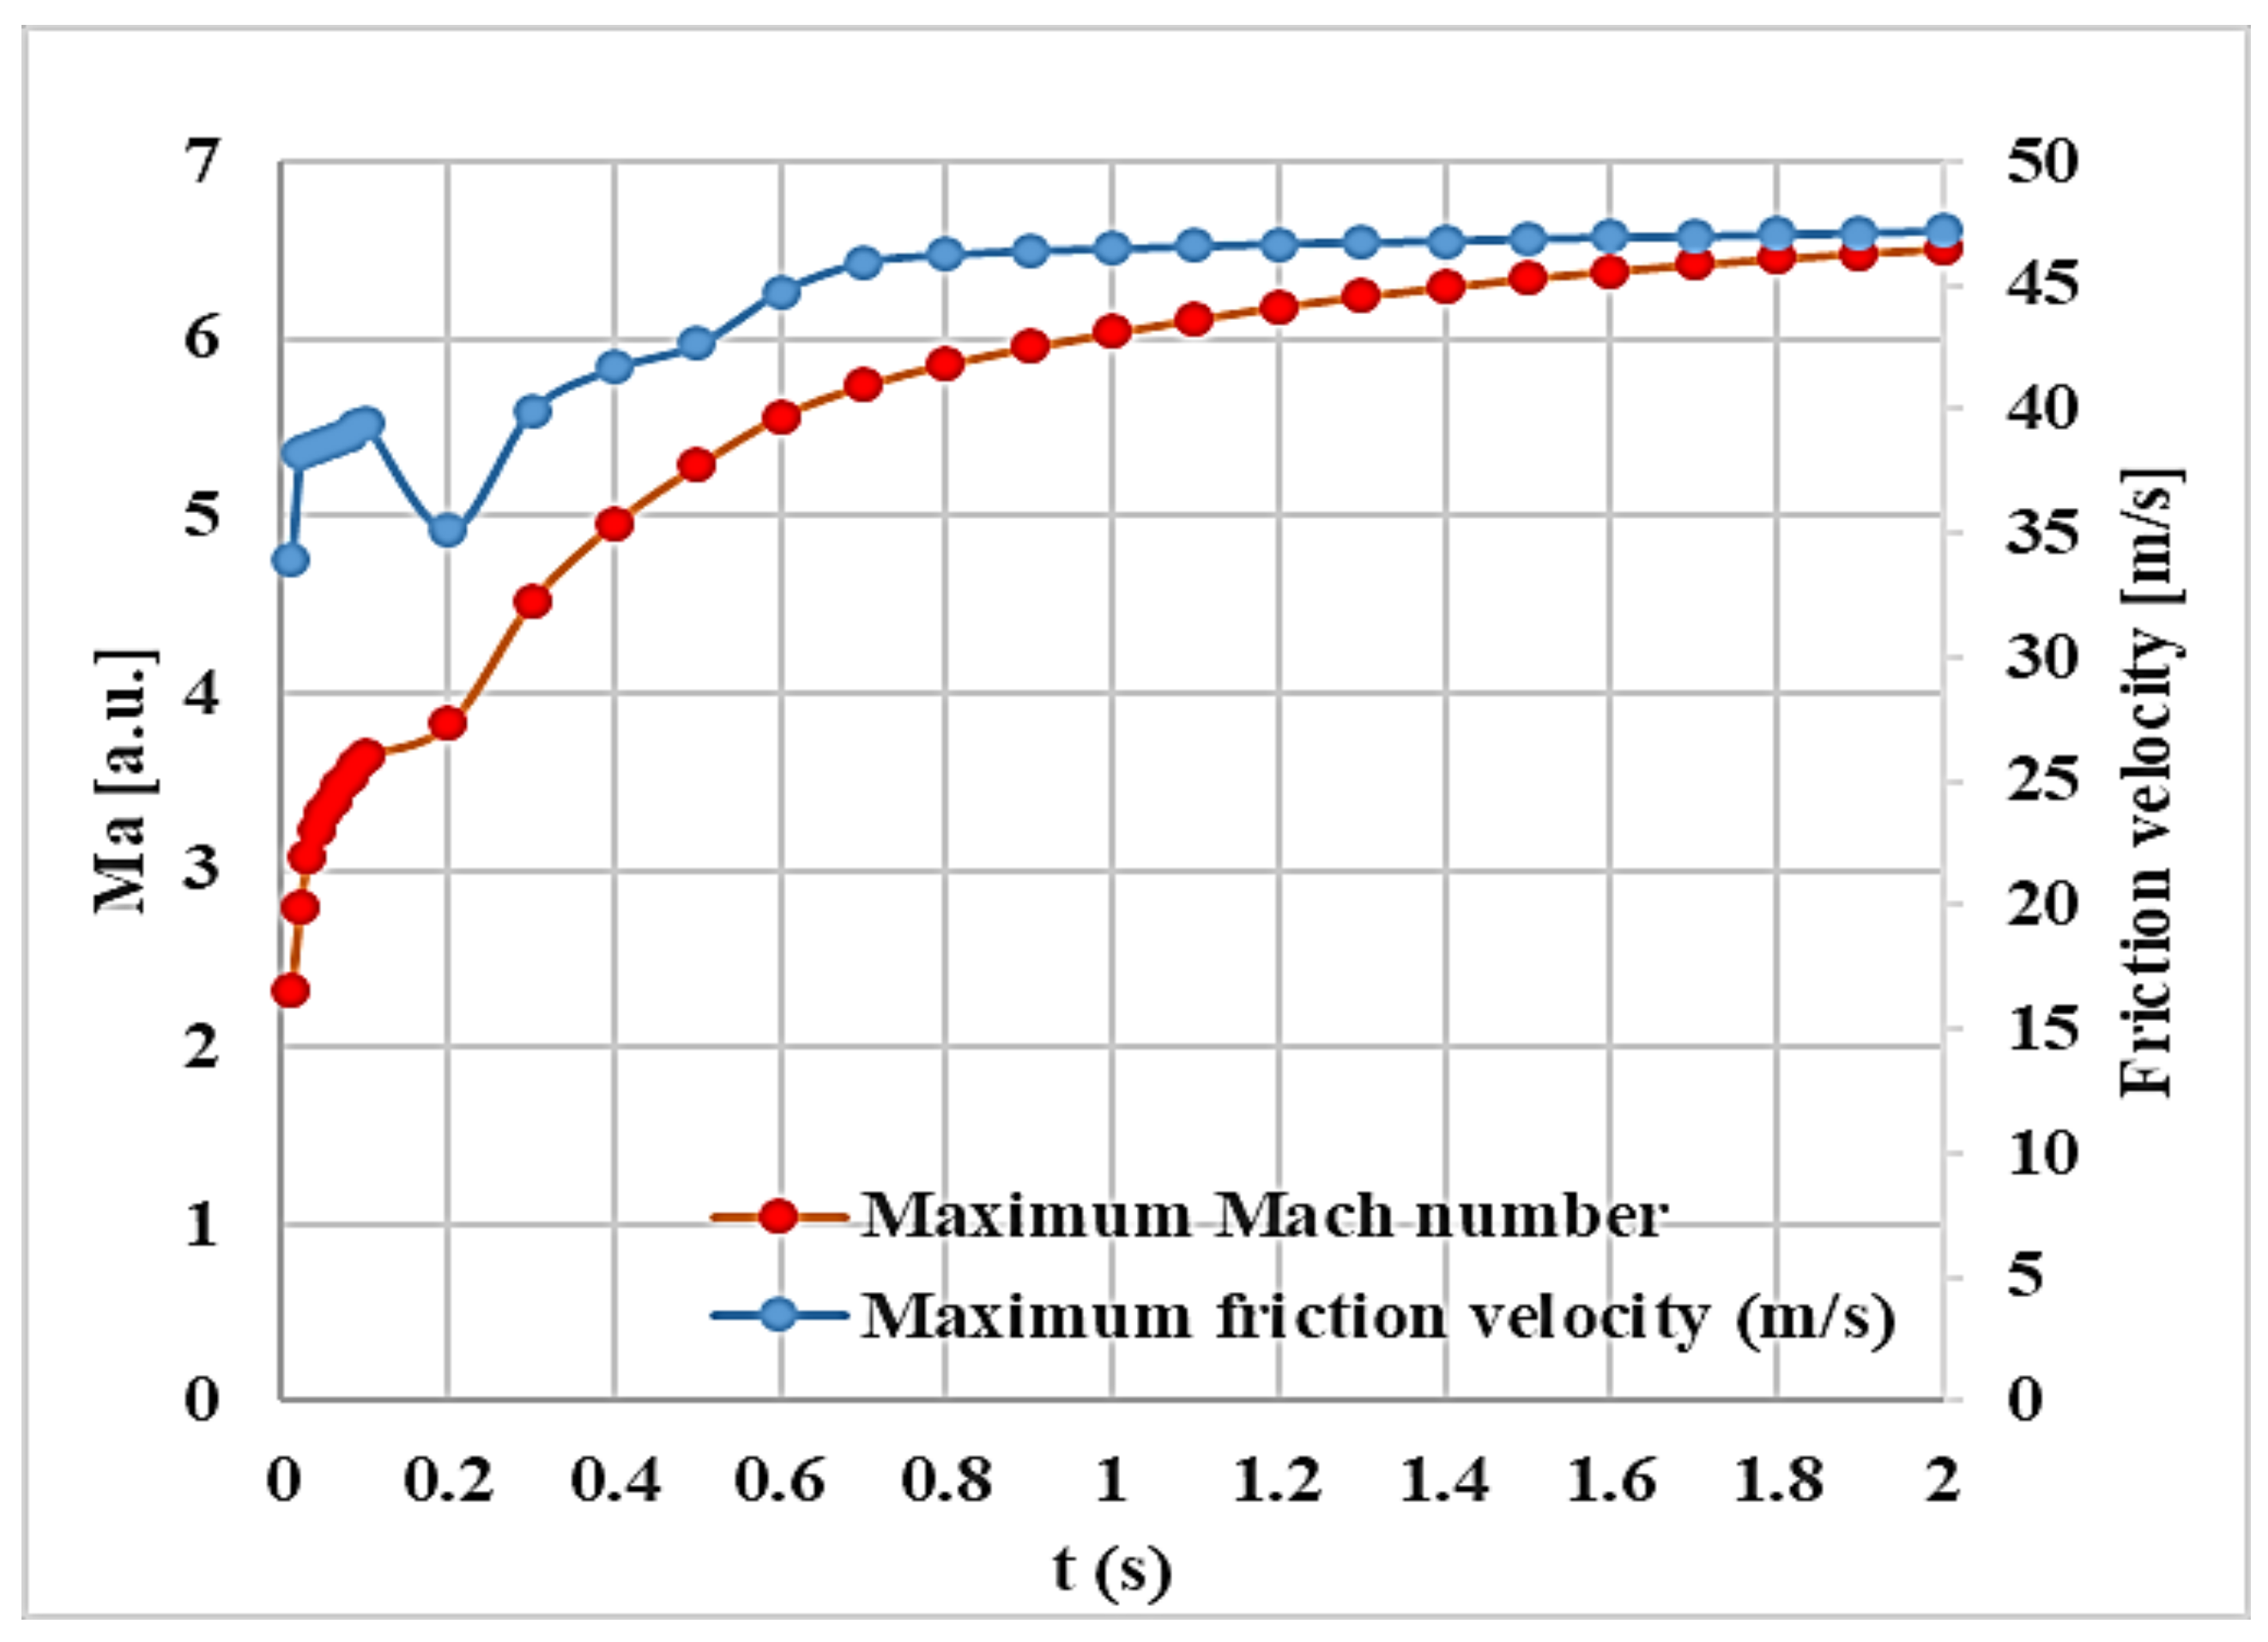
3.1. Mach Number, Static Pressure, and Velocity Friction Fields

The results are described referring to the Supplementary Material, which are compounded by five videos that show the Mach number, the static pressure, and the friction velocity. The time interval between each frame is 0.01 s. The Mach number is shown in the Video S1 (xy plane) and Video S2 (xz plane), the static pressure along the plane xy is the Video S3, while the plane xz is the Video S4. The friction velocity is shown in Video S5. Only the more significant frames of these videos are shown in the paper.
At 0.01 s of the beginning, due to the very high expansion ratio, the incoming air accelerates in the duct sonically and then supersonically in the vacuum vessel: a high Mach number flow bubble is observed just at the exit of the penetration line. Then, the jet slows down due to friction with the surrounding air at rest (Figure 3).
The duct is pressurised with respect to the vessel, and a shock wave, which separates the jet from air at rest in the Tokamak starts to propagate inside it (Figure 4). The friction velocity is very high in the duct, due to the high speed, but also on the walls in the surroundings of the connection between the penetration line and vessel (Figure 5). An increase in the Mach number and pressure inside the duct is observed with the increase of time. At 0.02 s, the flow is slightly supersonic already inside the duct, because of the pressure increase at the inlet and the subsequent propagation downstream of the disturbance: the flow accelerates up to supersonic speed in the duct and continues its expansion inside the vessel.
The jet has travelled for approximately one-third of the distance between the duct connection to the vessel and the opposite wall. A low-pressure zone (about 60 Pa, less than the initial value of it) is observed in the region where the jet expands, while a recompression bubble forms downstream the jet. What is seen is that the incoming air forms an over expanded jet, which is subsequently recompressed. A bubble of air at pressure higher than that of the rest of the vessel forms and precedes the propagation of the jet. The friction speed increases as the jet is getting faster, and the surface of the walls that are exposed to the movement of the air gets bigger.
After only 0.03 s, the jet reaches the middle of the space between the duct-vessel connection and the opposite wall, while the high-pressure bubble touches it. The zone where the friction velocity is high gets larger and larger.
After 0.04 s, the jet has almost reached the wall, as well as the recompression bubble. The region where the friction speed is high continues to enlarge, as the jet expands and fills the vacuum vessel. It can be noticed that its maximum value does not differ appreciably from the one at 0.02 s and 0.03 s.
At 0.05 s, the recompression bubble, which precedes the front of the jet, has reached the wall (Figure 6). The jet has, in the region just downstream of the connection between the duct and the vessel, and just before the recompression bubble, a lower pressure than that in the undisturbed part of the Tokamak (100 Pa): overexpansion still occurs. As shown by the contour lines, the flow is reaching the rear part of the Tokamak, but the highest values of the friction speed are still in the duct and in the region of the connection between it and the vessel, due to the high speed of the flow. It can also be noticed that a high friction speed zone on the part of the wall where the jet impingement occurs appears: this means that after 0.05 s, appreciable resuspension on that part of the internal blanket has to be expected.
The front of the jet has reached the wall and a stagnation point forms at 0.06 s. In the Mach field, a slight asymmetry of the flow is noticed: the stream of air deviates in the y-positive direction when the jet comes into contact with the wall. This instability is due to the fact that the jet is getting compressed in its frontal zone, so it tends to deviate and to divide into non-perfectly identical streams, although all of the initial and boundary conditions are symmetrical. An increase of pressure is noticed around the stagnation point and the overexpansion zone at the front of the jet is squeezing because the jet tends to move forward while the wall blocks it.
At 0.07 s, the jet breaks into two streams on the xz plane. An acceleration of it occurs just after the stagnation point, as there is room for the jet to move and continue expanding. As the jet impinges the wall, the frontal overexpansion region breaks on the xz plane and moves downstream: the two jets that are resulting from the division of the incoming original stream accelerate, as seen in Figure 7, and therefore the pressure drops under the one of the air at rest. Figure 8 shows how greatly the high friction speed zone has grown on the wall. Due to the impingement of the high-speed jet and of the two streams that form after the impact on the wall, shear stresses are very high and affect a large part of the walls.
At 0.08 s, there is an increase of the Mach number, due to the rise of the total pressure at the inlet and therefore of the expansion ratio, the displacement downstream on the xz plane of the acceleration (and low speed zones) and the enlargement of the high friction speed region around the impingement point.
The frames at 0.09 s show the same trends for all of the properties mentioned above. The friction speed pattern shows low values around the stagnation point, because the speed is low, then a steep increase due to the acceleration of the flow, and finally a fast decrease to very low values as the flow is supersonic and has not reached yet all of the points of the vacuum vessel.
The same trends are confirmed also at 0.1 s: a deeper penetration of the jet inside the vacuum chamber, an acceleration of the flow due to the high expansion ratio and an enlargement of the high friction speed zone.
After 0.2 s, it can be seen that the flow inside the duct is highly supersonic (roughly Mach 3) and that the flow is reaching the rear part of the vessel. The flow divides into two streams also on the xy plane and starts moving towards the duct-vessel connection: two toroidal counter-rotating vortices form at the margins of the jet and are filling the vessel.
The frames from 0.2 s to 2.0 s show a progressive increase of the Mach number inside the duct, as well as a deep penetration of the incoming air into the vacuum vessel. Instant by instant, a larger and larger surface of the walls is subject to interaction with the blowing flow, and therefore to friction (Figure 8 and Figure 9). The Mach number grows up to values up to 6, value for which the static temperature drops from 293.15 K (initial temperature in the vessel and total temperature at the inlet during all of the transient) to 36 K. Of course, when temperature gets so low, the real behaviour of the fluid deviates from the one of a perfect gas and condensation phenomena may occur. However, as these extreme values of the Mach number and temperature are reached only in a very small region (the duct), and that in the vessel the Mach number reaches maximum values of about 3, it can be said that the perfect gases state equation is valid on the overall domain, and, what is more important, inside the Tokamak, which is what this investigation is focused on.

3.2. Mach Number, Static Pressure, and Velocity Friction Fields

Figure 10 shows the time evolution of the mean pressurisation rate of the vessel and of the inlet total pressure. These parameters are evaluated as the weighted average pressure inside the Tokamak, where the weights are the element volumes.
As shown, the mean pressurisation rate reaches its maximum (about 14 Pa/s) after about 0.2 s, while the inlet total pressure rises continuously. At the beginning of the transient, the pressure and the density inside the vessel are very low, so the penetration of air at a higher and higher pressure produces a fast increase in their values. As the inlet pressure tends asymptotically to 1 atm, its slope decreases, and because the Tokamak is getting filled, its pressurisation rate decreases to 6 Pa/s. This effect also has consequences on the time evolution of maximum Mach number and maximum friction speed, as shown in Figure 11.
The drop of the pressurisation rate causes a reduction of the maximum Mach number slope, as well as a momentary diminution of the maximum friction speed. However, the general trend is an asymptotic increase of both quantities, at least for the initial seconds of the LOVA.

4. Conclusions

The development of a fusion device able to produce energy is one of the hardest technology challenges. At the moment, ITER is under construction and it will be the first Tokamak to have an energy gain factor higher than one. The Loss of Vacuum Accidents (LOVAs) are threatful events for these reactors, since radioactive and toxic dust may be resuspended, implying functioning and safety issues. Furthermore, the presence of metallic pyrophoric dust, as well as hydrogen, may cause, if a LOVA occurs and a hot spot is present inside the reactor, an explosion and a fire inside the plant. Of course, this risk depends on the concentration of flammable material that is inside the vessel, because the combustion can happen only in a certain range of mixture composition.
The fluid dynamics of these events has been experimentally and numerically investigated inside the scaled experimental facilities. The authors carried out, in old works [18,27,29,30,31], campaigns, where pressure, velocity, and temperature have been measured and analysed. Then, different numerical models have been developed to replicate properly LOVA events.
In this work, we used this model to replicate a LOVA inside an ITER-like geometry (same size and shape). The parameters that are showed and analysed in this work are the static pressure, the Mach number, and the friction velocity. The static pressure and the Mach number are useful variables to understand how the air moves inside the vessel and the pressurisation speed. The friction velocity is a parameter that can be directly correlated to the dust resuspension ratio, since it is related to the intensity of the shear stress on the wall.
The fluid dynamic analysis shows that the flow is highly supersonic, especially inside the duct and in the region near the junction between the vessel and the duct itself. Temperature is expected to drop in those zones below the one at which the behaviour of the fluid significantly differs from the one of a perfect gas. However, those regions are very small in comparison with the whole Tokamak. The jet reaches all of the regions of the Tokamaks very fast. The pressurisation rate is very slow: about 6 Pa/s after the initial part of the transient.
This implies a very long duration of the LOVA and so there is all the time to undertake measures to prevent consequences of this kind of accidents, such as the leakage of dust in the external environment. For example, security valves could be put on the penetration lines, which are the most possible routes of air entrance, in order to stop the incoming flow in case of a window breach.
Friction speed is very high on all walls blown by the jet and especially, in addition to the duct’s walls, on the one where the jet impinges. A fast and deep dust removal and mobilisation are expected there.
A remark about a simplifying assumption done in this work: there is no hot plasma in the vessel. So, the LOVA that is considered here occurs when the reactor is not running yet. This assumption may change the behaviour of the accidents and future analysis will be performed. It is expected that the jet impacting on the plasma, dilutes and cools it down. Then, the plasma returns to be a not ionized gas and the classical fluid dynamics laws again govern the event.
Another interesting study is about the replication of a LOVA considering the presence of dust inside the vessel and therefore using a multiphase model. However, before that, the experimental campaign must be led in order to find and validate a multiphase model for these events.

Supplementary Materials

The following are available online at https://www.mdpi.com/1996-1073/11/4/856/s1, Video S1: Mach number–xy, Video S2: Mach number–xz, Video S3: Pressure–xy, Video S4: Pressure–xz, Video S5: Friction speed.

Author Contributions

Jean-François Ciparisse and Riccardo Rossi set up the simulation and analysed the results. Andrea Malizia and Pasquale Gaudio gave as a starting point of the work the data collected previously during the experimental campaign with STARDUST-U and supervised the work.

Conflicts of Interest

The authors declare no conflict of interest.

References

  1. ITER—The Way to New Energy. Available online: https://www.iter.org/ (accessed on 16 March 2018).
  2. Romanelli, F.; Barabaschi, P.; Borba, D.; Federici, G.; Horton, L.; Neu, R.; Stork, D.; Zohm, H. Fusion electricity: A roadmap to the realization of fusion energy. In Proceedings of the European Energy Conference, Budapest, Hungary, 27–30 Septmber 2013; p. 36. [Google Scholar]
  3. Bigot, B. ITER: A unique international collaboration to harness the power of the stars. C. R. Phys. 2017, 18, 367–371. [Google Scholar] [CrossRef]
  4. Rondeau, A.; Peillon, S.; Roynette, A.; Sabroux, J.-C.; Gelain, T.; Gensdarmes, F.; Rohde, V.; Grisolia, C.; Chassefière, E. Characterization of dust particles produced in an all-tungsten wall tokamak and potentially mobilized by airflow. J. Nucl. Mater. 2015, 463, 873–876. [Google Scholar] [CrossRef]
  5. Loarte, A.; Lipschultz, B.; Kukushkin, A.S.; Matthews, G.F.; Stangeby, P.C.; Asakura, N.; Counsell, G.F.; Federici, G.; Kallenbach, A.; Krieger, K.; et al. Chapter 4: Power and Particle Control. Nucl. Fusion 2007, 47, S203. [Google Scholar] [CrossRef]
  6. Stork, D.; Agostini, P.; Boutard, J.L.; Diegele, E.; Dudarev, S.L.; English, C.; Federici, G.; Gilbert, M.R.; Gonzalez, S.; Ibarra, A.; et al. Materials R&D for a timely DEMO: Key findings and recommendations ofthe EU Roadmap Materials Assessment Group. Fusion Eng. Des. 2014, 89, 1586–1594. [Google Scholar]
  7. Maisonnier, D.; Campbell, D.; Cook, I.; di Pace, L.; Giancarli, L.; Hayward, J.; Puma, A.L.; Medrano, M.; Norajitra, P.; Roccella, M.; et al. Power plant conceptual studies in Europe. Nucl. Fusion 2007, 47, 1524–1532. [Google Scholar] [CrossRef]
  8. Rieth, M.; Dudarev, S.L.; Gonzalez de Vicente, S.M.; Aktaa, J.; Ahlgren, T.; Antusch, S.; Armstrong, D.E.J.; Balden, M.; Baluc, N.; Barthe, M.-F.; et al. Recent progress in research on tungsten materials for nuclear fusion. J. Nucl. Mater. 2013, 432, 482–500. [Google Scholar] [CrossRef]
  9. Rieth, M.; Dudarev, S.L.; Gonzalez de Vicente, S.M.; Aktaa, J.; Ahlgren, T.; Antusch, S.; Armstrong, D.E.J.; Balden, M.; Baluc, N.; Barthe, M.-F.; et al. A brief summary of the progress on the EFDA tungsten materials. J. Nucl. Mater. 2013, 442, S173–S180. [Google Scholar] [CrossRef]
  10. Rieth, M.; Boutard, J.L.; Dudarev, S.L.; Ahlgren, T.; Antusch, S.; Baluc, N.; Barthe, M.-F.; Becquart, C.S.; Ciupinski, L.; Correia, J.B.; et al. Review on the EFDA programme on tungsten materials technology and science. J. Nucl. Mater. 2011, 417, 463–467. [Google Scholar] [CrossRef]
  11. López-Ruiz, P.; Ordás, N.; Iturriza, I.; Koch, F.; García-Rosales, C. Powder metallurgical processing of self-passivating tungsten alloys for fusion first wall application. J. Nucl. Mater. 2013, 442, S219–S224. [Google Scholar] [CrossRef]
  12. Longhurst, G.R.; Snead, L.L.; Abou-Sena, A.A. The status of beryllium research for fusion in the United States. In Proceedings of the 6th IEA International Workshop on Beryllium Technology for Fusion, Miyazaki, Japan, 2–5 December 2003. [Google Scholar]
  13. Bloom, E.E. The challenge of developing structural materials for fusion power systems. J. Nucl. Mater. 1998, 258–263, 7–17. [Google Scholar] [CrossRef]
  14. Ehrlich, K.; Bloom, E.E.; Kondo, T. International strategy for fusion materials development. J. Nucl. Mater. 2001, 283–287, 79–88. [Google Scholar] [CrossRef]
  15. Zinkle, S.J.; Victoria, M.; Abe, K. Scientific and engineering advances from fusion materials R&D. J. Nucl. Mater. 2002, 307–311, 31–42. [Google Scholar]
  16. Bloom, E.E.; Conn, R.W.; Davis, J.W.; Gold, R.E.; Little, R.; Schultz, K.R.; Smith, D.L.; Wiffen, F.W. Low Activation Materials for Fusion Applications. J. Nucl. Mater. 1984, 122, 17–26. [Google Scholar] [CrossRef]
  17. Federici, G.; Skinner, C.H.; Brooks, J.N.; Coad, J.P.; Grisolia, C.; Haasz, A.A.; Hassanein, A.; Philipps, V.; Pitcher, C.S.; Roth, J.; et al. Plasma-material Interactions in current tokamaks and their implications for next step fusion reactors. Nucl. Fusion 2001, 41. [Google Scholar] [CrossRef]
  18. Malizia, A.; Poggi, L.A.; Ciparisse, J.-F.; Talebzadeh, S.; Gelfusa, M.; Murari, A.; Gaudio, P. Plasma-material interactions problems and dust creation and re-suspension in case of accidents in nuclear fusion plants: A new challenge for reactors like ITER and DEMO. In Advanced Surface Engineering Materials; John Wiley & Sons: Hoboken, NJ, USA, 2016. [Google Scholar]
  19. Gilliam, S.; Gidcumb, S.; Parikh, N.; Forsythe, D.; Patnaik, B.; Hunn, J.; Snead, L.; Lamaze, G. Retention and surface blistering of helium irradiated tungsten as a first wall material. J. Nucl. Mater. 2005, 347, 289–297. [Google Scholar] [CrossRef]
  20. Fukumoto, M.; Ohtsuka, Y.; Ueda, Y.; Taniguchi, M.; Kashiwagi, M.; Inoue, T.; Sakamoto, K. Blister formation on tungsten damaged by high energy particle irradiation. J. Nucl. Mater. 2008, 375, 224–228. [Google Scholar] [CrossRef]
  21. Tokitani, M.; Kajita, S.; Masuzaki, S.; Hirahata, Y.; Ohno, N.; Tanabe, T.; Group, L.E. Exfoliation of the tungsten fibreform nanostructure by unipolar arcing in the LHD divertor plasma. Nucl. Fusion 2001, 51. [Google Scholar] [CrossRef]
  22. Sharpe, J.; Petti, D.; Bartels, H. A review of dust in fusion devices: Implications for safety and operational performance. Fusion Eng. Des. 2002, 63–64, 153–163. [Google Scholar] [CrossRef]
  23. Novokhatsky, A.; Gorodetsky, V.; Gusev, A.; Zakharov, R. Zalavutdinov, Structure and chemical composition of magnetic dust formed in Globus-M Tokamak. In Proceedings of the 38th EPS Conference on Plasma Physics, Strasbourg, France, 27 June–1 July 2011. [Google Scholar]
  24. McCarthy, K.; Petti, D.; Carmack, W.; Smolik, G. The safety implications of tokamak dust size and surface area. Fusion Eng. Des. 1998, 42, 45–52. [Google Scholar] [CrossRef]
  25. Orlinskij, D.V.; Magyar, G. Plasma diagnostics on large tokamaks. Nucl. Fusion 1988, 28, 611–697. [Google Scholar] [CrossRef]
  26. Nie, M.; Ni, M.; Wei, S. Individual dose due to radioactivity accidental release from fusion reactor. J. Hazard. Mater. 2017, 327, 135–143. [Google Scholar] [CrossRef] [PubMed]
  27. Malizia, A.; Poggi, L.A.; Ciparisse, J.-F.; Rossi, R.; Bellecci, C.; Gaudio, P. A Review of Dangerous Dust in Fusion Reactors: From Its Creation to Its Resuspension in Case of LOCA and LOVA. Energies 2016, 9, 578. [Google Scholar] [CrossRef] [Green Version]
  28. Honda, T.; Bartels, H.-W.; Merrill, B.; Inabe, T.; Petti, D.; Moore, R.; Okazaki, T. Analyses of loss of vacuum accident (LOVA) in ITER. Fusion Eng. Des. 2000, 45, 361–375. [Google Scholar] [CrossRef]
  29. Rossi, R.; Gaudio, P.; Ciparisse, J.F.; Poggi, L.A.; Malizia, A. Imaging of dust re-suspension in case of LOVA. Fusion Eng. Des. 2018, 126, 156–169. [Google Scholar] [CrossRef]
  30. Malizia, A.; Camplani, M.; Gelfusa, M.; Lupelli, I.; Richetta, M.; Antonelli, L.; Conetta, F.; Scarpellini, D.; Carestia, M.; Peluso, E.; et al. Dust tracking techniques applied to the STARDUST facility: First results. Fusion Eng. Des. 2015, 89, 2098–2102. [Google Scholar] [CrossRef]
  31. Ciparisse, J.; Malizia, A.; Poggi, L.; Gelfusa, M.; Murari, A.; Mancini, A.; Gaudio, P. First 3D numerical simulations validated with experimental measurements during a LOVA reproduction inside the new facility STARDUST-Upgrade. Fusion Eng. Des. 2015, 101, 204–208. [Google Scholar] [CrossRef]
  32. Ciparisse, J.-F.; Malizia, A.; Poggi, L.; Cenciarelli, O.; Gelfusa, M.; Carestia, M.; DiGiovanni, D.; Mancinelli, S.; Palombi, L.; Bellecci, C.; et al. Numerical Simulations as Tool to Predict Chemical and Radiological Hazardous Diffusion in Case of Nonconventional Events. Model. Simul. Eng. 2016. [Google Scholar] [CrossRef]
  33. Shao, Y.; Klose, M. A note on the stochastic nature of particle cohesive force and implications to threshold friction velocity for aerodynamic dust entrainment. Aeolian Res. 2016, 22, 123–125. [Google Scholar] [CrossRef]
  34. Shao, Y.; Lu, H. A simple expression for wind erosion threshold friction velocity. J. Geophys. Res. 2000, 105, 22437–22443. [Google Scholar] [CrossRef]
  35. Chkhetiani, G.; Gledzer, E.B.; Artamonova, M.S.; Iordanskii, M.A. Dust resuspension under weak wind conditions: Direct observations and model. Atmos. Chem. Phys. 2012, 12, 5147–5162. [Google Scholar] [CrossRef] [Green Version]
  36. Zhanf, F.; Reeks, M.; Kssane, M.P. Particle Resuspension in Turbulent Boundary Layers and the Influence of Non-Gaussian Removal Forces. J. Aerosol Sci. 2013, 58, 103–128. [Google Scholar]
  37. ITER. Available online: https://en.wikipedia.org/wiki/ITER (accessed on 16 March 2018).
  38. International Thermonuclear Experimental Reactor (ITER). Generic Site Safety Report (GSSR)—Volume VII, Analysis of Reference Events; Report No. G 84 RI 6 01-07-10 R 1.0. 10.; ITER: Cadarache, France, 2010. [Google Scholar]
Figure 1. International Thermonuclear Experimental Reactor (ITER) reactor section [37].
Energies 11 00856 g001
Figure 2. Domain geometry, inlet valve and planes of analyses (zx and xy).
Energies 11 00856 g002
Figure 3. Mach number field on the xy plane (top) and xz plane (bottom) at 1 × 10⁻² s.
Energies 11 00856 g003
Figure 4. Static pressure on the xy plane (top) and xz plane (bottom) at 1 × 10⁻² s.
Energies 11 00856 g004
Figure 5. Friction velocity over the tokamak surface at 1 × 10⁻² s.
Energies 11 00856 g005
Figure 6. Static pressure on the xz plane at 5 × 10⁻² s.
Energies 11 00856 g006
Figure 7. Mach number on the xy plane (top) and zx plane (bottom) at 7 × 10⁻² s.
Energies 11 00856 g007
Figure 8. Friction speed at 7 × 10⁻² s.
Energies 11 00856 g008
Figure 9. Friction speed at 3 × 10⁻² s.
Energies 11 00856 g009
Figure 10. Mean pressurisation rate and inlet total pressure versus time.
Energies 11 00856 g010
Figure 11. Time evolution of maximum Mach number and maximum friction speed.
Energies 11 00856 g011
Table 1. k ϵ model constants.
C μ C ϵ 1 C ϵ 2 σ k σ ϵ
0.091.441.9211.3
Table 2. Sutherland’s laws coefficients.
μ r e f   ( P a · s ) T μ , r e f   ( K ) S μ   ( K ) λ r e f   ( W / ( m · K ) ) T λ , r e f   ( K ) S λ   ( K )
1.716 × 10-5273.151110.0241273.15194

