Abstract
Composite insulators are widely used in modern power systems to provide electrical insulation and mechanical support for transmission lines and substations. However, the insulation strength will decrease greatly under the combined conditions of ice-covering and contamination, and icing flashovers may take place under these serious conditions. In this paper, AC flashover tests of different artificially ice-covered 220 kV composite insulators were carried out in a multi-function artificial climate chamber under energized ice accumulation conditions. The test results indicate that, with the increasing of ice thickness, the flashover voltages decrease and tend to saturation. The icing flashover voltages can be increased by adding booster sheds, but excessive booster sheds can lead to lower flashover voltages under heavy icing conditions. The voltage distributions of the iced insulators were measured using experimental methods. The results show that, the air gaps withstand most of the applied voltage. The zinc oxide (ZnO) resistors that are contained in the insulators can influence the voltage distributions of the iced insulators, but have little affect on the icing flashover voltages. The work done in this paper can provide reference for the design and type selection of outdoor composite insulators in cold climate regions.
1. Introduction
Over past decades, composite insulators have been widely used in electric power utilities because of their excellent anti-contamination performance [1,2,3]. From the electrical viewpoint, the main function of insulators is to withstand electrical stress with a low probability of failure under the environmental and meteorological conditions to which they are subjected. However, in recent years, icing flashovers of composite insulators were frequently reported in cold climate regions [4,5,6]. Thus, it is of great significance to study the icing characteristics, flashover performance, and relevant improvement methods of composite insulators.
Investigations have been made to study the icing characteristics and flashover performance of composite insulators. Most researchers believe that the presence of a highly conductive water film on the ice surface is necessary for flashover to occur [7,8]. This water film on the ice surface can be formed by a combination of wet ice accretion, condensation, the heating effect of leakage current, partial arcs, and a rise in air temperature or the effect of sunshine [9,10]. This highly conductive water film leads to voltage drops across the air gaps on the iced insulators. These air gaps are formed during the growth period of icicles. If the electric field across the air gaps is high enough, corona discharges are initiated, leading to the development of partial arcs along air gaps [11,12,13]. This may cause an increase in leakage current and consequent ice melting rate. If the leakage current continues to increase, an unstable white arc will form along the iced insulator. When the white arc reaches its critical length, flashover occurs along the whole insulator [14,15].
Due to the above mentioned issues, composite insulators that are subjected to icing conditions should be properly designed for an acceptable risk of flashover. Hence, researches have been carried out to improve the electrical and flashover performance of iced insulators. It is proved that the variations of sheds configures can affect the number and length of the air gaps on the iced insulators, and the air gaps can impact the insulators’ icing flashover performance [16]. Experimental studies were carried out, and the booster sheds were found to be an effective way to improve the icing flashover performance of composite insulators [17]. The booster sheds effects on the flashover performance of ice-covered post insulators have been studied using experimental and simulation methods [18]. An improved hypothesis or theory regarding the effects of booster sheds was proposed in [19], a method for booster sheds design using geometric modeling and the Taguchi method was presented in [20]. Till now, a lot of researches have been carried out to study the icing flashover performance and relevant improvement methods of the composite insulators. However, not much work has compared the booster sheds’ effects on the insulators’ electrical and flashover performance under different icing conditions. Voltage distributions of the iced insulators were obtained by simulations [19,20,21], but the voltage distributions have not been studied using experimental methods. What is more, in recent years, composite insulators containing ZnO resistors have been used in regions where thunder and lightning happen frequently [22], however, little work has been done to study the influence of ZnO resistors on these insulators’ electric and flashover performance under icing conditions.
In view of these, the main purpose of this paper is to investigate the influence of the booster sheds and ZnO resistors on the voltage distributions and flashover performance of different types of 220 kV composite insulators. This paper is organized as follow:
- Firstly, the test facilities, specimens and procedures of the icing flashover experiment carried out in this paper are introduced in Section 2. When compared with the existing studies [19,20,21], voltage distributions of the test specimens were measured using experimental methods.
- Secondly, the composite insulators’ experimental results are presented and analyzed in Section 3. Equivalent circuit models are built, effects of the booster sheds and ZnO resistors on the iced insulators’ voltage distributions and flashover performance are discussed. As compared with the dynamic models in the existing studies [7,8,9,10,11,14], the equivalent circuits presented in this paper are used for voltage distribution analysis in steady state, and the effects of ZnO resistors are considered when building the equivalent circuit models.
- Finally, Section 4 gives the conclusions. References are proposed for the design of outdoor composite insulators in cold climate regions.
2. Test Facilities, Specimens and Procedures
2.1. Test Facilities
The experimental test circuit used in this paper is shown in Figure 1, and the main experimental set up is shown in Figure 2. The power is supplied by an 800 kV/3200 kVA test transformer and leaded in through a wall bushing, which meets the requirements of composite insulators’ icing flashover tests [23]. The applied voltage is measured by a capacitive voltage divider and an oscilloscope. The icing flashover tests are carried out in a multi-function artificial climate chamber in the State Grid Corporation of Hunan in Changsha, China. The artificial climate chamber has a diameter of 25 m and a height of 27.5 m. The minimum temperature in the climate chamber can be adjusted to −20 ± 1 °C. The spraying system consists of more than 10 fog nozzles, and the wind velocity regulating system is composed of more than 10 fans placed in a tapering box with a diffusing honeycomb panel. These facilities can meet the requirements of artificial wet growth ice deposit, which is known as the most dangerous ice type for the insulators [24].
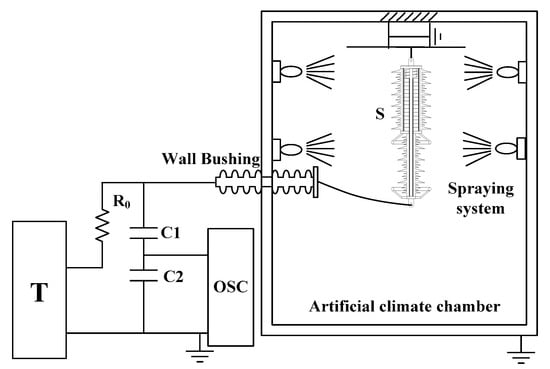
Figure 1.
Experimental circuit. T is the power supply, R0 is the 5 kΩ protective resistor, C1 and C2 are the voltage divider, OSC is the oscilloscope and S is the test specimen.
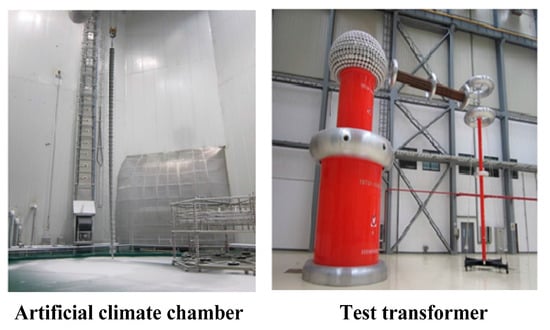
Figure 2.
Experimental setup.
2.2. Test Specimens
The test specimens consist of 6 types of 220 kV composite insulators. The profiles are presented in Figure 3, and the technical parameters are given in Table 1. In Table 1, C1 is the rod diameter of the tested insulators, C2 is the ZnO resistor diameter of type F, dS is the sheds distance, D is the sheds diameter (D1/D2/D3), h is the dry arc distance, l is the leakage distance, and N is the number of booster sheds. The installation height of the grading rings is 90 mm. All of the grading rings have a diameter of 350 mm and a tube diameter of 50 mm.
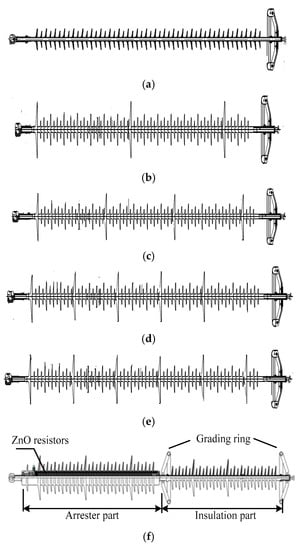
Figure 3.
Profiles of the test specimens (a) Type A; (b) Type B; (c) Type C; (d) Type D; (e) Type E; and (f) Type F.

Table 1.
Parameters of tested composite insulators.
In Figure 3, type A is the standard 220 kV insulator with small and middle sheds. Type B to type E have different number of booster sheds. The diameter of the booster sheds is 250 mm. Type F is made up of two parts: insulation part and arrester part, the arrester part has circular ZnO resistors contained in it. The rod is installed through the whole insulator. Type F has the function of an arrester; it can also withstand pulling force and be used as an insulator [22,25]. In this paper, flashover tests are carried out to study the effects of booster sheds and ZnO resistors on the insulators’ electrical and flashover performance under icing conditions.
2.3. Test Procedures
2.3.1. Ice Accumulation Method
The ice accumulation and flashover process was applied according to the IEEE Standard 1783 [26]. Before the icing process, the insulators were carefully cleaned to ensure removing of all traces of dirt and grease and then dried naturally. In order to simulate the pollution degree in most icing regions in china, the freezing water conductivity was fixed to 370 μS/cm [27,28]. Before spraying, the freezing water was pre-cooled to a temperature ranging from 3 to 4 °C. Wet-grown ice, known as the most dangerous ice type, was used in the flashover test in this paper [24]. Energized icing process was used in this paper, and the applied voltage was set to 50 kV during the ice accretion period. The experimental parameters are shown in Table 2.
Table 2.
Parameters of ice accretion.
2.3.2. Parameter Defining Ice Degree
In order to evaluate the icing degree of the test specimens, the average ice thickness (d) on a monitoring cylinder with a length of 600 mm and a diameter of 30 mm was chosen to monitor the ice covered on the insulators, the rotating speed was one round per minute. It was installed near the test insulators within the water spraying zone.
2.3.3. Electric and Flashover Performance Evaluation Methods
According to the IEEE standard and the experimental experiences in existing studies, a series of flashover tests were applied in this paper [5,16,21,22,23,24]. Energized icing was used, and the sequence of the test procedure is shown in Figure 4. During icing process, a 50 kV voltage was applied to the test specimens. When the icing process was finished, the spraying system was turned off and the ice accumulated on the test specimens was hardened for another 20 min. In order to obtain melting ice, the door of the climate room was opened to let the temperature increase above 0 °C.
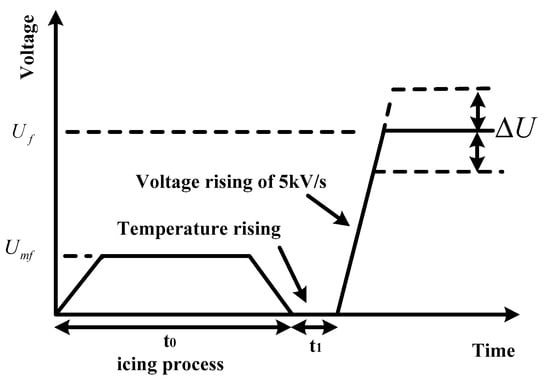
Figure 4.
Sequence of the icing regime test procedure [18].
In the existing studies, the voltage distributions of the iced insulators were obtained by simulations [19,20,21], but the simulated results have not been validated by experiments. In this paper, a 50 kV voltage Ua was applied to the high-voltage terminal of the test insulators. The voltages of the ice layer on different positions of the iced insulators were measured through a voltage divider. The impedance of this voltage divider is large enough that it has little influence on the voltage distributions of the iced insulators. Using this method, the voltage distributions of the test specimens were obtained under different icing conditions.
The up-and-down method was used in this experiment to determine the 50% withstand voltage (U50) with a step (ΔU) of 10 kV of the last flashover voltage (the expected flashover voltage in the first test). The detailed test procedure to determine U50 is shown in [23,29]. Provided that N is the number of test results, the first flashover voltage is marked with U1, the second one U2,and the Nth Un, U50 can be expressed as:
3. Test Results and Analysis
3.1. Test Results
Icing and flashover tests were carried out following the test procedures in Section 2. Five different ice thicknesses were chosen for flashover tests (5/10/15/20/25 mm). The test specimens under the ice thickness of d = 15 mm are shown in Figure 5. From the icing process, it can be observed that: at the beginning of the icing process, a thin ice layer was accumulated on the insulator surface, and icicles began to appear on the edges of sheds. As the icing process went on, the ice layer became thicker and the icicles grew radially and longitudinally. The adjacent icicles combined with each other and semicylindrical ice bulks were formed at the sheds edges [16,22]. When d = 15 mm, the small and middle sheds were bridged while booster sheds provided air gaps along the insulators.
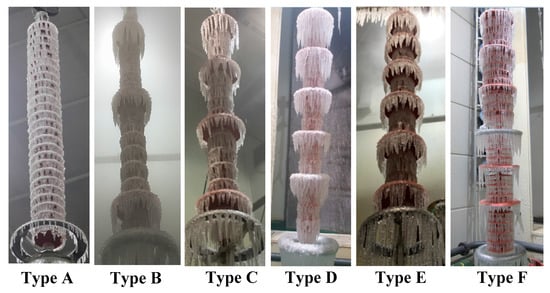
Figure 5.
Appearance of the iced specimens when ice thickness d = 15 mm.
U50 for the test specimens under different icing degrees are shown in Table 3. According to Table 3, the relationship between U50 and d is shown in Figure 6.
Table 3.
U50 (kV) for the test specimens under different icing degrees.
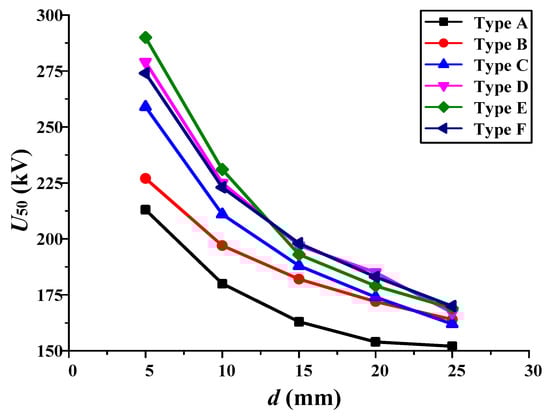
Figure 6.
Relationship between U50 and d.
According to the existing studies [4,5,22], when the contamination degree, insulator structures and environmental parameters are fixed, the relationship between U50 and d can be expressed by Equation (2), in which Ad is related to the freezing water conductivity, sheds configurations, and material of specimens; c is related to the influence of ice thickness on AC icing flashover voltages.
According to Equation (2), the test results in Figure 6 are fitted, and the fitting coefficients are shown in Table 4.
Table 4.
The values of Ad and c for different types of insulators.
From the test results above, it can be known that:
- (1)
- With the increasing of icing degree, the flashover voltages decrease and tend to saturation.
- (2)
- When icing degree is light (d = 5 mm), the icing flashover voltages of insulators with more booster sheds are higher. However, with the increasing of ice thickness (d ≥ 15 mm), excessive booster sheds can lead to lower flashover voltages (type E). When d = 25 mm, the flashover voltages of the test specimens are very close to each other.
In order to explain the test results, the effects of booster sheds and ZnO resistors on the insulators’ flashover performance and the voltage distributions are analyzed and discussed in this paper.
3.2. Influence of Booster Sheds on Flashover Path and U50
Under the icing degree of d = 15 mm, the icing flashover process of type A and type C is shown in Figure 7, which can be described as follow:
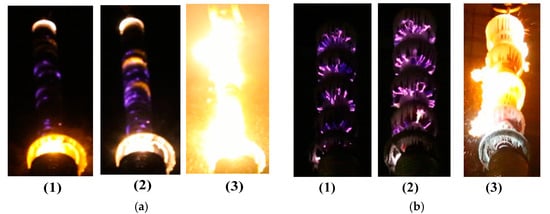
Figure 7.
Flashover process of ice-covered insulators. (a) Type A; and (b) type C.
- (1)
- For type A, partial arcs appeared at the top and bottom terminals and blue corona discharges appeared at the middle part of the insulator. As the flashover process went on, partial arcs are developed through the whole insulator, leading to icing flashover to happen.
- (2)
- For the test insulators with booster sheds (type C), partial arcs appeared at the air gaps between the icicles of the booster sheds and ordinary sheds. As the applied voltage was increased, the partial arcs between the air gaps developed through the whole insulator, and flashover happened.
From the flashover process in Figure 7, it can be known that: ignoring the fact that sometimes arcs deviate from the surface of insulators due to the effect of thermal buoyancy, the flashover paths mainly develop along the surface of the ice layer and the shortest air gaps where partial arcs appear. As the air gaps withstand most of the applied voltage under wet icing conditions [11,12,13], iced insulators with longer air gaps have higher flashover voltages. Based on the flashover process that is shown in Figure 7, the most possible flashover paths under different icing conditions can be deduced in Figure 8, from which the influence of booster sheds on U50 and flashover path can be explained as below:
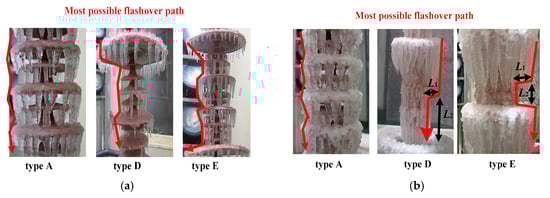
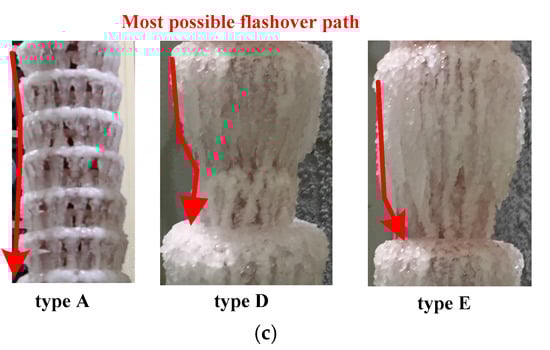
Figure 8.
Most possible flashover path under different icing conditions. (a) d = 5 mm; (b) d = 15 mm; and (c) d = 25 mm.
- (1)
- When d = 5 mm, as shown in Figure 8a, the icing degree is light and the insulator sheds are not bridged by icicles. Insulator with more booster sheds has a longer creep distance and longer air gap length on the flashover path, leading to higher flashover voltage.
- (2)
- When d = 15 mm, as shown in Figure 8b, the small and middle insulator sheds are all bridged by icicles. The flashover path is determined by the shortest air gap length, either the gap length between the icicles of the booster sheds and middle sheds (L1) or the gap length of the icicle below the booster sheds (L2). It is confirmed that, for type B to type D, flashovers happen along L1, more booster sheds can increase the number of air gaps and improve insulators’ icing flashover performance. However, when there are excessive booster sheds on the test specimens (type E), the distance between the booster sheds become shorter, and flashovers may happen along L2 (L2 < L1), leading to shorter air gap lengths and lower flashover voltages. According to the test results, the optimized booster sheds number should be chosen as 5 for the test specimens in this paper.
- (3)
- When d = 25 mm, as shown in Figure 8c, the small, middle, and booster sheds of the test specimens are all bridged by icicles. The flashover voltages of the test specimens are very close to each other.
3.3. Influence of ZnO Resistors on Voltage Distribution
According to the experimental methods in Section 2, the voltage distributions of the test insulators were obtained by applying a 50 kV voltage to the high-voltage terminal of the test insulators. Figure 9 gives the voltage distributions of type D and type F. These insulators have the same number of booster sheds. In Figure 9, the x axis is the distance from the high-voltage terminal, y axis is the voltage on the ice layer. From Figure 9, it can be known that:
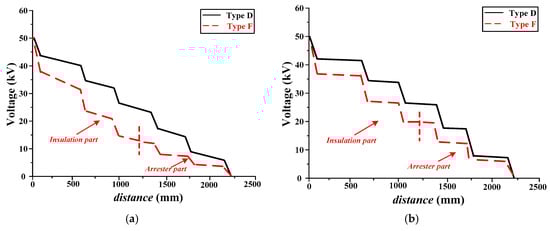
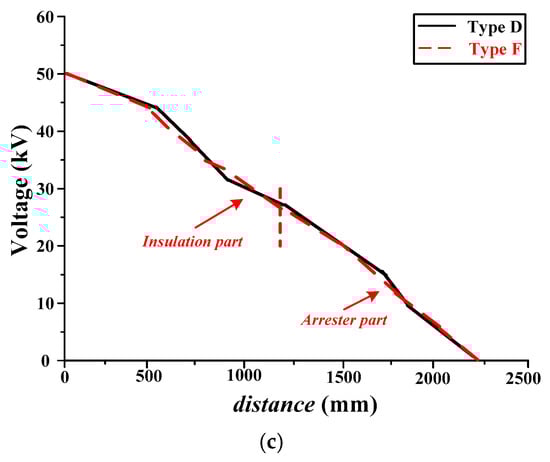
Figure 9.
Voltage distributions of the test specimens under different icing conditions. (a) d = 5 mm; (b) d = 15 mm; and (c) d = 25 mm.
- (1)
- When d = 5 mm (Figure 9a), the air gaps near the high-voltage terminal and under the booster sheds withstand more voltage than other parts. However, the small and middle sheds are not all bridged by icicles, there is still a small part of voltage that is applied on the small and middle sheds. For Type D, the voltage applied on each air gap are very close to each other. For type F, because of the ZnO resistors, the voltage applied on the insulator part is 38 kV, and the voltage applied on the arrester part is 12 kV.
- (2)
- When d = 15 mm (Figure 9b), the small and middle sheds are all bridged. The air gaps near the high-voltage terminal and under the booster sheds withstand more than 90% of the applied voltage. For type F, with the increasing of ice thickness, more voltage (21 kV) is applied on the arrester part.
- (3)
- When d = 25 mm (Figure 9c), all the insulator sheds are bridged by icicles, the applied voltage is distributed uniformly on the insulators. For type F, the arrester part withstands nearly 50% (27 kV) of the applied voltage.
From Figure 9, it can be deduced that: for type F, the insulation part withstands more applied voltage when d ≤ 15 mm. With the increasing of ice thickness, more voltage is applied on the arrester part. Under heavy icing condition (d = 25 mm), the voltage ratio of the arrester part and insulator part is nearly 50%, the voltage distributions of type D and Type F are near to each other. In order to explain the voltage distributions of the iced insulators, the equivalent circuit models are presented in Figure 10. These equivalent circuit models of the iced insulators are built based on the dynamic models of AC multiple arcs presented in [14]. When compared with the existing studies, the effects of ZnO resistors are considered, and the equivalent circuits that are presented in this paper are used in steady state analysis. In Figure 10, Zi is the impedance of the insulation part, Za is the impedance of the ZnO resistors in the arrester part, Zgap_xn is the impedance of the Nth air gap, and Zice_xn is the impedance of the Nth ice layer. It is confirmed that, for type D, Zi is much larger than Zice and Zgap. Because of the high-conductive water film on the surface of the ice layer, Zice is much smaller than Zgap. Thus, the air gaps of the iced insulators withstand most of the applied voltage. For type F, Za is much smaller than Zi due to the effects of ZnO resistors. When d = 5 mm, the icing degree is light, the applied voltage on the arrester part is smaller than that on the insulation part. With the increasing of ice thickness (d = 15 mm), Zice and Zgap become smaller, and the arrester part withstands higher voltage. When d = 25 mm, the air gaps are all bridged by icicles, and the voltage distributions are mainly determined by the ice layer [30,31], so the voltage is distributed uniformly on type D and type F. During the flashover process, the electric field across the air gaps is high enough, leading to partial arcs along the air gaps. As a result, the impedance of the air gaps become much smaller, and the insulator voltage is redistributed. From these, it can be concluded that the ZnO resistors contained in type F may decrease the voltages required to initiate corona and partial arcs under light or moderate icing conditions, but the flashover voltages of the test specimens are influenced little by the ZnO resistors (Table 3 and Figure 6).
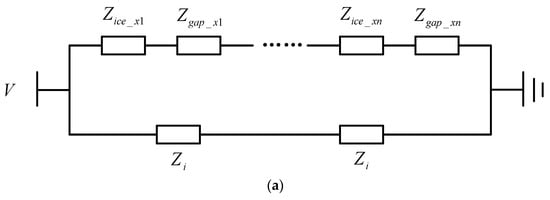
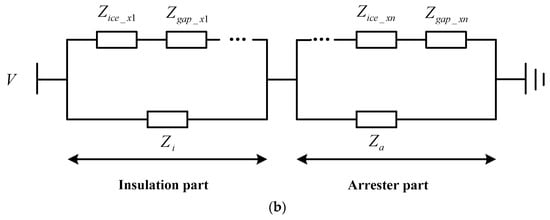
Figure 10.
Equivalent circuit models of the iced insulators. (a) Type D; and (b) Type F.
4. Conclusions
In this paper, icing flashover tests were carried out to investigate the icing flashover performance of 220 kV composite insulators under different icing conditions. The influence of booster sheds and ZnO resistors of the test specimens have been analyzed and discussed, based on which the following conclusions can be made:
- (1)
- From the comparison of the icing flashover performance of the iced insulators with different sheds configurations, it can be known that the booster sheds number should be chosen as 5, and the booster sheds should be uniformly distributed on the insulators.
- (2)
- From the comparison of voltage distributions and icing flashover performance of type D and type F, it can be known that the ZnO resistors contained in the composite insulators may decrease the voltage required to initiate corona and partial arcs under light or moderate icing conditions, but the flashover voltages are influenced little by the ZnO resistors. So, type F insulator can be used in regions where icing and lightning frequently happen.
Acknowledgments
The authors gratefully acknowledge the contributions of all members of the external insulation research team in State Grid Hunan Electric Power Corporation for their work on this paper.
Author Contributions
Pengkang Xie carried out the experiments, analyzed the test results, and wrote this paper. Jiazheng Lu gave input to the analysis of test results. Zhenglong Jiang, Zhen Fang and Wei Wu organized the experimental setup and measurements.
Conflicts of Interest
The authors declare no conflict of interest.
References
- Ren, A.; Liu, H.S.; Wei, J.C.; Li, Q.Q. Natural Contamination and Surface Flashover on Silicone Rubber Surface under Haze–Fog Environment. Energies 2017, 10, 1580. [Google Scholar] [CrossRef]
- Lv, Y.; Zhao, W.; Li, J.; Zhang, Y. Simulation of Contamination Deposition on Typical Shed Porcelain Insulators. Energies 2017, 10, 1045. [Google Scholar] [CrossRef]
- Farzaneh, M.; Kiernicki, J. Flashover problems caused by ice build-up on insulators. IEEE Electr. Insul. Mag. 1995, 11, 5–17. [Google Scholar] [CrossRef]
- Li, P.; Fan, J.; Li, W.; Su, Z.; Zhou, J. Flashover Performance of HVDC Iced Insulator Strings. IEEE Trans. Dielectr. Electr. Insul. 2007, 14, 1334–1338. [Google Scholar] [CrossRef]
- Hu, J.L.; Jiang, X.L.; Yin, F.H.; Zhang, Z.J. DC Flashover Performance of Ice-Covered Composite Insulators with Parallel Air Gaps. Energies 2015, 8, 4983–4999. [Google Scholar] [CrossRef]
- Liu, Y.; Gao, S.; Huang, D.; Yao, T.; Wu, X.; Hu, Y.; Cai, W. Icing flashover characteristics and discharge process of 500 kV AC transmission line suspension insulator strings. IEEE Trans. Dielectr. Electr. Insul. 2010, 17, 434–442. [Google Scholar] [CrossRef]
- Taheri, S.; Farzaneh, M.; Fofana, I. Equivalent surface conductivity of ice accumulated on insulators during development of AC and DC flashovers arcs. IEEE Trans. Dielectr. Electr. Insul. 2013, 20, 1789–1798. [Google Scholar] [CrossRef]
- Taheri, S.; Farzaneh, M.; Fofana, I. Empirical flashover model of EHV post insulators based on ISP parameter in cold environments. IEEE Trans. Dielectr. Electr. Insul. 2016, 23, 403–409. [Google Scholar] [CrossRef]
- Fofana, I.; Farzaneh, M. Application of Dynamic Model to Flashover of Ice-covered Insulators. IEEE Trans. Dielectr. Electr. Insul. 2007, 14, 1410–1417. [Google Scholar] [CrossRef]
- Fofana, I.; Farzaneh, M.; Hemmatjou, H.; Volat, C. Study of discharge in air from the tip of an icicle. IEEE Trans. Dielectr. Electr. Insul. 2008, 15, 730–740. [Google Scholar] [CrossRef]
- Farzaneh, M.; Volat, C.; Zhang, J. Role of air gaps on AC withstand voltage of an ice-covered insulator string. IEEE Trans. Dielectr. Electr. Insul. 2006, 13, 1350–1357. [Google Scholar] [CrossRef]
- Taheri, S.; Farzaneh, M.; Fofana, I. Influence of air gaps on the DC withstand voltage of ice-covered UHV insulators. In Proceedings of the 2012 Annual Report Conference on Electrical Insulation and Dielectric Phenomena (CEIDP), Montreal, QC, Canada, 14–17 October 2012; pp. 745–748. [Google Scholar] [CrossRef]
- Farzaneh, M.; Fofana, I.; Tavakoli, C.; Chen, X. Dynamic modeling of DC arc discharge on ice surfaces. IEEE Trans. Dielectr. Electr. Insul. 2003, 10, 463–474. [Google Scholar] [CrossRef]
- Taheri, S.; Farzaneh, M.; Fofana, I. Dynamic modeling of AC multiple ARCS of EHV post station insulators covered with ice. IEEE Trans. Dielectr. Electr. Insul. 2015, 22, 2014–2023. [Google Scholar] [CrossRef]
- Ndiaye, I.; Farzaneh, M.; Fofana, I. Study of the Development of Positive Streamers along an Ice Surface. IEEE Trans. Dielectr. Electr. Insul. 2007, 14, 1436–1445. [Google Scholar] [CrossRef]
- Hu, J.; Sun, C.; Jiang, X.; Xiao, D.; Zhang, Z.; Shu, L. DC Flashover Performance of Various Types of Ice-Covered Insulator Strings under Low Air Pressure. Energies 2011, 5, 1554–1576. [Google Scholar] [CrossRef]
- Ale-Emran, S.M.; Farzaneh, M. Flashover performance of ice-covered post insulators with booster sheds using experiments and partial arc modeling. IEEE Trans. Dielectr. Electr. Insul. 2016, 23, 979–986. [Google Scholar] [CrossRef]
- Ale-Emran, S.M.; Farzaneh, M. Dimensioning of booster sheds for icing protection of post station insulators. IEEE Trans. Dielectr. Electr. Insul. 2014, 21, 2576–2583. [Google Scholar] [CrossRef]
- Ale-Emran, S.M.; Farzaneh, M. Parametric studies and improved hypothesis of booster-shed effects on post insulators under heavy icing conditions. IEEE Trans. Dielectr. Electr. Insul. 2015, 22, 420–427. [Google Scholar] [CrossRef]
- Deng, Y.; Jia, Z.; Zhou, J.; Sun, L. Ice Flashover Performance and Its Characterization Parameter of Composite Insulator with Booster Sheds. IEEE Trans. Dielectr. Electr. Insul. 2016, 23, 1021–1029. [Google Scholar] [CrossRef]
- Shu, L.; Wang, S.; Jiang, X.; Hu, Q.; He, Y.; Wu, Z. Influences of grading ring arrangement on AC flashover performance of 220 KV ice-covered composite insulators. IEEE Trans. Dielectr. Electr. Insul. 2016, 21, 2652–2661. [Google Scholar] [CrossRef]
- Lu, J.; Zhao, C.; Jiang, Z.; Xie, P.; Hu, J. Simulation and experiment of a composite insulator with lightning protection and icing flashover prevention. In Proceedings of the International Conference on Lightning Protection (ICLP), Shanghai, China, 11–18 October 2014; pp. 1987–1991. [Google Scholar] [CrossRef]
- Hu, Q.; Shu, L.; Jiang, X.; Sun, C.; Zhang, Z.; Hu, J. Effects of shed configuration on AC flashover performance of ice-covered composite long-rod insulators. IEEE Trans. Dielectr. Electr. Insul. 2012, 19, 200–208. [Google Scholar] [CrossRef]
- Yin, F.; Jiang, X.; Farzaneh, M.; Hu, J. Electrical performance of 330-kV composite insulators with different shed configurations under icing conditions. IEEE Trans. Dielectr. Electr. Insul. 2015, 22, 3395–3404. [Google Scholar] [CrossRef]
- Koch, R.E.; Timoshenko, J.A.; Anderson, J.G.; Shih, C.H. Design of Zinc Oxide Transmission Line Arresters for Application on 138 kV Towers. IEEE Trans. Power Apparatus Syst. 2675, PAS-104, 2675–2680. [Google Scholar] [CrossRef]
- IEEE Std. 1783-2009, IEEE Guide for Test Methods and Procedures to Evaluate the Electrical Performance of Insulators in Freezing Conditions; Institute of Electrical and Electronics Engineers, Inc.: New York, NY, USA, 2009.
- Farzaneh, M.; Drapeau, J.F. AC flashover performance of insulators covered with artificial ice. IEEE Trans. Power Deliv. 1995, 10, 1038–1051. [Google Scholar] [CrossRef]
- Hu, Q.; Wang, S.; Shu, L.; Jiang, X.; Liang, J.; Qiu, G. Comparison of AC Icing Flashover Performances of 220 kV Composite Insulators with Different Shed Configurations. IEEE Trans. Dielectr. Electr. Insul. 2016, 12, 995–1004. [Google Scholar] [CrossRef]
- Yang, Q.; Wang, R.; Sima, W.; Jiang, C.; Lan, X.; Markus, Z. Electrical Circuit Flashover Model of Polluted Insulators under AC Voltage Based on the Arc Root Voltage Gradient Criterion. Energies 2012, 5, 752–769. [Google Scholar] [CrossRef]
- Hu, J.; Sun, C.; Jiang, X.; Yang, Q.; Zhang, Z.; Shu, L. Model for Predicting DC Flashover Voltage of Pre-Contaminated and Ice-Covered Long Insulator Strings under Low Air Pressure. Energies 2011, 4, 628–643. [Google Scholar] [CrossRef]
- Liu, Y.; Farzaneh, M.; Du, B. Nonlinear Characteristics of Leakage Current for Flashover Monitoring of Ice-covered Suspension Insulators. IEEE Trans. Dielectr. Electr. Insul. 2016, 23, 1242–1250. [Google Scholar] [CrossRef]
© 2018 by the authors. Licensee MDPI, Basel, Switzerland. This article is an open access article distributed under the terms and conditions of the Creative Commons Attribution (CC BY) license (http://creativecommons.org/licenses/by/4.0/).