Abstract
Fog and haze (F-H) weather has been occurring frequently in China since 2012, which affects the output power of photovoltaic (PV) generation dramatically by directly weakening solar irradiance and aggravating dust deposition on PV panels. The ultra-short-term forecast method presented in this study would help to fully reflect the dual effects of F-H on PV output power. Aiming at the weakening effect on solar irradiance, estimation models of atmospheric aerosol optical depth (AOD) based on particle matter (PM) concentration were established with machine learning (ML) method, and the total irradiance received by PV panels was calculated based on simplified REST2 model. Aiming at the aggravating effect on dust deposition on PV panels, sample set of “cumulative PM concentration—efficiency reduction” was constructed through special measurement experiments, then the efficiency reduction under certain dust deposition state was estimated with similar-day choosing method. Based on photoelectric conversion model, PM concentration prediction and weather forecast information, ultra-short-term forecast of PV output power was realized. Experimental results proved the validity and feasibility of the presented forecast method.
1. Introduction
In recent years, photovoltaic (PV) generation has attracted increasing global attention due to its economic and environmental benefits. The ability to forecast the output of PV generation in the ultra-short term (0–4 h into future) is a key issue to allow a high-level penetration of the PV generation into the grid. Besides, accurate ultra-short-term forecast of PV generation is required for regulating and dispatching of the power grid. However, this task still faces great challenges because the performance of PV generation is heavily influenced by frequently fluctuating weather types and meteorological conditions.
China has been facing fog and haze (F-H) weather since 2012. Especially in autumn and winter, large-scale emergence of F-H weather frequently affected the eastern China, and the involved area has gradually increased. In 2013, more than 100 cities in 25 provinces in China, which represent 25% of the national territorial area, were covered by F-H [1]. On 7 December 2015, the Moderate Resolution Imaging Spectroradiometer on NASA’s Aqua satellite captured an image of eastern China being inundated by F-H, seen in gray area of Figure 1. On 6 December 2015, in Beijing, the Chinese government issued a first-ever “red alert” for the city, which resulted in school and factory closures and the forcing of motorists from the roads.

Figure 1.
The spatial distribution of fog and haze (F-H) of eastern China on 7 December 2015.
The severity level of F-H can be quantitatively described by the Air Quality Index (AQI), which is a dimensionless index calculated by the concentrations of six sub-indexes: PM10 (inhalable particle matter, diameter < 10 μm), PM2.5 (fine particulate matter, diameter < 2.5 μm), SO2, CO2, CO and O3 [2]. The AQI level (LAQI) ranges from Level1–Level6 (0–50, 51–100, 101–150, 151–200, 201–300, and >300), corresponding to excellent condition, good condition, slight pollution, moderate pollution, severe pollution and serious pollution. By the end of February 2017, the Chinese government had set up the National Environmental Air Quality Monitoring Network, consisting of more than 5000 air quality monitoring sites to release AQI and six sub-indexes in real time. They also attempted measures in the long run to restrict the impacts of F-H, such as introducing a variety of energy-saving equipment and employing new energy-saving technology to reduce the consumption of fossil fuels, and substituting electricity for coal in industrial manufacturing to effectively control pollutant emissions. However, F-H weather still exists in many areas of China [3].
F-H could directly reflect and absorb the sunlight passing through the earth atmosphere to weaken the solar irradiance reaching the ground. In addition, F-H could aggravate the dust deposition on the surface of PV panels, which lower the PV panels’ energy conversion efficiency mainly by affecting the transmittance. Thus, F-H obviously has a reduced effect on the output of PV generation, which should be fully considered in forecast work.
The early studies about PV output forecast only considered traditional meteorological factors and all kinds of weather types, rarely focusing on F-H [4].The direct forecast and the indirect forecast are the two major methods for PV output forecast. The direct forecast is used to predict the PV output in a straightforward manor, whereas the indirect forecast is used to predict solar irradiance firstly, then the PV output is calculated in a second successive step. In both cases, the two major realization approaches are the statistical method and the physical method [5].
Statistical method implements the learning process to pursuit forecast models named as time series model or artificial intelligence (AI) model, and the forecast accuracy depends on the length and quality of historical input data. Li et al. [6] classified the weather types into four categories: sunny, cloudy, overcast and rain, and established a support vector machine (SVM) model to forecast the PV output. It was pointed out that in the early morning and evening, the mean relative error (MRE) of the model is 15.25% due to the influence of F-H. Li et al. [7] introduced the F-H weather in the classification of weather types, and established a least squares support vector machine (LSSVM) model to forecast the PV output. It was declared that MRE of the model is 15.31% under F-H weather.
Physical methods try to obtain an accurate forecast using a white box model, and the accuracy is determined by the parameters of physical equations. As for the prediction of solar irradiance, some clear sky irradiance models have been proposed, such as Bird, Ineichen, ASHRAE, and REST2, which depend on the solar zenith angle, and a limited number of parameters, whose role is to describe the local and current atmospheric and environmental conditions [8]. Among these parameters, aerosol optical depth (AOD) has been improved to be the primary influencing factor for forecasting results when the sun’s disk is not obscured [9]. Therefore, it is quite important to accurately obtain the AOD in real time for the prediction of solar irradiance.
There are two kinds of methods for obtaining the AOD in practice, satellite observation and ground observation. Satellite observation means that the AOD is inverted from monitoring data of Moderate Resolution Imaging Spectroradiometer (MODIS) on two remote sensing satellites Terra and Aqua, the real-time performance is affected by the satellite transit time and data release cycle, and the accuracy is low because variable surface reflectance, e.g., due to seasonal changes of vegetation. Ground observation means the AOD is inverted from measure data of multiband sun photometers, which are installed in ground observation sites of Aerosol Robotic Network (AERONET), the accuracy is high; however, the layout of observation sites in China are quite sparse, and the released AOD is only usable in local areas.
In order to analyze and predict ground air quality, Chu et al. [10], Liu et al. [11], Koelemeijer et al. [12], and Guo et al. [13] have used the AOD from satellite observation to calculate the PM concentration. The results show that the AOD has a high correlation with PM concentration after the modifications of air relative humidity, air temperature, and boundary layer height are considered. Inspired by this conclusion, considering the PM concentrations have been released to the public in real time by well-covered air quality monitoring sites, this paper tried to establish the AOD estimation model based on PM concentration as well as other influencing factors like relative air humidity, air temperature, and aerosol scale height. Then the radiative model was employed to predict the solar irradiance under F-H weather.
References [14,15,16,17] have investigated the effect of dust deposition on the performance of PV panels. Dust deposition is closely related to the exposure period and the tilt angle of the PV panels. Semaoui et al. [14] discovered that the transmittance of the glass plate on PV panels could be significantly reduced when it is covered with dust in a desert region. Based on an experiment with PV panels installed at an angle of 32° to the horizontal, the average transmittance of the glass plate over a day was found to be reduced by 8% after one month without rainfall. Similarly, Mastekbayeva et al. [15] observed that the transmittance was reduced by 11% after a month of dust accumulation in Thailand. In an experiment carried out in Roorkee by Garg et al. [16], it was discovered that dust deposition on a glass plate tilted at 45° led to a decrease in the transmittance by an average of 8% after an exposure period of 10 days. Sayigh et al. [17] studied the effect of dust deposition on a tilted glass plate located in Kuwait city, and the results indicated that the transmittance of the plate was decreased from 64 to 17% for tilt angles ranging from 0° to 60° after 38 days of exposure to the environment.
Depending on the location, the dust composition may be significantly different, and these differences affect the reduction degree of the energy conversion efficiency of PV panels. Kaldellis et al. studied [18] three representative samples of air pollution in Athens, Greece, including red earth, limestone, and coal ash, as well as natural dust samples. The results indicated that the deposition of dust particles led to significant deterioration in the performance of the PV cells. The decline in the efficiency of the modules depends primarily on the type of the pollutant because equal amounts of various types of dust particles may cause completely different effects.
Some studies have been devoted to determining the quantitative relationship between the dust density and the degradation of PV output. Klugmanne-Radziemska [19] revealed a linear relationship between the efficiency reduction of the PV module and the dust density in northern Poland. Jiang et al. [20] also found that the efficiency reduction has a linear relationship with the dust density, and the difference caused by cell types was not obvious. Ju [21] introduced the dust deposition coefficient, and established the relationships between the dust deposition coefficient and the output power under dry conditions and the bonding state, respectively.
Due to the differences in the experimental environment and the dust composition, the comparability of the above research works is quite weak, further effort is needed to investigate the effect of dust deposition on the performance of PV panels in F-H weather. In addition, the dust density on PV panels is difficult to measure in engineering practice. Therefore, it is quite meaningful to search feasible representation of dust density. This paper tries to represent the dust density by integral of PM concentration released by air quality monitoring site, and constructs the sample set of “cumulative PM concentration—efficiency reduction” by special measurement experiments under F-H weather, which could be used to estimate the actual efficiency reduction under certain dust deposition state with similar-day choosing method.
The main contribution of this paper is to present a novel ultra-short-term forecast method for PV output power under F-H weather, which could benefit the increase of high-level penetration of the PV generation into the grid as well as the economic dispatching of the grid. The contents in this paper comprise the following six parts: AOD estimation model based on PM concentration (Section 2); calculation of solar irradiance (Section 3); estimation of efficiency reduction for dust deposition (Section 4); ultra-short-term forecast method for PV output power (Section 5); case study (Section 6); conclusion (Section 7).
2. AOD Estimation Model Based on PM Concentration
2.1. Introduction of AOD
Atmospheric aerosol refers to a heterogeneous system composed of solid and liquid particles (0.001 μm < diameter < 10 μm) suspended in the atmosphere, which could reflect and absorb the sunlight passing through the atmosphere, thus weaken the solar irradiance reaching the earth’s surface. AOD is a dimensionless physical quantity defined as the integral of the extinction coefficient from the bottom to the top of the atmosphere in the vertical direction; generally, its value is in the range of 0 to 2.5. The higher the AOD value is, the stronger is the weakening effect on solar irradiance.
Angstrom [22] gives the calculate formula of the AOD for the wavelength λ:
where α is the Angstrom wavelength index, β is the Angstrom turbidity coefficient, both of them are related to the diameter distribution and concentration of aerosol particles. For F-H weather, AOD has a high correlation with PM concentration (PM10 concentration or PM2.5 concentration) when the influences of air relative humidity, air temperature and boundary layer height are considered.
(1). Air Relative Humidity
Air relative humidity can change the size, morphology and extinction characteristics of aerosol particles, thus affecting the value of AOD. At present, the PM10 concentration and PM2.5 concentration released by ground air quality monitoring site are the concentration of particulate matter after drying with 50 °C. Therefore, it is necessary to revise the PM concentration with humidity factor when analyzing the relationship between AOD and PM concentration. The common humidity factor models include single-parameter model [23], double-parameter model [24], and scattering moisture absorption model [25]. The generality of above models is poor due to the parameters are only suited for specific region and aerosol composition.
(2). Boundary Layer Height
The boundary layer height is the key parameter that affects the distribution characteristic of aerosols in boundary layer. The lower the value is, the closer the aerosol concentrated to the near ground is, which reveals the higher correlation between AOD and PM concentration. Under the assumption that the aerosol concentration decreases exponentially with the altitude, the aerosol scale height represents the standard height of aerosol in boundary layer. Therefore, aerosol scale height is chosen as one input of the AOD estimation model instead of boundary layer height in this paper.
(3). Air Temperature
Air temperature has important influence not only on dry/wet state of aerosol particles, but also on the existential state of semi volatile components, boundary layer height, and atmospheric stability, thus affecting the relationship between the PM concentration and AOD.
2.2. Data Sources
Because ground observation methods can obtain higher accuracy AOD than satellite observation methods, in this paper, AOD data are collected from AERONET Beijing site, the geographical coordinate of which is 116.583° E/39.783° N. Meanwhile, PM2.5 concentration data, PM10 concentration data, air relative humidity data and air temperature data are collected from Chaoyang Olympic meteorological station, which is the closest air quality monitoring site to AERONET Beijing site. Considering the variation of aerosol scale height is mainly affected by season, the season mean value is taken as an approximate real-time value. The season mean values of aerosol scale height in spring, summer, autumn and winter are 2.864 km, 3.298 km, 2.284 km and 1.597 km respectively in northern China [26]. A total of 2141 sets of effective data have been collected in total from 1 January 2015 to 30 November 2016. A total of 1971 sets were randomly selected as the training data set, and the remaining 170 as the test data set.
2.3. AOD Estimation Model
Back propagation (BP) neural networks [27] and support vector machines (SVM) [28] are the two most typical machine learning methods at the present. In this paper, the AOD estimation models were established respectively by these method sand their performances were compared.
2.3.1. BP Neural Network Model
At time t, taking the PM10 concentration CPM10(t), PM2.5 concentration CPM2.5(t), air relative humidity R(t), aerosol scale height H(t) and air temperature T(t) as input variables, and the 440 nm band AOD τ440(t), and 1020nm band AOD τ1020(t) as output variables, a three-layer BP neural network was established with five input neurons, N hidden neurons and two output neurons, and the neural network structure is shown in Figure 2.
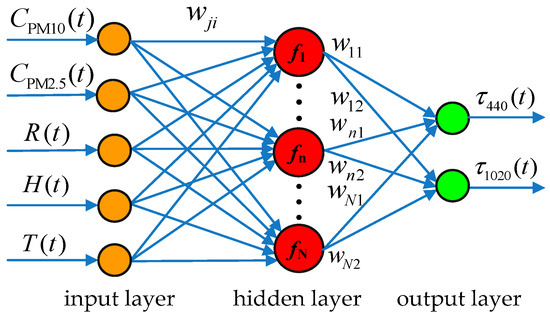
Figure 2.
Structure of the back propagation (BP) neural network model.
The BP neural network model is trained with MatLab Neural Network Toolbox (R2012a, MathWorks, Natick, MA, USA), the main steps include data normalization, determining the number of hidden neurons and model accuracy validation.
(1). Data Normalization
The magnitudes of different input variables of the BP neural network are quite different, therefore, it was necessary to normalize each input variable to achieve high training accuracy. In this paper, the range of all input variables was normalized to [−1, +1] according to Formula (2):
where, v is one of the variables, and vmax and vmin represent the maximum and minimum values of v respectively, with vnorm being the normalized value of v.
(2). Determine the Number of Hidden Layer Neurons
Generally, the optimal number of neurons in the hidden layer is determined by empirical formula. Nevertheless, in this paper, N is determined by trial method. For certain value of N belonging to [6,18], take the tansig function and logsig function as the activation function of hidden layer neurons and output layer neurons respectively, initialize weights and thresholds randomly, set the iteration times to be 30,000 based on the phenomenon that at that time the falling speed of training errors has been quite small, then the network is trained 10 times on the training data set with traingdx learning function. For example, take N = 8, the results of the mean square errors (MSE) are shown in Table 1. The average MSE of the 10 training results are calculated as shown in Table 2. At last, N is determined to be 13 for in that condition the smallest average MSE is achieved. Then, retrain the network with target MSE = 6 × 10⁻², after 54,728 iterations, the training process is finished, the ultimate BP neural network model is obtained.

Table 1.
Mean square errors (MSE) of the training results when number of hidden layer neurons N = 8.

Table 2.
Training results of network with different number of hidden layer neurons.
(3). Model Accuracy Validation
The estimation results of the BP neural network model on the training data set are shown in Figure 3. It is known that the estimation results of the 440 nm band AOD and 1020 nm band AOD are both consistent with the truth values, indicating that BP neural network model has a good fitting ability on training data set. Considering that the value of AOD is generally in the range of 0 to 2.5, Absolute error (AE) of estimation results on test data set are calculated to validate the estimation accuracy of the BP neural network model, as shown in Figure 4. The mean absolute error (MAE) of 440 nm band AOD is 0.1869, and the number of test samples on which AE is less than 0.3, accounting for 86.8% of the total test data set; the MAE of 1020 nm band AOD is 0.1067, and the number of test samples on which AE is less than 0.2, accounting for 90.3% of the total test data set.
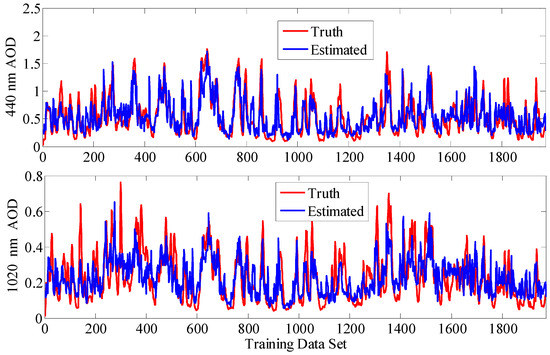
Figure 3.
Estimation results of the BP neural network model on the training data set.
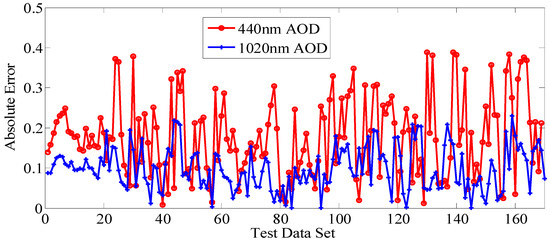
Figure 4.
Estimation results of BP neural network model on test data set.
2.3.2. SVM Estimation Models
Two SVM models, SVM-1 and SVM-2, were established respectively using Lib SVM toolbox, and had the same input variables as the BP Neural Network Model. The output variable of SVM-1 is the 440 nm band AOD τ440(t), while the output variable of SVM-2 is 1020 nm band AOD τ1020(t). The Gaussian kernel function is adopted for the two SVM models. The key to getting a high performance SVM model is to set reasonable training parameters, which mainly includes a loss coefficient ε, a penalty factor C, and a kernel function parameter σ2 in this paper. Considering that the loss coefficient ε mainly affects the generalization ability of the model, and is independent of C and σ2, a constant value to C and σ2 is given respectively, and the optimal value of ε is determined firstly according to the number of support vectors and MSE of estimation results on the training data set. After that, the C and σ2 are determined by the grid search method according to the training accuracy on training data set. Ultimately, the training parameters of the SVM-1 model and SVM-2 model are finally determined as: ε1 = 0.02, C1 = 6, = 10, ε2 = 0.01, C2 = 7, = 10. The estimation results of the SVM-1 model and SVM-2 model on the training samples are shown in Figure 5. It is known that the estimation results of the 440 nm band AOD and 1020 nm band AOD are both within the same trend with the truth values.
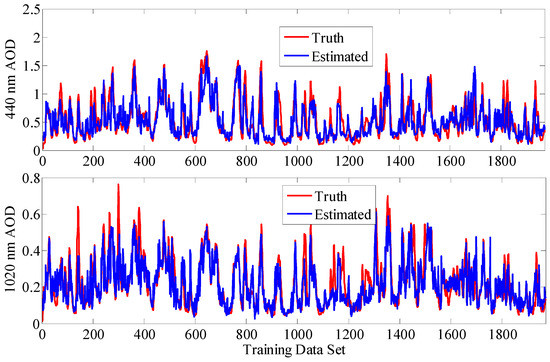
Figure 5.
Estimation results of support vector machine (SVM) models on the training data set.
In order to verify the estimation accuracy of the SVM-1 model and the SVM-2 model, AE of estimation results on test data set were calculated, as shown in Figure 6. The MAE of 440 nm band AOD was 0.1591, and the number of test samples on which AE was less than 0.3, accounting for 90.2% of the total test data set; the MAE of 1020 nm band AOD was 0.0786, and the number of test samples on which AE is less than 0.2, accounting for 92.9% of the total test data set.
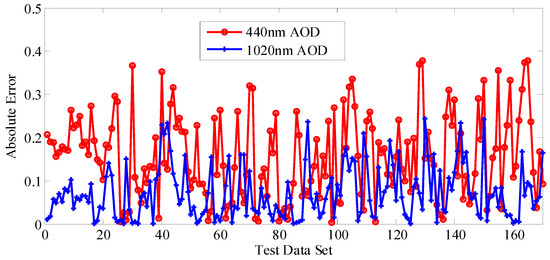
Figure 6.
Estimation results of SVM models on the test data set.
The BP neural network model and the SVM models were compared with the MAE as well as the MSE of estimation results on the test data set, as shown in Table 3. It was known that their performances are quite close. The SVM models had smaller MAE and MSE than the BP neural network model, which indicates that the SVM models had higher estimation accuracy. Therefore, the SVM models were selected for final AOD estimation in this paper.

Table 3.
Performance comparison for two estimation models on the test data set.
3. Calculation of Solar Irradiance
The clear sky irradiance models are suitable for calculating the solar irradiance under cloudless weather. They can also be used for calculating the solar irradiance in cloudy weather through introducing a cloud cover coefficient. Among the appeared clear sky irradiance models, REST2 model has been proven to have a higher accuracy than other models [8].
3.1. Introduction and Simplification of REST2 Model
The REST2 model calculates the direct irradiance and the diffuse irradiance of band 1 (0.29 um~0.7 um) and band 2 (0.7 um~4 um), respectively. For each of the two-bands, i, the band direct irradiance, is obtained from a product of individual transmittances:
where TRi, Tgi, Toi, Tni, Twi, and Tai are the band transmittances for Rayleigh scattering, uniformly mixed gases absorption, ozone absorption, nitrogen dioxide absorption, water vapor absorption, and aerosol extinction, respectively. The extra-atmospheric irradiances at the mean sun-earth distance are E0n1 = 635.4 W/m2 and E0n2 = 709.7 W/m2 in the two bands, respectively. Considering Tgi, Toi and Tni have less impact on Ebni, this paper ignores them to simplify the REST2 model, and then total direct irradiance is calculated as:
For each band, based on the AOD 𝜏ai, Tai is calculated as [29,30]:
where ma is the optical mass for aerosol extinction, which could be obtained from solar zenith angle Z:
and Z could be calculated as:
where ϕ is the site latitude, δ is the earth declination, θh is the solar hour angle, Hs is the sun time, d is the sequence number of the day of the year.
Twi is calculated as [29,30]:
where mw is the optical mass for water vapor absorption, which could be obtained from solar zenith angle Z:
and h1, h2, c1, c2, c3, c4 could be obtained from precipitable water w:
TRi is calculated as [29,30]:
where is the optical mass for Rayleigh scattering, which could be obtained from solar zenith angle Z and site pressure P:
The corresponding calculated formula for the diffuse irradiance of the simplified REST2 model is:
where Ed is the total diffuse irradiance, Edi is band diffuse irradiance, Edpi is the band incident diffuse irradiance, Eddi is the band backscattered diffuse irradiance.
Tasi is the band aerosol scattering transmittance, which could be expressed as:
where is the single-scattering albedo. For general use, the typical values and are recommended.
BRi is the band forward scattering fraction for Rayleigh extinction. For band 2, there is BR2 = 0.5, while for Band 1, BR1 could be obtained from mR [29,30]:
where:
Fi is the band correction factor [25,26], for Band 1, there is:
where , and could be obtained from ma:
for band 2, there is:
where , and could be obtained from ma:
Ba is the aerosol forward scatterance factor, which could be obtained from solar zenith angle Z:
ρsi is the band sky albedo, which could be obtained from Angstrom wave exponent αi and Angstrom turbidity factor βi. For band 1, there is:
For band 2, there is:
in this paper, take , and βi is calculated according to Angstrom equation:
ρgi is the band ground albedo, and is considered here.
In this paper, AOD of band 1, τa1, AOD of band 2, τa2, are replaced by τ440 and τ1020 as predicted by SVM estimation models. The precipitable water w is calculated by the linear fitting model proposed by Li Chao [31], that is:
where SVP is the ground water vapor pressure, according to air relative humidity R, and the air temperature T, there is:
where es0 is the saturated vapor pressure at 0 °C, with the empirical coefficient at a = 7.5, b = 237.3.
3.2. Total Irradiance Calculation
After the direct irradiance and the diffuse irradiance is calculated, for clear-sky weather, assuming that the diffuse irradiance is isotropic, the total irradiance that reaches a PV panel facing the equator and arranged with a tilt angle β to the horizontal is:
For sun-tracking PV panel, its normal direction is in accordance with the main direction of sunlight, so that the received total irradiance is:
In order to evaluate the calculation accuracy of the simplified REST2 model, taking the Baoding Campus of North China Electric Power University (NCEPU, Baoding) as the experimental site, the solar irradiance toward the main direction of sunlight is measured using a TES-1333R type photometer during clear-sky weather between July 2016 and November 2016. Considering the photometer has better measurement accuracy when solar irradiance is higher, 65 groups of data measured at midday were selected as truth values of solar irradiance for evaluation. Correspondingly, PM10 concentration and PM2.5 concentration were collected from the national level air quality monitoring site named 2nd Campus of NCEPU. Air relative humidity and air temperature were collected from China Weather Network. Then 440 nm band AOD and 1020 nm band AOD are estimated using the established SVM models, and the total irradiance is calculated with the simplified REST2 model and Formula (41). The calculated irradiances are compared with the truth values, as shown in Figure 7. The MRE is 9.46%, which indicates that the calculated irradiance has satisfied accuracy.
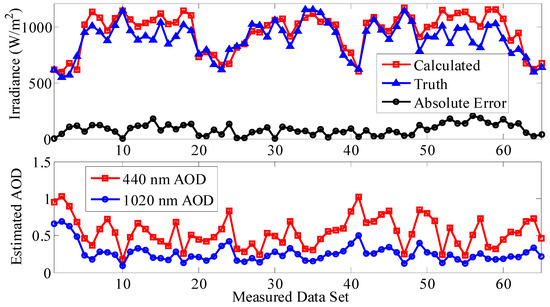
Figure 7.
Calculation of accuracy evaluation of the simplified REST2 model.
4. Estimation of Efficiency Reduction for Dust Deposition
Under the F-H weather, the particulate matter suspended in the air continuously settles down and forms dust deposition on the surface of the PV panels, which lowers the PV panels’ conversion efficiency mainly by affecting the transmittance. Considering that it is inconvenient to measure the dust density in real time, this paper represents the dust density by integral of PM concentration, and constructs the sample set of “cumulative PM concentration—efficiency reduction” through special measurement experiments in F-H weather, then the actual efficiency reduction under certain dust deposition state is estimated with similar-day choosing method.
4.1. Process of the Special Measurement Experiment
From November 2015 to October 2016, special measurement experiments were carried out in NCEPU, Baoding, to reflect the effect of dust deposition on PV panels’ efficiency reduction. The 10PV panels utilized for tests were purchased in the same batch, of which the main specification parameters are shown in Table 4.

Table 4.
Specifications of the photovoltaic (PV) panels utilized for special measurement experiment.
The 10 PV panels were divided equally into five groups, and arranged on the open platform of an office building (named Automation Building) with tilt angles β of 0°, 30°, 45°, 60°, 90° to the horizontal respectively, as shown in Figure 8. A solar simulator was constructed with high pressure xenon lamp, trigger, dimmer, voltage regulator, combined with the maximum power point tracking (MPPT) controller and resistance load, and a special measurement system was set up to realize the accurate measurement of the PV panels’ output power under constant irradiance conditions, as shown in Figure 9.
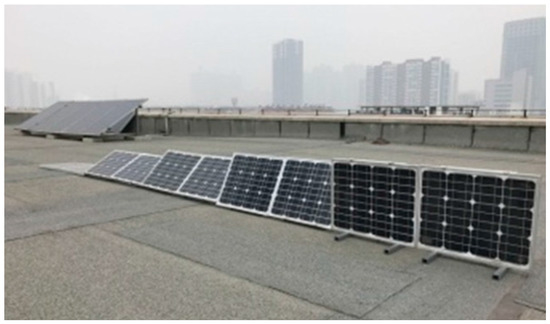
Figure 8.
Arrangement of the PV panels.
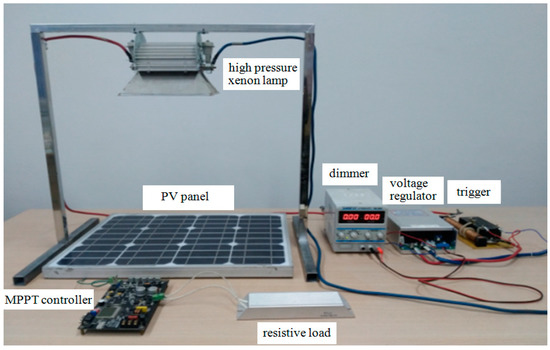
Figure 9.
Structure of the special measurement system.
In this paper, repetitive measurement processes of PV panels’ efficiency reduction were carried out with a period of 14 days for every measurement process, the specific steps of which were as follows:
- (1)
- The surfaces of the five groups of PV panels were cleaned and placed one by one in the constant irradiance condition (1000 W/m2) generated by the solar simulator. After the working point was controlled to the maximum power point (MPP) with the conductance incremental method, the output power was measured. The average output power of each group of PV panels was calculated and regarded as P0.
- (2)
- The five groups of PV panels were arranged on the open platform to naturally realize the dust deposition, and rain weather and snow weather were avoided.
- (3)
- The PV panels were taken back to the special measurement system periodically (set ΔT = 24 h as time interval) and the average output power of each group of PV panels in the same constant irradiance condition was measured. Meanwhile, the average concentration of PM2.5 and PM10 during the measurement interval is calculated. The group of PV panels with tilt angle β = 0° for example, for the i-th measurement (i = 1, 2, …, M. M is the total number of measure times in one measurement process), were regarded with the average output power as Pi, and the average concentration of PM10 and PM2.5 were calculated as CiPM10 and CiPM2.5 respectively, then one group of measure samples {(CiPM10, CiPM2.5, Pi)} was obtained for one measurement process.
- (4)
- Return to (1) for the next measurement process if one measurement process is finished, else return to (2).
4.2. Construction and ofAnalysisof Sample Set “Cumulative PMConcentration—Efficiency Reduction”
For each group of PV panels, the sample set of “cumulative PM concentration—efficiency reduction” was constructed based on the corresponding measure samples. For a group of PV panels with tilt angle β = 0° for example, for the i-th measurement in certain measurement process, the cumulative PM10 concentration , the cumulative PM2.5 concentration , and the efficiency reduction of the PV panels ηi are calculated as:
Thereby, based on one group of measure samples {(CiPM10, CiPM2.5, Pi)}, one group of samples “cumulative PM concentration—efficiency reduction” {(, , ηi)} was obtained correspondingly. After the repetitive measurement processes are accomplished, the sample set of “cumulative PM concentration—efficiency reduction” was constructed. The sample set in three-dimensional space with the least square surface fitting method was drawn, as shown in Figure 10.
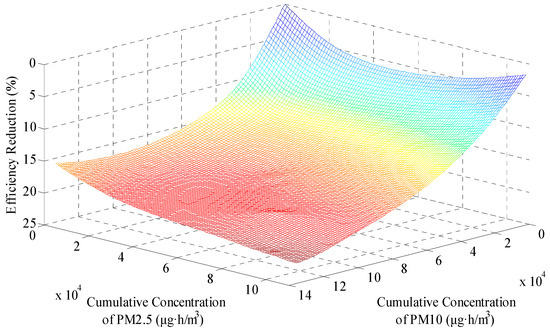
Figure 10.
Sample set for PV panels with tilt angle β = 0°.
It was obvious that the efficiency reduction of PV panels increased with the growth of cumulative PM concentration, indicating that the higher the cumulative PM concentration was, the more serious the dust accumulation on PV panels was. The obtained maximum efficiency reduction of the repetitive measurement processes was 22.19% for PV panels, with tilt angle β = 0°.
In order to analyze the effect of tilt angle β on the efficiency reduction of PV panels, certain measurement process (6 December 2015 to 19 December 2015) is taken as an example, the daily air quality of Baoding during the measurement process is shown in Table 5, and the efficiency reduction curves of the five group of PV panels were plotted with the number of days for dust deposition, as shown in Figure 11.

Table 5.
Dailyair quality of Baoding, China, 7–20 December 2015.
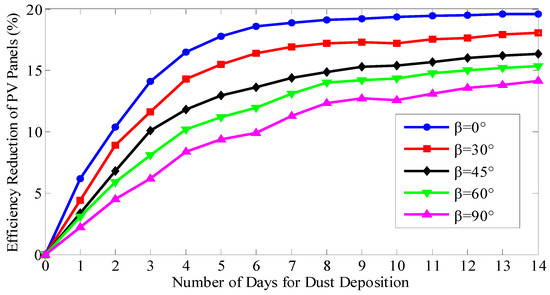
Figure 11.
Efficiency reduction of PV panels with different tilt angle.
With the growth of the number of days for dust deposition, the PV panels with smaller tilt angle β has consistent greater efficiency reduction, which indicated the degree of dust deposition is inversely proportional to tilt angle β. Meanwhile, the variation trends of the five groups of PV panels’ efficiency reduction are quite similar. The daily AQI Levels of 7 December 2015 to 10 December 2015 were all “serious pollution”, and the efficiency reduction of each groups of PV panels increased quite rapidly. The daily AQI Levels of 15 December 2015 and 16 December 2015 are both “excellent condition”, while the efficiency reduction increased quite slowly, even slightly decreased efficiency reduction was found for PV panels with β = 90° and β = 30°. On the whole, the efficiency reduction increased faster in the early stage of dust deposition, then gradually slowed down, and the smaller the tilt angle β was, the more obvious the above tendency was.
Because the actual irradiance varies continuously, efficiency reduction of PV panels (β = 0°) in different irradiance conditions were compared, as shown in Figure 12. It is known that for every dust deposition state, the variance of corresponding efficiency reduction is quite small when the PV panels are placed in different irradiance conditions. Therefore, the sample set of “cumulative PM concentration—efficiency reduction” constructed in the constant irradiance condition (1000 W/m2) could be generalized to other irradiance conditions.
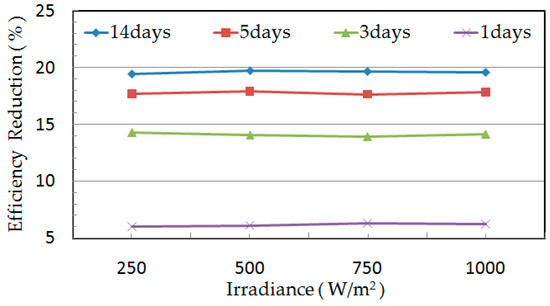
Figure 12.
Efficiency reduction of PV panel in different irradiance conditions.
4.3. Estimation of Efficiency Reduction Based on Similar-Day Choosing Method
Generally, the tilt angle of PV panels was determined mainly according to the latitude. In this paper, a similar-day choosing method was adopted to estimate the efficiency reduction of PV panels in certain dust deposition state with arbitrary tilt angle β*. Above all, the cumulative PM concentration from the last cleaning time was calculated, and the two sample sets of “cumulative PM concentration—efficiency reduction” the corresponding tilt angle are β1 and β2 adjacent to β* were selected. Then, according to the nearest neighbor principle of cumulative PM concentration, the similar-day sample in each sample set was selected. Eventually the efficiency reduction in current dust deposition state was estimated by implementing linear interpolation on the efficiency reduction of the selected two similar-day samples, according to the distances from tilt angle β* to the tilt angles β1 and β2.
5. Ultra-Short-Term Forecast Method for PV Generation
5.1. Photoelectric Conversion Model
The output of PV panels was mainly affected by the received total irradiance E and the component working temperature t0. Without considering the influence of dust deposition to PV panels, the photoelectric conversion model is [32]:
where ηpv and S are the conversion efficiency and area of the PV panels, respectively. The component working temperature t0 can be estimated according to the received total irradiance E and the air temperature T:
where k is the temperature coefficient, and its typical value is 0.03 [33].
In this paper, efficiency reduction η is introduced into the photoelectric conversion model to reflect the influence of dust deposition on PV panels. By combining Formula (45) with Formula (46), the photoelectric conversion model is expressed as:
5.2. Process of Ultra-Short-Term Forecast of PV Output Power
In this paper, an hourly ultra-short-term forecast method of PV output power under F-H weather is presented, the flow chart of which is shown in Figure 13.
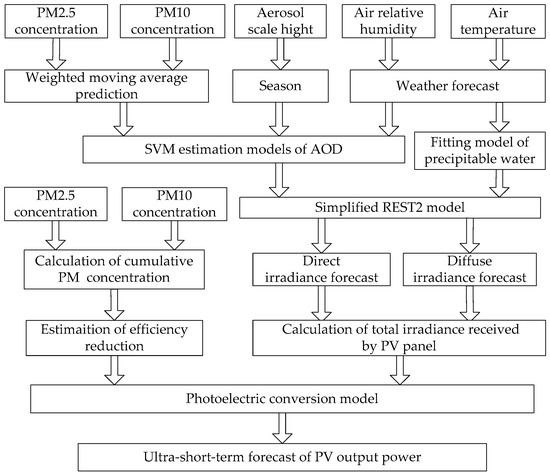
Figure 13.
Flow chart of the presented forecast method.
Above all, the predicted values of the input variables to the established SVM estimation models of AOD in next hour needed to be acquired respectively. There into, predicted values of PM2.5 concentration and PM10 concentration in the next hour were obtained using a weighted moving average method based on the real-time data released by air quality monitoring site, while predicted values of air relative humidity and air temperature were collected directly from the weather forecast result of the Accuweather Company, and predicted value of aerosol scale height was approximated to be the mean value of the current season. Then, the 440 nm band AOD and 1020 nm band AOD were estimated by SVM estimation models. Meanwhile, the precipitable water in the next hour was predicted by the linear fitting model. Secondly, the direct irradiance and diffuse irradiance were forecasted with the simplified REST2 model respectively, and the total irradiance received by the PV panel was calculated according to the arrangement conditions. Thirdly, based on the calculation of cumulative concentration of PM, the efficiency reduction of PV panels caused by dust deposition was estimated and introduced into the photoelectric conversion model, and then the forecast of PV output power in the next hour is accomplished.
6. Case Study
The effects of F-H on output power of PV panels and the presented ultra-short-term forecast method were evaluated using a 1.2 kW PV generation system on the roof platform of Automation Building in NCEPU, Baoding, of which the PV panels were arranged towards the equator and with a tilt angel of 35° to the horizontal, as shown in Figure 14, and the main specification parameters of the PV panels are shown in Table 6.
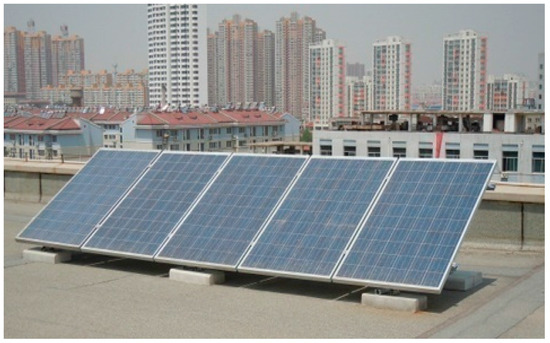
Figure 14.
PV generation system for case study.

Table 6.
Specifications of the panels of the PV generation system.
In order to conveniently analysis the effects of F-H on output power of PV panels, three cloudless days were chosen to perform the forecast experiment: (1) 14 December 2016, the daily air quality was at “good condition”, and surface of PV panels was dustless; (2) 16 December 2016, the daily air quality was at “severe pollution”, and the surface of PV panels was dustless; (3) 23 December 2016, the daily air quality was at “good condition”, and dust had naturally accumulated on the surface of PV panels since 17 December 2016. The daily air quality of Baoding from 14–23 December 2016 is shown in Table 7.

Table 7.
Daily air quality of Baoding, China, 14–23 December 2016.
Meanwhile, based on the presented forecast method, an ordinary physical forecast method was implemented for comparison by replacing the estimated AOD with season mean values of AOD (τ440 = 0.41 and τ1020 = 0.16) and ignoring the effect of dust deposition on PV panels. The hourly forecasted value and measured value of output power of the PV generation system are shown in Figure 15.

Figure 15.
Hourly forecast result of output power of the PV generation system.
It is known that because the experiment time was close to the winter solstice (21 December 2016), the solar zenith angle Z was greater, which caused the total irradiance to be weaker and the output power of the PV system to be lower. On 16 December 2016, there was typical heavy F-H weather (LAQI = 5), the PM concentration is higher, and the value of AOD was greater. Compared with 14 December 2016, of which the daily air quality was in “good condition”(LAQI = 2), the average values of measured output power and output power forecasted by the presented method decreased by 16.97% and 17.56% respectively, indicating that F-H has a significant weakening effect on solar irradiance. Meanwhile, the presented forecast method could fully reflect this weakening effect. In addition, the weakening strength on solar irradiance is related to the air mass (AM). In the morning or evening, the AM was greater; thus the F-H had more significant weakening effect on the solar irradiance. For example, on 16 December 2016, the PM concentration at 9 o’clock (CPM2.5 = 191 μg/m3 and CPM10 = 252 μg/m3) was quite close to that at 12 o’clock (CPM2.5= 206 μg/m3 and CPM10 = 256 μg/m3); nevertheless, compared with 14 December 2016, the output power of the PV generation system at 9 o’clock and 12 o’clock decreased by 38.09% and 9.91% respectively.
The PV panels were cleaned at 8 o’clock on 17 December 2016 and then dust began to naturally accumulate on their surface. After six days of serious F-H weather, on 23 December 2016, the average value of measured output power of the PV generation system decreased by 14.36% compared with that of 14 December 2016, which improves that the dust deposition could result in obviously efficiency reduction to PV panels. From 8 o’clock of 17 December 2016 to 8 o’clock of 23 December 2016, the cumulative concentration of PM2.5 and PM10 reached 44,937 μg·h/m3 and 58,183 μg·h/m3 respectively, and the efficiency reduction estimated by similar-day choosing method was 15.46%, which was quite close to the reduction of measured output power, indicating that it is reasonable to represent the dust density by cumulative PM concentration.
In terms of forecast results of the three experiment days, MRE of the presented forecast method was 11.61%, while MRE of the ordinary physical forecast method was 16.27%, which indicated that the forecast accuracy could be effectively improved when real-time estimation of AOD was introduced and the effect of dust deposition on PV panels is taken into account. According to the energy industry standards of the People’s Republic of China (NB/T 32011-2013), generally, MRE of the ultra-short-term forecast method of PV power in engineering practice should be less 15%. Therefore, the accuracy of the presented forecast method is acceptable. Because the output of PV generation is intermittent and difficult to forecast, in China, high-level penetration of the PV generation into the grid is still unrealized. In addition, in order to ensure the grid security, sometimes PV generation is forbidden to connect to the grid, which results in more power demand is supplied by thermal power units. With this background, the presented forecast method could benefit an increase in high-level penetration of PV generation into the grid, as well as the economic dispatching of the grid.
7. Conclusions
Large-scale F-H weather has frequently affected eastern China since 2012, which should be fully considered in the forecast work of PV output power. The main contribution of this paper is to present a novel ultra-short-term forecast method for PV output power under F-H weather, and the following conclusions were drawn:
- (1).
- Based on data of PM concentration released by air quality monitoring sites as well as data of other influence factors, an effective AOD estimation model was established using the BP neural network method and SVM method, by which AOD could be accurately obtained in real time, then the total irradiance received by PV panels was calculated with satisfactory accuracy by the simplified REST2 model.
- (2).
- It is feasible to represent dust density by cumulative PM concentration for convenience when analyzing the effect of dust deposition on PV panels’ conversion efficiency. Based on a sample set of “cumulative PM concentration—efficiency reduction” constructed through special measurement experiments, the efficiency reduction of PV panels under certain dust deposition state could be estimated with similar-day choosing method.
- (3).
- The case study indicates that the accuracy of the presented forecast method is satisfactory for it is able to fully reflect the dual effects of F-H on output power of the PV generation system. The forecast error is mainly derived from the error of AOD of as well as the error of estimated efficiency reduction, thus the training data set for AOD and sample set of “PM cumulative concentration—PV power attenuation rate”—should be replenished to achieve better performance on AOD estimation and efficiency reduction estimation, which will be studied in later work.
- (4).
- The presented forecast method could be easily realized in practice as long as there is an air quality monitoring site near the position of the PV generation system.Therefore, it hasbroad prospectsinapplication as the number of air quality monitoring sites continue to grow.
Acknowledgments
The authors would like to acknowledge the financial support from the Beijing Natural Science Foundation (4182061).
Author Contributions
Weiliang Liu proposed the original idea and designed the experiment process. Changliang Liu and Yongjun Lin checked the results of the whole manuscript. Liangyu Ma double-checked the results and helped to improve the full manuscript. Feng Xiong and Jintuo Li performed the main research tasks and translated the original manuscript.
Conflicts of Interest
The authors declare no conflict of interest.
References
- Zhang, X.D.; Liang, J. From London to Beijing: A comparison and reflexion on smog controls in China and Britain. Frontiers 2014, 2, 52–63. [Google Scholar]
- Cheng, W.L.; Kuo, Y.C.; Lin, P.L.; Chang, K.H.; Chen, Y.S.; Lin, T.M.; Huang, R. Revised air quality index derived from an entropy function. Atmos. Environ. 2004, 38, 383–391. [Google Scholar] [CrossRef]
- Gao, Y.J.; Cheng, H.X.; Zhu, J.; Liang, H.F.; Li, P. The optimal dispatch of a power system containing virtual power plants under fog and haze weather. Sustainability 2016, 8, 71. [Google Scholar] [CrossRef]
- Raza, M.Q.; Nadarajah, M.; Ekanayake, C. On recent advances in PV output power forecast. Sol. Energy 2016, 136, 125–144. [Google Scholar] [CrossRef]
- Gao, Y.J.; Zhu, J.; Cheng, H.X.; Xue, F.S.; Xie, Q.; Li, P. Study of short-term photovoltaic power forecast based on error calibration under typical climate categories. Energies 2016, 9, 523. [Google Scholar] [CrossRef]
- Li, R.; Li, G.M. Photovoltaic power generation output forecasting based on support vector machine regression technique. Electr. Power 2008, 41, 74–78. [Google Scholar]
- Cheng, Z.; Han, L.J.; Li, S.Y.; Gong, L. Intelligent forecasting algorithm for photovoltaic power generation. Electr. Power Constr. 2014, 35, 34–39. [Google Scholar]
- Gueymard, C.A. Clear-sky irradiance predictions for solar resource mapping and large-scale applications: Improved validation methodology and detailed performance analysis of 18 broadband radiative models. Sol. Energy 2012, 86, 2145–2169. [Google Scholar] [CrossRef]
- Zhong, X.; Kleissl, J. Clear Sky Irradiances Using REST2 and MODIS. Sol. Energy 2015, 116, 144–164. [Google Scholar] [CrossRef]
- Chu, D.A.; Kaufman, Y.J.; Zibordi, G.; Chern, J.D.; Mao, J.T.; Li, C.C.; Holben, B.N. Global monitoring of air pollution over land from the Earth Observing System-Terra Moderate Resolution Imaging Spectroradiometer (MODIS). J. Geophys. Res. 2003, 108. [Google Scholar] [CrossRef]
- Liu, Y.; Franklin, M.; Kahn, R.; Koutrakis, P. Using aerosol optical thickness to predict ground-level PM2.5, concentrations in the St. Louis area: A comparison between MISR and MODIS. Remote Sens. Environ. 2007, 107, 33–44. [Google Scholar] [CrossRef]
- Koelemeijer, R.; Homan, C.; Matthijsen, J. Comparison of spatial and temporal variations of aerosol optical thickness and particulate matter over Europe. Atmos. Environ. 2006, 40, 5304–5315. [Google Scholar] [CrossRef]
- Guo, J.P.; Wu, Y.R.; Zhang, X.Y.; Li, X.W. Estimation of PM2.5 over eastern China from MODIS aerosol optical depth using the back propagation neural network. Chin. J. Environ. Sci. 2013, 34, 817–825. [Google Scholar]
- Semaoui, S.; Arab, A.H.; Boudjelthi, E.K.; Bacha, S.; Zeraia, H. Dust effect on optical transmittance of photovoltaic module glazing in a desert region. Energy Procedia 2015, 74, 1347–1357. [Google Scholar] [CrossRef]
- Mastekbayeva, G.A.; Kumar, S. Effect of dust on the transmittance of low density polyethylene glazing in a tropical climate. Sol. Energy 2000, 68, 135–141. [Google Scholar] [CrossRef]
- Garg, H.P. Effect of dirt on transparent covers in flat-plate solar energy collectors. Sol. Energy 1974, 15, 299–302. [Google Scholar] [CrossRef]
- Sayigh, A.A.M.; Jandal, S.A.; Ahmed, H. Dust effect on solar flat surfaces devices in Kuwait. In Proceedings of the Workshop on the Physics of Nonconventional Energy Sources and Materials Science for Energy, Trieste, Italy, 2–20 September 1985; pp. 353–367. [Google Scholar]
- Kaldellis, J.K.; Kapsali, M. Simulating the dust effect on the energy performance of photovoltaic generators based on experimental measurements. Energy 2011, 36, 5154–5161. [Google Scholar] [CrossRef]
- Klugmann-Radziemska, E. Degradation of electrical performance of a crystalline photovoltaic module due to dust deposition in northern Poland. Renew. Energy 2015, 78, 418–426. [Google Scholar] [CrossRef]
- Jiang, H.; Lu, L.; Sun, K. Experimental investigation of the impact of airborne dust deposition on the performance of solar photovoltaic (PV) modules. Atmos. Environ. 2011, 45, 4299–4304. [Google Scholar] [CrossRef]
- Ju, F.L. Study on the Effect of Photovoltaic Power Generation Project by Dust. Master’s Thesis, Chongqing University, Chongqing, China, 2010. (In Chinese). [Google Scholar]
- Ångström, A. The parameters of atmospheric turbidity. Tellus 1964, 16, 64–75. [Google Scholar] [CrossRef]
- Kasten, F. Visibility forecast in the phase of pre-condensation. Tellus 1969, 21, 631–635. [Google Scholar] [CrossRef]
- Kotchenruther, R.A.; Hobbs, P.V. Humidification factors of aerosols from biomass burning in Brazil. J. Geophys. Res. 1998, 103, 32081–32089. [Google Scholar] [CrossRef]
- Kotchenruther, R.A.; Hobbs, P.V.; Hegg, D.A. Humidification factors for atmospheric aerosols off the mid-Atlantic coast of the United States. J. Geophys. Res. 1999, 104, 223–2251. [Google Scholar] [CrossRef]
- Cheng, H.X.; Wang, W.; Du, W.L.; Di, L.J.; Niu, Z.N.; Wang, J.T. Simulation of temporal and spatial variations and causes of aerosol scale height in Hebei province. Res. Environ. Sci. 2015, 28, 190–197. [Google Scholar]
- Guo, Z.H.; Wu, J.; Lu, H.Y.; Wang, J.Z. A case study on a hybrid wind speed forecasting method using BP neural network. Knowl.-Based Syst. 2011, 24, 1048–1056. [Google Scholar] [CrossRef]
- Cherkassky, V.; Ma, Y. Practical selection of SVM parameters and noise estimation for SVM regression. Neural Netw. 2004, 17, 113–126. [Google Scholar] [CrossRef]
- Gueymard, C.A. Direct solar transmittance and irradiance predictions with broadband models. Part II: Validation with high-quality measurements. Sol. Energy 2003, 74, 381–395. [Google Scholar] [CrossRef]
- Gueymard, C.A. REST2: High-performance solar radiation model for cloudless-sky irradiance, illuminance, and photosynthetically active radiation—Validation with a benchmark dataset. Sol. Energy 2008, 82, 272–285. [Google Scholar] [CrossRef]
- Li, C.; Wei, H.L.; Liu, H.T.; Zhou, J. Statistics of correlation of integrated water vapor and surface vapor pressure. Geomat. Inf. Sci. Wuhan Univ. 2008, 11, 1170–1173. [Google Scholar]
- Yona, A.; Senjyu, T.; Funabashi, T. Application of recurrent neural network to short-term-ahead generating power forecasting for photovoltaic system. In Proceedings of the IEEE Power Engineering Society General Meeting, Tampa, FL, USA, 24–28 June 2007; pp. 1–6. [Google Scholar]
- Du, Y. Research on Estimation and Measurement of Solar Array Characteristics. Master’s Thesis, Hefei University of Technology, Hefei, China, 2004. (In Chinese). [Google Scholar]
© 2018 by the authors. Licensee MDPI, Basel, Switzerland. This article is an open access article distributed under the terms and conditions of the Creative Commons Attribution (CC BY) license (http://creativecommons.org/licenses/by/4.0/).