Article

Effects of Mooring Compliancy on the Mooring Forces, Power Production, and Dynamics of a Floating Wave Activated Body Energy Converter

by
Luca Martinelli
1 and
Barbara Zanuttigh
2,*
1
ICEA Department, University of Padova, via Ognissanti 39, 35129 Padova, Italy
2
DICAM, University of Bologna, viale Risorgimento 2, 40136 Bologna, Italy
*
Author to whom correspondence should be addressed.
Energies 2018, 11(12), 3535; https://doi.org/10.3390/en11123535
Submission received: 5 November 2018 / Revised: 1 December 2018 / Accepted: 8 December 2018 / Published: 19 December 2018
(This article belongs to the Section A: Sustainable Energy)

Abstract

:
The paper aims at investigating the interactions between a floating wave energy device (WEC) and its mooring system under a variety of wave conditions (regular and irregular, perpendicular and oblique, ordinary and extreme). The analyzed WEC is the DEXA, a wave activated body point absorber, of the type that performs better when aligned to the incident wave direction. Two typologies of mooring systems were studied: for limited depths, the spread system, with a disposition of the lines that do not constrain the yaw movements; for large depths, the catenary anchor leg mooring (CALM) system. The spread system was experimentally investigated, including a realistic power take-off system, to capture non-linear behaviors and assess device motions, power production, and forces on mooring lines. The CALM system was numerically simulated, as mooring modelling is more reliable in deep waters and allows testing of a number of different configurations, by changing the number of the mooring lines and the mooring layout. The experiments showed that a reduction of the mooring compliancy increases the power production. The numerical simulations showed that a redundancy on the number of chains allows a better distribution of the loads, with advantages on reliability and costs.

1. Introduction

Moorings of wave energy converters (WECs) play a key role for the success and commercialization of floating WECs. They affect WECs operation in terms of efficiency of energy conversion, their global cost (including maintenance and installation) is quite relevant [1,2] and, more importantly, only their reliable design can assure the device survivability under extremes. It is worth mentioning that a failure of the mooring in the demonstration phase is likely to hinder the development process of a WEC.
The mooring system for offshore WECs should comply with many requirements [3]. Basically, it must keep the WEC on station within specified tolerances under normal operating load and extreme storm load conditions [4], avoiding tension loads in the electrical transmission cables. It must be sufficiently compliant to reduce the forces acting on anchors, and minimize adverse effects on the power capture ([5,6,7,8]). The system layout should also optimize the density of WECs placed in a farm or in multi-use installations ([9]).
There are still research gaps in the design of WECs moorings, in order to achieve an accurate set-up of standards. The work by [10] and [11] pointed out the need of verifying the influence of the moorings on the hydrodynamic loading on the structure as well as on the power extraction capabilities. In Reference [12], they compared three mooring configurations for floating, motion-independent WECs, showing that use of synthetic rope and variations in the mooring configuration has the potential of influencing the cost significantly. Reference [7] suggested to analysis beginning the very initial stages of design the influence of the mooring system on the WEC motions.
The aim of this contribution is to investigate, propose, and discuss two mooring schemes of WECs, suited to an array disposition in shallow and deep waters, and analyses the effects of mooring compliancy and the concept of redundancy, with reference to the requirements described above.
To this purpose, the adopted methodology is an integration between the experimental and the numerical modelling. The laboratory tests are the best available tool to investigate shallow water effects, due to the large non-linearities in these conditions. However, some constraints are posed on the values of the extreme wave heights and on the range of obliquities. Numerical simulations are quite reliable in deep waters ([13]) and they can be used instead of the physical models with the purpose of testing more configurations at lower costs.
In this work, the analyzed device is the DEXA ([14]), a floating wave activated body device formed by two hinged pontoons. Its development is now abandoned for reasons that cannot be ascribed to the validity of the patented concept. Recently, a hinged-two-module WEC was studied in [15] and [16]. The DEXA has been studied by the authors through similar (although different) physical model studies with the purpose of optimizing its design for installation in arrays ([6]) and of improving its performance and the possible beneficial effects in terms of coastal protection ([14,17]).
In the laboratory, the DEXA device was moored with a spread system. The mooring compliancy was studied by changing the pretension of the chains. The power take-off (PTO) was simulated by a resistive (i.e., dissipative) mechanism. The spread system is frequently the most economical solution but it is only suited in shallow waters and when the incident wave direction is limited to a narrow range, since the allowable weathervaning (i.e., re-orientation of the WEC with wave obliquity), obtained by a proper layout of the lines, is limited.
The numerical approach analyzed three alternative CALM mooring layouts in deep water conditions, with different degree of redundancy, i.e., a different number of chains and with the inclusion of one or two auxiliary buoys. CALM systems are the most suitable solution to allow for weathervaning over a wide range of wave directions. Since no actual PTO was numerically modeled, the effects of the mooring compliancy on power production are only indirectly evaluated considering the overall device dynamics.
The structure of the paper is as follows. Section 2 describes the experimental set-up including the facility, the device geometry, the mooring system, the tested regular and irregular wave conditions and the performed measurements. Section 3 presents the experimental results in terms of mooring forces, power production and device movements for different mooring compliancy. Section 4 presents a brief description of the numerical code and the numerical results in terms of mooring forces and principal movements for different mooring layouts, leading to the selection of the preferred one, also based on cost considerations. Finally, conclusions are drawn in Section 5.

2. The Experimental Set-Up

2.1. Wave Basin

The experimental activities were performed in the old directional wave basin of Aalborg University ([14]). The wave basin was 12.0 m long (in waves direction), 17.8 m wide, and 1.0 m deep. The basin width was such that it limited the wave reflection from the lateral walls.
The waves were generated through a snake-front piston type paddle system with 25 actuators. The software used for the wavemaker control was the “AwaSys” developed by the Aalborg laboratory ([18]) and it is able to generate regular and irregular long and short crest waves.
A dissipative beach made of concrete and gravel with D50 = 0.02 m was placed opposite to the wave maker, whereas the sidewalls were made of crates filled with stones (each being 1.2 × 1.2 × 0.70 m).
The basin depth, paddle stroke and devices for wave absorption at the sides affect the combination of the maximum feasible water depths and wave heights to be tested. Water depth was set at 0.45 m.

2.2. Wave Energy Converter

The WEC under investigation is a floating device belonging to the Wave Activated Body type. For this kind of device, the mooring system is of significant importance, because its stiffness should not limit the dynamic device response, but at the same time it has to react to extreme conditions and/or sea level rise.
Specifically, the device is the DEXA developed by DEXAWAVE AS, that unfortunately closed in 2012 for insufficient funding. The device consists of two rigid pontoons with a hinge in between, which allows each pontoon to pivot in relation to the other (see Figure 1). The relative pitch between the two pontoons activates the PTO system, based on a low-pressure power transmission technology, placed close to the center of the system, i.e., in correspondence of the device hinge. The draft is such that the free water surface at rest passes in correspondence of the axis of the pontoons.

2.3. Models

Two similar devices were built in 1:60 scale and deployed in the basin. The scale selection was the results of the realistic prototype dimensions, the basin size and the climate at the future possible installation site.
Each model was 0.96 m long (l) and 0.38 m wide (b), perpendicularly to the direction of wave propagation. The mass was approximately 4.0 kg. As the prototype, the laboratory model was composed by two parts connected with a rigid hinge. In the model, each part consisted of three cylindrical floaters and two cylindrical connections (see Figure 2). The cylindrical floaters have a diameter of 0.06 m, and the front float is 0.12 m wide. The two pontoons are separated by a gap of 0.04 m.
In order to represent the array layout, the two models were placed at the same distance from the wave-maker (3.60 m), to assure a complete wave propagation between the wave-maker and the devices even under extreme wave conditions.
Their mutual long-shore distance (2.38 m) was set to the minimum according to the chosen mooring system, i.e., a spread mooring (for the definition, see [3]) with four steel chains.
The mooring configuration was selected with the aim of assuring device keeping minimizing the marine space and the costs.
The initial chain pre-tension level was varied to evaluate the effect of mooring system compliancy on the overall device response, in particular on the power production.
Three pre-tension levels were investigated, by slightly moving the position of the anchor. The length of the chain lying on the seabed (LC) varied from 2.0 m (equal to the 80% of the total chain length, pretension of 1 N), to 1.3 m (65%, 3 N), and 1.0 m (50%, 5 N).
The chains (total length 2.5 m, weight per unit length of 0.2 kg/m) diverged in plan of 28° (front) and 17° (rear) from the main longitudinal axis. Since the front line diverged more than the rear ones, they provided a larger reaction to the oblique loads. The different angle is such that the front and rear lines virtual intersection is placed in the front pontoon, and this allowed some degree of weathervaning. As described in other similar experiments ([6,14,17]), the device tended to significantly re-orient under oblique waves with respect to the incoming wave direction. The realignment with the wave direction was not perfect, so that it is expected that the conversion efficiency may not be optimal under very oblique waves, but the loss in performance is balanced by the reduced mooring cost of this system compared to other that allow for complete weathervaning.

2.4. Power Take-Off

The suitability, real efficiency and durability of the PTO associated to the original electric design is out of the scope of this paper. At full scale, the production efficiency depends on the latching control strategy ([19]) or other types of delay between the applied external force and the force acting on the generator. However, such strategies are seldom implemented in the hydraulic model testing phase (e.g., [20,21,22]), and the harvesting possibilities of the hydraulic concepts are usually measured through generic and very simple resistive type ‘dummy’ PTOs.
The dummy PTO used for the model tests was placed above the device hinge (at the middle of the device) at a known vertical distance from the model axis, and it was aligned with the device cross-shore axis. It was composed by an air piston and a displacement sensor both placed in a horizontal position (see Figure 2). The relative pitch rotation between the two pontoons (which activates the PTO) is transformed into a translational motion by two hinges placed at the air piston extremities. Since very low forces are produced, the air can be considered incompressible. The air piston clearly dissipates energy, rather than ‘converting’ it. The induced dissipation is the work done by the pressure on the air volume expelled from the piston during its oscillatory motion. It is also equal to the (measured) force applied to the cylinder multiplied by the piston advancement, which are the measured quantities.
In practice, the dummy PTO harvests, or better, ‘dissipates’, part of the convertible kinetic energy, i.e., the energy due to the relative motion of the two pontoons. If the air piston is too stiff (large PTO resistance), the relative pitch of the two pontoons is null and no energy is harvested. On the contrary, if the air piston is too compliant, then the relative pitch occurs freely, and again no fraction of the convertible kinetic energy is harvested. There is however a value of resistance that maximizes the harvested energy.
The degree of PTO torque (resistance) was optimised by varying the vertical distance between the air piston and the model axis, thus changing the ‘rotational resistance’.
This distance was increased from 0.07 m to 0.17 m by steps of 0.02 m, therefore using up to 6 different stages, named r1 to r6: the lower the distance the lower the resistance and the lower the subscript number.
The torque applied by the PTO and the relative pontoon pitch are measured in terms of a force F and a movement d, measured by a load cell and a displacement sensor as shown in Section 2.5.
The time series of the produced power PPTO is obtained as
P P T O ( t ) = ( F ( t ) + F ( t + Δ t ) 2 ) d ( t + Δ t ) d ( t ) Δ t
where:
  • Δt is the time step interval;
  • F(t), F(t + Δt) are the forces induced by the device on the PTO at the times t and t + Δt, recorded by the PTO load cell;
  • d(t), d(t + Δt) are the relative device displacement at the respective time t and t + Δt, recorded by the displacement sensor.

2.5. Measurements

In order to measure the hydrodynamics around the devices, resistive wave gauges (WGs) were placed in the basin (see Figure 3). In particular, two groups of seven WGs each were placed in the front and in the rear of one device. The position of the WGs allowed the analysis of the incoming wave direction. Reference [14] provided a reconstruction of the wave field transmitted behind the devices both in terms of directionality and of disturbance/diffraction based on seven WGs placed behind one device in long-shore direction.
The forces acting on the mooring lines were measured through load cells, the device movements were derived from two motion trackers (MTi), i.e., two miniature gyro-enhanced sensors, which provide 3D angles (roll, pitch, and yaw), 3D acceleration (in surge, sway, and heave direction), 3D rate of turn (rate gyro) and 3D earth-magnetic field data. The MTi are positioned at the bow and stern of the device (represented by the grey boxes in Figure 2).
The PTO system, described in Section 2.4 (see also Figure 2) was equipped with a specific load cell measuring the load on the air piston and a LVDT displacement meter measuring the excursion of the cylinder, and therefore providing an extremely accurate measure of the relative pitch of the two pontoons.
All the data were simultaneously logged at 100 Hz. An analogic low pass filtered was used only for the load cells, with cut-off frequency of 50 Hz.
The load cells, the PTO and the MTi were deployed on the device placed closer to the basin centre. Further details on the experimental layouts and results are available in [23].

2.6. Wave States

The two models were tested under several regular and irregular, perpendicular, and oblique wave states (WSs). Two main sets of WSs were chosen; the first set of 10 regular waves (RWs) was used to determine the best PTO resistance, and the second set of 11 irregular waves (IRs) was selected to assess the combined performance of energy conversion, movements, and moorings under typical operative conditions.
All the RWs, described in Table 1 with reference to the prototype scale, have a wave steepness of 3%. The 3D short-crested IRs, described in Table 2, were reproduced with Jonswap spectrum with a peak enhancement factor of 3.3 and a spreading angle of 14.7°.
Perpendicular extreme WSs and oblique ordinary WSs (with the exception of WS1) were performed for one selected mooring pre-tension level. In particular, two different wave obliquities (i.e., 10° and 20°) were generated exploiting the wave-maker directional capabilities (i.e., no change in the position of the device or generator).
For all the WSs, the water depth was equal to 0.45 m, the maximum water depth allowed in the basin, i.e., 27 m in full scale. In case of extreme WSs (WSs from no. 7 to no. 11) a high percentage of breaking waves was observed. The actual duration of the regular tests was 5 min. For the irregular tests, a 30-min duration allowed for the generation of a number of waves ranging from 1000 to 2500 waves, depending on the specific mean wave period of the WS.

3. Experimental Results: Moorings in Shallow Water

This section presents the results in terms of power production, device movements, and mooring forces, focusing on the effects of different mooring pre-tension levels.
The results are relative to ordinary and/or extreme WSs. In the latter case, no information on power production is available, and the PTO is considered to be in safe mode.
The WSs are here described by three main variables: PW, θ, and l/LP, where PW is the incident wave power per unit width, θ is the main wave direction and l/LP is the ratio between the device length and the peak wave length. PW is selected as it is very relevant for power production and summarizes the effect of wave height and period. The choice of l/LP was suggested by previous studies ([14,23]) showing that the parameter l/LP affects the overall device behavior, in terms of hydrodynamics, power production, moorings. In fact, the device design length l should be tuned to the local wave climate.

3.1. Power Performance Optimization

The purpose of this subsection is to select the PTO resistance r and the mooring pre-tension level LC that maximize the average power production PPTO under regular wave conditions. This investigation is a very common step for R&D of WECs.
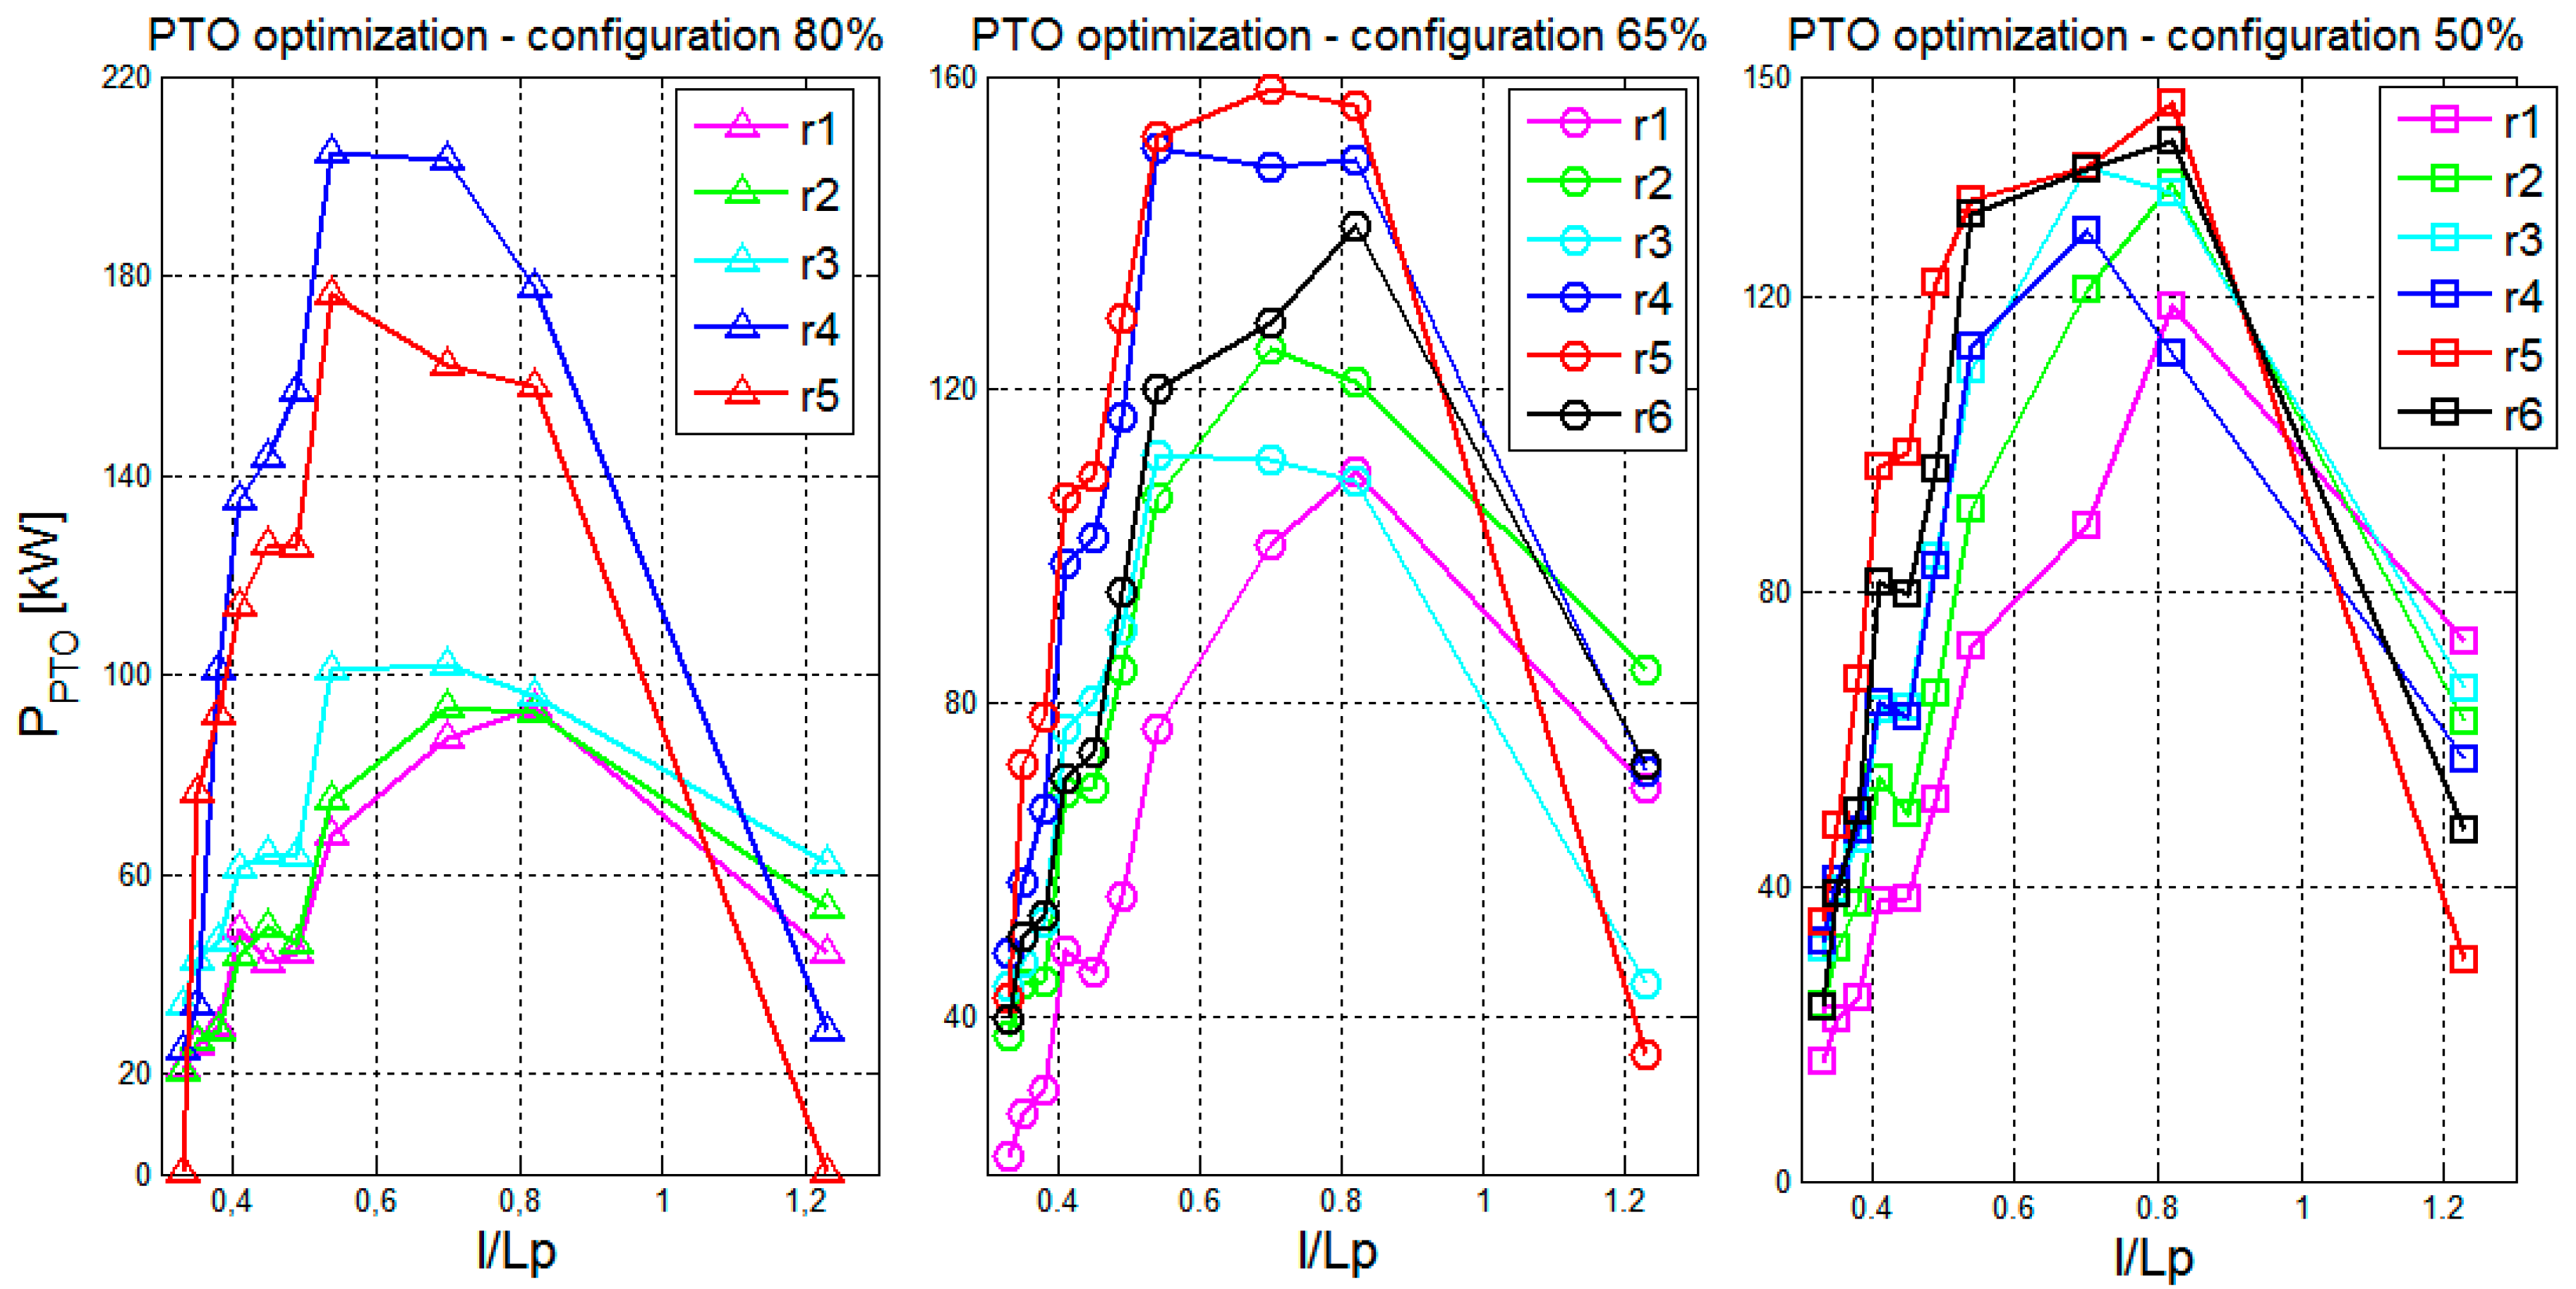
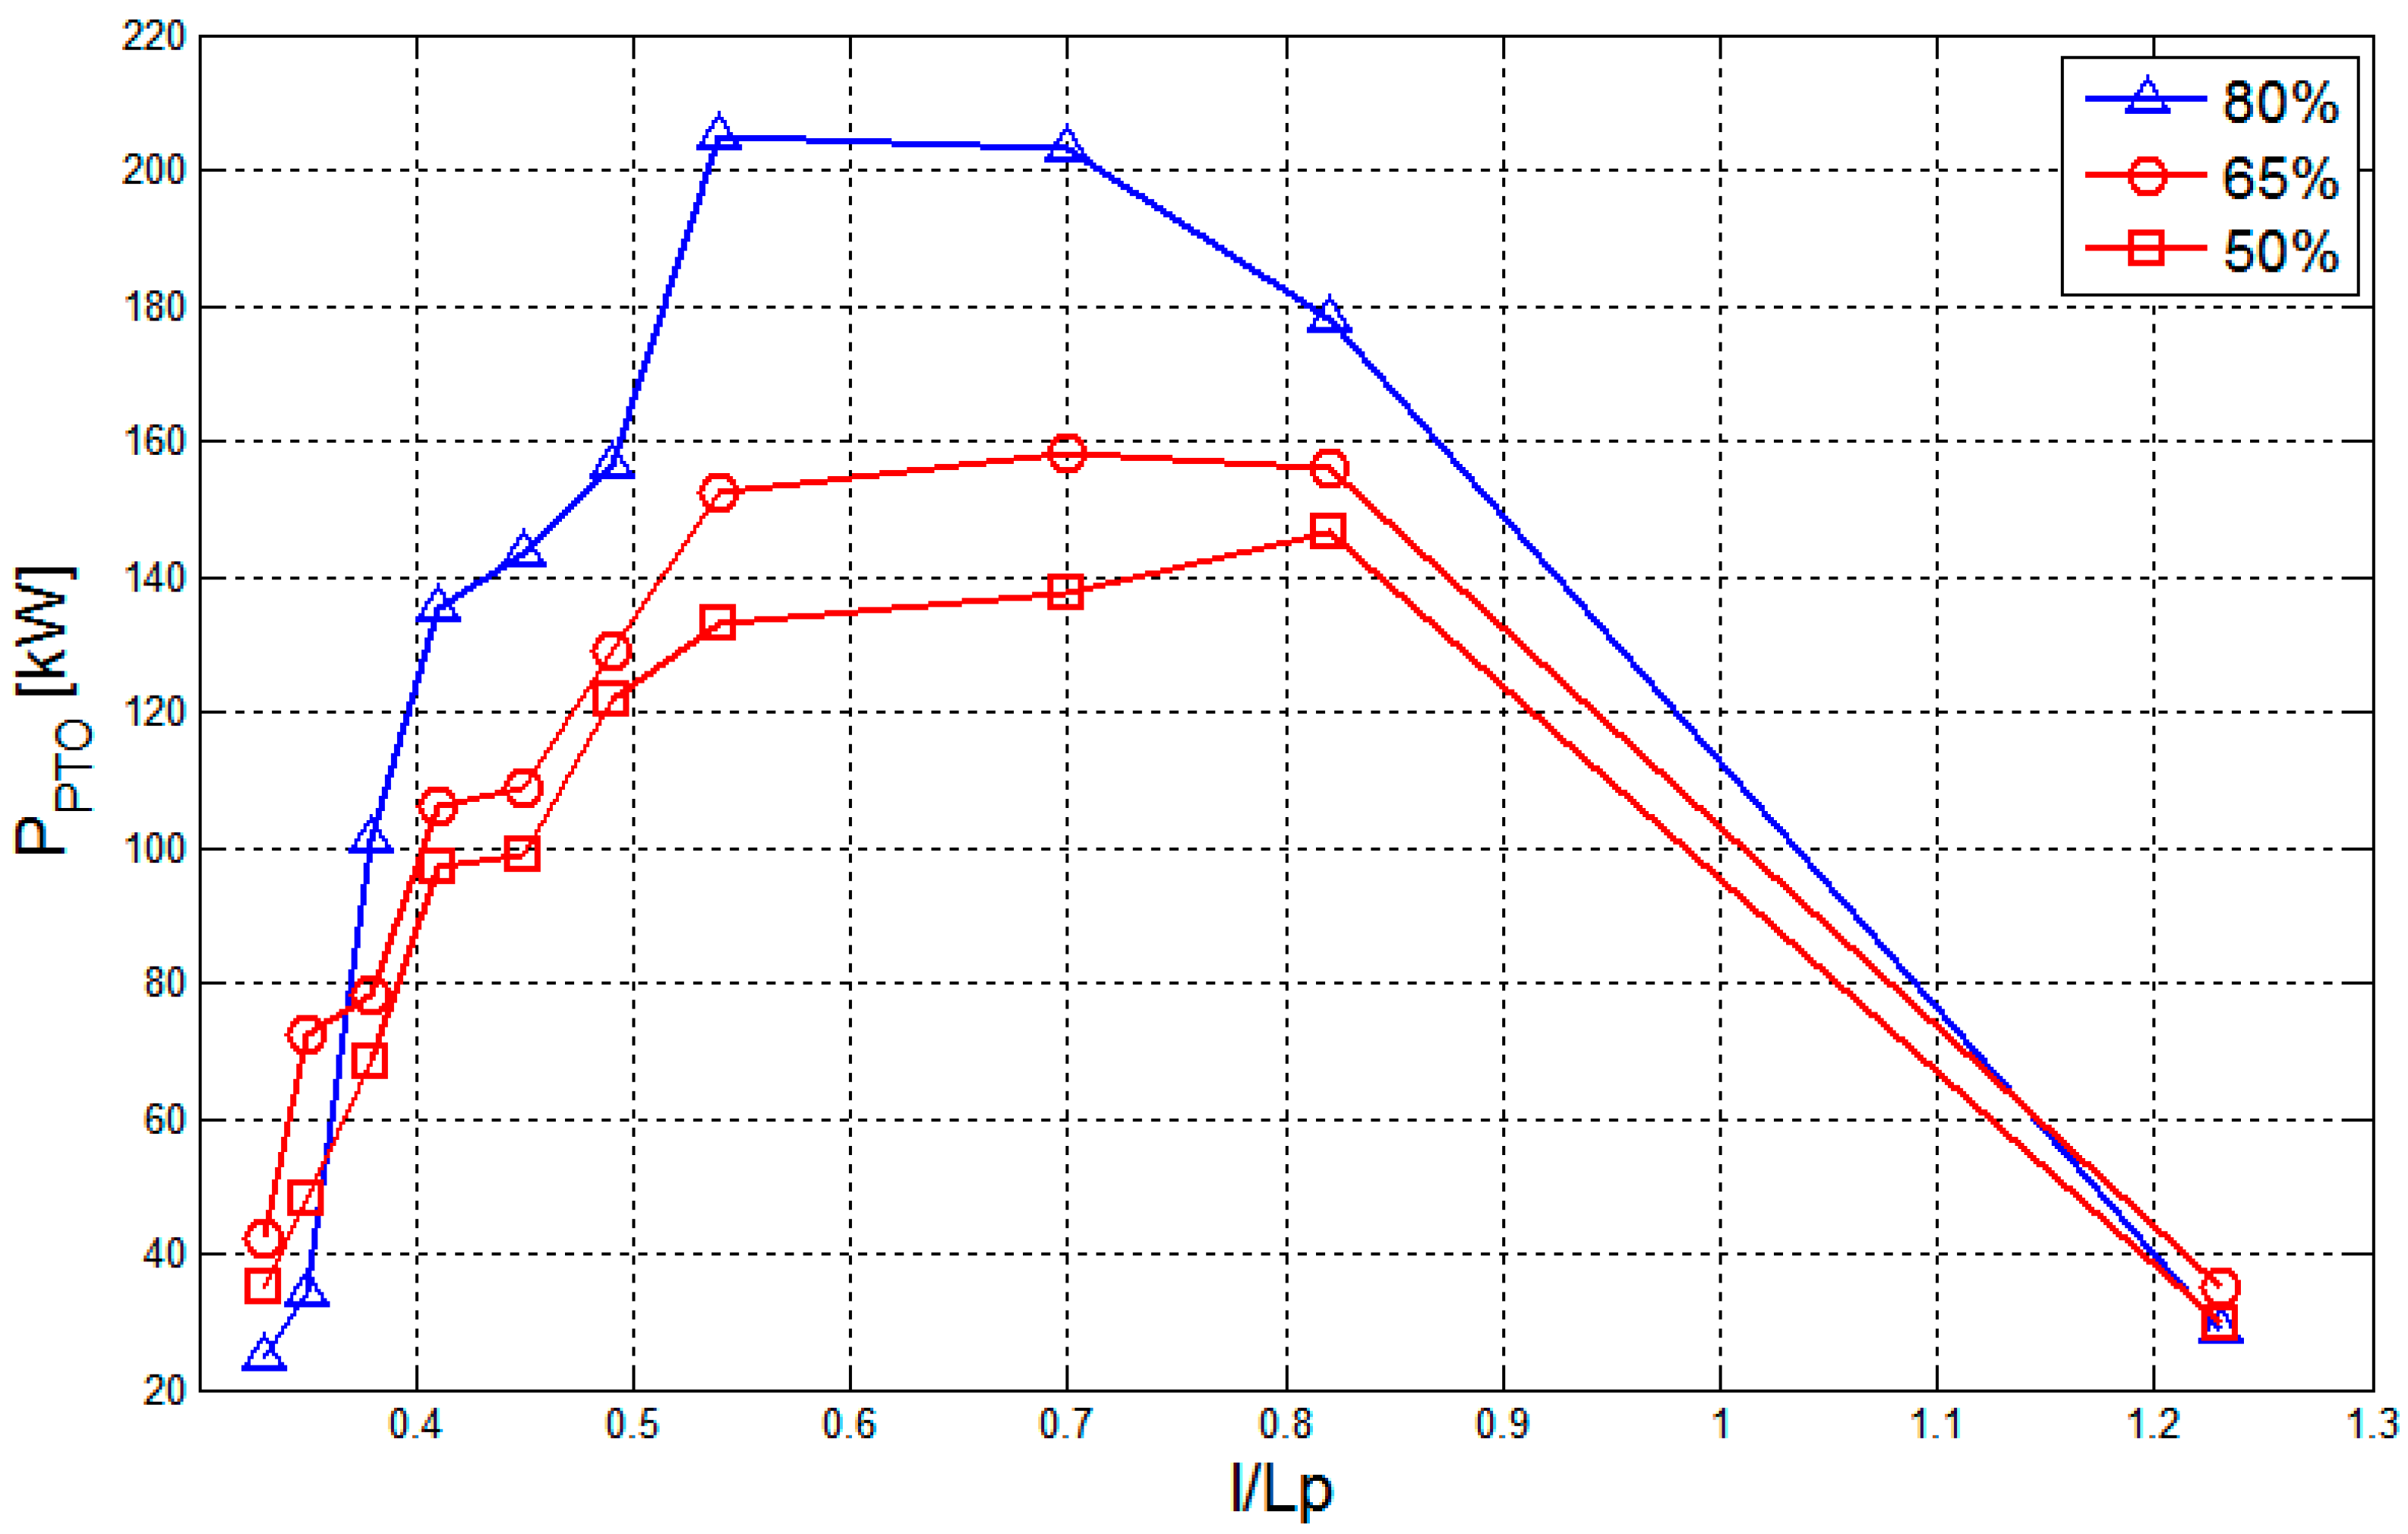
Figure 4 shows the wave averaged power production at prototype scale PPTO (obtained using Equation 1), vs the tested values of l/LP, for waves given in Table 1. Since the 10 RWs are characterized by variable height and constant steepness, the higher and more energetic waves are longer, so that PW decreases with l/LP. The three sub-plots of Figure 4 refer to the three different LC and include the tests carried out for all the PTO settings (r1 up to r6).
PPTO increases rather monotonically by increasing the PTO resistance up to a certain resistance value, either r4 or r5, somewhat lower than the maximum, and then decreases. More precisely, the best PTO configurations correspond to r4 for LC = 80% (i.e., vertical distance of 0.13 m), and to the r5 (i.e., vertical distance of 0.15 m) for both LC = 65% and LC = 50%. For the slack configuration (LC = 80%) the overall PPTO increases of 2.4 times from the lower to the best resistance.
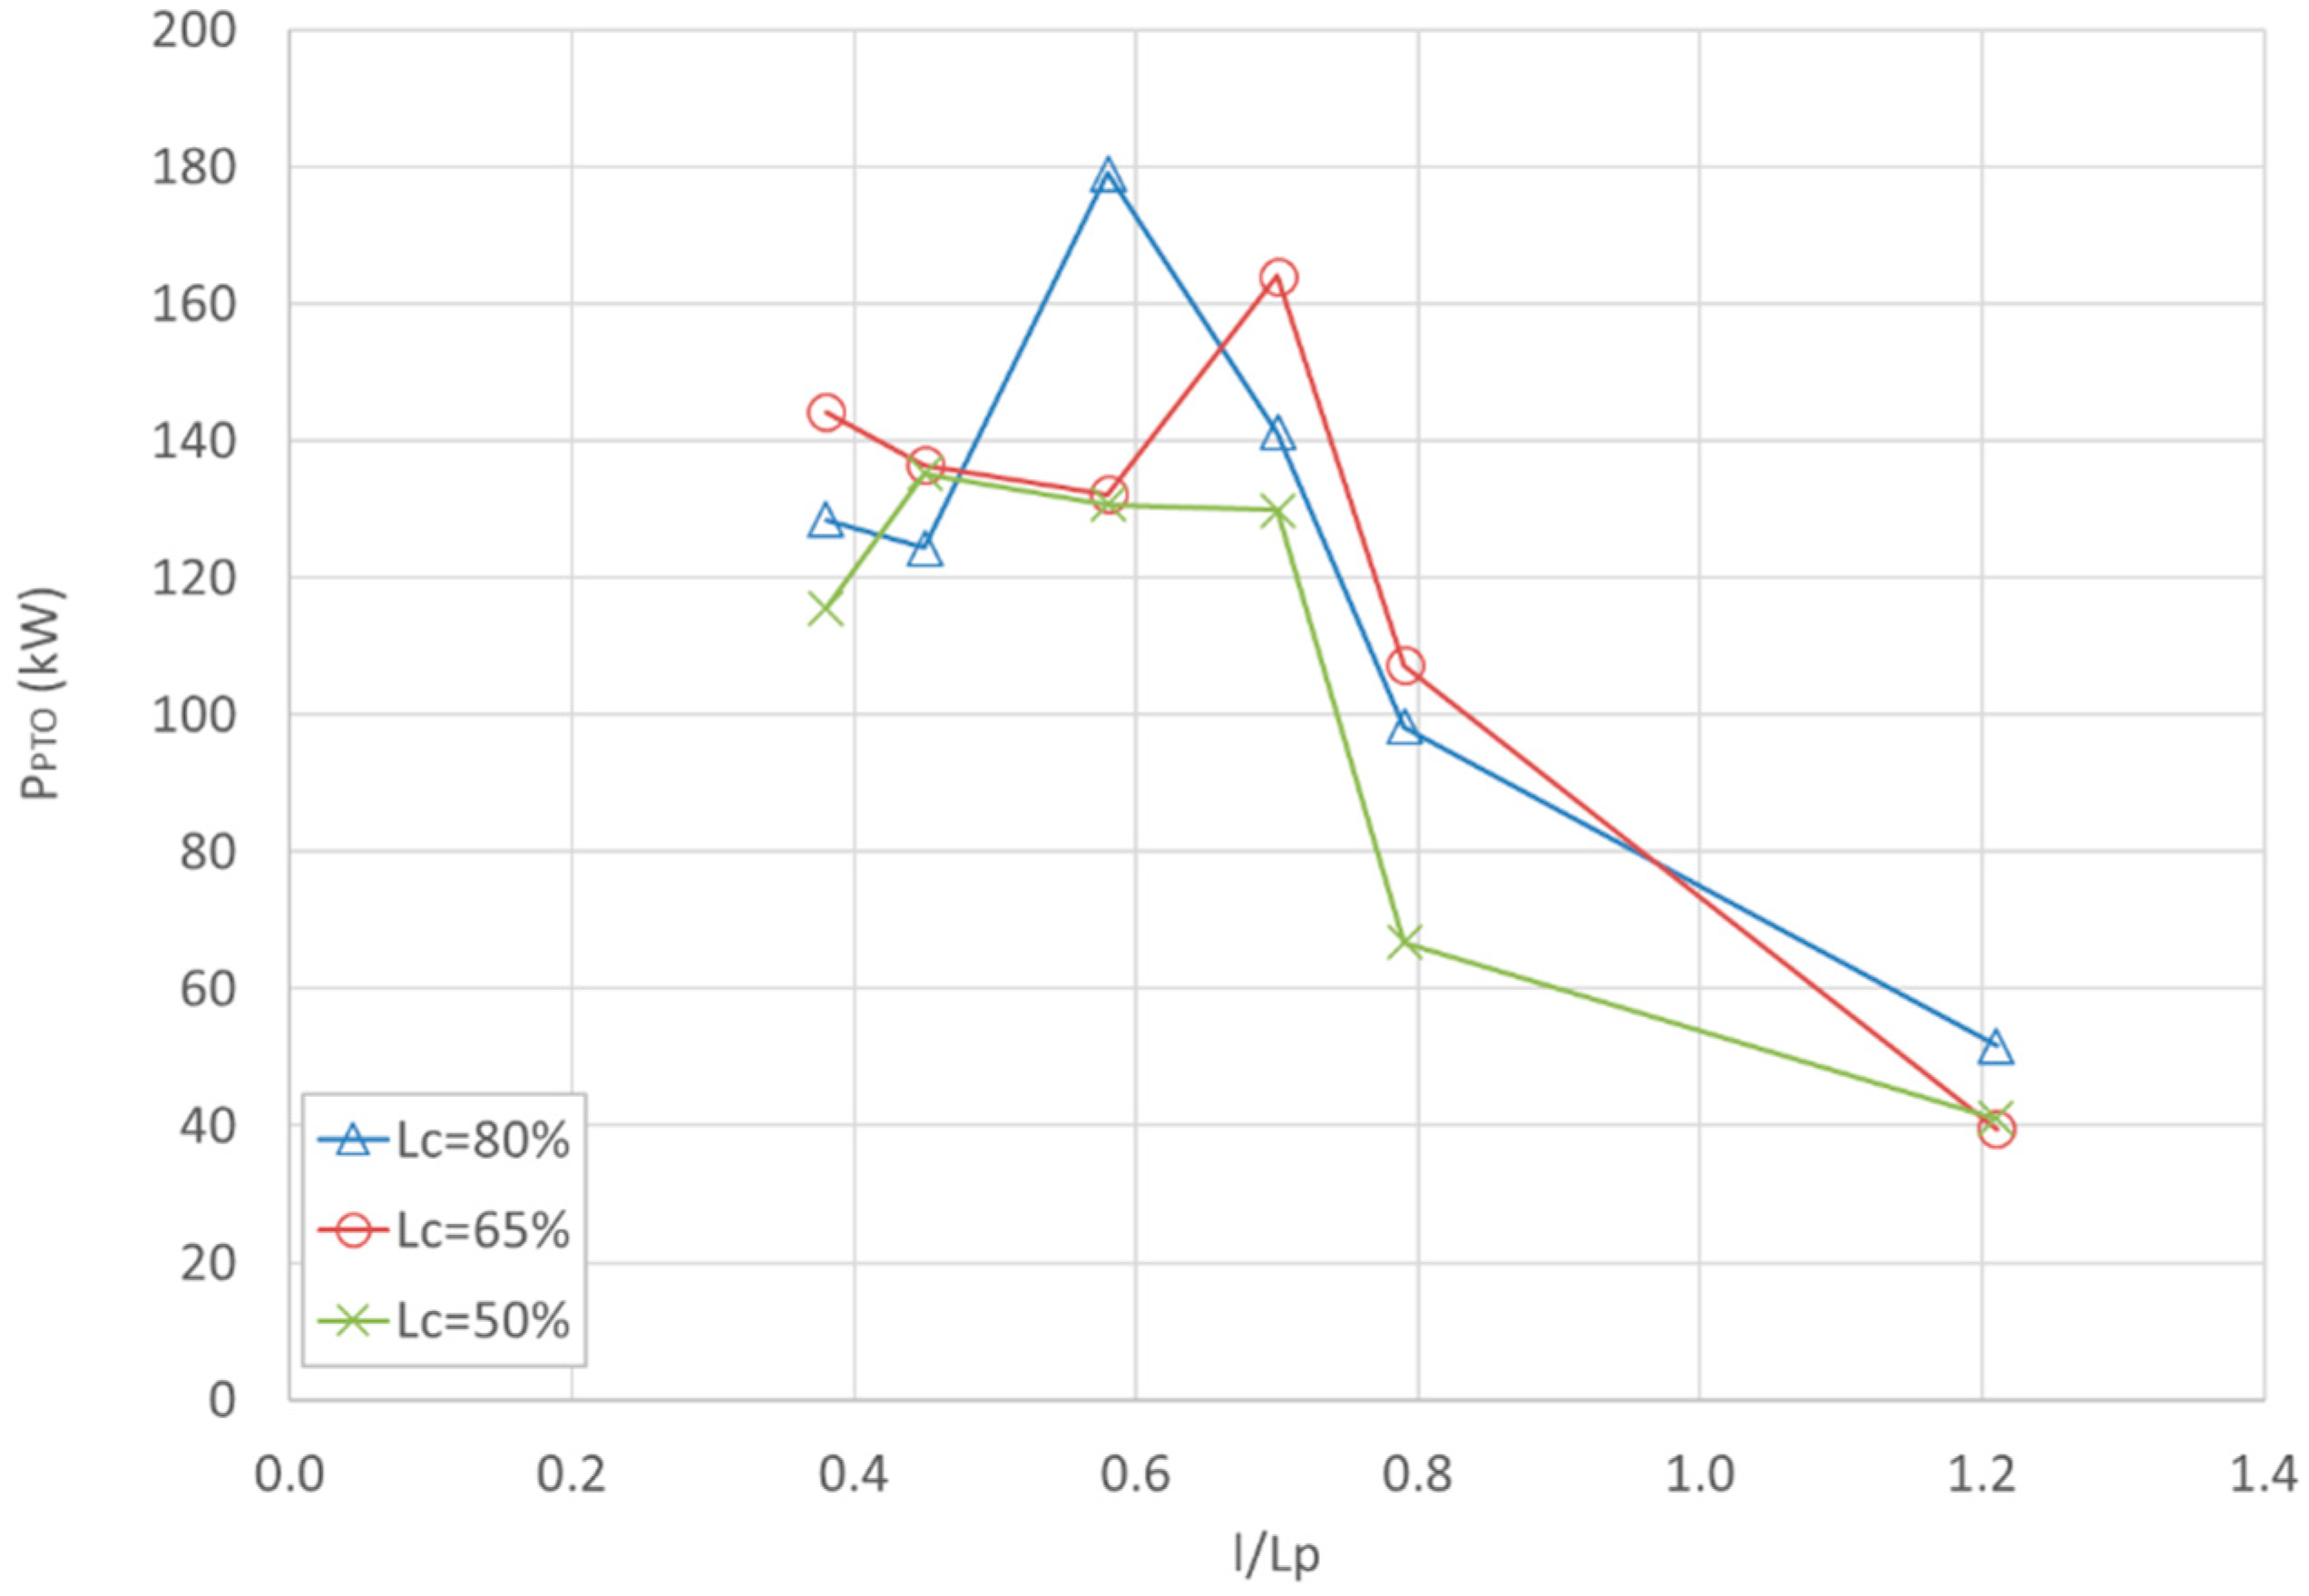
Figure 5 compares the trends of the PPTO for each value of LC (80%, 65%, and 50%) associated to the optimal r-value (r4, r5, and r5, respectively). The figure shows that PPTO is mooring dependent, being the highest PPTO values relative to the slack configuration (i.e., LC = 80%) for the more energetic RWs. The mooring pre-tension level significantly affects the power production.

3.2. Power Production under Irregular Waves

The main goal of this subsection is to evaluate if the conclusions on the optimal value of r and Lc, drawn under regular waves, can be extended to ordinary irregular (IR) waves. This type of investigation is not common for the R&D of WECs, since it is very time consuming. In order to reduce the number of tests, and since under extremes the PTO is usually set in safe mode, only ordinary WSs (see Table 2) are considered in this analysis.
Figure 6 shows the PPTO at prototype scale as function of l/LP (as in Figure 5). It may be observed that the slack configuration leads to the highest power production performance. The production decreases for waves longer than approximately 100 m (i.e., periods larger than 8 s), which suggests that the designed device is suited to mild wave climates. Note that all irregular waves have a steepness in the range 2.5% to 4%.
The highest value of PPTO around 167 kW may appear too small to justify even the costs of the electrical connections from the device to the shore. Economically feasible installations for DEXA are array schemes [24], or possibly installations in combination with wind turbines ([25,26]) or co-location with other economic activities ([9]).
By assuming—for sake of simplicity—the same probability of occurrence of each WS, the power production decreases—by increasing the mooring pre-tension level—of 6% for LC = 65% and of 16% for LC = 50% compared to LC = 80%. Regardless of LC, the sets of PPTO show high values when l/LP < 0.70.
In order to find the optimal range of operation, the efficiency η instead of the total power production is investigated. The values of η are derived as the ratio between PPTO and the value of the available wave power PW, based on the expressions
P W = ρ g H s 2 16 c g b
η = P P T O P W
where ρ is the water density; g is the gravity acceleration; cg is the wave group celerity, function of the depth h equal (at full scale) to 27 m and of the energetic wave period Te ≈ 0.9 T
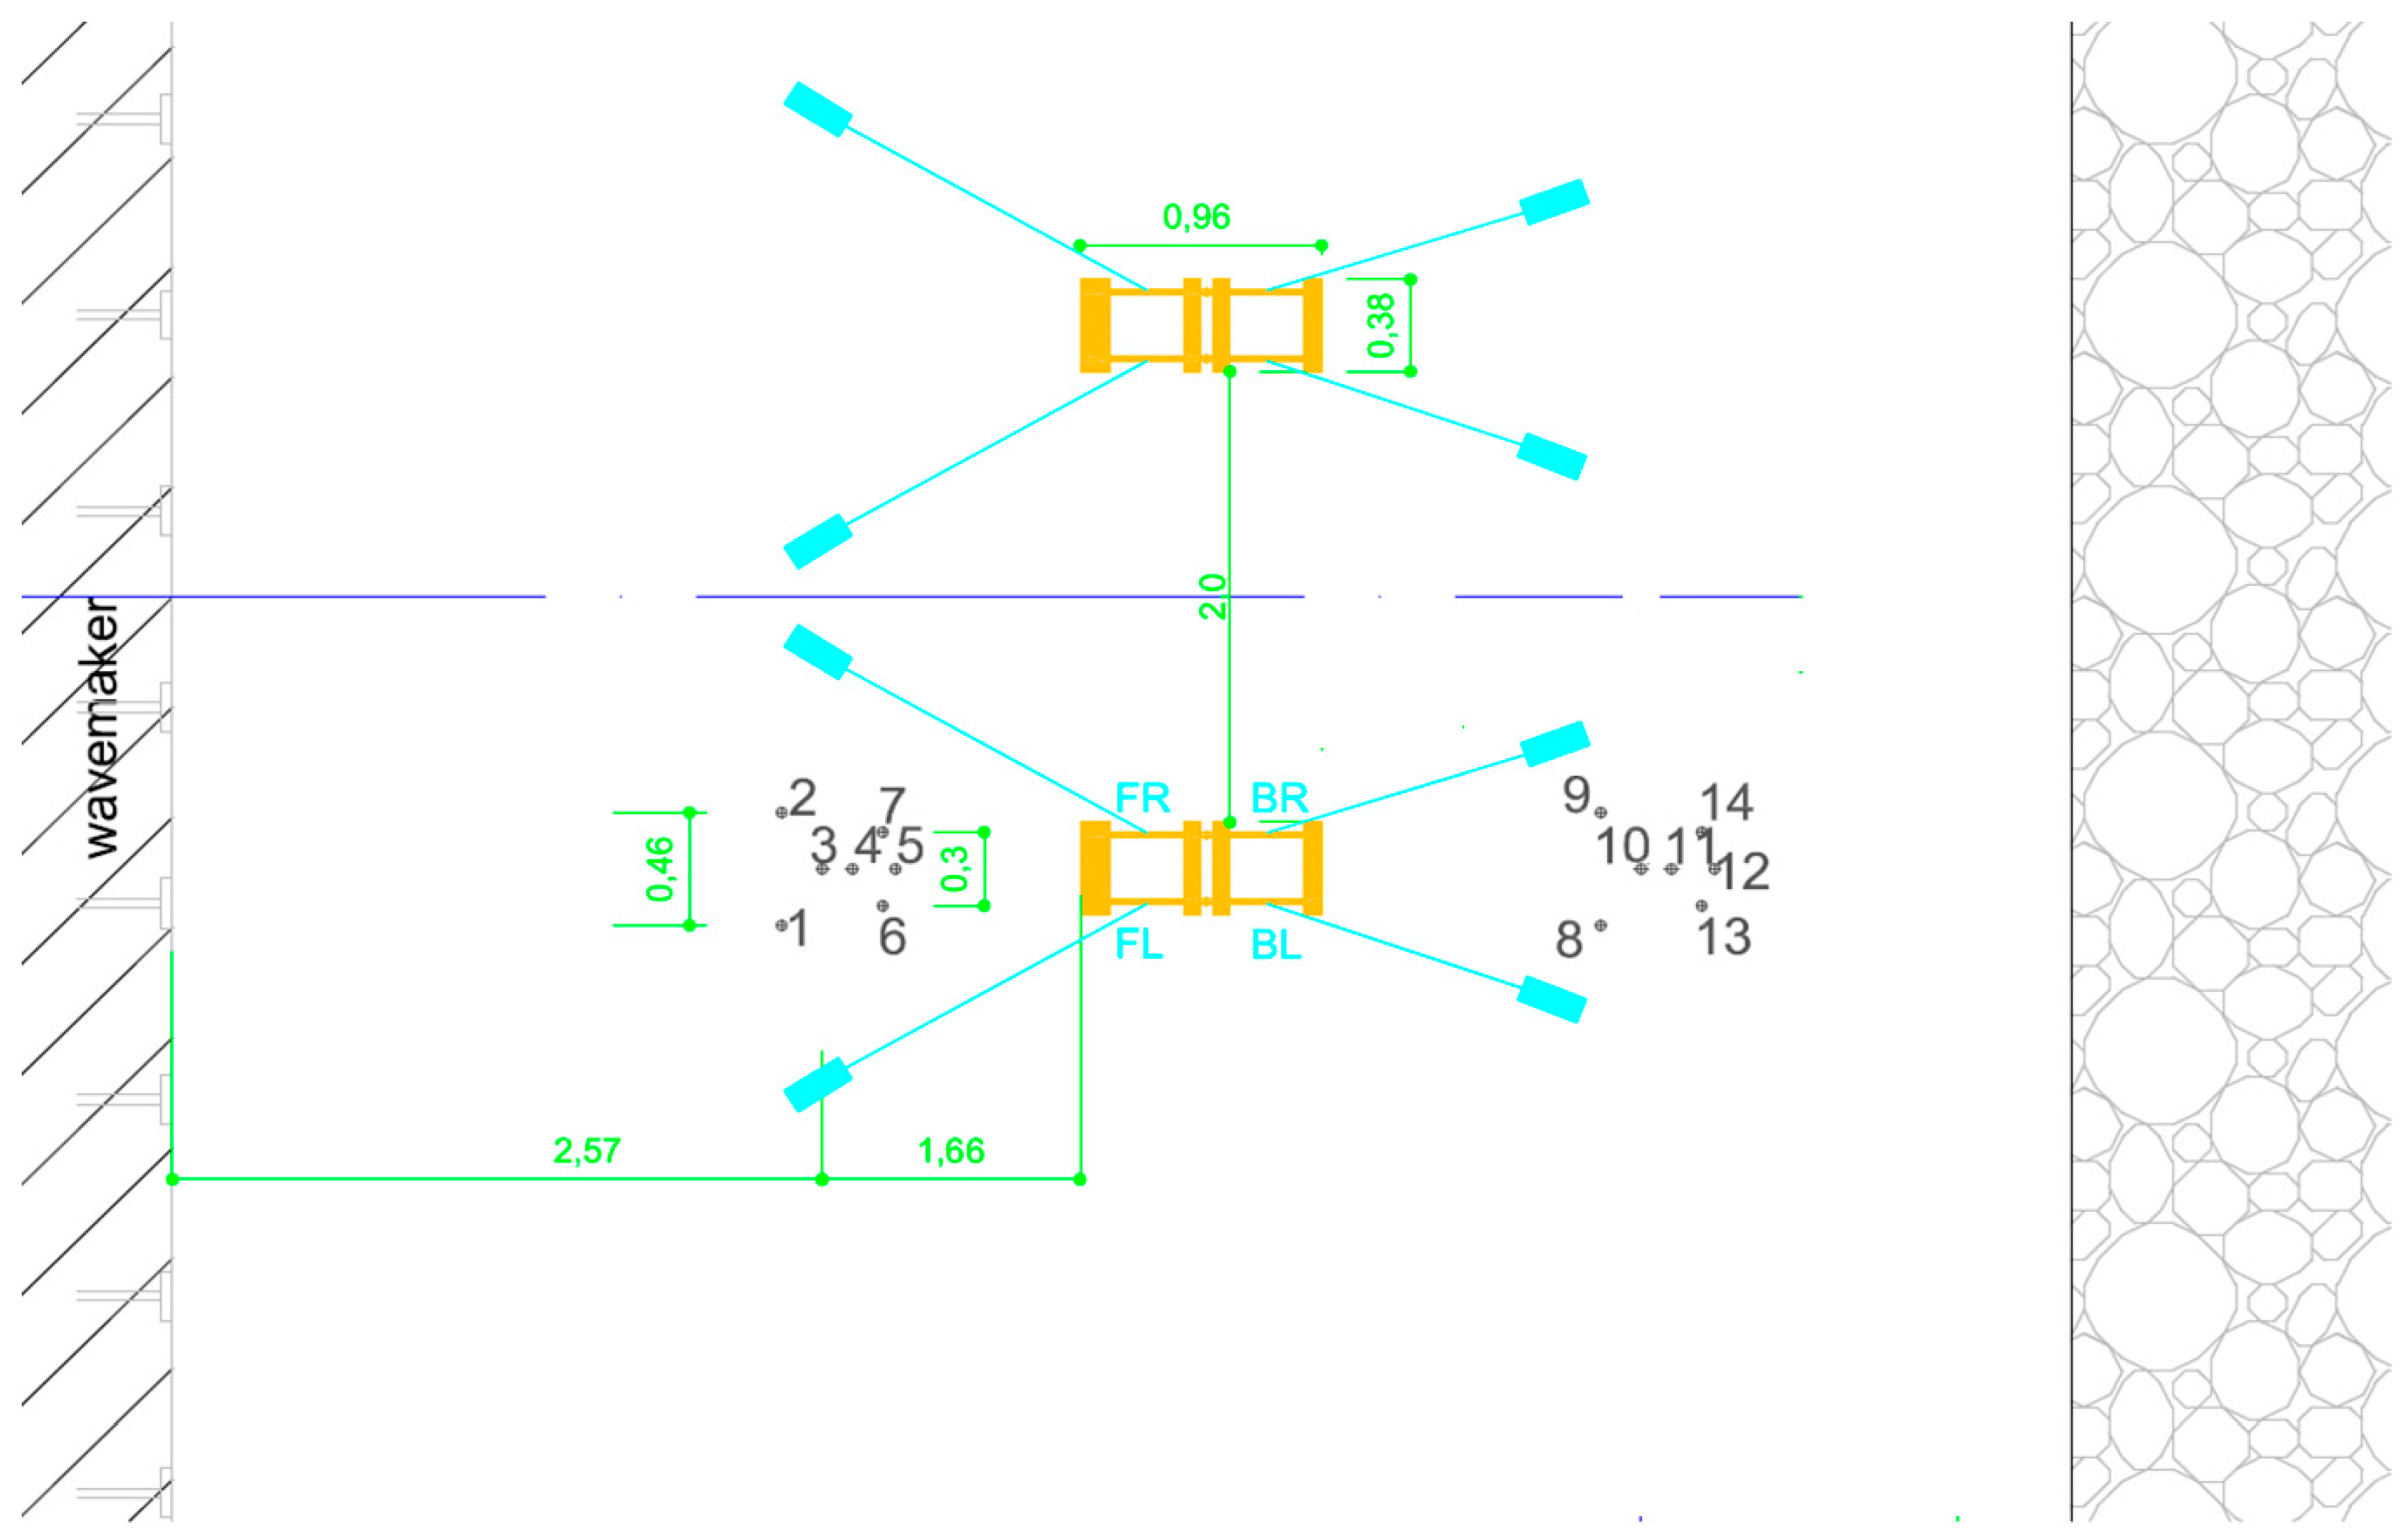
p; b is the device width, equal to 22.8 m. The values of HS and Tp were derived—for each WG—through a zero-down crossing analysis. In Equation (2), the average values of HS and TP recorded at the first seven WGs were considered (see Figure 3).
The efficiency can be described by a different non-dimensional quantity, given by the product of k and CW, where k is the wave number and CW is the capture width (also termed capture length, [27]), i.e., the ratio between the power output and the density of power flux of the incident wave front.
Table 3 synthesizes the values of PPTO, PW, and η for the three values of LC. The dependence of η on l/LP for the three LC shows pretty well marked peaks around l/LP = 0.80 or greater (see Table 3). This result highlights the correlation between the device dimensions and the climate at the site of installation, hence the device length l should be approximately equal to the typical wave length LP to maximize η. Due to the negative correlation with LP, this device seems ideal for areas with short fetch rather than oceanic wave climates.
For LC = 80%, the trends of η under oblique WSs are similar to the case of perpendicular waves, i.e., with peaks around l/LP = 0.80. The effects of different wave obliquities seem to be limited, however η tends to decrease for the largest value of β, confirming the need to design the mooring system to allow an easy device re-orientation to the incoming waves (see Table 3).
The results under regular WSs are confirmed, i.e., the most efficient mooring condition corresponds to LC = 80% and the best PTO setting is r4.

3.3. Device Movements

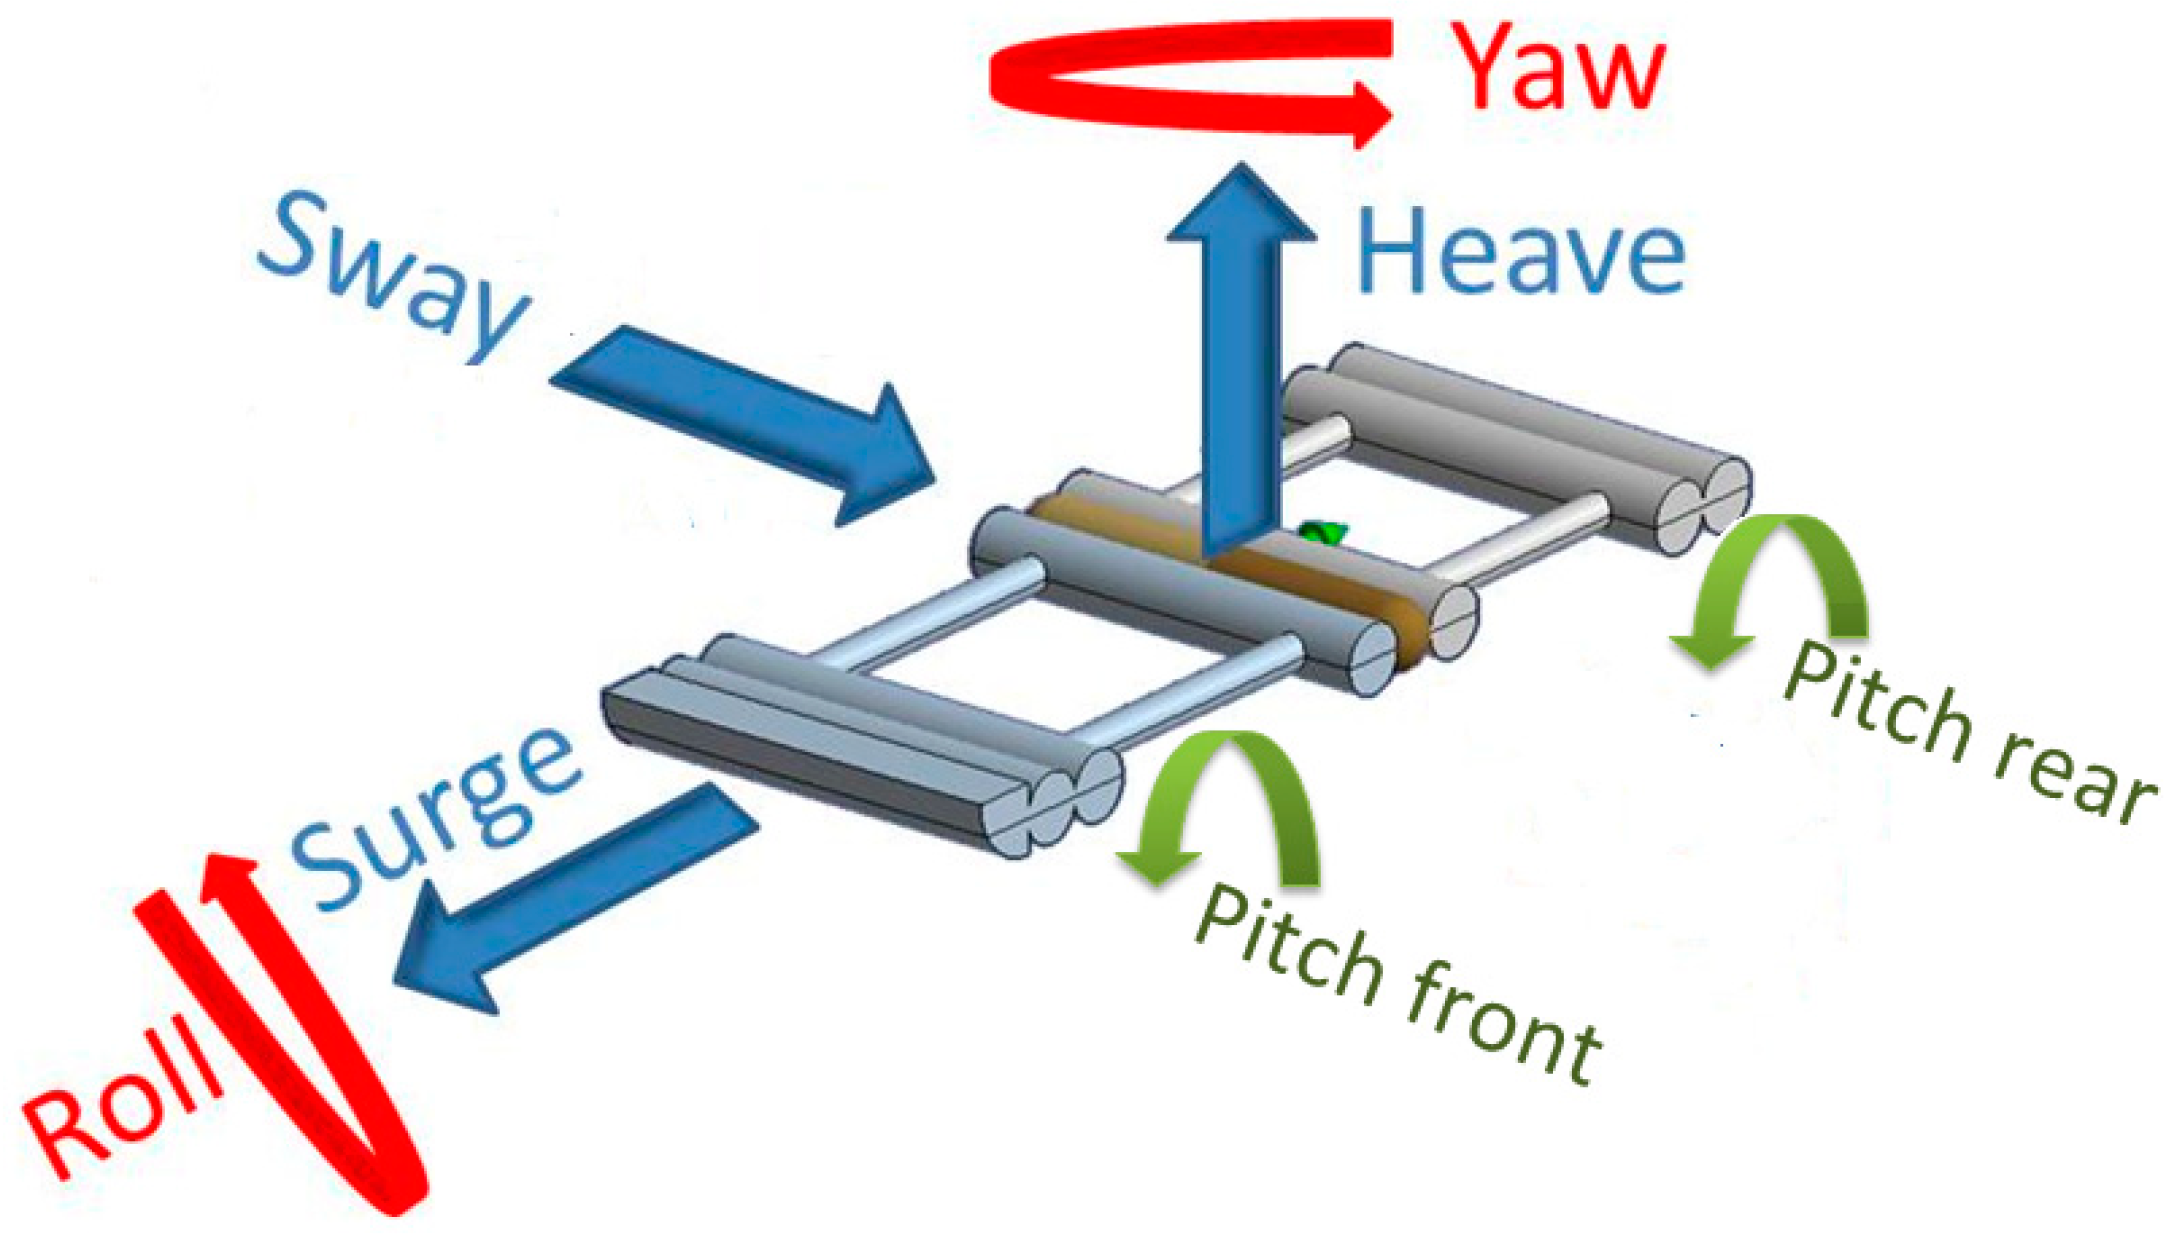
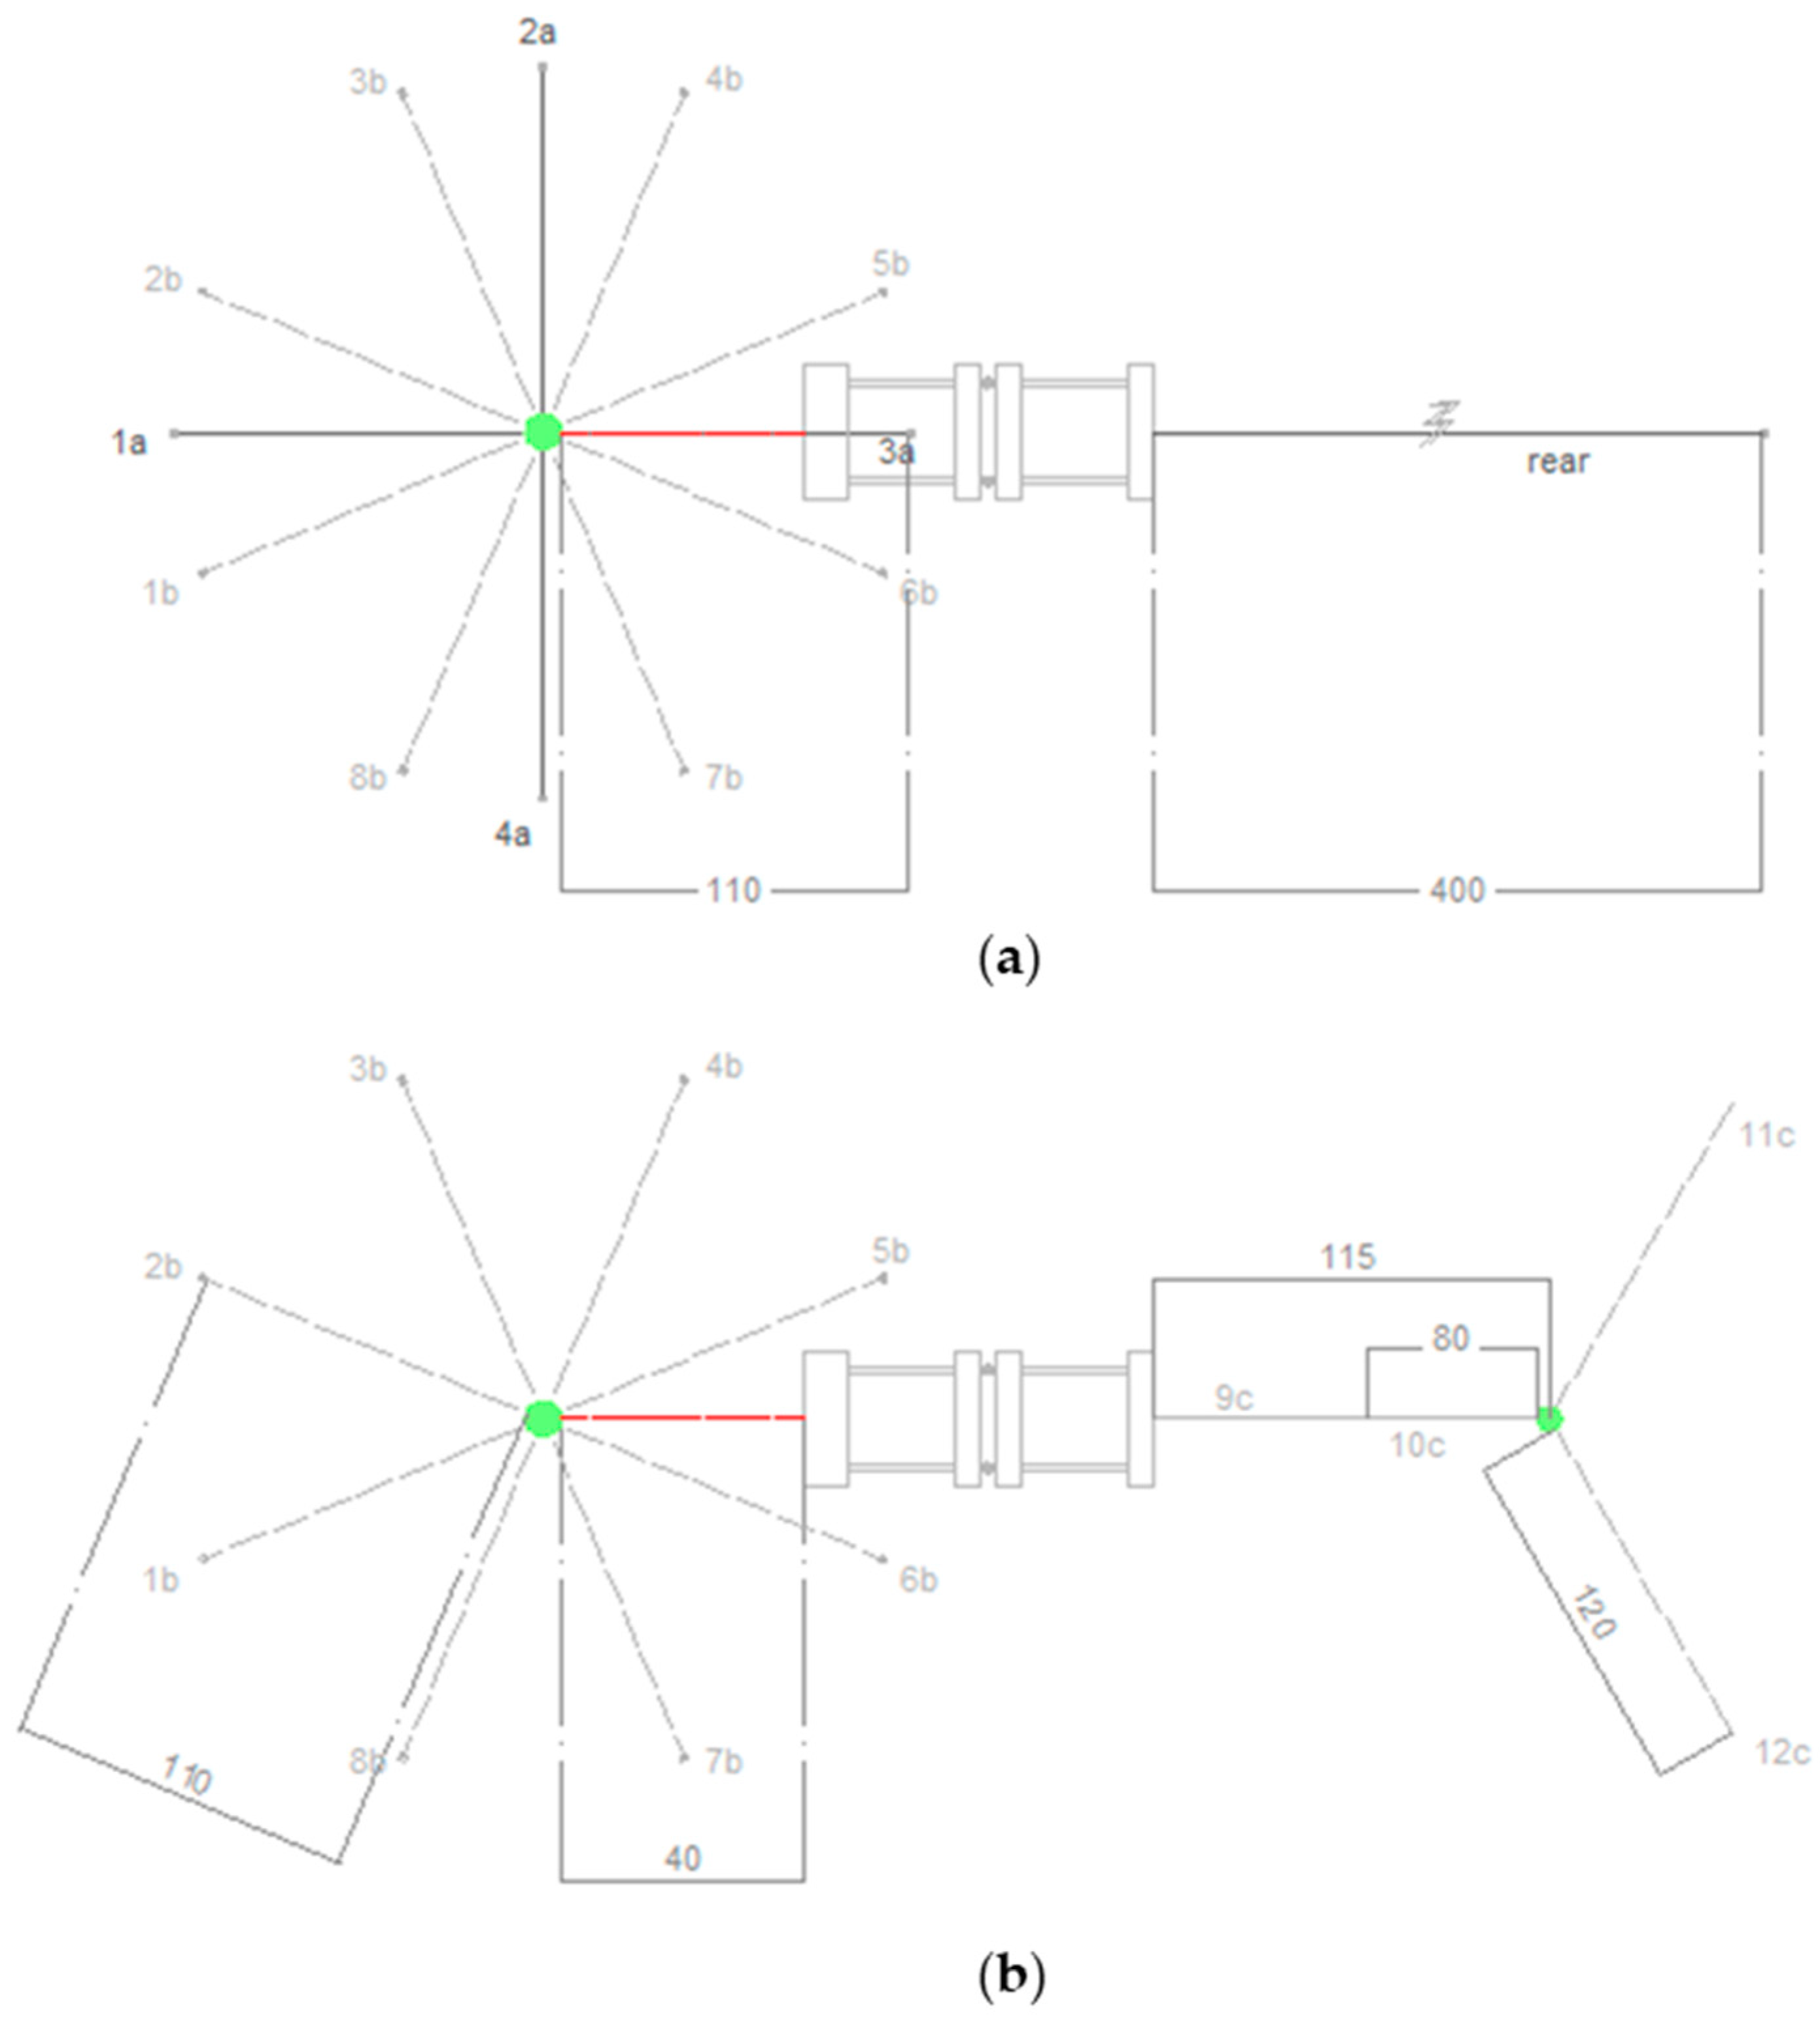
The possible degrees of freedom (DoF) of the device under analysis are 7 (see Figure 7), i.e., one more than the 6 canonical DoF of a rigid body, since the two pontoons have a separate pitch motion (that activates the PTO system). In order to give a physically relevant information, the pitch of the front and rear pontoons are described through their average and their difference (named relative pitch in the following).
In order to derive the device movements, the following steps were undertaken:
  • double integration of the MTi signals to obtain positions from accelerations;
  • high-pass filter of the obtained position signals, to remove the linear and eventually second order terms caused by the double integration procedure;
  • transposition of the signal from the local to a fixed coordinate system (centered at the hinge position);
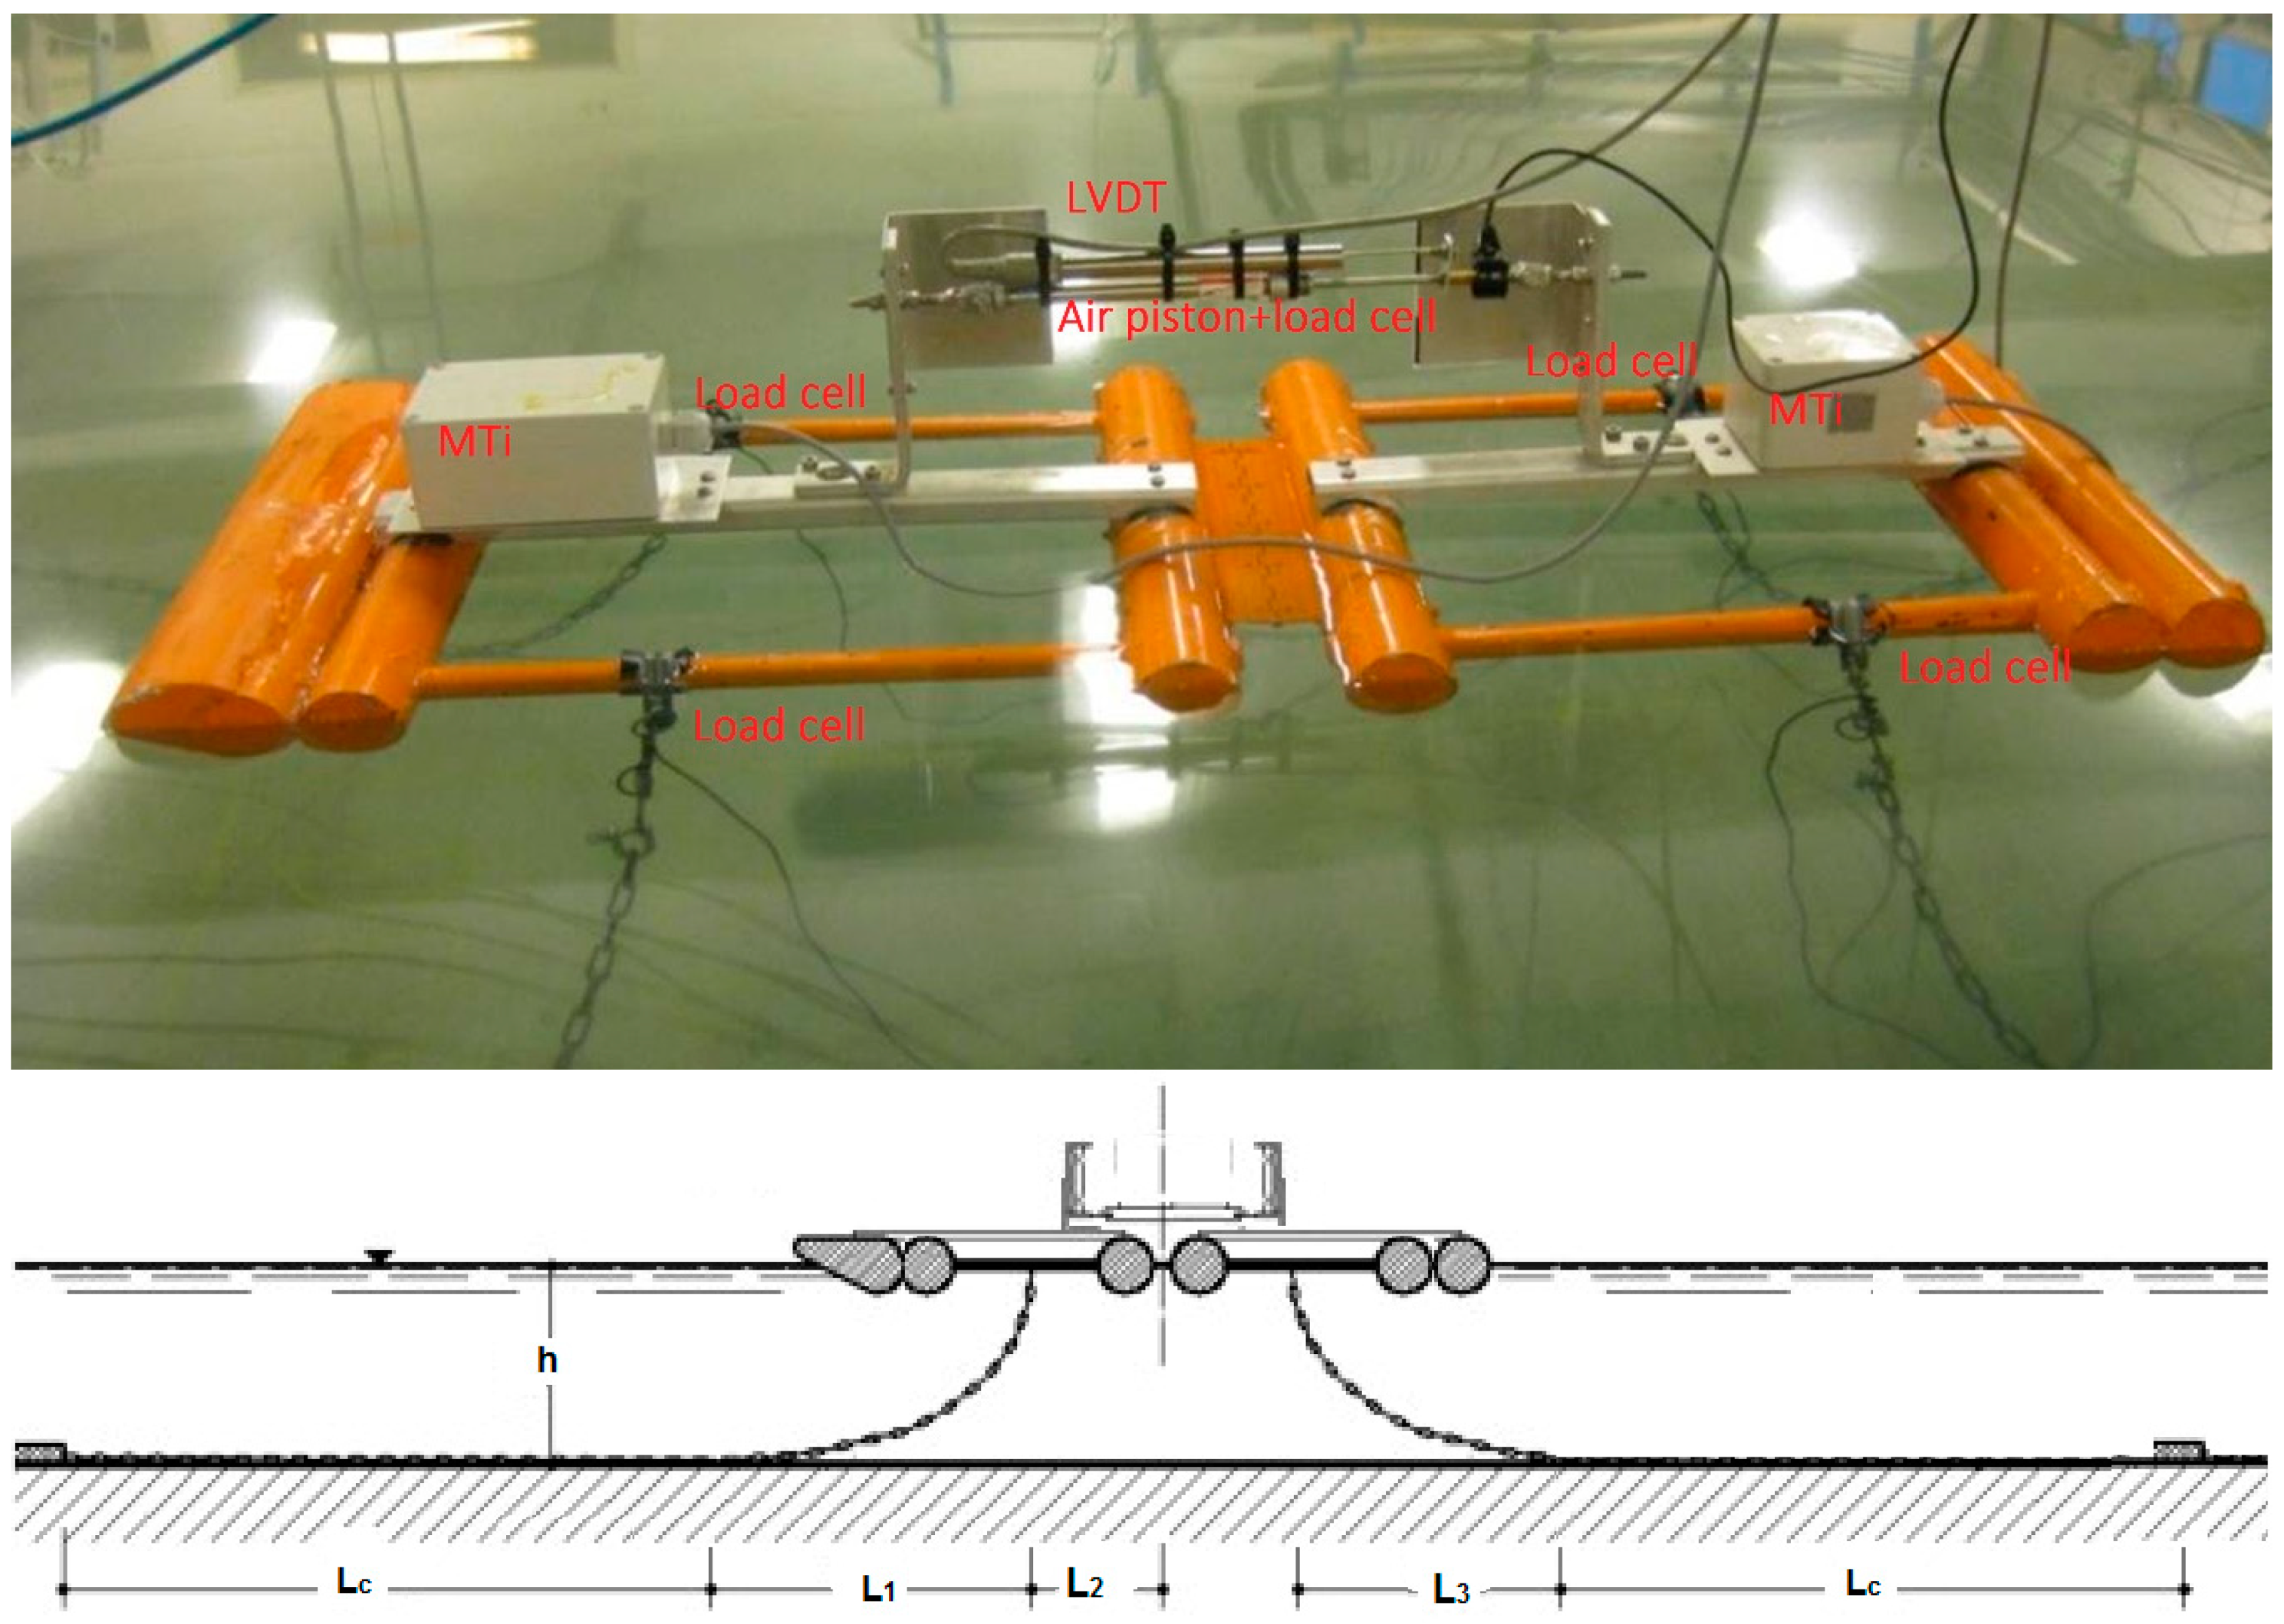
  • analysis of the LVDT placed on the PTO, in order to derive the time series of the relative pitch angle between the pontoons. Actually, the same information can be obtained as the instantaneous difference between the pitch signals of the two MTi placed on the two pontoons of the same device (see Figure 2). The obtained relative pitch was not as accurate as the LVDT output and therefore the latter was preferred.
The amplitudes of the oscillations were derived from a zero-down crossing analysis of the MTi signals. The two MTi signals (front and rear pontoons) were averaged. Table 4 shows the amplitude statistics for 5 degrees of freedom in terms of the mean of the 10% higher values, for each perpendicular ordinary WS and for the three LC.
The amplitudes in general tend to increase with increasing HS and to decrease with increasing l/LP. For l/LP = 1.21 both translations and rotations have the minimum value and appear to be substantially independent from LC.
The amplitude of the movements (surge, sway, heave) depend on LC and on l/LP. In particular, the pretension level LC has a large influence on the movements for small wavelength, i.e., l/LP < 0.70.
For large l/LP < 0.70, and when the mooring is slack, the device easily rides the waves and it has a significant vertical motion (i.e., high heave values), whereas if the mooring is taut the horizontal component is more relevant (i.e., high surge values).
The sway oscillations are significantly limited compared to the heave and surge movements, proving that the mooring system is effective in keeping the device position. This result is important for marine spatial planning issues and/or possible collisions between closer devices, because it leads to higher device density, i.e., lower marine occupied space for the same number of devices.
The rotations are also mooring dependent (see Table 4). In particular, yaw movements tend to decrease with decreasing LC, whereas the roll movements are larger for the intermediate pretension level LC.
All the movements tend to decrease by decreasing HS, i.e., increasing l/LP, with the exception of the roll that is almost constant. Roll appears to depend on the plan layout of the chains and on the rigidity to this degree of freedom.
Table 5 summarizes the translations by varying the wave obliquity β for the same LC = 80%. All the translations tend to increase by increasing β especially for higher WSs (i.e., l/LP < 0.5). The effects of β are more evident for the sway motion, i.e., the greater β the greater the motion, regardless of the l/LP values.
The pitch movements are extremely affected by the PTO setting. For very loose PTO resistance, the device is very mobile, and the opposite occurs for stiff resistances. 
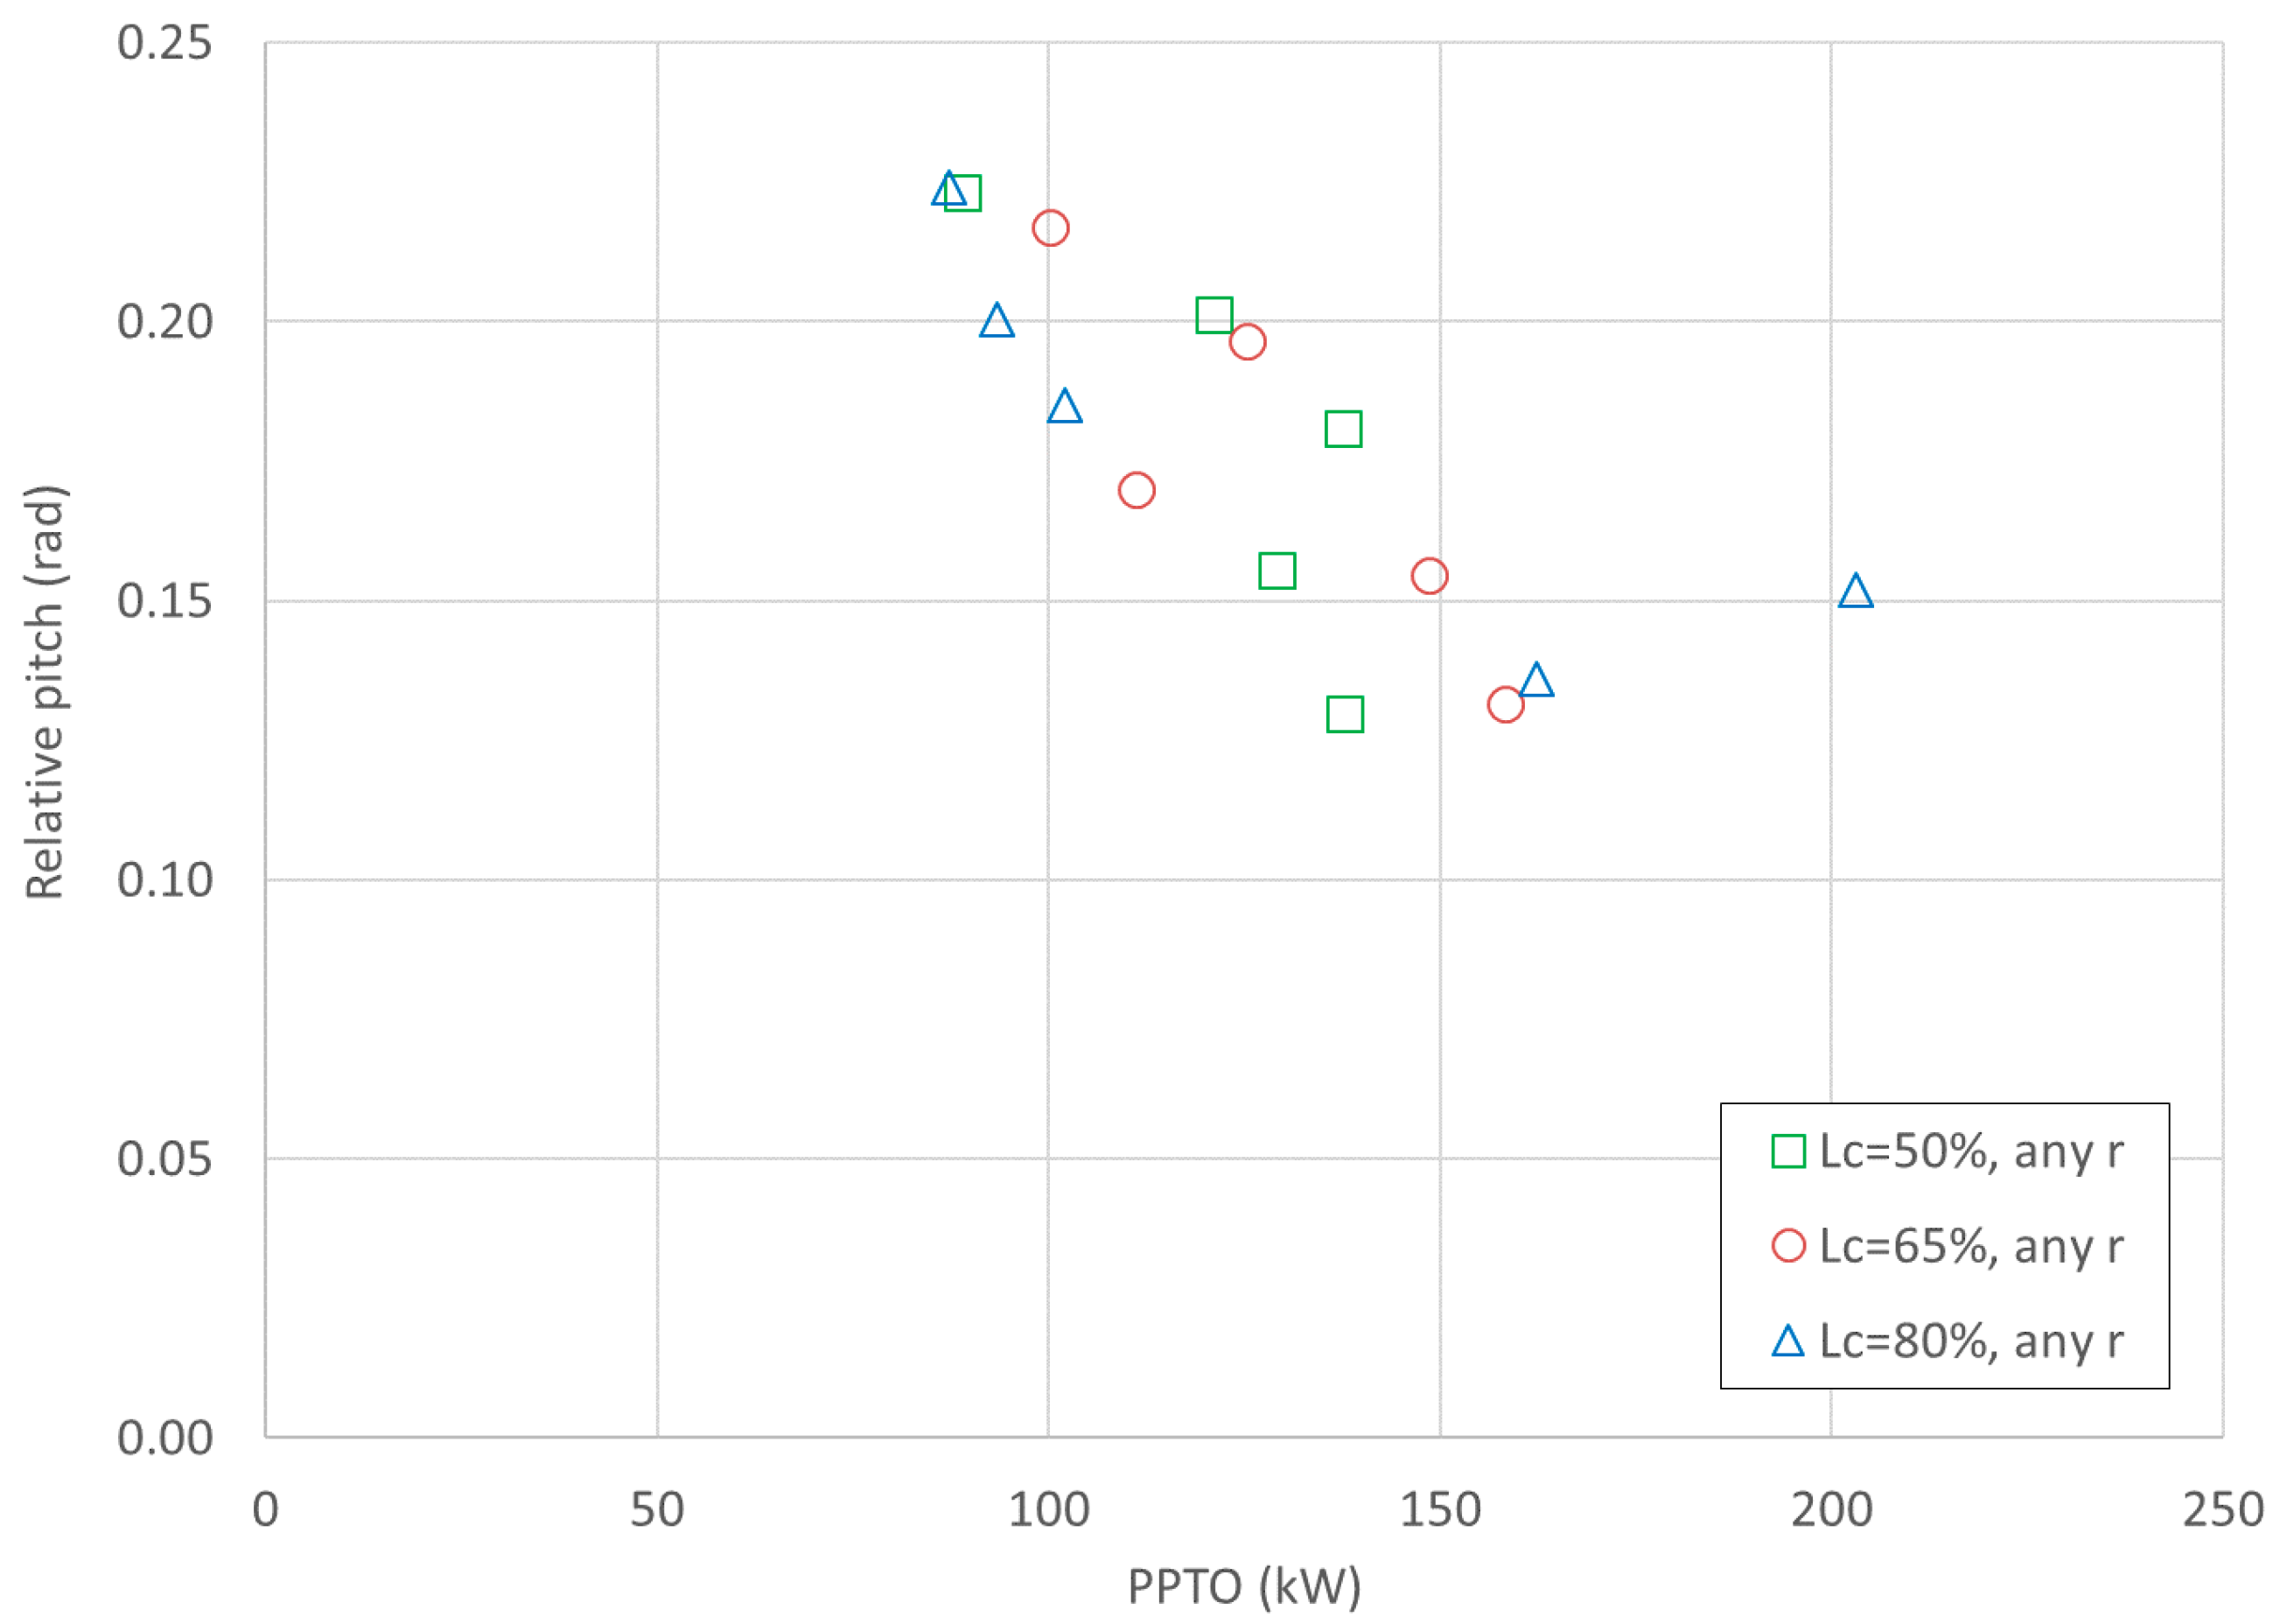
Figure 8 shows the effects in terms of relative pitch and the corresponding PPTO for the different r settings (from 1 to 5), under the same irregular WS3. The datasets are grouped by the value of the pretension level. The relative pitch ranges from 0.11 to 0.23 rad (i.e., between 6° and 13°) and the PPTO from 90 kW to 200 kW. Large data scatter can be observed for all WSs, showing that that the value of r and partially the mooring configuration affect the movements and the efficiency.
However, a homogeneous response characterises the tests carried out under the same PTO resistance setting. In particular, only the tests carried out under optimal PTO setting are selected in the following analysis, i.e., r4, r5, r5 for LC = 80, 65, and 50% respectively.
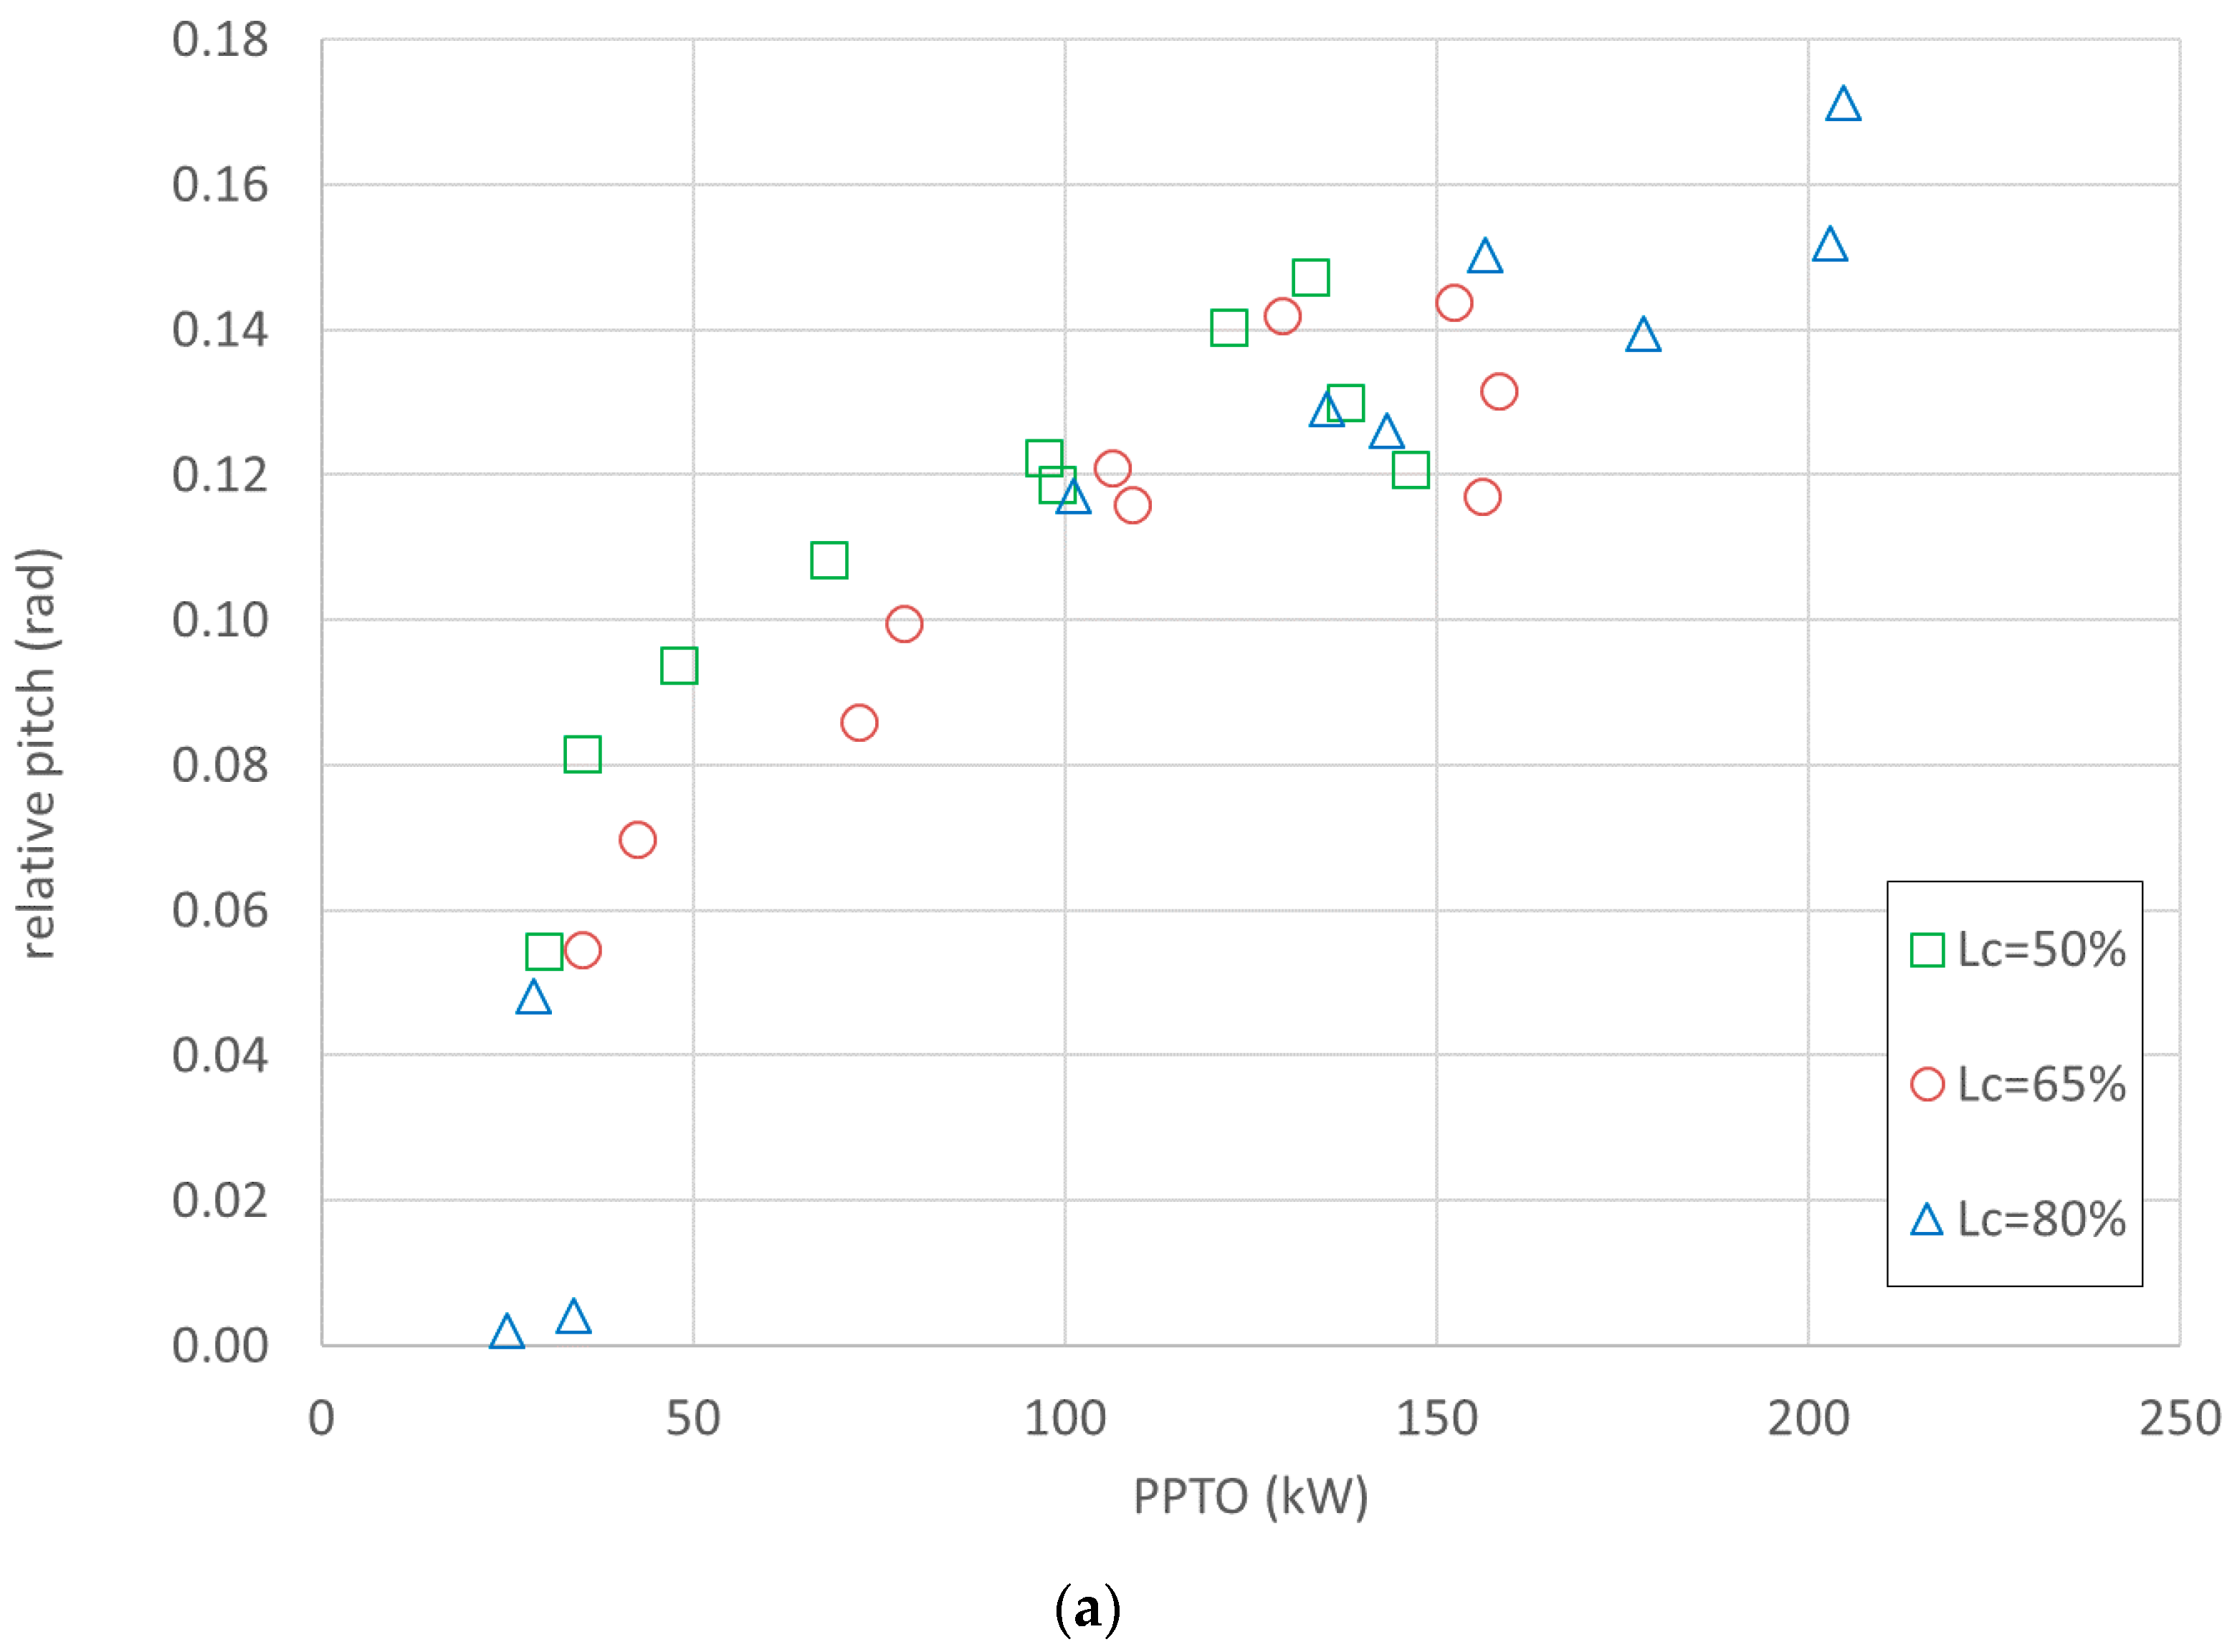
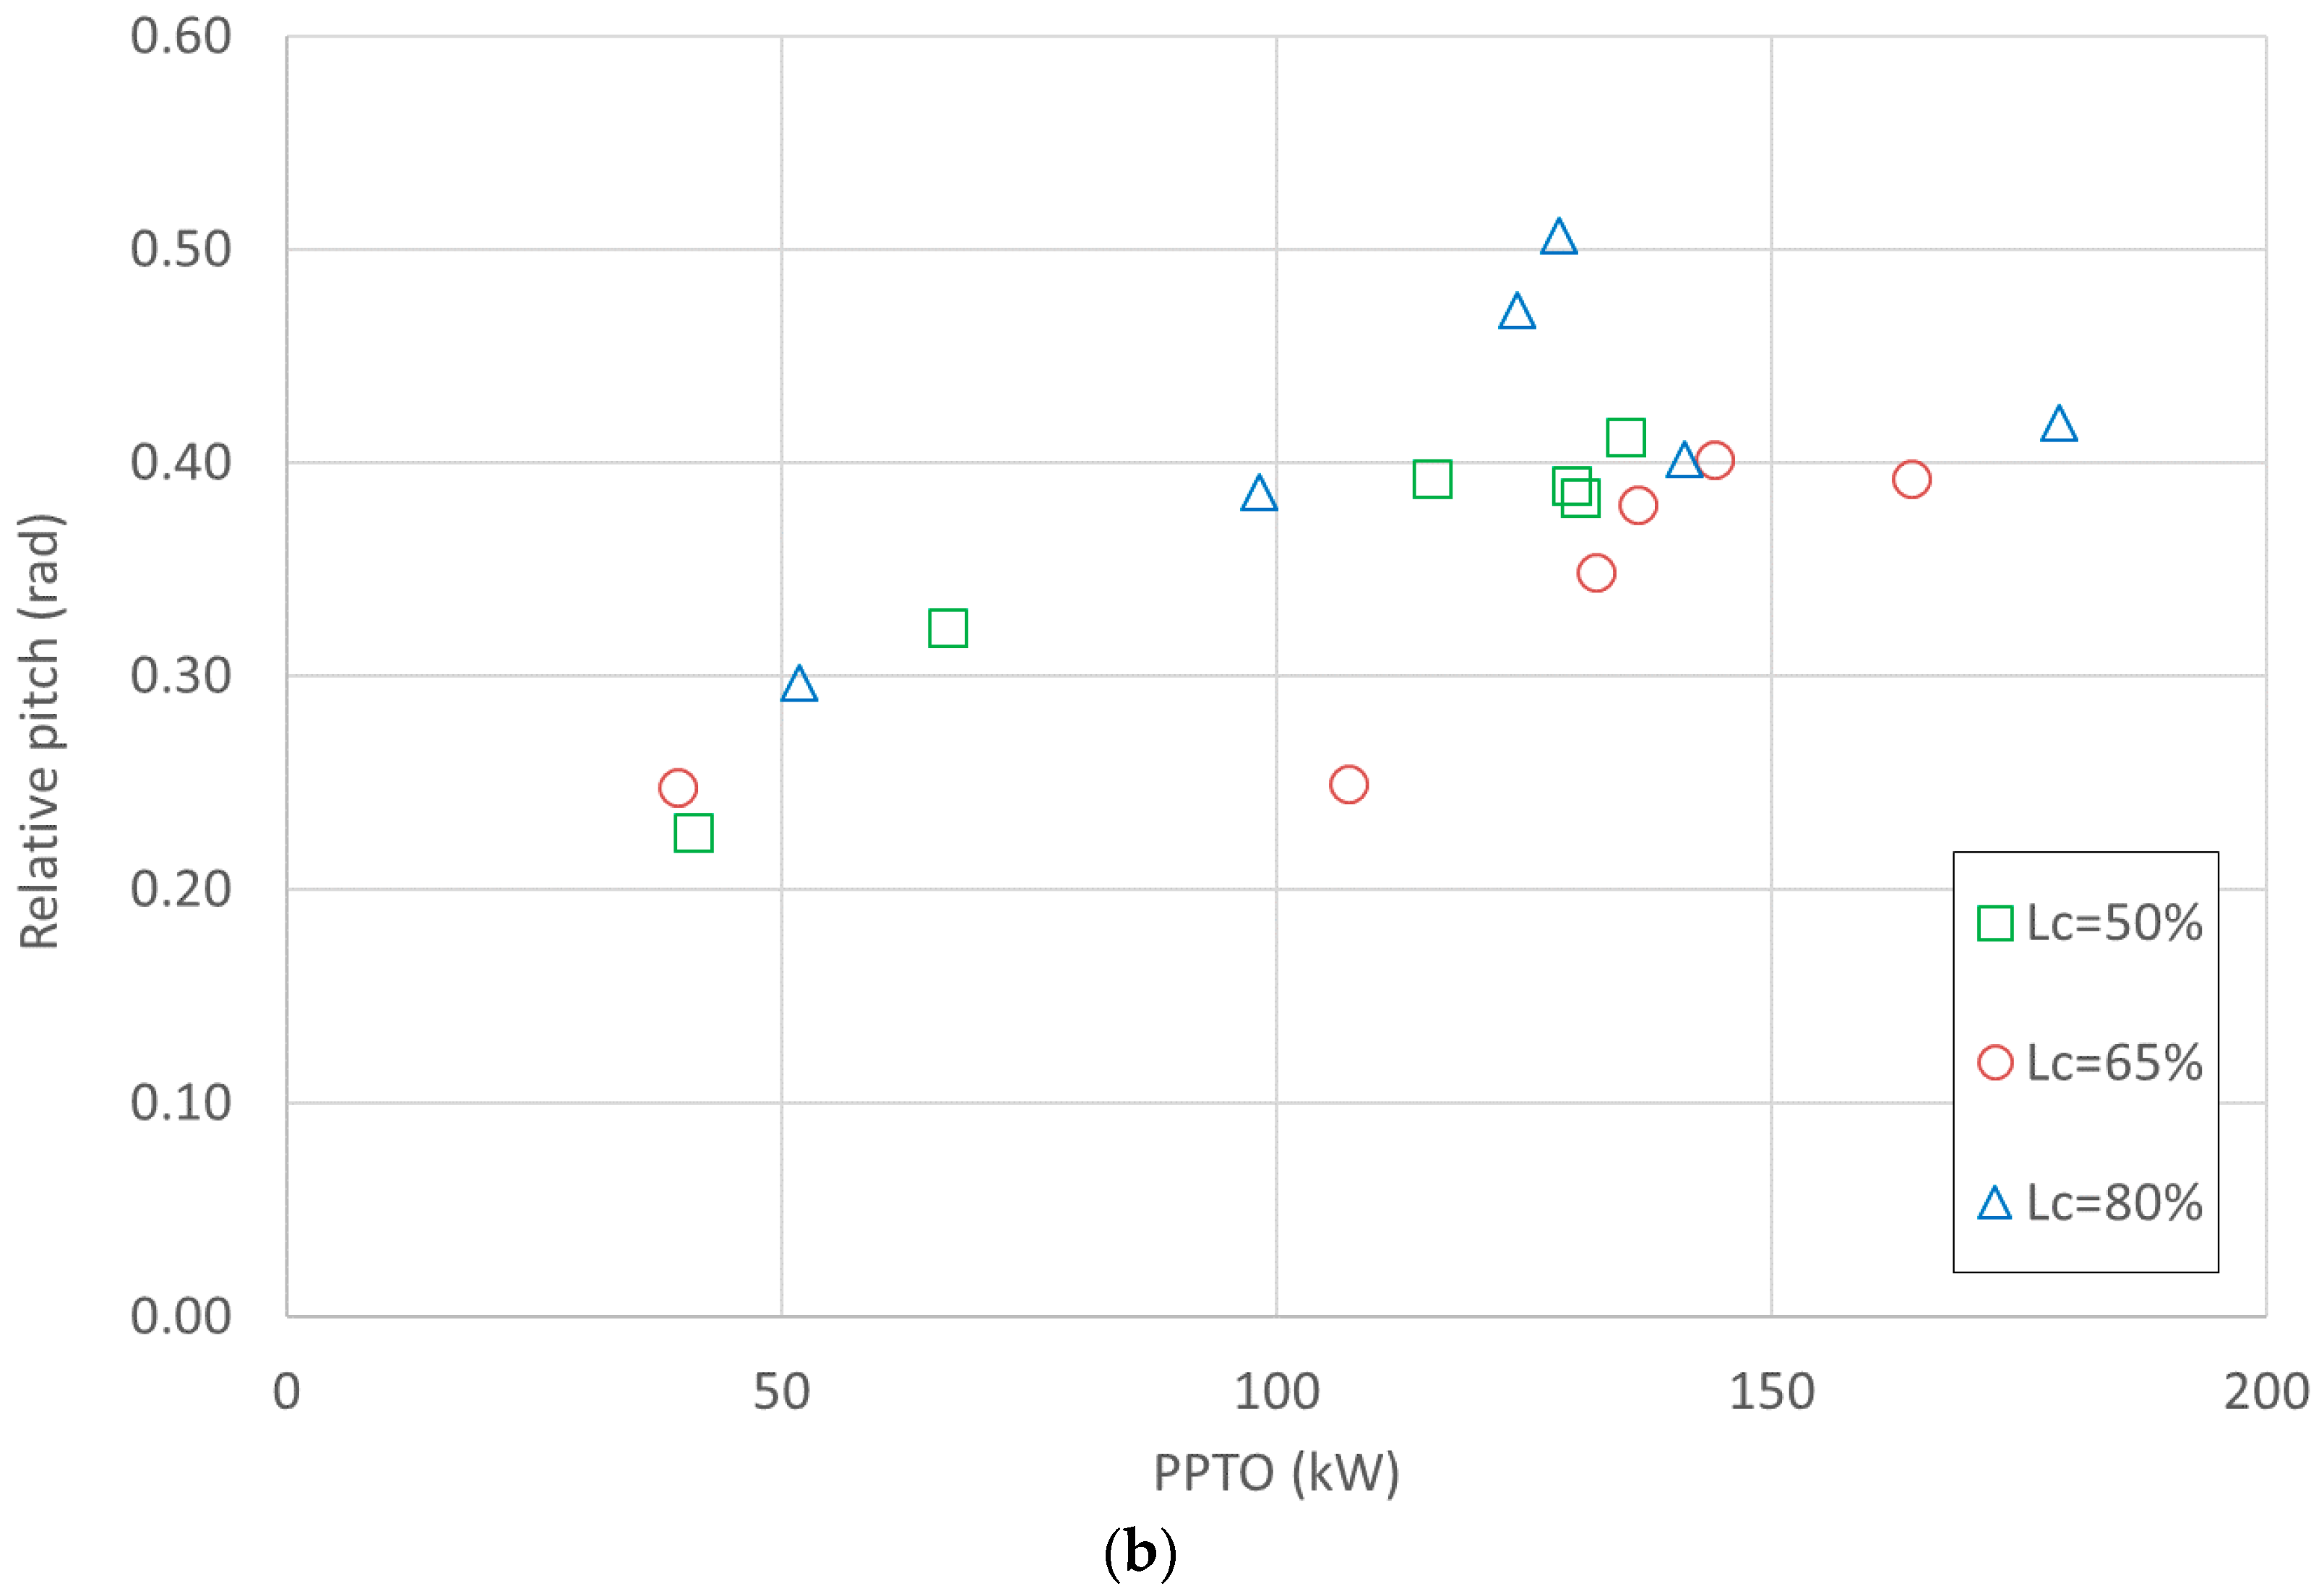
Figure 9 shows the experimental correlation between the upper 10% quantile of the relative pitch and the device power production, for the different mooring configurations, under regular and irregular WSs. The produced PPTO is proportional to the relative pitch motion for a given PTO setting, as it may be argued by observing Equation (1). The proportionality depends also on the wave characteristics, and particularly on the frequency. The larger production is found for LC = 80% (r = 4), coherently with Figure 5. Under regular waves, the maximum value of the relative pitch is approximately 0.18 rad (10°) whereas the maximum is of order 0.5 rad (28°) under irregular waves.
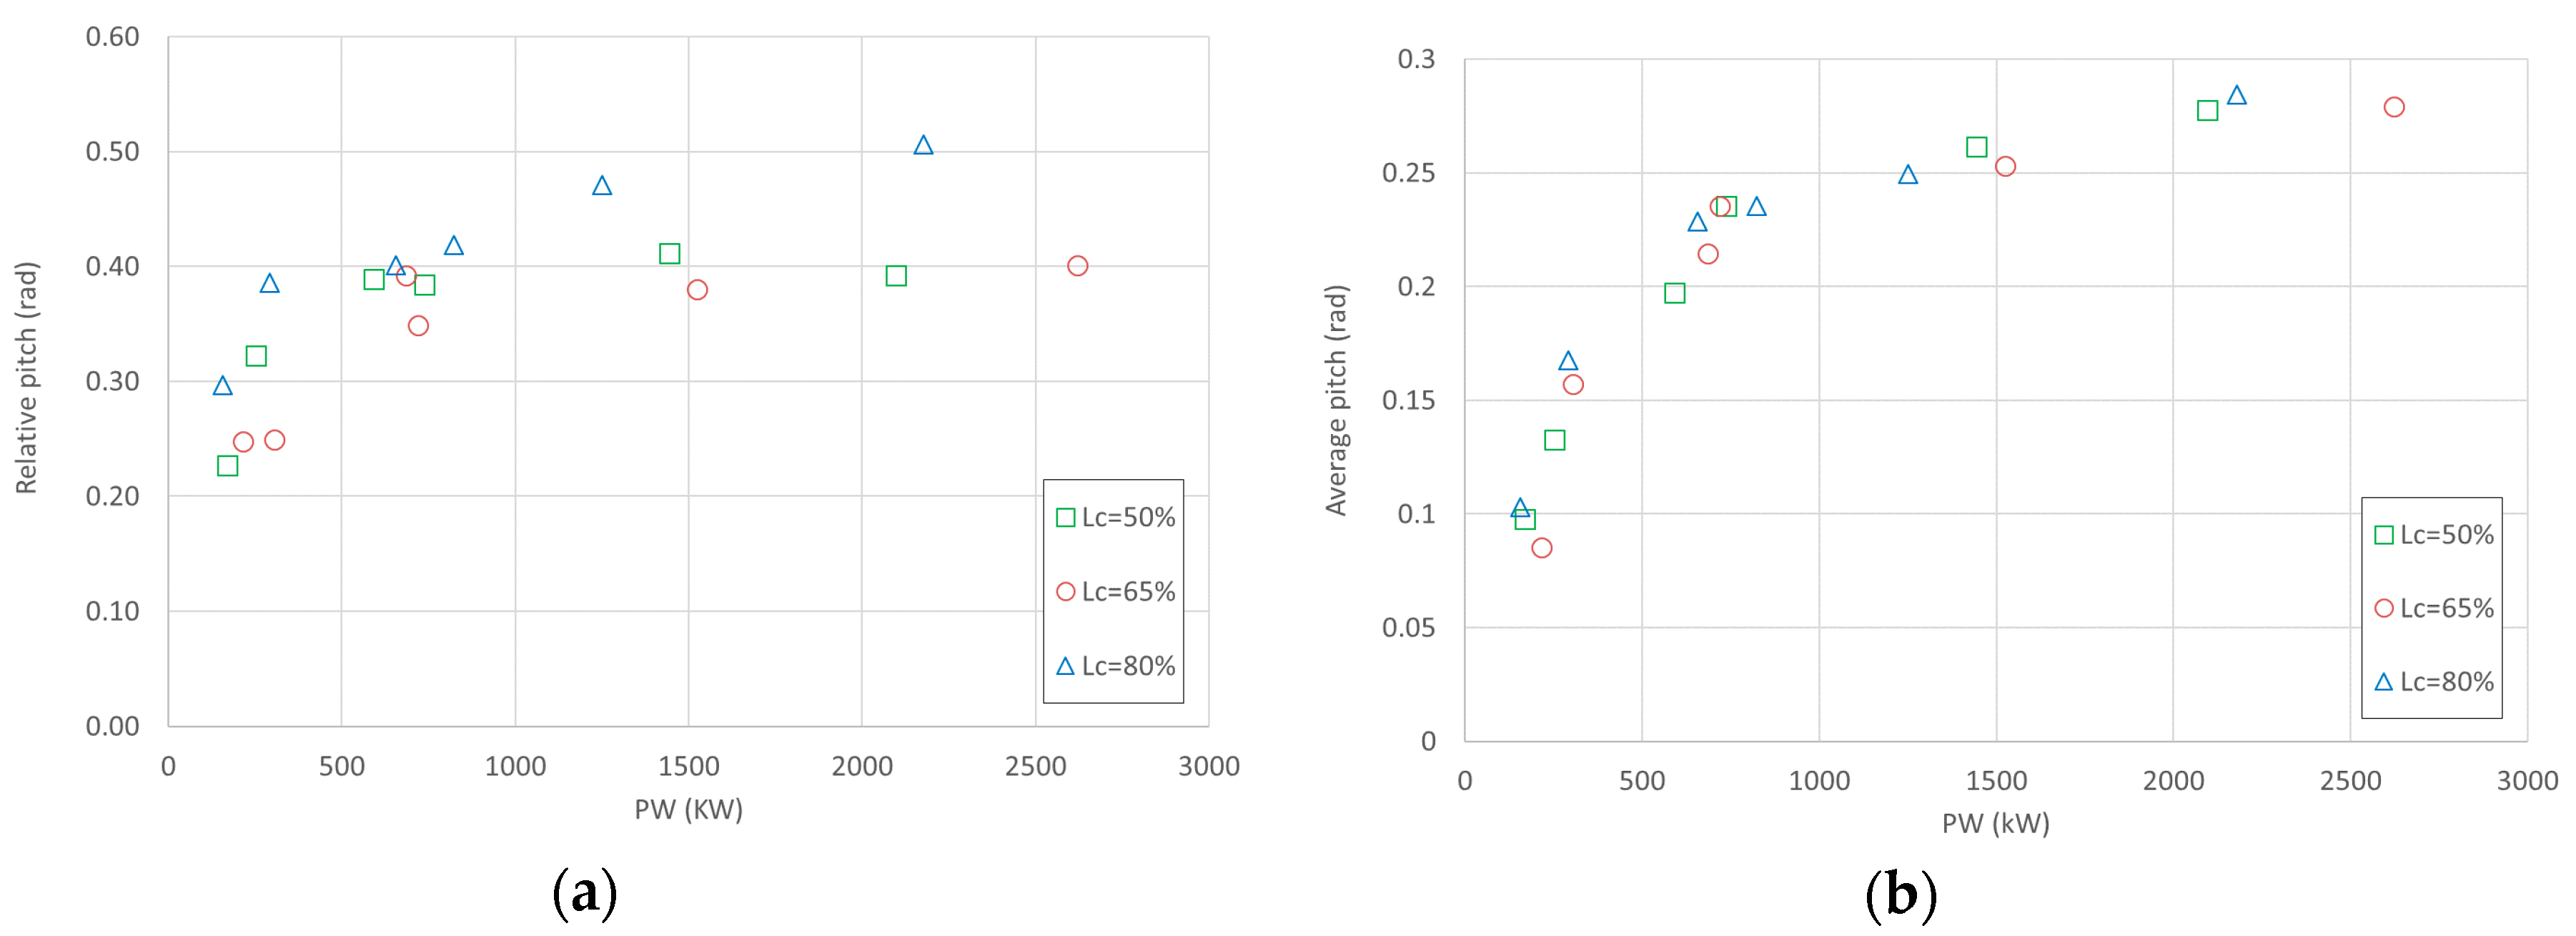
The relative and absolute pitch are also well correlated to the incident wave power PW. This is a consequence of the correlation between the available wave power and the produced power, for the same PTO setting. Figure 10 shows the almost monotonic trend of the relative pitch (top panel) and of the mean pitch (bottom panel) as a function of PW. The combination of LC = 80% and r = 4 gives the larger relative pitch for all conditions. However, the average pitch is the same for the three LC values. It should be noted that the relative pitch is quite variable, being strongly related to power harvesting. Actually, the relative pitch is larger than the average pitch in case of large production.
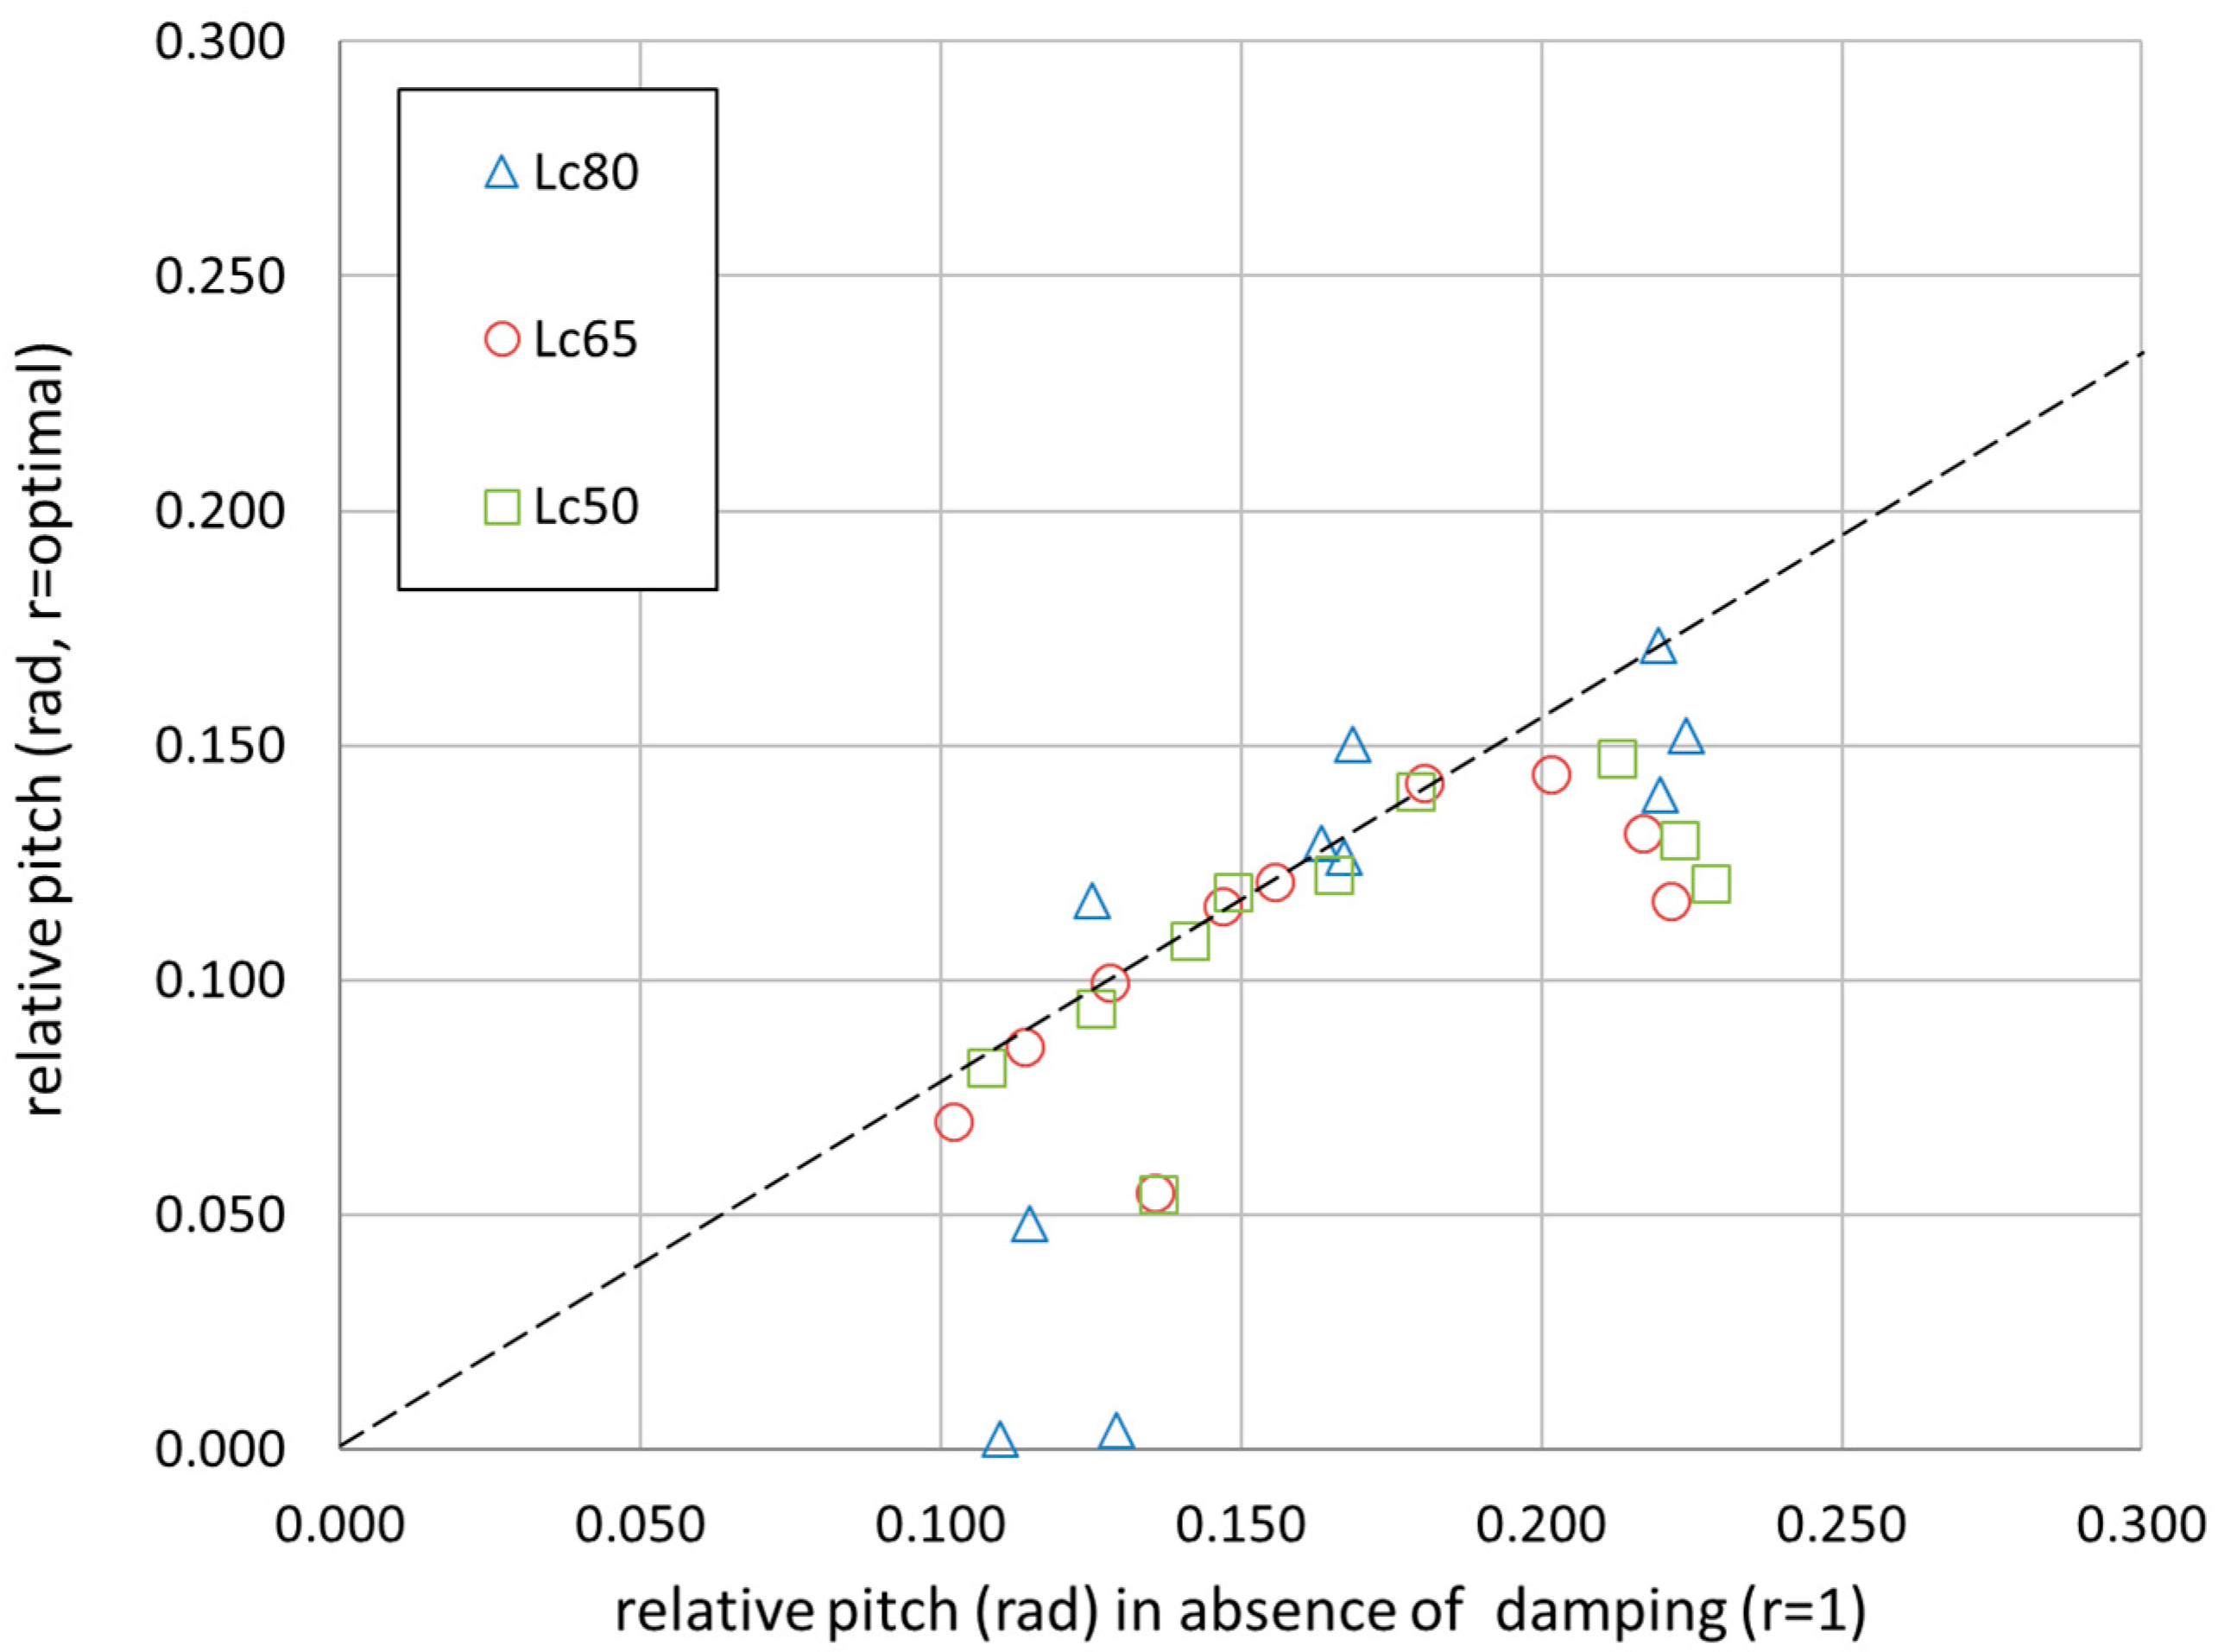
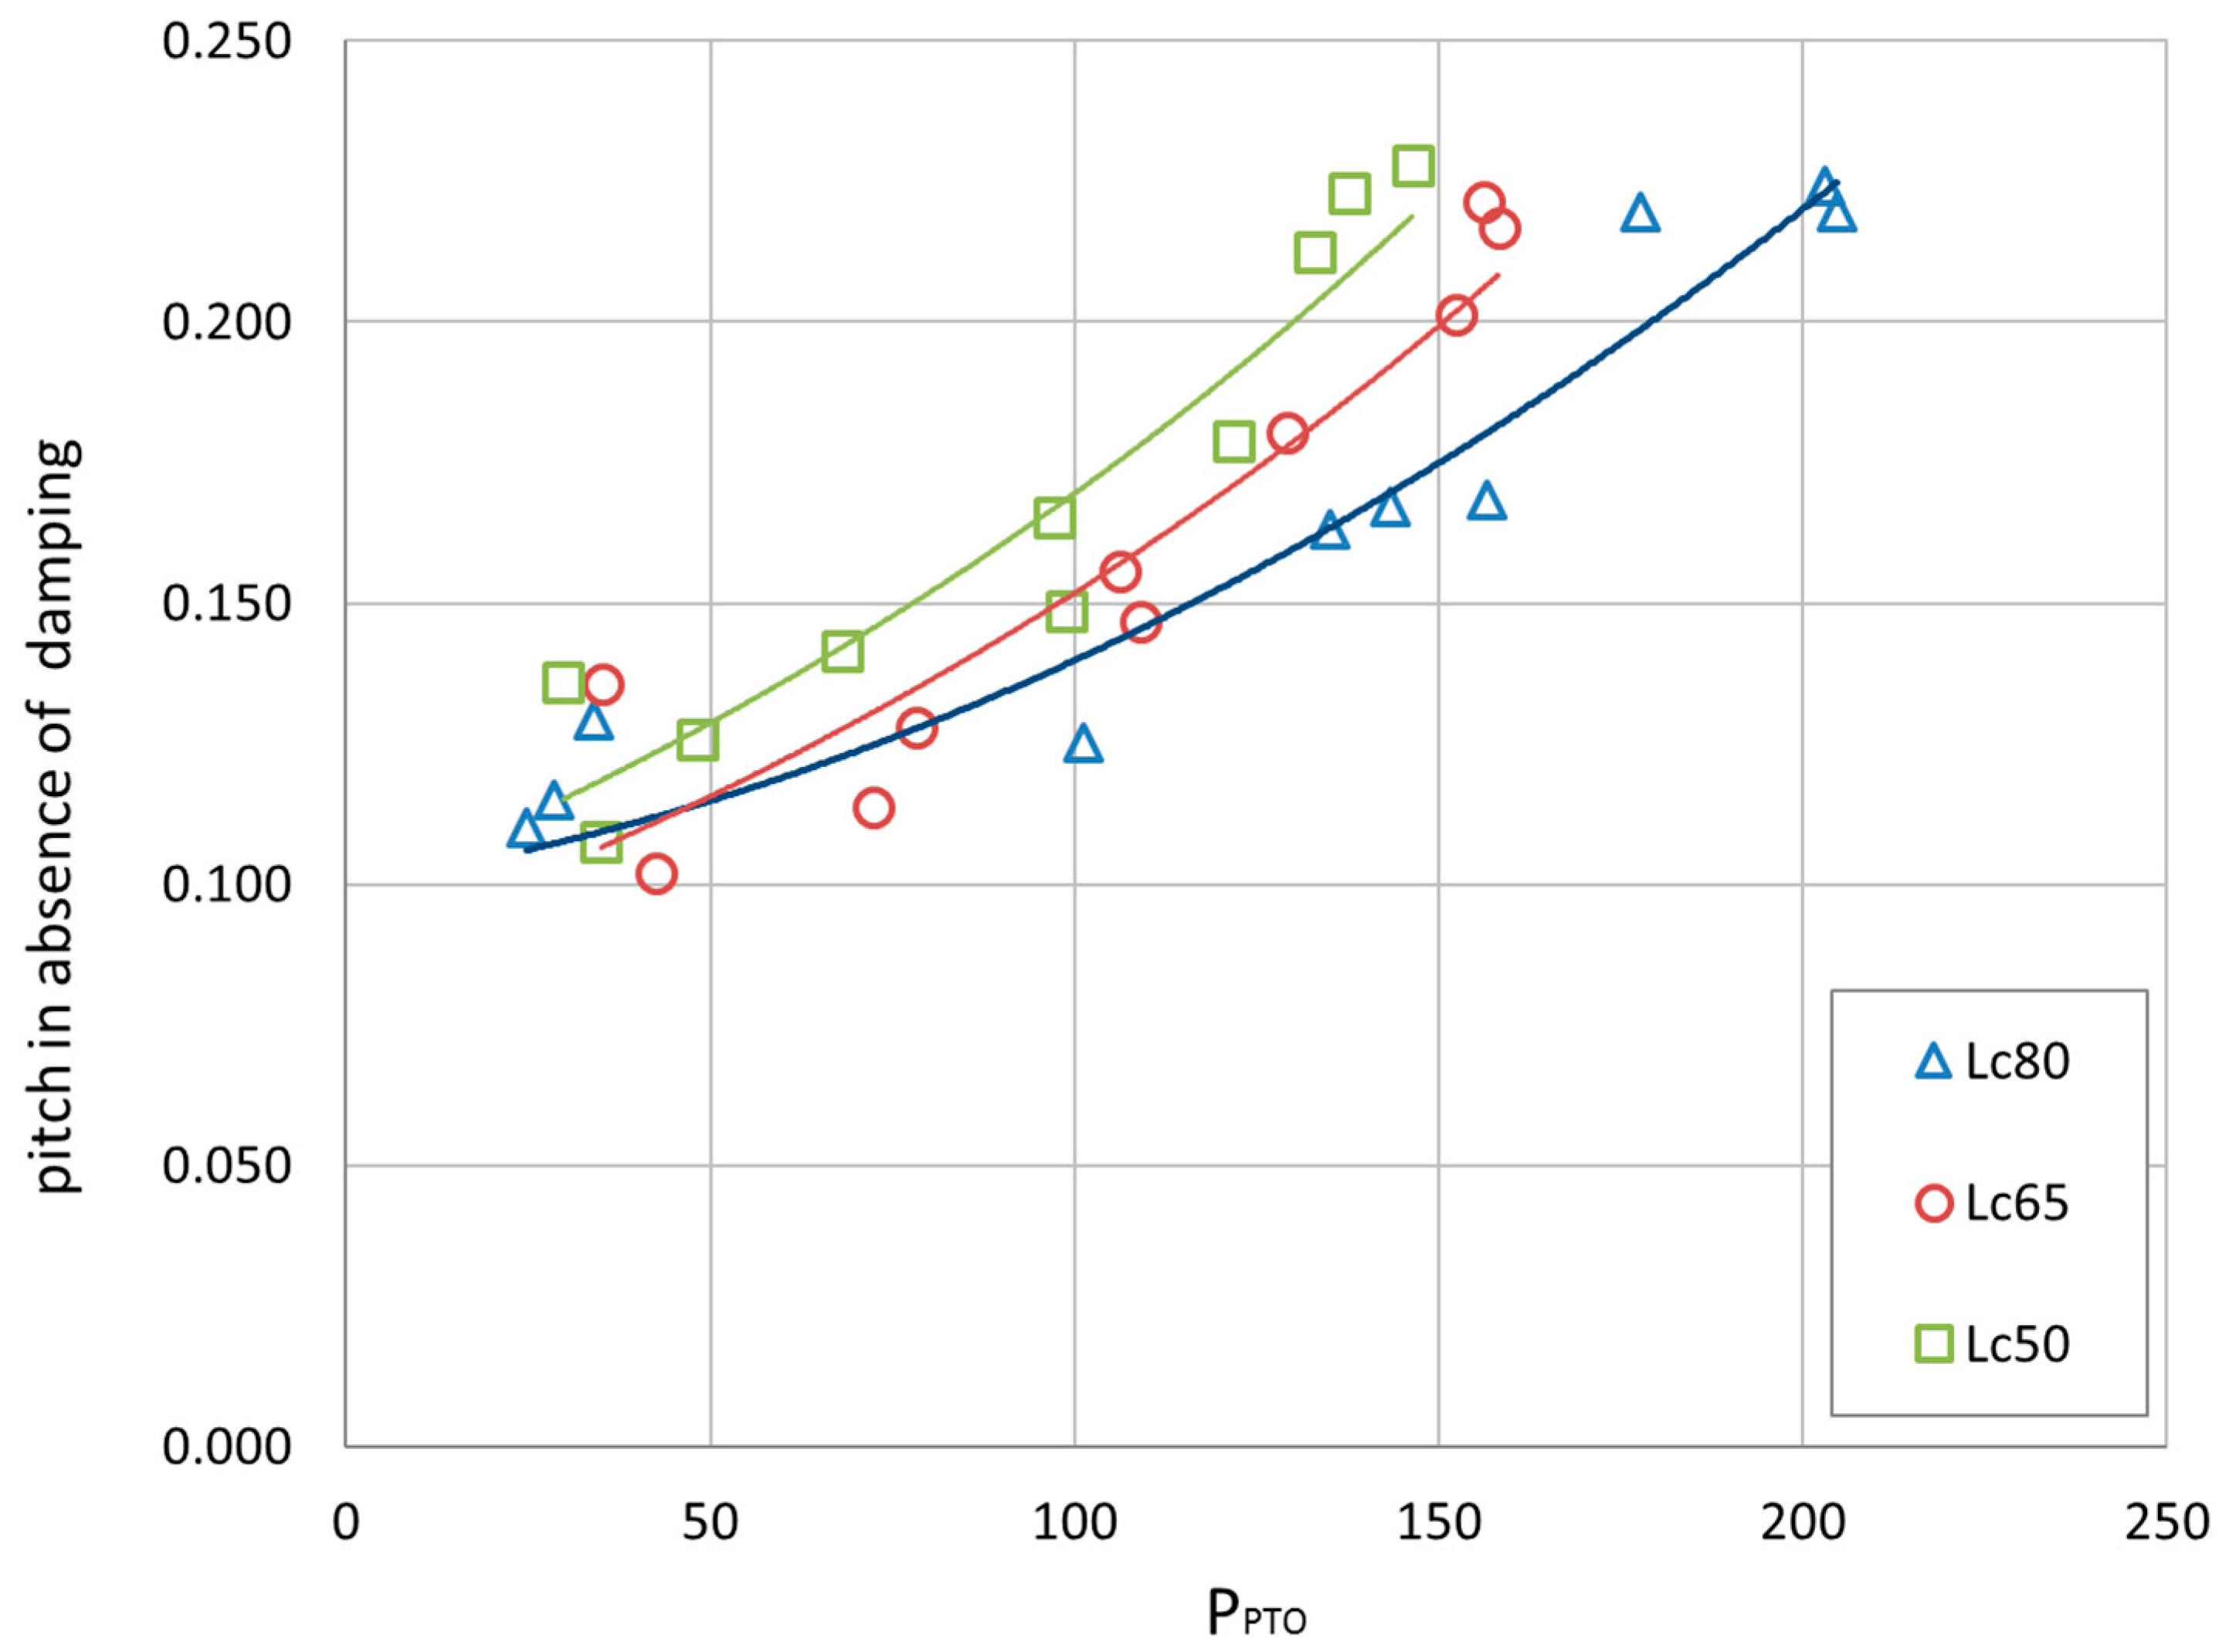
From the information gathered above, it is clear that also the average pitch is strongly correlated to PPTO and to the PTO setting. It therefore becomes interesting to experimentally relate the motion of the structure under optimal PTO setting to the motion obtained in the absence of the PTO, under the same incident wave conditions.
For this purpose, only the regular WSs are considered and the setting r=1 is assumed to represent the ‘absence of PTO’ (or undamped case), since it corresponds to a very loose resistance in the air cylinder.
Figure 11 shows the relative pitch for r = 1, compared to the relative pitch obtained for optimal r. The correlation is significant and is almost unaffected by Lc. Although the relation is not strictly linear in the whole range of tested conditions, most of the relative pitch values are 80% smaller for optimal setting compared to the undamped case.
Similarly, Figure 12 shows the experimental relation between the relative pitch for r = 1 and the produced power. The data appear to be aligned along different lines (obtained by an exponential trend fitting), depending on Lc.
The combination of Figure 11 and Figure 12 is very useful to anticipate the potential PPTO of the DEXA on the basis of simple experiments, carried out in the absence of the PTO. For example, for LC = 65%, a relative pitch of 0.16 rad is measured or predicted in absence of PTO. Then, if ones assumes that an optimal PTO is installed, the actual relative pitch would be 80% lower (Figure 11) and the produced power would be just larger than 100 kW (Figure 12).

3.4. Mooring Forces

The measured mooring loads are important to prove that the design is sound. The data recorded from the load cells, under ordinary and extreme WSs, were elaborated in the time domain. The characteristic value F1/50 (i.e., the mean value of the 2% of the highest points) was selected to statistically describe the largest forces during the wave attack.
The forces F1/50 are given as a function of PW.
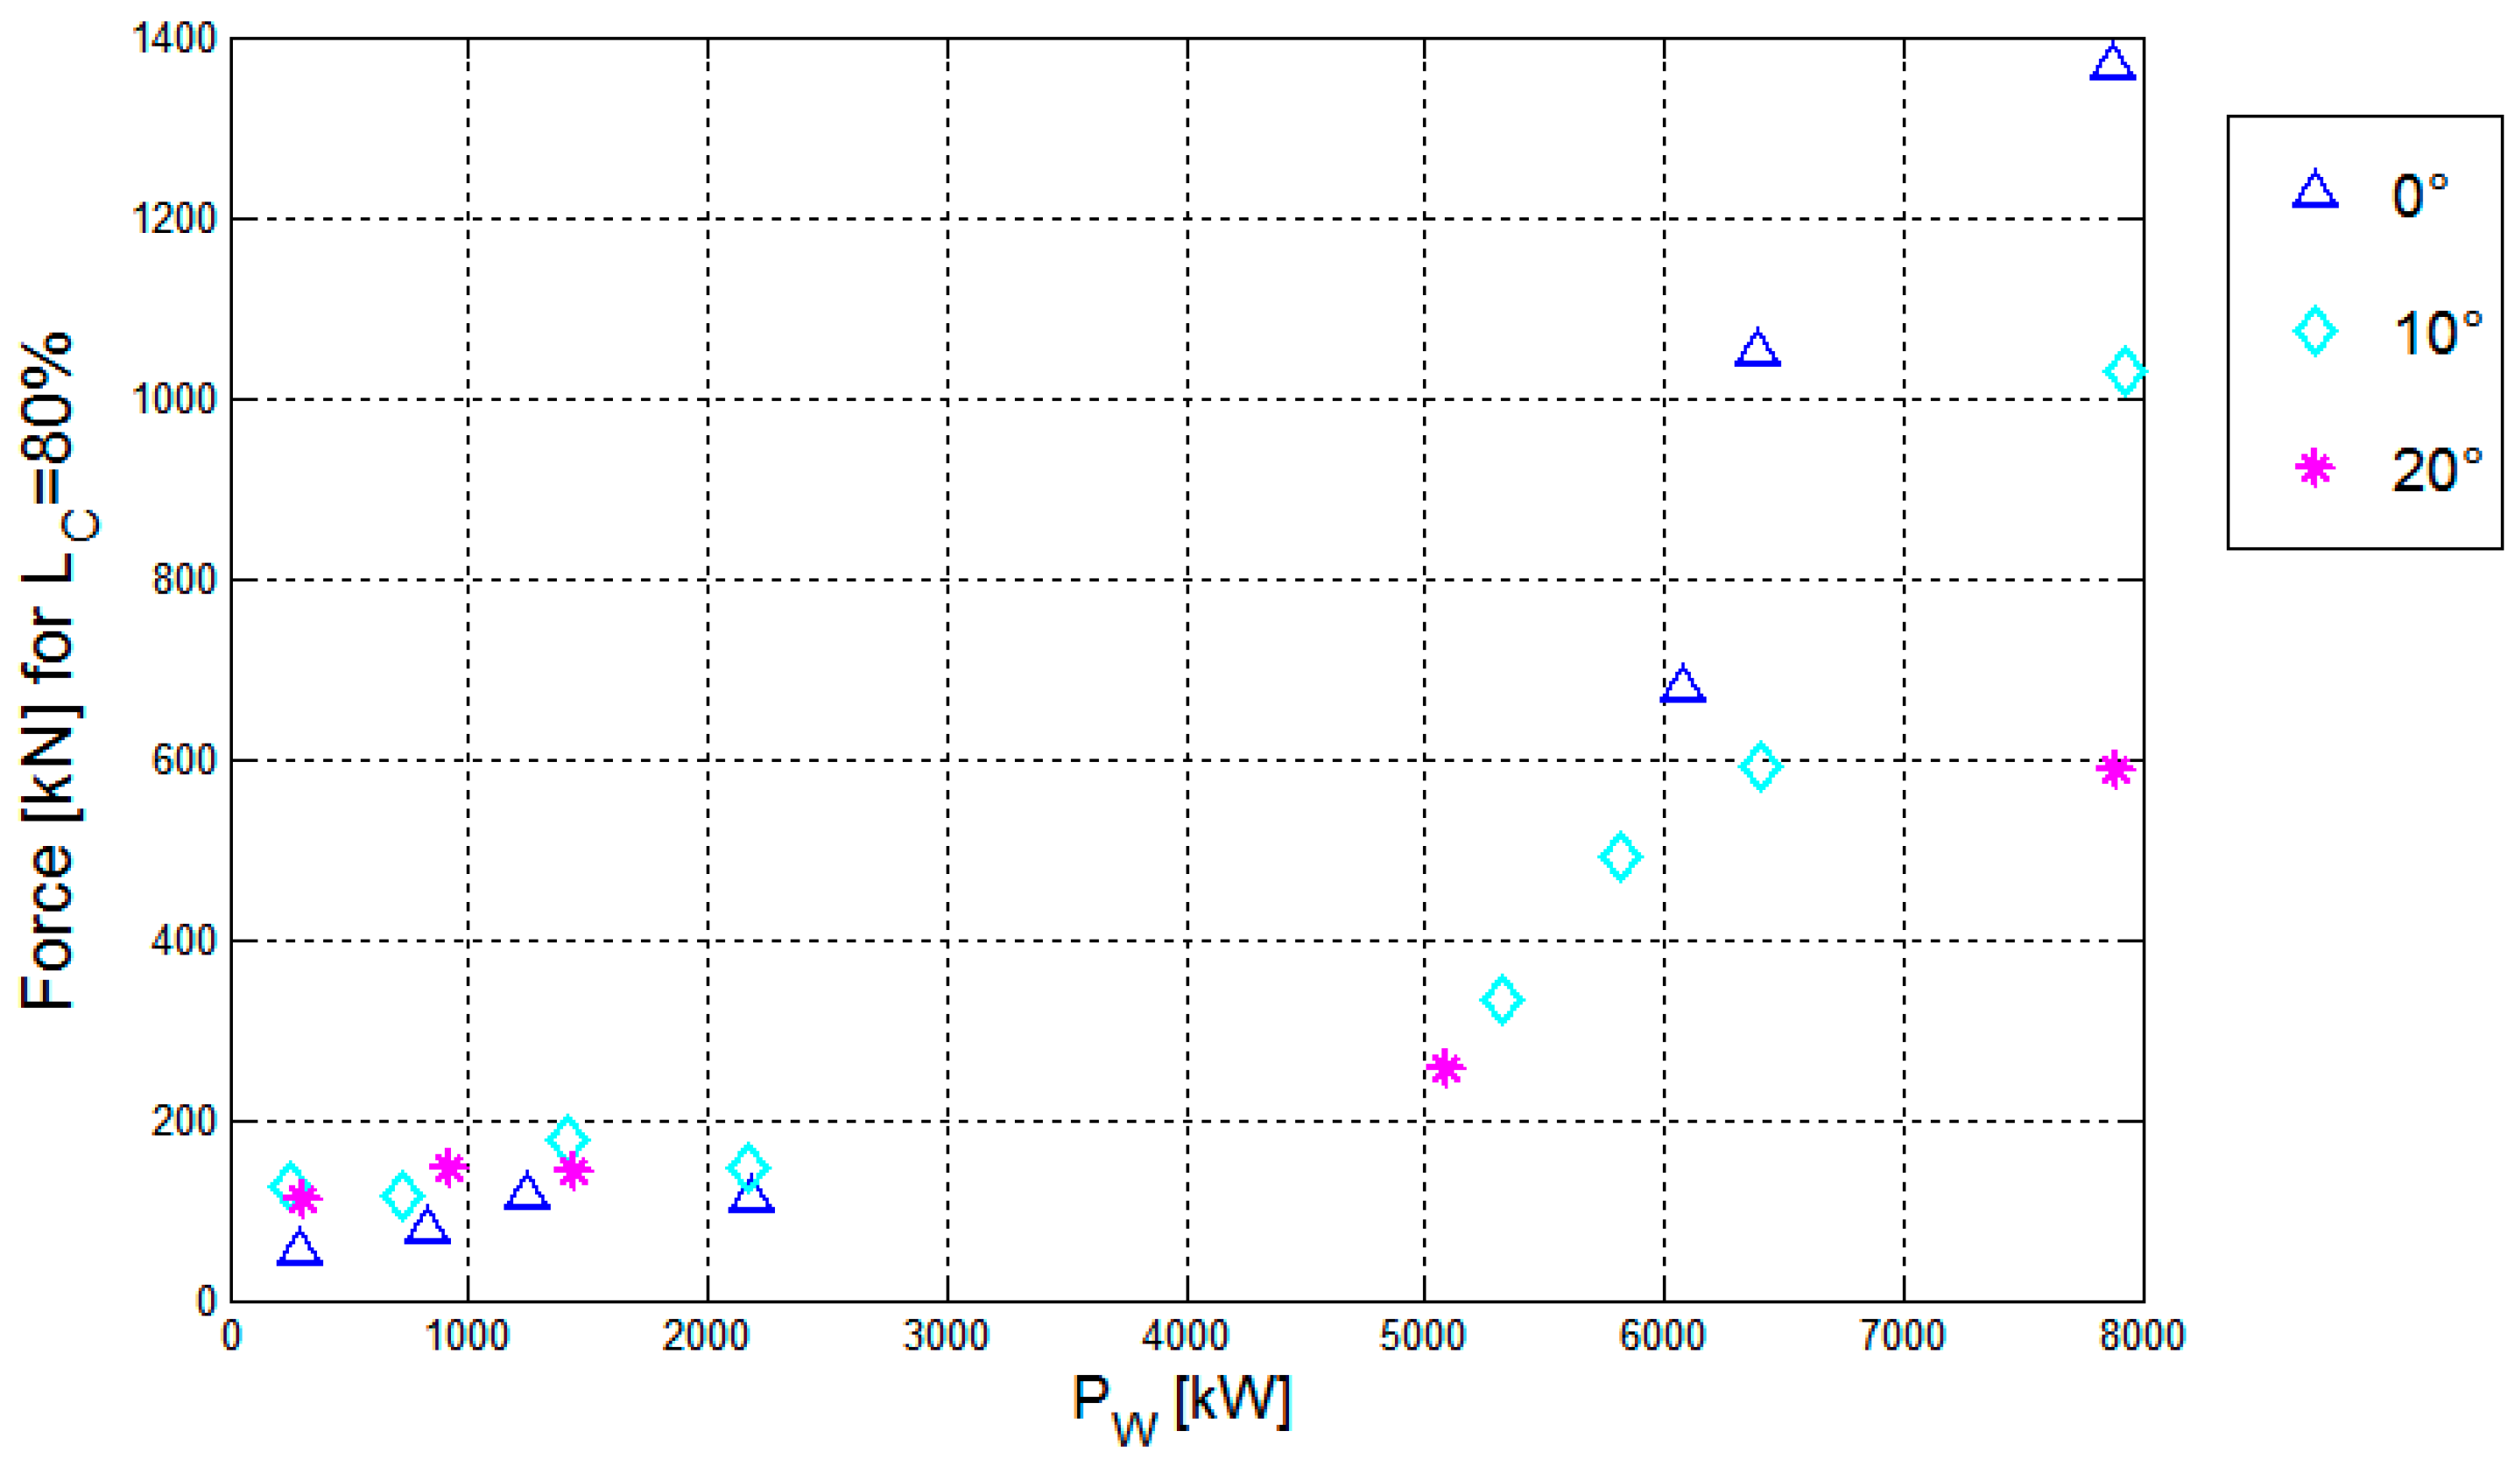
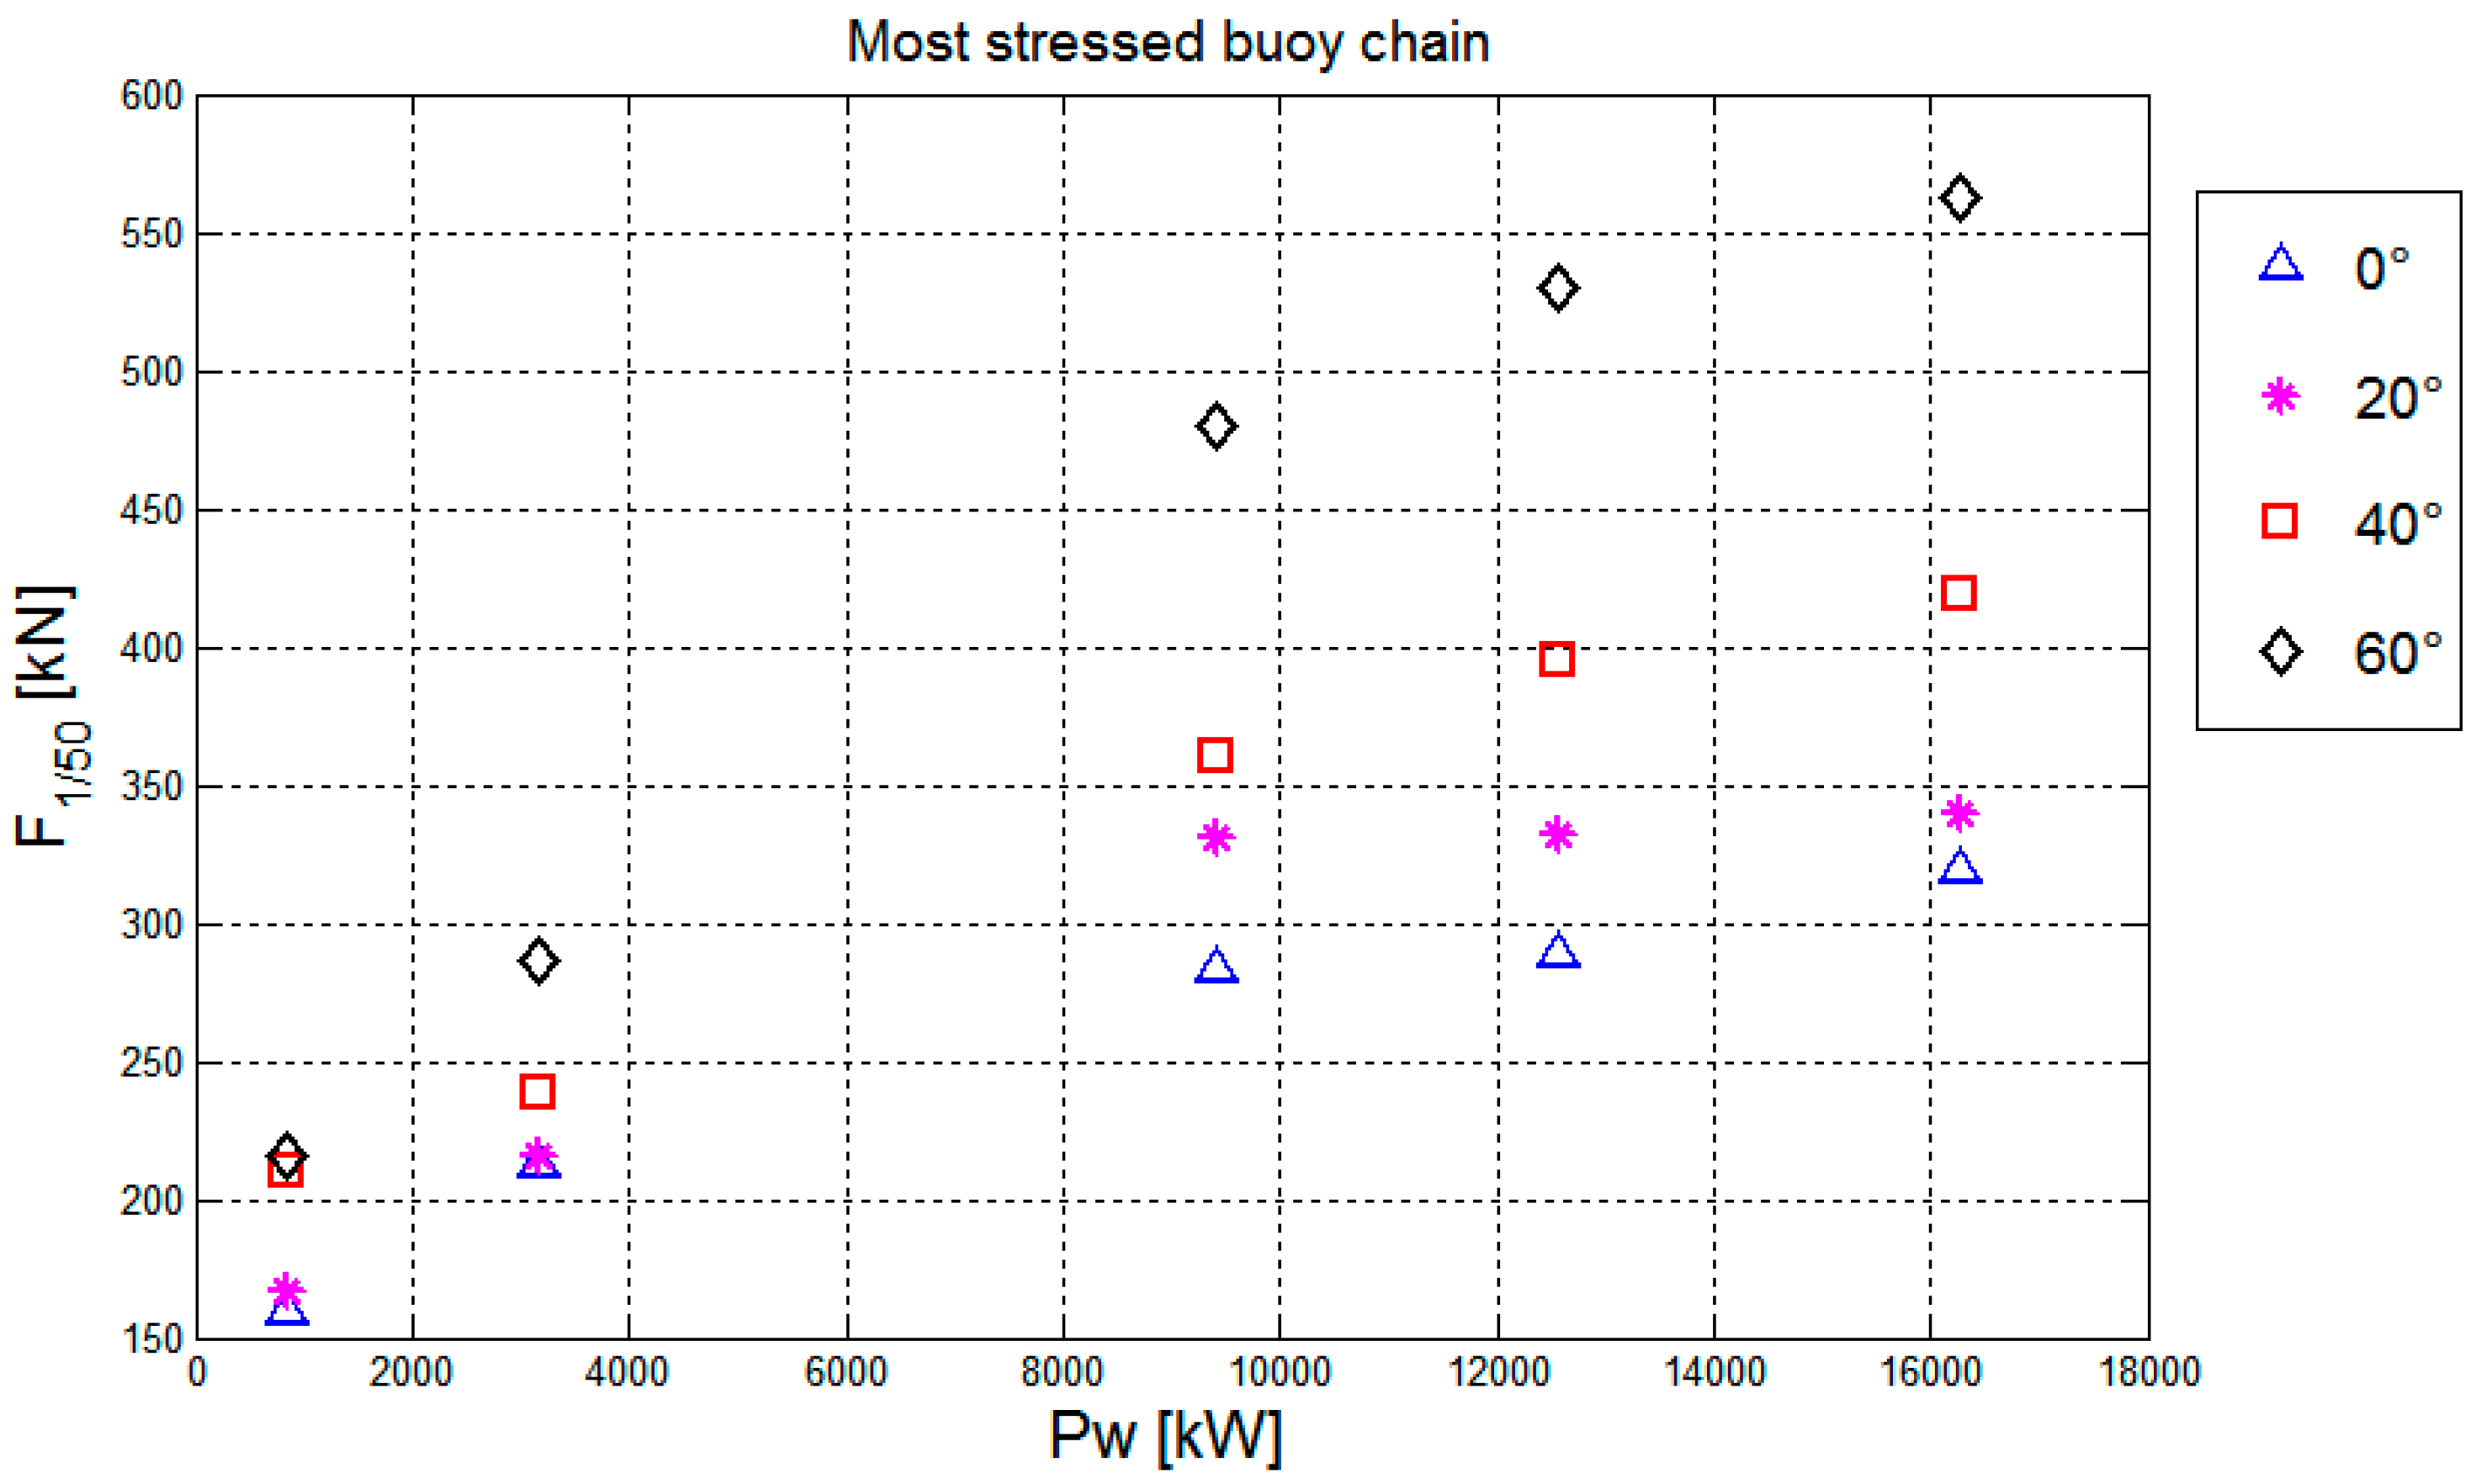
Figure 13 shows the maximum values of F1/50 among the four chains, under perpendicular and oblique wave attacks, for LC = 80%. The maximum loads are within an acceptable limit. For the ordinary WSs the values of F1/50 slightly vary for different wave obliquities β, being slightly lower for perpendicular wave attacks. The lines are mainly slack and the loads are proportional to their elongation, usually very limited. Under oblique waves, yaw rotations induce a greater elongation of the chains with respect to pure surge, therefore larger loads are observed.
Conversely, in case of extreme WSs, F1/50 increases up to 3.5 times when the waves hit the device perpendicularly to its axis. The larger loads occur when the device reaches its maximum offset and the lines are fully stretched, and the load is proportional to the device deceleration. When the device is forced to yaw before reaching the maximum offset, the device deceleration is slower and the loads are smaller than in case of pure surge.
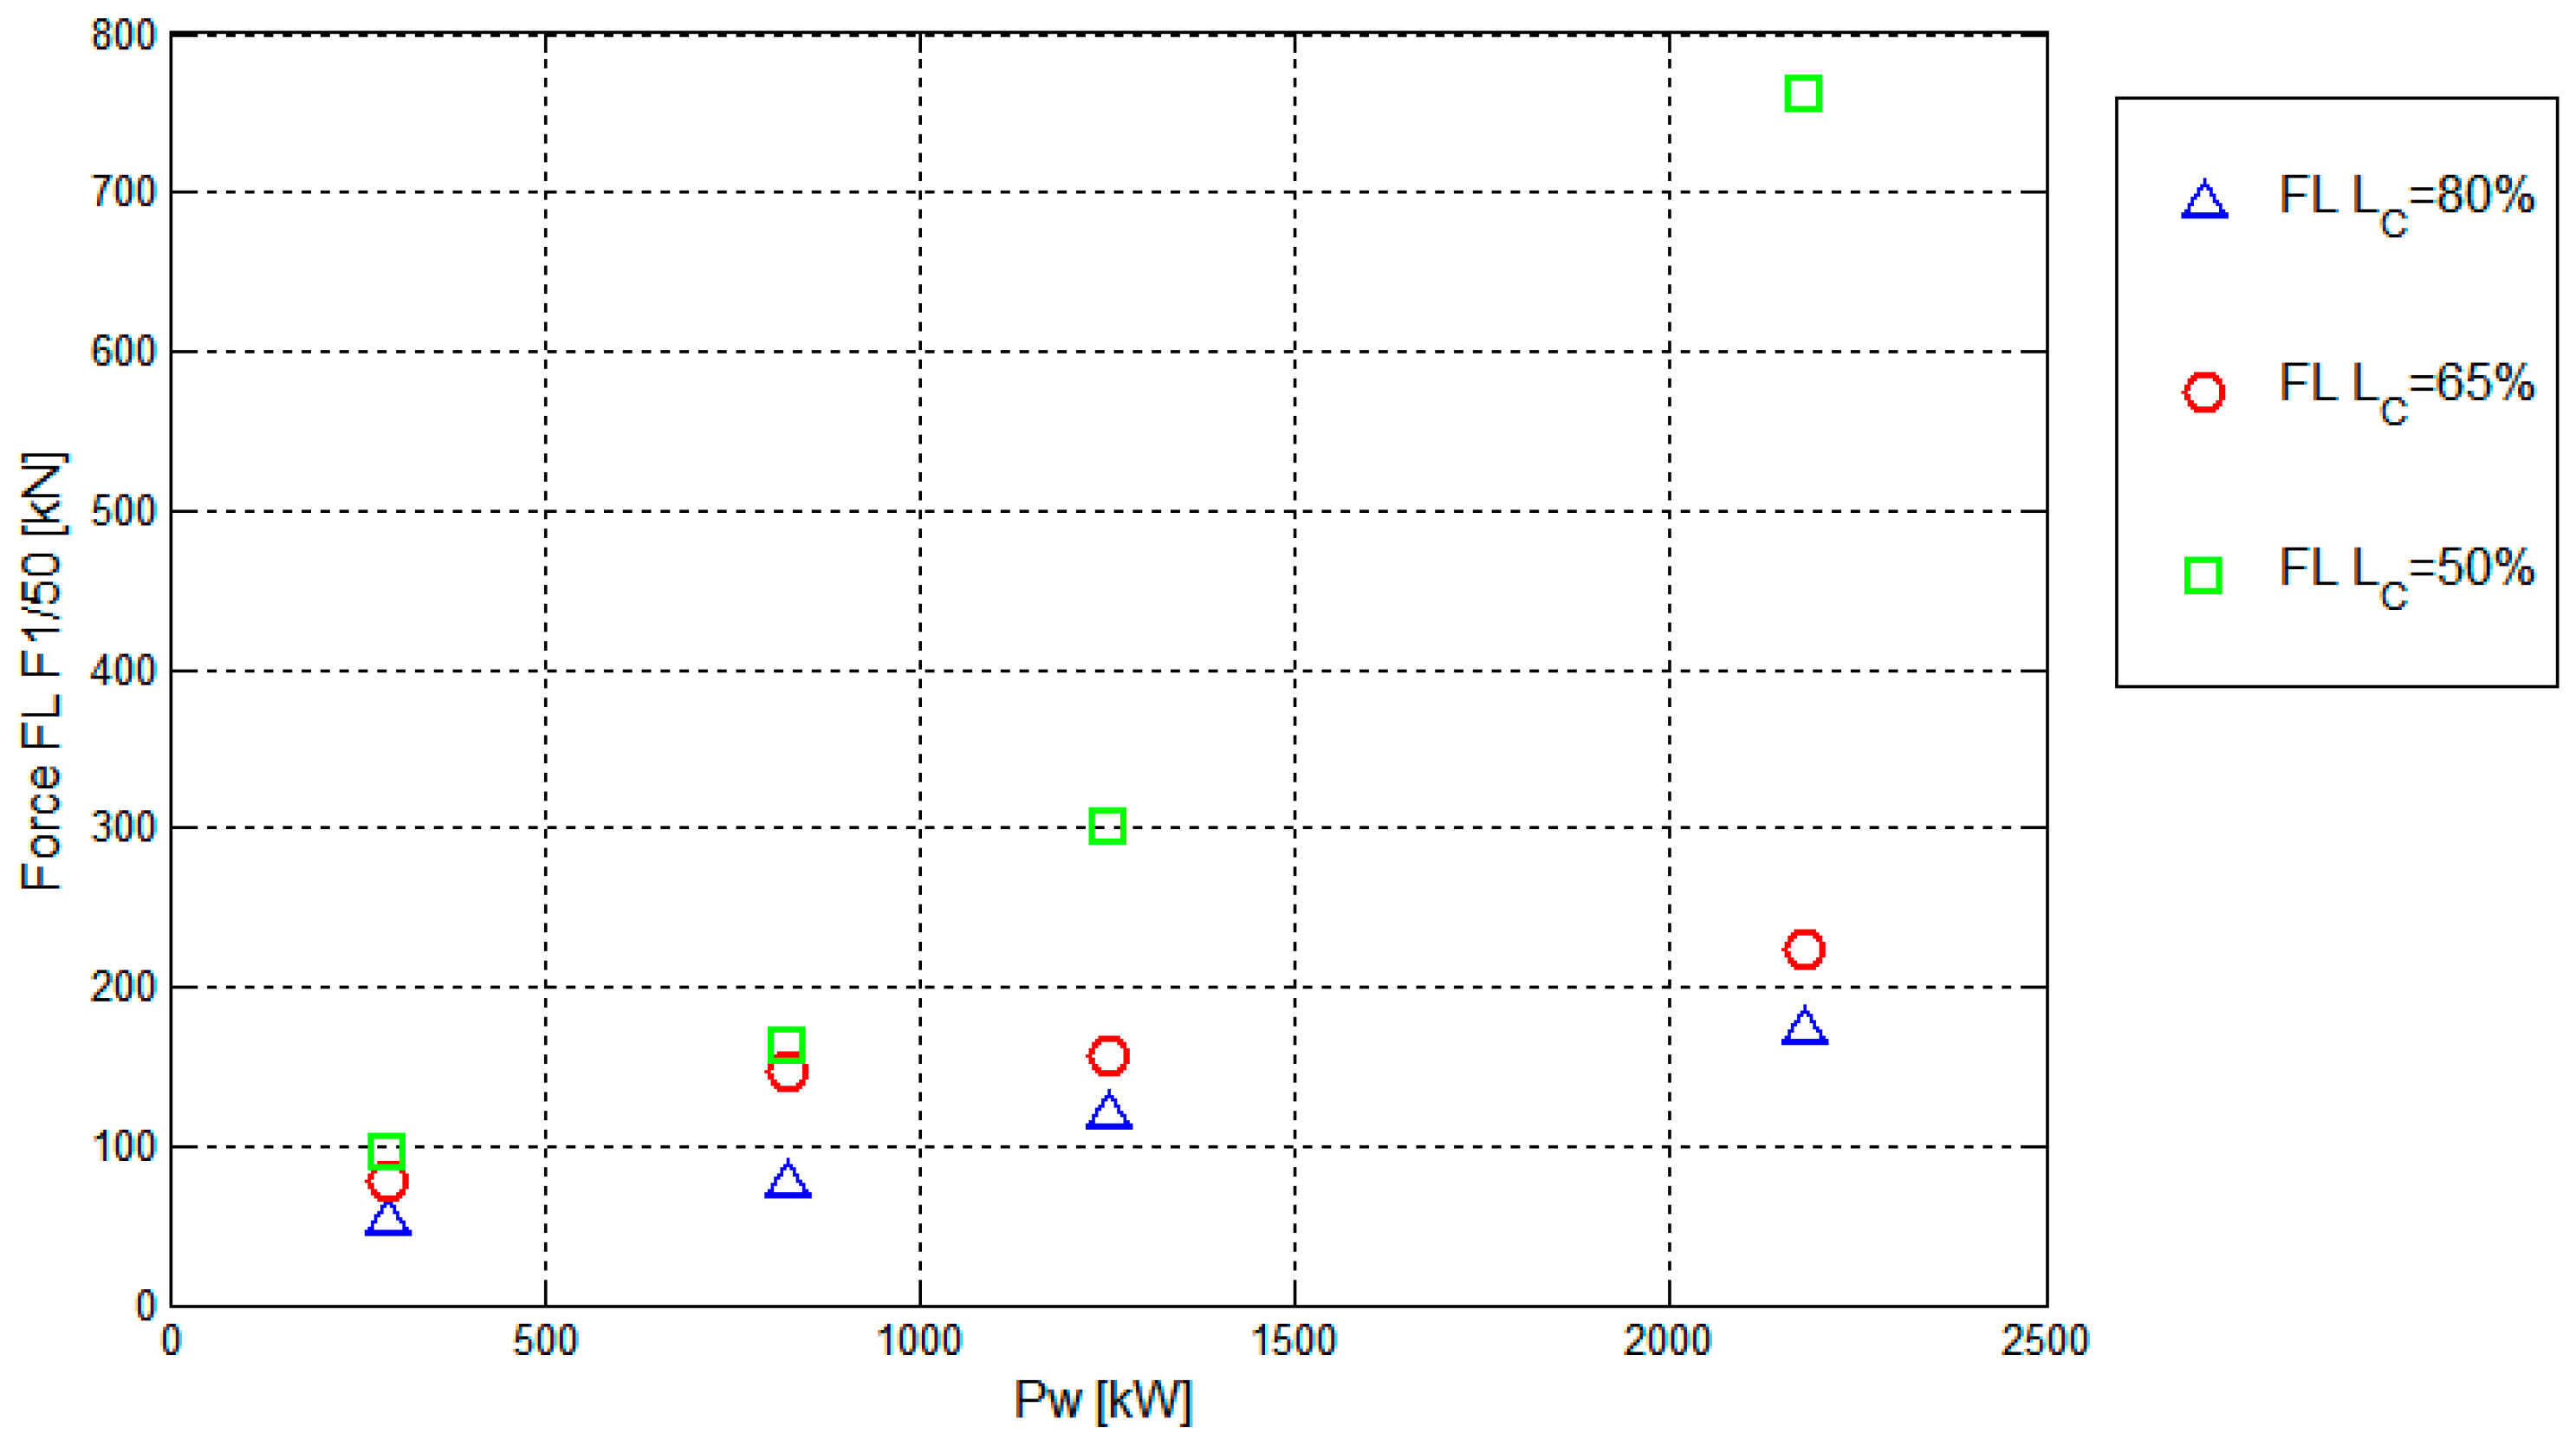
Figure 14 shows the values of F1/50 for different LC on the same chain as functions of PW, only available for ordinary WSs. The increase of F1/50 with PW looks pretty linear for LC = 80%, indicating a slack reaction. The trend of F1/50 is quadratic for LC = 50%, while the case with LC = 65% follows an intermediate trend. Only for LC = 80%, the load is available also for extreme WSs (see Figure 13, perpendicular case) and it is evident that the linear trend is abandoned.

4. Numerical Modeling of Moorings in Deep Waters

4.1. Short Description of the Numerical Model

Numerical simulations were performed with the code ANSYS-AQWA (version 15.0), developed by ANSYS. This software is able to simulate the effects of wave, wind and current on floating and fixed off-shore and marine structures. In particular, ANSYS AQWA hydrodynamic diffraction and ANSYS AQWA hydrodynamic time response modules were used in this work.
The ANSYS AQWA hydrodynamic diffraction module develops the primary hydrodynamic variables required for complex movements and response analyses, solving the Green function for linear potential flow by means of boundary element and panel method [28].
The ANSYS hydrodynamic time response module performs the dynamic analysis in frequency or time domains, deriving the impulsive response from the hydrodynamic diffraction module. It solves the equation of motion with the state-space method ([29]). The hydrodynamic analysis is coupled to a module that solves the cable dynamics by a finite element approximation. Slow-drift effects may be investigated within the time domain ([30]). Damage conditions, such as line breakage, may also be included. The degree of accuracy that linear-potential-flow-based models can reach when used to simulate extreme waves is a subject of recent studies ([13,22,31]), and it is clearly expected to be larger in deep-water, where non-linearities are less important.
The numerical code provides several results in the frequency or time domain, e.g., structure position or velocity or acceleration, RAO response, cable or joint forces, etc. For the purpose of this analysis, the results of whole tension on cable and chains and the rigid body movements in the time domain are considered.

4.2. Design of the Mooring Schemes

The CALM system appeared to be the more feasible among those suited to deep waters that allow a free re-orientation of the device to the incoming waves. The mooring design was an interactive procedure, since changes on one element have consequences on the whole response. The proposed scheme is meant to be a preliminary design, e.g., it did not consider ULS conditions due to chain failure.
The device was reproduced through the design module system where two parts were created to allow a relative pitch motion between the two pontoons. A rigid hinge was placed between the two parts to assure a correct device representation.
Three CALM mooring schemes were designed and investigated. In each scheme, the device is linked to a front catenary moored buoy. The schemes were simulated under several ordinary and extreme WSs (WSs nos. 4, 6, 7, 10, 11, see Table 2) with different wave obliquities (i.e., 0°, 20°, 40°, 60°). In particular, extreme WSs aimed at the selection of the mooring chains, whereas ordinary WSs aimed at achieving information on the device movements, and hence, indirectly, on the power production.
Figure 15 shows the plan view of the three schemes and Table 6 summarises the characteristics of the mooring chains.
The first scheme consists of a front buoy (diameter 8 m) moored to the sea bottom by means of four steel chains (see Figure 15a black lines).
The second scheme examines the redundancy of the buoy mooring chains aiming at decreasing the mooring forces on each chain and so its maximum resistance, i.e., its material costs. Therefore, the number of the front buoy mooring chains is increased from 4 to 8 (see Figure 15a grey lines). To avoid crash with closer devices, a rear chain is introduced to limit the sway.
For each mooring line, the chain mass unit was selected based on a sensitivity analysis under the most energetic WS. The results led to the selection of heavier chains at the front side—the most exposed side—with respect to the lateral or rear side.
The third configuration is similar to the second scheme, but it comprises a second smaller buoy (diameter 4 m) in the rear side of the device to increase the overall stability (Figure 15b). In place of a long rear chain, three shorter chains are designed. The total maximum weathervaning range is equal for the three schemes.
In all the three schemes, the device is connected to the front moored buoy by means of an elastic cable to assure a larger mooring compliancy effect, with a diameter of 88 mm, a weight of 3.2 kg/m, a length of 40 m, a stiffness of 30,000 N/m, and a maximum tension of 1100 KN.

4.3. Mooring Forces and Device Movements

The results of the numerical simulations are reported in terms of: (i) forces acting on the mooring lines, (ii) surge movements (amplitudes of the oscillations), and (iii) the pitch movements which are correlated to the device power production.
The results do correspond to the statistical values of the times histories representing the mean value of the upper 10% for the displacements and of the upper 2% for the forces (to characterize the extreme force F1/50).
The forces on the mooring lines and the surge movements for each body composing the mooring scheme were found. Readers interested in retrieving the actual results are directed to the archive service [32], where the data have been uploaded in form of tables.
Overall, the device movements increase with increasing wave height and obliquity, and the device movements are larger than those of the restraining buoys. The surge motions of the front and of the rear pontoons are essentially equal and their differences are due to the relative movements of the gravity center and to the numerical approximations.
Under perpendicular waves, the device surge reaches approximately 20 m. The chain loads are symmetrical, well below the design maxima and contribute effectively to the device station keeping.
Under oblique waves, the movements are non-symmetrical and the buoy movements are more erratic. The asymmetric movements induce asymmetric loads and much larger values of the maximum load.
Basically, the mooring design had to be verified for WS11 (Table 1) for β = 60°, since this wave attack induces both the maximum loads (that must be smaller than the chain resistance) and the larger displacements (that should avoid collision among devices). Obviously, the design is such that the loads are within the design maxima (Table 6).
The most loaded chain is the one facing the wave direction, e.g., for the mooring scheme no. 2 the maximum load is applied to chain 1b under perpendicular waves and to chain 8b under very oblique waves. Figure 16 shows the variation of the force acting on chain 1b (see Figure 15a) with respect to PW and β. The force linearly increases with PW. A different growth rate is observed for ordinary and extreme WSs, since the interaction among the chains is larger in the latter case. The value of β plays a significant role, especially in case of the extreme WSs. The forces for β = 60° have an almost double value with respect to the case of β = 0°. In fact, the WEC oscillates between a fully weathervaning under the larger waves and the initial position under the smaller waves.
The elastic cable, being more compliant, is not significantly loaded, as it absorbs a limited part of the external forces. Figure 17 shows the forces acting on the cable between the buoy and the front pontoon as a function of PW and β. The force-displacement relation is almost perfectly linear, as it is expected due to the elastic characteristic of the connection. The higher values of the forces are found for β = 60°, in agreement with the results in Figure 16.
The comparison between mooring schemes no. 1 and no. 2 proves that the chain redundancy reduces the extreme loads and therefore the design size of the chains.
The mooring configuration no. 3 shows larger loads on the chain that connects the Dexa to the rear buoy. It was also observed that an insufficient stiffness of the rear chain leads the system becoming unstable.

4.4. Effects of the Rear Mooring

In the cases of the first and second mooring configurations, a few unstable events were observed under oblique wave attacks during the weathervaning motion of the device (WS10, 11 for β = 40° and WS7, WS10, WS11 for β = 60°). This phenomenon is not observed in case of the third mooring configuration, that includes an additional buoy at the rear of the device (Figure 15, bottom).
Figure 18 shows the sway and surge motions of the rear pontoon and the surge motions of the front buoy in time. These motions are compared, for the second and third mooring schemes, relatively to an example case (WS7, β = 60°).
The first sub-plot of Figure 18 shows the sway motion for the rear pontoon. It is evident that the sway increases in time for the second mooring layout, in the absence of an external forcing. The device shows large sway oscillations which eventually compromise the stability and survivability of the overall system. The inclusion of the rear buoy effectively limits such effect avoiding the potential crash between adjacent devices.
The second sub-plot of Figure 18 shows the surge motion for the rear pontoon. The surge is large but does not point out any unstable response. In case of the third mooring configuration the surge is also reduced, entailing a reduction of the force on the rear chain.
The third sub-plot of Figure 18 shows the surge motion for the front buoy. In the third mooring configuration, the front buoy has slightly higher surge peaks, meaning that the addition of the rear buoy increases the overall system resistance. These peaks lead to a marginal increase of the forces on the buoy mooring lines, which however are still far away from the maximum admissible tension values.
The results in Figure 18 confirm the relevance of the design of the rear moorings, considering the stability of the overall installation and the need to optimize the use of the marine space (including the placement of the device in a wave array).
Mooring scheme no. 3 is considered the best tested configuration because it shows an increase of the overall system survivability by avoiding unstable device drift due to the sway motion and it is not expected to substantially affect the power production, since the presence of the rear buoy does not reduce the device pitch motion.

4.5. Cost of the Mooring Layouts

The total investment for the WEC is related to the whole life cycle, including the construction, installation, maintenance, and demolition phases. Reference [33] pointed out the importance of the mooring systems for WEC installations and [1] suggested that the construction and installation phases constitute up to 30% of the total cost.
This subsection aims at comparing the proposed mooring alternatives from an economical point of view, based on the mooring characteristics given in Subsection 4.2. The order of magnitude of the total costs is evaluated based on the total weight of the chains. A unit value of 5€/kg could be assumed as order of magnitude, and includes assembly, transportation, and positioning.
Table 7 reports the weight of the chains and anchors for the three mooring schemes. The additional elastic rope is common to all alternatives, and the presence of the buoys is considered to be negligible. The selection the anchor typology is based on the holding anchor capacity, and the order of magnitude of the cost is 10 €/KN of loading capacity.
In conclusion, the costs for the three mooring schemes are similar, to the order of 500,000 €, regardless of the different number of lines and anchors. The redundancy of the mooring lines limits the forces, and therefore the required resistance and weight of the chains, and ultimately the costs.

5. Conclusions

This paper focused on the design and analysis of the performance of the mooring system of a floating wave energy converter of the wave activated body type in terms of device movements, forces on the mooring lines, and power production.
The device is composed by two rigid pontoons with a hinge in between, which allows each pontoon to pivot in relation to the other, and this relative motion activates the PTO system.
Two different mooring layouts are suggested, a spread and a CALM scheme, suited to shallow and deep waters respectively. These layouts were analyzed by means of physical model tests, in the case of shallow water; and by using a numerical commercial code in deep water.
The experimental investigation of the spread scheme focused on the effects of different PTO resistance and of three pretension levels of the mooring lines. The numerical modelling of the CALM scheme examined the effects of the number of mooring lines and on the design of the rear mooring. The rear mooring has the purpose of reducing the device sway movements to avoid collisions between adjacent devices.
The power production increases by increasing the mooring compliancy. The best performance is achieved when the mooring lines are initially slack, with a decrease of the 16% of the average power production changing from a slack to a taut configuration.
The maximum power production is obtained for both regular and irregular waves in correspondence of the same combination of the PTO resistance and of the mooring pre-tension level. This result endorses the best practice to optimize the mooring-PTO configuration under regular waves only, with obvious reduction of time and costs, and use then the result in the irregular wave testing.
The selection of the chains used in the mooring schemes has to take into account the direction of the incoming waves, with heavier chains at the front and lighter chains at the back. An asymmetric layout—as for the weight of the chains—has to be preferred as a compromise among stability, compliancy, and costs.
The redundancy of the mooring lines decreases the loads acting on the lines without increasing the costs, overall contributing to a more reliable design especially under oblique waves.
The design of the rear moorings were found to be of outmost importance for the survivability of the device itself. A single rear chain is subjected to large loads and may fail for oblique waves.
It is therefore suggested an original CALM configuration with the inclusion of an additional rear buoy, leading to an effective reduction of the device drift and thus of the loads on the rear mooring lines. The rear buoy does not significantly change the device pitch movements, hence this configuration is not expected to significantly affect the power production.

Author Contributions

The authors contributed in equal measure to each step of the research.

Acknowledgments

The authors gratefully acknowledge the precious contribution of Elisa Angelelli and the assistance and valuable suggestions of the staff at Aalborg University.

Conflicts of Interest

The authors declare no conflict of interest.

References

  1. Fitzgerald, J. Position Mooring of Wave Energy Converters. Ph.D. Thesis, Chalmers University of Technology, Goteborg, Sweden, 2009. [Google Scholar]
  2. Thomsen, J.B.; Ferri, F.; Kofoed, J.P.; Black, K. Cost Optimization of Mooring Solutions for Large Floating Wave Energy Converters. Energies 2018, 11, 159. [Google Scholar] [CrossRef]
  3. Harris, R.E.; Johanning, L.; Wolfram, J. Mooring Systems for Wave Energy Converters: A review of Design Issues and Choices; Heriot-Watt University: Edinburgh, UK, 2004. [Google Scholar]
  4. Det Norske Veritas. Offshore standard DNV-OS-E301 Position Mooring; Det Norske Veritas: Oslo, Norway, October 2010. [Google Scholar]
  5. Johanning, L.; Smith, G.; Wolfram, J. Measurements of static and dynamic mooring line damping and their importance for floating WEC devices. Ocean Eng. 2007, 43, 1918–1934. [Google Scholar] [CrossRef]
  6. Zanuttigh, B.; Angelelli, E.; Kofoed, J.P. Effects of mooring systems on the performance of a wave activated body energy converter. Renew. Energy 2013, 57, 422–431. [Google Scholar] [CrossRef]
  7. Cerveira, F.; Fonseca, N.; Pascoal, R. Mooring System Influence on the Efficiency of Wave Energy Converters. Int. J. Mar. Energy 2013, 3, 65–81. [Google Scholar] [CrossRef]
  8. Moura Paredes, G.; Palm, J.; Eskilsson, C.; Bergdahl, L.; Taveira-Pinto, F. Experimental investigation of mooring configurations for wave energy converters. Int. J. Mar. Energy 2016, 15, 56–67. [Google Scholar] [CrossRef]
  9. Zanuttigh, B.; Angelelli, E.; Bellotti, G.; Romano, A.; Krontira, Y.; Troianos, D.; Suffredini, R.; Franceschi, G.; Cantù, M.; Airoldi, L.; et al. Boosting Blue Growth in a Mild Sea: Analysis of the Synergies Produced by a Multi-Purpose Offshore Installation in the Northern Adriatic, Italy. Sustainability 2015, 7, 6804–6853. [Google Scholar] [CrossRef] [Green Version]
  10. Vicente, P.; Falcão, A.; Gato, L.; Justino, P. Dynamics of arrays of floating point-absorber wave energy converters with inter-body and bottom slack-mooring connections. Appl. Ocean Res. 2009, 31, 267–281. [Google Scholar] [CrossRef]
  11. Davidson, J.; Ringwood, J. Mathematical modelling of mooring systems for wave Energy converters—A review. Energies 2017, 10, 666. [Google Scholar] [CrossRef]
  12. Thomsen, J.B.; Kofoed, J.P.; Delaney, M.; Banfield, S. Initial Assessment of Mooring Solutions for Floating Wave Energy Converters. In Proceedings of the 26th International Ocean and Polar Engineering Conference, Rhodes, Greece, 26 June–1 July 2016. [Google Scholar]
  13. Palm, J.; Eskilsson, C.; Paredesy, G.M.; Bergdahl, L. CFD Simulation of a Moored Floating Wave Energy Converter. In Proceedings of the 10th European Wave and Tidal Energy Conference, Aalborg, Denmark, 2–5 September 2013. [Google Scholar]
  14. Zanuttigh, B.; Angelelli, E. Experimental investigation of floating wave energy converters for coastal protection purpose. Coast. Eng. 2013, 80, 148–159. [Google Scholar] [CrossRef]
  15. Zheng, S.; Zhang, Y.; Sheng, W. Maximum wave energy conversion by two interconnected floaters. J. Energy Resour. Technol. 2016, 138, 032004. [Google Scholar] [CrossRef]
  16. Zhang, X.; Lu, D.; Guo, F.; Gao, Y.; Sun, Y. The maximum wave energy conversion by two interconnected floaters: Effects of structural flexibility. Appl. Ocean Res. 2018, 71, 34–47. [Google Scholar] [CrossRef]
  17. Zanuttigh, B.; Angelelli, E.; Castagnetti, M.; Kofoed, J.K.; Clausens, L. The wave field around DEXA devices and implications for coastal protection. In Proceedings of the 9th European Wave and Tidal Energy Conference, Southampton, UK, 5–9 September 2011. [Google Scholar]
  18. Aalborg University. AwaSys Homepage. Available online: http://hydrosoft.civil.aau.dk/AwaSys (accessed on 18 December 2018).
  19. de O Falcão, A.F. Control of an oscillating water column wave power plant for maximum energy conversion. Appl. Ocean Res. 2002, 24, 73–82. [Google Scholar] [CrossRef]
  20. Martinelli, L.; Zanuttigh, B.; Kofoed, J.P. Selection of design power of wave energy converters based on wave basin experiments. Renew. Energy 2011, 36, 3124–3132. [Google Scholar] [CrossRef]
  21. Peretta, S.; Ruol, P.; Martinelli, L.; Tetu, A.; Kofoed, J.P. Effect of a negative stiffness mechanism on the performance of the weptos rotors. In Proceedings of the VI International Conference on Computational Methods in Marine Engineering, Rome, Italy, 15–17 June 2015; pp. 132–144. [Google Scholar]
  22. Ruiz, P.M.; Ferri, F.; Kofoed, J.P. Experimental validation of a wave energy converter array hydrodynamics tool. Sustainability 2017, 9, 115. [Google Scholar] [CrossRef]
  23. Angelelli, E. Hydrodynamic Induced by an Array of Wave Energy Converters. Experimental and Numerical Analysis. Ph.D. Thesis, University of Bologna, Bologna, Italy, 2014. [Google Scholar]
  24. Beels, C.; Troch, P.; Kofoed, J.P.; Frigaard, P.; Kringelum, J.V.; Kromann, P.C.; Donovan, M.H.; De Rouck, J.; De Backer, G. A methodology for production and cost assessment of a farm of wave energy converters. Renew. Energy 2011, 36, 3402–3416. [Google Scholar] [CrossRef]
  25. Azzellino, A.; Ferrante, V.; Kofoed, J.P.; Lanfredi, C.; Vicinanza, D. Optimal siting of offshore wind-power combined with wave energy through a marine spatial planning approach. Int. J. Mar. Energy 2013, 3–4, e11–e25. [Google Scholar] [CrossRef]
  26. Vasileiou, M.; Loukogeorgaki, E.; Vagiona, D.G. GIS-based multi-criteria decision analysis for site selection of hybrid offshore wind and wave energy systems in Greece. Renew. Sustain. Energy Rev. 2017, 73, 745–757. [Google Scholar] [CrossRef]
  27. Martins-Rivas, H.; Mei, C.C. Wave Power Extraction from an Oscillating Water Column at the Tipo of a Breakwater. J. Fluid Mech. 2009, 626, 395–414. [Google Scholar] [CrossRef]
  28. Newman, J.N. Algorithms for the Free-Surface Green Function. J. Eng. Math. 1985, 19, 57–67. [Google Scholar] [CrossRef]
  29. Journée, J.M.J.; Massie, W.W. Offshore Hydromechanics. Delft University of Technology. Available online: https://ocw.tudelft.nl/wp-content/uploads/OffshoreHydromechanics_Journee_Massie.pdf (accessed on 14 December 2018).
  30. Chakrabarti, S.K. Numerical Models in Fluid-Structure Interaction; WIT Press: Southampton, UK, 2004. [Google Scholar]
  31. Thomsen, J.B.; Ferri, F.; Kofoed, J.P. Screening of available tools for dynamic mooring analysis of wave energy converters. Energies 2017, 10, 853. [Google Scholar] [CrossRef]
  32. Supplementary Material. Available online: https://doi.org/10.5281/zenodo.2243683 (accessed on 13 December 2018).
  33. Astariz, S.; Iglesias, G. The economics of wave energy: A review. Renew. Sustain. Energy Rev. 2015, 45, 397–408. [Google Scholar] [CrossRef]
Figure 1. 3D rendering image showing a single DEXA device at full scale (from www.dexawave.com).
Energies 11 03535 g001
Figure 2. Models of the wave activated bodies with spread mooring system, in scale 1:60. H = 0.45 m; LC ≈ 2.00/1.30/1.00 m; L1 ≈ L3 ≈ 0.15/1.08/1.41 m (measured along their axis); L2 = 0.22 m
Energies 11 03535 g002
Figure 3. Scheme of the wave farm line in scale 1:60 (incident waves come from the left side). Black numbers represent the wave gauges (WGs). The distances are in meter.
Energies 11 03535 g003
Figure 4. From the left to the right: PTO resistance optimization under 10 RWs for the configuration with LC = 80, 65, 50%. Five PTO rigidities were analysed for LC = 80%, and six PTO rigidities were analysed for LC = 65% and 50%. r1 is the less rigid configuration, r6 is the most rigid one. The optimal PTO resistance is r4 for LC = 80% and r5 for LC = 65% and 50%.
Energies 11 03535 g004
Figure 5. Mooring pre-tension level optimization based on the best PTO resistance, under 10 RWs (in terms of l/LP). For an easier comprehension the same symbols and colors adopted in the previous figure were maintained. Values of PPTO for LC = 80%, 65%, 50% are with triangles, circles, and squares respectively. Blue color indicates the r4 resistance, whereas red color indicates the r5 resistance.
Energies 11 03535 g005
Figure 6. Power production performance in function of l/LP under IR WSs. Blue triangles, red circles and green squares for LC = 80%, 65%, and 50% respectively (each with its best PTO resistance). LC = 80% is confirmed as the best mooring pre-tension level.
Energies 11 03535 g006
Figure 7. Possible canonical movements of the device under exam.
Energies 11 03535 g007
Figure 8. WS3: Measured relative pitch between the pontoons and power production PPTO, for all PTO setting and mooring configurations, under the same irregular waves (WS3).
Energies 11 03535 g008
Figure 9. Relation between the relative pitch (upper 10% quantile) between the pontoons and the power production PPTO, (a) using optimal PTO setting: regular waves; (b) irregular waves.
Energies 11 03535 g009aEnergies 11 03535 g009b
Figure 10. Relation between the relative (a) and average (b) pitch and incident wave power PW (optimal PTO setting, IR).
Energies 11 03535 g010
Figure 11. Relation between the relative pitch and the pitch in absence of damping.
Energies 11 03535 g011
Figure 12. Relation between the relative pitch and the pitch in absence of damping.
Energies 11 03535 g012
Figure 13. F1/50 of the reliable signals of the force under perpendicular and oblique waves (with LC = 80%) for ordinary and extreme WSs.
Energies 11 03535 g013
Figure 14. F1/50 of the force acting on the FL for the three mooring pre-tension levels.
Energies 11 03535 g014
Figure 15. (a) Scheme of the first and second mooring configuration. In the first configuration the buoy was moored with the four black lines (from 1a to 4a), whereas in the second configuration the buoy was moored with the eight grey dashed lines (from 1b to 8b); (b) Scheme of the third mooring configuration with the addition of a rear buoy.
Energies 11 03535 g015
Figure 16. Relation between the available wave power PW and the force acting on the most stressed buoy chain.
Energies 11 03535 g016
Figure 17. Relation between the available wave power PW and the force acting on the cable connection.
Energies 11 03535 g017
Figure 18. Comparison between the second (one buoy) and third (two buoys) mooring configurations. Dashed lines represent the results of the third mooring layout compared with the second layout (continuous lines). From top to bottom: sway of the rear pontoon, surge of the rear pontoon, surge of the buoy. The addition of the rear buoy avoids the signal drift (visible for the sway motion).
Energies 11 03535 g018
Table 1. Regular WSs used to evaluate the best PTO resistance, values in 1:1 scale. H is the wave height, T is the wave period, L is the wave length, l/L is the ratio device–peak wave length, and so is the wave steepness.
WSH (m)T (s)L (m)l/L (-)so (-)
Regular WSs
11.445.58481.210.03
22.166.82720.820.03
32.527.44840.700.03
43.248.681080.540.03
53.609.301200.490.03
63.969.911320.450.03
74.3210.531440.410.03
84.6811.231560.380.03
95.0411.851680.350.03
105.4012.551800.330.03
Table 2. Irregular WSs used to evaluate the device performance, values at prototype scale. Hs is the significant wave height, TP is the peak wave period, LP is the peak wave length, l/LP is the ratio device–peak wave length, and sop is the wave steepness.
WSHs (m)TP (s)LP (m)l/LP (-)sop (-)
Ordinary WSs
12.05.5848.61.210.041
22.06.9774.40.790.027
33.07.4483.40.700.036
43.08.37102.00.580.03
54.09.84130.20.450.031
65.011.23156.60.380.032
Extreme WSs
78.013.09190.80.310.042
88.014.02207.00.280.039
98.613.09190.80.310.045
109.013.79202.80.290.044
1110.014.48215.40.270.047
Table 3. Device performance under ordinary IR WSs, values in 1:1 scale. PW is the available wave power, PPTO is the generated power by the PTO system, η is the device efficiency, k CW is the non-dimensional capture width and β is the incoming wave direction.
DirectionPre Tension LevelWS123456
l/LP1.210.790.70.580.450.38
β1 = 0°LC = 80%PW (kW)155.5291.2656.1822.81250.52177.9
PPTO (kW)51.798.2141.2179124.3128.5
η33.30%33.70%21.50%21.80%9.90%5.90%
k CW1.0130.6690.3780.3180.1120.056
LC = 65%PW (kW)215.9304.3685719.21524.62620.6
PPTO (kW)39.5107.2164.1132.2136.4144.2
H24.20%26.60%21.90%17.70%9.40%5.50%
k CW0.7360.5280.3850.2580.1060.053
LC = 50%PW (kW)169.5251.2592.2737.91443.62095.8
PPTO (kW)4166.8129.8130.7135.2115.6
H18.30%35.20%24.00%18.40%8.94%5.50%
k CW0.5570.6990.4220.2680.1010.053
β1 = 10°LC = 80%PW (kW)-251602.3719.41422.22175.1
PPTO (kW)-83.7150.6133.9150.6133.9
H-35.50%24.30%17.60%10.40%6.20%
k CW-0.6690.3780.3180.1120.056
β1 = 20°LC = 80%PW (kW)-301.2686920.21438.92777.4
PPTO (kW)-100.4150.6133.9133.9133.9
H-31.50%20.40%14.50%8.90%4.60%
k CW-0.6250.3590.2110.1010.044
Table 4. Amplitudes of the device motion in full scale. Data, derived from the MTi, were elaborated through a time domain analysis. The data represent the statistical value of the 10% of the highest points for each ordinary WS for the three LC.
DoFPre-TensionOrdinary Wave States
WS 1WS 2WS 3WS 4WS 5WS 6
l/LP = 1.21l/LP = 0.79l/LP = 0.70l/LP = 0.58l/LP = 0.45l/LP = 0.38
Surge (m)LC = 80%0.600.721.021.562.222.76
LC = 65%0.540.721.081.682.463.06
LC = 50%0.600.721.261.923.003.66
Heave (m)LC = 80%0.962.103.063.604.085.10
LC = 65%0.781.802.583.304.024.74
LC = 50%0.901.322.283.304.384.86
Sway (m)LC = 80%0.180.300.600.720.841.02
LC = 65%0.240.300.420.661.381.02
LC = 50%0.180.300.480.840.901.26
Roll (°)LC = 80%2.62.53.53.23.13.6
LC = 65%4.72.62.83.34.13.6
LC = 50%2.62.02.83.23.33.9
Yaw (°)LC = 80%5.37.311.112.914.115.7
LC = 65%3.55.08.612.213.215.1
LC = 50%3.33.97.711.713.413.1
Table 5. Amplitudes of the translations by varying the incoming wave direction β for the slack mooring configuration (LC = 80%). Values are in full scale.
DoFDirectionOrdinary Wave States
WS 1WS 2WS 3WS 4WS 5WS 6
l/LP = 1.21l/LP = 0.79l/LP = 0.70l/LP = 0.58l/LP = 0.45l/LP = 0.38
Surge (m)β1 = 0°0.600.721.021.562.222.76
β1 = 10°-0.691.031.513.044.15
β1 = 20°-0.650.991.562.814.57
Heave (m)β1 = 0°0.962.103.063.604.085.10
β1 = 10°-2.093.103.595.395.56
β1 = 20°-2.273.113.884.956.46
Sway (m)β1 = 0°0.180.300.600.720.841.02
β1 = 10°-0.901.201.622.242.05
β1 = 20°-1.212.012.222.853.77
Table 6. Main mooring chain characteristics.
ChainLength (m)Mass Unit Length (kg/m)Equivalent Diameter (m)Equivalent Cross Section (cm2)Max Tension (KN)Stiffness EA (KN)
1a125910.06432.153130643072
Rear406910.06432.153130643072
2a, 4a125700.05624.612430492352
1b, 2b125560.05019.621960392500
9c129.5560.05019.621960392500
11c, 12c134.5560.05019.621960392500
3b, 8b12543.50.04415.201540303952
3a, 4b, 5b, 6b, 7b, 10c125320.03811.331160226708
Table 7. Cost analysis of the three mooring schemes. The total cost does not include the buoys, the elastic rope, and the steel anchors.
Buoy Mooring ConfigurationTotal Weight Front Chains (kg)Total weight Rear Chains (m)Total Weight (kg)Cost of the Chains (€)Anchors Total Holding Capacity (KN)Anchor Cost (€)Total Cost (€)
4 chains + rear32,87536,94669,821350,00012,980130,000480,000
8 chains + rear40,87536,94677,821390,00014,770150,000540,000
8 chains plus a rear buoy with 3 chains40,87526,31667,191335,00018,680185,000520,000

