Article

Stochastic Dynamic Response Analysis of a 10 MW Tension Leg Platform Floating Horizontal Axis Wind Turbine

1
State Key Laboratory for Alternate Electrical Power System with Renewable Energy Sources, North China Electric Power University, Beijing 102206, China
2
CAS Key Laboratory of Wind Energy Utilization, Institute of Engineering Thermophysics, Chinese Academy of Sciences, Beijing 100190, China
*
Author to whom correspondence should be addressed.
Energies 2018, 11(12), 3341; https://doi.org/10.3390/en11123341
Submission received: 2 October 2018 / Revised: 9 November 2018 / Accepted: 23 November 2018 / Published: 30 November 2018
(This article belongs to the Special Issue Sustainable Energy Systems)

Abstract

:
The dynamic response of floating horizontal axis wind turbines (FHWATs) are affected by the viscous and inertia effects. In free decay motion, viscous drag reduces the amplitude of pitch and roll fluctuation, the quasi-static mooring system overestimates the resonant amplitude values of pitch and roll. In this paper, the quasi-static mooring system is modified by introducing linear damping and quadratic damping. The dynamic response characteristics of the FHAWT modified model of the DTU 10 MW tension leg platform (TLP) were studied. Dynamic response of the blade was mainly caused by wind load, while the wave increased the blade short-term damage equivalent load. The tower base bending moment was affected by inclination of the tower and the misaligned angle βwave between wind and wave. Except the yaw motion, other degrees of freedom motions of the TLP were substantially affected by βwave. Ultimate tension of the mooring system was related to the displacement caused by pitch and roll motions, and standard deviation of the tension was significantly affected by the wave frequency response. Under the action of wave load, the viscous drag would stimulate the mooring system and increase the resonance of the platform motion.

1. Introduction

In order to cope with the increasingly serious problems of fossil energy shortages and environmental pollution, renewable energy technologies have developed rapidly in recent years. Among the various types of renewable energy, wind energy has the most promising prospects and has received wide public attention [1,2]. So far, most wind farms have been deployed onshore due to the relatively lower cost of construction, operation, and maintenance [3]. However, offshore wind farms have higher wind speeds and smaller turbulence, and they are also less sensitive to space utilization, noise constraints, visual pollution and regulation issues. What is more, they can provide more and better green energy than onshore wind farms [4,5]. Although the cost of construction, operation and maintenance of offshore wind farms is relatively higher compared to onshore wind farms, as more and more research is being invested in offshore projects, as the advantages of offshore wind farms are gradually emerging. The substantial increment of offshore wind power capacity in the future may meet the need of the demand for green energy [4].
In shallow water areas (<50 m), offshore wind turbines, such as monopiles, gravity-based structures, jackets and buckets, are usually supported by bottom-fixed foundations [6,7]; when the offshore wind turbines are constructed in deep water areas (>50 m), the floating support platform has more advantages from an economic point of view [8,9]. According to the static stability method, there are mainly three types of FHAWTs: spar type, semi-submersibles, and TLP type [9,10,11,12]. The spar-type platform is usually a stable ballast in a small horizontal plane area; the semi-submersible floater needs a large water line restoring moment to achieve sufficient stability; the TLP type is stabilized by tendons or tightened mooring lines to resists the wave-induced motions, thus reducing generator power variations and reducing the impact to the grid [6]. In the case of wind-wave alignment, both the spar platform and the semi-submersible platform showed large fatigue damage. In contrast, the limited platform motion of the TLP FHAWT could reduce the structural loads on the tower and the blades, resulting in less fatigue damage [13].
FHAWT operates in a complex environment which withstands loads from a variety of sources, including wind, wave, and ocean currents. Considering the mobility of floating platforms, FHAWT is a much more complex system than an onshore wind turbine or a stationary offshore wind turbine. Bachynski et al. conducted a series of studies in order to understand the dynamic response of the FHAWT more accurately [11,13]. According to the design considerations of a TLP FHAWT in deep sea water, they studied the design parameters of the TLP wind turbine which used full coupling simulation to evaluate the motion of the platform and the structural loads of the wind turbine components and mooring line. Significant works on TLP wind turbines had been done by the National Renewable Energy Laboratory and Massachusetts Institute of Technology [14]. Li et al. studied effects of the vertical heave motion, the aerodynamic forces and the quadratic wave forces on a TLP-type wind turbine [15]. Glosten Associates Company has designed PelaStar TLP for water depths ranging from 50 m to 200 m. This platform has the advantages of small displacement, economical to transport and install, low energy cost and capable of supporting 5–10 MW wind turbines [16]. Sant et al. conducted an experiment on TLP wind turbines, compared the power coefficient measured by the experiment with the power coefficient predicted by three independent models, and studied influences of the platform surge motion on the time average power coefficient [17]. Nihei et al. conducted a number of model tests to determine stochastic dynamic performances of three floating wind turbines on the Spar platform, TLP and semi-submersible platforms, respectively, and concluded that the TLP model showed the best performance [18]. However, due to the scale effect, the viscosity phenomenon cannot be accurately simulated in the model test.
The dynamic response of the TLP FHAWT depends on several factors such as the aerodynamic loads on the wind rotor, the hydrodynamic loads on the floating platform, the recovery effects of the mooring system, and the structural characteristics of the wind turbine and floating platform [19]. Viscous drag and inertia effects are two important factors affecting the dynamic response of FHAWT, approximate mooring systems simulated by quasi-static mooring lines (i.e., ignoring inertial effects and viscous drag) overestimates the pitch resonant amplitude values to some extent [20]. Farrugia’s research showed a linear relationship between the amplitude of the surge velocity and the amplitude of the aerodynamic load response [21], which indicated that the aerodynamic load was affected by the surge motion [22]. The experimental results of Stewart et al. showed that the quadratic damping caused by viscous drag played an important role in the low-frequency zones where the radiation damping disappears [23]. Most studies assumed that the mooring system is a quasi-static system, in order to better predict the dynamic response of FHAWT, this paper considered the inertial effect and viscous drag in the mooring system and corrected the quasi-static mooring system. The stochastic dynamic response analysis of the modified 10 MW TLP FHAWT is carried out to understand the operating law and load characteristics of the TLP FHAWT more accurately.
Most of the studies on FHAWT dynamic analysis are limited to the environmental conditions in which wind waves are assumed to have the same direction of propagation. However, according to observational data, although there is less than 5% of the incident that the angle between wind and wave is greater than 60 degrees, the angle can usually reach 30 degrees [24]. Wind and waves may be significantly misaligned, especially under stable atmospheric conditions [25]. Barj et al. [26] observed that the spar-type FHAWT wind-wave misalignment could increase the extreme side-tower loads in numerical simulations. In the monopile installed at Bockstigen by Trumars, it was observed that the lateral load was increased under a 90° misalignment conditions, but it was difficult to interpret the results due to the lack of information on environmental conditions (ECs) [27]. Aerodynamic and viscous damping are keys to determine the pitch resonance amplitude [20]. When the wave comes from a different direction with the wind direction, the aerodynamic damping is less effective in relieving the wave load [13]. Especially in the extreme case where the wind and wave direction are different from 90°, because there is no aerodynamic damping, the inertial force generated by the sway motion is likely to cause roll resonance response. It is estimated that the viscous drag and inertia effect of the mooring system would be more obvious at this time. In addition, due to the high stiffness of the mooring system, TLP is susceptible to high frequency excitation, which generates heave resonance and pitch motion, and causes fatigue damage to the mooring system. When the wind and waves misalignment, the hydrodynamic load exceeds the aerodynamic load, which dominates the system response. Therefore, the modified model including viscous drag and inertia effects is used to study the wind and wave misalignment.
The structure of this paper is as follows: Section 2 introduces the numerical method of fully coupled dynamic analysis and the environmental conditions of wind turbine operation used in TLP FHAWT modeling simulation. Aiming at the problem that the quasi-static mooring system overestimates the surge and pitch motion, a method for modifying the model is proposed. Section 3 introduces the structure of the FHAWT and the data parameters used in the modeling and simulation, also corrects the simulation model. Section 4 discusses the dynamic response characteristics of TLP FHAWT based on statistical methods and frequency domain analysis methods: (1) Compared the differences in dynamic characteristics of TLP FHAWT and equivalent onshore HAWT; (2) Analyzed the response characteristics of wind turbines with and without waves. Based on the above analysis, the impact of wind-waves misalignment on the turbine is analyzed. The effects of inertial and viscous effects on the TLP wind turbine response are also demonstrated by typical wind and wave misalignment. The conclusions are summarized in Section 5.

2. Theories and Methods

2.1. Aerodynamic Modeling

Aerodynamic load on the blade is calculated based on the blade element momentum (BEM) theory and the wake influence was calculated by the induction factor [28]. Since BEM theory is originally developed for wind-stabilized wind turbines, the transient wind field should be corrected. Assuming that the pressure/momentum loss in the plane of the wind rotor is caused by the air flowing through the rotor blade planar element, the induced velocity resulting from loss of axial and tangential momentum in the flow field can be computed, and the aerodynamic and induced velocity near the rotor can be iteratively determined. The correction factor F is:
F = 2 π cos 1 e f
Tip-Loss Model:
f = B ( R r ) 2 r sin φ
Hub-Loss Model:
f = B ( r R h u b ) 2 r sin φ
The dynamic stall model [29] is commonly used to solve the transient aerodynamic problems caused by turbulent wind, yawing, rotational speed regulation and pitch regulation. The dynamic stall phenomena of airfoils have been extensively experimentally analyzed and studied [30,31]. In the literature, the B-L mode is widely used in helicopter and wind turbine analysis [3]. When using the semi-empirical Gonzalez and Minnema/Pierce models to calculate aerodynamic loads, a reasonable hysteresis can be generated in the normal force, tangential force, and pitching moment coefficient if the model parameters are set appropriately [32]. The potential-flow model uses the analytical potential-flow solution for the surrounding flow of a cylinder to model the tower dam effect on upwind rotors. Aerodynamic loads on the tower are calculated based on tower diameter, drag coefficient, and local relative velocity between free incoming flow and analytical node structure of each tower [32].

2.2. Hydrodynamic Modeling

In the simulation calculation, it is assumed that the TLP is a rigid structure and the mooring line is represented by a finite beam element. The loads acting on the TLP include first-order wave forces, quadratic sum-frequency forces and viscous forces. The first-order wave force is processed by the linear potential flow model. The quadratic sum-frequency forces is solved according to the complete quadratic potential flow. The viscous force is provided by the semi-empirical Morison equation [33]. The potential flow model in Sesam/Wadam deduces a first-order wave transfer function, additional mass, and radiation damping [34]. The general form of the complete time-domain equation of motion for coupled wind turbines and supporting platform systems is [35]:
M i j ( q , u , t ) q ¨ j = f i ( q , q ˙ , u , t )
where M i j is the ( i , j ) component of the volumetric mass (inertia) matrix, which depends nonlinearly on the set of system degree of freedom q, control inputs u and time t; q ¨ j is the second time derivative of degree of freedom q j ; f i is the force function component associated with the degree of freedom q i ; The force function fi depends nonlinearly on the system degree of freedom and the first time derivatives (q and q ˙ respectively), as well as the control inputs u and time t.
The total external load on TLP are:
F i P l a t f o r m = A i j q ¨ j + F i H y d r o + F i L i n e s
where A i j is the ( i , j ) component of the hydrodynamic-added-mass matrix; F i H y d r o is the ith component of the applied hydrodynamic load on the TLP associated with everything but A i j ; F i L i n e s is the ith component of the applied load on the TLP from the contribution of all mooring lines; For each TLP degree of freedom q i , where q 1 is surge, q 2 is sway, q 3 is heave, q 4 is roll, q 5 is pitch and q 6 is yaw.
In hydrodynamics problems, the form of F i H y d r o is as follows:
F i H y d r o = F i W a v e + ρ g V 0 δ i 3 C i j H y d r o s t r a t i c q j 0 t K i j ( t τ ) q ˙ j ( τ ) d τ
The expression of the first term F i W a v e s on the right-hand side of Equation (6) is:
F i W a v e = 1 2 π W ( ω ) 2 π S ζ 2 S i d e d ( ω ) X i ( ω , β ) e j ω t d ω
where W ( ω ) represents a Fourier transform of a realization of the white Gaussian noise time-series process with zero mean and unit variance; S ζ 2 S i d e d represents the expected two-sided power spectral density of the wave elevation per unit time; X i ( ω , β ) represents the wave-excitation force normalized per unit wave amplitude on the TLP.
The combination of the second and third terms on the right-hand side of Equation (6) ρ g V 0 δ i 3 C i j H y d r o s t a t i c q j represents the load contribution from hydrostatics. ρ is the density of seawater; g is the gravitational acceleration; V 0 is the displaced volume of fluid when the TLP is in the undisplaced position; δ i 3 is the (i,3) component (water depth) of the Kronecker-Delta function (unit matrix), and C i j H y d r o s t a t i c is the ( i , j ) component of the linear hydrostatic-restoring matrix. The last term on the right-hand side of Equation (6), 0 t K i j ( t τ ) q ˙ j ( τ ) d τ is a convolution integral representing the load contribution from wave-radiation damping.
For mooring systems approximated by quasi-static mooring lines, the total loads on the TLP from the contribution of all mooring lines F i L i n e s would be:
F i L i n e s = F i L i n e s , 0 C i j L i n e s q j
where C i j L i n e s is the ( i , j ) component of the linearized restoring matrix from all mooring lines; F i L i n e s , 0 is the ith component of the mooring system load acting on the TLP in the undisplaced position.
It can be seen from the above equations that the mooring system fitted with a quasi-static mooring line ignores the inertia effect and the viscous drag, which overestimates the pitch and the surge resonance amplitude to some extent. Because the coupling between axial and transversal motions contributes a lot to the pitch damping [20]. In order to correct the inertia effect neglected in the mooring system, two-thirds of the total dry weight of the mooring mass is added to the quality of the supporting platform. The quadratic damping is calculated using the method proposed by Hoff [36] to correct the viscous drag that is neglected in the mooring system. The pitch motion can be considered as a single degree of freedom system, and is assumed governed by the following form of an equation:
ϕ ¨ + β F ( ϕ ˙ ) + G ( ϕ ) = 0
where ϕ is the pitch angle; F ( ϕ ˙ ) is the nonlinear pitch damping characteristics; G ( ϕ ) is the restoring moment characteristic; β is the assumed small scaling parameter.
For linear damping and quadratic damping terms:
F ( ϕ ˙ ) = b 1 ϕ ˙ + b 2 | ϕ ˙ | ϕ ˙
For small to moderate pitch angles, a positive cubic term restoring moment characteristic is usually appropriate:
G ( ϕ ) = ω 0 2 ϕ ( 1 + ε 2 ϕ 2 )
where ω 0 is the undamped natural pitch frequency.
The average energy loss rate per cycle, namely the energy loss function L ( V ) is:
L ( V ) = β T ( V ) 0 T ( V ) F ( ϕ ˙ ) ϕ ˙ d t
where T ( V ) is the periodic time of an undamped oscillation.
In the calculation of L ( V ) , V is held constant, and the variation of ϕ ( t ) thus corresponds to the case of undamped free oscillations. In this case, we can write:
U ( ϕ ) = V cos θ 0
ϕ ˙ = 2 V sin θ 0
where U ( ϕ ) = 0 ϕ G ( ξ ) d ξ ; θ 0 ( t ) is a time-dependent phase angle.
The final energy loss function L ( V ) is:
L ( V ) = β [ b 1 V A ( V ) + b 2 V 3 / 2 B ( V ) ]
where
A ( V ) = 2 T ( V ) sin 2 θ 0 ( t ) d t
B ( V ) = 2 2 T ( V ) | sin 3 θ 0 ( t ) | d t
Perform dimensionless processing on the loss function L ( V ) to get the function Q ( V )
Q ( V ) = L ( V ) 2 ω 0 V
In view of the linear and quadratic damping term format, we may convert the loss function to a non-dimensional Q ( V ) function as:
Q ( V ) = b 1 A ( V ) + b 2 D ( V )
where:
b 1 = β b 1 2 ω 0
b 2 = β b 2 2
D ( V ) = V B ( V ) ω 0
To find the appropriate value for b 1 and b 2 , assuming that there are N estimates Q ( V 1 ) , Q ( V 2 ) , , Q ( V N ) , according to the least squares method:
e = i = 1 N [ Q ( V i ) Q ( V i ) ] 2
In order to get the best b 1 and b 2 , the e is derived and to obtain the simultaneous equation of b 1 and b 2 :
e b 1 = e b 2 = 0
The final solutions b 1 and b 2 :
b 1 = S 3 S 4 S 2 S 5 S 1 S 3 S 2 2
b 2 = S 1 S 5 S 2 S 4 S 1 S 3 S 2 2
where:
S 1 = i = 1 N A 2 ( V i )
S 2 = i = 1 N A ( V i ) D ( V i )
S 3 = i = 1 N D 2 ( V i )
S 4 = i = 1 N A ( V i ) Q ( V i )
S 5 = i = 1 N D ( V i ) Q ( V i )

2.3. Environmental Conditions

Normal wind profile model are used in the operational conditions. In the normal wind profile conditions, the wind profile U(z) is the average wind speed as a function of the height z above the free water level:
U ( z ) = U r e f ( z z r e f ) α
where Uref is the reference wind speed at hub height; zref is hub height; α is the power law index, typically between 0.07 and 0.15, and the α value of the TLP FHAWT is set to 0.14 according to IEC 61400-3 [37].
Turbulent winds and irregular waves are considered related. For normal turbulence model, based on the Kaimal turbulence model for IEC Class C, turbulent wind fields are generated using the TurbSim program of NREL. For the irregular wave, the significant wave height (Hs) and Peak-spectral period (Tp) were set based on their correlation with the wind speed at the Statfjord site in the North Sea [38], and the irregular wave time history was generated by using the JONSWAP wave model.

3. Modeling and Calibration

3.1. Modeling

The 10 MW TLP FHAWT model included a 10 MW DTU wind turbine, a TLP, and a mooring system. As shown in Table 1, the wind turbine adopts the DTU 10 MW reference wind turbine developed by DTU Wind Energy and Vestas in the Light Rotor project [39]; Table 2 lists the TLP and mooring system characteristics.
In order to study the impact of wind-wave misalignment, the rotor was aligned with the wind and the direction of the wave was defined relative to the wind direction under the conditions of EC1–EC7. During the process of research, one wind direction (0°) and four-wave directions (0°, 30°, 60°, and 90°) were considered. The wind-wave misalignment angle was denoted by βwave, as shown in Figure 1.

3.2. Validation

The fully coupled aero-hydro-servo-elastic time domain simulations performed on the DTU 10 MW reference wind turbine can be carried out by using the code FAST [40] which is a wind turbine design code developed by the National Renewable Energy Laboratory (NREL). The FAST simulation model was compared with the parameters of the DTU reference wind turbine to assess the accuracy. Under the same operating conditions, the rotor speed w and the blade pitch angle θ calculated by the calculation model must be consistent with the corresponding parameters in the DTU model for a given wind speed V m/s. Thrust is the most important aerodynamic factor in the overall dynamics of a wind turbine, so the calculation model needs to match the thrust of the DTU 10 MW reference wind turbine at each wind speed section. By matching the above key system features, the test and calibration of the calculation model were completed. As can be seen from Figure 2, except for the low wind speed region of 4–7 m/s, the remaining positions are well matched. The larger error at low wind speeds is due to the fact that the simulation model uses simple PI control and does not pitch to 5° as in the DTU reference wind turbine. Therefore, a wind speed of 7 m/s and above were selected for simulation.
Surge and pitch motions are the most important in the six motions of rigid-body floating platforms because they dominate the dynamic response of the system. The experimental data of the DTU 10 MW reference wind turbine scaling model was used to test and verify the simulation results of the surge free decay motion [41]. All the experimental results were extrapolated to the full size.
The relationships between the length, the time, and the mass of the full-size model and the experimental model were shown in Equation (33). In the surge free decay motion test, the full-scale displacement of the platform in the surge direction was 6.72 m. The comparison among experimental data, FAST simulation results, and modified model simulation results including inertial effects and viscous drag were shown in Figure 3. It can be seen from the figure that the free decay motion obtained by the modified model is closer to the experimental data than the FAST simulation. And the quasi-static mooring system of FAST simulation overestimates the amplitude of the turbulence to some extent due to the neglected of viscous drag:
{ T = t λ L = l λ M = m λ 3 ρ s w / ρ f w
where λ = 60 is the geometric scaling factor; ρ s w and ρ f w are the densities of seawater and fresh water, respectively; L, T and M are the length, time and mass for the full-size model, respectively; l, t and m are the length, time and mass of the scaled experimental model, respectively.
As shown in Figure 4, the pitch resonance frequency response predicted by the modified model is smaller than it predicted by FAST. The peak value of the modified model pitch response amplitude operator (RAO) is approximately 2/3 of the peak value predicted by FAST, which is caused by the damping effects of the viscous drag on the mooring system; The natural frequency of the modified model changes from 0.1918 Hz to 0.1896 Hz because of the neglecting of viscous damping and inertia effects of the mooring system. The difference could be explained by both the viscous damping effect and the inertial effect reducing the natural frequency.
Through the surge free decay motion verification and pitch response amplitude operator test, the results showed that the modified model could provide more accurate results for the stochastic dynamic response of the 10 MW FHAWT.

4. Simulation Research

For the modified model that considered the inertial effects and viscous drag in the mooring system, a series of representative working conditions EC1–EC7 as shown in Table 3 were selected to perform a 600 s fully coupled time domain simulation. The stochastic dynamic response of FHAWT under various wind and wave conditions was studied by the statistical analysis (mean, standard deviation, maximum/minimum value) and frequency domain analysis. Firstly, the differences between TLP FHAWT and equivalent onshore HAWT responses were compared and analyzed; then the effect of waves on TLP FHAWT was studied.

4.1. Comparison of TLP FHAWT and Onshore HAWT

In this section, the equivalent onshore HAWT used the same wind turbine blade as the TLP FHAWT with the difference that the former was mounted on a fixed base on the ground. Therefore, comparing and analyzing the stochastic dynamic responses of the two could provide a solution of designing the TLP FHAWT. In the comparative analysis process, the same turbulent wind loads were applied to the TLP FHAWT and onshore HAWT while the wave load was only applied to the TLP FHAWT.
The blade root is the connecting part between the blade and the turbine hub, and the load on it can reflect the load characteristics of the blade under the coupled action of wind and wave. Figure 5 shows the statistical analysis of the blade root bending moment and the corresponding short-term damage equivalent load of the TLP FHAWT and those of the equivalent onshore HAWT. It can be seen from Figure 5a,b that the two mean values of the blade root bending moments are almost the same, which indicates that the dynamic response of the blade is mainly caused by the wind load; The difference between the two standard deviations of blade root bending moment is quite large, which is related to the effects of wave load. The maximum difference is up to 3400 kNm when the wind speed is 14.7 m/s. It can be seen from Figure 5c that short-term damage equivalent load of the out-of-plane moment My at the blade root of the TLP FHWAT is larger than that of the onshore HAWT in the mid-high wind speed. The difference reaches a maximum value of 10,480 kNm when the wind speed is 14.7 m/s, which indicates that the wave load will increase the blade fatigue damage; It can be seen from Figure 5d that short-term damage equivalent load of the in-plane moment Mx at the blade root of the TLP FHAWT is basically consistent with that of the onshore HAWT, which indicates that the pitch control can reduce the influence of the wave load on the torque fluctuation.
The stability of the nacelle is very important for the safe operation of the wind turbine. Therefore, the fore-aft displacement and corresponding accelerations at the tower-top of the TLP FHAWT and the onshore HAWT were compared and analyzed. As shown in Figure 6a, the average fore-aft displacement at the tower-top of the TLP FHAWT is slightly larger than that of the equivalent onshore HAWT, and the difference is 0.02 m at the rated wind speeds. This was caused by the surge motion of the TLP. The standard deviation of the fore-aft displacement at the tower-top of the TLP FHAWT is greater than that of the equivalent onshore HAWT, and the difference between the two increases significantly as the wave increases. It can be explained by the wave load effects from Figure 6b, which indicates that the wave load will affect the stability of the nacelle. There was a similar conclusion about the maximum value of the fore-aft displacement at the tower-top. The spectrum analysis (under the rated conditions) of Figure 6d shows that the linear acceleration at the tower-top of the onshore HAWT is more sensitive to the 3P frequency, which indicates that the tower of the TLP FHAWT is less sensitive to the passing frequency of the blades.
Moreover, the bending moment at tower base is an important factor to consider when designing the tower, so the bending moments at tower base of TLP FHAWT and equivalent onshore HAWT were investigated. It is observed in Figure 7a that the mean tower base fore-aft moment My of the TLP FHAWT is slightly greater than that of the equivalent onshore HAWT at low wind speeds, the difference reaches a maximum value of 4702.37 kNm at the rated wind speed.
This could be explained by the non-zero tilt angle of the TLP FHAWT tower causes gravity to generate bending moments. The standard deviation of fore-aft bending moment at tower base of the TLP FHAWT is greater than that of the equivalent onshore HAWT, and the difference between the two increases significantly as the wave increases. The difference reaches a maximum value of 46,525.48 kNm when the wind speed is 24.8 m/s. There was also a similar conclusion about the maximum value of fore-aft bending moment at tower base. The standard deviation could reflect the fatigue load of the structure to a certain extent and the maximum value indicated the limit load that the structure faced. Therefore, compared with the onshore HAWT, the tower of the TLP FHAWT needed an enhanced design. It is observed in Figure 7b that the tower base fore-aft moment My of the TLP FHAWT has a amplitude near the wave frequency of 0.12 Hz, again indicating that the wave load has a significant effect on the tower. There was a similar result observed for the tower base side-to-side moment Mx of TLP FHAWT.

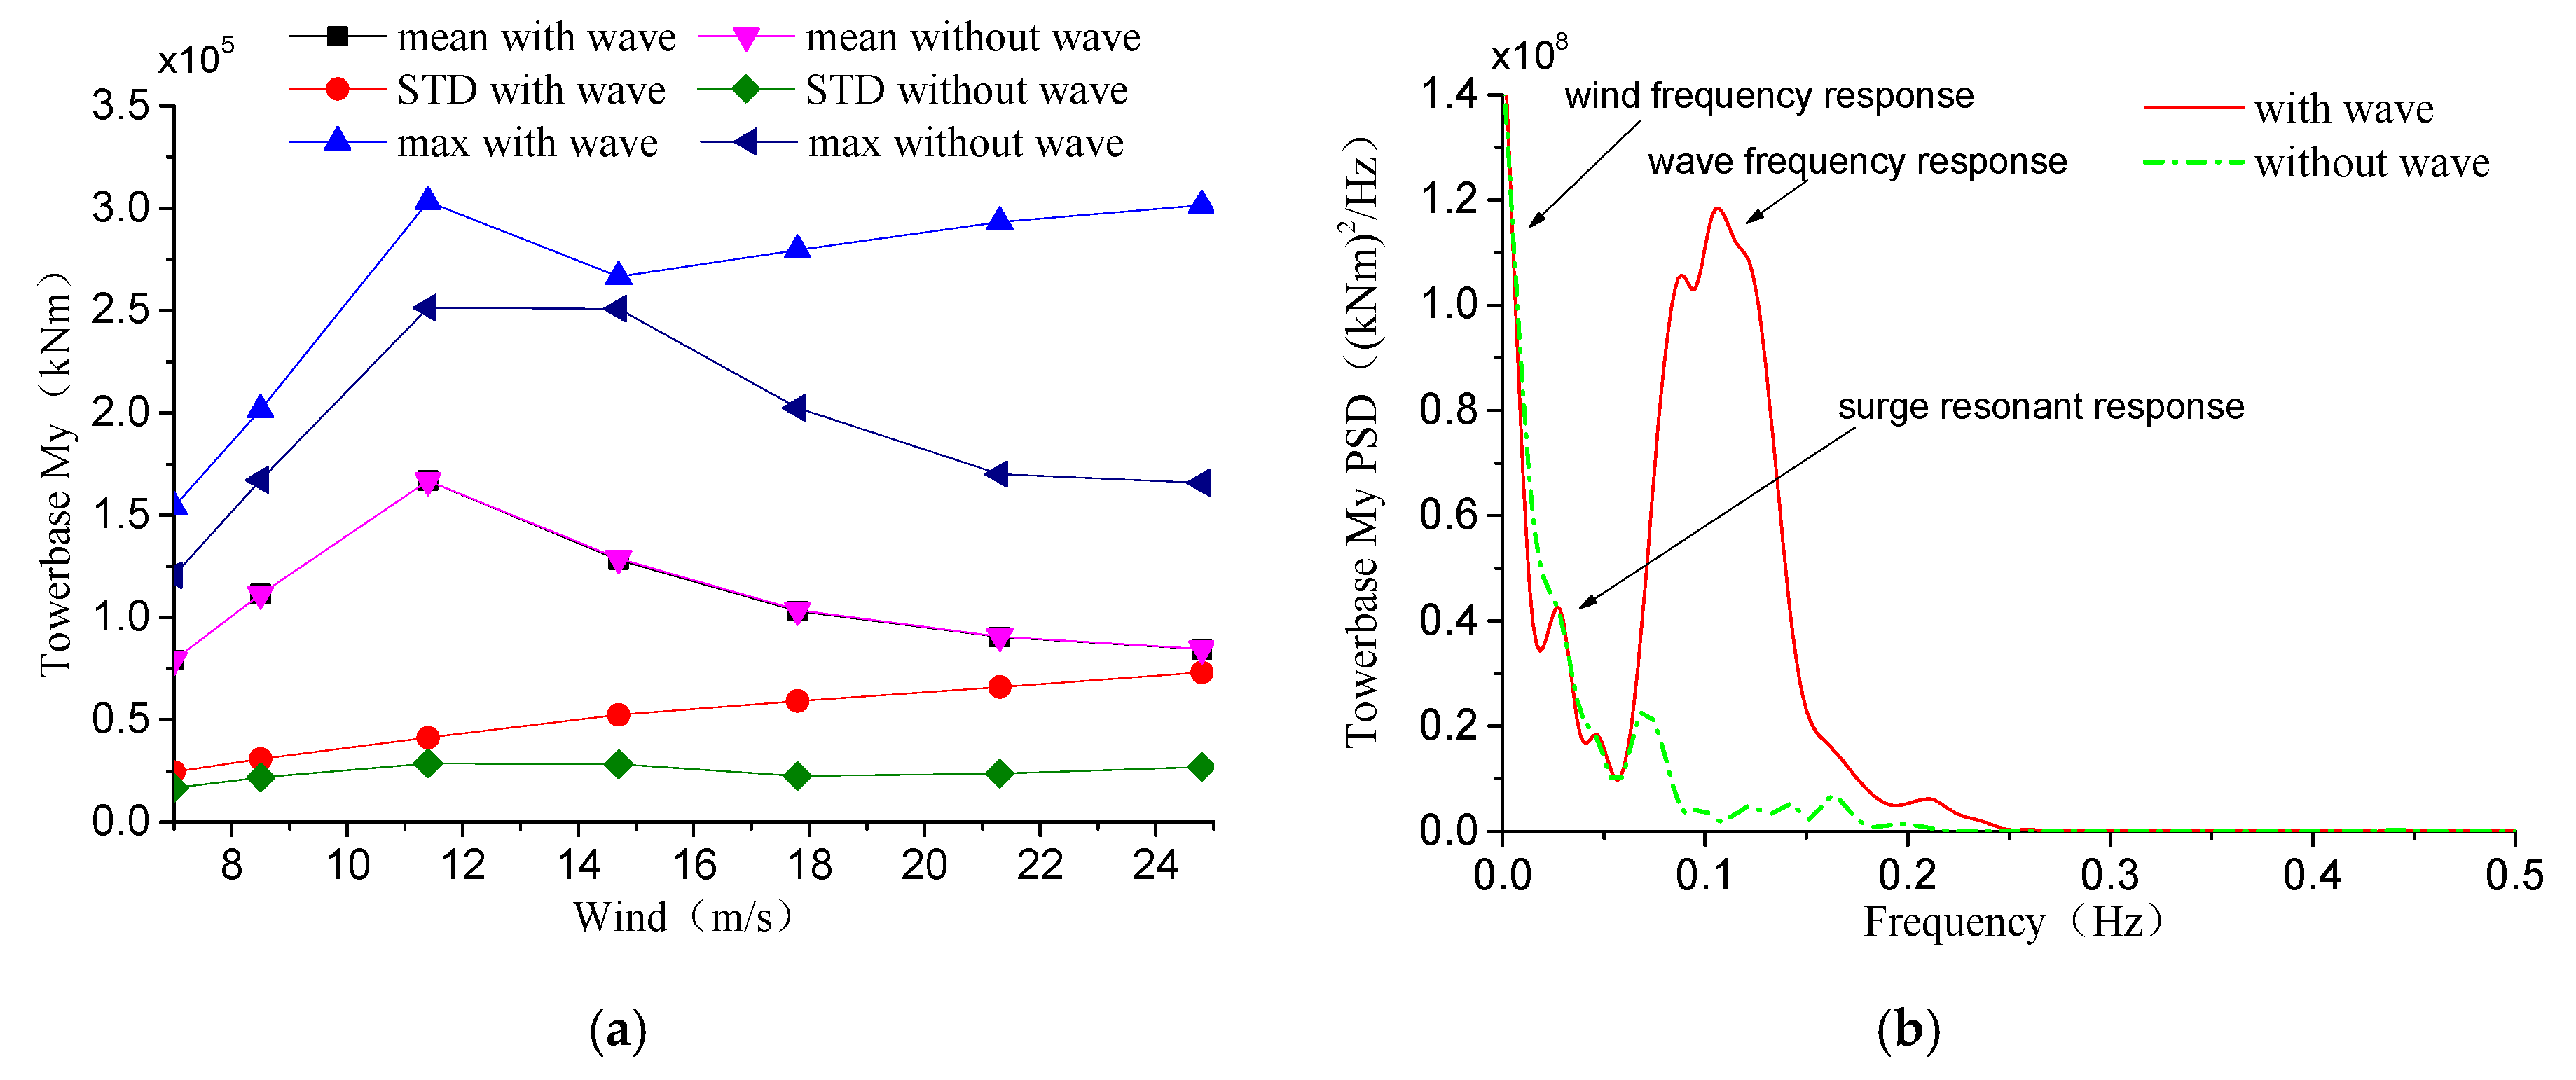
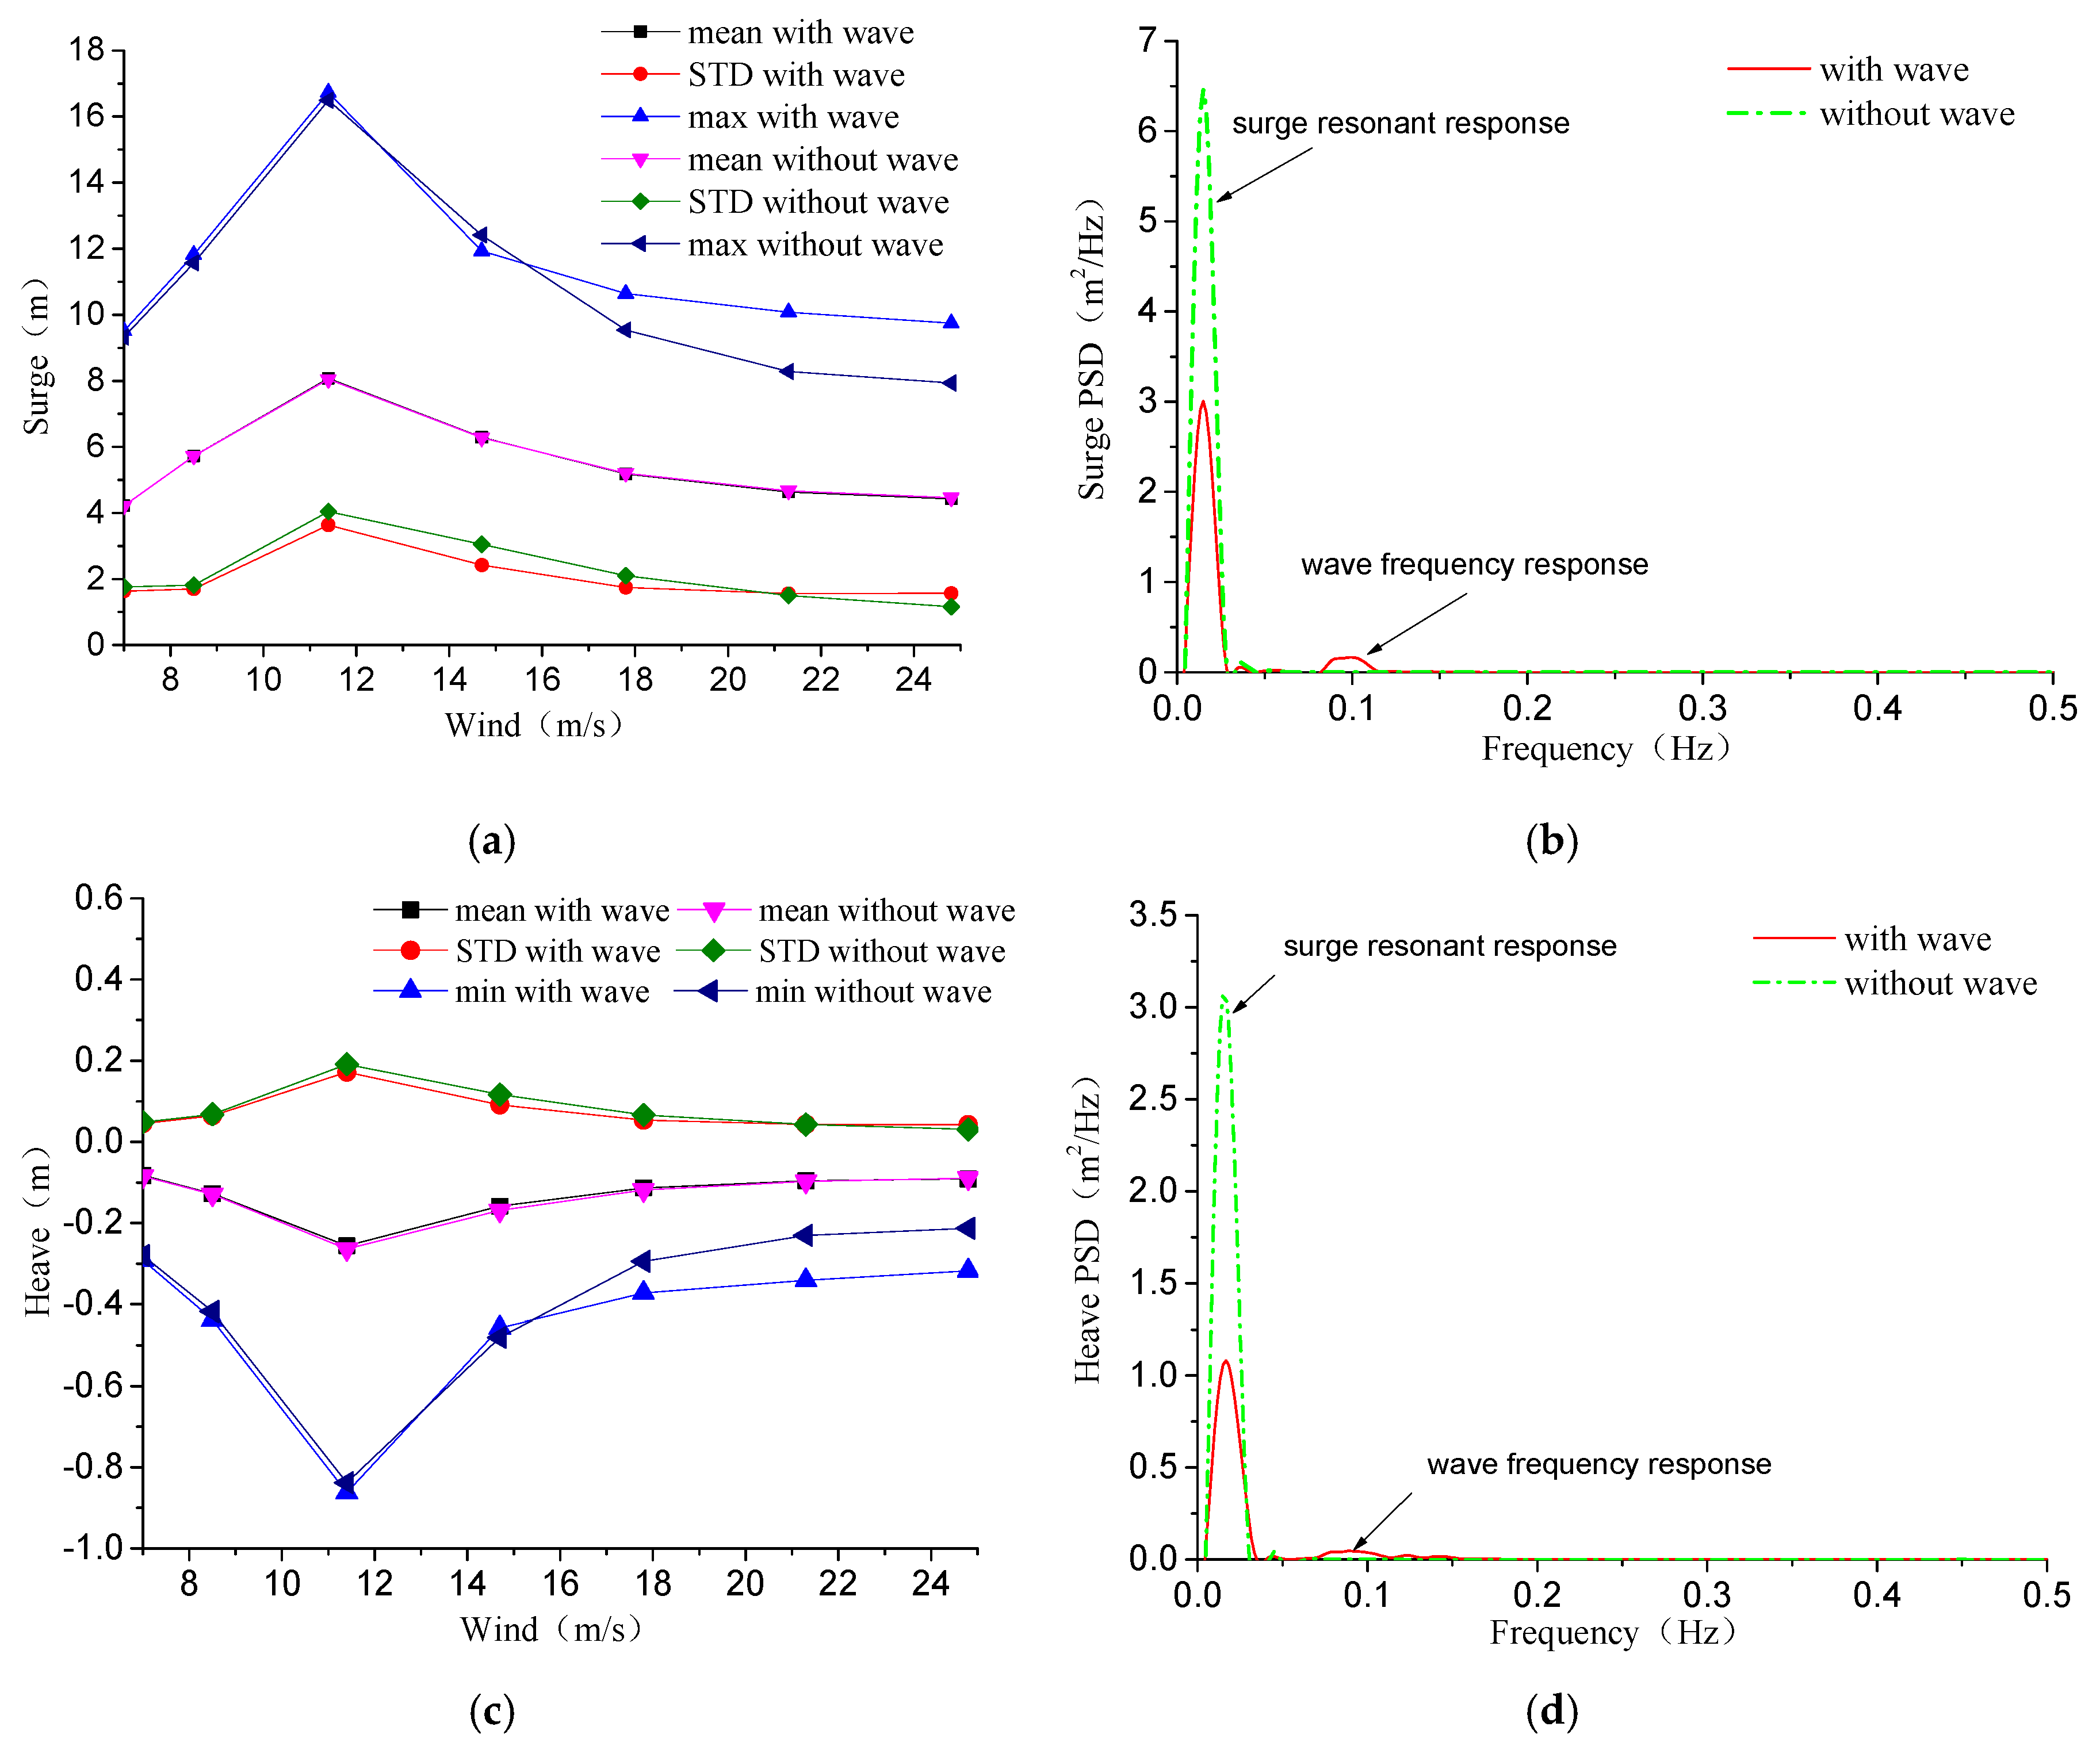
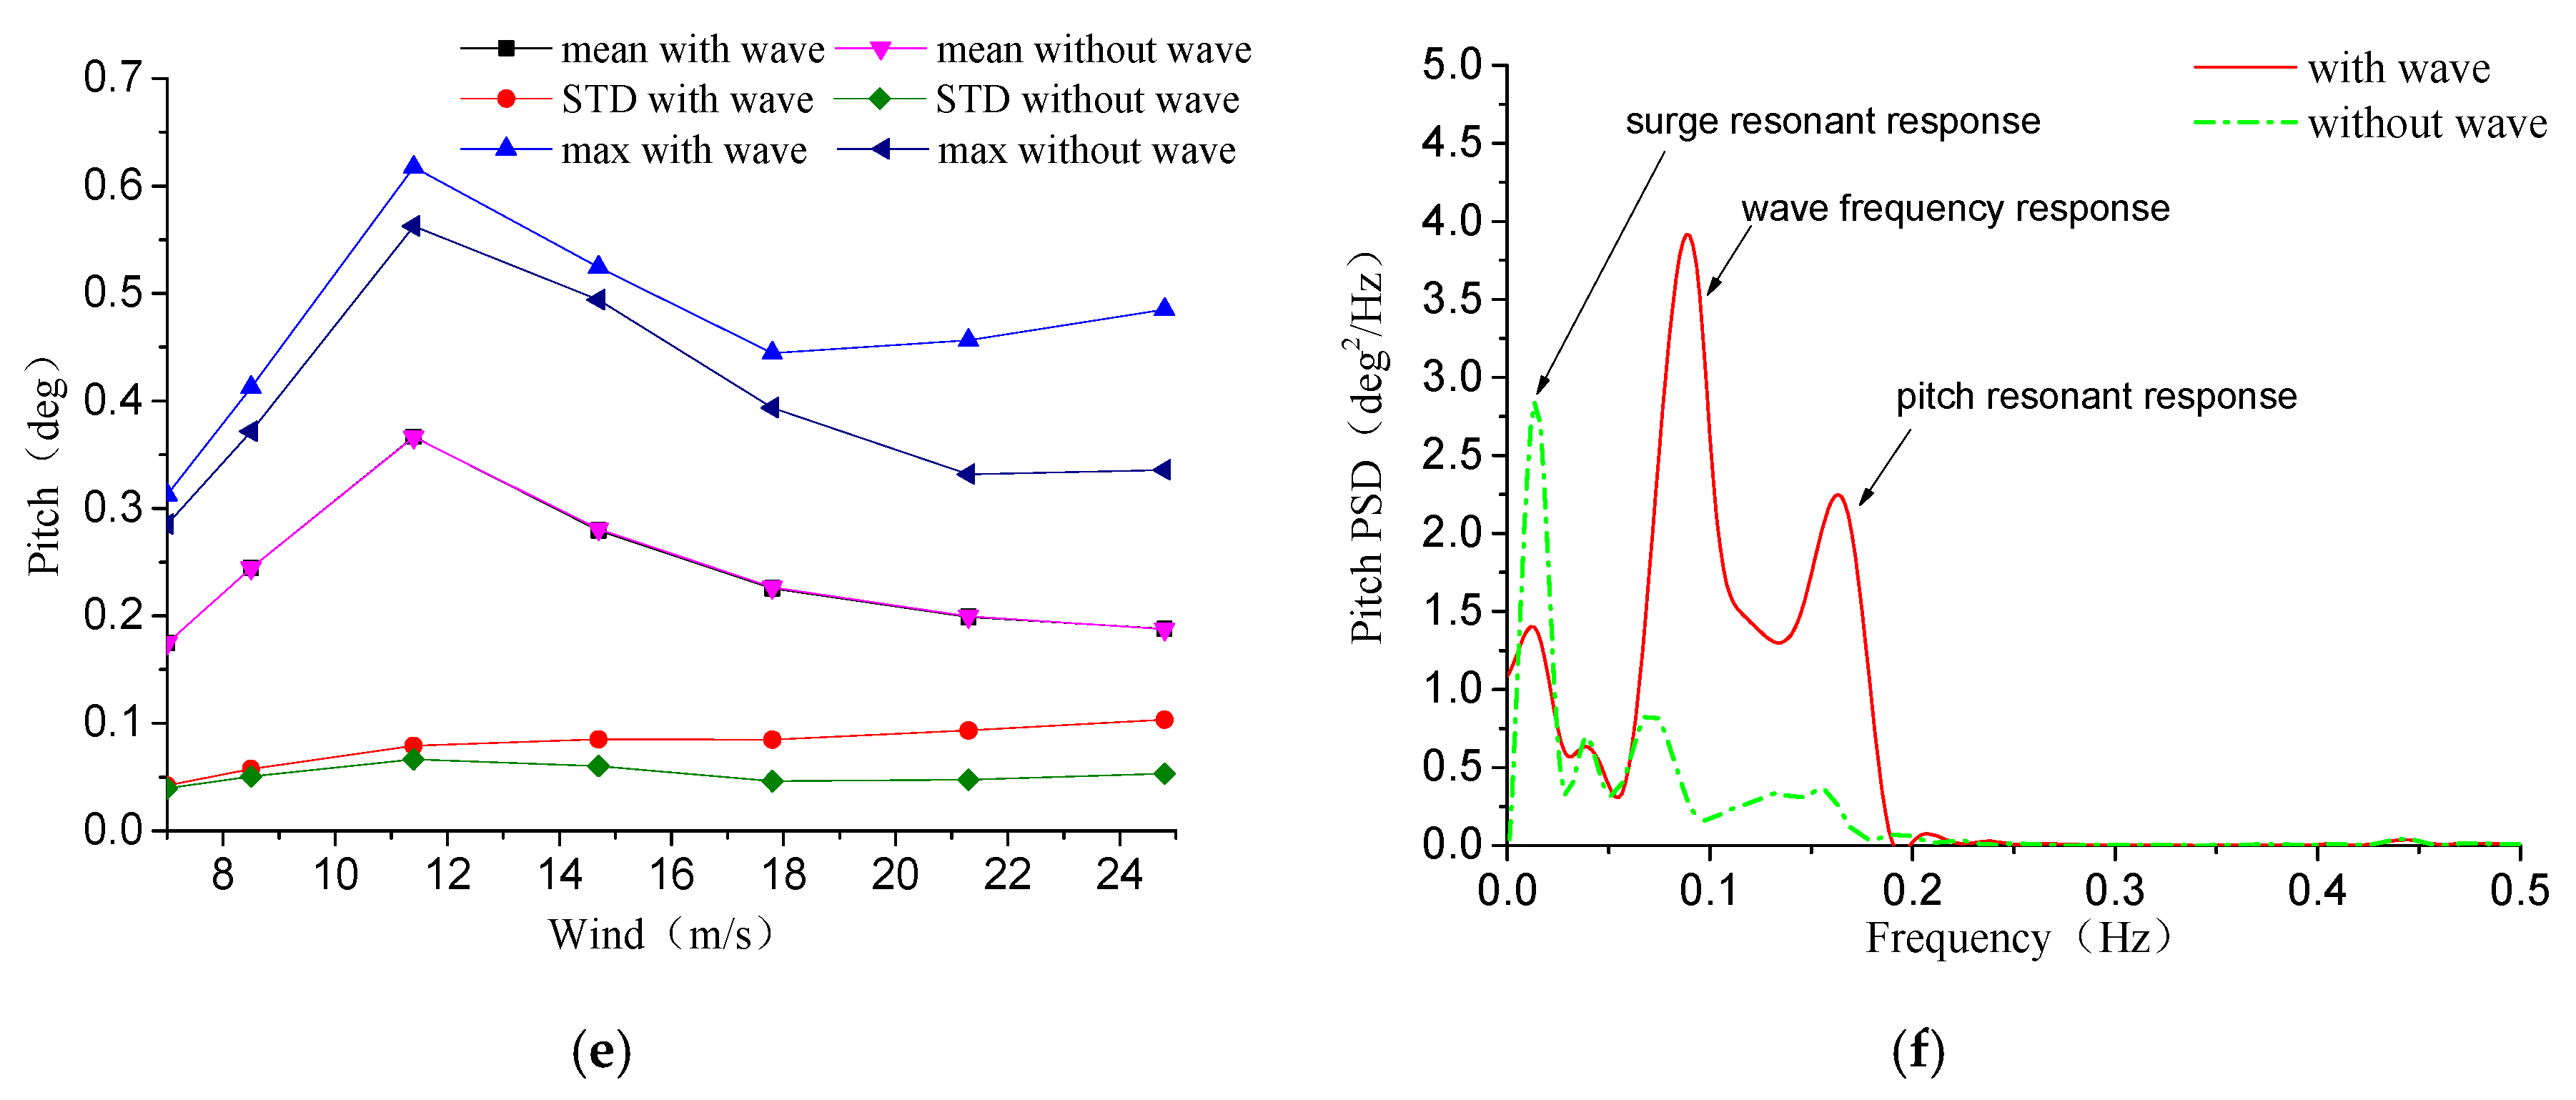
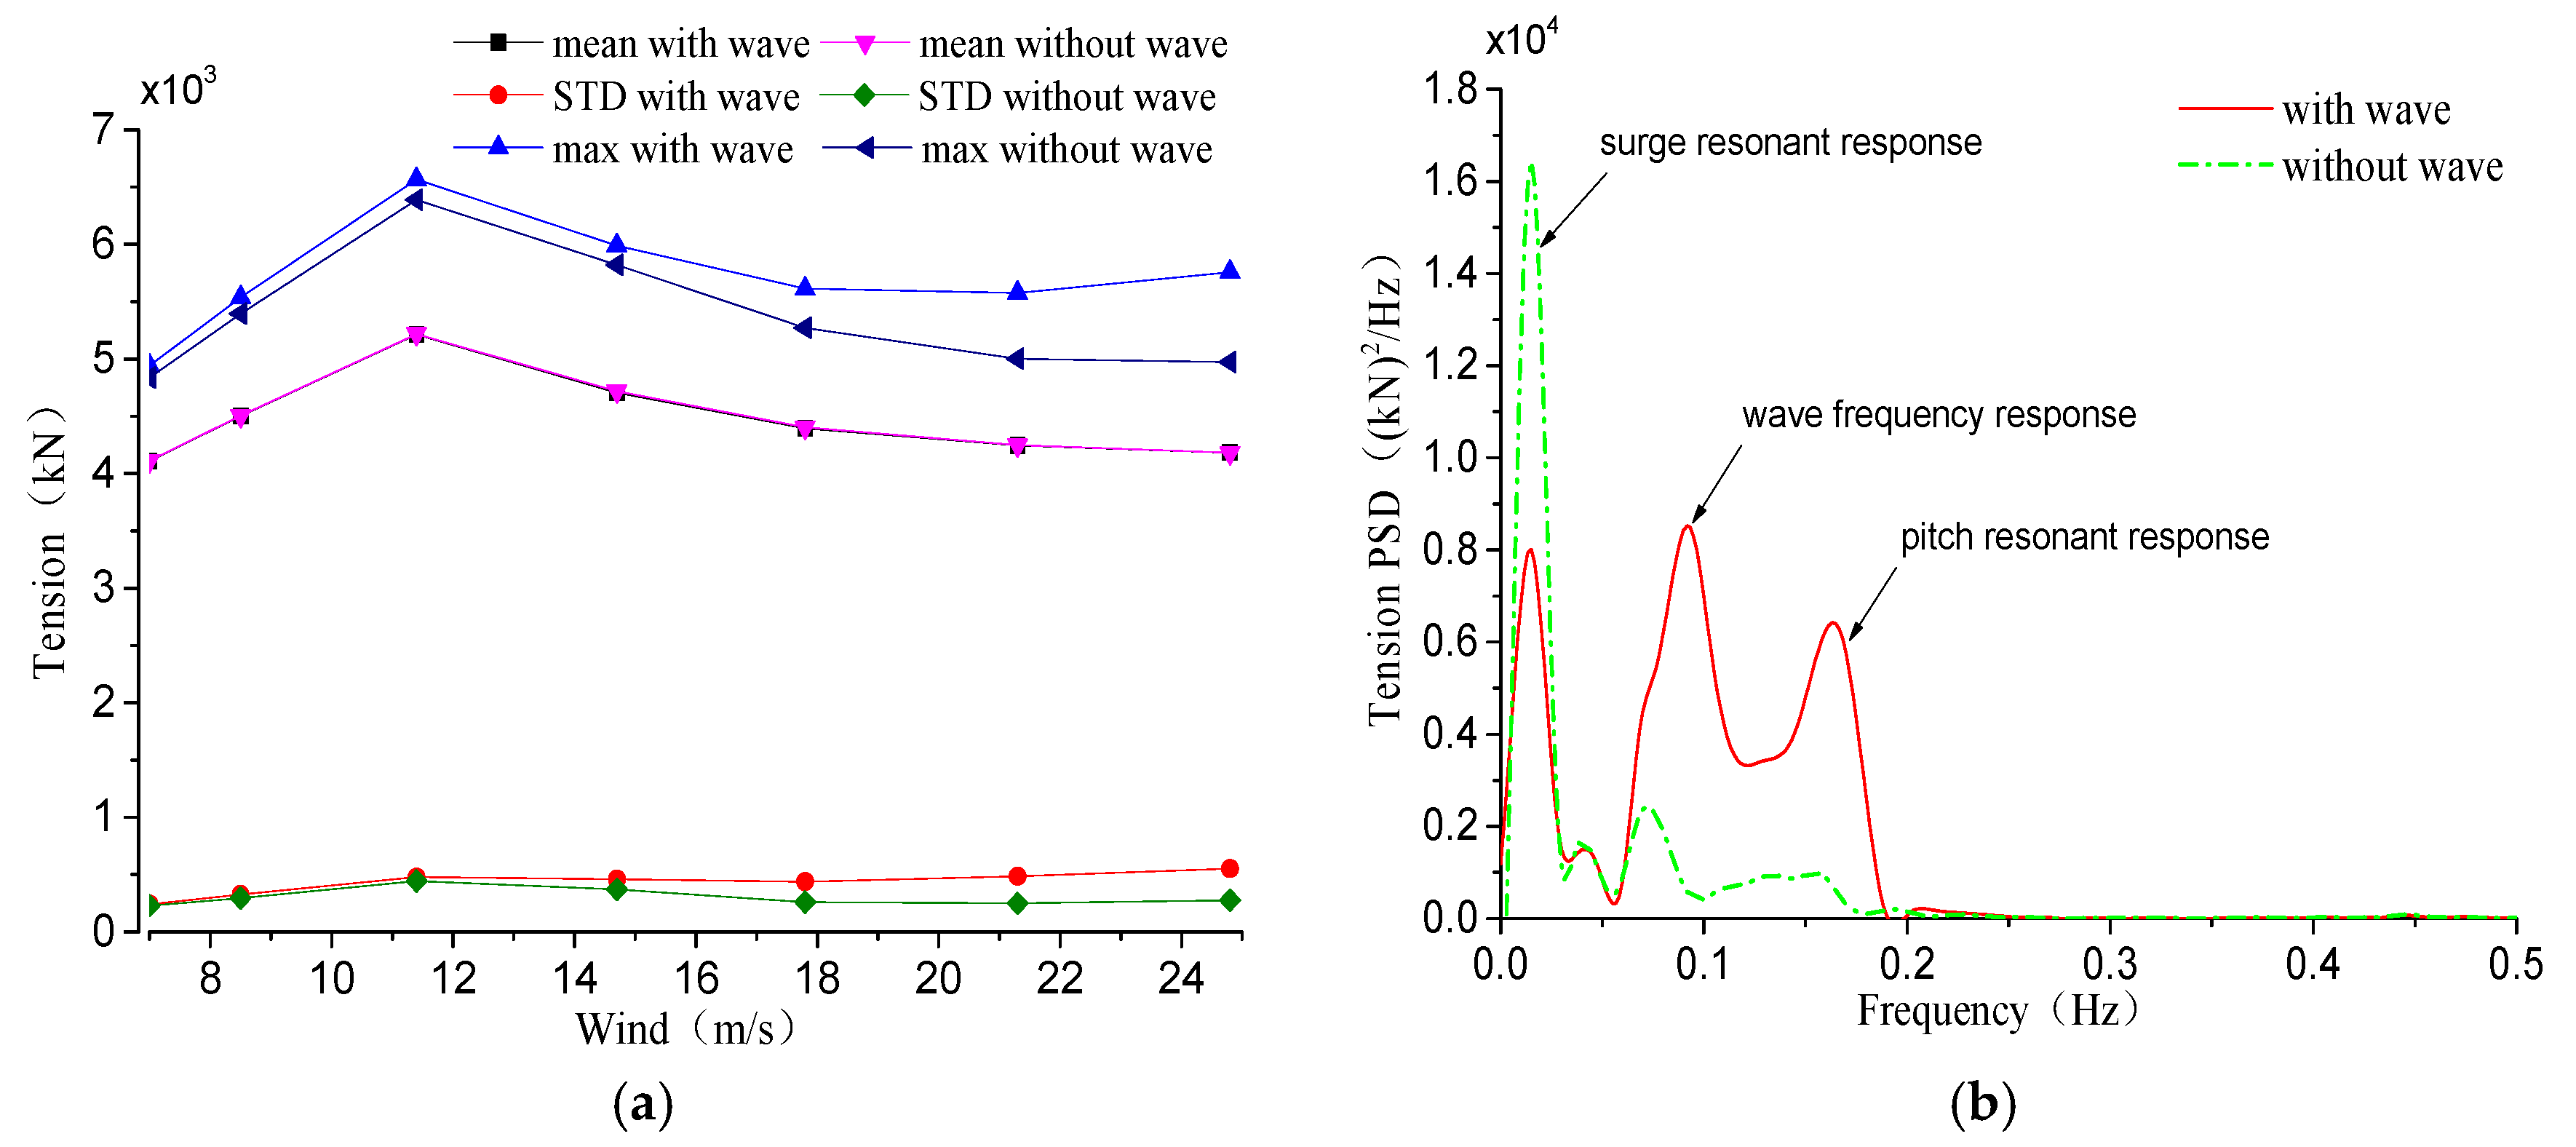
4.2. Influence of Wave on TLP FHAWT

Many studies on the TLP FHAWT dynamic analysis were limited to the environmental conditions of wind load and wave load in the same propagation direction. However, the wind and wave can be significantly misaligned, and it is expected that such misalignments would affect the motions and structural responses of the wind turbine.

4.2.1. The Influence of the Wave

The mean value of out-of-plane moment My at the blade root under the waving conditions was equal to that under the non-waving conditions. It means that the wave loads had very limited effects on out-of-plane moment My at the blade root. There was a similar result observed from the in-plane moment Mx at the blade root. Those were consistent with the conclusion from the comparative analysis of TLP FHAWT and equivalent onshore HAWT in Section 4.1 that the loads on the wind turbine blade were mainly caused by turbulent wind. The blade structure design mainly considered the wind load, but it should be noted that the wave would increase the blade fatigue load.
Tower base bending moments were significantly affected by wave loads and it was up to the nacelle movement relative to the TLP, the thrust, the inertia transmitted to the platform and the mooring line tension. According to the Figure 8a, the mean value of tower base fore-aft moment My under the waves conditions is consistent with that under the non-waves conditions, indicating that the mean value is mainly affected by the wind; The large difference in standard deviations can be explained based on the power spectrum (under the rated conditions) of Figure 8b that the wave load causes the tower to generate wave frequency response. When the wind speed was 24.8 m/s, the standard deviation of tower base fore-aft moment My reached the maximum value of 46,130.38 kNm. There was a similar conclusion about tower base side-to-side moment Mx. Therefore, the tower fatigue load caused by waves must be taken into consideration during the design phase.
Figure 9 shows the statistical analysis and spectral analysis (under the rated conditions) of the surge, heave and pitch motions of the TLP FHAWT with and without waves. Motions of sway, roll and yaw were not discussed because they were very small due to the symmetry of structures and external loads [42]. It can be seen from Figure 9a that the two mean values (one with wave and another without wave) of surge motion of the TLP are substantially identical. And similar results was observed from the Figure 9c,e for the heave and pitch motions. As can be seen from Figure 9b,d, the standard deviations of the surge motion and heave motion are mainly composed of the wave frequency response component and the surge resonance response component, and the former is much smaller than latter induced by low-frequency wind. Since the heave resonance frequency was high, there was no necessary to consider the heave resonance response. The pitch natural frequency is reduced to 1.85 Hz as shown in Figure 9f due to the shift of the pitch natural frequency caused by the TLP-tower coupling effect [43]. The standard deviation of pitch motion was the combined actions of wind and wave loads, i.e., the inertia of the surge motion and the hydrodynamic coupling. The pitch motion consisted of surge resonance response component, wave response component, and pitch resonance response component. Based on the above analysis, it could be inferred that the surge resonance and the pitch resonance affected the motions of the TLP platform deeply, and they should be considered in the TLP design phase as key issues.
Since the mooring system was related to the safety of the wind turbine, the mooring line tension was also investigated. While the mooring line 3 was in the upwind position, with greater tension than the downwind mooring lines, the mooring line 3 was selected to be analyzed. It can be seen from the Figure 10a that the wave load has almost no effect on the mean value of mooring line tension, but it has a great influence on the standard deviation. According to the Figure 10b, the standard deviation response of the tension is affected by the wave-frequency excitation and the pitch resonance response, which is similar to the pitch motion in Figure 9. Therefore, reducing the surge resonance response and pitch resonance response were effective ways to ensure the safety of the TLP FHAWT.

4.2.2. The Influence of the Wind-Wave Misalignment

From the results of the study with and without wave loading in Section 4, it was expected that wind-wave misalignment would affect the dynamic response of the TLP FHAWT, including the structural loads of the blade and tower, platform motion and mooring line tension. The mean of the dynamic response of TLP FHAWT was mainly induced by wind, so the dynamic standard deviation (STD) of TLP FHAWT was mainly analyzed [44].
The standard deviations of the blade root bending moments, the tower base bending moments and the tension of the mooring lines were shown as functions of the wind-wave misalignment angle βwave in Figure 11. As shown in Figure 11a,b, the standard deviations of the blade in-plane moment Mx at the blade root and out-of-plane moment My at the blade root are basically not affected by βwave at the low wind speed. While under the high wind speed conditions, the standard deviation of the in-plane moment Mx at the blade root increases slightly as βwave increases and the standard deviation of the out-of-plane moment My at the blade root decreases as βwave increases. According to Figure 11c,d, it can be seen that the tower base moment changes significantly as βwave increases. This was because the tilting of the platform shifts the center of gravity of the wind turbine nacelle thus changed the tower base bending moment. When βwave changed, the weight of the rotor and nacelle components changed the contribution to the tower base side-to-side moment Mx and tower base fore-aft moment My. The standard deviation of the tower base side-to-side moment Mx reaches a maximum value of 58,219.14 kNm when the FHAWT operates in EC7, βwave is 90°, and the standard deviation of tower base fore-aft moment My reaches a maximum value of 73,157.88 kNm when the FHAWT operates in EC7, βwave is 0°. Under the low wind speed conditions EC1-EC2, the fore-aft tilt angles of the tower are very small, the wind and wave misalignment has little influence on the fore-aft bending moments. While at mid-high wind speeds, the tilt angle of the tower increases, resulting in a significant influence. The mooring line 2 and the mooring line 3 were respectively located on the rotating tension side and the downwind side of the rotor, which meant they would bear larger loads than other mooring lines. It can be seen from Figure 11e,f that the standard deviation of tension of the mooring line 2 increases with the increment of βwave, while the standard deviation of the tension of the mooring line 3 is opposite. This performance is more pronounced at high wind speed conditions. The standard deviation of the tension of mooring line 2 reaches a maximum value of 329.55 kN when the wind speed is 24.8 m/s, βwave is 90°, and the standard deviation of the tension of mooring line 3 reaches a maximum value of 552.12kN when the wind speed is 24.8 m/s, βwave is 0°. The mooring line 3 had the same tendency as the pitch motion, which meant that the pitch motion had a great influence on the tension of the mooring line 3.
The standard deviation of the platform motion was shown as a function of the wind-wave misalignment angle βwave in Figure 12. Figure 12a shows that the standard deviation of the surge motion increases as βwave increases at low to medium wind conditions EC1-EC5. This was because the aerodynamic damping decreases as βwave increases, resulting in an increment in low frequency surge motion. It can also be observed that the standard deviation of surge motion under high wind speed condition EC6-7 decreases as βwave increases. This was because the viscous hydrodynamic load in the TLP surge direction was greatly reduced as the wind speed increases, so that the wave-frequency surge motion decreased significantly as βwave increased. As shown in Figure 12b, the standard deviation of the sway motion at a low wind speed is the minimum when βwave is 30°, and in the case of mid-high wind speed, the sway motion increases as βwave increases due to the larger effective wave height and the longer wave period. As shown in Figure 12c, the standard deviation of the heave motion at low and medium wind speeds increases slightly with the increment of βwave, because the viscous fluid dynamic load decreases slightly as the increment of βwave. While at high wind speeds, the dynamic load of viscous fluid decreases significantly as βwave increases, and the standard deviation of the heave motion decreases with the increase of βwave. According to Figure 12d, it can be seen that the standard deviation of the roll motion increases as βwave increases.
From Figure 12e, it can be seen that the standard deviation of the pitch motion decreases as βwave increases. This was because as βwave increases, the contribution of the wave load to the Y direction increased and the contribution to the X direction decreased.
As shown in Figure 12f, the standard deviation of yaw motion is not sensitive to the wave directions of all ECs, indicating that it is mainly affected by changes in wind speed. From the above analysis, we could conclude that, with the exception of yaw motion, the other degrees of freedom motions of TLP were significantly affected by the misalignment of wind and waves. The influence of wind and wave misalignment on the platform could be reduced by increasing the aerodynamic damping of the wind turbine.
From the above analysis, it could be concluded that the wind-wave misalignment had obvious influence on the surge, pitch, sway and roll motion of the TLP. In order to demonstrate the influence of the viscous drag and inertial effect of quasi-static mooring system on the stochastic dynamic response of wind turbines, the power spectrum comparison analysis was carried out for the standard deviation of TLP motions of the original model and the correction model under wind-wave misalignment.
Figure 13 shows the spectral analysis of the standard deviation of surge and pitch motion at the wind speed of 24.8 m/s (the maximum standard deviation of the pitch motion is occurred at this time). Among them, Figure 13a,b show the situation when βwave is 0°, and Figure 13c,d show the situation when βwave is 90°. It can be seen from Figure 13a,c that, for the surge motion, the surge component in the correction model is larger, indicating that the viscous drag has an effect on the fluctuation of the TLP motion; according to the power spectrum analysis of pitch motion in Figure 13b,d, for the modified model, the inertial force generated by the surge motion causes larger pitch resonance response, which indicates that the viscous resistance and inertia effect of the mooring system should be considered. It can be seen by comparing Figure 13a,c that the fluctuations of the surge motion are different for different βwave angles. It has bigger effect on the surge motion when βwave is 0°, while the effect is smaller when βwave is 90°. There are similar conclusions about the pitch motion.
Figure 14 shows the sway and roll spectrum analysis of the standard deviation of the sway and roll motion at the wind speed of 24.8 m/s (the maximum standard deviation of the roll motion occurs at this time). Among them, Figure 14a,b show the situation when βwave is 0°, and Figure 14c,d show the situation when βwave is 90°. It can be seen from Figure 14a,c that, when wind and wave in the same direction, the fluctuation of the sway motion is not much different. While for βwave is 90°, due to the inclusion of viscous drag, a larger deviation of the sway motion is produced under the wave loads in the corrected model. According to the power spectrum analysis of the roll motion in Figure 14b,d, when βwave is 90°, for the modified model, the inertial force generated by the sway motion causes a larger roll resonance response, which indicates that the viscous drag and inertia effects of the mooring system should be considered. Comparing Figure 14a,c, the fluctuations of the sway motion are different for different βwave angles. Which is exactly the opposite of the surge motion, it has smaller effects on the sway motion when βwave is 0°, while the effect is bigger when βwave is 90°. There are similar conclusions about the roll motion.

5. Conclusions

In this paper, the quasi-mooring system was modified by calculating the quadratic damping, and an improved model simulating the 10 MW TLP FHAWT was constructed based on the modified mooring system. Then the response characteristics of the TLP FHAWT were analyzed and compared with the equivalent onshore HAWT to determine effects of the wave on dynamic responses of the TLP FHAWT. Moreover, the influence of turbulent wind loads and wave loads misalignment on FHAWT under typical operating conditions was studied. Finally, the differences between the correction model and the original model TLP response are analyzed. On the basis of those works, it can be concluded that:
(1)
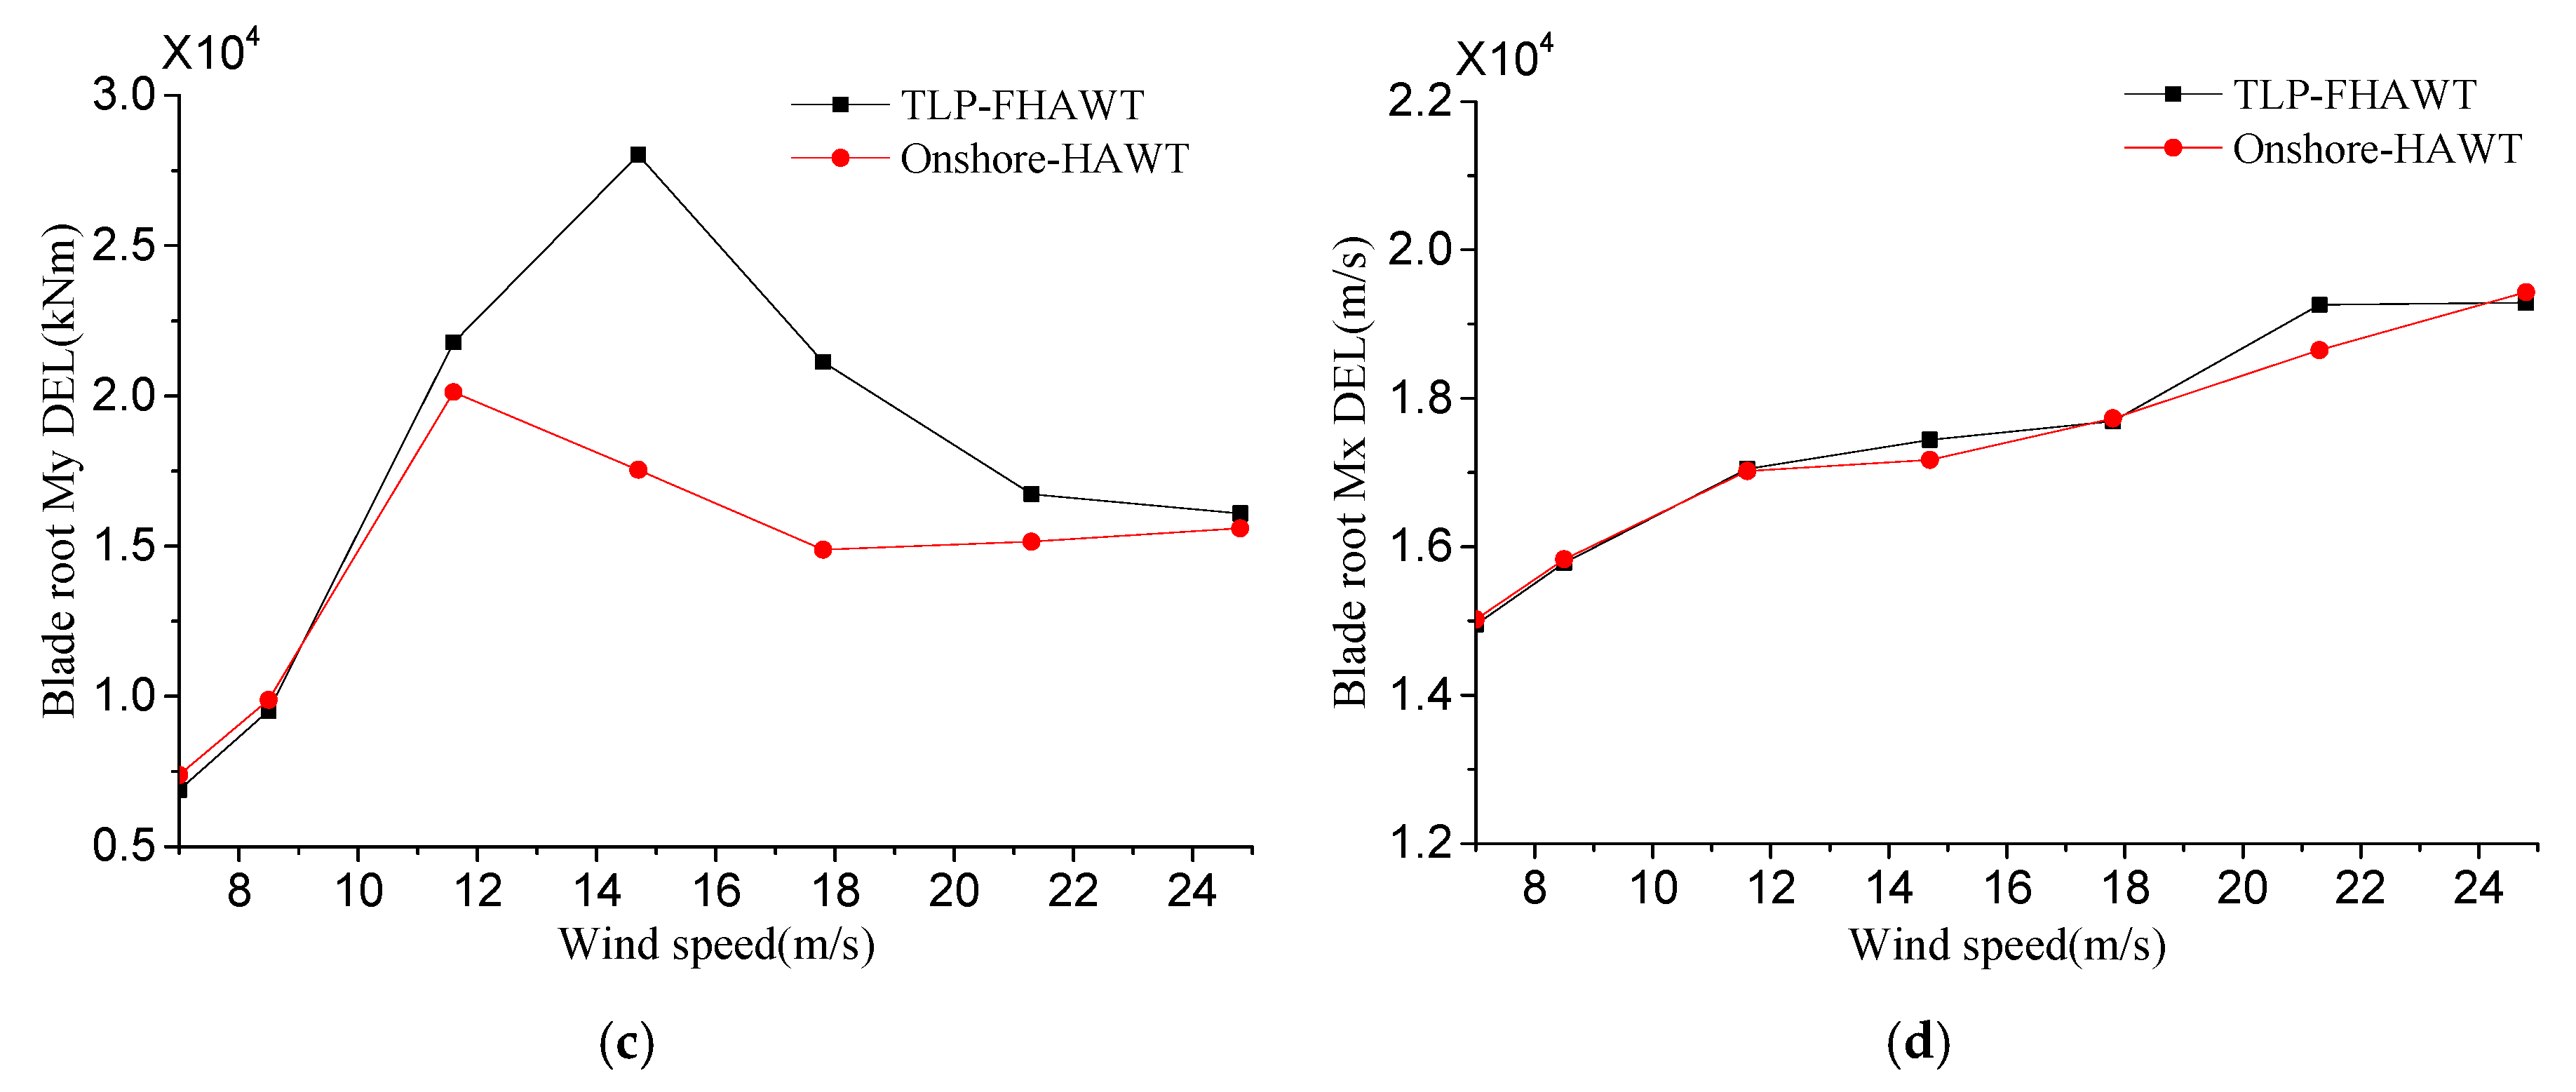
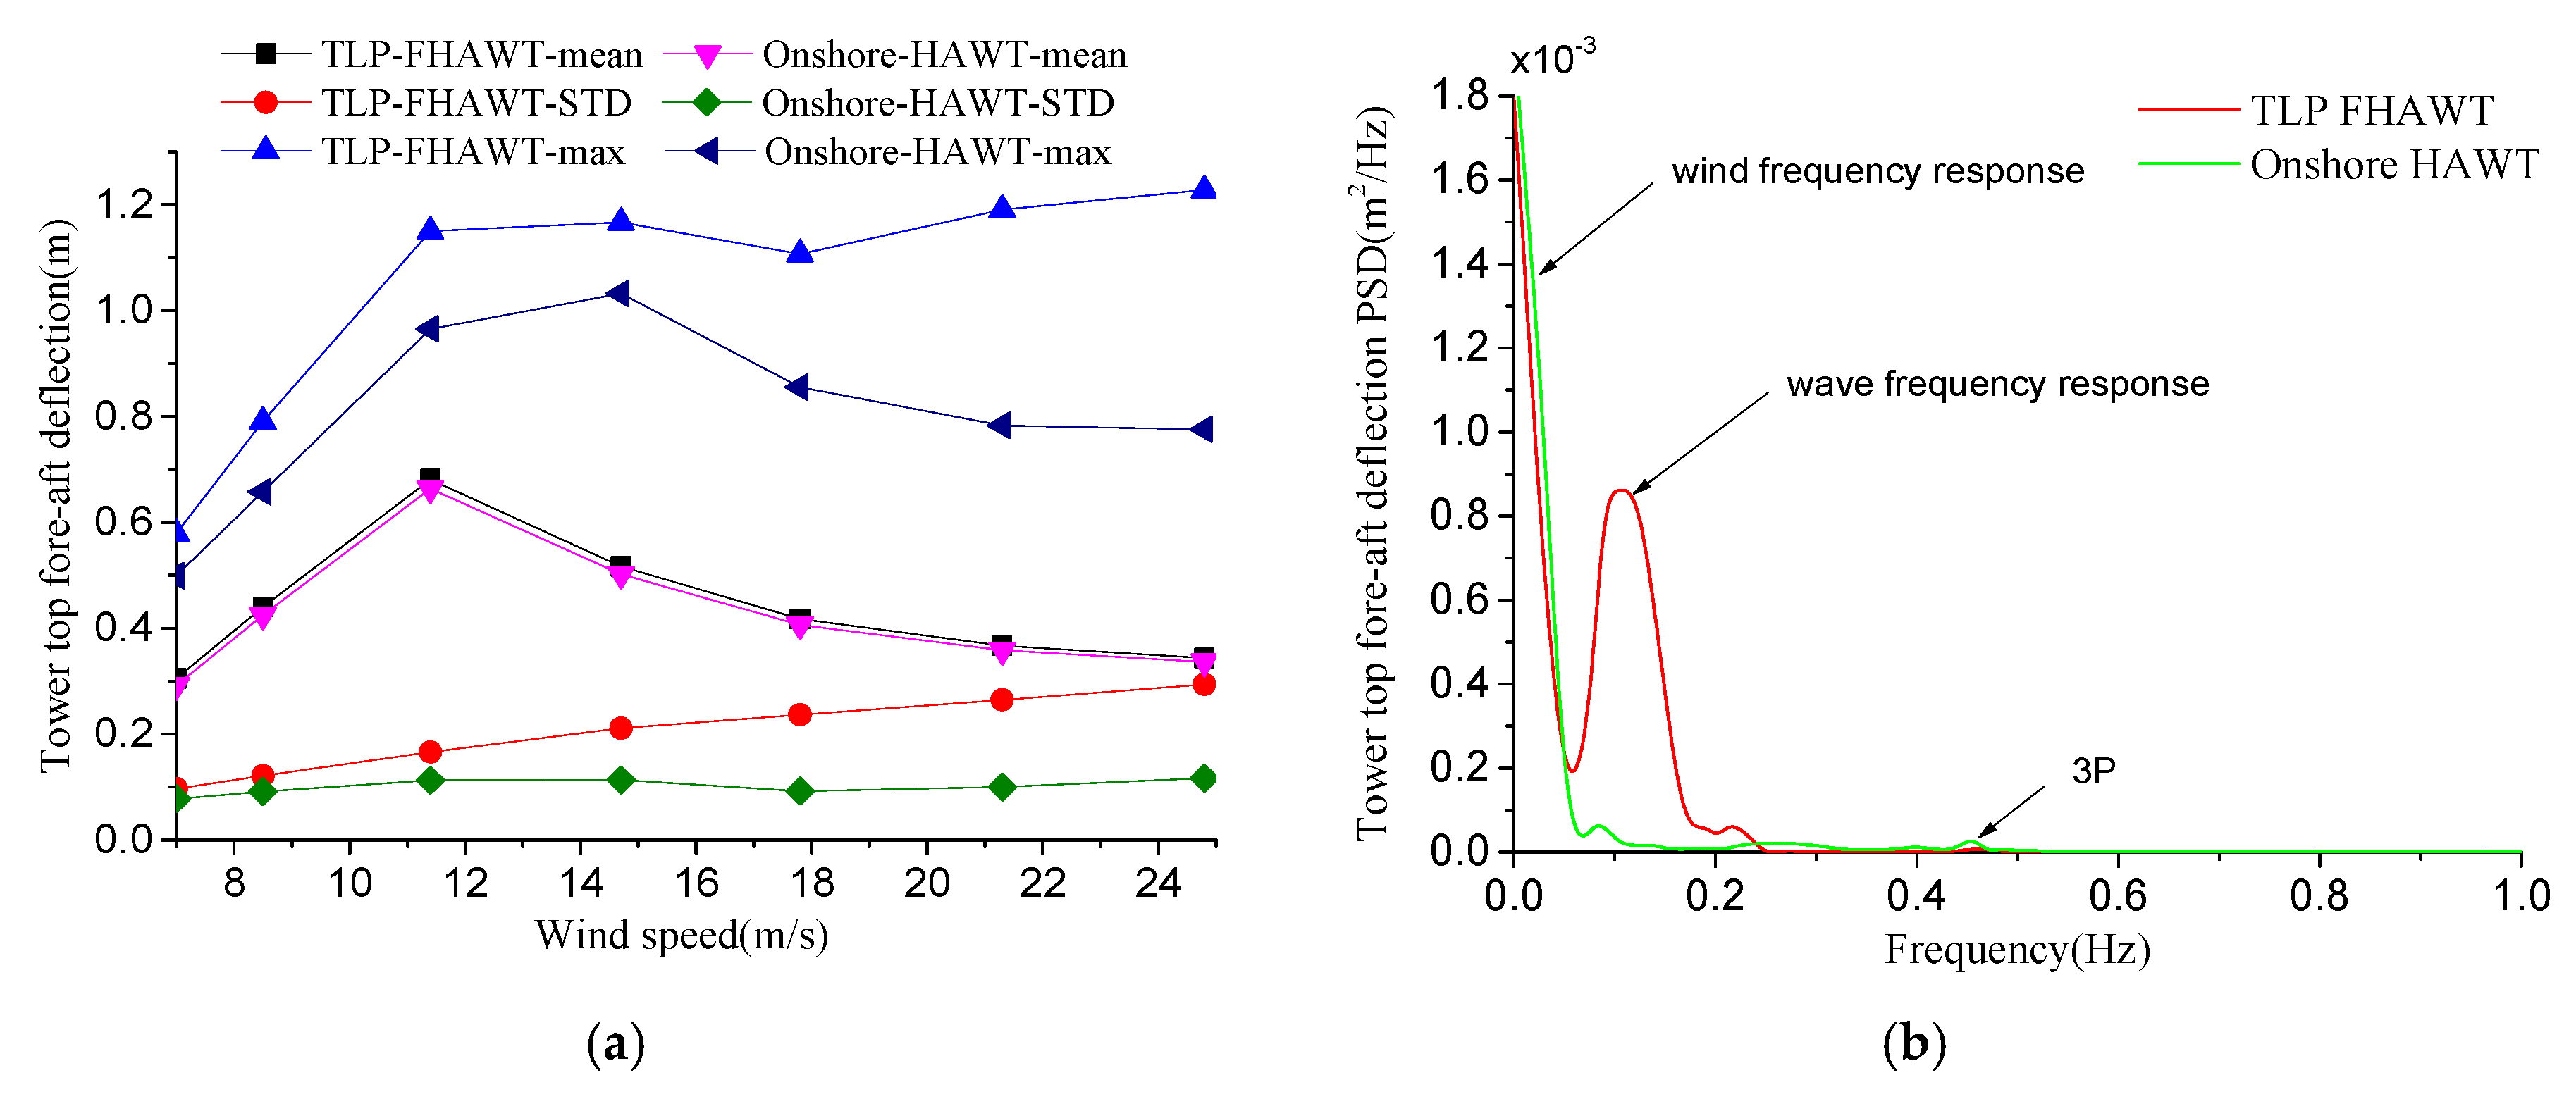
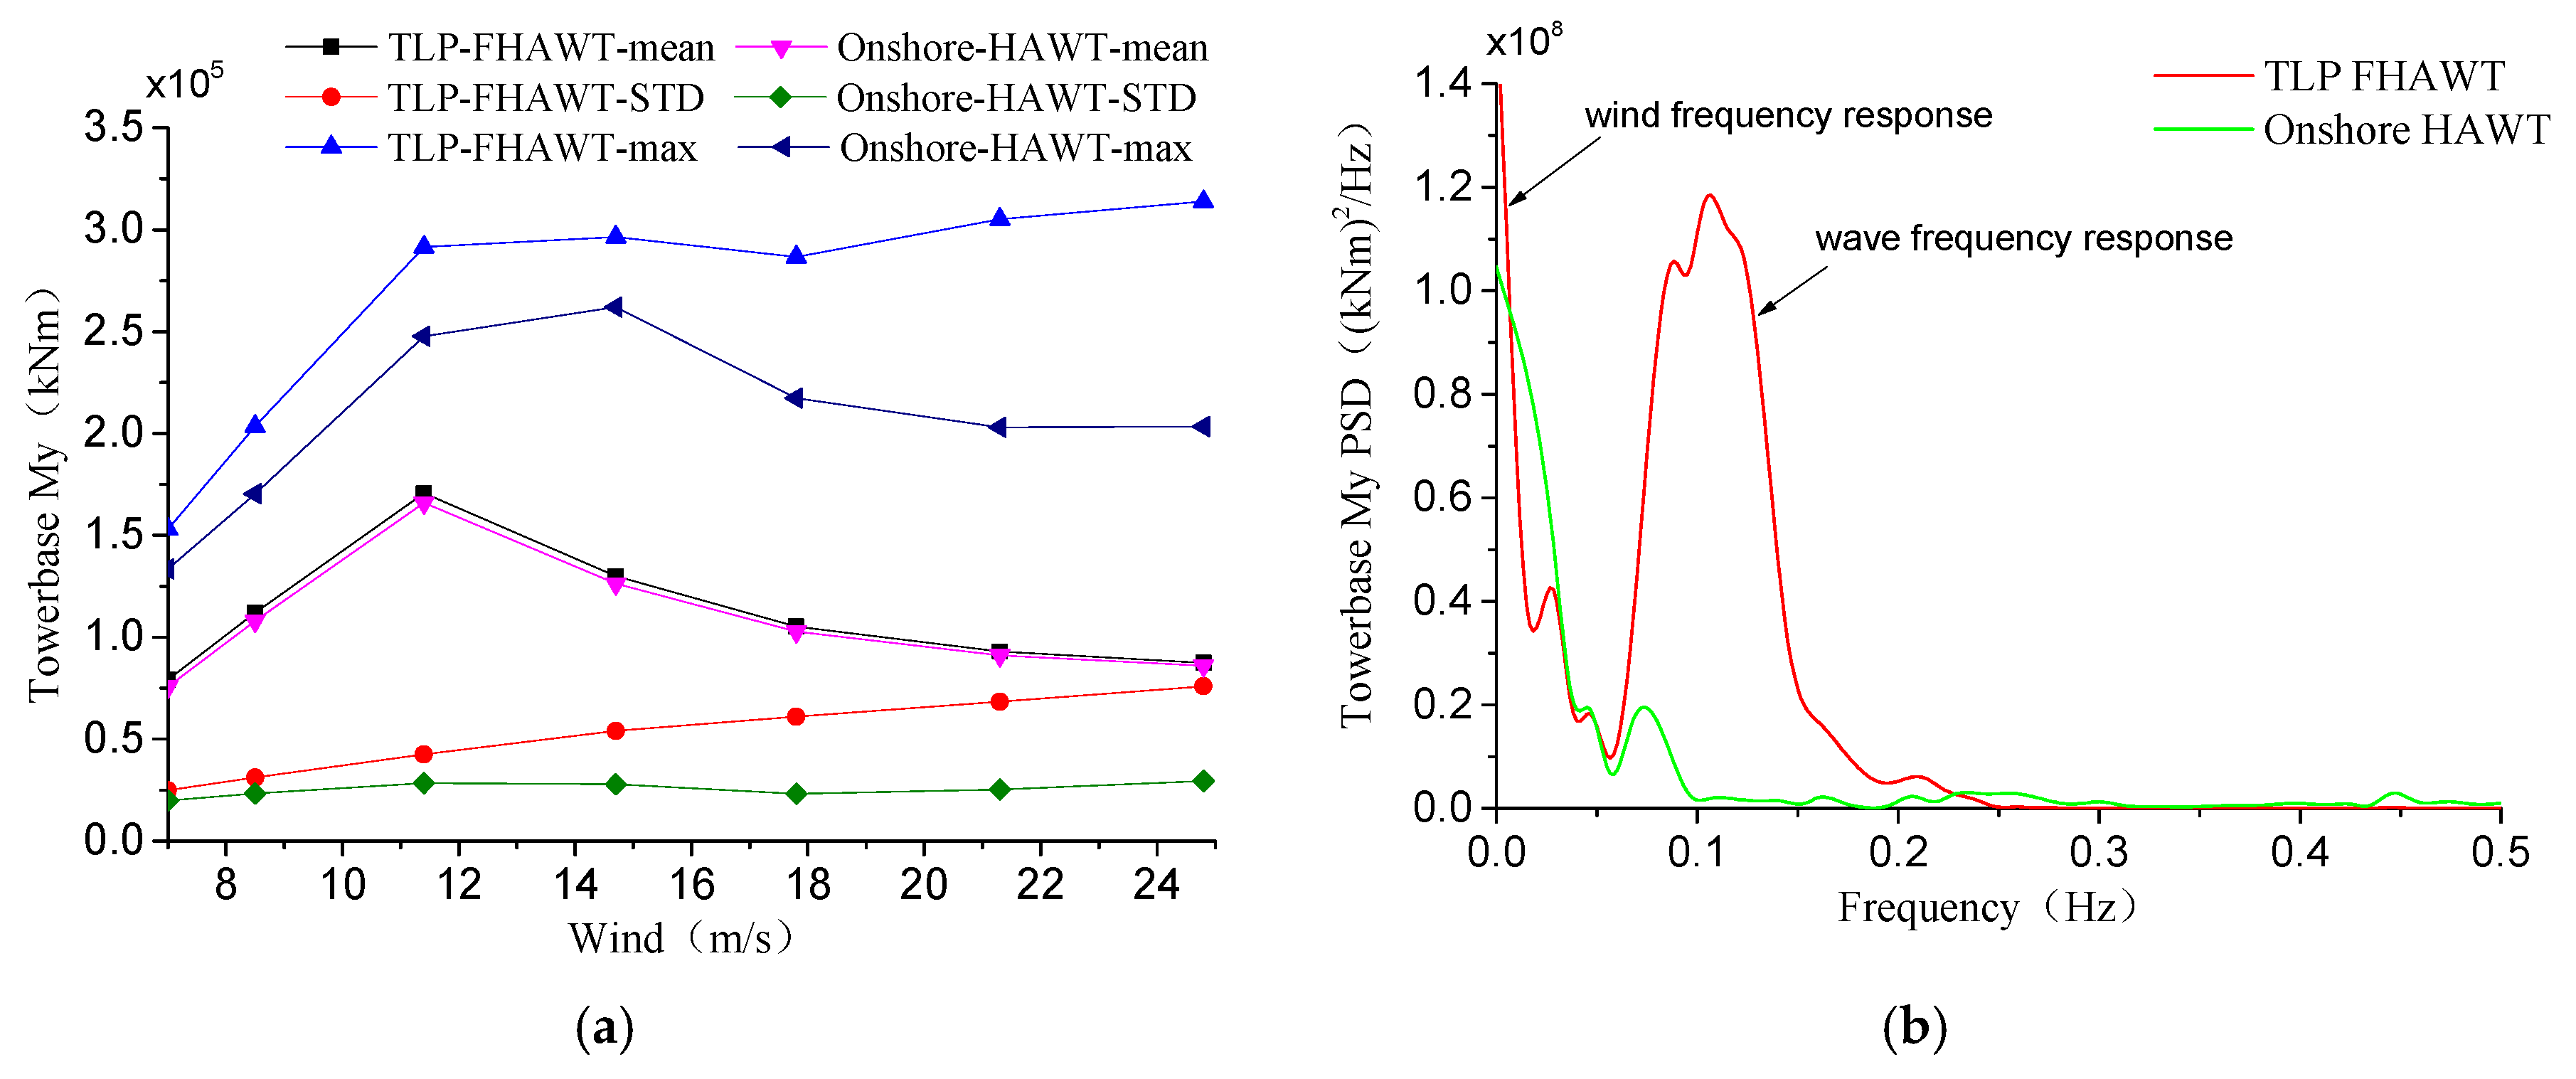
Both mean values of blade root bending moments of the TLP FHAWT and of the equivalent onshore HAWT were almost the same. Loads on the blade root were mainly caused by turbulent wind, but short-term damage equivalent loads on the blade were dramatically affected by the wave. Due to inclination of the tower, mean value of tower bending moment of the TLP FHAWT was greater than it of the equivalent onshore HAWT. At the rated wind speed, My value of the TLP FHAWT exceeded it of the equivalent Onshore HAWT My value by 4702.37 kNm.
(2)
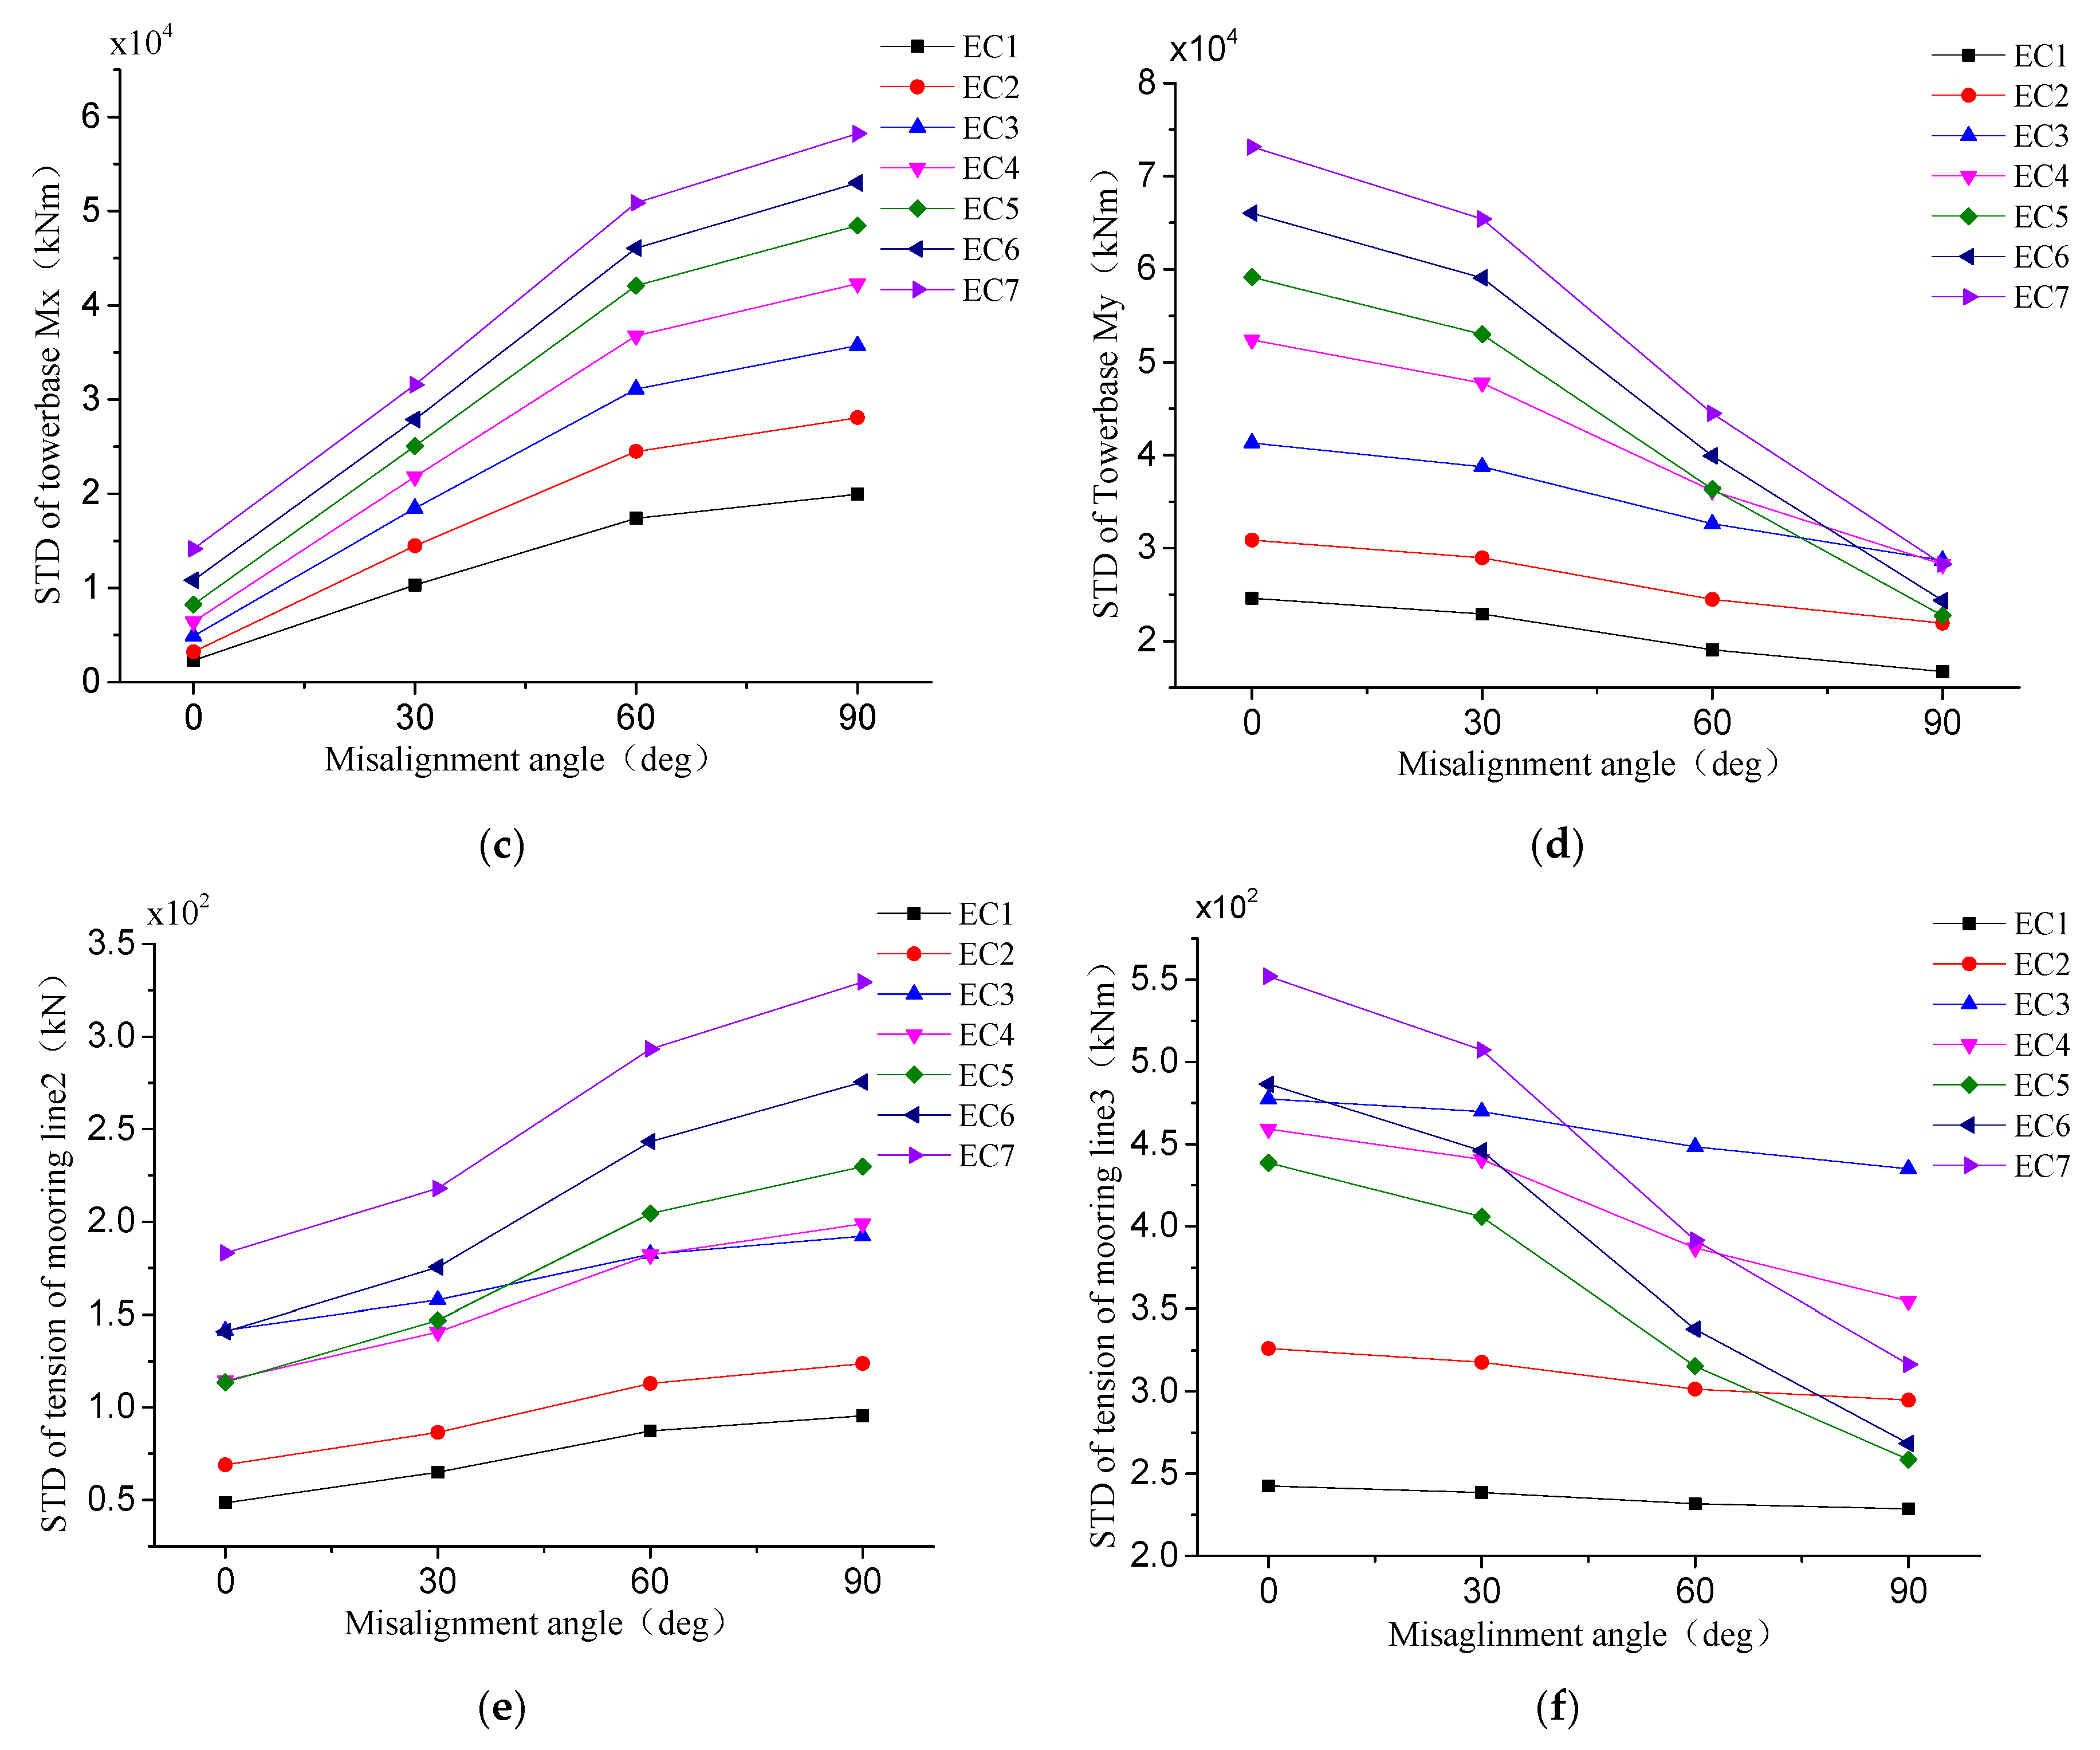
Vibration of the TLP FHAWT tower was substantially affected by the wind-wave misalignment. The aerodynamic damping generated by rotation of the rotor could significantly reduce vibration of the tower caused by wave loads. As βwave increased, inclination of the platform caused the center of gravity of the nacelle to shift which further increased bending moments of the tower base. Therefore, reinforcement design for the TLP FHAWT tower should supposed to be enhanced.
(3)
Ultimate tension of the mooring system was mainly related to the displacement caused by pitch motion. Standard deviation of the tension was significantly affected by the wave frequency response. Therefore, ultimate tension of the mooring line should be decreased by reducing the pitch motion.
(4)
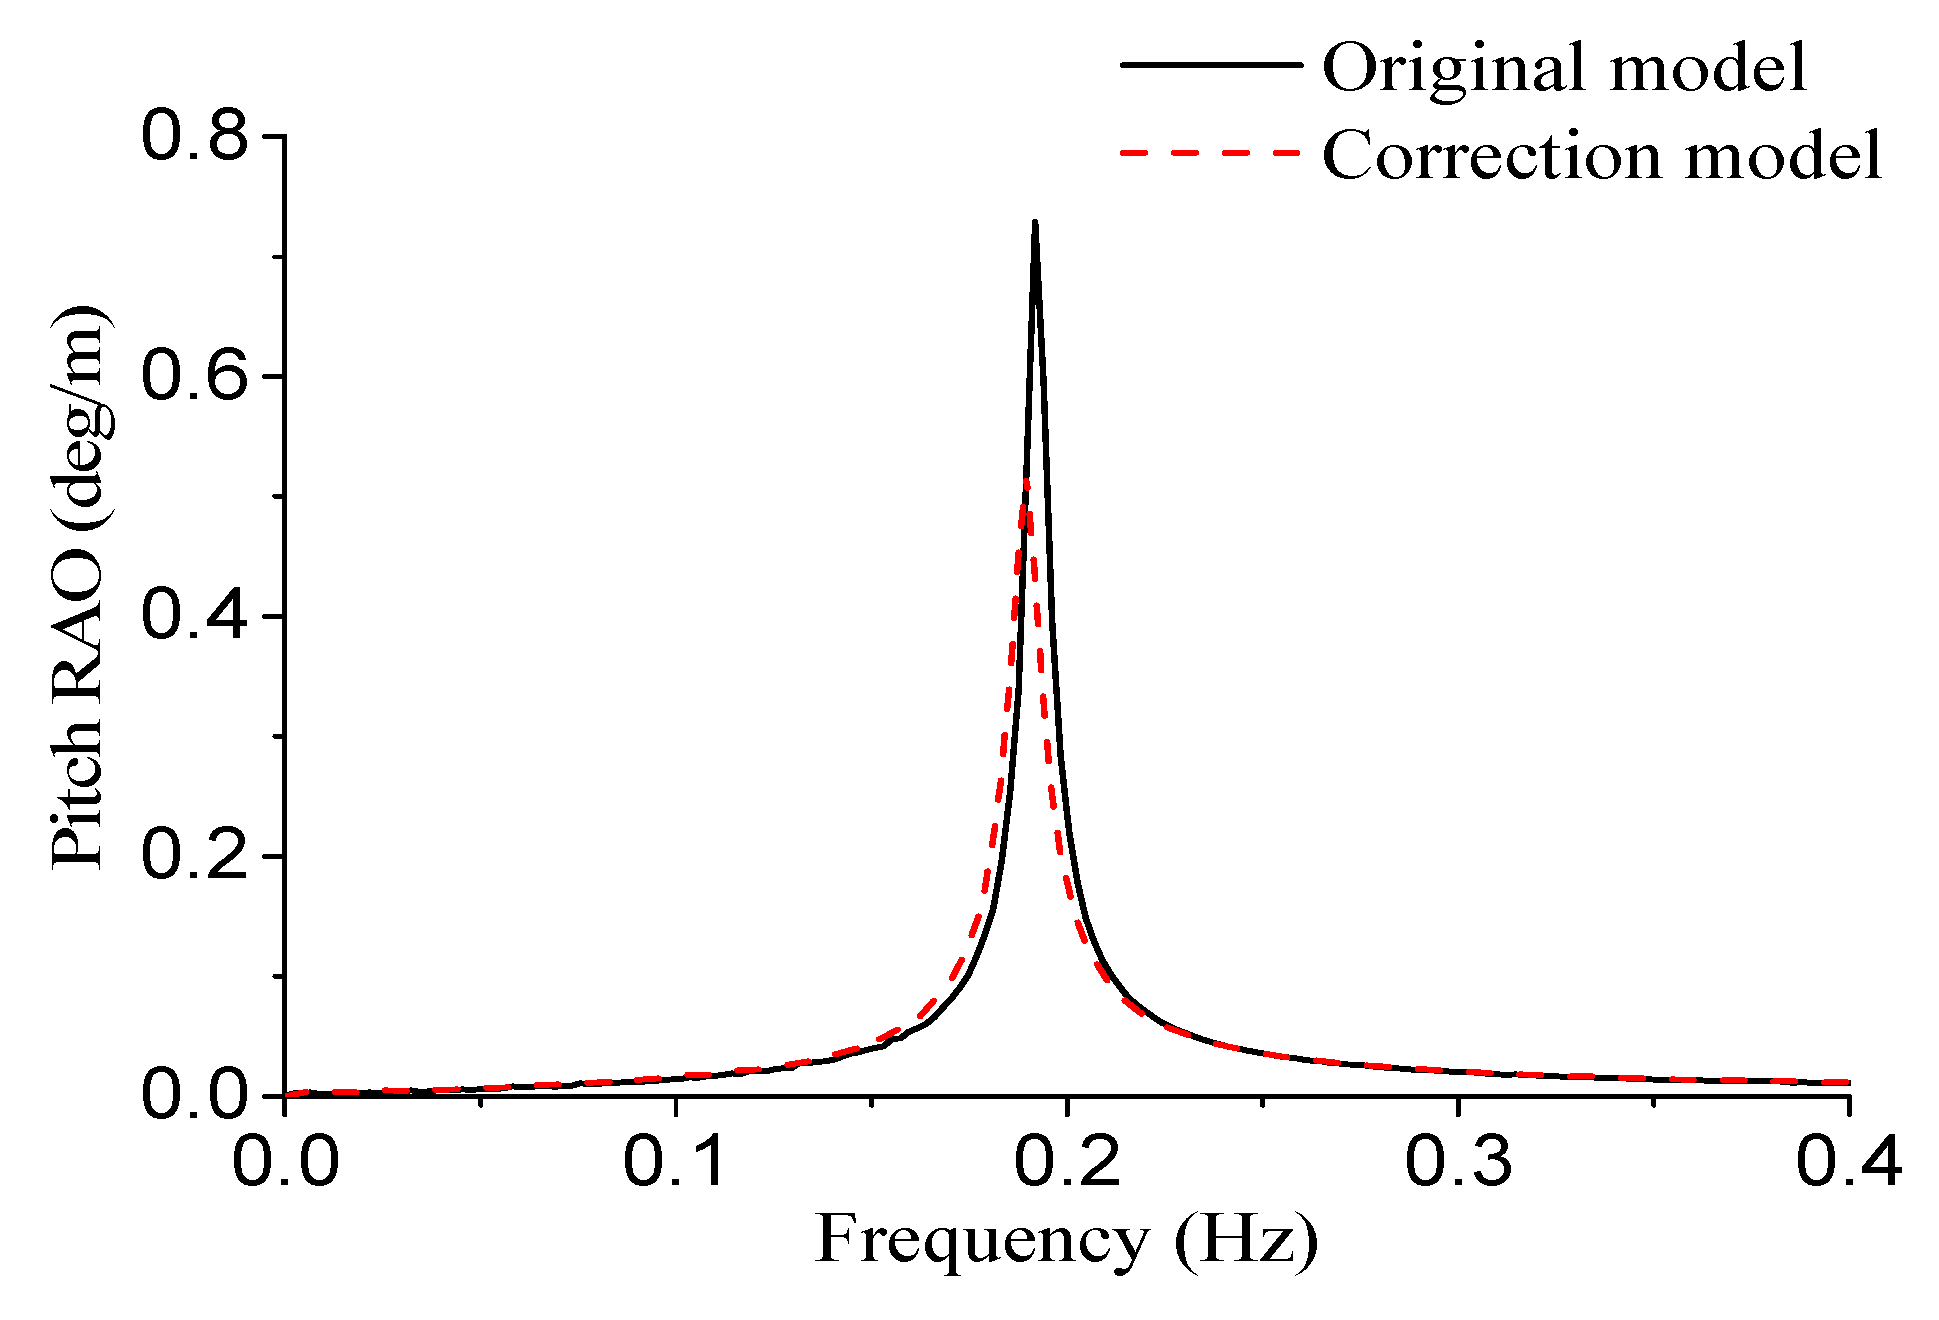
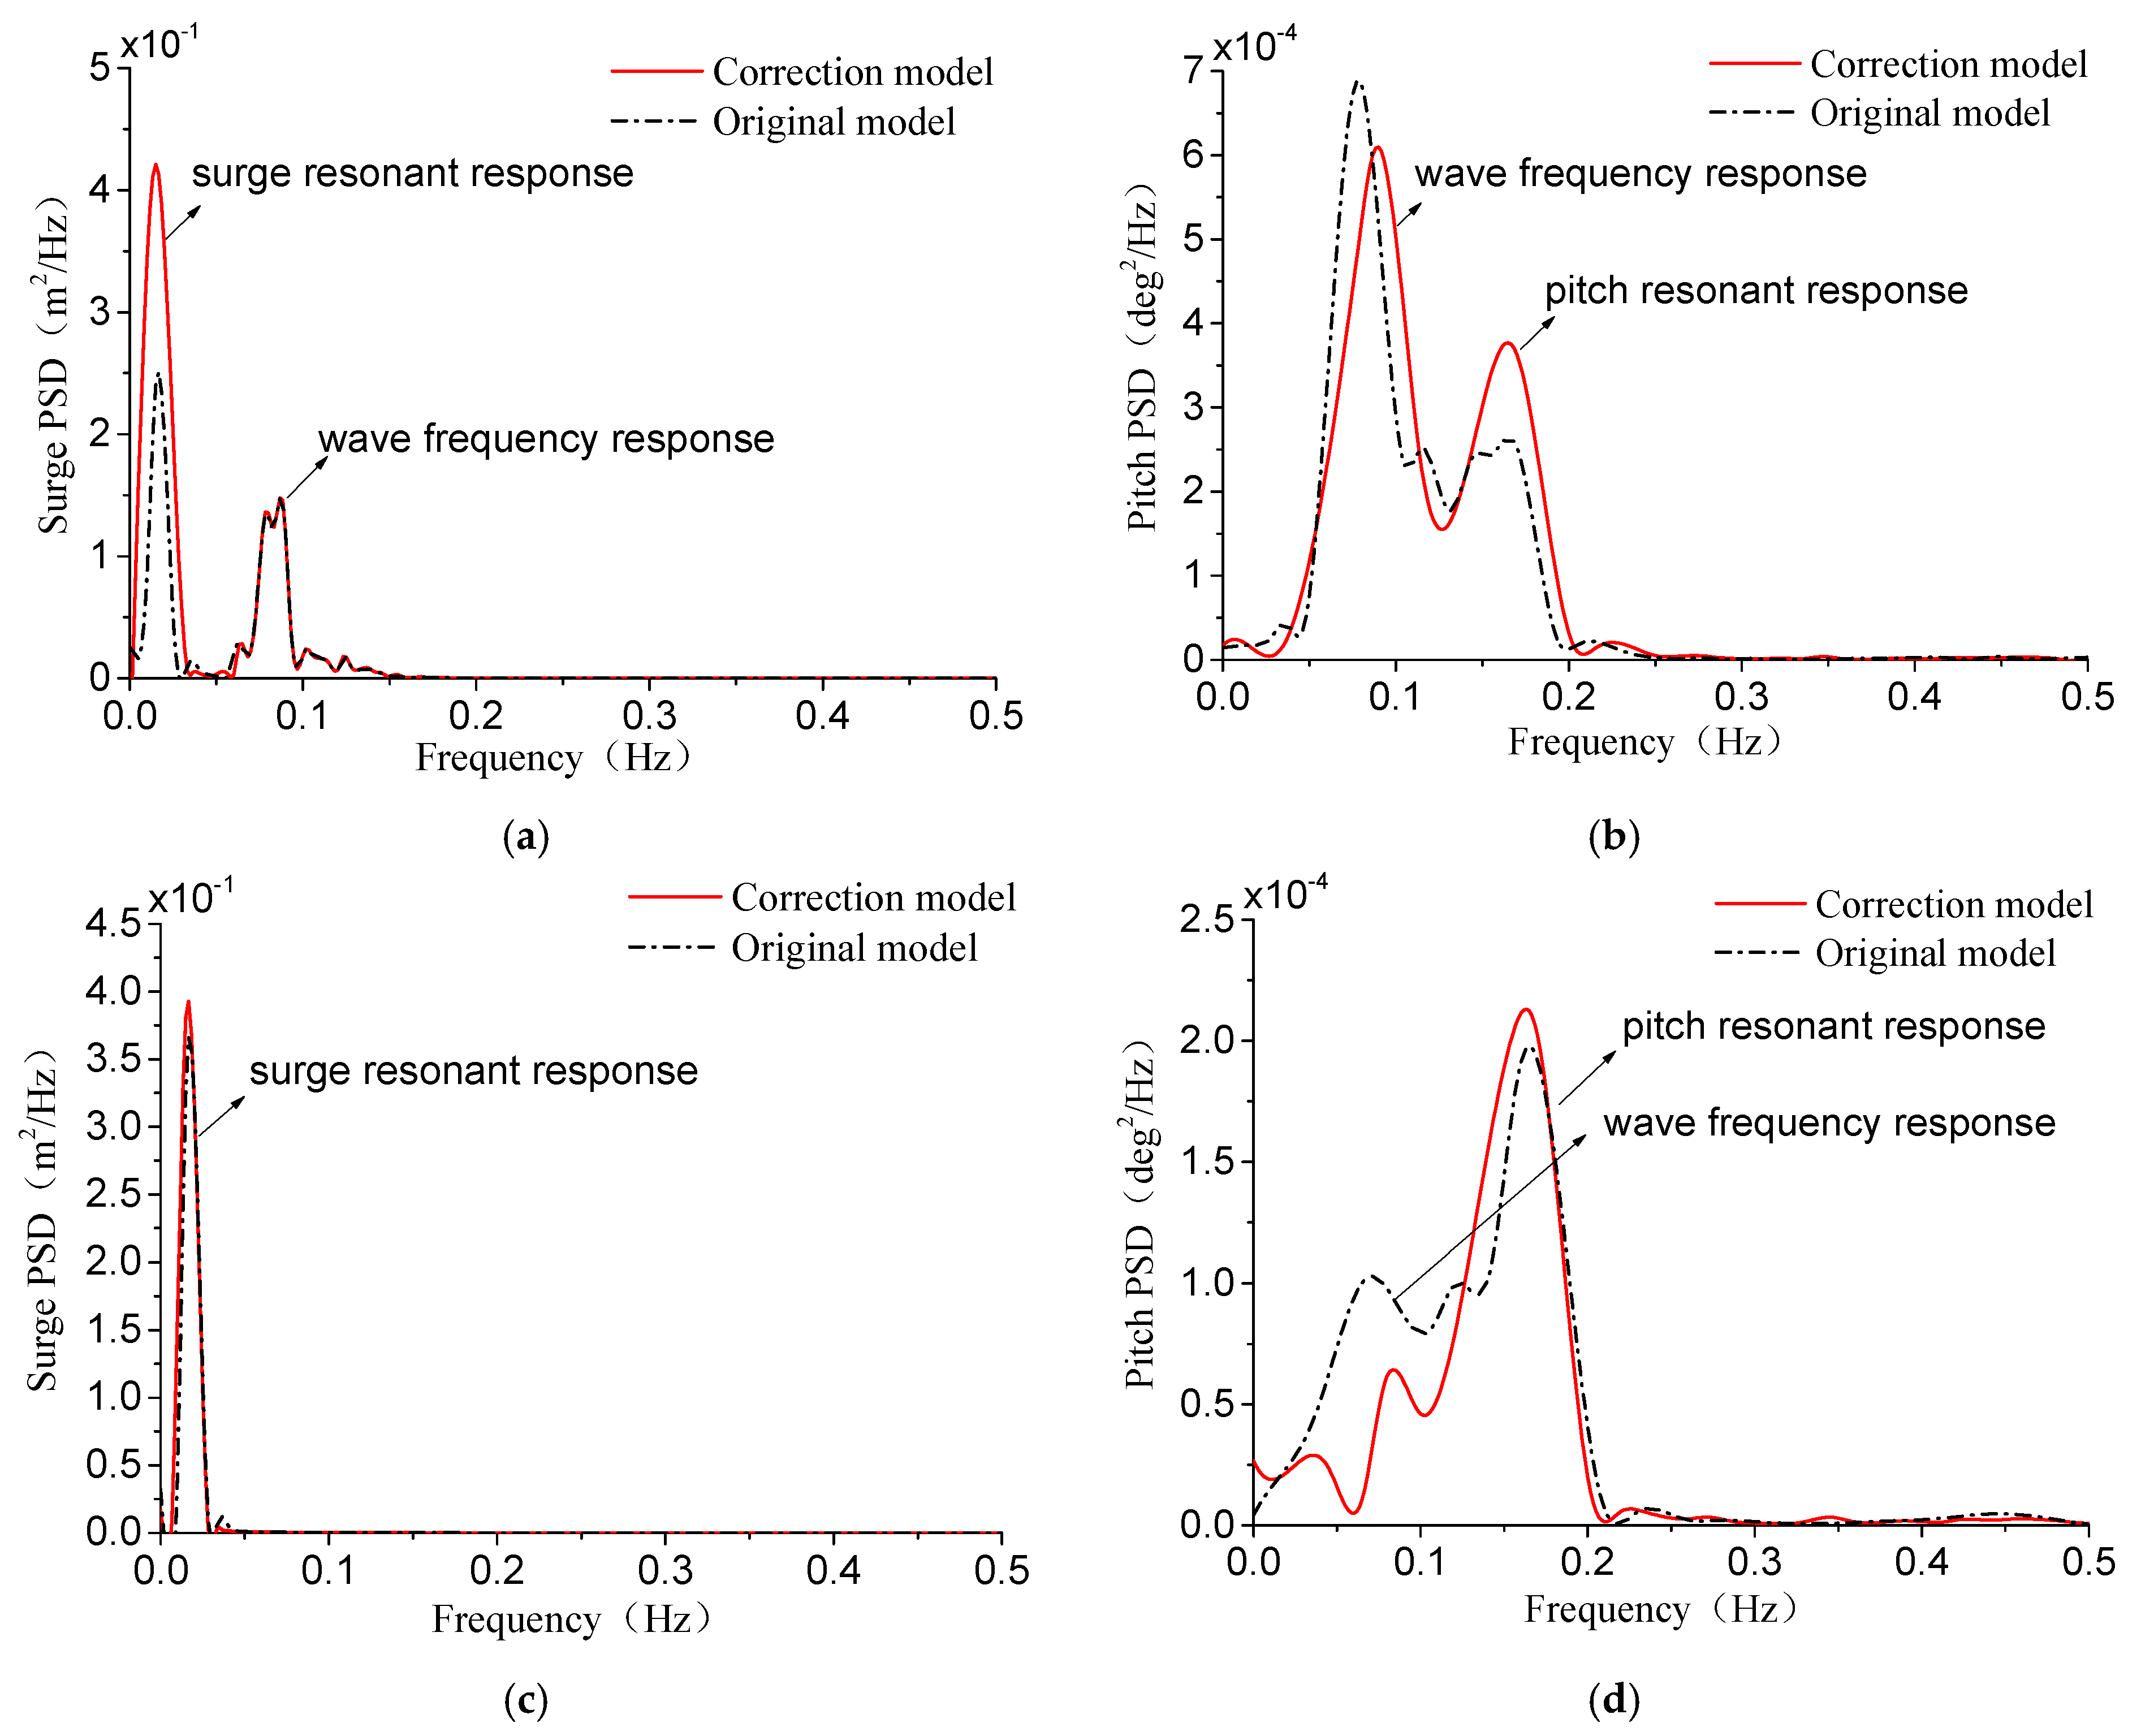
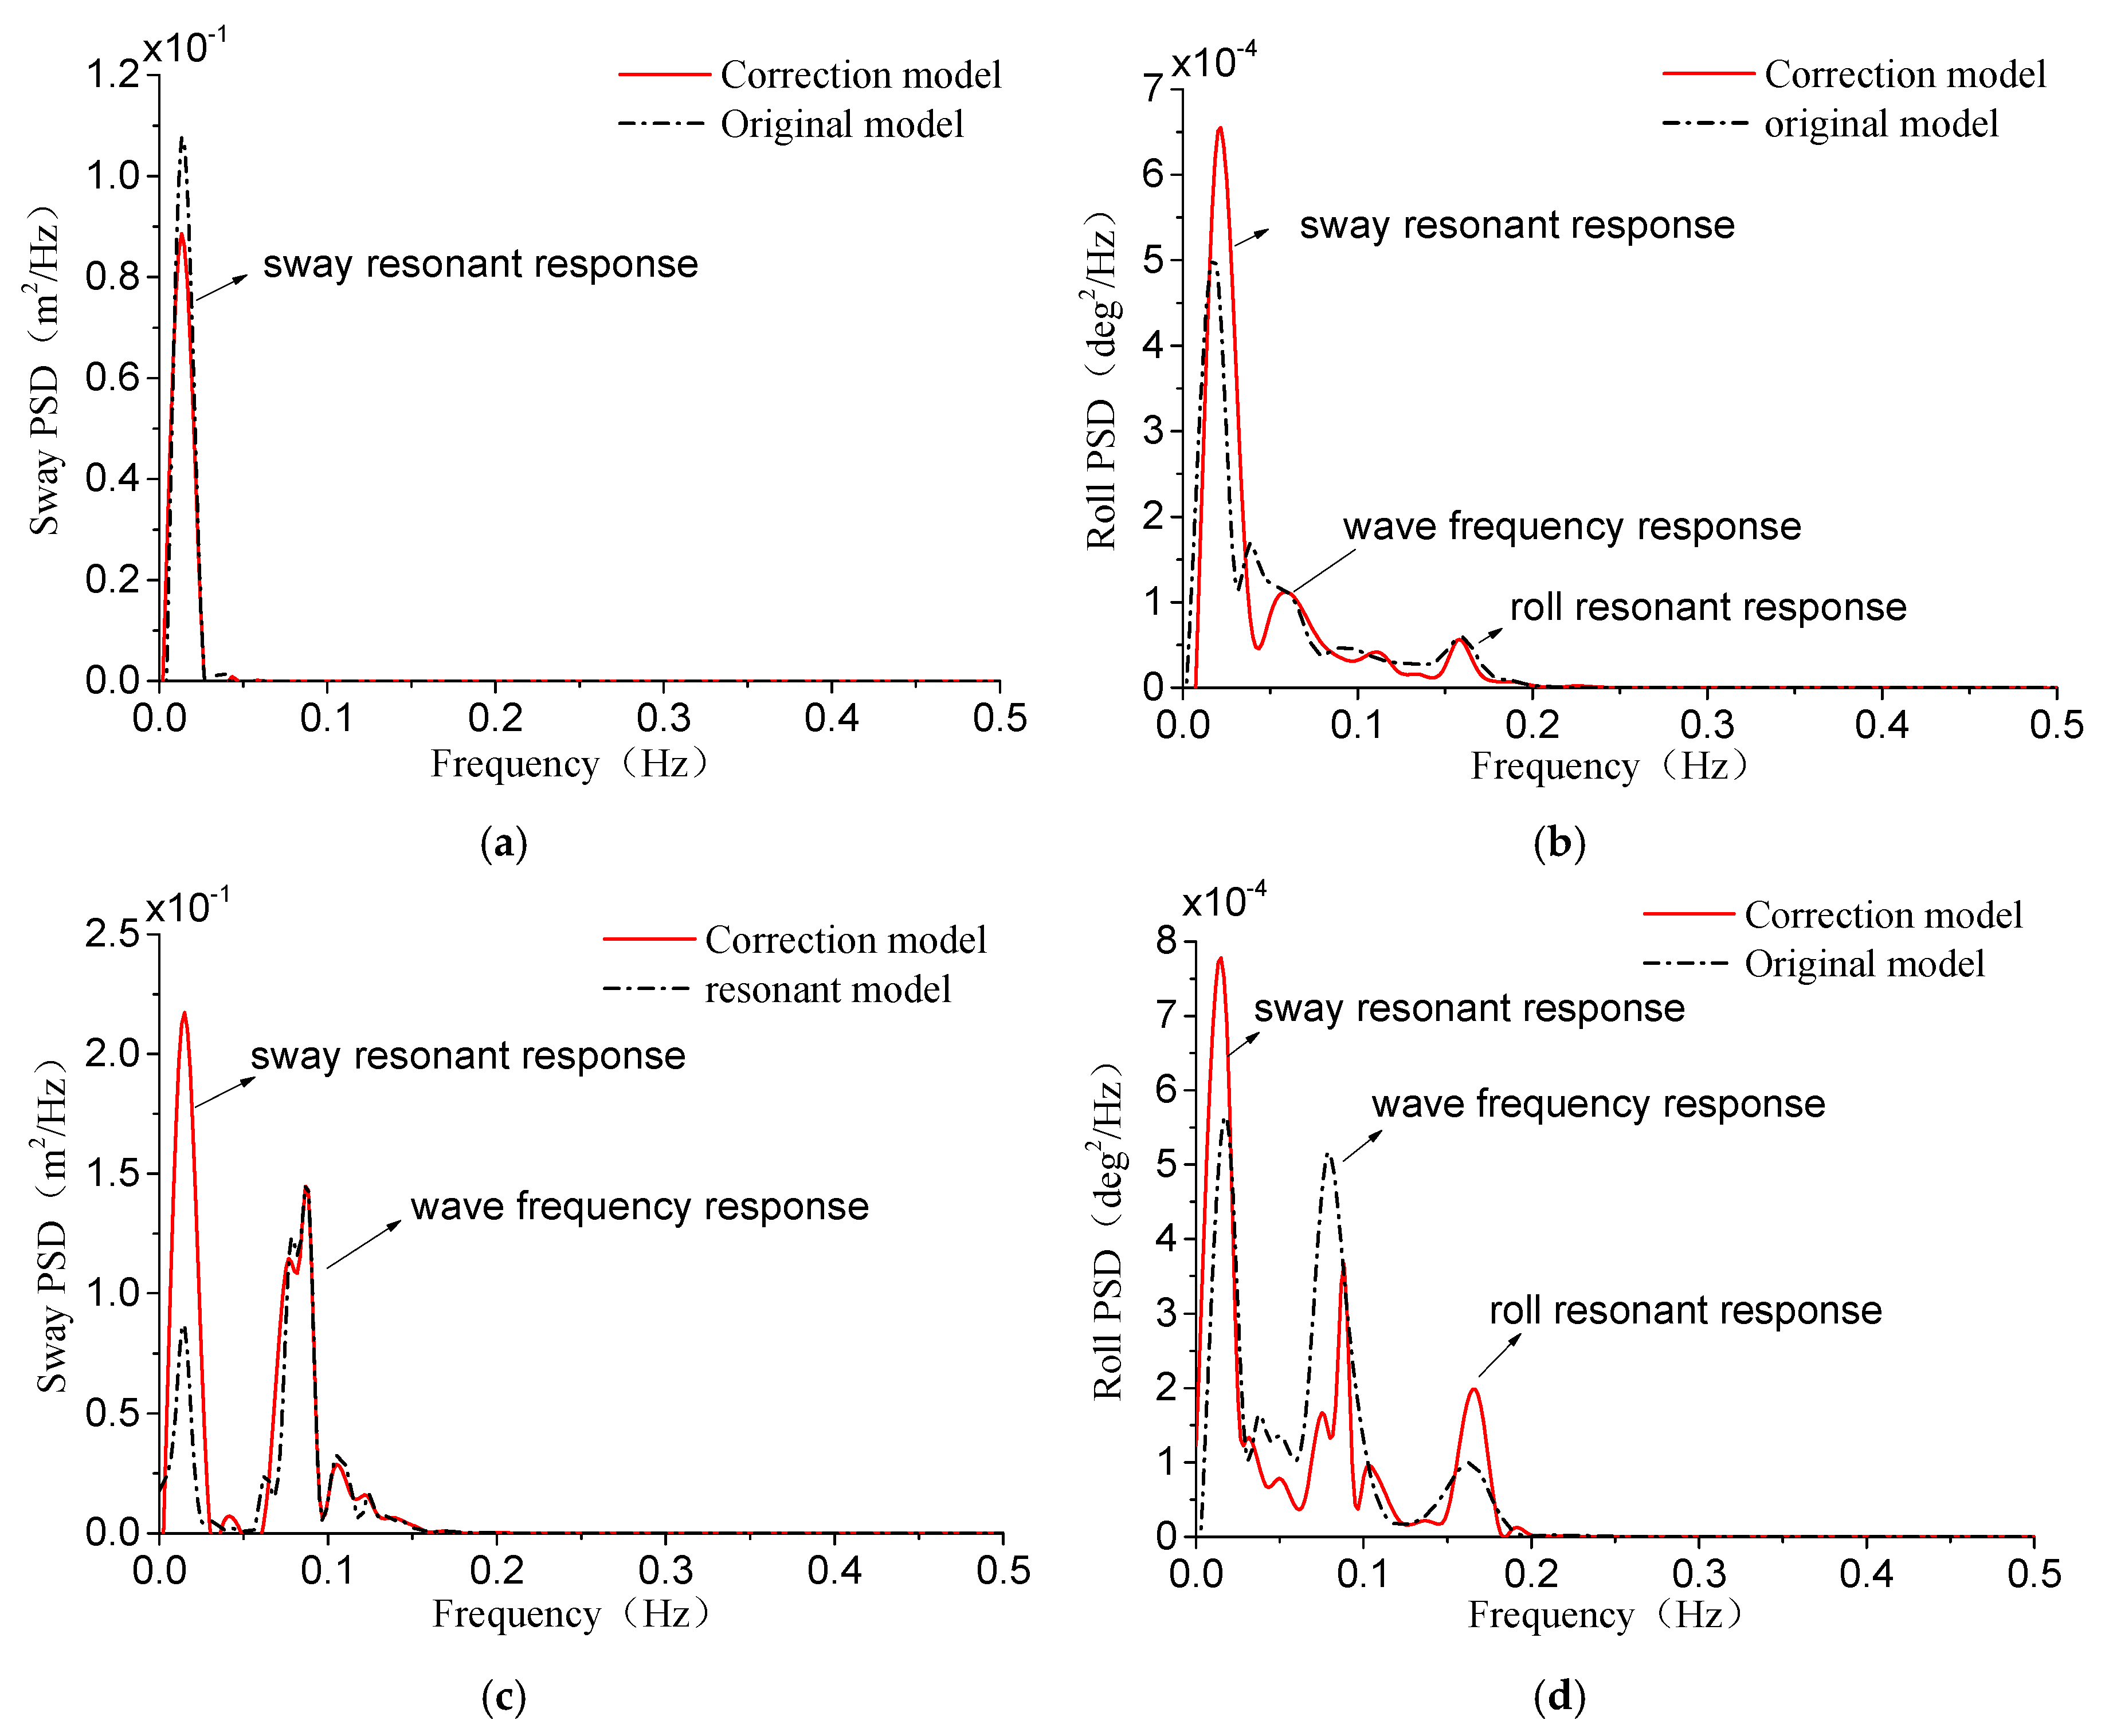
Amplitudes of the pitch and roll motion were overestimated in the free decay motion due to the neglected of viscous drag of the mooring system. Viscous drag would increase the resonance of the platform under the wave loads, while the quasi-static mooring system correction model could capture those resonances better. Wave loads mainly affected the pitch and surge motion when βwave is 0°. The inertial force caused by the surge motion would generate high-frequency moments which would cause pitch resonance. When the wind-wave misalignment, the inertial force caused by the sway motion would generate high-frequency moments without the inhibition of aerodynamic damping, which would cause roll resonance.

Author Contributions

The analysis and interpretation of modeling and simulation were carried out by T.L., who was also responsible for writing the manuscript of this paper. D.T. conducts analysis and guidance, who also revised the manuscript critically. R.W. is in charge of data statistics and analysis. C.L. provides technical guidance.

Funding

This research was funded by the CAS Key Laboratory of Wind Energy Utilization of China, Grant number KLWEU-2016-0101 and the Fundamental Research Funds for the Central Universities, Grant number 2018QN060.

Conflicts of Interest

The authors declare no conflict of interest.

References

  1. Danao, L.A.; Edwards, J.; Eboibi, O.; Howell, R. A numerical investigation into the influence of unsteady wind on the performance and aerodynamics of a vertical axis wind turbine. Appl. Energy 2014, 116, 111–124. [Google Scholar] [CrossRef] [Green Version]
  2. Sun, H.; Luo, X.; Wang, J. Feasibility study of a hybrid wind turbine system—Integration with compressed air energy storage. Appl. Energy 2015, 137, 617–628. [Google Scholar] [CrossRef]
  3. Liu, X.; Lu, C.; Li, G.; Godbole, A.; Chen, Y. Effects of aerodynamic damping on the tower load of offshore horizontal axis wind turbines. Appl. Energy 2017, 204, 1101–1114. [Google Scholar] [CrossRef]
  4. Esteban, M.; Leary, D. Current developments and future prospects of offshore wind and ocean energy. Appl. Energy 2012, 90, 128–136. [Google Scholar] [CrossRef]
  5. Shu, Z.R.; Li, Q.S.; Chan, P.W. Investigation of offshore wind energy potential in Hong Kong based on Weibull distribution function. Appl. Energy 2015, 156, 362–373. [Google Scholar] [CrossRef]
  6. Han, Y.; Le, C.; Ding, H.; Cheng, Z.; Zhang, P. Stability and dynamic response analysis of a submerged tension leg platform for offshore wind turbines. Ocean Eng. 2017, 129, 68–82. [Google Scholar] [CrossRef]
  7. Ding, H.; Liu, Y.; Zhang, P.; Le, C. Model tests on the bearing capacity of wide-shallow composite bucket foundations for offshore wind turbines in clay. Ocean Eng. 2015, 103, 114–122. [Google Scholar] [CrossRef]
  8. Wayman, E.N.; Sclavounos, P.D.; Butterfield, S.; Jonkman, J.; Musial, W. Coupled dynamic modeling of floating wind turbine systems. In Proceedings of the Offshore Technology Conference, Houston, TX, USA, 1–4 May 2006. [Google Scholar] [CrossRef]
  9. Karimirad, M.; Moan, T. Wave-and wind-induced dynamic response of a spar-type offshore wind turbine. J. Waterw. Port Coast. Ocean Eng. 2011, 138, 9–20. [Google Scholar] [CrossRef]
  10. Jonkman, J.M.; Matha, D. Dynamics of offshore floating wind turbines—Analysis of three concepts. Wind Energy 2011, 14, 557–569. [Google Scholar] [CrossRef]
  11. Bachynski, E.E.; Moan, T. Design considerations for tension leg platform wind turbines. Mar. Struct. 2012, 29, 89–114. [Google Scholar] [CrossRef]
  12. Luan, C.; Gao, Z.; Moan, T. Modelling and analysis of a semi-submersible wind turbine with a central tower with emphasis on the brace system. In Proceedings of the ASME 2013 32nd International Conference on Ocean, Offshore and Arctic, Nantes, France, 9–14 June 2013. [Google Scholar] [CrossRef]
  13. Bachynski, E.E.; Kvittem, M.I.; Luan, C.; Moan, T. Wind-wave misalignment effects on floating wind turbines: Motions and tower load effects. J. Offshore Mech. Arctic Eng. 2014, 136, 041902. [Google Scholar] [CrossRef]
  14. Matha, D. Model development and loads analysis of an offshore wind turbine on a tension leg platform with a comparison to other floating turbine concepts. In Proceedings of the European Offshore Wind 2009, Stockholm, Sweden, 14–16 September 2009. [Google Scholar] [CrossRef]
  15. Li, Y.; Tang, Y.; Zhu, Q.; Qu, X.; Wang, B.; Zhang, R. Effects of second-order wave forces and aerodynamic forces on dynamic responses of a TLP-type floating offshore wind turbine considering the set-down motion. J. Renew. Sustain. Energy 2017, 9, 063302. [Google Scholar] [CrossRef]
  16. Vita, L.; Ramachandran, G.K.V.; Krieger, A.; Kvittem, M.I.; Merino, D.; Cross-Whiter, J.; Ackers, B.B. Comparison of numerical models and verification against experimental data, using Pelastar TLP concept. In Proceedings of the ASME 2015 34th International Conference on Ocean, Offshore and Arctic Engineering, St. John’s, NL, Canada, 31 May–5 June 2015. [Google Scholar] [CrossRef]
  17. Sant, T.; Bonnici, D.; Farrugia, R.; Micallef, D. Measurements and modelling of the power performance of a model floating wind turbine under controlled conditions. Wind Energy 2015, 18, 811–834. [Google Scholar] [CrossRef]
  18. Nihei, Y.; Iijima, K.; Murai, M.; Ikoma, T. A comparative study of motion performance of four different FOWT designs in combined wind and wave loads. In Proceedings of the ASME 2014 33rd International Conference on Ocean, Offshore and Arctic Engineering, San Francisco, CA, USA, 8–13 June 2014. [Google Scholar] [CrossRef]
  19. Liu, X.; Lu, C.; Liang, S.; Godbole, A.; Chen, Y. Vibration-induced aerodynamic loads on large horizontal axis wind turbine blades. Appl. Energy 2017, 185, 1109–1119. [Google Scholar] [CrossRef] [Green Version]
  20. Shen, M.; Hu, Z.; Liu, G. Dynamic response and viscous effect analysis of a TLP-type floating wind turbine using a coupled aero-hydro-mooring dynamic code. Renew. Energy 2016, 99, 800–812. [Google Scholar] [CrossRef]
  21. Farrugia, R.; Sant, T.; Micallef, D. A study on the aerodynamics of a floating wind turbine rotor. Renew. Energy 2016, 86, 770–784. [Google Scholar] [CrossRef]
  22. Salehyar, S.; Zhu, Q. Aerodynamic dissipation effects on the rotating blades of floating wind turbines. Renew. Energy 2015, 78, 119–127. [Google Scholar] [CrossRef]
  23. Stewart, G.M.; Lackner, M.A.; Robertson, A.; Jonkman, J.; Goupee, A.J. Calibration and validation of a FAST floating wind turbine model of the Deep C wind scaled tension-leg platform. In Proceedings of the 22nd International Offshore and Polar Engineering Conference, Rhodes, Greece, 17–22 June 2015; pp. 1–8. [Google Scholar]
  24. Stewart, G.M.; Robertson, A.; Jonkman, J.; Lackner, M.A. The creation of a comprehensive metocean data set for offshore wind turbine simulations. Wind Energy 2016, 19, 1151–1159. [Google Scholar] [CrossRef]
  25. Barth, S.; Eecen, P.J. Description of The Relation of Wind, Wave and Current Characteristics at The Offshore Wind Farm Egmond Aan Zee (Owez) Location in 2006; ECN: Amsterdam, The Netherlands, 2007. [Google Scholar]
  26. Barj, L.; Jonkman, J.M.; Robertson, A.; Stewart, G.M.; Lackner, M.A.; Haid, L.; Stewart, S.W. Wind/wave misalignment in the loads analysis of a floating offshore wind turbine. In Proceedings of the 32nd ASME Wind Energy Symposium, National Harbor, MD, USA, 13–17 January 2014. [Google Scholar] [CrossRef]
  27. Trumars, J.M.; Jonsson, J.O.; Bergdahl, L. The effect of wind and wave misalignment on the response of a wind turbine at Bockstigen. In Proceedings of the 25th International Conference on Offshore Mechanics and Arctic Engineering, Hamburg, Germany, 4–9 June 2006; pp. 635–641. [Google Scholar]
  28. Moriarty, P.J.; Hansen, A.C. AeroDyn Theory Manual; National Renewable Energy Laboratory: Golden, CO, USA, 2005. [Google Scholar]
  29. Leishman, J.G.; Beddoes, T.S. A Semi-Empirical model for dynamic stall. J. Am. Helicopter Soc. 1989, 34, 3–17. [Google Scholar] [CrossRef]
  30. Gharali, K.; Johnson, D.A. Numerical modeling of an S809 airfoil under dynamic stall, erosion and high reduced frequencies. Appl. Energy 2012, 93, 45–52. [Google Scholar] [CrossRef]
  31. Gharali, K.; Johnson, D.A. Dynamic stall simulation of a pitching airfoil under unsteady freestream velocity. J. Fluid. Struct. 2013, 42, 228–244. [Google Scholar] [CrossRef]
  32. Jonkman, J.M.; Hayman, G.J.; Jonkman, B.J.; Damiani, R.R.; Murray, R.E. AeroDyn V15 User’s Guide and Theory Manual; NREL: Golden, CO, USA, 2015. [Google Scholar]
  33. Wang, K.; Moan, T.; Hansen, M.O. Stochastic dynamic response analysis of a floating vertical-axis wind turbine with a semi-submersible floater. Wind Energy 2016, 19, 1853–1870. [Google Scholar] [CrossRef]
  34. Veritas, D.N. Sesam User Manual: Wadam; SEP: Boulder, CO, USA, 2010. [Google Scholar]
  35. Jonkman, J.M. Dynamics of offshore floating wind turbines—Model development and verification. Wind Energy 2009, 12, 459–492. [Google Scholar] [CrossRef]
  36. Hoff, J.R. Estimation of linear and quadratic roll damping from free-decay tests. Available online: http://www.ivt.ntnu.no/imt/courses/tmr7/resources/decay.pdf (accessed on 6 July 2001).
  37. International Electrotechnical Commission (IEC). Wind Turbines-Part 3: Design Requirements for Offshore Wind Turbines; International Electrotechnical Commission (IEC): London, UK, 2009. [Google Scholar]
  38. Johannessen, K.; Meling, T.S.; Hayer, S. Joint distribution for wind and waves in the northern north sea. In Proceedings of the Eleventh International Offshore and Polar Engineering Conference, Stavanger, Norway, 17–22 June 2001. [Google Scholar]
  39. Bak, C.; Zahle, F.; Bitsche, R.; Kim, T.; Yde, A.; Henriksen, L.C.; Natarajan, A. The DTU 10-MW Reference Wind Turbine; DTU: Lyngby, Denmark, 2013. [Google Scholar]
  40. Jonkman, J.M.; Buhl, M.L., Jr. FAST User’s Guide-Updated 05; National Renewable Energy Laboratory (NREL): Golden, CO, USA, 2005. [Google Scholar]
  41. Bredmose, H.; Mikkelsen, R.; Hansen, A.M.; Laugesen, R.; Heilskov, N.; Jensen, B.; Kirkegaard, J. Experimental study of the DTU 10 MW wind turbine on a TLP floater in waves and wind. In Proceedings of the EWEA Offshore Conference, Copenhagen, Denmark, 10–12 March 2015. [Google Scholar] [CrossRef]
  42. Bae, Y.H.; Kim, M.H. Rotor-floater-tether coupled dynamics including second-order sum–frequency wave loads for a mono-column-TLP-type FOWT (floating offshore wind turbine). Ocean Eng. 2013, 61, 109–122. [Google Scholar] [CrossRef]
  43. Matha, D.; Fischer, T.; Kuhn, M.; Jonkman, J. Model Development and Loads Analysis of a Wind Turbine on a Floating Offshore Tension Leg Platform; National Renewable Energy Lab. (NREL): Golden, CO, USA, 2010. [Google Scholar]
  44. Bachynski, E.E.; Moan, T. Second order wave force effects on tension leg platform wind turbines in misaligned wind and waves. In Proceedings of the ASME 2014 33rd International Conference on Ocean, Offshore and Arctic Engineering, San Francisco, CA, USA, 8–13 June 2014. V09AT09A006. [Google Scholar]
Figure 1. The top view of wind-wave misalignment conditions.
Energies 11 03341 g001
Figure 2. Model calibration: (a) rotor speed; (b) pitch angle θ ; (c) wind rotor thrust.
Energies 11 03341 g002
Figure 3. Surge free decay motion.
Energies 11 03341 g003
Figure 4. Pitch amplitude response operator.
Energies 11 03341 g004
Figure 5. The statistical analysis of the bending moment and short-term damage-equivalent load: (a) The statistical analysis of blade root out-of-plane bending moment My; (b) The statistical analysis of blade root in-plane bending moment Mx; (c) short-term damage equivalent load of the out-of-plane moment My; (d) short-term damage equivalent load of the in-plane moment Mx.
Energies 11 03341 g005aEnergies 11 03341 g005b
Figure 6. Tower top displacement statistics, acceleration time history and corresponding power spectrum; (a) Tower top fore-aft displacement statistics; (b) Tower top fore-aft displacement power spectrum; (c) tower top fore-aft displacement acceleration time history; (d) tower top fore-aft displacement acceleration power spectrum.
Energies 11 03341 g006aEnergies 11 03341 g006b
Figure 7. Tower base bending moment statistical analysis and corresponding power spectrum: (a) Tower base fore-aft bending moment My statistical analysis; (b) Tower base fore-aft bending moment My power spectrum.
Energies 11 03341 g007
Figure 8. Tower base bending moment statistical analysis and corresponding power spectrum: (a) Tower base fore-aft bending moment My statistical analysis; (b) Tower base fore-aft bending moment My power spectrum.
Energies 11 03341 g008
Figure 9. Statistical analysis and corresponding power spectrum of Surge, Heave and Pitch motions. (a) Surge motion statistical analysis; (b) Surge motion power spectrum; (c) Heave motion Statistical analysis; (d) Heave motion power spectrum; (e) Pitch motion Statistical analysis; (f) Pitch motion power spectrum.
Energies 11 03341 g009aEnergies 11 03341 g009b
Figure 10. Mooring line tension statistical analysis and corresponding power spectrum: (a) Mooring line 3 tension statistical analysis; (b) Mooring line 3 tension power spectrum.
Energies 11 03341 g010
Figure 11. The standard deviations of the blade root bending moment, the tower base bending moment and the tension of the mooring lines are shown as a function of the wind-wave misalignment angle βwave: (a) The standard deviations of the blade root in-plane moment Mx; (b) The standard deviations of the blade root out-of-plane moment My; (c) The standard deviations of the tower base side-to-side bending moment My; (d) The standard deviations of the tower base fore-aft bending moment My; (e) the standard deviation of tension of the mooring line 2; (f) the standard deviation of tension of the mooring line 3.
Energies 11 03341 g011aEnergies 11 03341 g011b
Figure 12. The standard deviation of the platform motion is shown as a function of the wind-wave misalignment angle βwave: (a) The standard deviation of the platform surge motion; (b) The standard deviation of the platform sway motion; (c) The standard deviation of the platform heave motion; (d) The standard deviation of the platform roll motion; (e) The standard deviation of the platform pitch motion; (f) The standard deviation of the platform yaw motion.
Energies 11 03341 g012
Figure 13. Power spectrum of standard deviation of platform surge and pitch motion under different wind-waves misalignment: (a) Power spectrum of standard deviation of platform surge motion when βwave = 0°; (b) Power spectrum of standard deviation of platform pitch motion when βwave = 0°; (c) Power spectrum of standard deviation of platform surge motion when βwave = 90°; (d) Power spectrum of standard deviation of platform pitch motion when βwave = 90°.
Energies 11 03341 g013
Figure 14. Power spectrum of standard deviation of platform sway and roll motion under different wind-waves misalignment: (a) Power spectrum of standard deviation of platform sway motion when βwave = 0°; (b) Power spectrum of standard deviation of platform roll motion when βwave = 0°; (c) Power spectrum of standard deviation of platform sway motion when βwave = 90°; (d) Power spectrum of standard deviation of platform roll motion when βwave = 90°.
Energies 11 03341 g014
Table 1. Specifications of the DTU 10 MW turbine.
DescriptionValue
Turbine power10 MW
Rotor orientation configurationUpwind, 3 blades
ControlVariable speed, collective pitch
DrivetrainMedium speed, multiple stage gearbox
Rotor, Hub diameter178.3 m, 5.6 m
Hub height119 m
Cut-in, Rated, Cut-out wind speed4 m/s, 11.4 m/s, 25 m/s
Cut-in, Rated rotor speed6 rpm, 9.6 rpm
Rotor mass229,000 kg
Nacelle mass446,000 kg
Tower mass605,000 kg
Table 2. Specification of the TLP and mooring lines.
DescriptionValue
Platform Diameter19.8 m
Platform Draft47.89 m
Water Depth200 m
Mooring System Angle90°
Total Displacement14,745.69 m3
Platform mass8,013,000 kg
Center of mass−40.612 m
Center of buoyancy –23.945 m
Number of mooring lines8
Mooring lines length152.11 m
Viscous-drag coefficients0.6
Table 3. Turbulent winds and irregular wave conditions.
ConditionUS (m/s)Tp (s)Hs (m)Wind Turbine Status
EC179.562.34Operating
EC28.59.713.3
EC311.410.044.14
EC414.710.295.16
EC517.810.516.18
EC621.311.126.99
EC72511.687.8

