Article

Life Cycle Estimation of Battery Energy Storage Systems for Primary Frequency Regulation

1
ENEA—Italian National Agency for New Technologies, Energy and Sustainable Economic Development, via Anguillarese 301, 00123 Rome, Italy
2
Department of Industrial Engineering, University of Naples Federico II, via Claudio 21, 80125 Naples, Italy
*
Author to whom correspondence should be addressed.
Energies 2018, 11(12), 3320; https://doi.org/10.3390/en11123320
Submission received: 23 October 2018 / Revised: 14 November 2018 / Accepted: 25 November 2018 / Published: 28 November 2018
(This article belongs to the Special Issue Grid-Scale Energy Storage Management)

Abstract

:
An increasing share of renewable energy sources in power systems requires ad-hoc tools to guarantee the closeness of the system’s frequency to its rated value. At present, the use of new technologies, such as battery energy storage systems, is widely debated for its participation in the service of frequency containment. Since battery installation costs are still high, the estimation of their lifetime appears crucial in both the planning and operations of power systems’ regulation service. As the frequency response of batteries is strongly dependent on the stochastic nature of the various contingencies which can occur on power systems, the estimation of the battery lifetime is a very complex issue. In the present paper, the stochastic process which better represents the power system frequency is analyzed first; then the battery lifetime is properly estimated on the basis of realistic dynamic modeling including the state of the charge control strategy. The dynamic evolution of the state of charge is then used in combination with the celebrated rain-flow procedure with the aim of evaluating the number of charging/discharging cycles whose knowledge allows estimating the battery damage. Numerical simulations are carried out in the last part of the paper, highlighting the resulting lifetime probabilistic expectation and the impact of the state of the charge control strategy on the battery lifetime. The main findings of the present work are the proposed autoregressive model, which allows creating accurate pseudo-samples of frequency patterns and the analysis of the incidence of the control law on the battery lifetime. The numerical applications clearly show the prominent importance of this last aspect since it has an opposing impact on the economic issue by influencing the battery lifetime and technical effects by modifying the availability of the frequency regulation service.

1. Introduction

In the last few decades, a large deployment of renewable energy sources (RESs) and the implementation of the deregulated energy market have led to larger frequency changes in power systems. Increased load demand has been satisfied by generation units based on wind and photovoltaic energy, thus limiting the presence of conventional power plants. In this scenario, the main issue to address is related to the massive adoption of power electronics needed to connect RESs to the power network [1,2]. As an example, wind generators typically imply the use of fully-fed induction or synchronous generators and doubly fed induction generators connected to the network through direct current (DC) to alternating current (AC) converters. In this case, power electronics decouple mechanical and electrical sections, thus implying a loss of rotational inertia and, in turn, more frequent and larger changes of system frequency. The analysis of the reduction of rotational inertia and frequency deviation in the presence of a large amount of RESs has become a key aspect of large power systems [3,4,5,6,7,8]. Two main solutions have been highlighted in the recent literature:
  • new control laws of the converters of the RES-based generation plants;
  • integration of grid-connected battery energy storage systems (BESSs).
As far as the adoption of control laws of converters is concerned, the aim is to study proper control laws that are able to mimic the inertial characteristics of the classical synchronous generators. The desired level of the power system inertia is related to the rate of change of frequency, and efforts have been devoted to compensating the loss of rotational inertia with virtual inertia, thus trying to realize the required power system inertia [9,10,11,12].
As far as the use of BESSs is concerned, the battery has proven to be competitive for the service of primary control reserve [13,14,15,16]. The noticeable reductions of frequency deviations obtained with BESSs are ensured provided that the battery state of charge ( S O C ) is controlled so that admissible limits are not violated. In order to allow BESSs to contribute in an effective way to the frequency regulation service, the energy capacity needs to be properly rated. In this regard, BESS sizing could be roughly performed by assigning the droop value and by taking into account that the primary frequency reserve must be linearly deployed within a specified time and frequency intervals. As an example, in the synchronous interconnected networks of the central European countries, the primary frequency regulation linearly deploys within 30 s, starting from the occurrence of an imbalance event of frequency, in correspondence to a frequency deviation of ±200 MHz [17]. The problem of the battery sizing, however, is complicated by the battery degradation mechanism which cannot be disregarded. This complexity is mainly due to the randomness related to the continuous power imbalance which is inherently a stochastic process.
The main contribution of this paper relies upon a rational procedure for deriving the lifetime probability distribution from the knowledge of a limited set of power system frequency samples. This is a fundamental step to take into account reliability aspects in the battery design procedure, which could be considered among the most critical ones. Some mild hypotheses are made in order to perform a consistent statistical analysis of the power system frequency samples, to generate pseudo samples that exhibit similar frequency time variations. Due to the time resolution of the frequency measures (typically a few seconds), in fact, the available historical data are not sufficient to create the required number of frequency patterns needed for an accurate statistical analysis. Our approach is based on the generation of these pseudo samples based on an autoregressive model that represents the time series of the available recorded data. This is consistent with the spreading exploitation of the RESs and preserves the fundamental characteristics of the correlation analysis of the base sample.
The cycle-based degradation of BESS depends on the charge/discharge sequence [18]. The capacity fading can be properly described in terms of the fatigue process since, as focused in [19], the mechanical stress plays a key role in the degradation of the battery performances [20,21]. The significance of the diffusion-induced stress leads to consider the classical approach for the aging of mechanical systems subject to fatigue cycle loading as the most appropriate model for describing the battery performance deterioration.
The lifetime distribution is evaluated through the knowledge of the dynamic evolution of the battery S O C . For this purpose, the implementation of the rain-flow counting algorithm for each dynamic simulation provides the needed information to calculate the life consumption according to the Palmgren-Miner linear damage accumulation rule.
The rest of the paper is organized as follows. In Section 2, a literature review on the BESS adopted for primary frequency regulation is proposed together with the detailed description of the main contributions of this paper. In Section 3, the background of the primary frequency regulation is discussed and some aspects related to the operation and sizing of the BESS is presented. The issue of the battery lifetime duration and the methods available for its estimation is discussed in Section 4. An autoregressive model able to create an effective set of frequency patterns is proposed in Section 5. The results of simulations are proposed in Section 6 and our conclusions are drawn in Section 7.

2. Literature Review and Contribution of the Paper

The application of BESSs for primary frequency regulation has been widely debated in the literature from different perspectives. The impact of the BESS model on the regulation service is discussed in [22] by considering the case of an islanded power system. Ref. [23] uses a model of BESS in an isolated power system which integrates the charging/discharging cycle’s constraints with the generation rate constraint. Based on an area control error, in [24] the control of BESSs for frequency regulation purposes is used to study the performance of both power systems and BESS. In [25], layout and control algorithms are presented with reference to ultracapacitor-based distributed energy storage systems used to provide regulation service in islanded networks. Ref. [26] discusses the degrees of freedom in the regulation service and the effects of their inclusion in the S O C control of the BESS. Different operation strategies are analyzed in [27], with reference to their influence on BESS operational parameters, such as the S O C ranges and management levels. In [28], the effectiveness of battery storage devices is investigated by analyzing experimental and historical data. With reference to the Lithium-ion battery technology, in [29], an electrical-thermal model is developed and verified on experimental test data. The impact of the BESS used for frequency regulation on the system stability is examined in [30], where the effects of set-point adjustment strategies are studied. In order to investigate the effective methods to increase the potential of BESSs in regulation services, in Ref. [31], a model which aims to account for both technical provision of regulation service and economic revenues is proposed. In [32] an operation simulation model is proposed which includes three main parts: the grid frequency control module, the battery operation simulation module and the statistical evaluation module. Within the framework of the unit commitment, Ref. [33] deals with the optimal operation of batteries used as a support to the dynamic frequency of power systems affected by uncertain power production from wind turbines. In [34], by considering real frequency data, strategies for the restoration of the battery S O C are discussed and compared in view of the battery’s lifetime estimation in case of provisions of the deterministic and stochastic ancillary services. Ref. [35] analyzes the suitability of control strategies from the lifetime perspective of Lithium-ion batteries used for primary frequency regulation. In [36], the battery is used to achieve both peak shaving and frequency regulation services while accounting for both battery degradation, operational constraints, and uncertainties in load and signals.
Focusing on the BESS sizing, in [37] hybrid energy storage systems—including battery and supercapacitor—are investigated with reference to their regulation support in an isolated grid and the impact in terms of lifetime and system capacity. Based on a simulation tool, the battery power and energy capacity are studied in [38], with the aim of optimizing the reserve capacity and the ramp rate of the control unit. In [39] an automatic generation control is analyzed with reference to a generator and BESS hybrid system: a model able to optimize the size of the capacity regulation of both battery and generator is proposed based on the total costs minimization. In [40] the capacity configuration of the battery storage system combined with a wind turbine generator is studied through battery control strategies based on a frequency regulation reserve. Several electrochemical technologies are considered in [41] for different types of aging tests by comparing different cycle test types for frequency regulation. The method in [14] allows determining the minimum capacity of the battery based on the S O C limits and on the historic frequency data. In [15] a sizing methodology is proposed, based on inertia constant and the power/frequency characteristic used to estimate the power and energy capacity of the storage. Based on the proper control of the S O C , in [42] a methodology for finding the optimal battery power/energy rated value and control parameters with respect to the historical data of frequency is proposed. In [43] a stochastic optimal power and energy sizing of a BESS is developed for isolated microgrids: uncertainty of solar radiation, wind speed, and power demand, as well as load leveling and reserve support, are taken into account. In [44] the optimal sizing of a storage system is considered with reference to the frequency regulation, taking into account the requirements of wind power integration. For the optimal sizing of BESSs providing frequency control in isolated microgrids, an algorithm is proposed in [45] which includes a control scheme based on the use of the overloading capacity of the battery. In [46], aimed at counteracting the impact of renewable energy on frequency nadir, the optimal placement and sizing of BESSs for primary frequency support in an isolated network is discussed. A theoretical framework for BESSs providing primary frequency control is discussed in [47], where the optimal planning and control strategy based on a stochastic dynamic program is analyzed.
The main items of each contribution are summarized in Table A1 reported in Appendix A. In the table, some relevant aspects related to the use of batteries for primary frequency services are highlighted. In particular, the main items and parameters of the papers are reported in the second column. In the third column, the most important contributions of each work are synthesized.
By the analysis of Table A1, it clearly emerges that the use of BESSs for frequency regulation service can be effective and feasible from both an economic and technical point of view. Additionally, it can be seen that the problem is complicated by several complex issues which have to be faced in real-world applications in order to have the correct size and operation of the BESS. Particularly, in the most recent literature, battery aging emerged as a crucial parameter, whose impact on the battery lifetime heavily affects the economic viability of the battery. The accurate evaluation of the battery lifetime is crucial in BESS sizing studies in order to balance the positive effect of the use of a battery and the economic implications of the requested heave working cycles. The need for accurate simulations tools which deal with the accurate control of the battery S O C is also clearly discussed in the literature. Moreover, proper data analysis of real frequency measurements is another critical point. This complexity is due to the enormous amount of data that have to be managed, according to the time scale of the signal (few seconds) and the large number of samples typically required by the statistical tools.
In this paper, a comprehensive approach is proposed to simulate the operation of a BESS used for primary frequency regulation in a real application which takes into account all the main issues related to the actual implementation of the service. The flowchart of the proposed approach is shown in Figure 1.
The background of frequency regulation is summarized to determine a suitable control strategy of the BESS. The BESS should be properly modeled with regard to both the provision of the primary frequency service and the control of the battery S O C . The proposed control strategy is then applied to a large number of frequency patterns obtained through an autoregressive model applied to a limited number of real data. The application of the proposed control allows for obtaining a large set of power and S O C patterns of the BESS. They are analyzed through the rain-flow method, which provides the data needed for a statistical analysis of the lifetime duration of the battery. Attention is also paid on some features of the S O C control related to the restoration of the stored energy levels. In particular, the effect of this factor on the expected lifetime duration is analyzed.
The main novelties of the paper can be summarized as follows:
  • all aspects related to the battery operation for primary frequency regulation are analyzed to highlight, in a feasible and effective way, the main issues affecting planning and operation;
  • a simulation setup implementing the main features of the BESS control for primary frequency regulation is proposed;
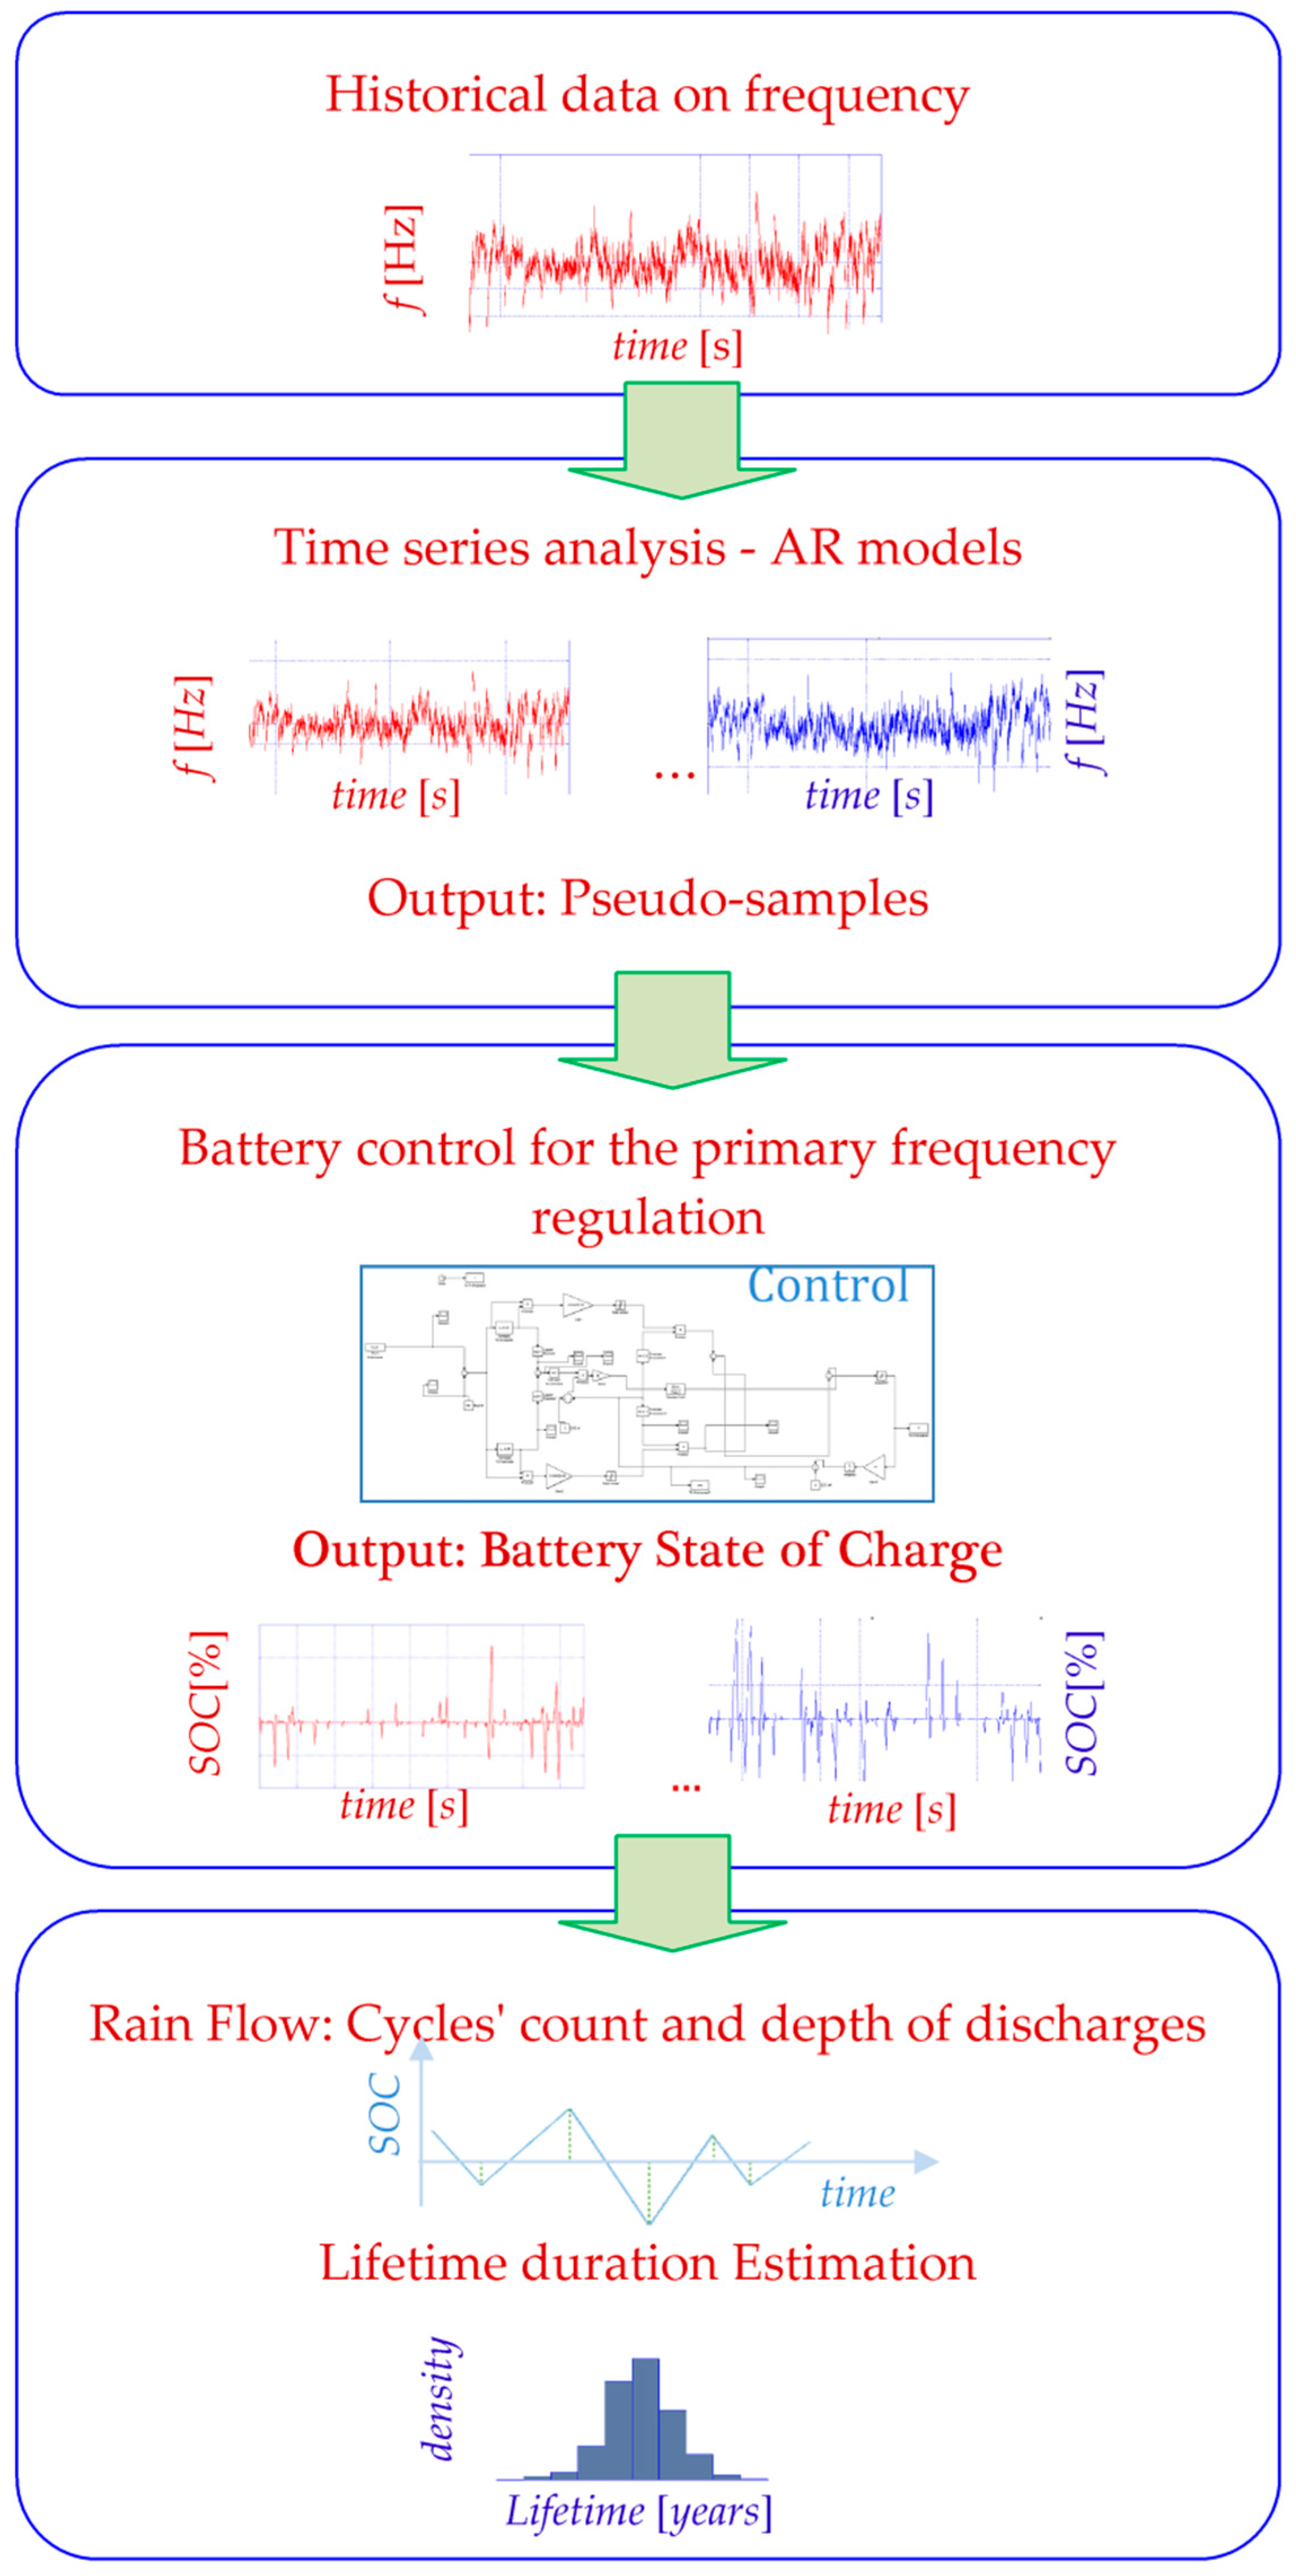
  • an autoregressive model based on actually measured data is tailored to accurately represent effective frequency patterns which are then used in statistical analyses;
  • by analyzing the real frequency measures, an efficient method is adopted to estimate the parameters of the autoregressive model based on a Logistic underlying distribution assumption;
  • a tool is proposed for the statistical prediction of the lifetime duration based on an accurate analysis of the charging/discharging cycles of the BESS provided by the rain-flow method and by a consolidated method used to model the lifetime degradation of the batteries;
  • a sensitivity analysis is proposed in order to show the effect of the control features on the battery lifetime duration.

3. Primary Frequency Regulation with BESS

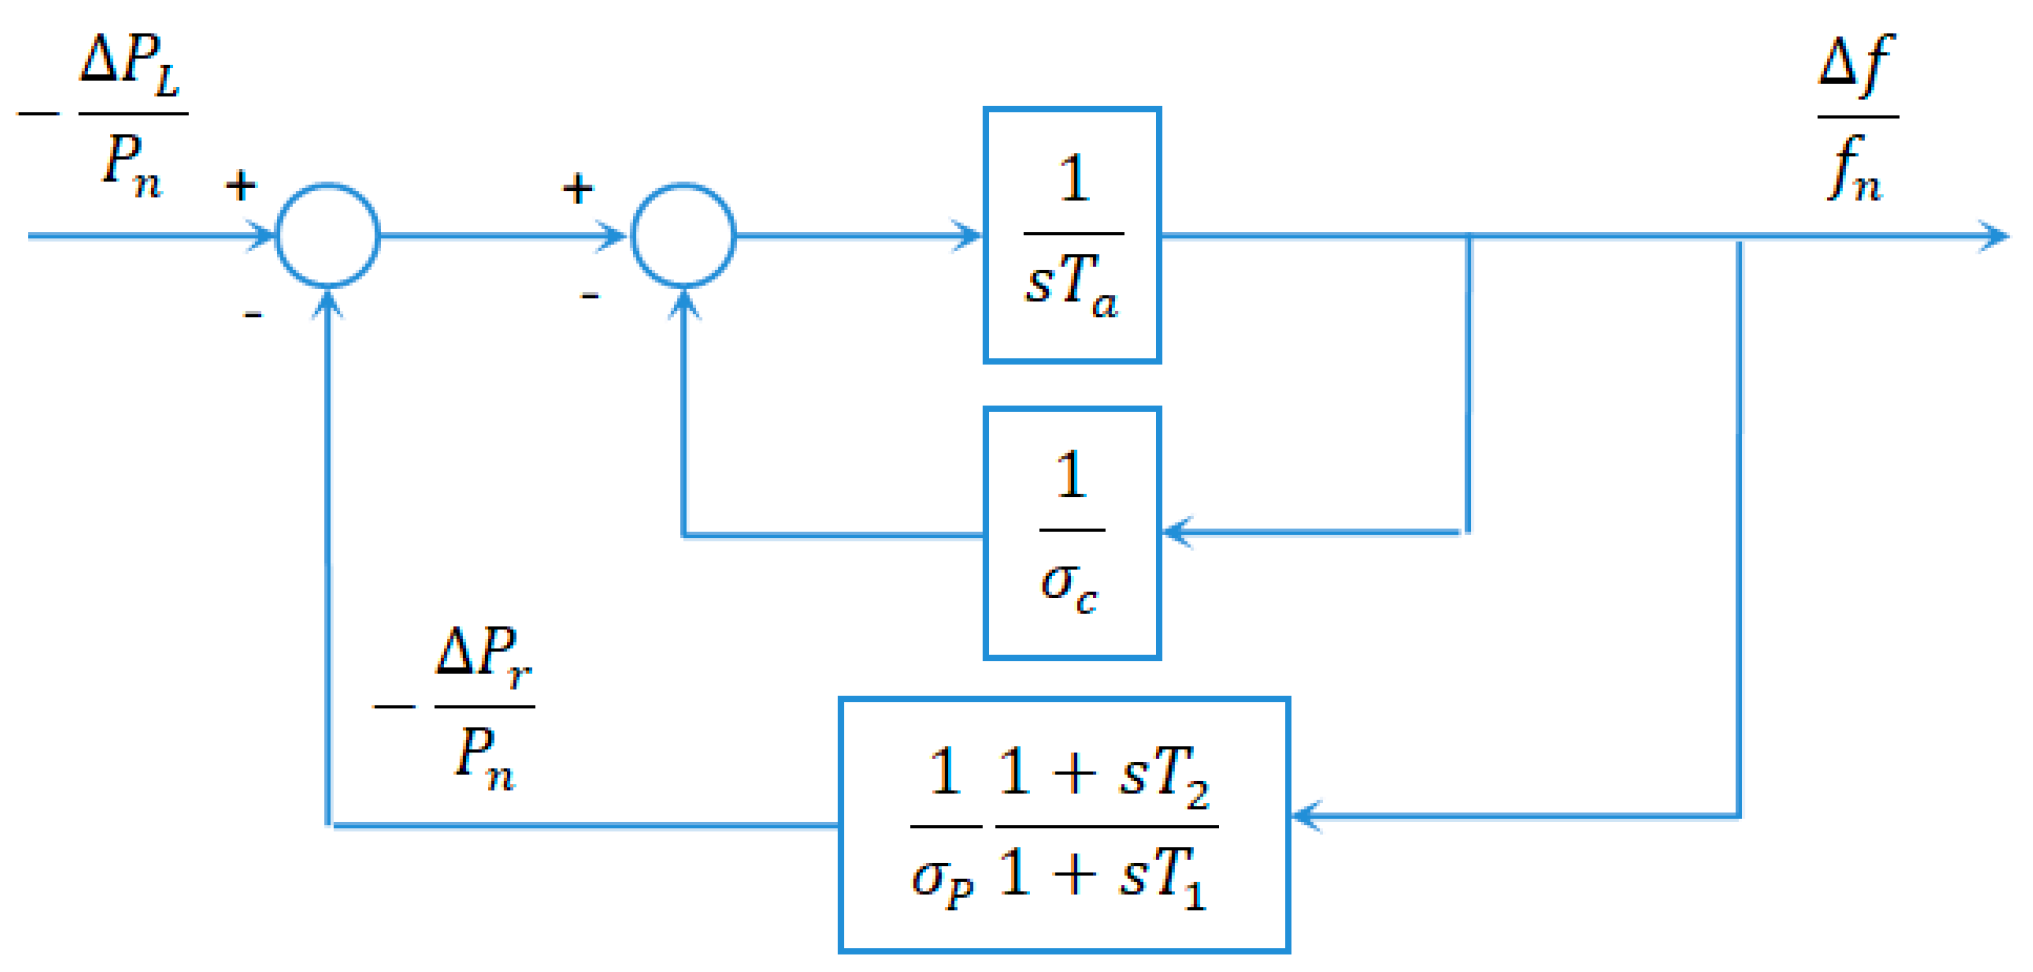
3.1. Basic Concepts on the Primary Frequency Regulation

When perturbations occur, it is necessary to monitor the time evolution of the frequency in order to verify the dynamic security of the network. In particular, it is needed to control the frequency trends following load imbalances. In this case, the frequency exhibits a time evolution which depends on the degree of unbalance, on the features of the frequency regulation, and on the available system rotating reserve after the disturbance. This rotating reserve can be estimated as
R = j = 1 n ( P n j P j 0 )
where R is the rotating reserve, n is the number of groups in service after the perturbation, P j 0 is the power delivered by the jth group at the time of the perturbation, and P n j is its the nominal active power.
The frequency behavior for any kind of load perturbation can be determined once the response to the step load perturbation Δ P L is known, provided that the hypothesis of linearity applies. In case of perturbations of the generated power, such as those corresponding to the disconnection of groups or large intermittences of renewable generation, the frequency behavior can also be derived in terms of variations of equivalent load Δ P L . Typically, the value of the rotating reserve is about five percent of the network nominal power, as a result of economic considerations.
Unbalances larger than the available rotating reserve clearly imply that the frequency keeps dropping. When the power imbalance is relevant, the frequency can reach the lowest limit that causes the protection devices to disconnect automatically from the mains of the large thermoelectric groups, thus causing an additional quality degradation of the operating conditions. To assure that the frequency of the transient does not reach inadmissible values, suitable control actions are then required, such as the automatic reduction of the load, which is typically controlled by frequency and its derivative.
With reference to a generation unit, the basic equation of the primary frequency regulation is the well-known transfer function of the regulator:
Δ P r Δ f | Δ f r e f = 0 = E P 1 + s T 2 1 + s T 1
where Δ f r e f is the variation of the frequency reference, Δ f r e f = f f r e f ; Δ P r is the regulating power, T 1 > T 2 ; and E P is the ratio, at steady-state conditions, of the variation of regulating power and the corresponding variation of frequency, with a sign changed. E P is referred to as permanent regulating energy (MW/Hz) due to the regulation of the unit.
Still referring to the steady-state conditions, it is also defined as the permanent droop, σ P , due to the regulation of the unit which is the ratio between the relative variations of frequency and regulating power, with a sign changed. Once the permanent load droop, σ c , is introduced, the transfer function, G ( s ) of the frequency deviation ( Δ f f n ) and the power deviation ( Δ P L P n ) can be derived through the block diagram of Figure 2 and expressed as
G ( s ) = 1 s T a + 1 σ c + 1 σ P 1 + s T 2 1 + s T 1
where T a is the starting time of the unit, in seconds, linked to the inertia constant, H , from the simple relation T a = 2 H .
The characteristic equation for the transfer function (Equation (3)) is characterized by complex and conjugated poles. Thus, the frequency transients is characterized by oscillatory dynamics having pulsation ω 0 [48]. The frequency nadir corresponding to a step function of the load variation, Δ P L = d / s , is given by [48]
f m i n = f n { 1 σ P 1 + σ P σ c d [ 1 + e T 2 + σ P ( T a + T 1 σ c ) 2 T a T 1 σ P t p T 1 T 2 T a σ P ] }
where t p = 1 ω 0 { π 2 a r c t g [ ω T 2 + ω σ P ( T 1 σ c T a ) ] } , ω 0 = 1 2   T a T 1 σ P ω and ω = 1 4 ( 1 + σ P σ c ) T a T 1 σ P [ T 2 + σ P ( T a + T 1 σ c ) ] 2 .

3.2. Batteries for the Primary Frequency Regulation

The use of BESSs for the primary frequency regulation service implies the controlled charge and discharge of the battery in order to keep the frequency deviation within admissible ranges. With reference to the European case study [17], the action required to the storage device is summarized in Figure 3.
Figure 3 shows that, when frequency falls within the dead-band, that is the frequency deviation is in the interval ±20 MHz, no actions from BESS are required. When frequency deviation falls in the interval [−200, −20] MHz the BESS injects power to the network. In this case, the discharged power linearly increases with increasing frequency deviation (up-regulation). The BESS absorbs power from the network when frequency deviation is included in the interval [20, 200] MHz. In this case, the charged power linearly increases with increasing frequency deviation (down-regulation). Eventually, if the frequency deviation exceeds the interval [−200, 200] MHz, the BESS will charge or discharge at its rated power value. In Figure 3, the BESS power is assumed negative when BESS is charged and positive when BESS is discharged.
In order to size the battery, the reference values of the regulation energy required at the system level, Δ E r e f , and potentially provided by the conventional generation groups, Δ E d i s p , have to be estimated. The required regulation energy can be estimated from the magnitude of the loss of the generation group and the frequency’s target value to be achieved. The difference of the required regulation energy and that potentially available from the conventional generation groups allows determining the required BESS rated power through the following power balance:
P b e s s = σ b a t t f n ( Δ E r e f Δ E d i s p )
where P b e s s is the requested rated power of the BESS and σ b a t t is the BESS setting droop.
The BESS energy capacity, E b a t t , required for the primary frequency regulation can be estimated considering that it should be large enough to support both upward and downward services for the duration of τ = 15 min. To verify the constraints on the S O C during battery operation, the charged and discharged energy has to be evaluated according to the BESS efficiency. The S O C value at a generic time t can be evaluated as
S O C ( t ) = S O C 0 0 t P a c t ( ξ ) d ξ E b a t t
with S O C 0 being the initial S O C value and P a c t accounting for the BESS efficiency as
P a c t ( ξ ) = { P b a t t ( ξ ) η d P b a t t ( ξ ) 0 η c P b a t t ( ξ ) P b a t t ( ξ ) < 0
where P b a t t ( ξ ) is the power of the BESS at time ξ , η d is the BESS efficiency in discharge mode (i.e., when P b a t t ( ξ ) 0 ), and η c is the BESS efficiency in charge mode (i.e., when P b a t t ( ξ ) < 0 ).

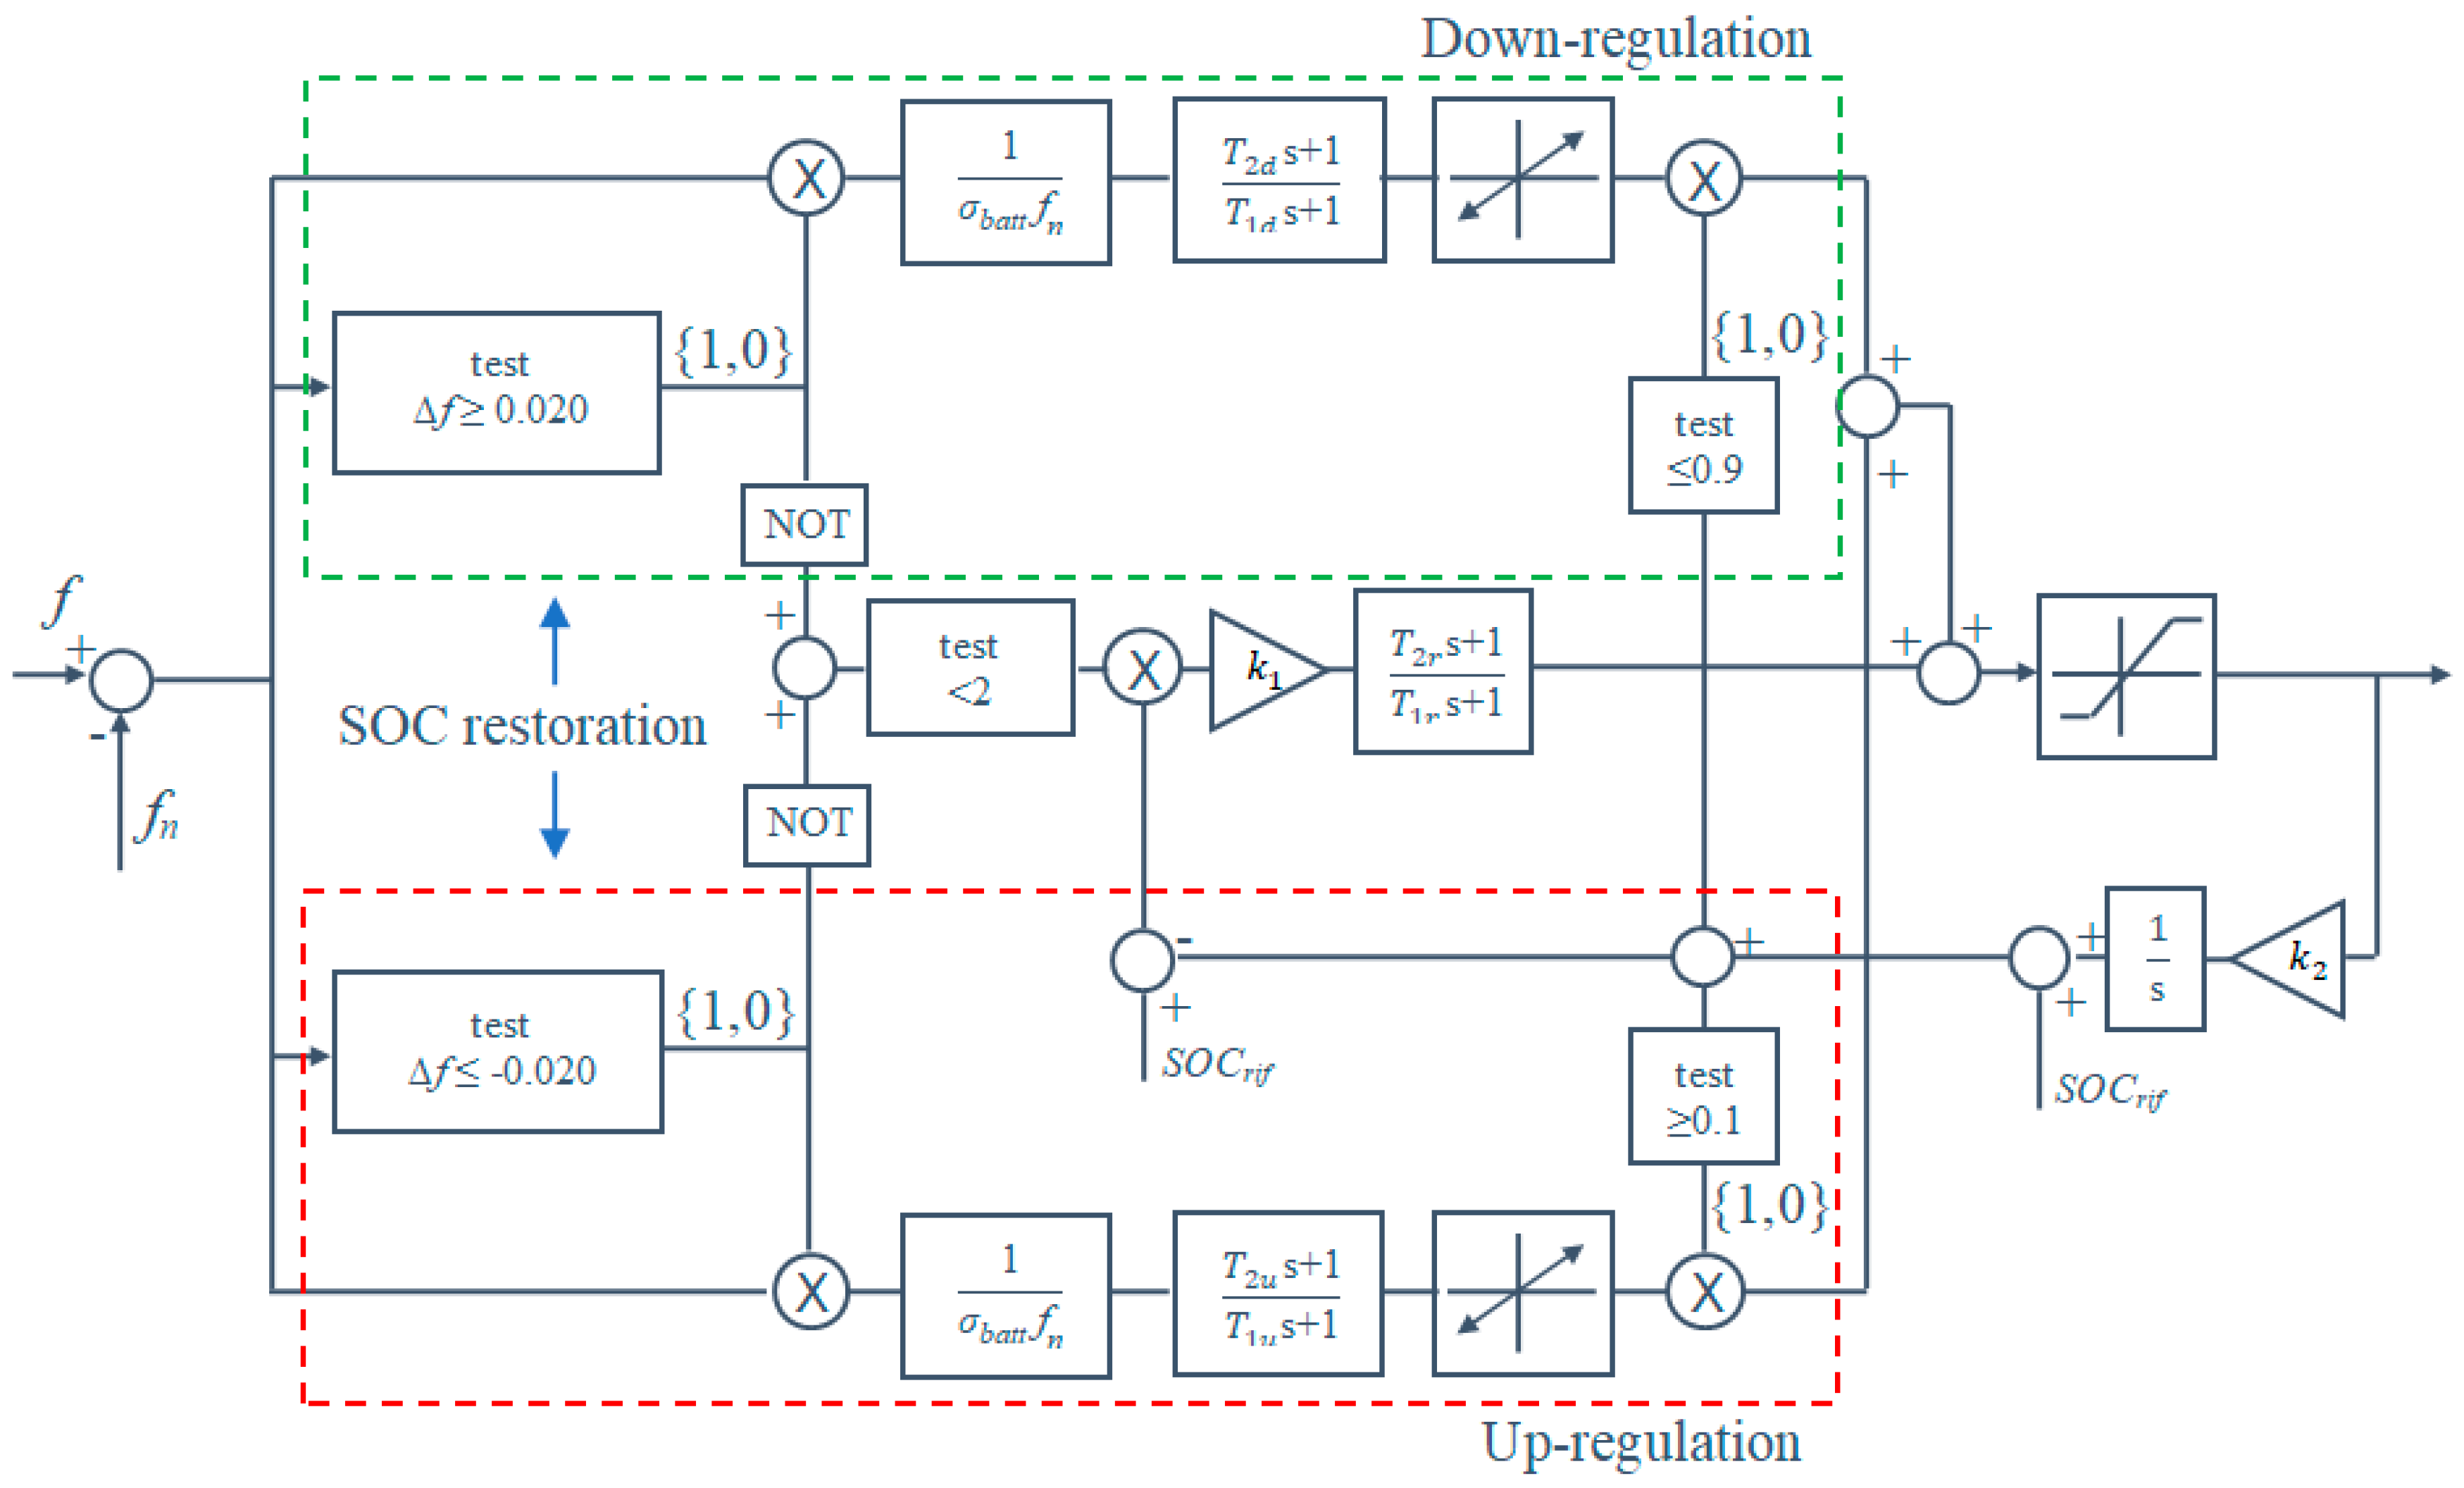
3.3. Battery Control for the Primary Frequency Regulation

In order to simulate the S O C profile related to a specific frequency profile, it is necessary to define a control strategy which allows the battery to provide the primary frequency regulations according to either the requirements of the primary frequency regulations and the stored energy available for charging and discharging. At this aim, the control of the battery S O C is required to allow the battery to
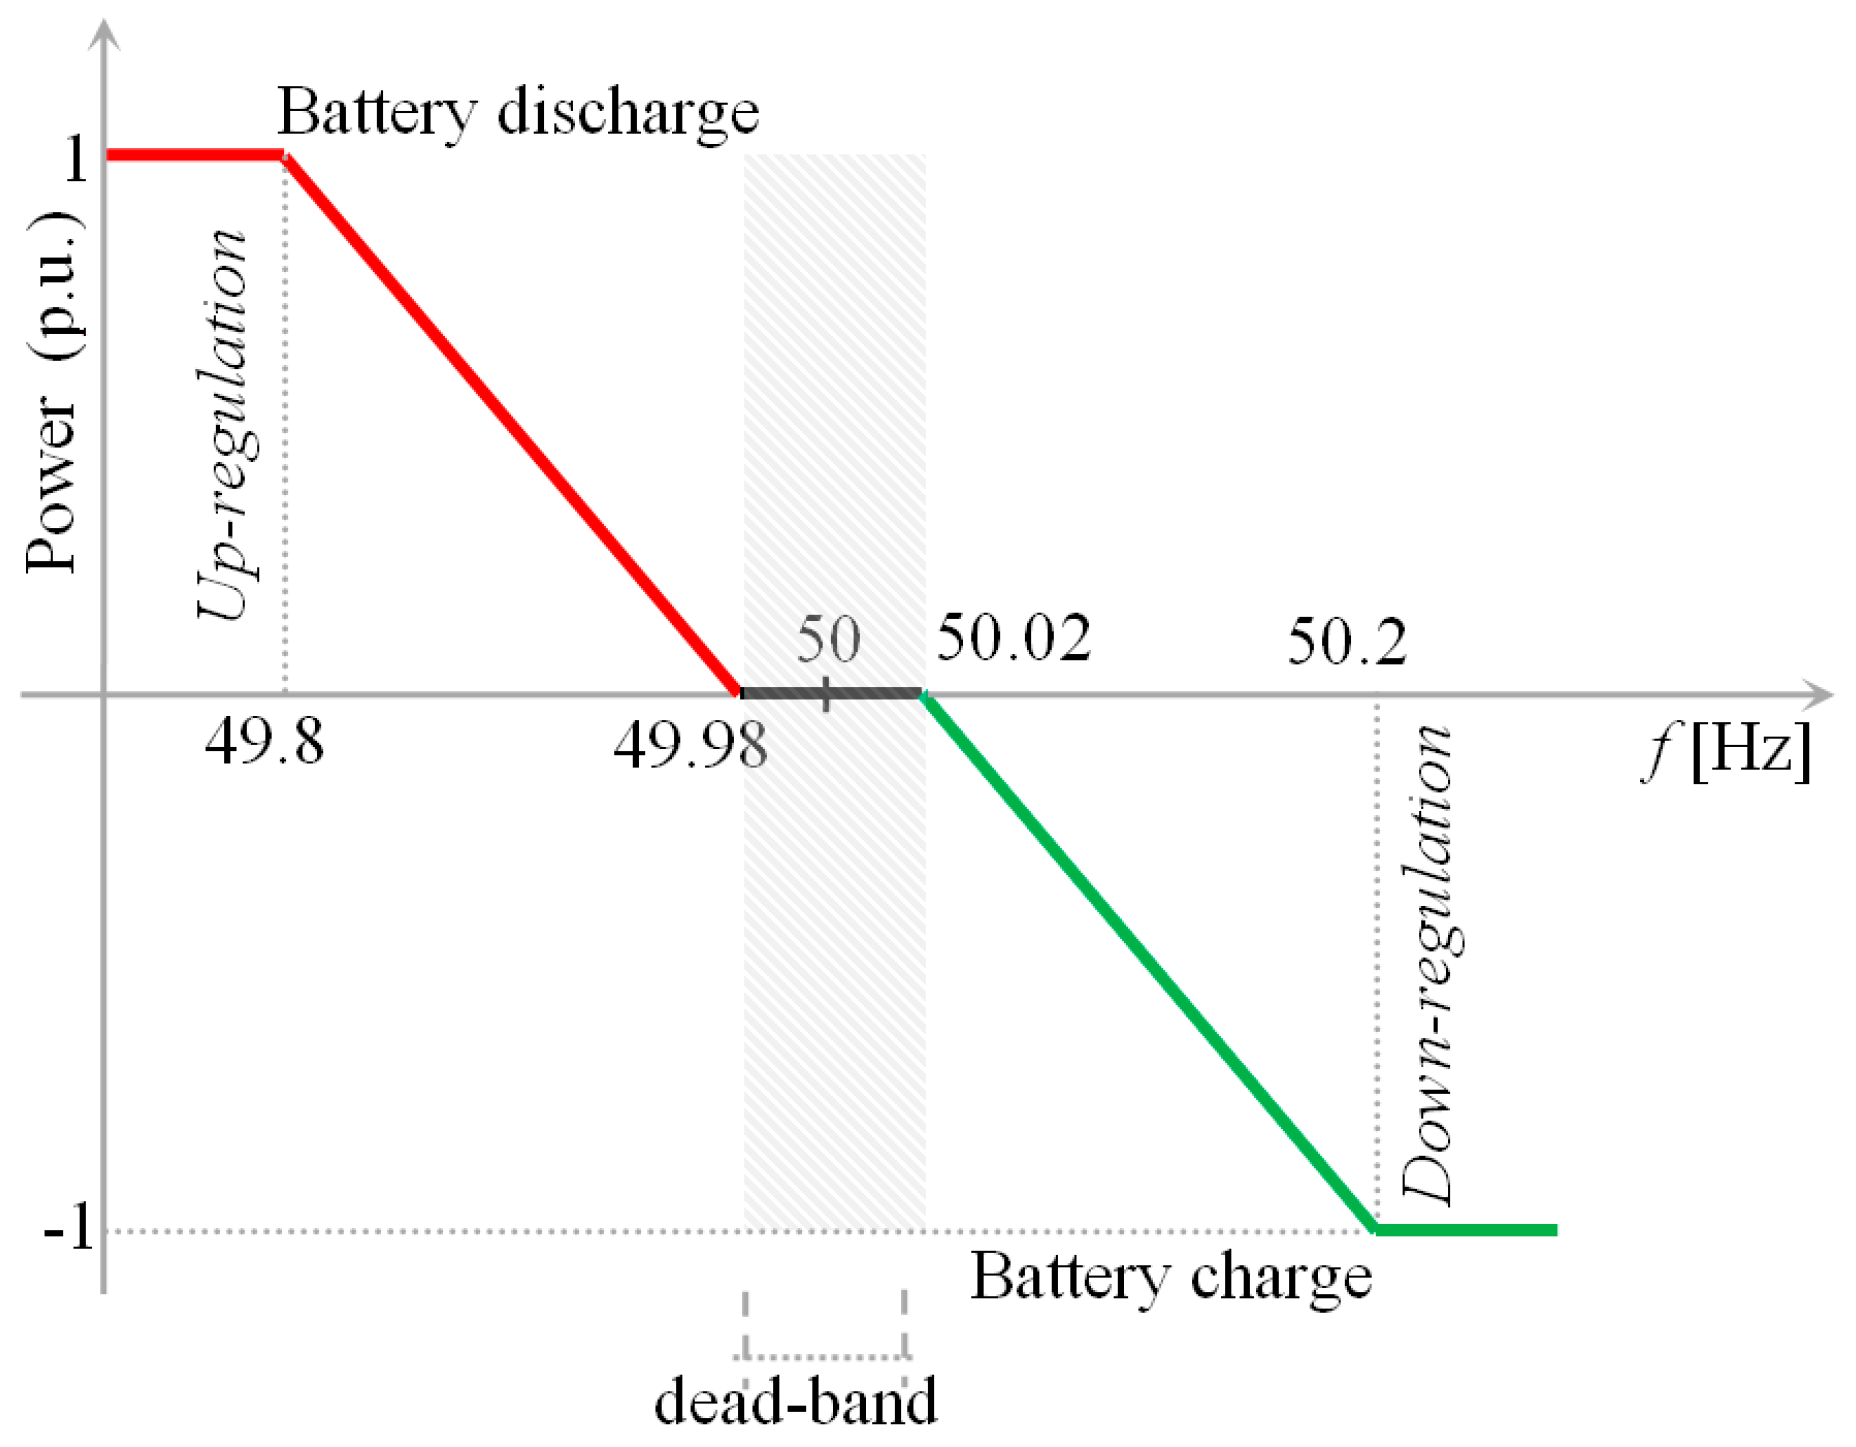
  • provide the charging/discharging power according to the up- and down- regulation reported in Figure 3;
  • restore the S O C at a reference value, when frequency falls within the dead-band; the reference value is typically set at 0.5 p.u.;
  • keep the S O C within the range [ 0.1 , 0.9 ] p.u., in order to preserve the battery lifetime.
In Figure 4, the block diagram of the simulation set up of the control strategy adopted for the primary frequency regulation is shown.
The upper part of Figure 4 refers to the down-regulation, which applies when the frequency deviation is greater than 20 MHz and S O C is lower than 0.9 p.u. In this case, the BESS is requested to absorb power according to a value which depends on the difference between the reference frequency and the actual one and on the BESS setting drop σ b a t t . The time constants of the transfer function of the BESS down-regulation are T 2 d and T 1 d .
The lower part of the diagram refers to the up-regulation, which applies when frequency deviation is lower than −20 MHz and S O C is greater than 0.1 p.u. In this case, the BESS is requested to inject power to the network according to a value which depends on the difference between the reference frequency and the actual one and on the BESS setting drop σ b a t t . The time constants of the transfer function of the BESS up-regulation are T 2 u and T 1 u .
The value of the BESS setting drop is related to the interval amplitude of the frequency for which the primary regulation applies, σ b a t t = 0.0036. In both down- and up-regulation the maximum value of the BESS power is limited by its rated value.
When the frequency falls within the dead-band, the BESS can be charged or discharged in order to restore the reference value of the S O C . The transfer function, whose time constants are T 1 r and T 2 r , acts on the difference between the actual S O C value and the reference one. In this phase, the restoration factor k 1 has a remarkable role, since the higher the factor k 1 , the smaller the deviation of S O C with respect to the reference value. Consequently, the lower the factor k 1 the higher the battery contribution to the power system frequency regulation. Hence, the proper choice of this factor must be a reasonable tradeoff between the regulation service availability of the BESS and the battery lifetime duration. It is worth noting that the tradeoff leading to the identification of the parameter k 1 can be modified according to technical and/or economic issues. The identification of the other parameters of the control architecture described in Figure 4 strictly depends on the service performance required by the grid operator. The effect of the value of the parameter k 1 on the lifetime duration will be extensively discussed in the numerical application of this paper.

4. Battery Lifetime Degradation Estimation

The most critical aspect in designing batteries is the trade-off between the ability in achieving the requested power and energy performances, and in guaranteeing designated lifetime duration with a certain degree of accuracy. It is easy to argue that this problem gets complicated by the inherently probabilistic nature of the interest variables. More specifically, both the requested powers for frequency regulation and the battery capacity fading are stochastic variables. It has to be highlighted that the S O C control strategy has heavy effects on the dynamic evolution of the system and, hence, on these interest variables.
Recent researches about Li-ion batteries evidenced that, during cycling, the capacity fade of the battery is related to mechanical stresses. More precisely, the mechanism of capacity loss is explained on the basis of the theory of the break and repair of the solid electrolyte interphase. This method, as discussed in [19,20,21], reproduces in an accurate way both the incidence of the discharge depth and the influence of the average value of the S O C on the capacity fade. In our opinion, this approach suggests retaining the cycle-counting algorithm, employed for the evaluation of fatigue damage consequent to mechanical vibrations, as a candidate for battery lifetime consumption estimation. Various cycle-countings have been proposed in the relevant literature, but the rain-flow algorithm, first proposed by Matsuishi and Endo [49], is among the most widely employed techniques for performing a fatigue analysis of structural components subject to random loads. Many different algorithms have been proposed in the relevant literature. However, to ascertain the superiority of a given algorithm on the other ones is beyond the scope of this paper. However, a common characteristic to all them is the fact that the output of the signal processing can be organized in a suitable data histogram, thus allowing the assessment of the fatigue life by applying Miner’s rule [50]. This rule assumes that the effects of various different cycles, each characterized by a depth of discharge in the case of batteries, can be combined according to a linear damage accumulation relationship:
L C = j = 1 K n j N f j
where L C is the life consumption, K is the number of different depths of discharge, N f j is the number of cycles to the failure (e.g., the number of cycles needed to reach a capacity fading of 20%) corresponding to the jth depth of discharge, n j is the number of cycles performed at the jth depth of discharge. The number of cycles to failure corresponding to the jth cycle can be derived from [51] as
N f j = ( C f a d e 0.021   e ( 0.1943   μ s o c j ) d j 0.7162 ) 2
where μ s o c j is the average value of the S O C level of the jth cycle, d j is the depth of discharge characterizing the jth cycle and C f a d e is the capacity fade in percentage value, representing the end of the life.

5. Representation of the Frequency Patterns through an Autoregressive Model

Accurate frequency predictions based on power unbalance have a crucial importance for accurately characterizing the battery lifetime. Predictions are based on frequency historical data, that typically consist of sets of observations f ( t ) each one referred to a specified time t . The set T 0 of all the sample time t , is typically a discrete set, thus involving the concept of a discrete time series [52]. The accuracy of the prediction depends strongly on the amount of the historical data, that is, the length of the time series. Due to the time resolution of the frequency measures (typically a few seconds), the available historical data are usually not sufficient to create the required number of frequency patterns needed for accurate statistical analysis. As an example, in order to use Monte Carlo simulations, several thousands of frequency patterns are required. It is thus necessary to set up a time series model to catch the most important features of the available data and to generate patterns that preserve the frequencies of the measured spectrum. In this paper, we propose the use of an appropriate autoregressive model to represent the time series of available recorded data Y t for the frequency deviations with respect to the nominal value. The autoregressive model is used in a great number of engineering applications to infer data from time series [52,53,54]. Under the assumption of a Normal underlying distribution, the autoregressive model can be derived from the more general autoregressive moving average process:
ϕ ( B ) Y t = θ ( B ) Z t , { Z t } ~ W N ( 0 , σ 2 )
where B is the backward shift operator and the parameters ϕ = ( ϕ 1 , , ϕ p ) , θ = ( θ 1 , , θ q ) and variance σ 2 of the white noise need to be estimated starting from the available time series. At this stage, the polynomial orders p and q are assumed to be known. Clearly, p and q depend on the data that have been used to determine their values. Parameters and variance in (10) can be evaluated through several methods available in [54]. In this paper, we focus on pure autoregressive models, that is, when θ ( z ) 1 . In this case, the process (10) can be rewritten as
y t ϕ ^ 1 y t 1 ϕ ^ p y t p = z t , { z t } ~ W N ( 0 , σ ^ 2 )
where ( ϕ ^ 1 , , ϕ ^ p ) and σ ^ 2 are the estimators of the parameters ( ϕ 1 , , ϕ p ) and of the variance σ 2 , respectively.
According to Equation (11), the successful estimate provided by different methods is based on the normally distributed white noise. The adoption of these approaches for the inference of frequency power systems data is supported by preliminary analyses that evidence the Gaussian nature of the static distribution of frequency data [55]. This is clearly shown in Figure 5, where the histogram of frequencies deviations of typical measurements from their reference value is reported [56].
An accurate analysis of the actual frequency data can also imply a non-Normal underlying distribution. The case of auto-regressive models dealing with non-Normal underlying distribution has been treated in the literature, such as the work in [57], with reference to Student distribution and that in [58], with reference to Logistic distribution. In this paper, we focus on the case of the Logistic distribution, as suggested by the analysis shown in the numerical applications. In this case, in order to infer the frequency modeling from the available data, we then propose an autoregressive model based on the following first order polynomial approximation:
y t ϕ ^ y t 1 = μ ^ + a ^ t
with μ ^ the estimation of the mean value of the frequency deviation and a ^ t distributed according to the symmetric Logistic distribution.
A fast estimation of the parameters ϕ ^ and μ ^ in (12) can be performed by solving the following system equations [58]:
[ μ ^ ϕ ^ ] = [ n s y t 1 y t 1 y t 2 ] 1 [ y t y t   y t 1 ]
where n s is the number of samples.
This primary and partial estimation can support a more rigorous and simultaneous estimation of the three parameters in (12) based on the classical statistics method, as the maximum likelihood estimators. The numerical solution can exhibit some convergence problems and, therefore, it can be rather useful to have a preliminary evaluation of the parameters. The likelihood function related to the model (Equation (12)) is given by:
L ( ϕ , μ , σ ) = ( 1 / σ ) n t = 1 n e z t ( 1 + e z t ) 2
with
z t = ( 1 / σ ) ( y t ϕ y t 1 ) μ
By imposing the partial derivatives of the log-likelihood function with respect to the unknowns μ , ϕ , and σ equal to zero,
l n L ( ϕ , μ , σ ) μ = 0 l n L ( ϕ , μ , σ ) ϕ = 0 l n L ( ϕ , μ , σ ) σ = 0
the following system of equations is obtained [58]:
n s 2 t = 1 n s 1 1 + e z t = 0 t = 1 n s y t 1 2 t = 1 n s y t 1 1 1 + e z t = 0 n s t = 1 n s z t + 2 t = 1 n s z t 1 1 + e z t = 0
whose solution provides the estimate of the parameters μ ^ , ϕ ^ , and σ ^ .

6. Numerical Applications

In this section, the results of numerical applications of the proposed approach are reported and discussed. In particular, the results of the battery control for the provision of the primary frequency regulation service are presented first. Then the accurate analysis to represent frequency patterns through an autoregressive model is reported. A discussion on the lifetime duration and the implications of the control law on the battery aging is presented in the final part of the section.

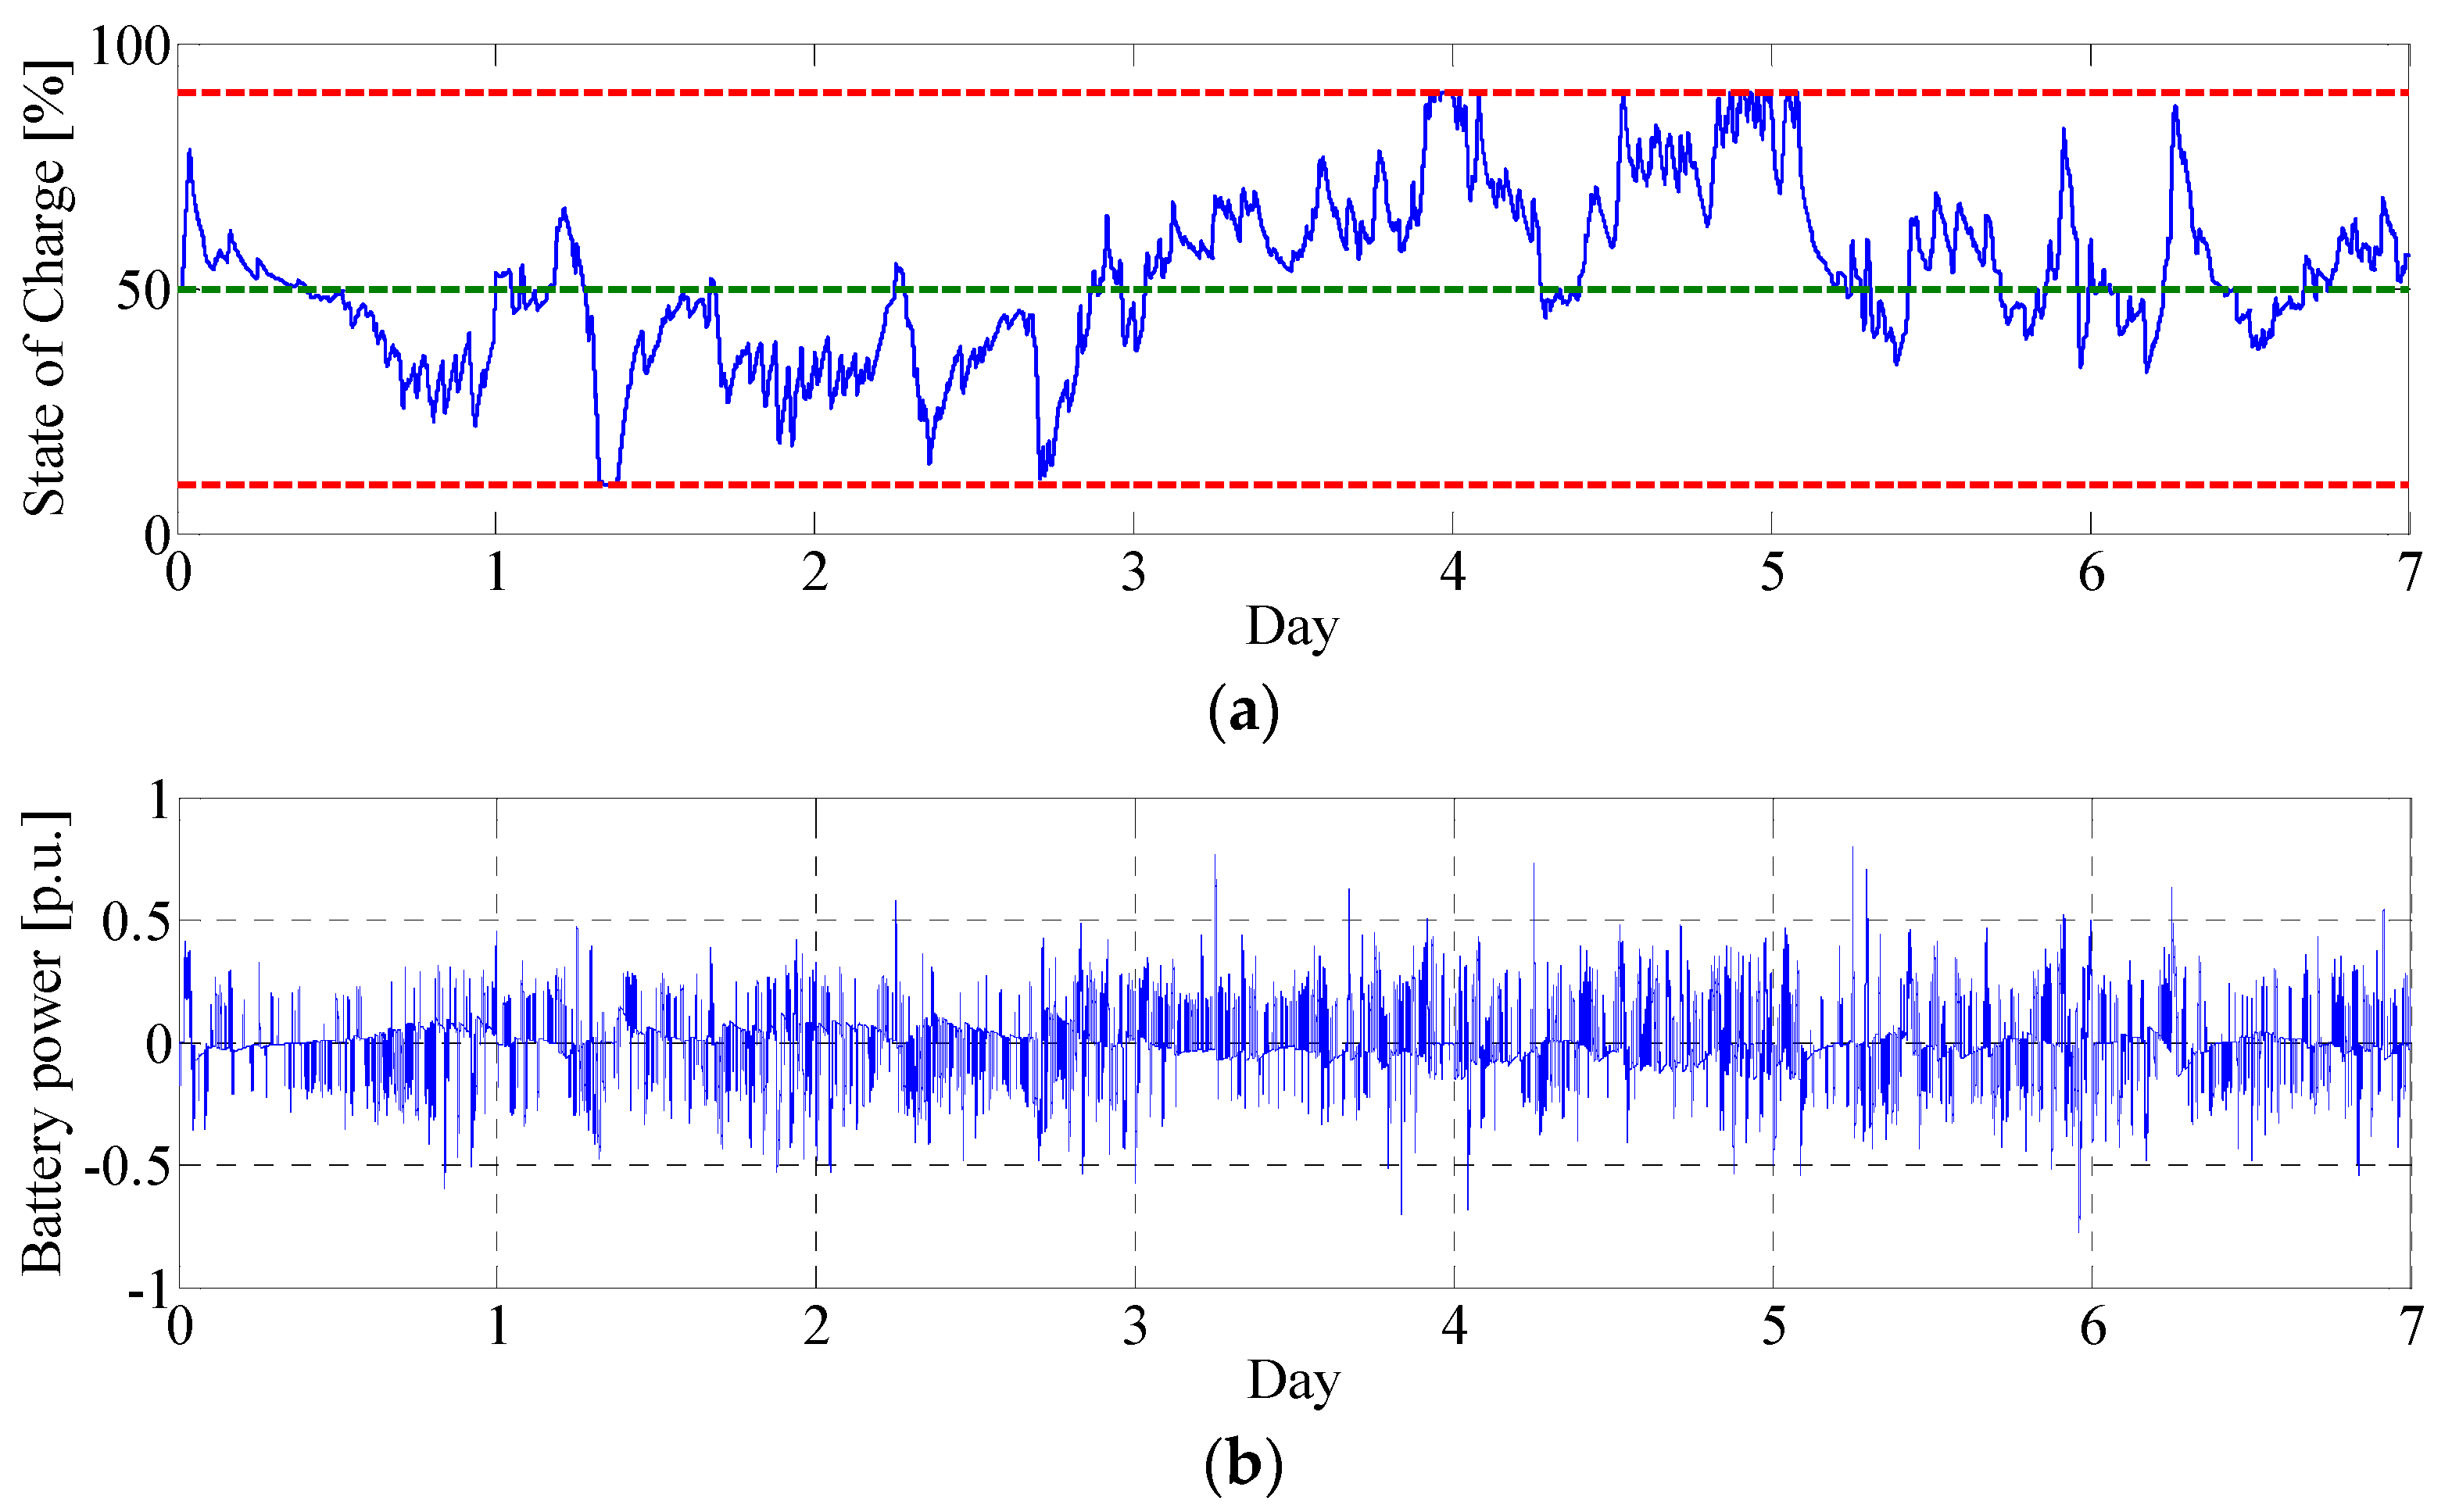
6.1. Battery Control for the Primary Frequency Regulation

The simulation of the primary frequency control described in Section 3.3 has been implemented with reference to real frequency data [56]. According to the requirements defined in [17], the power and energy rating of the BESS were 98.5 MW and 49.5 MWh, respectively, as derived in [15]. Starting from these data and taking into account the requirements imposed by the frequency regulation service in Europe (as discussed in Section 3), the features of the control simulation tool depicted in Figure 4 are easily derived. Regarding the restoration factor, the value k 1 = 0.4 has been considered.
In Figure 6, some results over seven days of simulation were reported. In particular, the S O C profile is shown in Figure 6a, and the power requested to the BESS is reported in Figure 6b. The S O C profile in Figure 6a shows the use of the BESS for regulation purposes, thus highlighting the repeatedly charging and discharging cycles occurred while the upper and lower limit (0.9 p.u. and 0.1 p.u., respectively) are satisfied and the average S O C value is always close to the reference value (0.5 p.u.). Additionally, Figure 6a clearly shows how the BESS is stressed in terms of charging/discharging cycles. It is shown, in fact, that a full charging/discharging cycle happens every few days. During this period, however, a huge number of partial cycles apply whose depth vary within large ranges, depending on the velocity of the S O C restoration. Figure 6b shows that the upper and lower limits of the BESS’ power are also satisfied (+1 p.u. and −1 p.u., respectively).

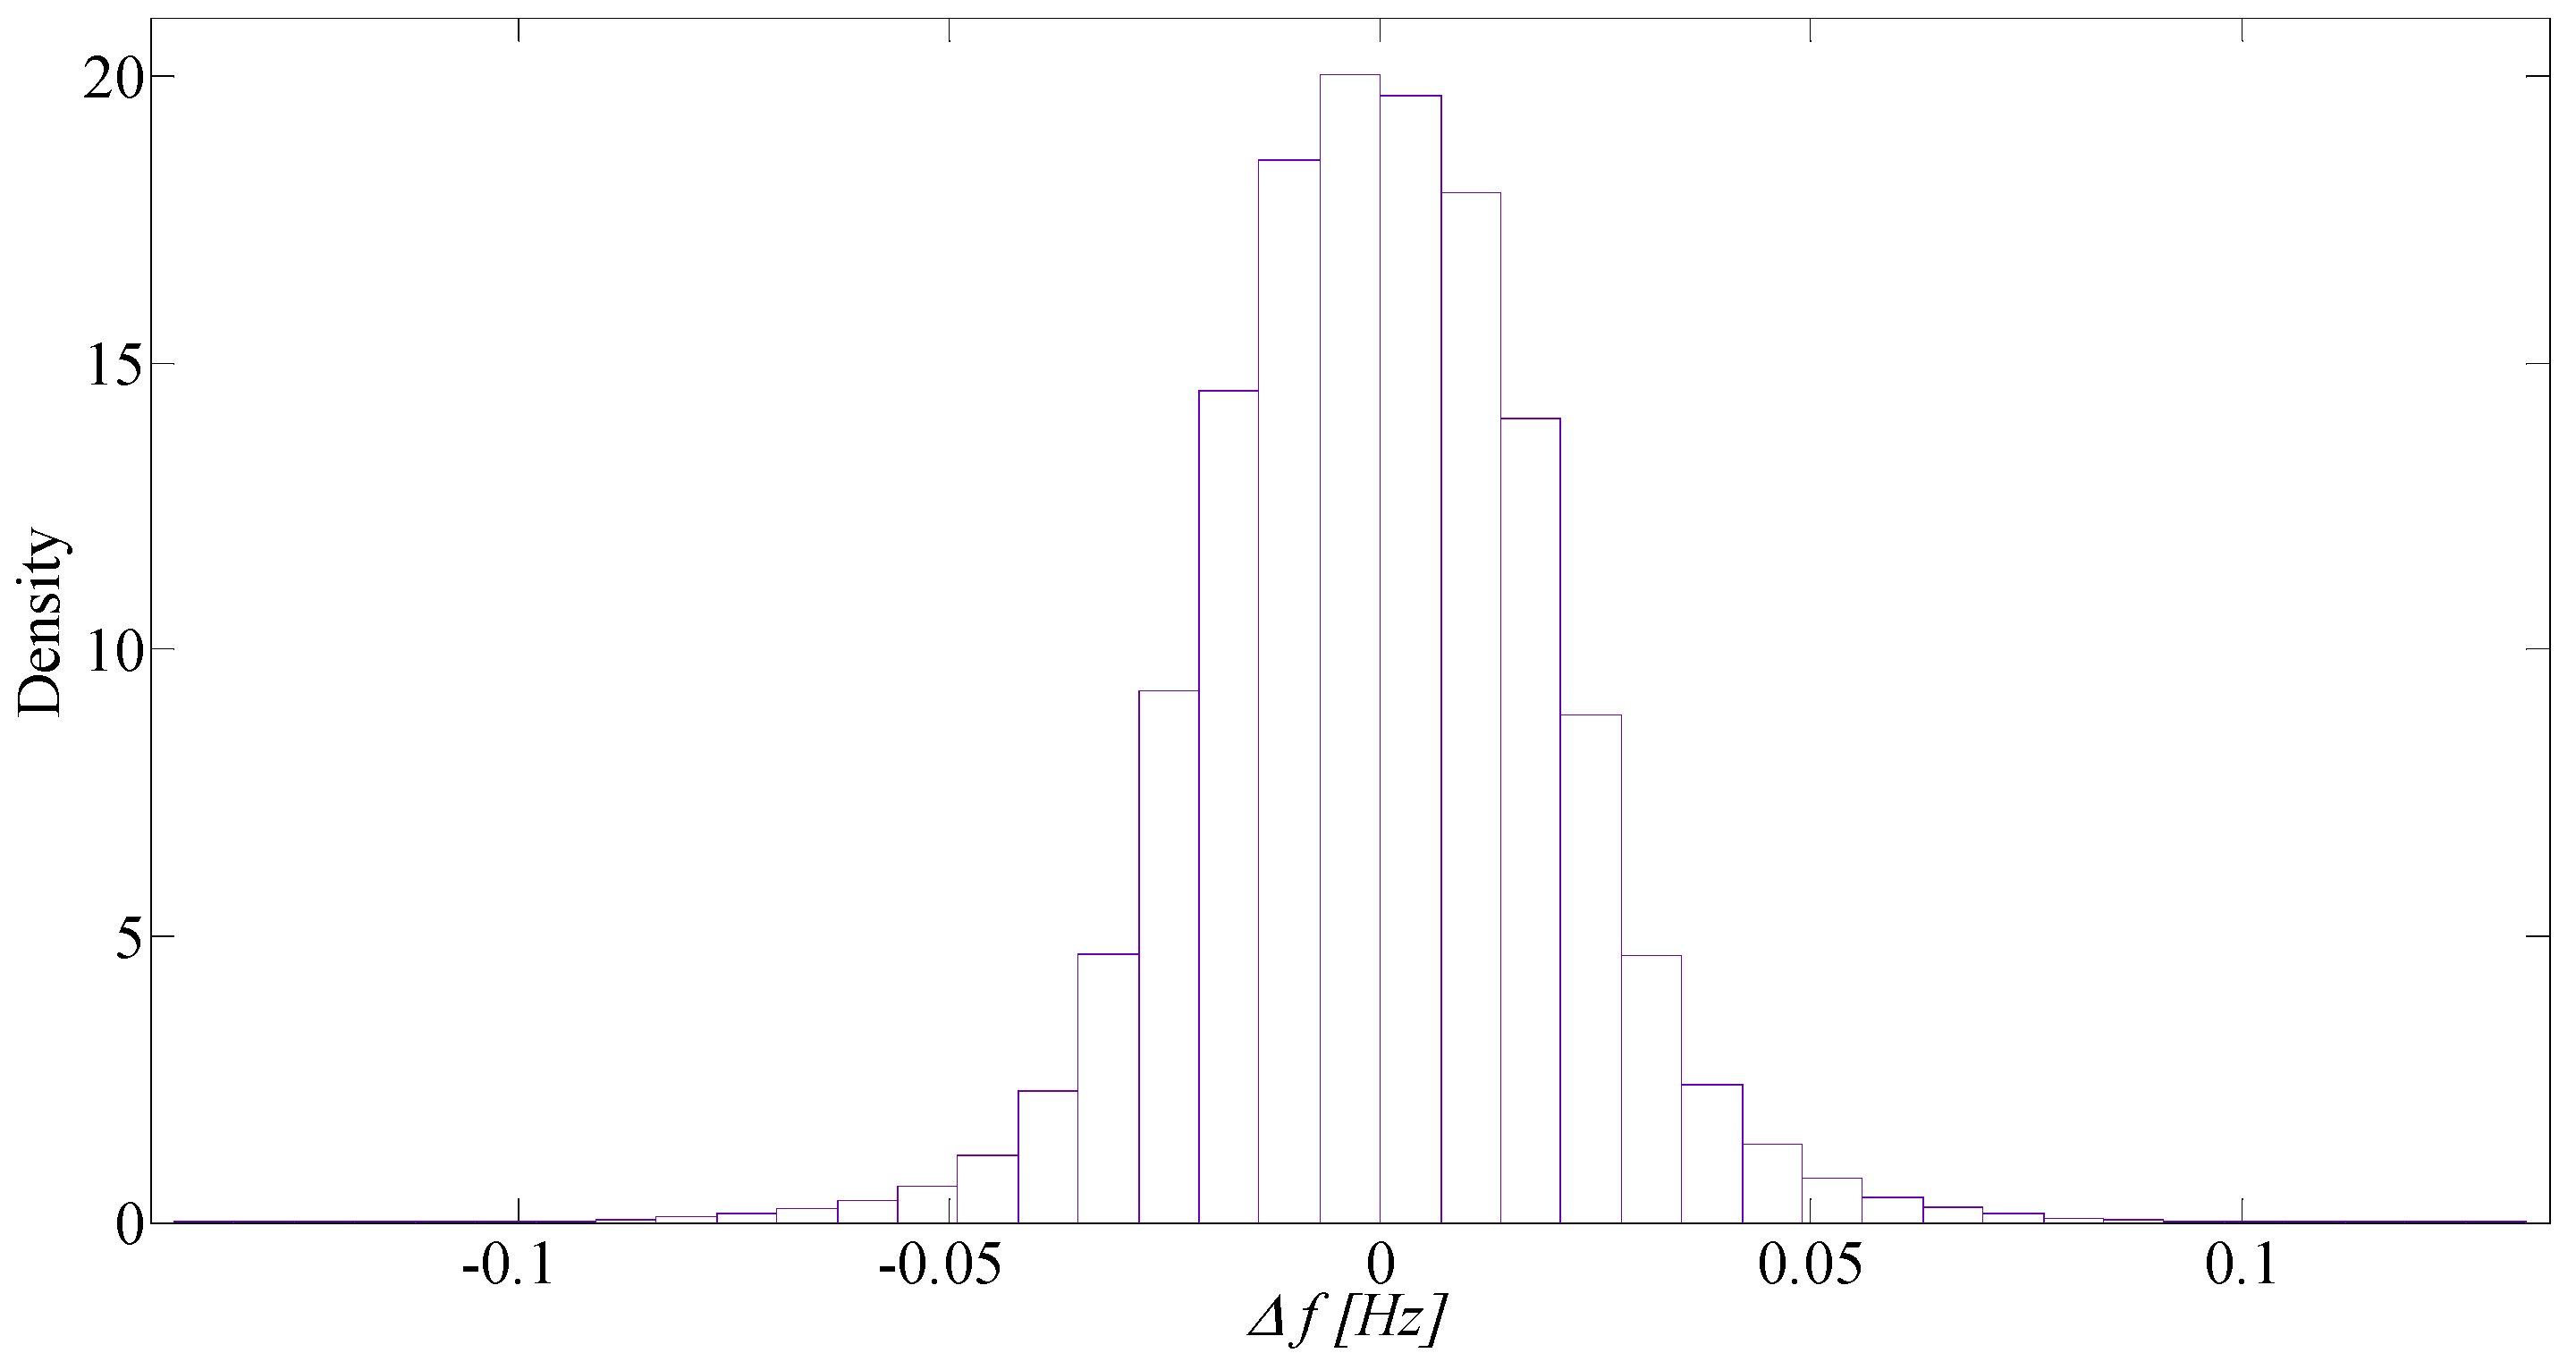
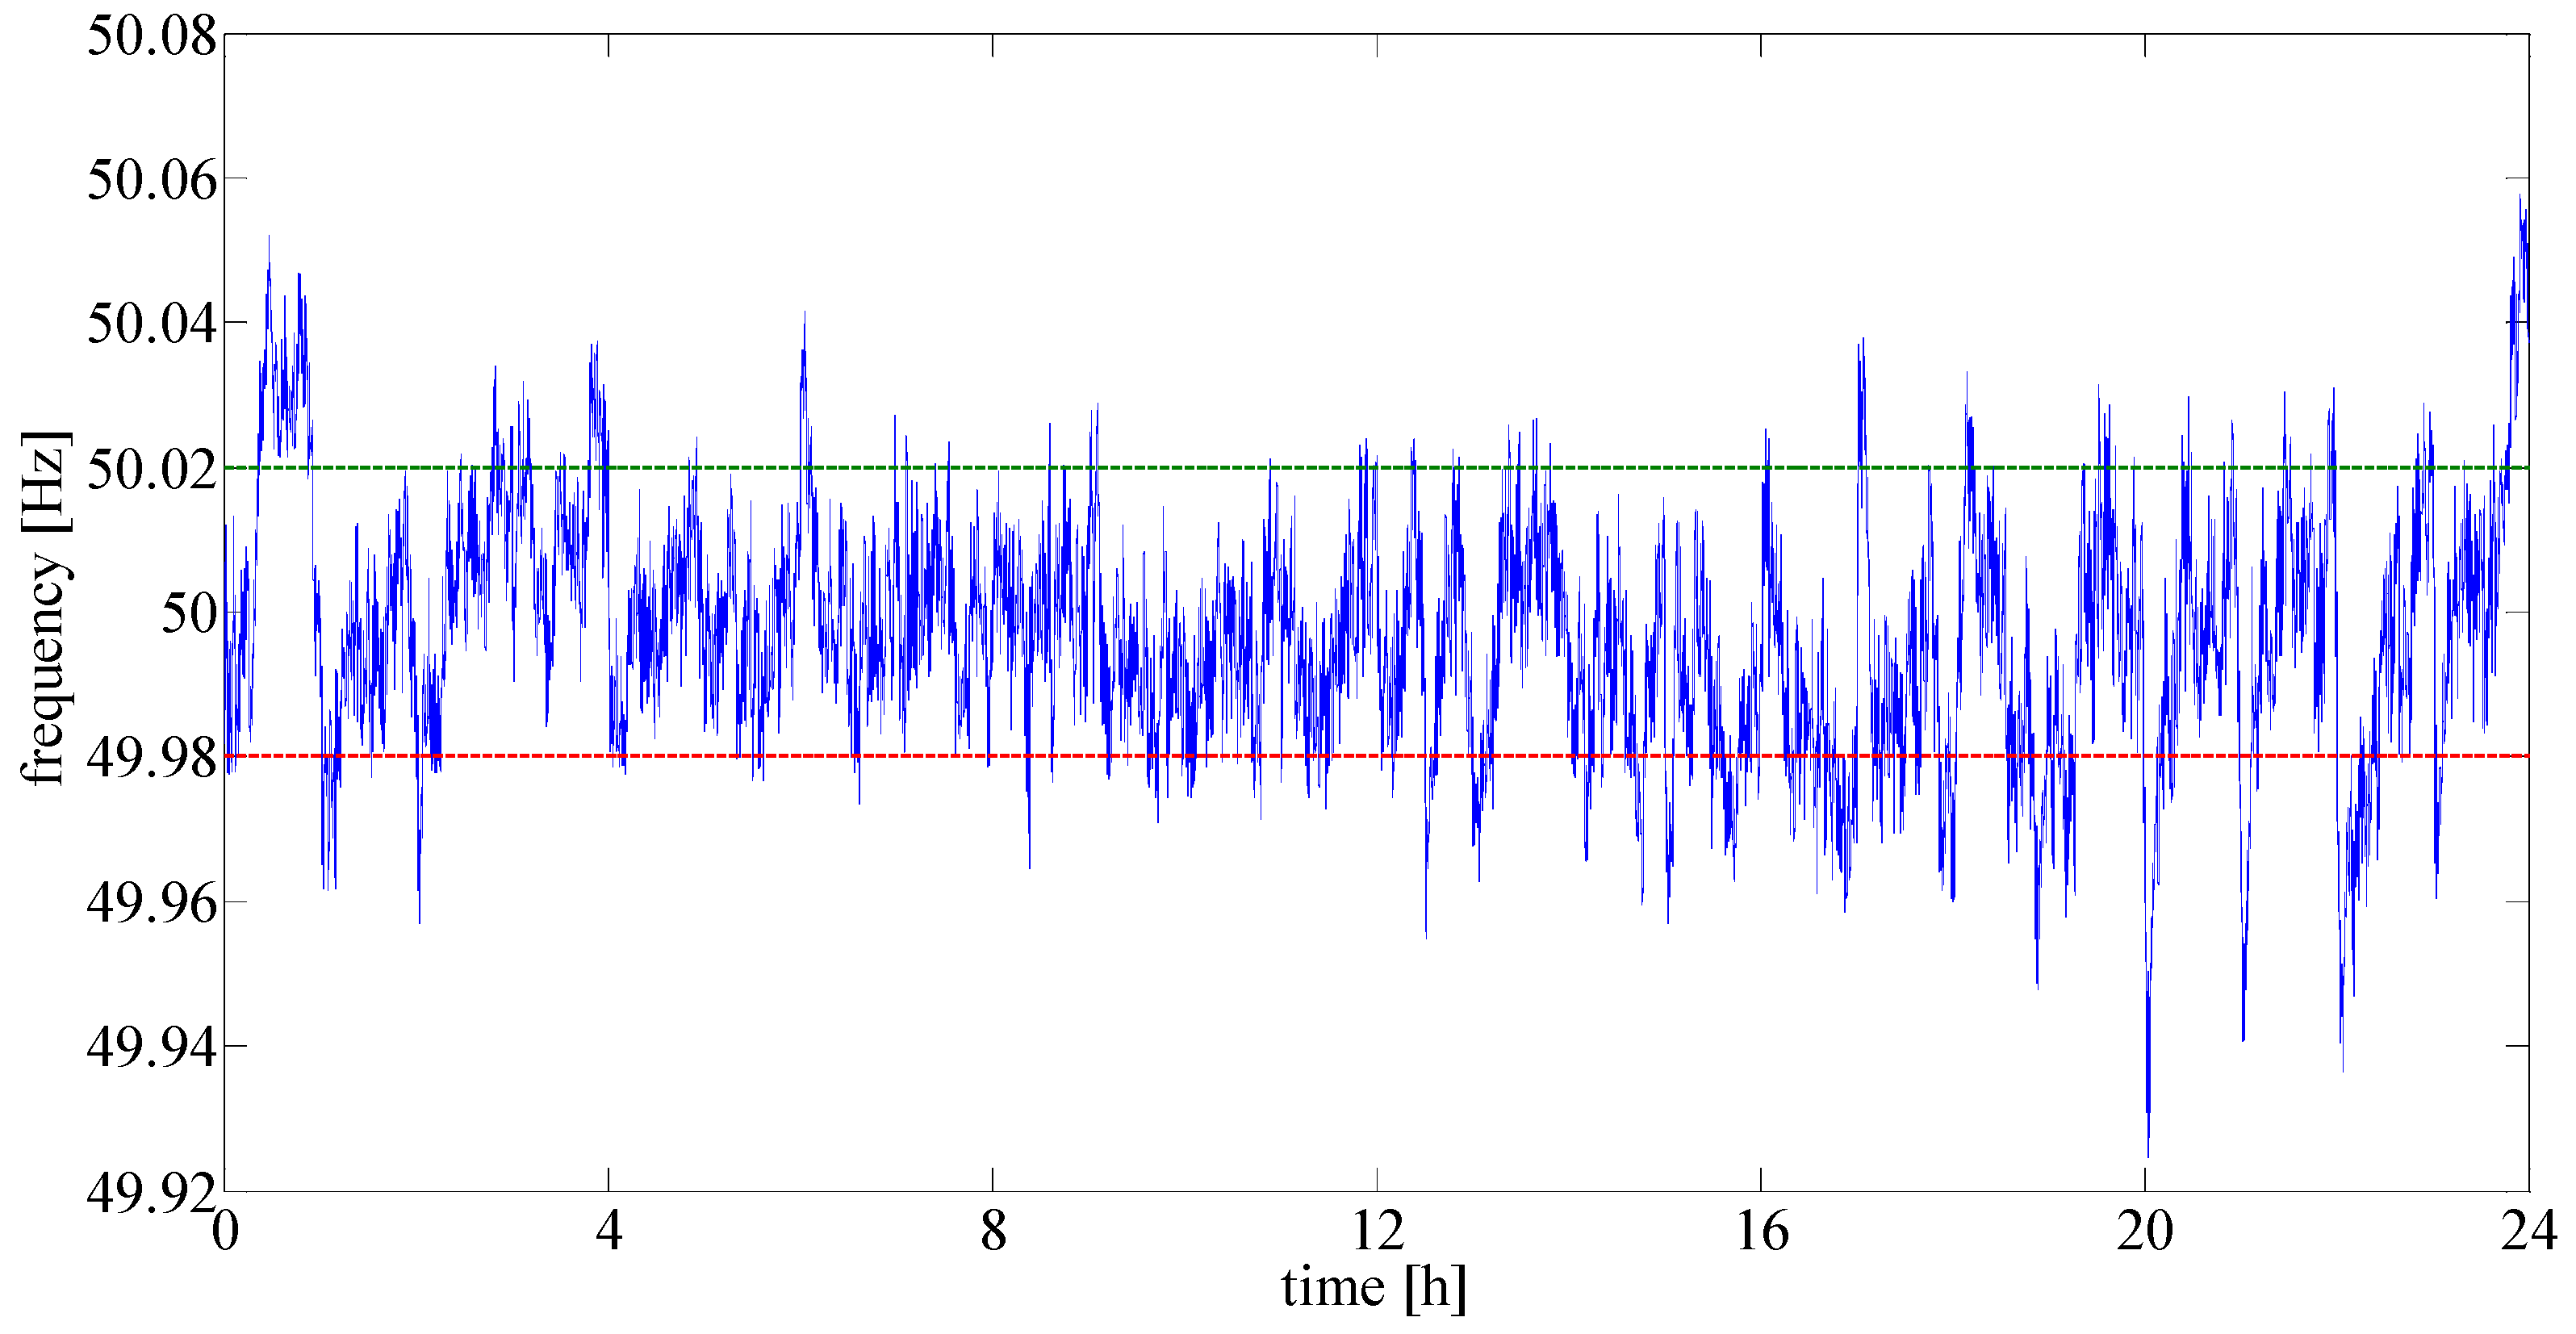
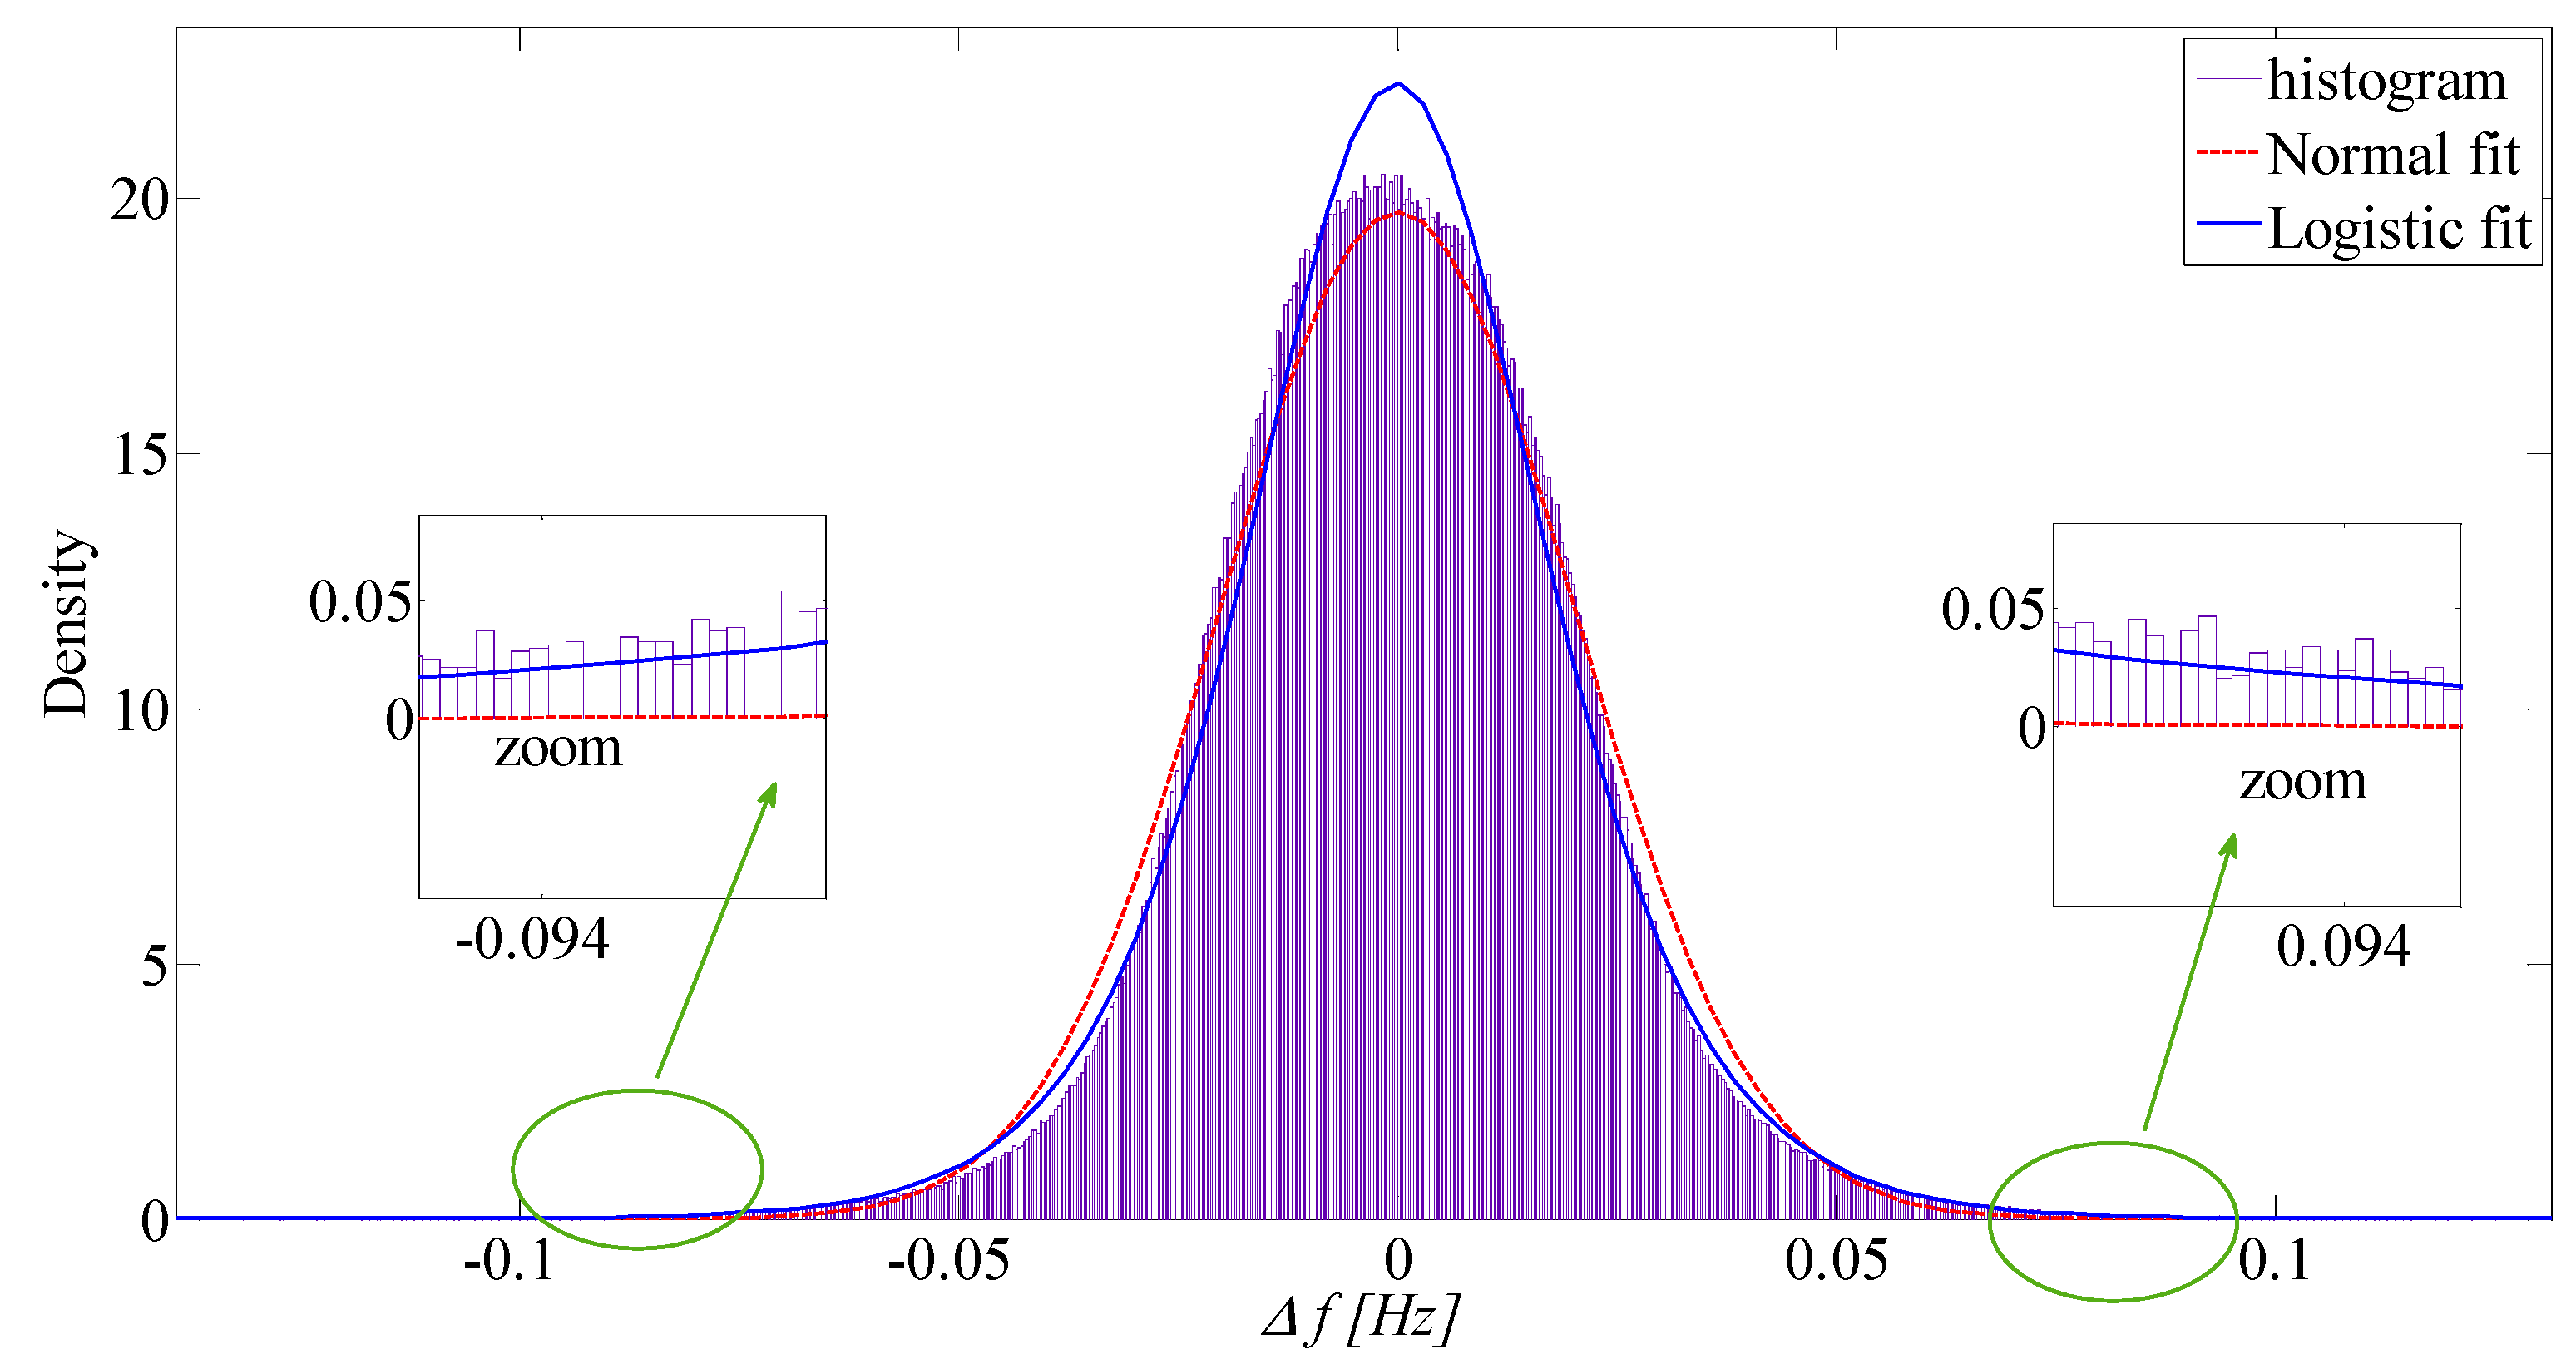
6.2. Data analysis to Represent Frequency Patterns through an Autoregressive Model

In this section, the frequency data actually measured in a European continental synchronous network are analyzed [56]. They refer to the year 2016, with a sampling period of 10 s. As an example, in Figure 7, the frequency pattern is reported with reference to one day.
Figure 8 reports the histogram of the measured frequency deviations from the nominal value (50 Hz) for the whole year. The data reported in the figure are the same as Figure 5, but they are reported in a more detailed representation to show some statistical features more accurately. Moreover, in the figure, the results of two fitting distributions, i.e., Normal and Logistic distributions, are also depicted. In order to better compare the two fitting distributions, Table 1 reports the mean, variance, and Log likelihood of the Normal and Logistic distribution in the first and second row, respectively.
By observing Figure 8 and the data in Table 1, intuitively, one can infer that both Logistic and Normal distributions are accurate. Both distributions, in fact, have a mean value very close to zero, a small variance, and the Log Likelihood values are very similar and satisfying in both cases. The figure also shows that both distributions provide a good graphical representation of the density function of the real data. However, by analyzing the right and left tails of the fitting distributions, some discrepancies between the Normal distribution and the measured data clearly appear. Indeed, both tails of the Normally distributed data approach zero faster than the measured data. As clearly highlighted in the zooms of Figure 8, Normal distribution implies zero values before |∆f| reaches 100 MHz, while actual events of frequency deviations still occur. A more accurate representation of the actual distributions’ tails is obtained through the Logistic distribution, as clearly depicted in the zooms of Figure 8. It is worth to note that the tails of the distributions have a crucial role in our application since their occurrences imply the most severe frequency deviations and, consequently, the most relevant battery wear.
In order to obtain a large set of pseudo sample for statistical purposes, the autoregressive model (Equation (12)) based on the underlying Logistic distribution can be then justified. The parameters of the model can be deduced through Equation (17), starting from the measured frequency data available in [56]. In order to show the accuracy of this method, a one-year frequency pattern has been produced. As discussed in [55], for the purposes of the frequency regulation, a good measure for comparing the frequency patterns is the evaluation of the mean crossing time, which represents the mean time between consecutive events in which frequency deviation exceeds a specified barrier (i.e., frequency deviation). In Figure 9, with reference to the barrier | Δ f | = 100   MHz , the histograms of the mean crossing time for the measured (Figure 9a) and inferred (Figure 9b) frequency data are reported. As clearly shown in the figures, the frequency of the occurrences are very similar in the two cases. Moreover, for both of them, the exponential distribution seems a good fitting of the related probability density functions. It is worth to note that time series with typical autoregressive methods based on an underlying Normal distribution have also been adopted. The corresponding results show that the event of crossing barriers is characterized by a negligible number of occurrences. This is consistent with the considerations made for Figure 8 on the validity of the underlying Normal distribution. The results of Figure 9, clearly show the goodness of the proposed auto-regressive model for the frequency profile based on the underlying Logistic distribution when used to study frequency regulation. The estimated data, in fact, show an excellent agreement to the real measured data based on the consideration that, due to the large number of data, the statistical features and graphical shapes of the related distributions can be used for a proper comparison.

6.3. Statistical Analysis of the Battery Lifetime Duration and Impact of the Control Law

According to the well-known Monte Carlo method, the simulation related to the frequency regulation provided by the BESS was iteratively performed for each of the 10,000 samples of one year-long frequency patterns. The frequency patterns were created with the autoregressive model (Equation (12)) with parameters given by the solution of Equation (17). For each simulation, the expected lifetime was recorded thus obtaining 10,000 samples for the lifetime, which statistically characterize the BESS lifetime. In these simulations, it is assumed that the battery’s end of life occurs when the actual capacity reaches 20% of the nominal capacity.
Figure 10 shows the histogram of the occurrences of the lifetime duration, which has been evaluated at each iteration of the Monte Carlo, still referring to the case k 1 = 0.4 .
The histogram in Figure 10 clearly shows a typical heavy tail distribution, showing a large number of occurrences on the right side of the figure. The mean value of the lifetime duration is 8.20 years and the standard deviation is 1.20 years. This value is aligned with the results reported in the literature such as, for example, in [29], where experimental tests on batteries of the same technology used for primary frequency regulation showed a lifetime of eight years.
The shape of the histogram in Figure 10 can be explained by considering that large frequency deviations (right and left tails in Figure 8), either positive or negative, increase battery wear and, consequently, shorter lifetime duration. The number of times the BESS participates in the frequency regulation depends on the value of k 1 . Indeed, when k 1 decreases, a larger deviation between the available and reference S O C are allowed, thus implying a larger time availability and a larger energy range of the frequency regulation service. In this case, the BESS is able to participate in the regulation service for a greater number of occurrences of larger frequency deviations, which implies a reduction of the lifetime. As a consequence of that, the shape of the histogram radically changes with the value of k 1 . As an example, a histogram corresponding to a lower value of k 1 ( k 1 = 0.05 ) is shown in Figure 11. In this case, as expected, a larger number of occurrences of large frequency deviations are caught by the BESS, and lifetime duration reduces. Additionally, a more regular shape of the distribution is obtained, with a mean value of 3.92 years and a standard deviation of 0.37 years.
In order to better exploit the effect on the lifetime duration, the Monte Carlo analysis was iteratively repeated for a larger range of values of the restoration parameter k 1 , to emphasize the impact of the control performance requested to the BESS on the battery lifetime. Particularly interesting are the results obtained in the range k 1 [0.01, 0.5], which are reported in Figure 12 in terms of the mean value of the lifetime durations.
The importance of analyzing the effect of the control law on the battery lifetime duration clearly emerges in Figure 12. As expected, in fact, the figure shows that the expected battery lifetime duration increases as the parameter k 1 increases, in the considered interval, going from less than four years for the lowest value of k 1 to almost nine years for k 1 = 0.5. As a counteraction to this remarkable advantage, there is a disadvantage in terms of the frequency regulation service availability of the BESS.

7. Conclusions

The paper aims to describe the dependence of the lifetime distribution characteristics on the parameters of the state of charge control law. A proper framework was tailored to take into account the stochastic nature of the power system frequency. Twofold original contributions can be observed: the first one refers to the ability to treat power system frequency historical data in terms of the autoregressive model. This modeling allows building stochastic patterns for the subsequent evaluation of the probabilistic features of the battery lifetime. The second original contribution lies in the rationale procedure that highlights the effects of the control law on the battery lifetime. Indeed, the battery lifetime is correctly estimated with a realistic dynamic modeling that includes a state of charge control strategy besides an active-power and frequency control. In particular, the effect of the control parameter on the restoration of the state of charge of the battery has been analyzed. From the reported results, the significant impact of this parameter on both economic and technical aspects clearly emerges. In fact, it has been found that a higher value of this parameter implies an increase in the expected battery lifetime duration—thus obtaining a beneficial effect from the economic point of view—while the availability of the frequency regulation service decreases, thus implying a technical degradation of the frequency quality. Conversely, lower value of the restoration parameter implies a shorter expected lifetime—thus implying a detrimental effect on the economic aspect—and an increased availability of the regulation service, thus improving the resulting frequency quality. In the Monte Carlo procedure, the various steps of the proposed approach are clearly explained, therefore it can be used as a tool for choosing the most convenient parameter values of the state of charge control law, for a given frequency profile and the specific battery technology, in order to optimize both the frequency response and the battery lifetime. Future works will be devoted to deduce analytical results which can be useful for the sensitivity and robustness analysis. The idea is based on the possibility of predicting the cycle number directly from the knowledge of the power system frequency spectral analysis, avoiding the huge complexity of the battery cycles’ counting. This could allow time-consuming procedures, such as the Monte Carlo method, to be able to infer the relationship between battery fatigue and the spectral features of the power system frequency in a closed form.

Author Contributions

N.A., E.C., D.L. and F.M. conceived of the present idea. N.A., E.C., D.L. and F.M. developed the methodology and performed the computations. N.A., E.C., D.L. and F.M. wrote the manuscript. N.A., E.C., D.L. and F.M. discussed the results and contributed to the final manuscript.

Funding

This research received no external funding.

Conflicts of Interest

The authors declare no conflict of interest.

Nomenclature

ACalternating current
BESSbattery energy storage system
C f a d e capacity fade in per cent value representing the end of the life
DCdirect current
E b a t t BESS energy capacity
E P permanent regulating energy
H inertia constant
K number of different depths of discharge
L ( ϕ , μ , σ ) likelihood function
L C battery life consumption
N f j number of cycles to the battery failure at the jth depth of discharge
P b a t t ( ξ ) BESS power at time ξ
P b e s s rated power of the BESS
P j 0 power delivered by the jth group at the time of the perturbation
P n j nominal active power of the jth group
R rotating reserve
RESrenewable energy source
S O C state of charge
S O C 0 initial SOC value
T a starting time of the generation unit
a ^ t estimated parameter at t distributed according to a specific distribution
d j depth of discharge characterizing the jth cycle
f frequency
f r e f reference value of the frequency
k 1 BESS restoration factor
n number of groups in service after the perturbation
n j number of cycles performed at the jth depth of discharge
n s number of samples
t time
y t time series value at t
Δ P L step load perturbation
Δ P r regulating power
Δ f r e f Δ f r e f = f f r e f
ϕ parameter of the autoregressive model’s polynomial approximation
ϕ ^ parameter estimated value of autoregressive model’s polynomial approximation
μ mean value of the frequency deviation
μ ^ mean value estimation of the frequency deviation
σ standard deviation of the frequency deviation
σ ^ Estimation of the standard deviation of the frequency deviation
μ s o c j average value of the SOC level of jth cycle
σ b a t t BESS setting droop
σ c permanent load droop
σ P permanent droop

Appendix A. The Summary of the Literary Contributions

Table A1. The summary of the literary contributions.
Ref.Main Investigated Items and ParametersObject/Contribution
[14]
-
historic frequency data;
-
network code for regulation service;
-
dynamically adjustable SOC limits.
-
control algorithm with adjustable limits of SOC;
-
sizing of battery;
-
profitability of the battery energy storage system;
[15]
-
rate of change of frequency;
-
number of synchronous generators;
-
number of renewable generators;
-
battery sizing;
-
modeling and control of the energy storage system;
-
real-time simulations;
[22]
-
SOC constraints;
-
battery time constant;
-
impact of the battery storage system model on the frequency regulation;
[23]
-
battery charging/discharging;
-
step load variation;
-
generation rate constraint;
-
battery energy storage system model in isolated networks;
[24]
-
generation rate constraint;
-
area control error;
-
peak deviations of frequency;
-
model of battery energy storage system;
-
impact of the battery service on the system dynamic performance;
[25]
-
deployment time of the service;
-
duration of delivery of the service;
-
end of delivery of the service;
-
SOC constraints;
-
frequency control from ultracapacitors-based distributed energy storage systems in isolated grids;
-
operating modes of the storage;
-
realtime simulations;
[26]
-
SOC constraints
-
dead-band of the regulation;
-
gradient of the regulation;
-
delay of the regulation;
-
over-fulfillment of the regulation;
-
minimize cycles operation mode;
-
maximize charging and maximize discharging operation mode;
-
simulation of the primary control reserve provision under degrees of freedom of the regulation (dead-band, delay, etc.);
[27]
-
SOC constraints;
-
C-rate;
-
charged/discharge energy;
-
simulation model for battery energy systems;
-
impact on the battery of the operation strategies;
-
SOC level management;
[28]
-
historical frequency data;
-
battery capacity
-
aggregated fleet of batteries
-
SOC control able to optimize efficiency and degradation;
-
integration of the batteries and conventional service’s providers;
-
statistical analysis.
[29]
-
battery lifetime;
-
battery round trip efficiency;
-
battery C-rate.
-
electrical-thermal model of a Lithium-ion battery;
-
experimental test verification;
-
performances of the Lithium-ion battery.
[30]
-
battery recharge strategies;
-
SOC constraints.
-
effect of the set-point adjustment strategies on system stability;
-
sensitivity of battery on design parameters;
[31]
-
battery charging/discharging process;
-
SOC constraints;
-
primary frequency reserve availability;
-
regulation curve droop-control.
-
model which accounts for both technical provision of regulation service and economic revenues;
-
effective methods to increase the potential of batteries in regulation services.
[32]
-
battery aging model;
-
battery lifetime;
-
system price, electricity and primary reserve market data;
-
simulation model including: frequency control module, battery module and the statistical evaluation module;
-
costs and revenues analysis;
-
statistical analysis.
[33]
-
SOC control in post-contingency event;
-
battery lifetime;
-
system’s resilience;
-
optimal operation of batteries for frequency support under uncertain wind turbines power productions;
-
integration with synchronous units;
[34]
-
real frequency data;
-
strategies for the SOC restoration;
-
battery lifetime;
-
battery aging;
-
semi-empirical model of battery lifetime estimation;
-
provision of services in case of deterministic and stochastic power profiles;
-
comparison of different restoration strategies;
[35]
-
battery lifetime;
-
battery degradation behavior;
-
SOC reestablishing strategies;
-
temperature and depth of discharge;
-
the suitability of battery’s control strategies used to provide primary frequency regulation;
-
impact of different parameters on the battery aging;
-
comparison of different strategies.
[36]
-
peak shaving;
-
battery degradation;
-
uncertainties in load and signals;
-
services’ revenue;
-
real data of commercial users.
-
real-time battery control for providing peak shaving and frequency regulation;
-
study of the revenue obtained by the joint optimization of the peak shaving and frequency regulations services.
[37]
-
SOC constraints;
-
load/generation balance;
-
real data of wind, irradiance and loads;
-
model to size battery-supercapacitor hybrid storage system;
-
statistical simulation;
-
control strategies of battery/supercapacitor hybrid system;
[38]
-
load frequency control reserve;
-
load frequency control ramp rate;
-
SOC constraints;
-
power and energy capacity of battery assisted load frequency control unit;
-
simulation model;
[39]
-
battery response performances;
-
generator and battery cost;
-
real load data;
-
sizing of energy and power capacity of battery system;
-
sizing of regulation capacity of generators;
-
total cost minimization;
[40]
-
battery capital and maintenance cost;
-
real data of wind power and load;
-
curtailed wind energy;
-
reserve capacity;
-
capacity configuration of the battery storage system combined with a wind turbine generator;
-
control strategies of the battery storage system assisted wind turbine generator for frequency regulation reserve;
[41]
-
SOC constraints;
-
battery module and temperature;
-
battery C-rate;
-
ageing of batteries due to the network frequency regulation services;
[42]
-
historic data of frequency;
-
demand/ generation forecasting errors;
-
battery degradation;
-
SOC set-point;
-
optimal battery power/energy rated value;
-
battery control parameters;
-
real-time strategy to continuously maintain the SOC value within operative ranges;
[43]
-
load leveling and reserve support;
-
battery capacity degradation;
-
charging/discharging battery operation;
-
optimal sizing of a BESS in isolated microgrids;
-
management of uncertain power of solar, wind and load;
-
optimal selection of the battery technology;
-
statistical analysis;
[44]
-
energy/freq. response market real data;
-
regulatory framework;
-
battery degradation costs;
-
sizing of storage system integrated with wind power integration;
-
viability of the system in specific real scenarios;
-
wind turbines/battery control for frequency support;
[45]
-
frequency/voltage control;
-
battery overloading duration;
-
required overloading for the battery;
-
sizing of batteries in isolated microgrids;
-
control scheme based on the use of the overloading capacity of the battery;
[46]
-
steady state frequency deviation
-
contingency due to generation outage;
-
renewable energy effect on frequency;
-
renewable energy penetration levels;
-
battery sizing in isolated networks;
-
counteract the impact of renewable energy on frequency nadir;
-
battery power/energy and droop control gain;
[47]
-
SOC constraints;
-
battery lifetime;
-
battery charging/discharging strategies;
-
battery lifetime;
-
battery degradation;
-
planning and control strategy of battery based on stochastic dynamic program;
-
control strategy for minimizing operating and degradation cost;
-
optimal SOC control;

References

  1. Bevrani, H.; Ghosh, A.; Ledwich, G. Renewable energy sources and frequency regulation: Survey and new perspectives. IET Renew. Power Gener. 2010, 4, 438–457. [Google Scholar] [CrossRef]
  2. Weissbach, T.; Welfonder, E. High frequency deviations within the European Power System: Origins and proposals for improvement. In Proceedings of the IEEE/PES Power Systems Conference and Exposition, Seattle, WA, USA, 15–18 March 2009; pp. 1–6. [Google Scholar]
  3. Saarinen, L.; Norrlund, P.; Yang, W.; Lundin, U. Linear synthetic inertia for improved frequency quality and reduced hydropower wear and tear. Int. J. Electr. Power Energy Syst. 2018, 98, 488–495. [Google Scholar] [CrossRef]
  4. Adrees, A.; Papadopoulos, P.N.; Milanovic, J.V. A framework to assess the effect of reduction in inertia on system frequency response. In Proceedings of the IEEE Power and Energy Society General Meeting (PESGM), Boston, MA, USA, 17–21 July 2016; pp. 1–5. [Google Scholar]
  5. Ulbig, A.; Borsche, T.S.; Andersson, G. Impact of low rotational inertia on power system stability and operation. IFAC Proc. Vol. 2014, 47, 7290–7297. [Google Scholar] [CrossRef]
  6. Chiodo, E.; Lauria, D.; Mottola, F. On-line bayes estimation of rotational inertia for power systems with high penetration of renewables. Part I: Theoretical methodology. In Proceedings of the 24th International Symposium on Power Electronics, Electrical Drives, Automation and Motion, Amalfi Coast, Italy, 20–22 June 2018. [Google Scholar]
  7. Chiodo, E.; Lauria, D.; Mottola, F. On-line bayes estimation of rotational inertia for power systems with high penetration of renewables. Part II: Numerical experiments. In Proceedings of the 24th International Symposium on Power Electronics, Electrical Drives, Automation and Motion, Amalfi Coast, Italy, 20–22 June 2018. [Google Scholar]
  8. Canevese, S.; Ciapessoni, E.; Gatti, A.; Rossi, M. Monitoring of frequency disturbances in the European continental power system. In Proceedings of the AEIT International Annual Conference (AEIT), Capri, Italy, 5–7 October 2016; pp. 1–6. [Google Scholar]
  9. Frizera Encarnação, L.; Carletti, D.; de Angeli Souza, S.; de Barros, O., Jr.; CorneauBroedel, D.; Trivilin Rodrigues, P. Virtual inertia for power converter control. Adv. Renew. Energies Power Technol. 2018, 2, 377–411. [Google Scholar] [CrossRef]
  10. Hirase, Y.; Abe, K.; Sugimoto, K.; Sakimoto, K.; Bevrani, H.; Ise, T. A novel control approach for virtual synchronous generators to suppress frequency and voltage fluctuations in microgrids. Appl. Energy 2018, 210, 699–710. [Google Scholar] [CrossRef]
  11. Kerdphol, T.; Rahman, F.S.; Mitani, Y.; Watanabe, M.; Küfeoğlu, S. Robust virtual inertia control of an islanded microgrid considering high penetration of renewable energy. IEEE Access 2018, 6, 625–636. [Google Scholar] [CrossRef]
  12. Kerdphol, T.; Rahman, F.S.; Mitani, Y. Virtual inertia control application to enhance frequency stability of interconnected power systems with high renewable energy penetration. Energies 2018, 11, 981. [Google Scholar] [CrossRef]
  13. Carpinelli, G.; Caramia, P.; Mottola, F.; Proto, D. Exponential weighted method and a compromise programming method for multi-objective operation of plug-in vehicle aggregators in microgrids. Int. J. Electr. Power Energy Syst. 2014, 56, 374–384. [Google Scholar] [CrossRef]
  14. Oudalov, A.; Chartouni, D.; Ohler, C. Optimizing a battery energy storage system for primary frequency control. IEEE Trans. Power Syst. 2007, 22, 1259–1266. [Google Scholar] [CrossRef]
  15. Knap, V.; Chaudhary, S.K.; Stroe, D.I.; Swierczynski, M.; Craciun, B.I.; Teodorescu, R. Sizing of an energy storage system for grid inertial response and primary frequency reserve. IEEE Trans. Power Syst. 2016, 31, 3447–3456. [Google Scholar] [CrossRef]
  16. Akram, U.; Khalid, M. A Coordinated frequency regulation framework based on hybrid battery-ultracapacitor energy storage technologies. IEEE Access 2018, 6, 7310–7320. [Google Scholar] [CrossRef]
  17. Continental Europe Operation Handbook. Available online: https://docstore.entsoe.eu/publications/system-operations-reports/operation-handbook/Pages/default.aspx (accessed on 13 September 2018).
  18. Xu, B.; Oudalov, A.; Ulbig, A.; Andersson, G.; Kirschen, D.S. Modeling of lithium-ion battery degradation for cell life assessment. IEEE Trans. Smart Grid 2018, 9, 1131–1140. [Google Scholar] [CrossRef]
  19. Laresgoiti, I.; Käbitz, S.; Ecker, M.; Sauer, D.U. Modeling mechanical degradation in lithium ion batteries during cycling: Solid electrolyte interphase fracture. J. Power Sources 2015, 300, 112–122. [Google Scholar] [CrossRef]
  20. Shi, Y.; Xu, B.; Tan, Y.; Kirschen, D.; Zhang, B. Optimal battery control under cycle aging mechanisms in pay for performance settings. IEEE Trans. Autom. Control. 2018, in press. [Google Scholar] [CrossRef]
  21. Xu, B.; Zhao, J.; Zheng, T.; Litvinov, E.; Kirschen, D.S. Factoring the cycle aging cost of batteries participating in electricity markets. IEEE Trans. Power Syst. 2018, 33, 2248–2259. [Google Scholar] [CrossRef]
  22. Kottick, D.; Blau, M.; Edelstein, D. Battery energy storage for frequency regulation in an island power system. IEEE Trans. Energy Convers. 1993, 8, 455–459. [Google Scholar] [CrossRef]
  23. Aditya, S.K.; Das, D. Application of battery energy storage system to load frequency control of an isolated power system. Int. J. Energy Res. 1999, 23, 247–258. [Google Scholar] [CrossRef]
  24. Aditya, S.K.; Das, D. Battery energy storage for load frequency control of an interconnected power system. Electr. Power Syst. Res. 2001, 58, 179–185. [Google Scholar] [CrossRef]
  25. Delille, G.; François, B.; Malarange, G. Dynamic frequency control support: A virtual inertia provided by distributed energy storage to isolated power systems. In Proceedings of the IEEE PES Innovative Smart Grid Technologies Conference Europe (ISGT Europe), Gothenberg, Sweden, 11–13 October 2010. [Google Scholar]
  26. Hollinger, R.; Diazgranados, L.M.; Wittwer, C.; Engel, B. Optimal provision of primary frequency control with battery systems by exploiting all degrees of freedom within regulation. Energy Procedia 2016, 99, 204–214. [Google Scholar] [CrossRef]
  27. Fleer, J.; Stenzel, P. Impact analysis of different operation strategies for battery energy storage systems providing primary control reserve. J. Energy Storage 2016, 8, 320–338. [Google Scholar] [CrossRef]
  28. Greenwood, D.M.; Lim, K.Y.; Patsios, C.; Lyons, P.F.; Lim, Y.S.; Taylor, P.C. Frequency response services designed for energy storage. Appl. Energy 2017, 203, 115–127. [Google Scholar] [CrossRef]
  29. Gatta, F.M.; Geri, A.; Lamedica, R.; Lauria, S.; Maccioni, M.; Palone, F.; Rebolini, M.; Ruvio, A. Application of a lifepo4 battery energy storage system to primary frequency control: simulations and experimental results. Energies 2016, 9, 887. [Google Scholar] [CrossRef]
  30. Borsche, T.S.; Ulbig, A.; Andersson, G. Impact of frequency control reserve provision by storage systems on power system operation. IFAC Proc. Vol. 2014, 47, 4038–4043. [Google Scholar] [CrossRef]
  31. Brivio, C.; Mandelli, S.; Merlo, M. Battery energy storage system for primary control reserve and energy arbitrage. Sustain. Energy Grids Netw. 2016, 6, 152–165. [Google Scholar] [CrossRef] [Green Version]
  32. Fleer, J.; Zurmühlen, S.; Badeda, J.; Stenzel, P.; Hake, J.-F.; Uwe Sauer, D. Model-based economic assessment of stationary battery systems providing primary control reserve. Energy Procedia 2016, 99, 11–24. [Google Scholar] [CrossRef]
  33. Wen, Y.; Li, W.; Huang, G.; Liu, X. Frequency dynamics constrained unit commitment with battery energy storage. IEEE Trans. Power Syst. 2016, 31, 5115–5125. [Google Scholar] [CrossRef]
  34. Karagiannopoulos, S.; Rigas, A.; Hatziargyriou, N.; Hug, G.; Oudalov, A. Battery energy storage capacity fading and control strategies for deterministic and stochastic power profiles. In Proceedings of the Power Systems Computation Conference (PSCC), Genoa, Italy, 20–24 June 2016. [Google Scholar]
  35. Stroe, D.I.; Knap, V.; Swierczynski, M.; Stroe, A.I.; Teodorescu, R. Operation of a grid-connected lithium-ion battery energy storage system for primary frequency regulation: A battery lifetime perspective. IEEE Trans. Ind. Appl. 2017, 53, 430–438. [Google Scholar] [CrossRef]
  36. Shi, Y.; Xu, B.; Wang, D.; Zhang, B. Using battery storage for peak shaving and frequency regulation: Joint optimization for superlinear gains. IEEE Trans. Power Syst. 2018, 33, 2882–2894. [Google Scholar] [CrossRef]
  37. Jia, H.; Mu, Y.; Qi, Y. A statistical model to determine the capacity of battery-supercapacitor hybrid energy storage system in autonomous microgrid. Int. J. Electr. Power Energy Syst. 2014, 54, 516–524. [Google Scholar] [CrossRef]
  38. Orihara, D.; Saitoh, H. Evaluation of battery capacity required for assist of balancing control. J. Int. Counc. Electr. Eng. 2017, 7, 119–124. [Google Scholar] [CrossRef]
  39. Pan, X.; Xu, H.; Song, J.; Lu, C. Capacity optimization of battery energy storage systems for frequency regulation. In Proceedings of the IEEE International Conference on Automation Science and Engineering (CASE), Gothenburg, Sweden, 24–28 August 2015; pp. 1139–1144. [Google Scholar]
  40. Li, J.; Ma, Y.; Mu, G.; Feng, X.; Yan, G.; Guo, G.; Zhang, T. Optimal configuration of energy storage system coordinating wind turbine to participate power system primary frequency regulation. Energies 2018, 11, 1396. [Google Scholar] [CrossRef]
  41. Benato, R.; Dambone Sessa, S.; Musio, M.; Palone, F.; Polito, R.M. Italian experience on electrical storage ageing for primary frequency regulation. Energies 2018, 11, 2087. [Google Scholar] [CrossRef]
  42. Lian, B.; Sims, A.; Yu, D.; Wang, C.; Dunn, R.W. Optimizing LiFePO4 battery energy storage systems for frequency response in the UK system. IEEE Trans. Sustain. Energy 2017, 8, 385–394. [Google Scholar] [CrossRef]
  43. Alharbi, H.; Bhattacharya, K. Stochastic optimal planning of battery energy storage systems for isolated microgrids. IEEE Trans. Sustain. Energy 2018, 9, 211–227. [Google Scholar] [CrossRef]
  44. Johnston, L.; Díaz-González, F.; Gomis-Bellmunt, O.; Corchero-García, C.; Cruz-Zambrano, M. Methodology for the economic optimisation of energy storage systems for frequency support in wind power plants. Appl. Energy 2015, 137, 660–669. [Google Scholar] [CrossRef] [Green Version]
  45. Aghamohammadi, M.R.; Abdolahinia, H. A new approach for optimal sizing of battery energy storage system for primary frequency control of islanded Microgrid. Int. J. Electr. Power Energy Syst. 2014, 54, 325–333. [Google Scholar] [CrossRef]
  46. Ramírez, M.; Castellanos, R.; Calderón, G.; Malik, O. Placement and sizing of battery energy storage for primary frequency control in an isolated section of the Mexican power system. Electr. Power Syst. Res. 2018, 160, 142–150. [Google Scholar] [CrossRef]
  47. Zhang, Y.J.A.; Zhao, C.; Tang, W.; Low, S.H. Profit-maximizing planning and control of battery energy storage systems for primary frequency control. IEEE Trans. Smart Grid 2018, 9, 712–723. [Google Scholar] [CrossRef]
  48. Marconato, R. Electric Power Systems Vol. 3. Dynamic Behaviour, Stability and Emergency Controls; Hoepli: Milan, Italy, 2004. [Google Scholar]
  49. Matsuishi, M.; Endo, T. Fatigue of metals subjected to varying stress. Jpn. Soc. Mech. Eng. 1968, 68, 37–40. [Google Scholar]
  50. Miner, M.A. Cumulative damage in fatigue. J. Appl. Mech. 1945, 12, A159–A164. [Google Scholar]
  51. Han, H.; Li, Q.; Lu, Z.; Yang, X. Energy storage frequency response control considering battery aging of electric vehicle. In Proceedings of the IEEE International Conference on Energy Internet, Beijing, China, 17–21 April 2017; pp. 72–76. [Google Scholar]
  52. Brockwell, P.J.; Davis, R.A. Introduction to Time Series and Forecasting, 2nd ed.; Springer: New York, NY, USA, 2002. [Google Scholar]
  53. Kallas, M.; Honeine, P.; Richard, C.; Francis, C.; Amoud, H. Prediction of time series using Yule-Walker equations with kernels. In Proceedings of the IEEE International Conference on Acoustics, Speech and Signal Processing (ICASSP), Kyoto, Japan, 25–30 March 2012; pp. 2185–2188. [Google Scholar]
  54. Hassanzadeh, M.; Evrenosoğlu, C.Y.; Mili, L. A Short-term nodal voltage phasor forecasting method using temporal and spatial correlation. IEEE Trans. Power Syst. 2016, 31, 3881–3890. [Google Scholar] [CrossRef]
  55. Andrenacci, N.; Pede, G.; Chiodo, E.; Lauria, D.; Mottola, F. Tools for life cycle estimation of energy storage system for primary frequency reserve. In Proceedings of the International Symposium on Power Electronics, Electrical Drives, Automation and Motion (SPEEDAM), Amalfi, Italy, 20–22 June 2018; pp. 1008–1013. [Google Scholar]
  56. RTE, Network Frequency. Available online: http://clients.rte-france.com/lang/an/visiteurs/vie/vie_frequence.jsp (accessed on 13 September 2018).
  57. Tiku, M.L.; Wong, W.K.; Bian, G. Estimating parameters in autoregressive models in non-normal situations: Symmetric innovations. Commun. Stat. Theory Methods 1999, 28, 315–341. [Google Scholar] [CrossRef]
  58. Wong, W.K.; Bian, G. Estimating parameters in autoregressive models with asymmetric innovations. Stat. Probab. Lett. 2005, 71, 61–70. [Google Scholar] [CrossRef]
Figure 1. A flowchart of the proposed approach.
Energies 11 03320 g001
Figure 2. The block diagram for analyzing the frequency transients.
Energies 11 03320 g002
Figure 3. The action of the BESS for the primary frequency regulation service in the European case [17].
Energies 11 03320 g003
Figure 4. The block diagram of the BESS control strategy for primary frequency regulation.
Energies 11 03320 g004
Figure 5. The histogram of typical frequency deviation.
Energies 11 03320 g005
Figure 6. The output of the simulation over seven days ( k 1 = 0.4 : (a) S O C of the BESS; (b) BESS power profile.
Energies 11 03320 g006
Figure 7. The sampled frequency patterns actually measured related to one day.
Energies 11 03320 g007
Figure 8. The histogram and fitting distributions of actual frequency deviation data of the data European continental synchronous network.
Energies 11 03320 g008
Figure 9. The comparison of the real frequency samples (a) and estimated samples (b) through the pdf of the crossing time values.
Energies 11 03320 g009
Figure 10. The mean values of battery lifetime duration for different control performance requested to the BESS ( k 1 = 0.4 ).
Energies 11 03320 g010
Figure 11. The mean values of battery lifetime duration for different control performance requested to the BESS ( k 1 = 0.05 ).
Energies 11 03320 g011
Figure 12. The mean values of battery lifetime duration for different control performance requested to the BESS.
Energies 11 03320 g012
Table 1. The comparison of the fitting distributions.
Fitting DistributionMeanVarianceLog Likelihood
Normal≅00.000409366.92523 × 106
Logistic≅00.000415426.9568 × 106

