A Multi-Agent-Based Optimization Model for Microgrid Operation Using Dynamic Guiding Chaotic Search Particle Swarm Optimization


Abstract
1. Introduction
- (1)
- In this paper, DG, energy storage system and power load are regarded as independent agents, whose control are determined by their own control mechanism and operation objectives. In order to efficiently and stably operate the entire MG, a hybrid three-layer MAS, including DMS agent, MGCC agent, and MGCE agent, is proposed.
- (2)
- From the aspects of operation cost, environmental impact and safety, a total cost optimization model for MG is put forward to obtain the optimal operation plan. This model not only considers the operation and environmental cost but also conducts a quantitative research on the influence of volatility of DG on the MG operation.
- (3)
- To avoid local convergence, the dynamic guiding and chaotic search are introduced into traditional PSO method. The proposed DCPSO has a faster convergence speed and in this method, inertia weight decreases with the increase of the number of iterations, which makes this method have a better global convergence ability in the initial stage and a stronger local convergence ability during later period.
- (4)
- Three scenarios are analyzed, including basic scenario, energy storage participation scenario and DR participation scenario, which proves that energy storage system and DR can not only improve the flexibility and diversity of MG operation, but also promote the economy and security of MG.
2. Literature Review
2.1. MG Operation Optimization
2.2. DR Research
2.3. MAS in MGs
3. MAS Architecture and MG Optimization Model
3.1. MAS Architecture of MG
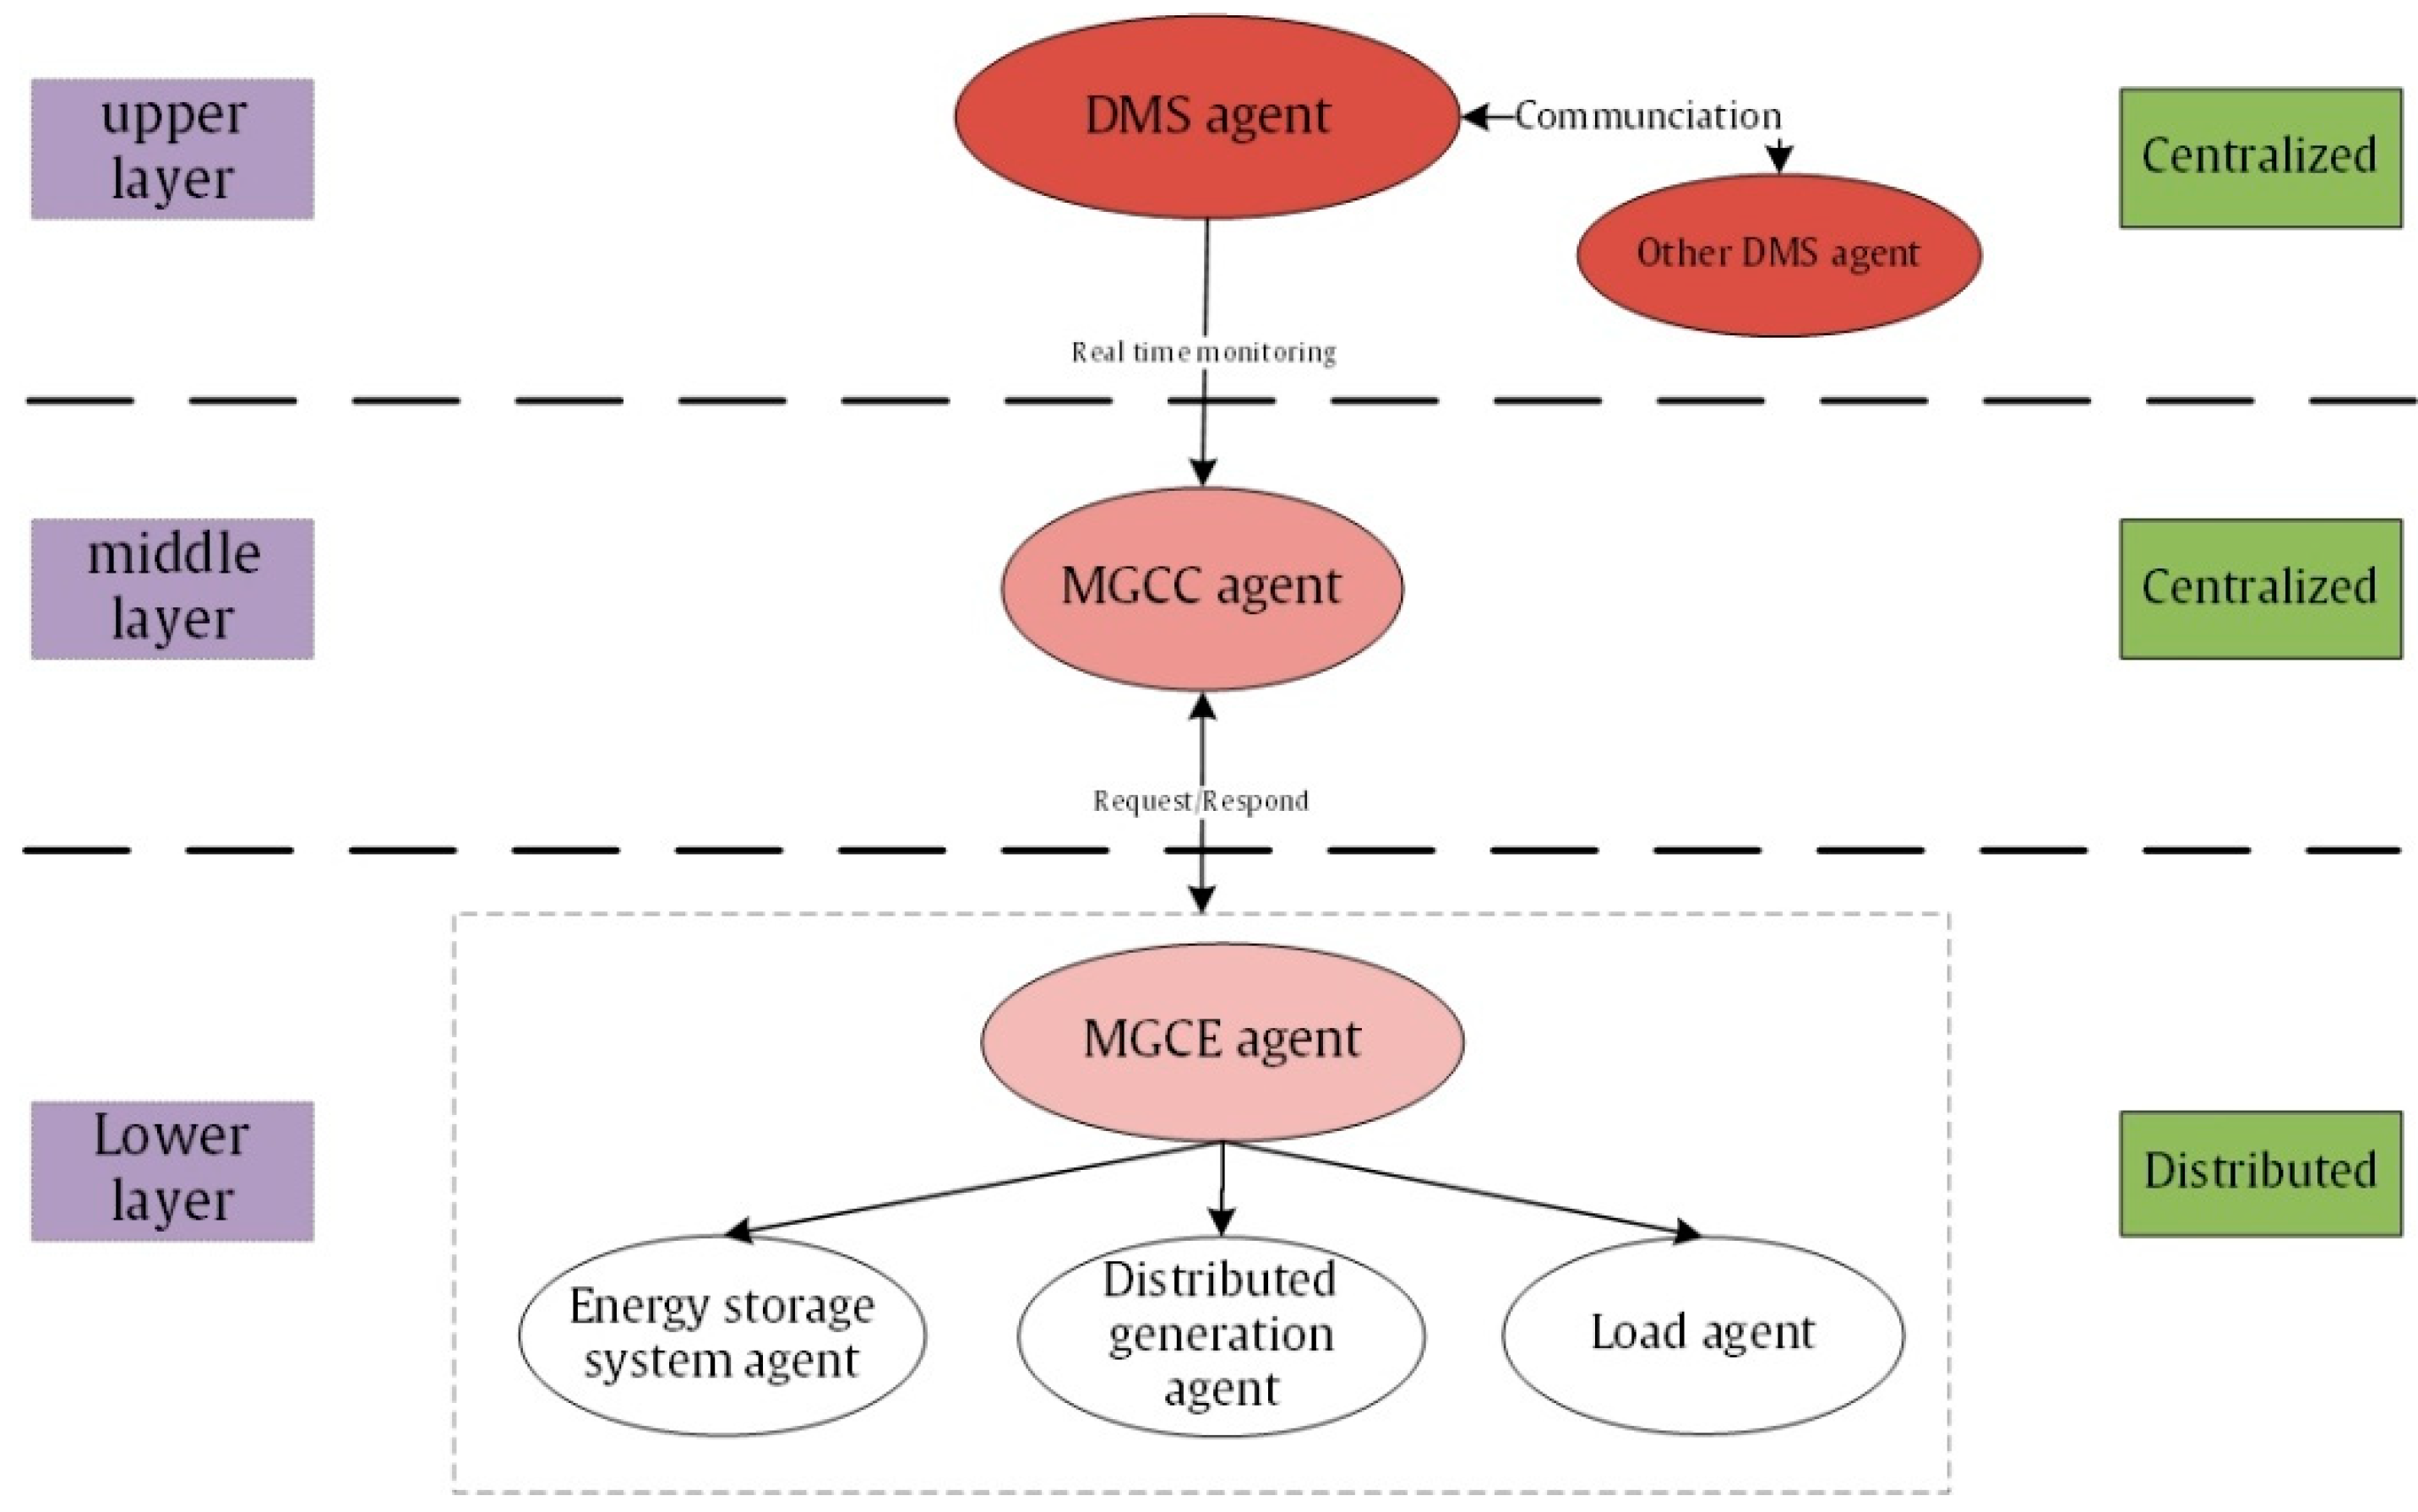
3.1.1. Hybrid Three-Layer MAS of MG
- (1)
- DMS agent is mainly responsible for the coordination and scheduling of the various agent units in the national power network and MGs. According to the overall optimization goal of the system, it sends out the incentive signal to the lower agents and makes the final scheduling decision based on the response of each agent.
- (2)
- MGCC agent acts as a link between upper and lower agents. It coordinates and optimizes the energy within MGs by receiving the incentive signals sent by DMS agent, and sends the task division and resource allocation instructions to the bottom agents.
- (3)
- As the bottom agent unit, MGCE agent monitors the running status of distributed agent units and adjusts the operation strategy according to the top instructions and actual load demand. It also can optimize the structure of MG power and respond to the upper agents.
- (1)
- The DMS agent initiates the incentive signal according to the system optimization goal, and checks whether the agents meet the systematic and local constraints.
- (2)
- According to the load prediction, the load agent submits the load demand to the MGCC and waits for the response. The DG agent submits power generation to MGCC agent according to generation prediction and waits for response. At the same time, the limit of power purchase from the national power grid is also submitted to the MGCC agent, waiting for the response. The energy storage system agent submits the state of charge to the MGCC agent, waiting for the response.
- (3)
- The MGCC agent receives the load demand, power generation and the state of charge, and then does the calculation. After receiving the DR signal, the load agent responds to the instructions of the MGCC agent according to the pre-signed agreement.
- (4)
- After receiving the response of the load agent, the MGCC agent solves the optimization model established in advance and releases the scheduling information to MGCE agent.
- (5)
- The MGCE agent receives the operation information from the MGCC agent and schedules the power generation.
3.1.2. Descriptions of Agents
3.2. MG Operation Optimization Model
3.2.1. Objective Function
- (1)
- Minimization of operation cost (C1). The operation cost mainly includes the cost of purchasing power from national grid (Costgrid,t), distributed power generation cost (CostDG,t), maintenance cost (CostOM,t), start-stop cost (CostSS), total cost per day of BES (CostTCPD) and DR cost (CostDR). The calculation is given by Equation (1):C1 = Costgrid,t + CostDG,t + CostOM + CostSS + CostTCPD + CostDR
- (a)
- Cost of purchasing power from national grid:
- (b)
- Distributed power generation cost:Since wind and PV power generation are clean energy generation, they will not consume primary non-renewable energy sources such as fossil fuel. Therefore, the fuel cost of power generation is not considered in this paper:CostDG,t = BMT,tPMT,tuMT,t
- (c)
- Maintenance cost:
- (d)
- Start-stop cost:CostSS = BStart × max(0,uMT,t − uMT,t−1)+BStop × max(0,uMT,t−1 − uMT,t)
- (e)
- Total cost per day of BES:
- (f)
- DR costIn this paper, the object of DR is the resident consumers, and the DR mode is incentive-based. The strategy of DR is as follows: when the system is in the peak period of power consumption, part of non-important load is interrupted in order to relieve the power supply pressure; these part of load will be compensated accordingly. Interruptible loads are generally considered to account for 15% of total load demand:Bgrid,t and BMT,t are the bids of the utility grid and MT at time t, respectively. Pgrid,t, PMT,t, PPV,t, PWT,t, PBES,t are power of utility grid, MT, PV, wind turbine (WT) and BES at time t, respectively. tax is the tax rate of utility power grid. uMT,t, uBES,t represent the status of MT and BES at time t (1 means on; 0 means off), respectively. OMMT, OMWT, OMPV are the maintenance costs for MT, WT and PV. CBES,max is the maximum capacity of BES. IR and LT are interest rate and lifetime of installed BES operation time horizon. FCBES, MCBES are fixed and maintenance cost for BES, respectively. A1, A2, A3 are coefficients of power interruption cost in DR, which are set as 6.14, 1.2 and 0.0000123. PDR is the total interrupted electricity.
- (2)
- Minimization of environmental cost (C2). The environmental cost of MG mainly takes into account the cost of CO2, SO2 and NOX emission treatment when the unit is running. Since wind and PV power generation are clean energy generation, this paper only considers the environmental cost caused by MT power generation, and the calculation is described as Equation (8):where K refers to the pollutant types (CO2, SO2 and NOX). is the unit cost of treating kth pollutant. is the emission factor of kth pollutant.
- (3)
- Minimization of operation risk (C3). MG contains many DG units with high randomness, volatility and uncertainty, such as wind power and PV power generation. The instability of the power output of these power generation units will lead to the phenomenon that the power supply of the isolated MG is less than the demand, which will bring some disturbance to the normal operation of MG. According the operation risk model proposed by [39], the objective function of MG operation risk is as follows:where d1 refers to the electricity price for compensating power fluctuations of WT and PV. P′WT,t and P′PV,t are the expected output of wind and PV power and d1 = 0.52 yuan/kWh.
3.2.2. Constraints
- (1)
- Equality constraints. The equality constraint is also the supply and demand balance constraint, which is the premise of the stable operation of MG. Considering the impact of user participation in DR, the equality constraint is built, shown as Equation (10):PMT,tuMT,t + PPV,t + PWT,t + PBES,tuBES,t + Pgrid,t = PL,t − PDR,tuDR,t
- (2)
- Inequality constraints. Inequality constraints include operating constraint, standby constraint, voltage constraint and DR constraint.
- (a)
- MT operating constraint. There are two kinds of operating constraints for MT units: generation constraint and start-stop constraint. The constraint of power generation is shown in Equation (11). In order to maintain efficient and stable output of the engine, there is a constraint on engine start and stop times, as shown in Equation (12):where PMT,min and PMT,max are the minimum and maximum MT power. Nnum and Nmax are the frequency and upper limit of start and stop, respectively.
- (b)
- Wind and PV power constraint. The generating power of WT and PV should satisfy the following constraint:where PMT,tmin and PMT,tmax are the minimum and maximum output power of WT at time t. PPV,tmin and PPV,tmax the minimum and maximum output power of PV at time t.
- (c)
- Charging and discharging constraints of BES. Equations (14) and (15) are the energy release and storage of discharge and charging process respectively. Equation (16) is the charging and discharging power limit. Equations (17) and (18) are the calculation of the minimum and maximum charging and discharging power.The model of discharging:The model of charging:where:CBES,t represents the energy stored in BES at time t. CBES,min and CBES,max are the minimum and maximum allowable capacity of BES. ηd and ηc are the discharge and charge efficiency of BES respectively. PBES,min and PBES,max are the minimum and maximum rated power of BES. PBES,t and are the minimum and maximum charge and discharge rates of BES at time t.
- (d)
- Utility grid constraint. The amount of electricity purchased by MG from utility power grid must meet the minimum and maximum limits of power supply, as shown in Equation (19):
- (e)
- DR constraint. The residents’ participation in DR should meet the total load reduction constraint, that is, the load reduction must be kept within an acceptable range, and the specific equation is as follows:where PDR,tmin and PDR,tmax are the lower and upper limits of load reduction for residential users at time t, PDR,t is the total interrupted electricity.
4. Framework of DCPSO
4.1. PSO
4.2. Dynamic Guiding
- (1)
- When , does not change (n = 1, …, N).
- (2)
- When , .
- (3)
- When , .
4.3. Chaotic Search
- (1)
- Initialization. Suppose that the maximum number of iterations of chaotic search as G, and set the first iteration g = 1.
- (2)
- Obtain the g-th chaotic sequence according to Equation (26).
- (3)
- Calculate variation scale using Equation (27):
- (4)
- Calculate the new position of variable Xj:where is constriction factor. m controls the speed of contraction and determines the size of the variation space of . can be determined by Equation (29):
- (5)
- Calculate the fitness of gbest. If the fitness is less than the original fitness, then the new position is the new gbest.
- (6)
- If g reaches the upper limit G, stop the chaotic search; otherwise, go to step (2).
4.4. Steps of DCPSO
5. Simulation and Discussion
5.1. MAS Machanism
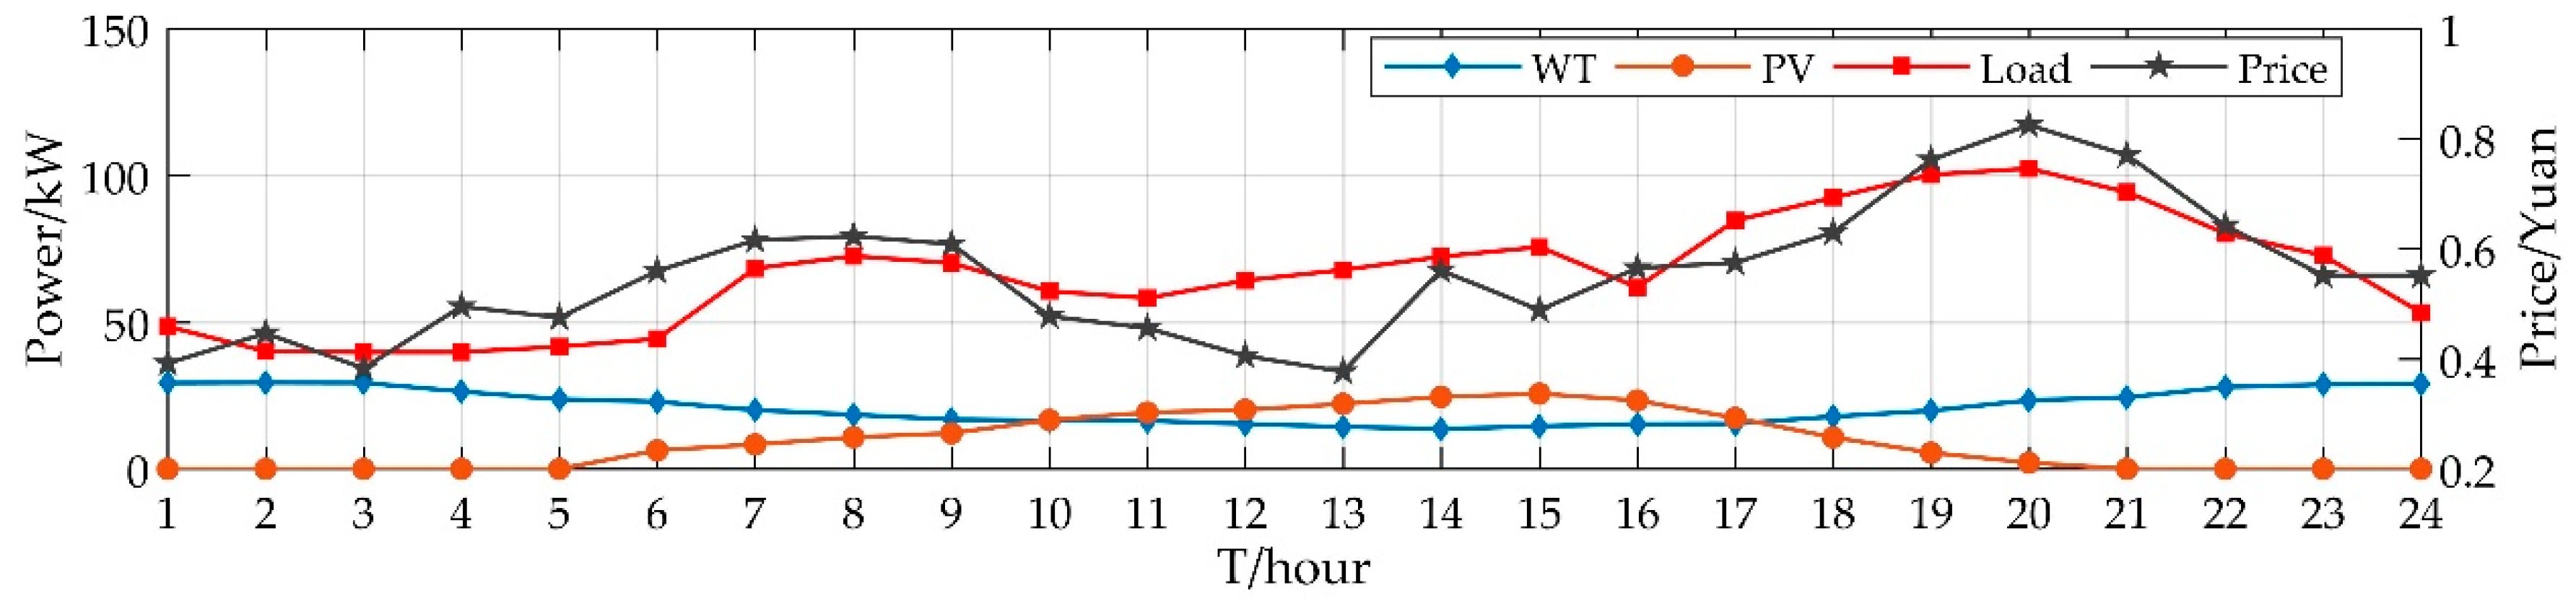
5.2. Basic Data
5.3. Scenario Analysis
5.3.1. Scenario 1
5.3.2. Scenario 2
5.3.3. Scenario 3
5.4. Comparison Analysis
5.4.1. Result Comparison
5.4.2. Convergence Speed Comparison
6. Conclusions
- (1)
- The proposed MAS included three layers, that is, DMS agent (upper layer), MGCC agent (middle layer) and MGCE agent (lower layer), to realize the coordinated and optimized efficient management of MG energy. The whole MAS would be designed in JADE in practical application.
- (2)
- In MGCC agent, an optimization model for MG operation was established. In this model, the objective function of MG operation was built from three aspects: operation cost, environmental impact and security. The MGCC agent performs the energy dispatch of other agents on the basis of minimizing the objective function.
- (3)
- To solve the proposed optimization model, this paper improved traditional PSO into DCPSO method by introducing dynamic guiding and chaotic search. In the comparison analysis, compared with PSO and VW-PSO, the proposed method proved to obtain a better result, and show higher computational efficiency and faster convergence speed.
- (4)
- In order to verify the influence of energy storage system and DR participation on MG, three scenarios were analyzed in this paper. The results show that when the energy storage system plays a role in MG operation, the minimum daily cost of the system is 422.86 yuan, which is 27.92% lower than the basic scenario. When residents participate in the DR, the minimum daily cost of the MG is reduced to 382.55 yuan, which is 9.53% lower than Scenario 2, and 34.79% lower than Scenario 1. Therefore, the participation of BES and DR can effectively reduce the cost of MG and improve the flexibility of MG operation.
Author Contributions
Funding
Acknowledgments
Conflicts of Interest
Nomenclature
| Abbreviations | |
| MG | Microgrid |
| DG | Distributed generation |
| DR | Demand response |
| MAS | Multi-agent system |
| DCPSO | Dynamic guiding chaotic search particle swarm optimization |
| RTP | Real-time price |
| CPP | Critical peak price |
| TOU | Time-of-use price |
| DMS | Distributed management system |
| MGCC | Microgrid central control |
| MGCE | Microgrid control element |
| PV | Photovoltaic |
| MT | Micro-gas turbine |
| BES | Battery energy storage |
| WT | Wind turbine |
| Constants | |
| Bgrid,t | Bid of utility grid at time t |
| BMT,t | Bid of MT at time t |
| tax | Tax rate of utility grid |
| OMMT | Maintenance cost for MT |
| OMWT | Maintenance cost for WT |
| OMPV | Maintenance cost for PV |
| CBES,min | Minimum capacity of BES |
| CBES,max | Maximum capacity of BES |
| IR | Interest rate |
| LT | Lifetime of installed BES operation time horizon |
| FCBES | Fixed cost for BES |
| MCBES | Maintenance cost for BES |
| A1, A2, A3 | Coefficients of power interruption cost in DR |
| The unit cost of treating kth pollutant | |
| The emission factor of kth pollutant | |
| The electricity price for compensating power fluctuations of WT and PV | |
| Minimum producible power of MT at time t | |
| Minimum producible power of WT at time t | |
| Minimum producible power of PV at time t | |
| Minimum producible power of utility grid | |
| Minimum producible power of DR at time t | |
| Minimum producible power of BES | |
| Maximum producible power of MT | |
| Maximum producible power of WT | |
| Maximum producible power of PV | |
| Maximum producible power of utility grid | |
| Maximum producible power of DR | |
| Maximum producible power of BES | |
| Nmax | The upper limit of start and stop |
| Discharging efficiency of BES | |
| Charging efficiency of BES | |
| Variables | |
| Costgrid,t | Cost of purchasing power from utility grid at time t |
| CostDG,t | Cost of dgs at time t |
| CostOM,t | Cost of maintenance at time t |
| CostSS | Start-stop cost |
| CostTCPD | Total cost per day of BES |
| CostDR,t | DR cost at time t |
| Pgrid,t | Power of utility grid at time t |
| PMT,t | Power of MT at time t |
| PPV,t | Power of PV at time t |
| PWT,t | Power of WT at time t |
| PBES,t | Power of BES at time t |
| uMT,t | Status of MT |
| uBES,t | Status of BES |
| PDR,t | Interrupted electricity at time t |
| Expected output of wind at time t | |
| Expected output of PV at time t | |
| Nnum | Frequency of start and stop |
| Energy stored in BES at time t | |
| The minimum charge and discharge rates of BES at time t | |
| Maximum charge and discharge rates of BES at time t | |
References
- Van Ackooij, W.; De Boeck, J.; Detienne, B.; Pan, S.; Poss, M. Optimizing power generation in the presence of micro-grids. Eur. J. Oper. Res. 2018, 271, 450–461. [Google Scholar] [CrossRef]
- Abo-Elyousr, F.K.; Elnozahy, A. Bi-objective economic feasibility of hybrid micro-grid systems with multiple fuel options for islanded areas in Egypt. Renew. Energy 2018, 128, 37–56. [Google Scholar] [CrossRef]
- Wang, Y.; Huang, Y.; Wang, Y.; Zeng, M.; Li, F.; Wang, Y.; Zhang, Y. Energy management of smart micro-grid with response loads and distributed generation considering demand response. J. Clean. Prod. 2018, 197, 1069–1083. [Google Scholar] [CrossRef]
- Lin, S.; Li, C.; Xu, F.; Liu, D.; Liu, J. Risk identification and analysis for new energy power system in China based on D numbers and decision-making trial and evaluation laboratory (DEMATEL). J. Clean. Prod. 2018, 180, 81–96. [Google Scholar] [CrossRef]
- Oprea, S.-V.; Bara, A.; Majstrovic, G. Aspects Referring Wind Energy Integration from the Power System Point of View in the Region of Southeast Europe. Study Case of Romania. Energies 2018, 11, 251. [Google Scholar] [CrossRef]
- Palensky, P.; Dietrich, D. Demand Side Management: Demand Response, Intelligent Energy Systems, and Smart Loads. IEEE Trans. Ind. Inform. 2011, 7, 381–388. [Google Scholar] [CrossRef]
- Sharma, S.; Bhattacharjee, S.; Bhattacharya, A. Operation cost minimization of a Micro-Grid using Quasi-Oppositional Swine Influenza Model Based Optimization with Quarantine. Ain Shams Eng. J. 2018, 9, 45–63. [Google Scholar] [CrossRef]
- Ju, L.; Zhang, Q.; Tan, Z.; Wang, W.; Xin, H.; Zhang, Z. Multi-agent-system-based coupling control optimization model for micro-grid group intelligent scheduling considering autonomy-cooperative operation strategy. Energy 2018, 157, 1035–1052. [Google Scholar] [CrossRef]
- Dou, C.; An, X.; Yue, D. Multi-agent System Based Energy Management Strategies for Microgrid by using Renewable Energy Source and Load Forecasting. Electr. Power Compon. Syst. 2016, 44, 2059–2072. [Google Scholar] [CrossRef]
- Maheri, A. Multi-objective design optimisation of standalone hybrid wind-PV-diesel systems under uncertainties. Renew. Energy 2014, 66, 650–661. [Google Scholar] [CrossRef]
- Azaza, M.; Wallin, F. Multi objective particle swarm optimization of hybrid micro-grid system: A case study in Sweden. Energy 2017, 123, 108–118. [Google Scholar] [CrossRef]
- Cheng, M.-Y.; Huang, K.-Y.; Hutomo, M. Multiobjective Dynamic-Guiding PSO for Optimizing Work Shift Schedules. J. Constr. Eng. Manag. 2018, 144, 04018089. [Google Scholar] [CrossRef]
- Wang, L.; Singh, C. Multicriteria Design of Hybrid Power Generation Systems Based on a Modified Particle Swarm Optimization Algorithm. IEEE Trans. Energy Convers. 2009, 24, 163–172. [Google Scholar] [CrossRef]
- Katsigiannis, Y.A.; Georgilakis, P.S.; Karapidakis, E.S. Hybrid Simulated Annealing-Tabu Search Method for Optimal Sizing of Autonomous Power Systems With Renewables. IEEE Trans. Sustain. Energy 2012, 3, 330–338. [Google Scholar] [CrossRef]
- Abbes, D.; Martinez, A.; Champenois, G. Eco-design optimisation of an autonomous hybrid wind-photovoltaic system with battery storage. Iet Renew. Power Gener. 2012, 6, 358–371. [Google Scholar] [CrossRef]
- Kaviani, A.K.; Riahy, G.H.; Kouhsari, S.H.M. Optimal design of a reliable hydrogen-based stand-alone wind/PV generating system, considering component outages. Renew. Energy 2009, 34, 2380–2390. [Google Scholar] [CrossRef]
- Wu, Y.-K.; Lee, C.-Y.; Liu, L.-C.; Tsai, S.-H. Study of Reconfiguration for the Distribution System With Distributed Generators. IEEE Trans. Power Deliv. 2010, 25, 1678–1685. [Google Scholar] [CrossRef]
- Kirthiga, M.V.; Daniel, S.A.; Gurunathan, S. A Methodology for Transforming an Existing Distribution Network Into a Sustainable Autonomous Micro-Grid. IEEE Trans. Sustain. Energy 2013, 4, 31–41. [Google Scholar] [CrossRef]
- Rendroyoko, I.; Sinisuka, N.I. Residential Customer Demand Response Program in Microgrid System: A Survey Literature. Int. J. Geomate 2018, 14, 8–14. [Google Scholar] [CrossRef]
- Zeng, B.; Yang, Y.; Duan, J.; Zeng, M.; Ouyang, S.; Li, C. Key issues and research prospects for demand-side response in alternate electrical power systems with renewable energy sources. Autom. Electr. Power Syst. 2015, 39, 10–18. [Google Scholar]
- Yao, J.; Yang, S.; Wang, K.; Zeng, D.; Mao, W.; Geng, J. Framework and strategy design of demand response scheduling for balancing wind power fluctuation. Autom. Electr. Power Syst. 2014, 85–92. [Google Scholar]
- Ju, L.; Tan, Z.; Li, H.; Tan, Q.; Yu, X.; Song, X. Multi-objective operation optimization and evaluation model for CCHP and renewable energy based hybrid energy system driven by distributed energy resources in China. Energy 2016, 111, 322–340. [Google Scholar] [CrossRef]
- Baboli, P.T.; Eghbal, M.; Moghaddam, M.P.; Aalami, H. Customer Behavior Based Demand Response Model. In 2012 IEEE Power and Energy Society General Meeting; IEEE: New York, NY, USA, 2012; ISBN 978-1-4673-2729-9. [Google Scholar]
- Bartusch, C.; Wallin, F.; Odlare, M.; Vassileva, I.; Wester, L. Introducing a demand-based electricity distribution tariff in the residential sector: Demand response and customer perception. Energy Policy 2011, 39, 5008–5025. [Google Scholar] [CrossRef]
- Li, L.; Rao, Y.; Yang, R.; Zhou, K. Is it more effective to bring time-of-use pricing into increasing block tariffs? Evidence from evaluation of residential electricity price policy in Anhui province. J. Clean. Prod. 2018, 181, 703–716. [Google Scholar] [CrossRef]
- Venizelou, V.; Philippou, N.; Hadjipanayi, M.; Makrides, G.; Efthymiou, V.; Georghiou, G.E. Development of a novel time-of-use tariff algorithm for residential prosumer price-based demand side management. Energy 2018, 142, 633–646. [Google Scholar] [CrossRef]
- Asadinejad, A.; Tomsovic, K.; Varzaneh, M.G. Examination of Incentive Based Demand Response in Western Connection Reduced Model. In 2015 North American Power Symposium (naps); IEEE: New York, NY, USA, 2015; ISBN 978-1-4673-7389-0. [Google Scholar]
- Asadinejad, A.; Rahimpour, A.; Tomsovic, K.; Qi, H.; Chen, C. Evaluation of residential customer elasticity for incentive based demand response programs. Electr. Power Syst. Res. 2018, 158, 26–36. [Google Scholar] [CrossRef]
- Shao, S.; Pipattanasomporn, M.; Rahman, S. Development of Physical-Based Demand Response-Enabled Residential Load Models. IEEE Trans. Power Syst. 2013, 28, 607–614. [Google Scholar] [CrossRef]
- Gonzalez Cabrera, N.; Gutierrez-Alcaraz, G. Evaluating Demand Response Programs Based on Demand Management Contracts. In 2012 IEEE Power and Energy Society General Meeting; IEEE: New York, NY, USA, 2012; ISBN 978-1-4673-2729-9. [Google Scholar]
- Shabbir, A.; ul Hassan, N.; Yuen, C.; Ahmad, A.; Tushar, W. Multi-tier Incentive Scheme for Residential Customer Participation in Demand Response Management Programs; IEEE: New York, NY, USA, 2015; ISBN 978-1-5090-1237-4. [Google Scholar]
- Logenthiran, T.; Srinivasan, D.; Khambadkone, A.M. Multi-agent system for energy resource scheduling of integrated microgrids in a distributed system. Electr. Power Syst. Res. 2011, 81, 138–148. [Google Scholar] [CrossRef]
- Jun, Z.; Junfeng, L.; Jie, W.; Ngan, H.W. A multi-agent solution to energy management in hybrid renewable energy generation system. Renew. Energy 2011, 36, 1352–1363. [Google Scholar] [CrossRef]
- Elamine, D.O.; Nfaoui, E.H.; Boumhidi, J. Intelligent multi-agent system for smart microgrid energy management. Int. J. Intell. Eng. Inform. 2016, 4, 245–266. [Google Scholar] [CrossRef]
- Anvari-Moghaddam, A.; Rahimi-Kian, A.; Mirian, M.S.; Guerrero, J.M. A multi-agent based energy management solution for integrated buildings and microgrid system. Appl. Energy 2017, 203, 41–56. [Google Scholar] [CrossRef]
- Khan, M.W.; Wang, J. The research on multi-agent system for microgrid control and optimization. Renew. Sustain. Energy Rev. 2017, 80, 1399–1411. [Google Scholar] [CrossRef]
- Mohseni, S.; Moghaddas-Tafreshi, S.M. A multi-agent system for optimal sizing of a cooperative self-sustainable multi-carrier microgrid. Sustain. Cities Soc. 2018, 38, 452–465. [Google Scholar] [CrossRef]
- Yin, X.; Ding, M. Improvement of real-time power tracking in microgrid using multi-agent system. Ieej Trans. Electr. Electron. Eng. 2018, 13, 58–64. [Google Scholar] [CrossRef]
- Li, C.; Zhang, J.; Li, P. Multi-objective Optimization Model of Micro-grid Operation Considering Cost, Pollution Discharge and Risk. Proc. Csee 2015, 35, 1051–1058. [Google Scholar]
- Zhao, B.; Guo, C.X.; Cao, Y.J. A multiagent-based particle swarm optimization approach for optimal reactive power dispatch. IEEE Trans. Power Syst. 2005, 20, 1070–1078. [Google Scholar] [CrossRef]


| DG Type | Minimum Power (kW) | Maximum Power (kW) | Generating Cost (yuan/kWh) | Maintenance Cost (yuan /kWh) | Start-Stop Cost (yuan) |
|---|---|---|---|---|---|
| MT | 6 | 50 | 0.75 | 0.0401 | 0.492 |
| WT | 0 | 30 | 0 | 0.0296 | - |
| PV | 0 | 25 | 0 | 0.0096 | - |
| BES | −30 | 30 | 0 | - | - |
| Utility | −30 | 30 | - | - | - |
| GHG Type | Emission Factor (g/kW) | Processing Cost (yuan/kg) | |||
|---|---|---|---|---|---|
| MT | WT | PV | BES | ||
| CO2 | 1.600 | - | - | 0.0220 | 0.09 |
| NOX | 0.440 | - | - | 0.0044 | 27.54 |
| SO2 | 0.008 | - | - | 0.0005 | 6.49 |
| Time (h) | DG Outputs (kWh) | Load (kWh) | on/off Status | ||||||
|---|---|---|---|---|---|---|---|---|---|
| WT | PV | MT | Grid | WT | PV | MT | Grid | ||
| 1 | 29.30 | 0 | 0 | 19.14 | 48.44 | 1 | 1 | 0 | 1 |
| 2 | 29.40 | 0 | 0 | 10.66 | 40.07 | 1 | 1 | 0 | 1 |
| 3 | 29.32 | 0 | 0 | 10.46 | 39.78 | 1 | 1 | 0 | 1 |
| 4 | 26.33 | 0 | 0 | 13.46 | 39.80 | 1 | 1 | 0 | 1 |
| 5 | 23.71 | 0 | 0 | 17.89 | 41.61 | 1 | 1 | 0 | 1 |
| 6 | 22.90 | 6.30 | 0 | 15.10 | 44.32 | 1 | 1 | 0 | 1 |
| 7 | 20.01 | 8.32 | 15.51 | 24.44 | 68.28 | 1 | 1 | 1 | 1 |
| 8 | 18.47 | 10.79 | 15.67 | 27.55 | 72.48 | 1 | 1 | 1 | 1 |
| 9 | 16.84 | 12.16 | 14.68 | 26.40 | 70.10 | 1 | 1 | 1 | 1 |
| 10 | 16.49 | 16.65 | 0 | 27.39 | 60.54 | 1 | 1 | 0 | 1 |
| 11 | 16.41 | 19.21 | 0 | 22.53 | 58.16 | 1 | 1 | 0 | 1 |
| 12 | 15.32 | 20.12 | 0 | 28.70 | 64.16 | 1 | 1 | 0 | 1 |
| 13 | 14.34 | 22.14 | 6 | 25.28 | 67.76 | 1 | 1 | 1 | 1 |
| 14 | 13.62 | 24.51 | 6 | 28.13 | 72.26 | 1 | 1 | 1 | 1 |
| 15 | 14.53 | 25.61 | 6 | 29.42 | 75.57 | 1 | 1 | 1 | 1 |
| 16 | 15.27 | 23.32 | 6 | 17.22 | 61.81 | 1 | 1 | 1 | 1 |
| 17 | 15.37 | 17.35 | 22.64 | 29.21 | 84.58 | 1 | 1 | 1 | 1 |
| 18 | 17.82 | 10.75 | 50.00 | 13.80 | 92.38 | 1 | 1 | 1 | 1 |
| 19 | 19.83 | 5.52 | 50.00 | 24.82 | 100.18 | 1 | 1 | 1 | 1 |
| 20 | 23.37 | 2.12 | 50.00 | 26.78 | 102.28 | 1 | 1 | 1 | 1 |
| 21 | 24.38 | 0 | 50.00 | 19.82 | 94.21 | 1 | 1 | 1 | 1 |
| 22 | 27.84 | 0 | 22.67 | 29.64 | 80.16 | 1 | 1 | 1 | 1 |
| 23 | 28.75 | 0 | 14.79 | 29.13 | 72.68 | 1 | 1 | 1 | 1 |
| 24 | 29.03 | 0 | 0 | 24.21 | 53.24 | 1 | 1 | 0 | 1 |
| Total | 508.65 | 224.87 | 329.96 | 541.18 | 1604.85 | ||||
| Time (h) | DG and BES Outputs (kWh) | Load (kWh) | on/off Status | ||||||||
|---|---|---|---|---|---|---|---|---|---|---|---|
| WT | PV | MT | Grid | BES | WT | PV | MT | Grid | BES | ||
| 1 | 29.30 | 0 | 0 | 30.00 | −10.85 | 48.44 | 1 | 1 | 0 | 1 | 1 |
| 2 | 29.40 | 0 | 0 | 9.91 | 0.75 | 40.07 | 1 | 1 | 0 | 1 | 1 |
| 3 | 29.32 | 0 | 0 | 30.00 | −19.53 | 39.78 | 1 | 1 | 0 | 1 | 1 |
| 4 | 26.33 | 0 | 0 | 18.00 | −4.53 | 39.80 | 1 | 1 | 0 | 1 | 1 |
| 5 | 23.71 | 0 | 0 | 30.00 | −12.10 | 41.61 | 1 | 1 | 0 | 1 | 1 |
| 6 | 22.90 | 6.30 | 0 | 1.53 | 13.57 | 44.32 | 1 | 1 | 0 | 1 | 1 |
| 7 | 20.01 | 8.31 | 6.00 | 11.44 | 22.51 | 68.28 | 1 | 1 | 1 | 1 | 1 |
| 8 | 18.47 | 10.79 | 0 | 30.00 | 13.22 | 72.48 | 1 | 1 | 0 | 1 | 1 |
| 9 | 16.84 | 12.16 | 0 | 30.00 | 11.09 | 70.10 | 1 | 1 | 0 | 1 | 1 |
| 10 | 16.49 | 16.64 | 0 | 30.00 | −2.60 | 60.54 | 1 | 1 | 0 | 1 | 1 |
| 11 | 16.40 | 19.21 | 0 | 30.00 | −7.46 | 58.16 | 1 | 1 | 0 | 1 | 1 |
| 12 | 15.32 | 20.12 | 0 | 30.00 | −1.29 | 64.16 | 1 | 1 | 0 | 1 | 1 |
| 13 | 14.33 | 22.13 | 6.00 | 30.00 | −4.71 | 67.76 | 1 | 1 | 1 | 1 | 1 |
| 14 | 13.61 | 24.51 | 0 | 30.00 | 4.13 | 72.26 | 1 | 1 | 0 | 1 | 1 |
| 15 | 14.53 | 25.61 | 0 | 30.00 | 5.42 | 75.57 | 1 | 1 | 0 | 1 | 1 |
| 16 | 15.26 | 23.31 | 6.00 | −1.44 | 18.67 | 61.81 | 1 | 1 | 1 | 1 | 1 |
| 17 | 15.36 | 17.35 | 0 | 30.00 | 21.86 | 84.58 | 1 | 1 | 0 | 1 | 1 |
| 18 | 17.82 | 10.75 | 6.00 | 30.00 | 27.80 | 92.38 | 1 | 1 | 1 | 1 | 1 |
| 19 | 19.83 | 5.52 | 16.72 | 30.00 | 28.10 | 100.18 | 1 | 1 | 1 | 1 | 1 |
| 20 | 23.37 | 2.12 | 18.75 | 30.00 | 28.02 | 102.28 | 1 | 1 | 1 | 1 | 1 |
| 21 | 24.38 | 0 | 35.24 | 6.23 | 28.35 | 94.21 | 1 | 1 | 1 | 1 | 1 |
| 22 | 27.84 | 0 | 0 | 30.00 | 22.31 | 80.16 | 1 | 1 | 0 | 1 | 1 |
| 23 | 28.75 | 0 | 0 | 30.00 | 13.93 | 72.68 | 1 | 1 | 0 | 1 | 1 |
| 24 | 29.03 | 0 | 0 | 21.38 | 2.81 | 53.24 | 1 | 1 | 0 | 1 | 1 |
| Total | 508.60 | 224.83 | 94.71 | 577.05 | 199.47 | 1604.85 | |||||
| Time (h) | DG and BES Outputs (kWh) | Load (kWh) | on/off Status | ||||||||
|---|---|---|---|---|---|---|---|---|---|---|---|
| WT | PV | MT | Grid | BES | WT | PV | MT | Grid | BES | ||
| 1 | 29.30 | 0 | 0 | 30.00 | −10.85 | 48.44 | 1 | 1 | 0 | 1 | 1 |
| 2 | 29.40 | 0 | 0 | 29.02 | −18.36 | 40.07 | 1 | 1 | 0 | 1 | 1 |
| 3 | 29.32 | 0 | 0 | 30.00 | −19.53 | 39.79 | 1 | 1 | 0 | 1 | 1 |
| 4 | 26.33 | 0 | 0 | 30.00 | −16.53 | 39.80 | 1 | 1 | 0 | 1 | 1 |
| 5 | 23.71 | 0 | 6.00 | 26.54 | −14.64 | 41.61 | 1 | 1 | 1 | 1 | 1 |
| 6 | 22.90 | 6.30 | 0 | 30.00 | −14.89 | 44.32 | 1 | 1 | 0 | 1 | 1 |
| 7 | 20.01 | 8.31 | 0 | 20.37 | 19.57 | 68.28 | 1 | 1 | 0 | 1 | 1 |
| 8 | 18.47 | 10.79 | 0 | 13.59 | 29.62 | 72.48 | 1 | 1 | 0 | 1 | 1 |
| 9 | 16.84 | 12.16 | 6.00 | 8.00 | 27.09 | 70.10 | 1 | 1 | 1 | 1 | 1 |
| 10 | 16.49 | 16.64 | 0 | 30.00 | −2.60 | 60.54 | 1 | 1 | 0 | 1 | 1 |
| 11 | 16.40 | 19.21 | 0 | 30.00 | −7.46 | 58.16 | 1 | 1 | 0 | 1 | 1 |
| 12 | 15.32 | 20.12 | 0 | 30.00 | −1.29 | 64.16 | 1 | 1 | 0 | 1 | 1 |
| 13 | 14.33 | 22.13 | 0 | 30.00 | 1.28 | 67.76 | 1 | 1 | 0 | 1 | 1 |
| 14 | 13.61 | 24.51 | 10.00 | 3.55 | 20.58 | 72.26 | 1 | 1 | 1 | 1 | 1 |
| 15 | 14.53 | 25.61 | 0 | 30.00 | 5.43 | 75.57 | 1 | 1 | 0 | 1 | 1 |
| 16 | 15.26 | 23.31 | 0 | −4.55 | 27.78 | 61.81 | 1 | 1 | 0 | 1 | 1 |
| 17 | 15.36 | 17.35 | 0 | 30.00 | 21.86 | 84.58 | 1 | 1 | 0 | 1 | 1 |
| 18 | 17.82 | 10.75 | 6.00 | 15.61 | 28.33 | 78.52 | 1 | 1 | 1 | 1 | 1 |
| 19 | 19.83 | 5.52 | 50.00 | −17.36 | 27.16 | 85.15 | 1 | 1 | 1 | 1 | 1 |
| 20 | 23.37 | 2.12 | 6.00 | 30.00 | 25.44 | 86.94 | 1 | 1 | 1 | 1 | 1 |
| 21 | 24.38 | 0 | 0 | 30.00 | 25.69 | 80.08 | 1 | 1 | 0 | 1 | 1 |
| 22 | 27.84 | 0 | 0 | 30.00 | 22.32 | 80.16 | 1 | 1 | 0 | 1 | 1 |
| 23 | 28.75 | 0 | 6.00 | 30.00 | 7.93 | 72.68 | 1 | 1 | 1 | 1 | 1 |
| 24 | 29.03 | 0 | 6.00 | 2.15 | 16.05 | 53.24 | 1 | 1 | 0 | 1 | 1 |
| Total | 508.6 | 224.83 | 96 | 516.92 | 199.98 | 1546.50 | |||||
| Best Solution (yuan) | Average Solution (yuan) | Worst Solution (yuan) | Standard Deviation | ||
|---|---|---|---|---|---|
| Scenario 1 | PSO | 602.218 | 617.054 | 642.404 | 11.151 |
| VW-PSO | 596.236 | 609.068 | 624.750 | 6.576 | |
| Proposed Method | 586.64 | 597.982 | 609.378 | 6.200 | |
| Scenario 2 | PSO | 439.258 | 459.540 | 486.141 | 14.420 |
| VW-PSO | 435.068 | 444.610 | 456.538 | 6.948 | |
| Proposed Method | 422.90 | 425.681 | 430.128 | 2.216 | |
| Scenario 3 | PSO | 397.765 | 419.563 | 435.828 | 10.666 |
| VW-PSO | 398.735 | 407.174 | 416.978 | 5.593 | |
| Proposed Method | 382.60 | 388.784 | 398.094 | 4.155 | |
© 2018 by the authors. Licensee MDPI, Basel, Switzerland. This article is an open access article distributed under the terms and conditions of the Creative Commons Attribution (CC BY) license (http://creativecommons.org/licenses/by/4.0/).
Share and Cite
Liu, J.; Xu, F.; Lin, S.; Cai, H.; Yan, S. A Multi-Agent-Based Optimization Model for Microgrid Operation Using Dynamic Guiding Chaotic Search Particle Swarm Optimization. Energies 2018, 11, 3286. https://doi.org/10.3390/en11123286
Liu J, Xu F, Lin S, Cai H, Yan S. A Multi-Agent-Based Optimization Model for Microgrid Operation Using Dynamic Guiding Chaotic Search Particle Swarm Optimization. Energies. 2018; 11(12):3286. https://doi.org/10.3390/en11123286
Chicago/Turabian StyleLiu, Jicheng, Fangqiu Xu, Shuaishuai Lin, Hua Cai, and Suli Yan. 2018. "A Multi-Agent-Based Optimization Model for Microgrid Operation Using Dynamic Guiding Chaotic Search Particle Swarm Optimization" Energies 11, no. 12: 3286. https://doi.org/10.3390/en11123286
APA StyleLiu, J., Xu, F., Lin, S., Cai, H., & Yan, S. (2018). A Multi-Agent-Based Optimization Model for Microgrid Operation Using Dynamic Guiding Chaotic Search Particle Swarm Optimization. Energies, 11(12), 3286. https://doi.org/10.3390/en11123286