Factors Affecting the Installation Potential of Ground Source Heat Pump Systems: A Comparative Study for the Sendai Plain and Aizu Basin, Japan


Abstract
:1. Introduction
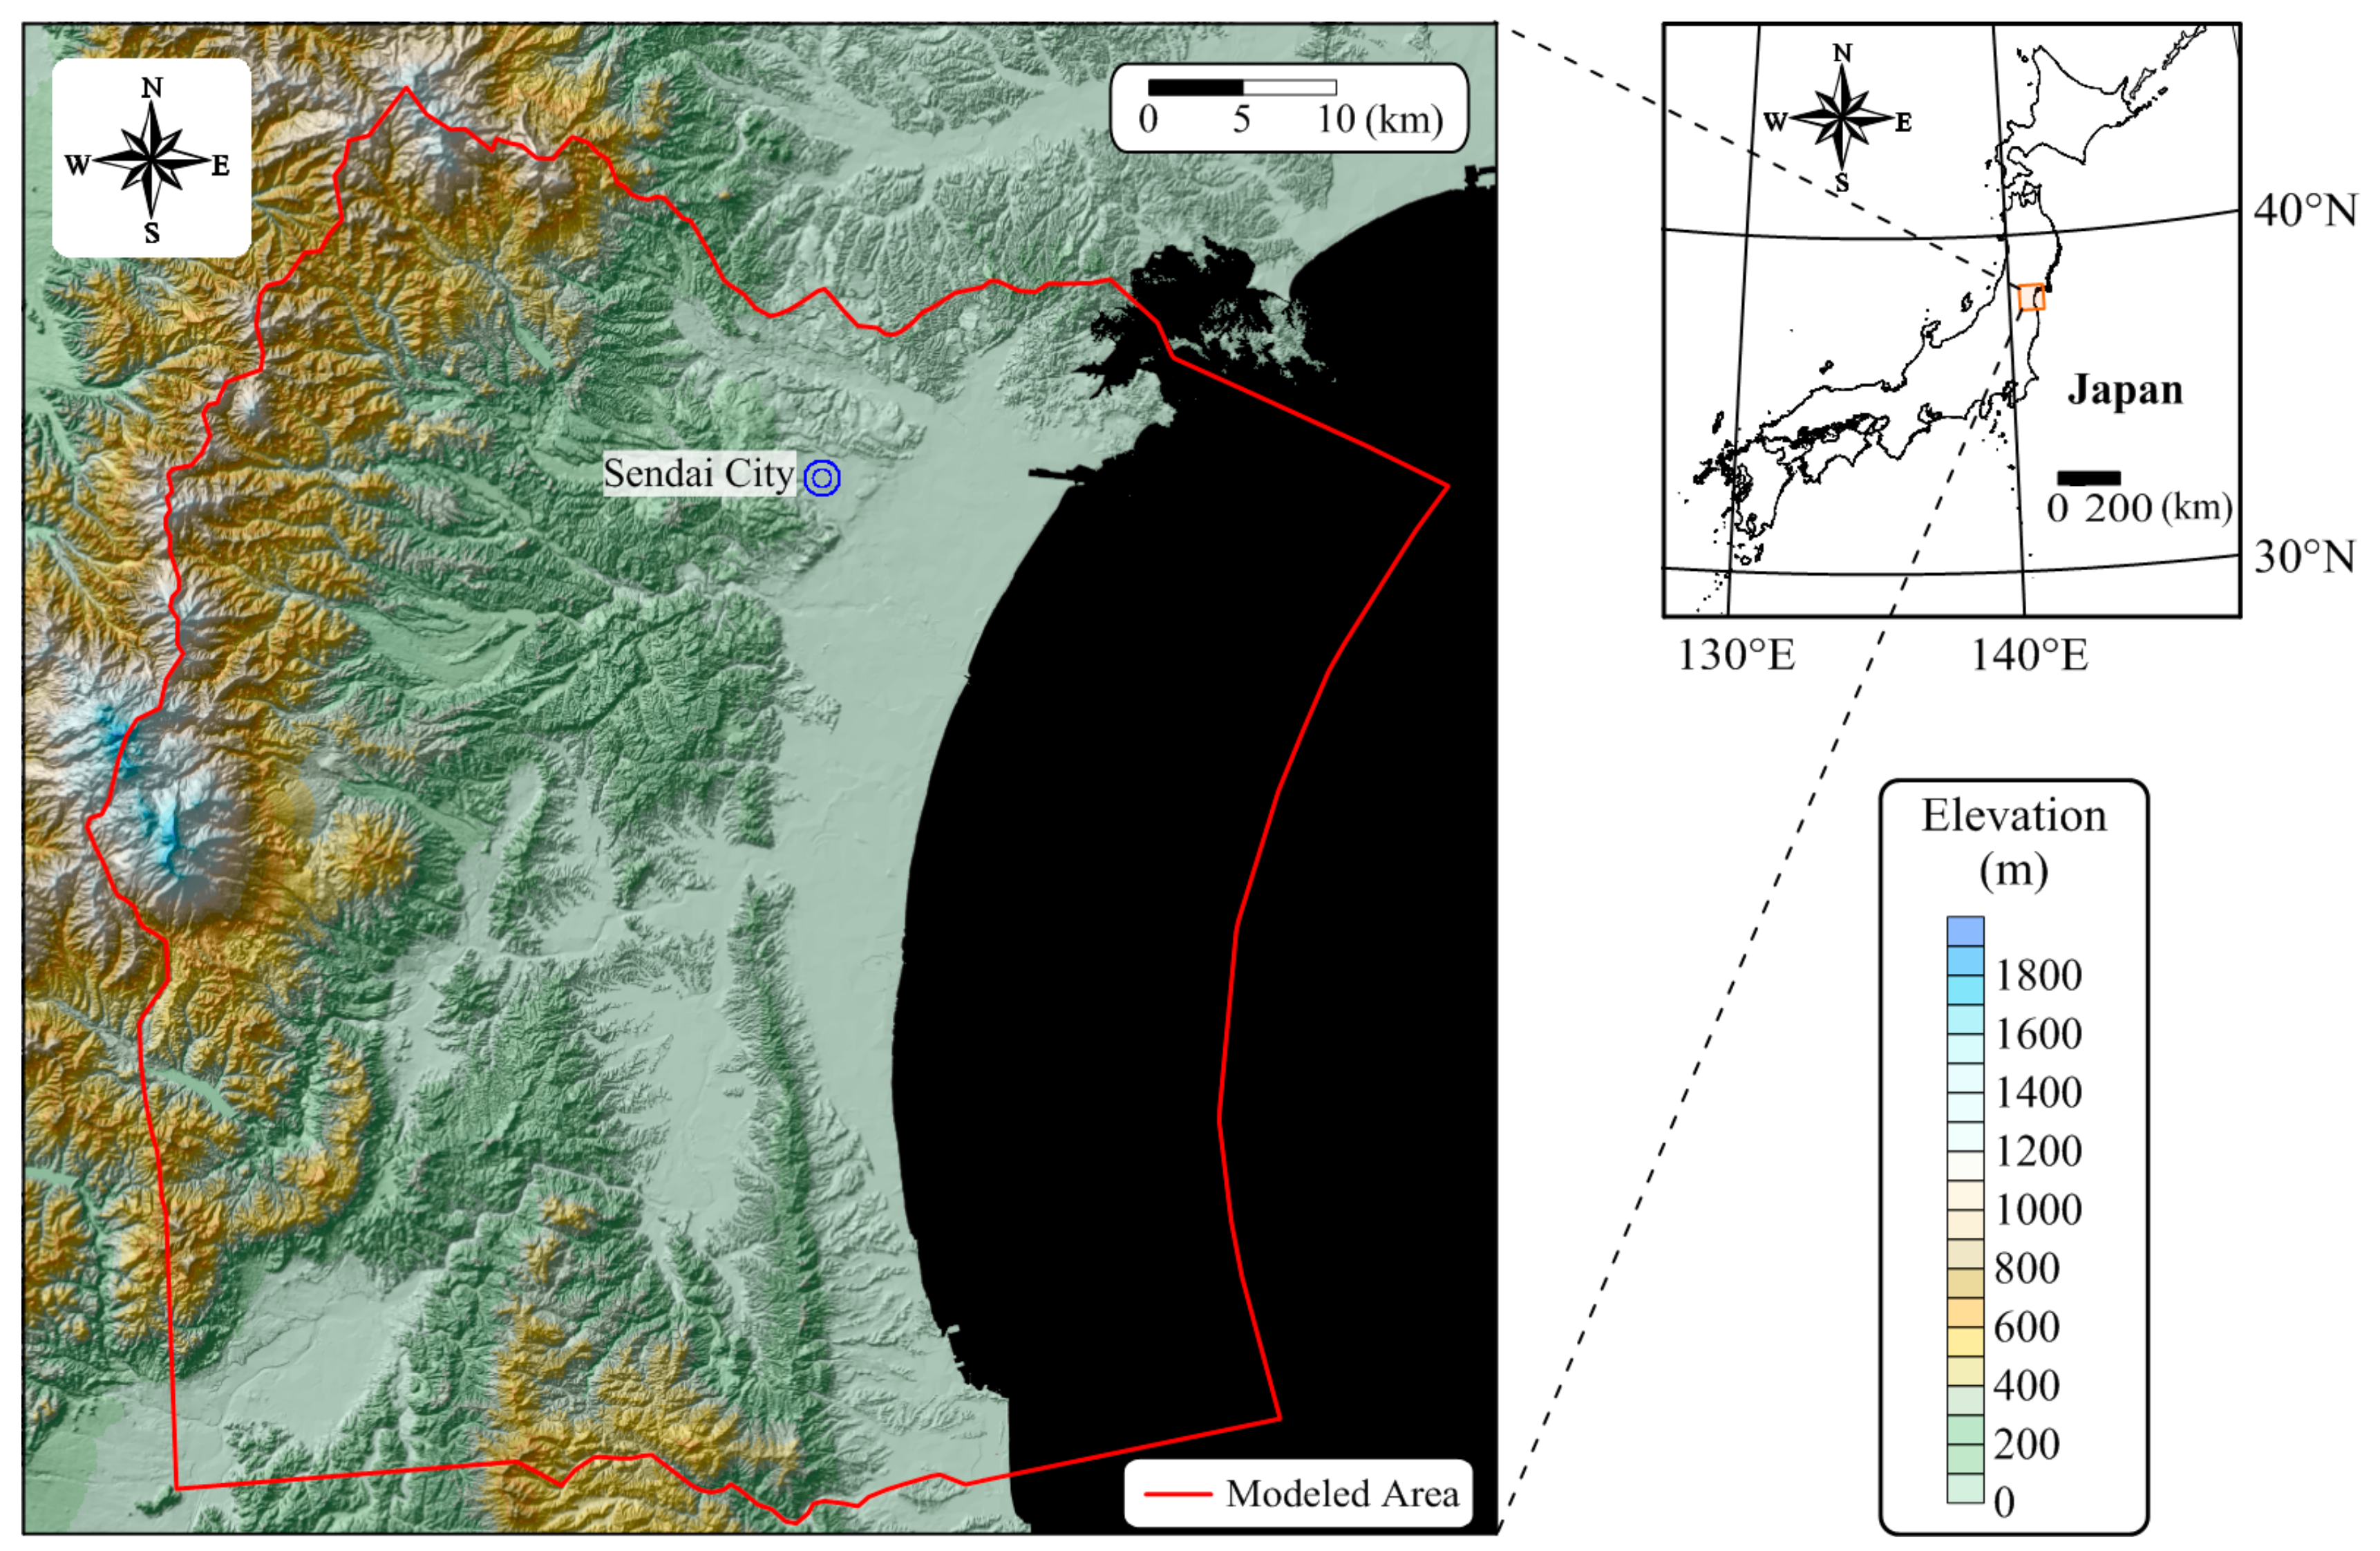
2. Study Area
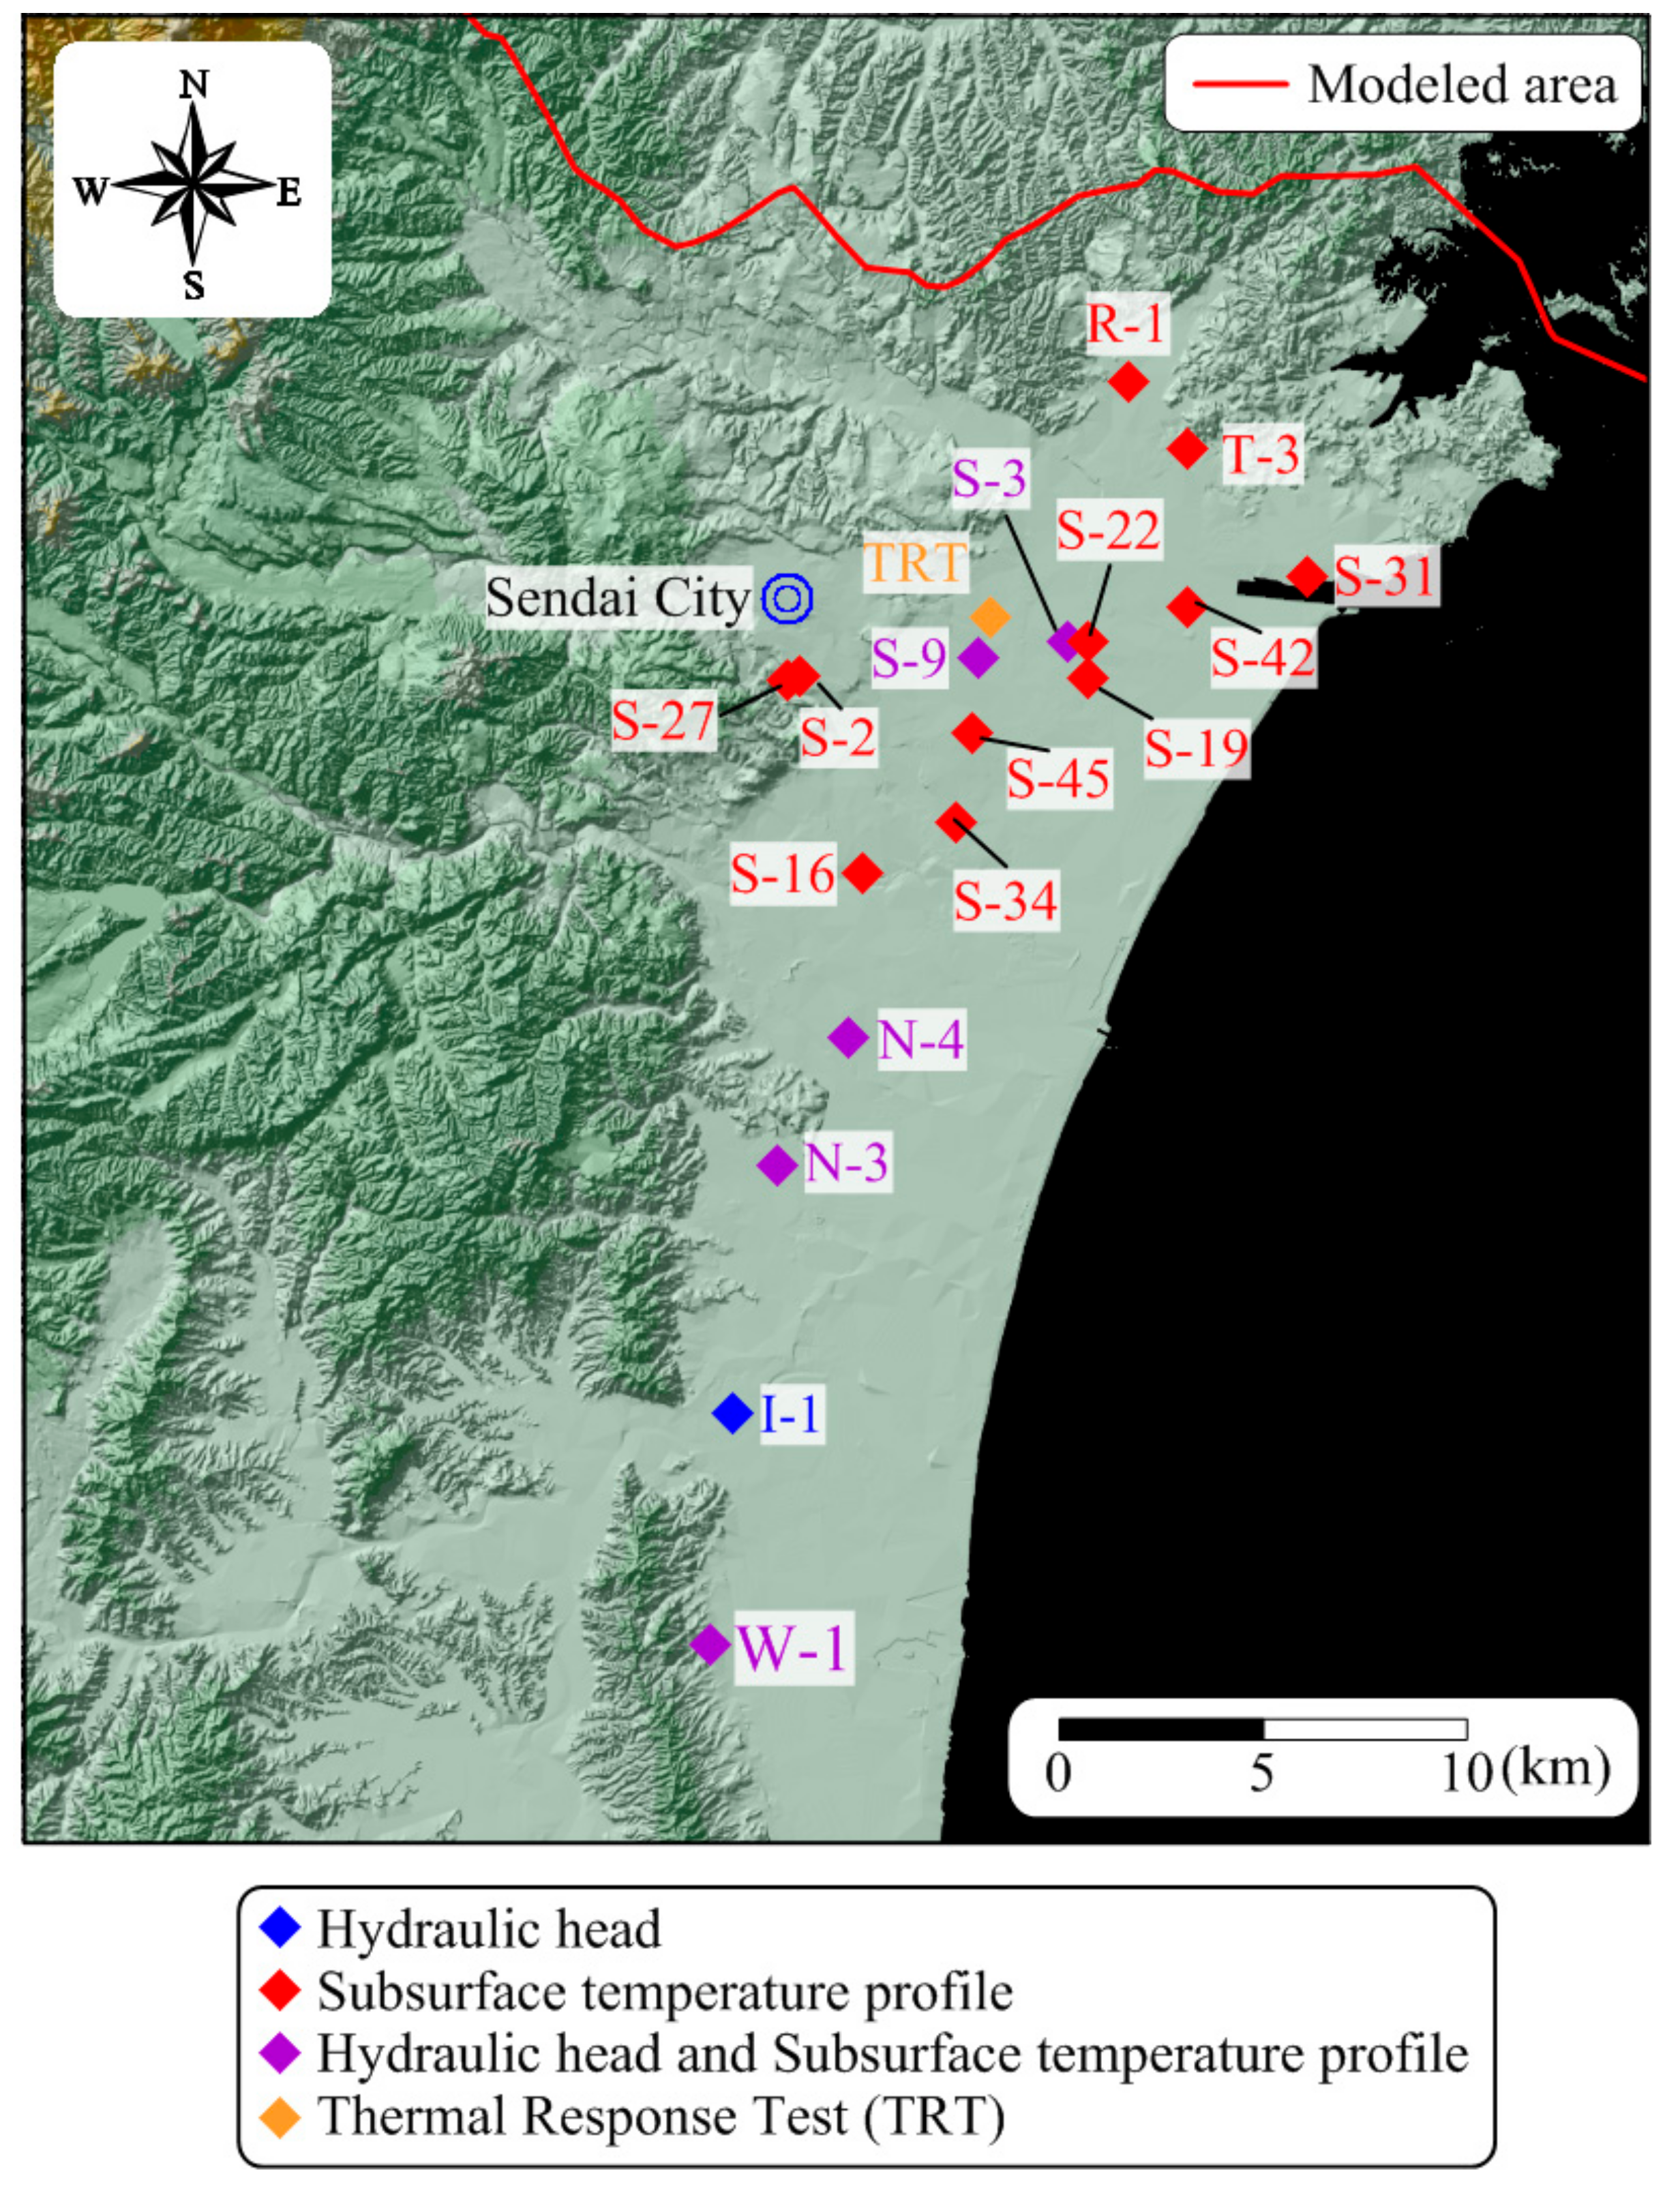
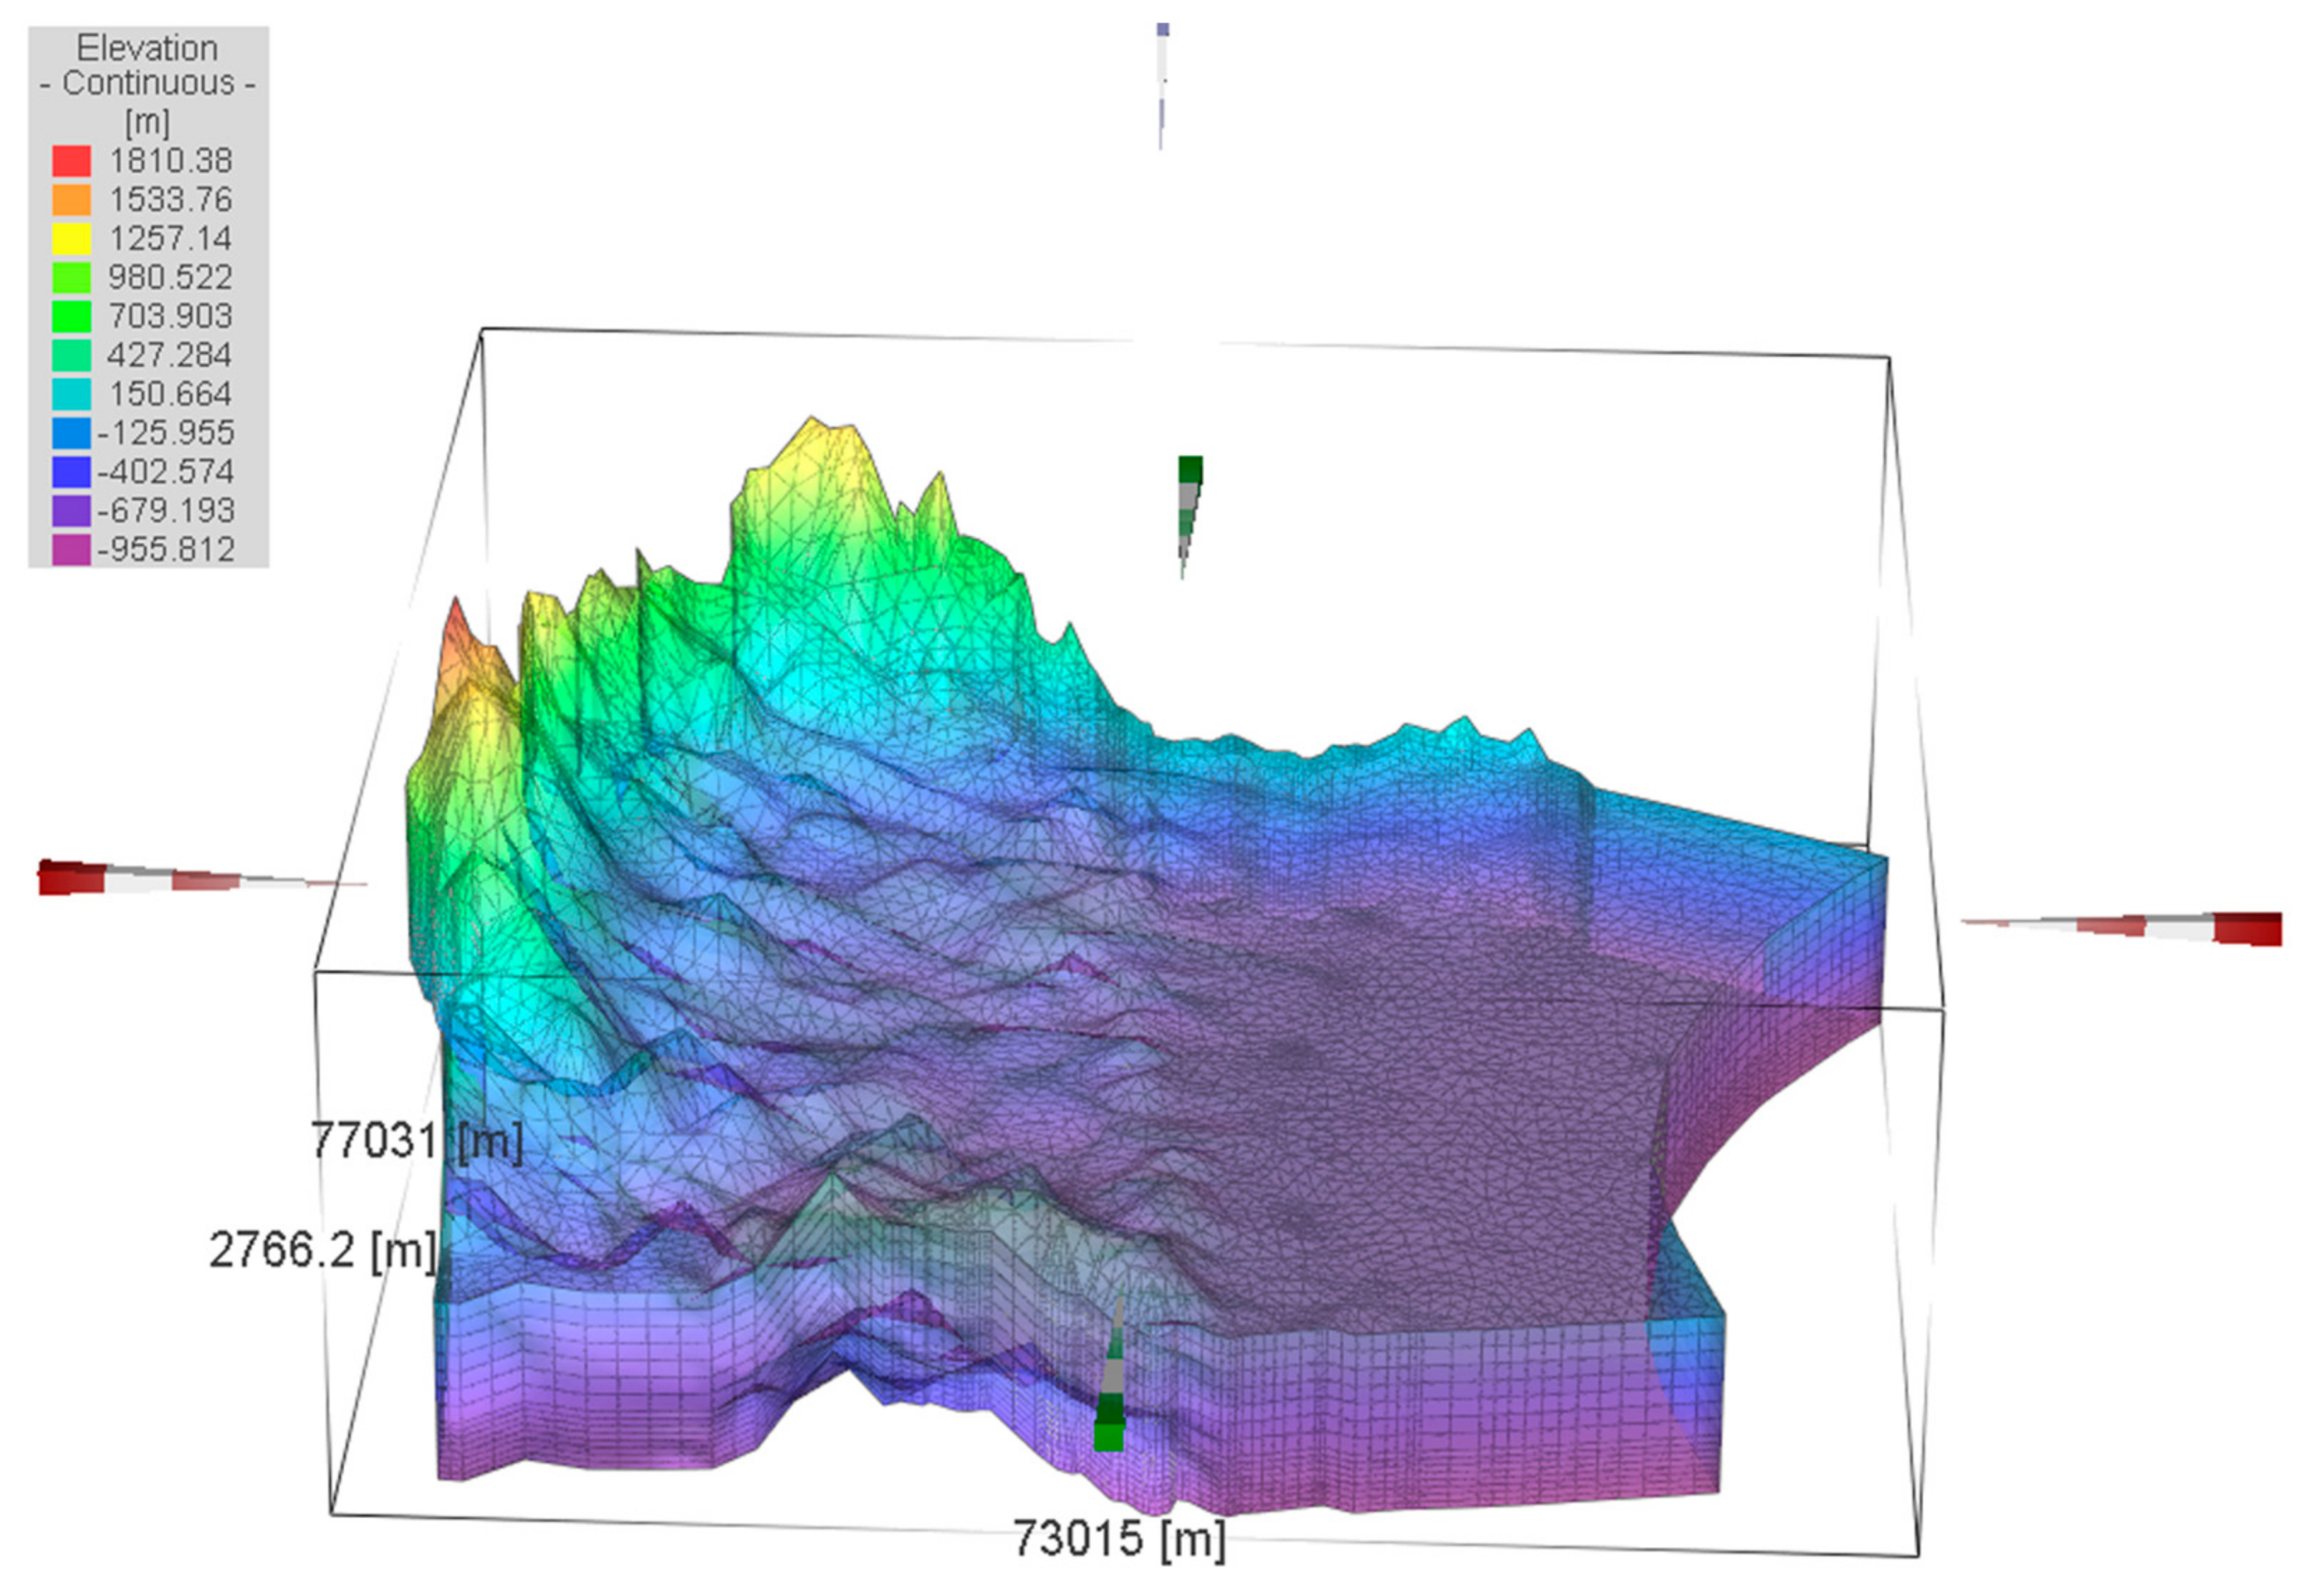
3. 3D Groundwater Flow and Heat Transport Model (Regional Model)
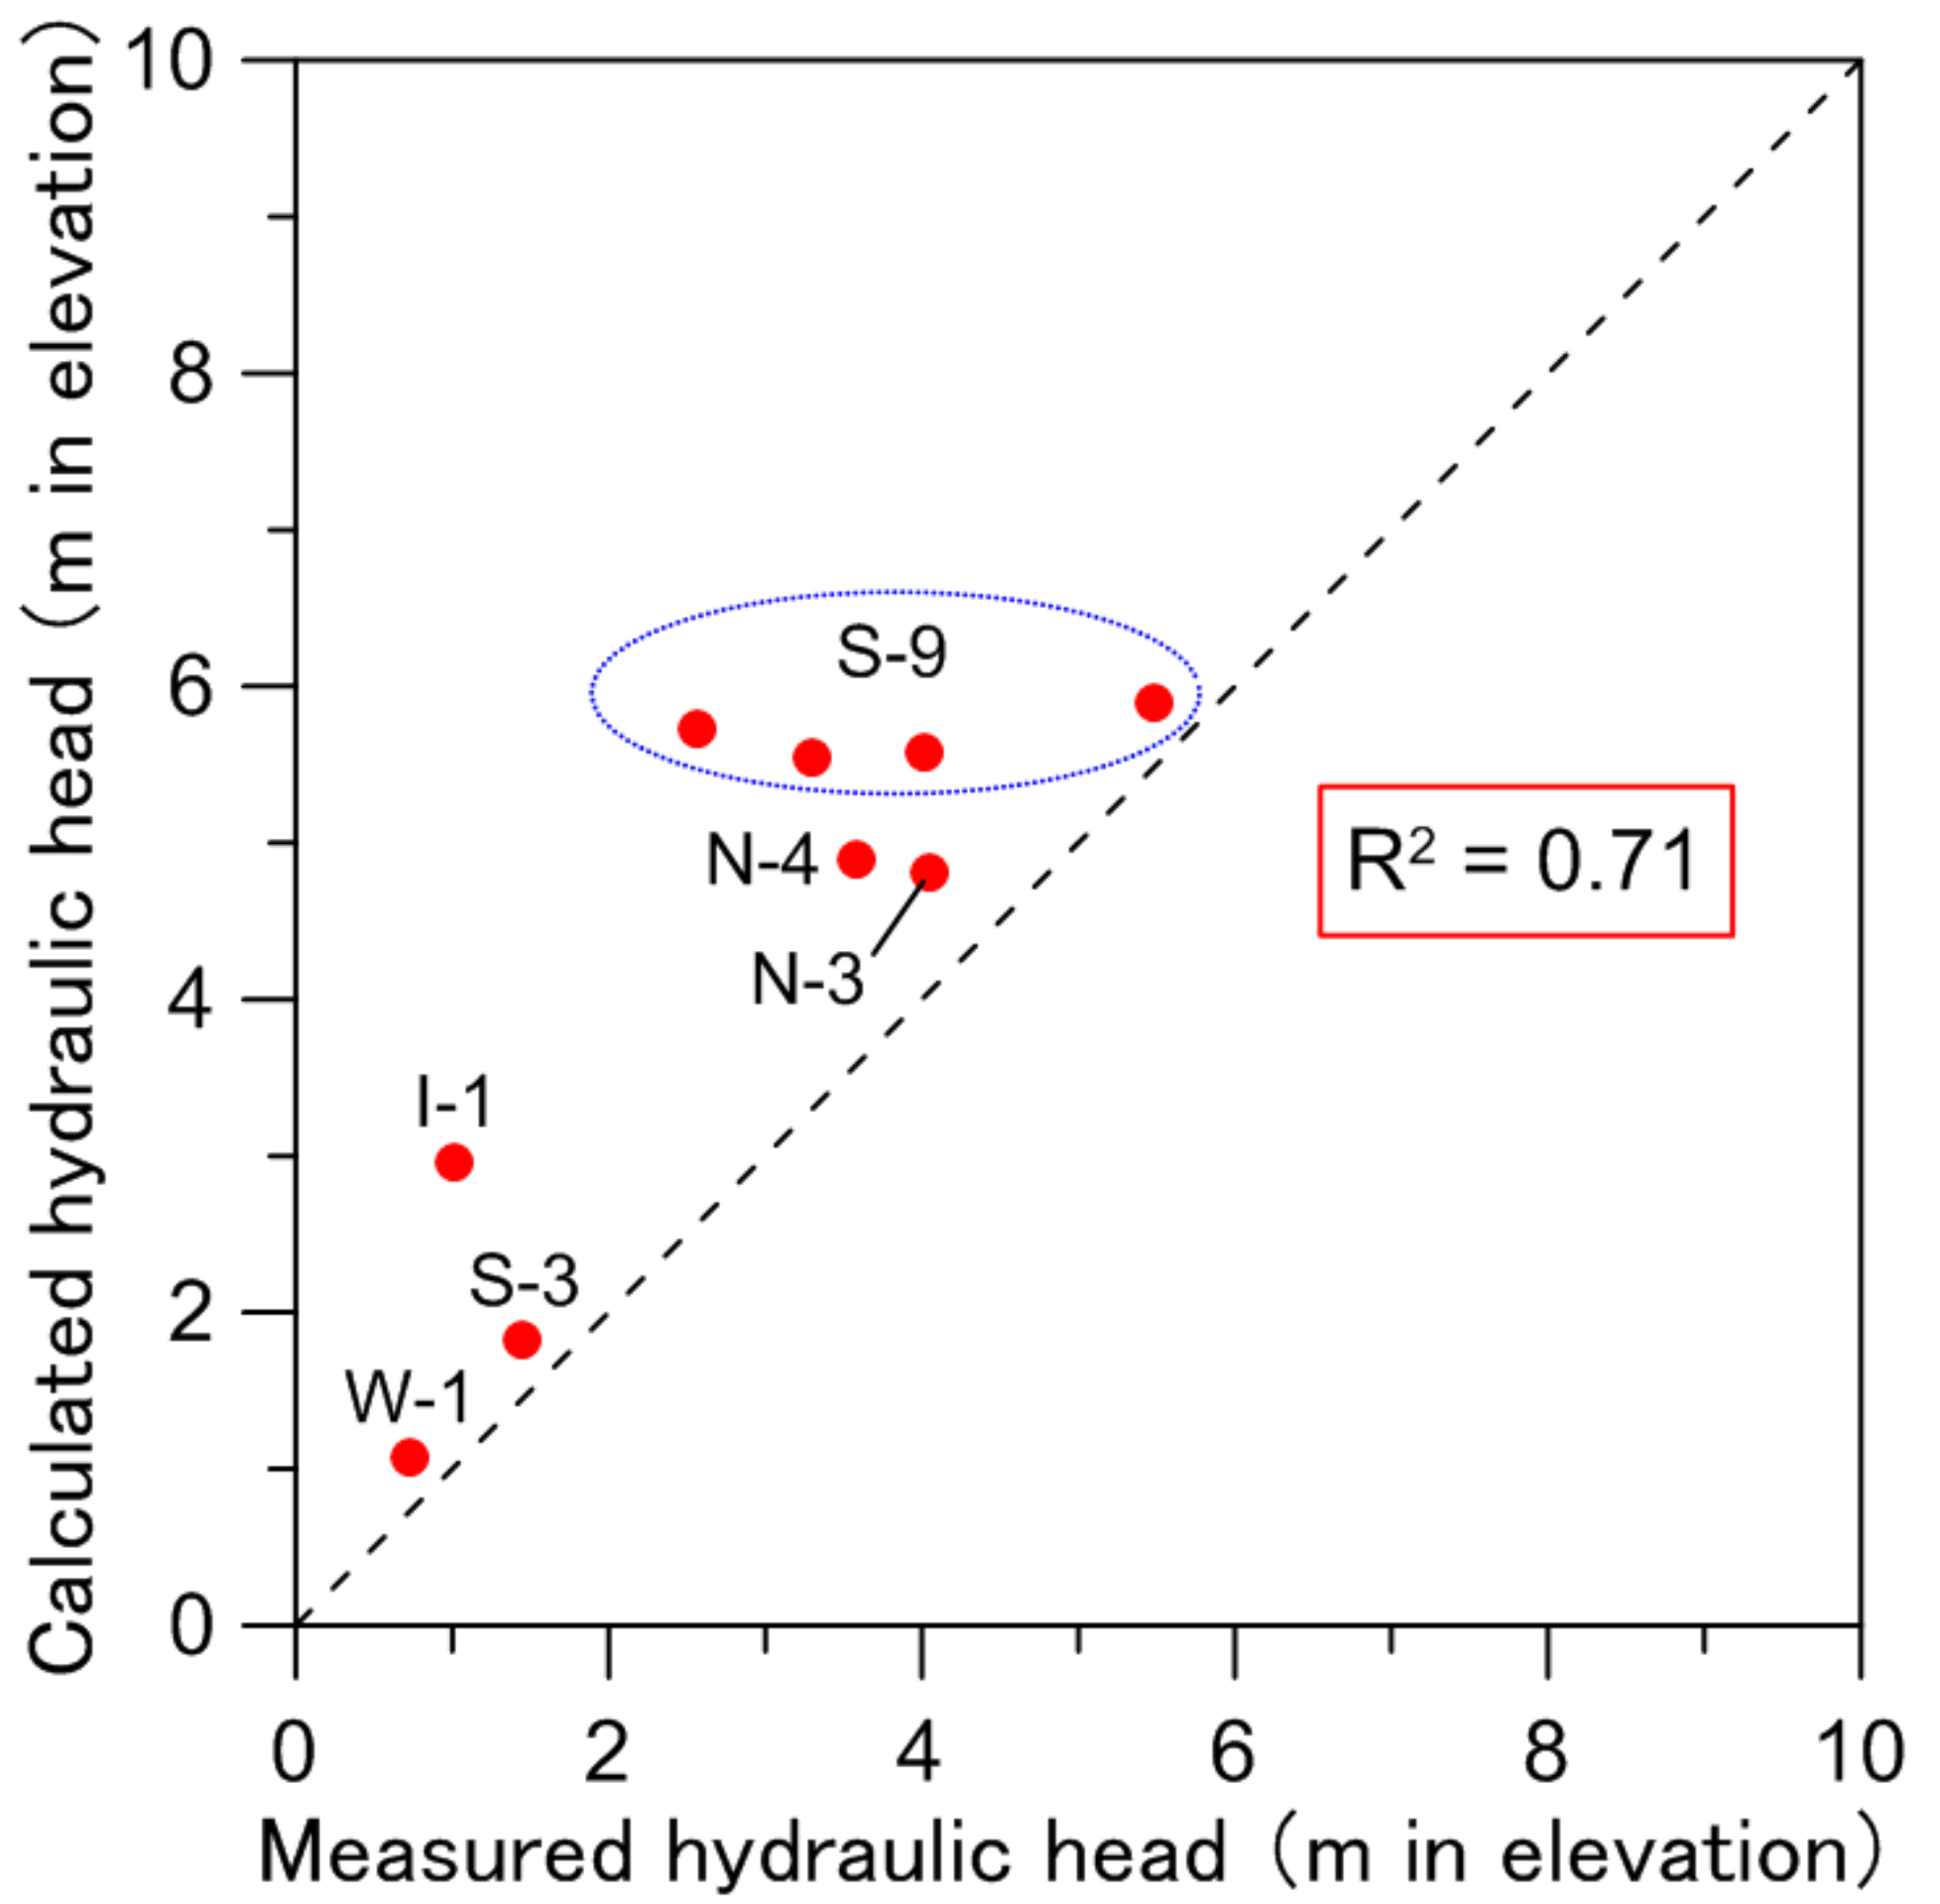
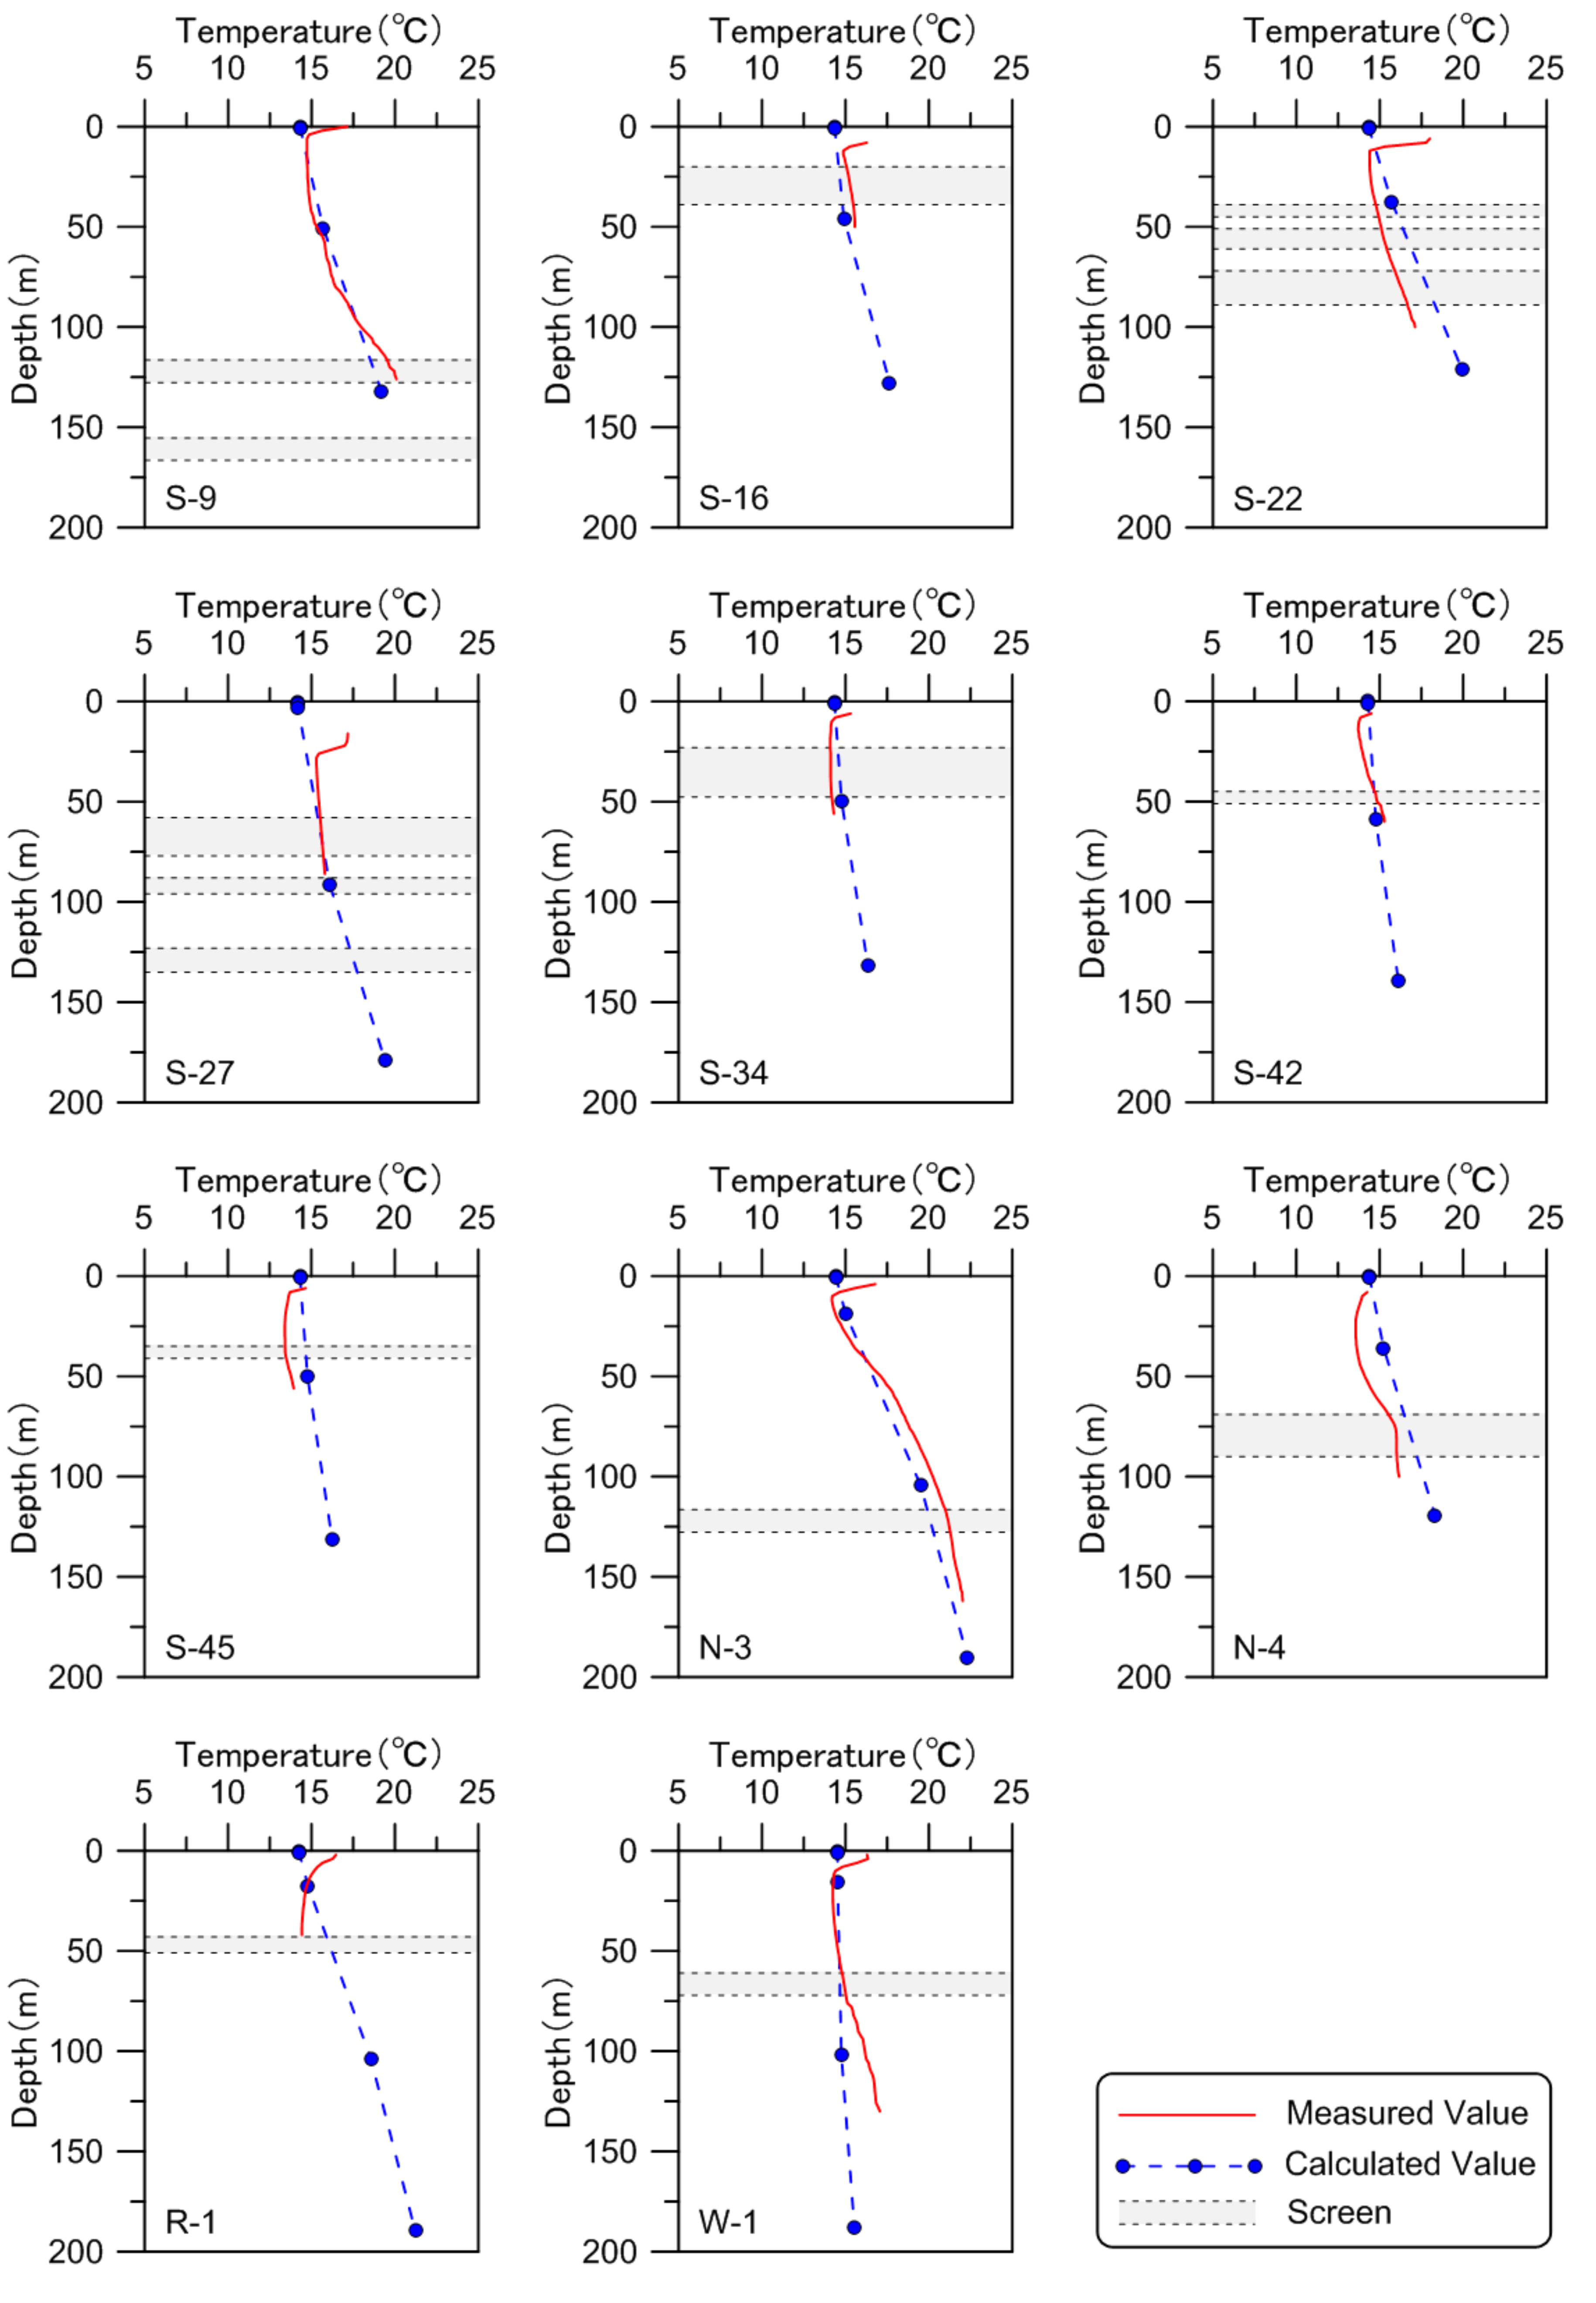
Validation of the Constructed Model
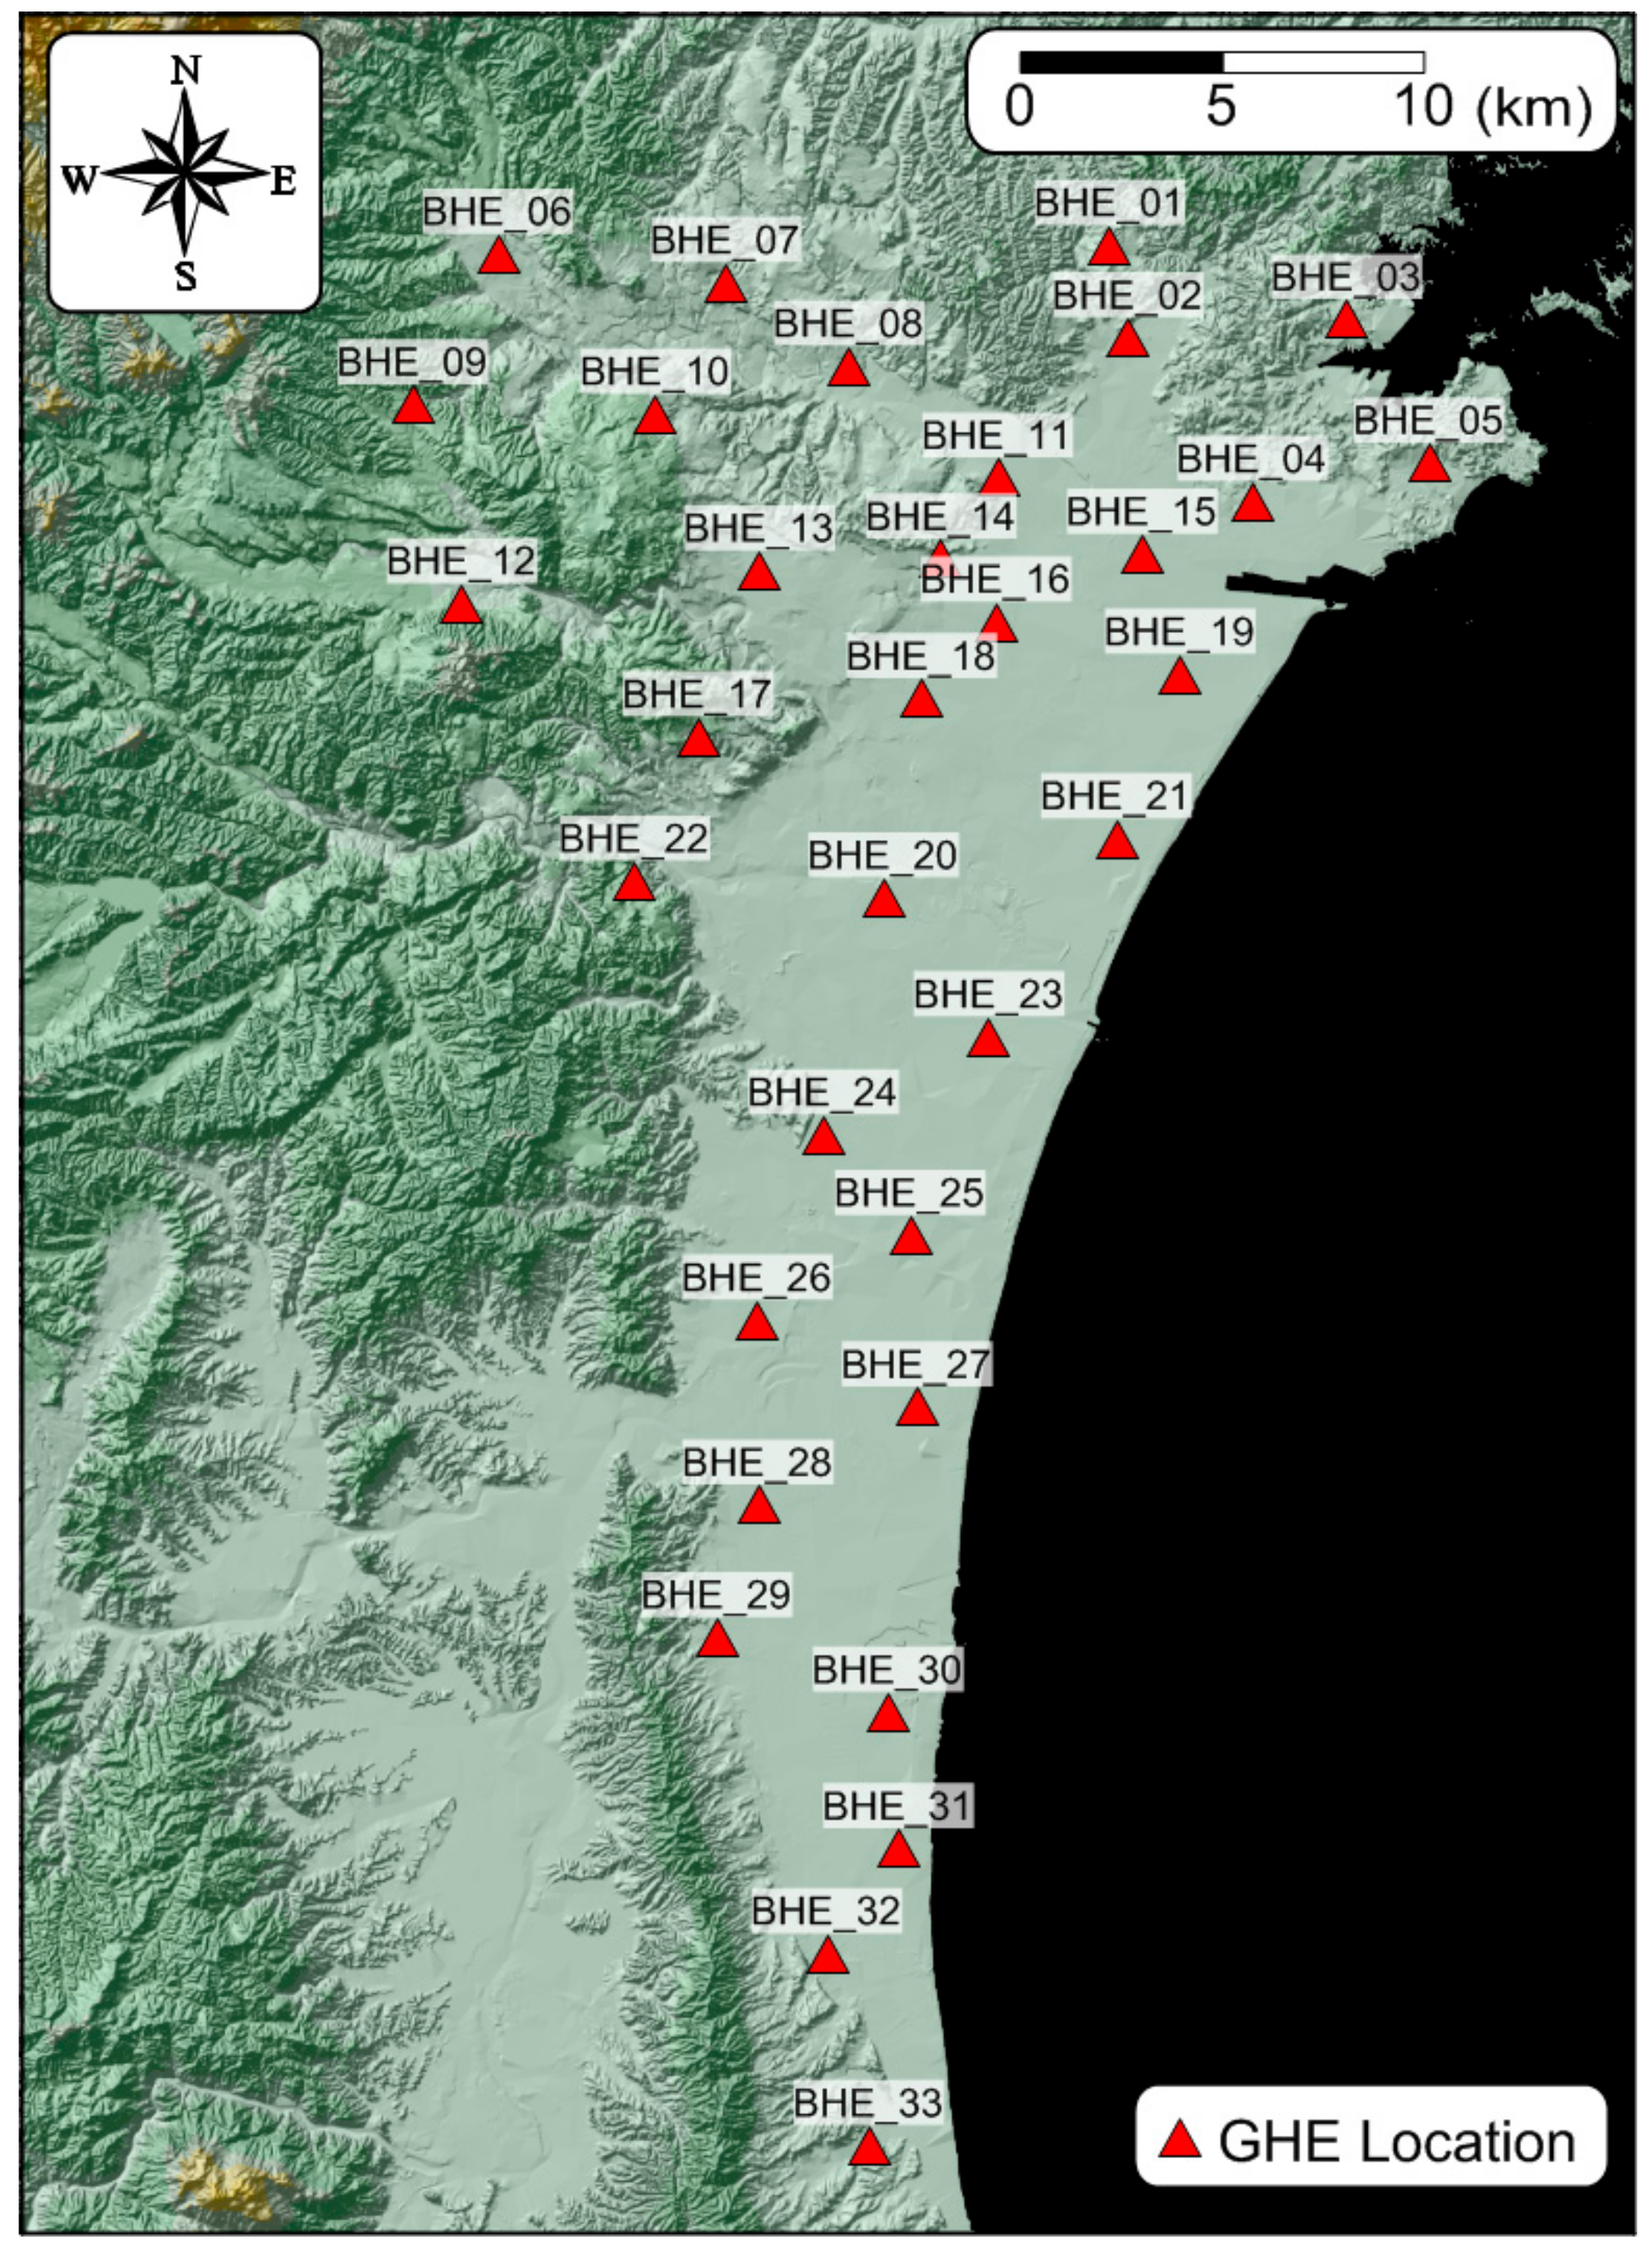
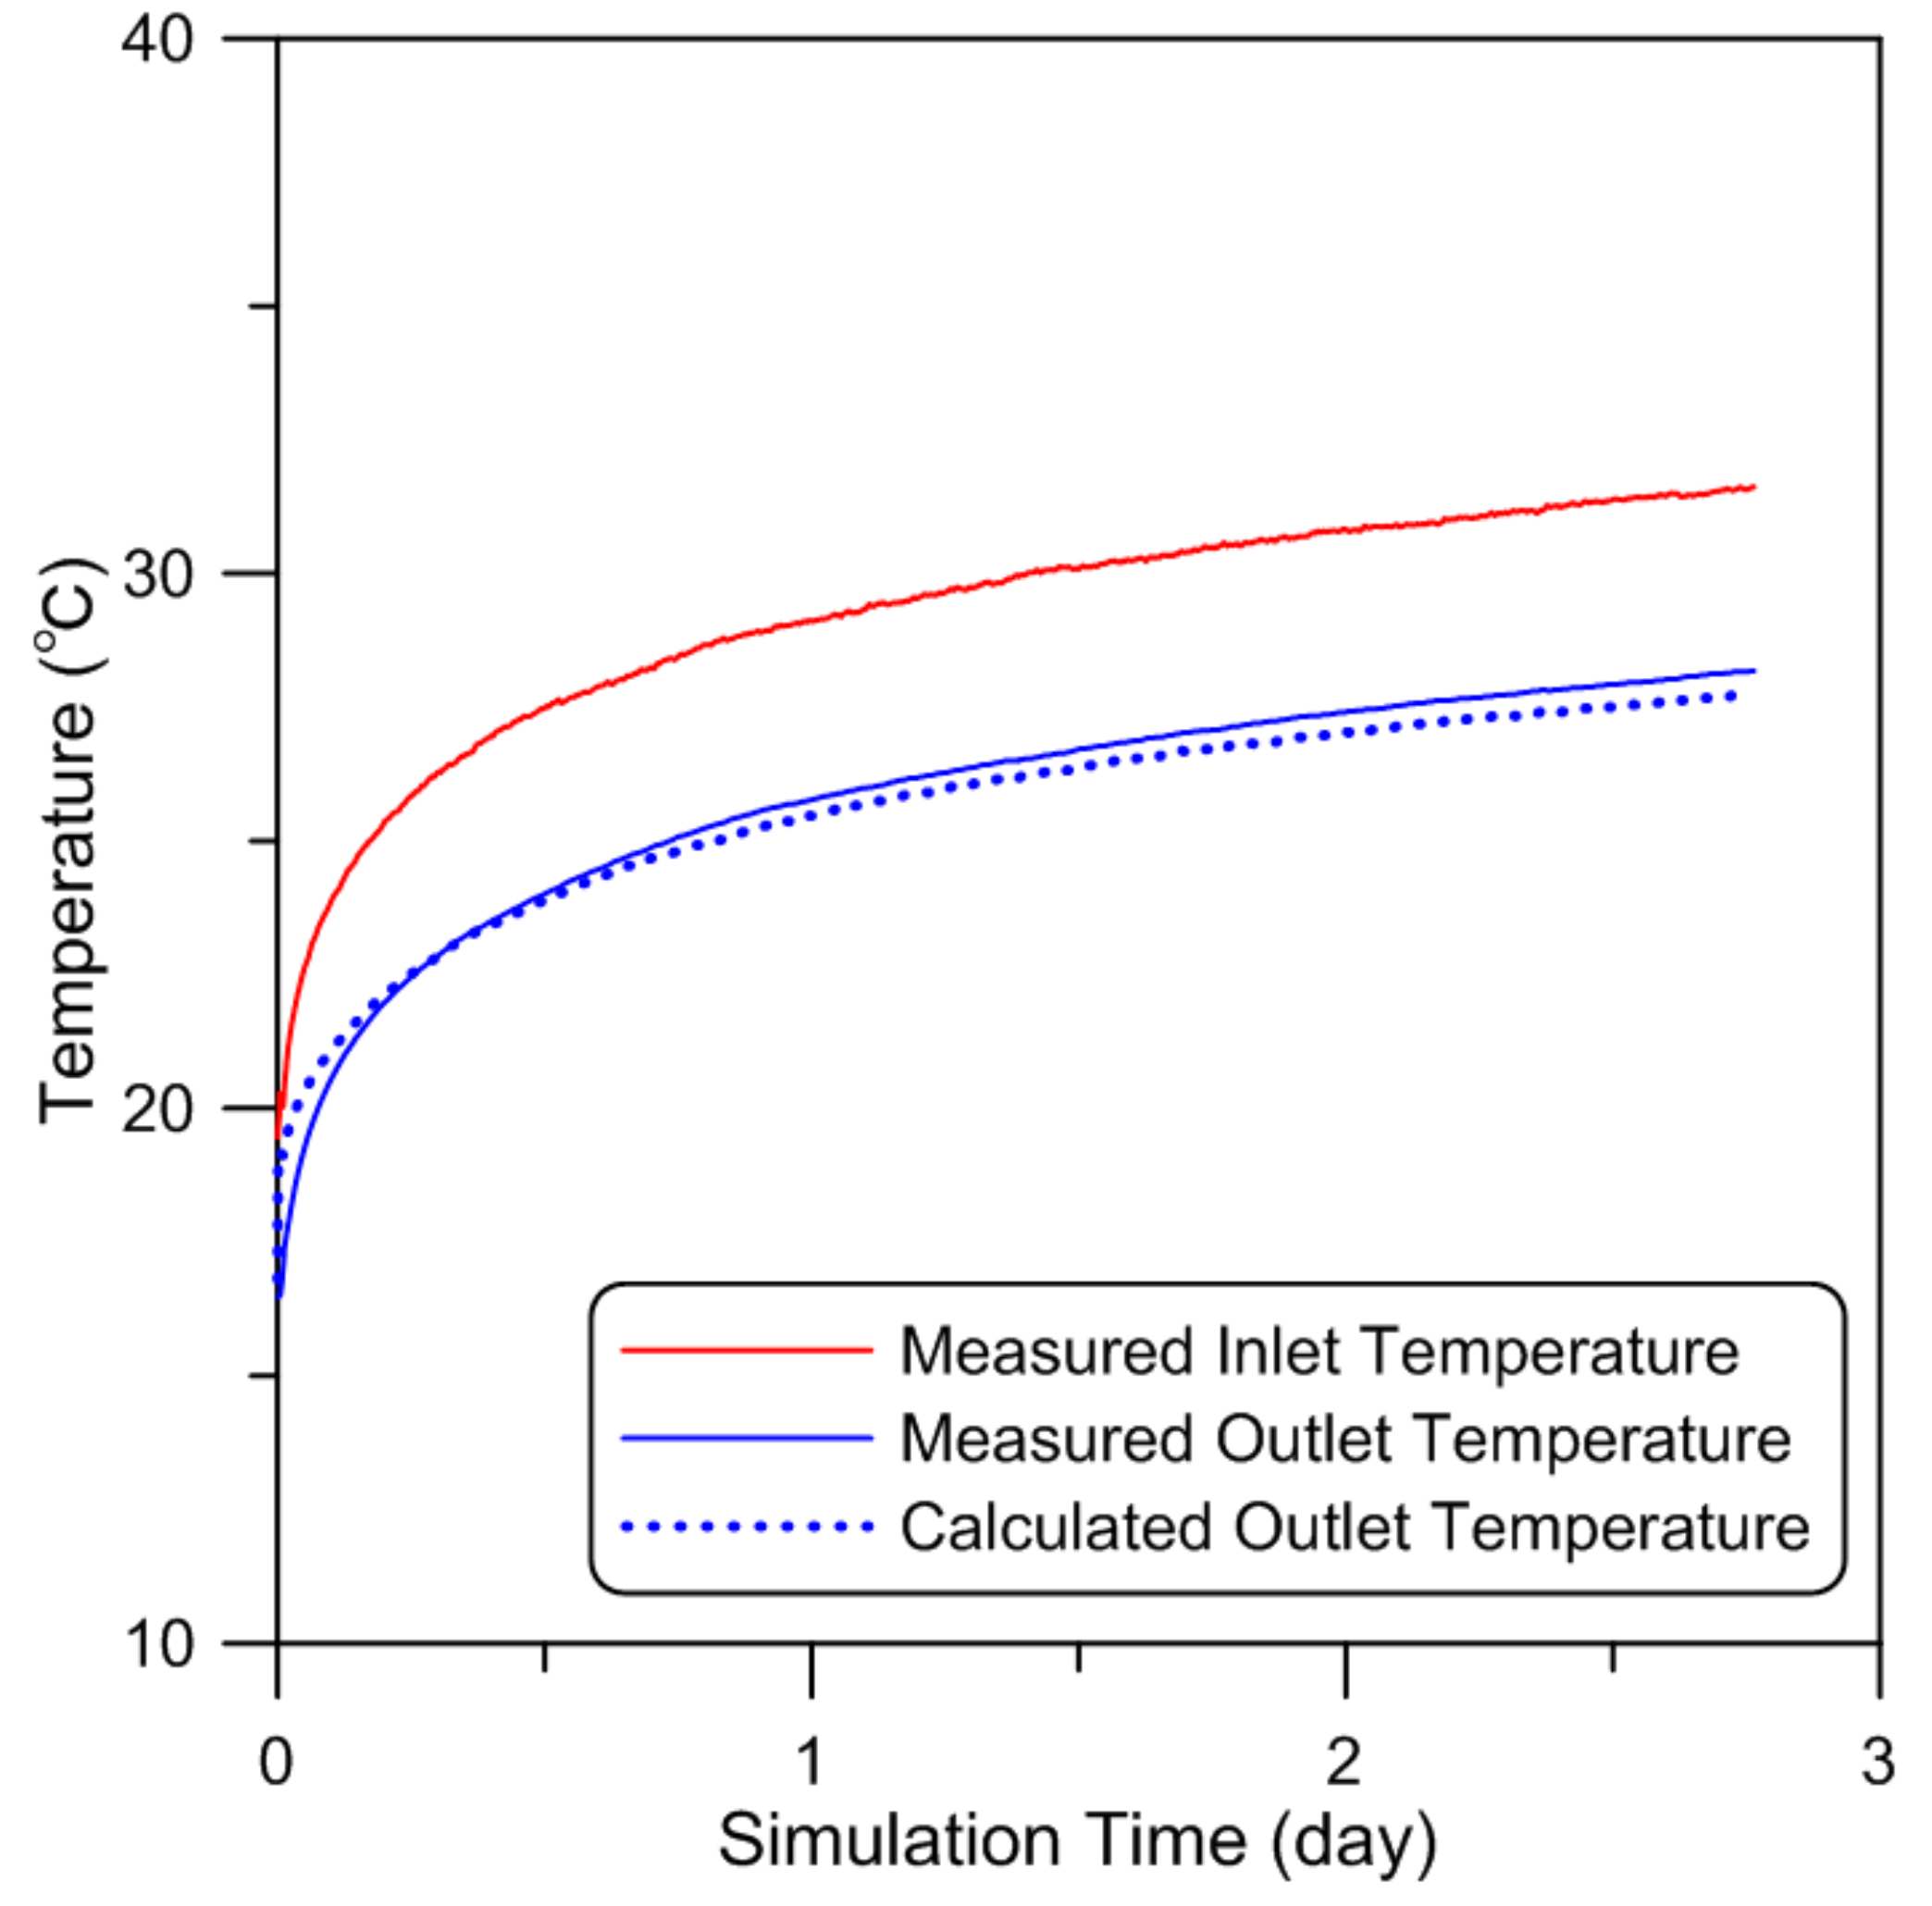
4. Ground Heat Exchanger Model
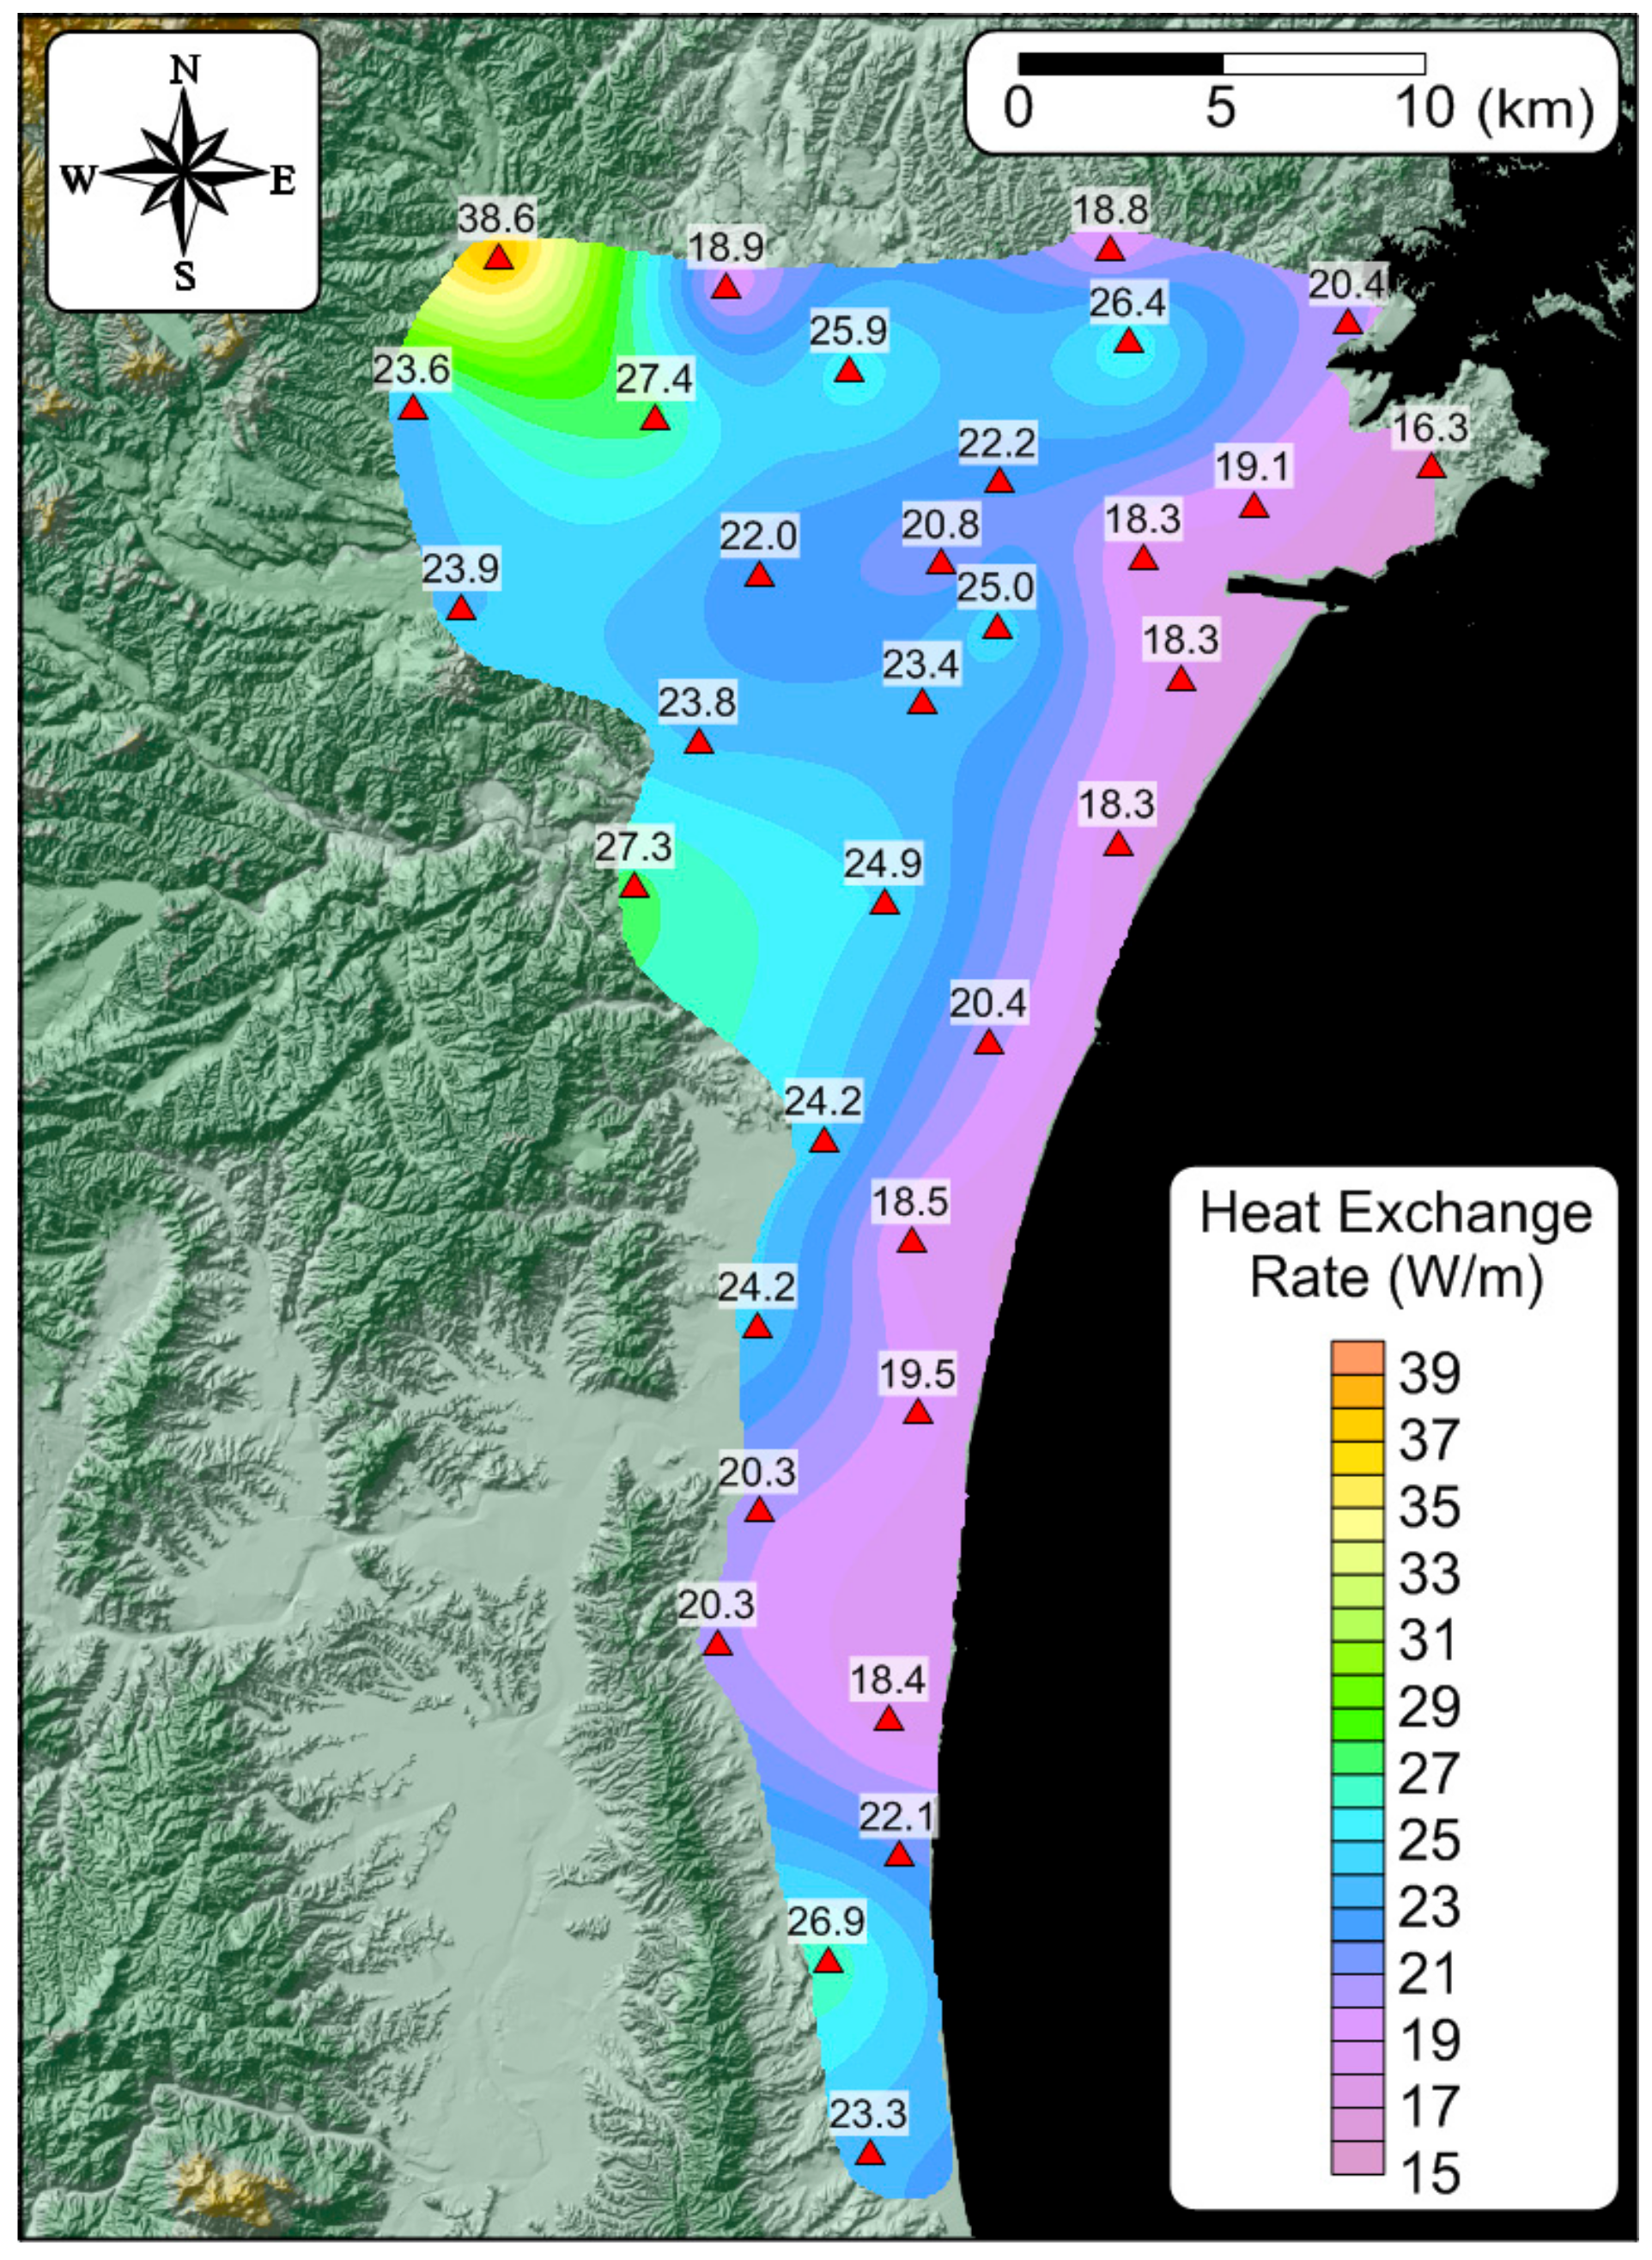
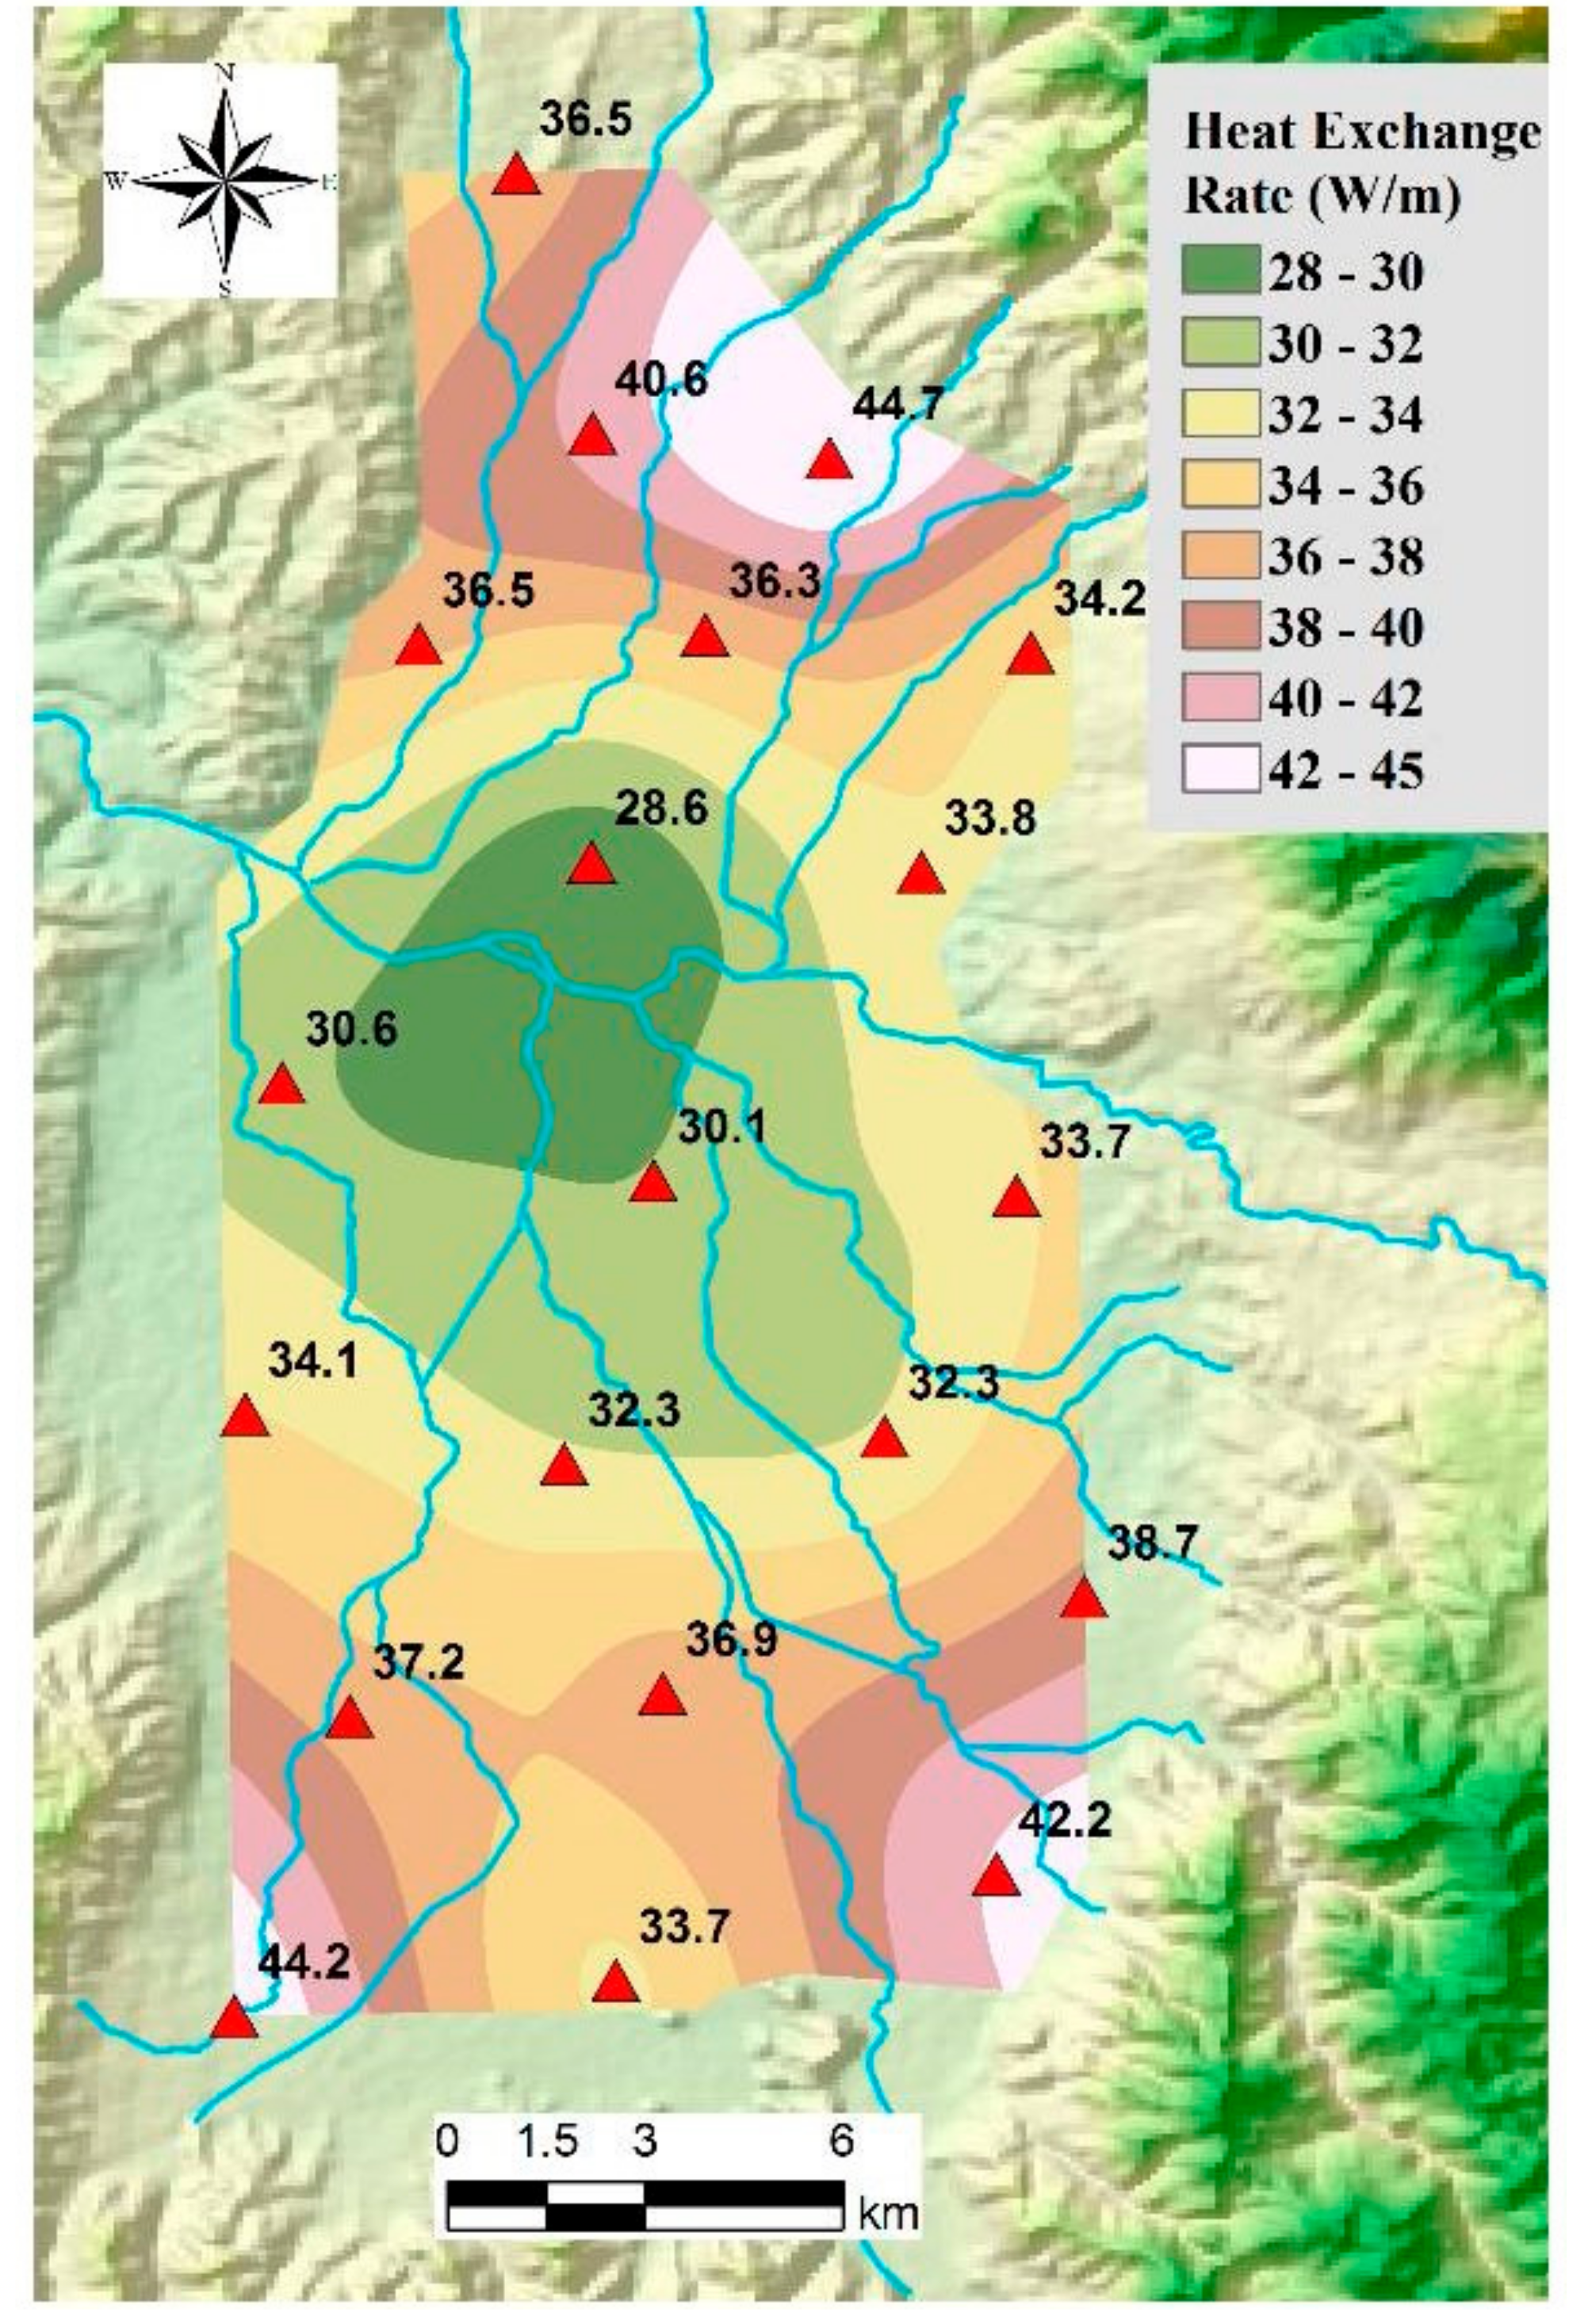
Distribution Map of Heat Exchange Rates
5. Comparison of Heat Exchange Rates in the Sendai Plain with in the Aizu Basin
6. Discussion
7. Conclusions
- (1)
- The average heat exchange rate for the 33 constructed BHEs for the Sendai Plain was 22.5 W/m. In this analysis, the operating scenario of the GSHP system was set as 120 d of space heating per year from December to March, assuming 24-h operation. The inlet temperature and flow rate of circulation fluid were set as 5 °C and 20 L/min, respectively.
- (2)
- The Sendai Plain has lower heat exchange rates than the Aizu Basin. In both areas, upstream locations showed a higher heat exchange rate than downstream locations.
- (3)
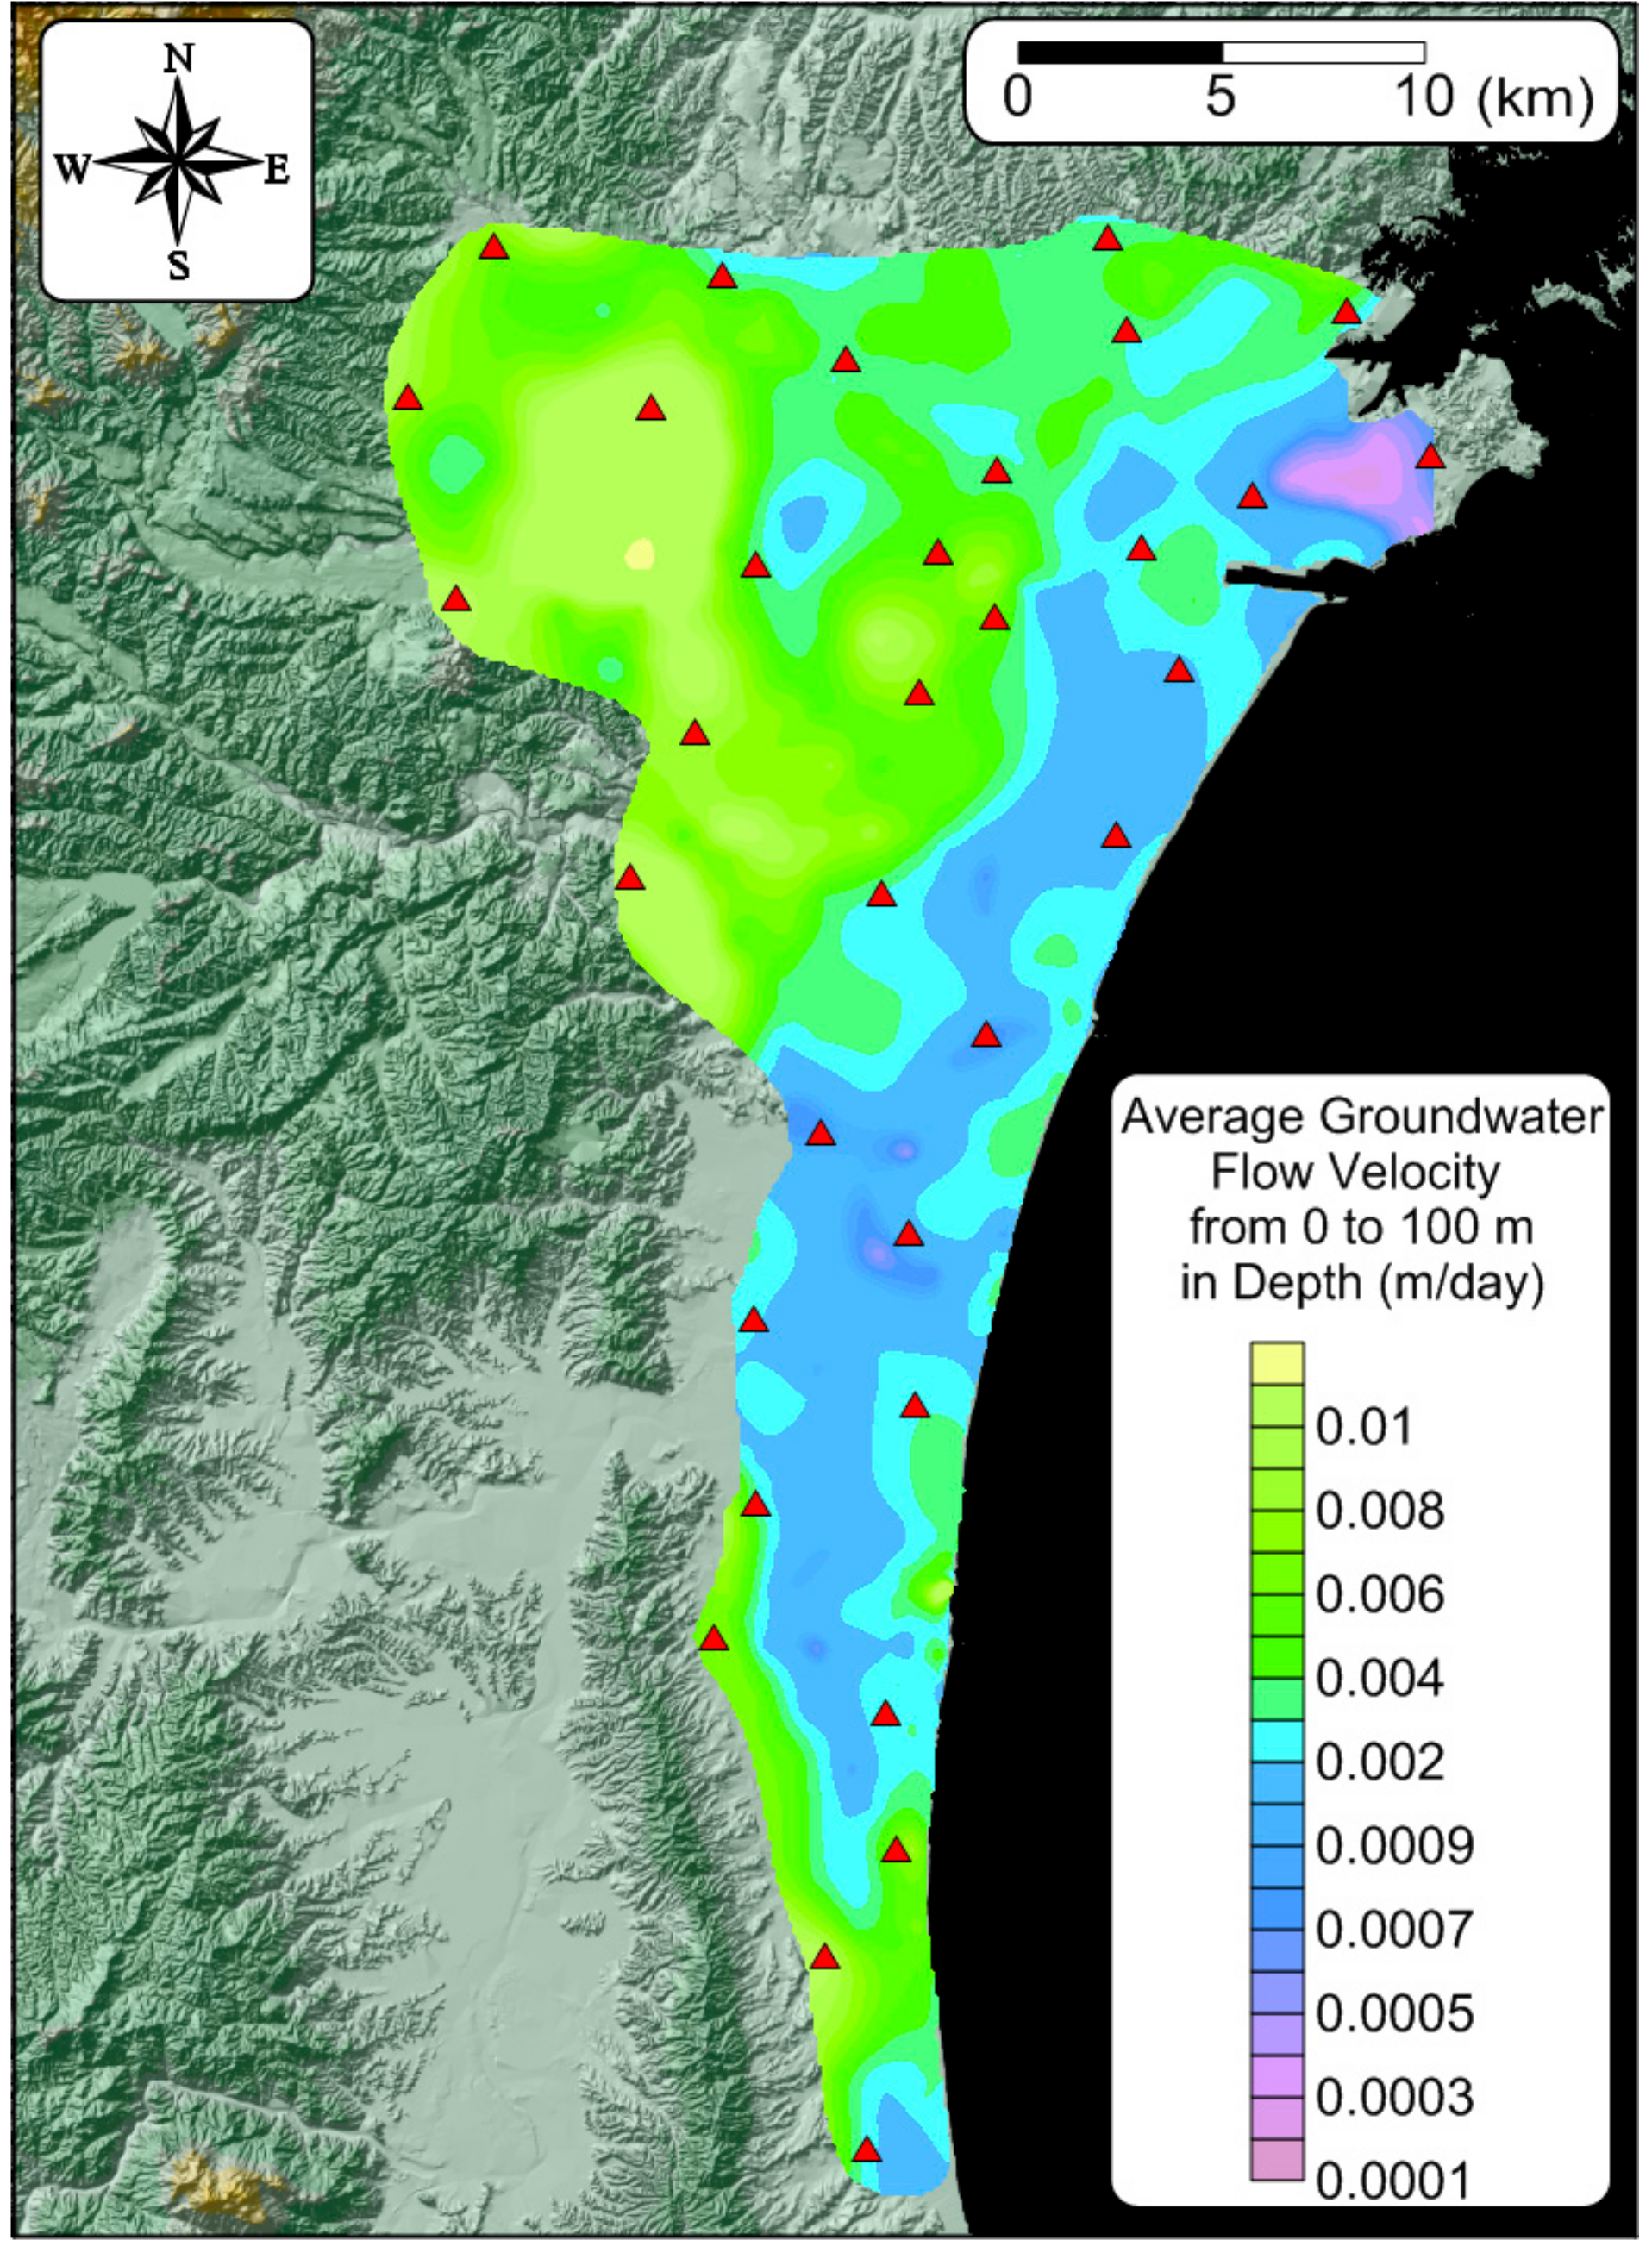
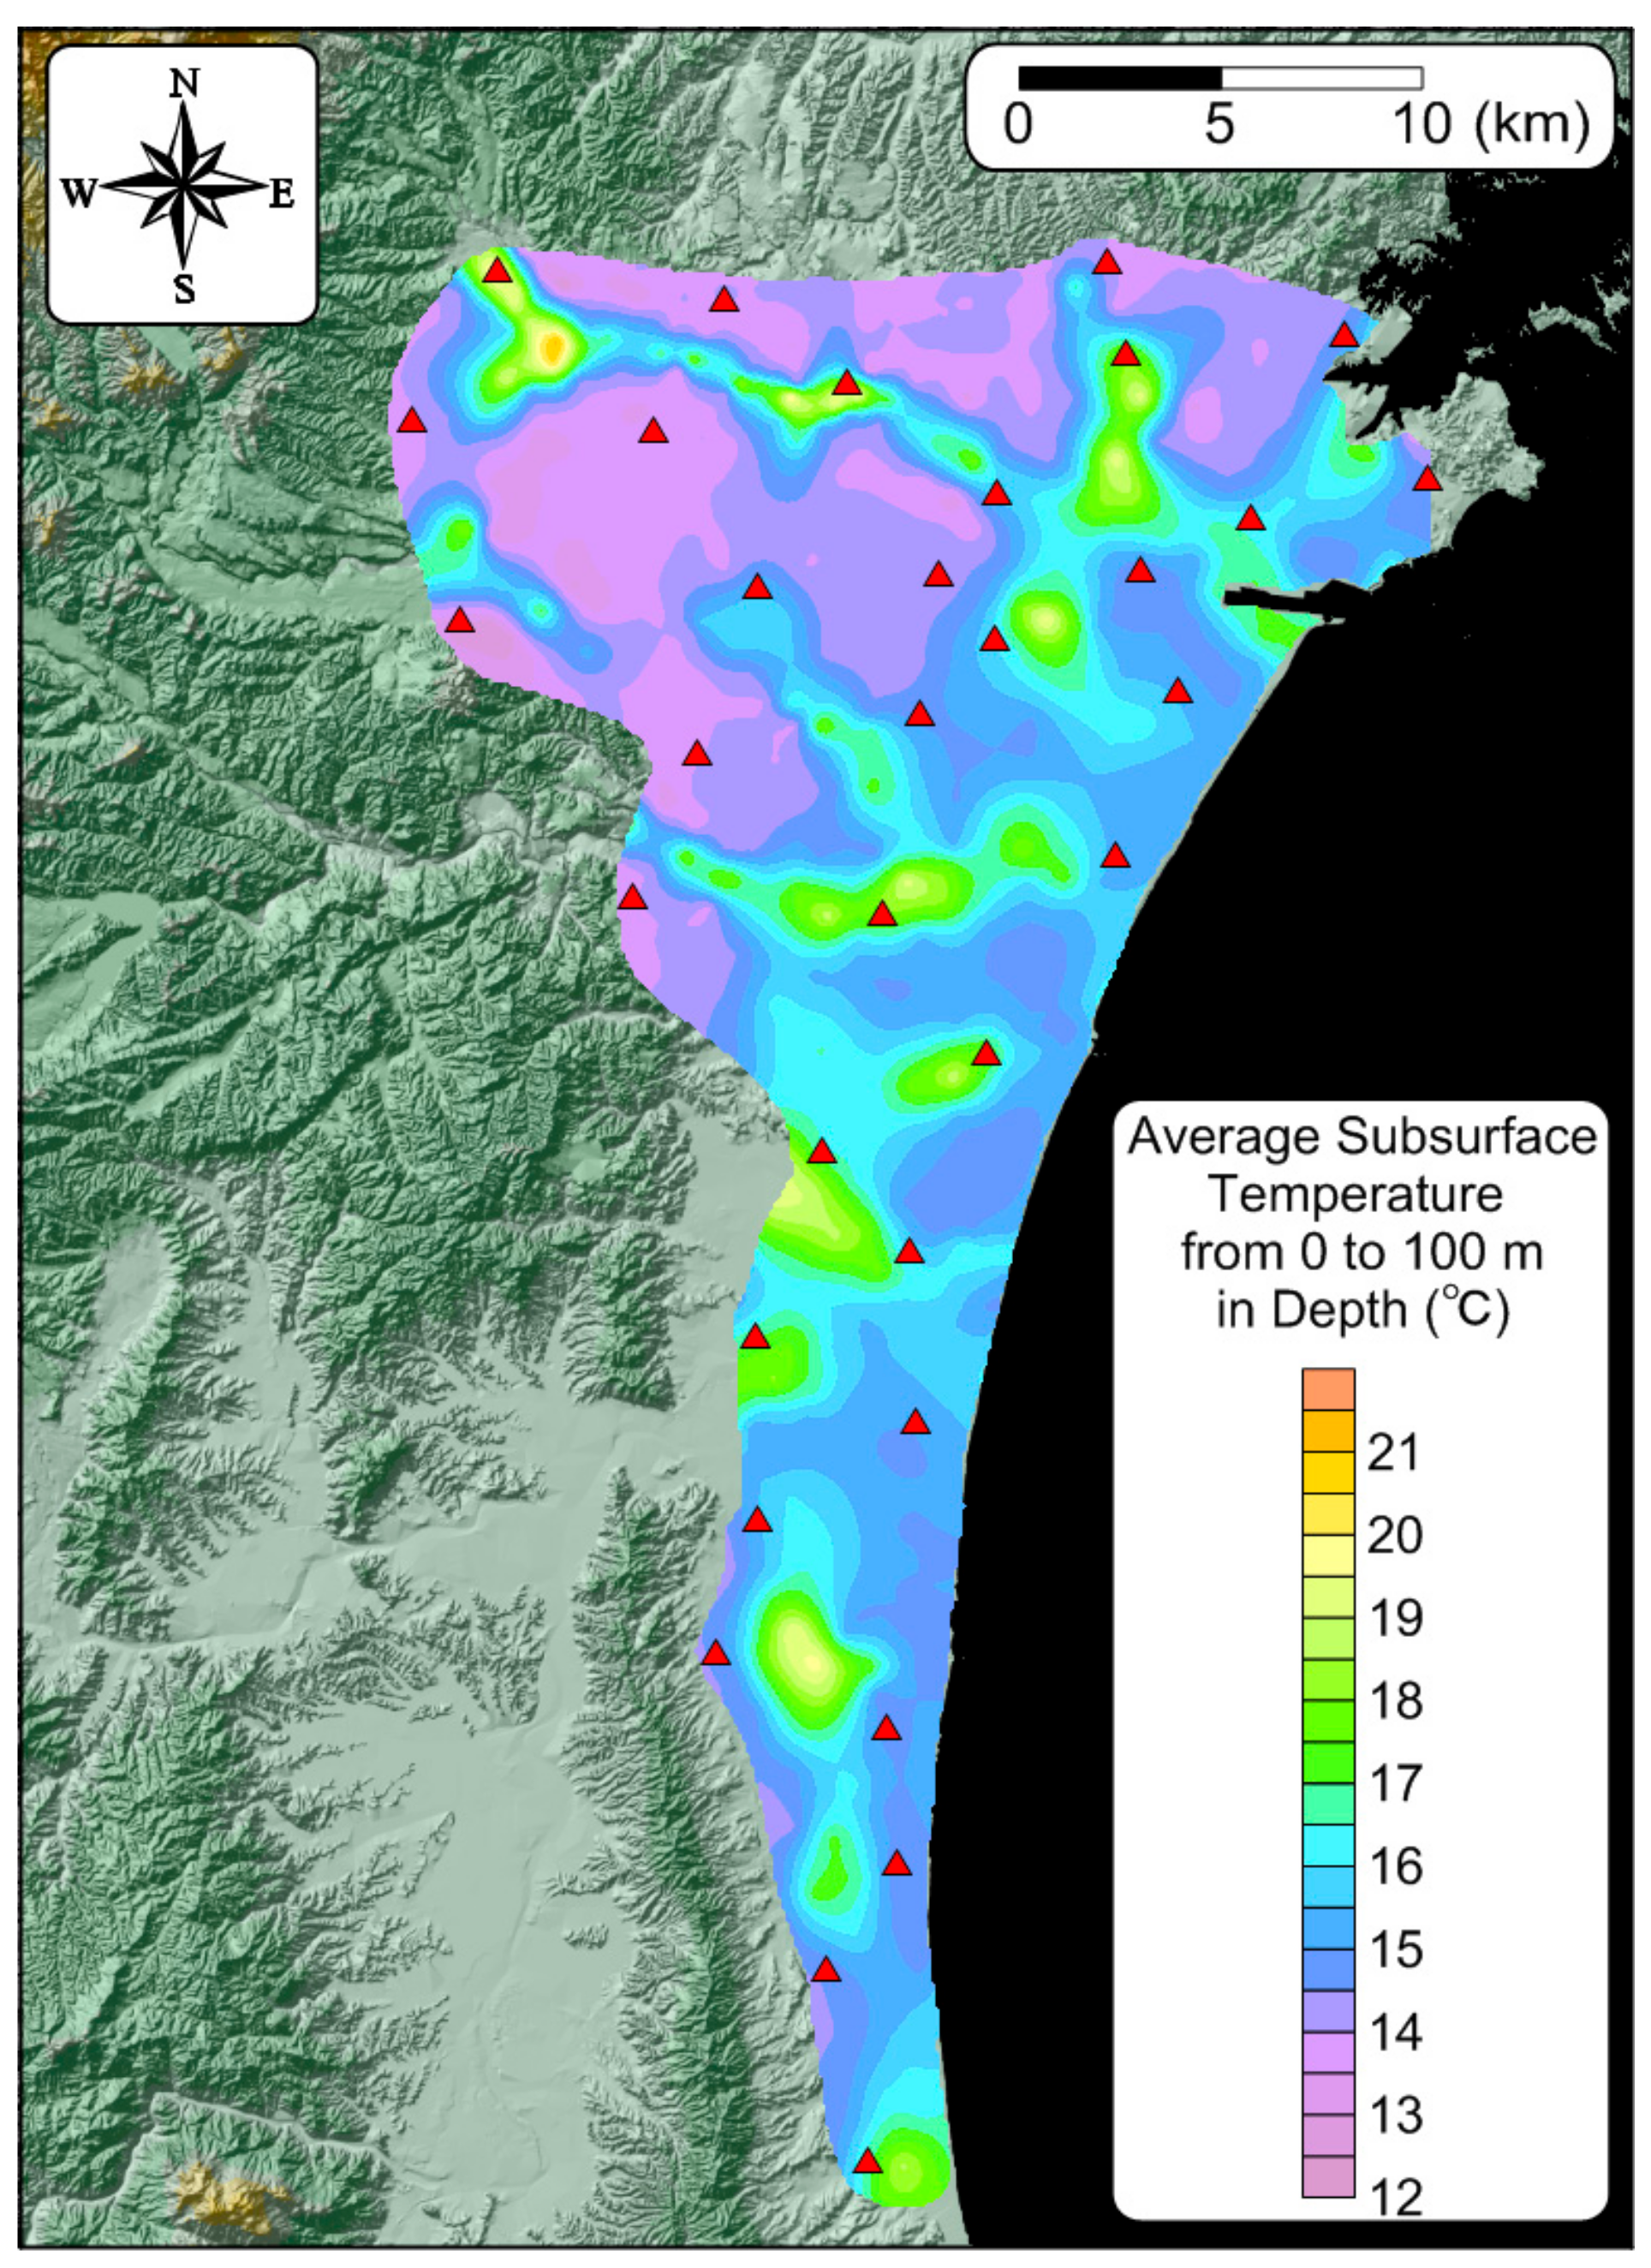
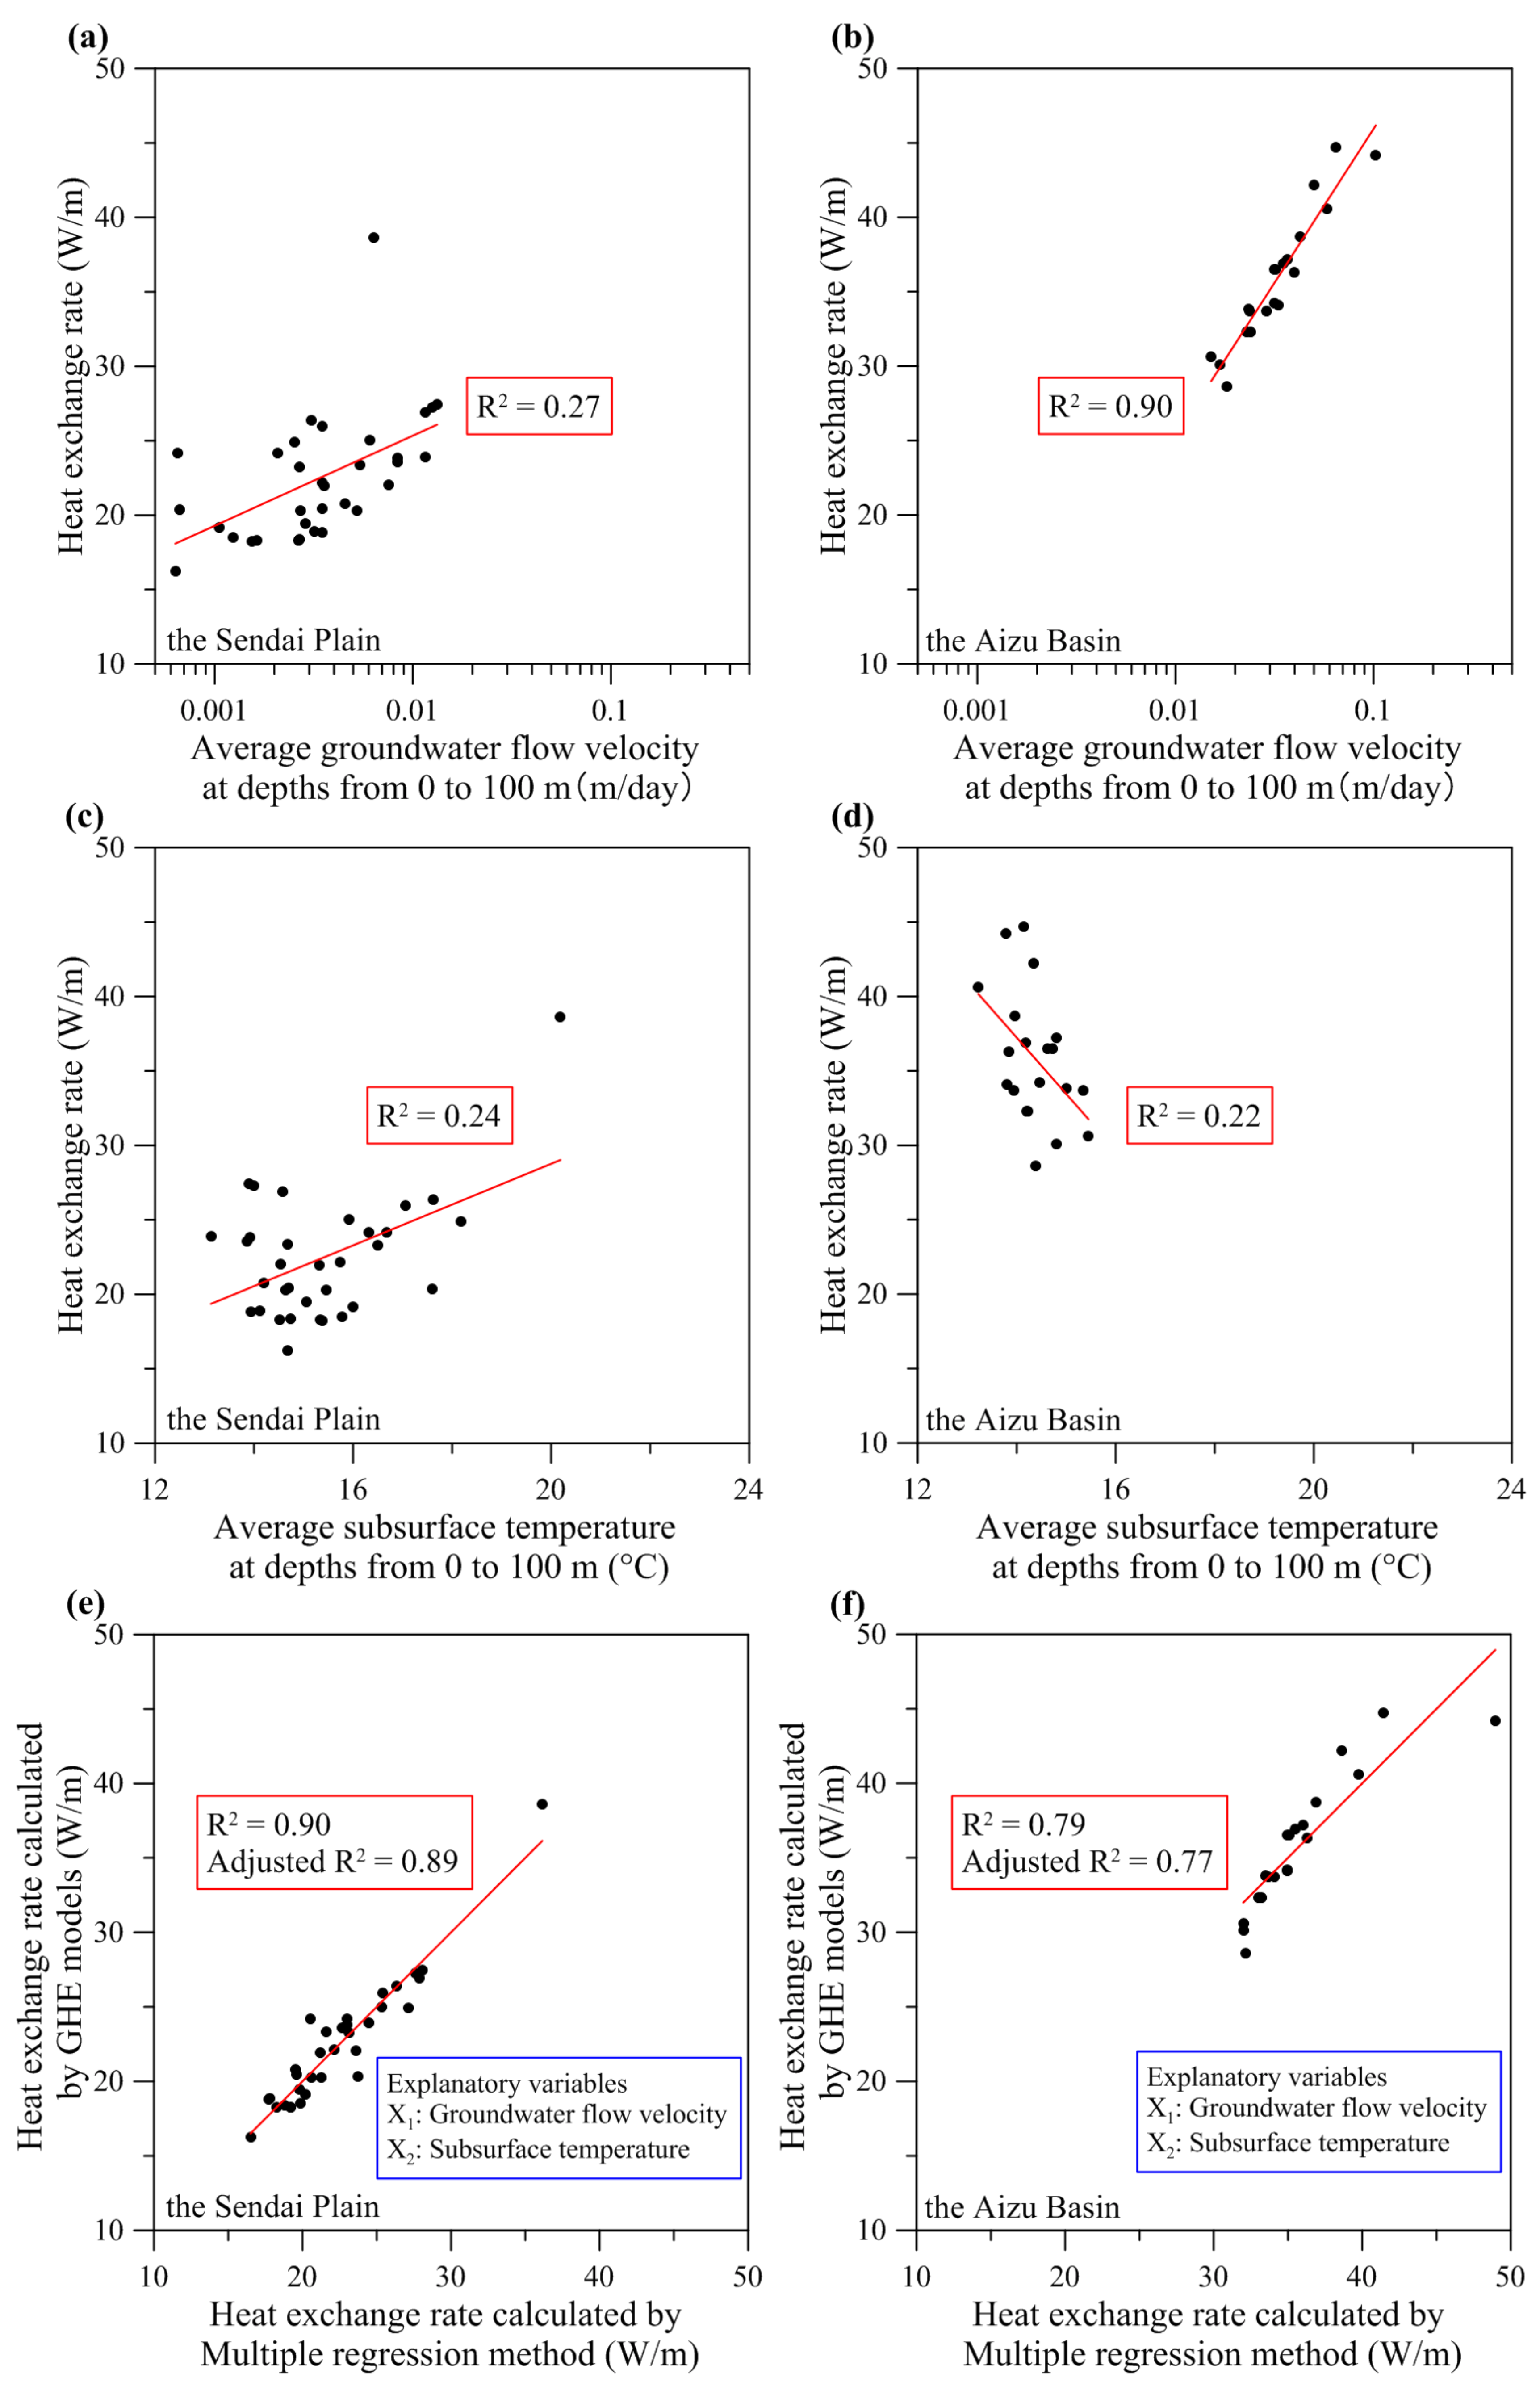
- Multiple regression analysis was conducted using heat exchange rate as the response variable and average groundwater flow velocity and average subsurface temperature profile at 0–100 m depth as the explanatory variables. The heat exchange rate of the Sendai Plain, whose Péclet number ranges from 3.5 × 10⁻³ to 7.3 × 10⁻², may be affected by not only groundwater flow velocity but also by subsurface temperature. The heat exchange rate of the Aizu Basin, whose Péclet number ranges from 8.5 × 10⁻² to 5.8 × 10⁻¹, may be affected by groundwater flow velocity alone.
- (4)
- In terms of inclination of slope, the upstream area is expected to have a higher heat exchange rate, which is more suitable for GSHP system installation, which can utilize the groundwater flow, compared to the downstream area in both the plain and the basin. Similarly, inland basins are expected to be more suitable for GSHP system installation utilizing groundwater flow velocity than the coastal plains. The area along the coast is expected to be more amenable to the use of ATES systems.
Author Contributions
Acknowledgments
Conflicts of Interest
Nomenclature
| 3D | Three-dimensional |
| ATES | Aquifer thermal energy storage |
| BHE | Borehole heat exchanger |
| GHE | Ground heat exchanger |
| GSHP | Ground source heat pump |
| TRT | Thermal response test |
| Specific storage [L−1] | |
| Hydraulic head [L] | |
| Time [T] | |
| Darcy velocity [LT−1] | |
| Bulk source/sink term [T−1] | |
| Correction sink/source term of extended Oberbeck-Boussinesq approximation [T−1] | |
| Tensor of hydraulic conductivity [LT−1] | |
| Viscosity relation function [-] | |
| Dimensionless buoyancy coefficient [-] | |
| Porosity [-] | |
| Density of fluid [ML−3] | |
| Specific heat capacity of fluid [L2T−2K−1] | |
| Density of solid [ML−3] | |
| Specific heat capacity of solid [L2T−2K−1] | |
| Temperature [K] | |
| Tensor of hydrodynamic thermodispersion [MLT−3K−1] | |
| Specific heat sink/source function of wells [ML−1T−3] | |
| Reference temperature [K] | |
| Isotropic thermal conductivity of fluid [MLT−3K−1] | |
| Isotropic thermal conductivity of solid [MLT−3K−1] | |
| Tensor of mechanical dispersion [L2T−1] | |
| Coefficient of thermal conductivity of fluid [MLT−3K−1] | |
| Dirac delta function [-] | |
| Coefficient of thermal conductivity of solid [MLT−3K−1] | |
| Transverse dispersivity [L] | |
| Longitudinal dispersivity [L] | |
| Modified heat source/sink term without well function [L2T−3] | |
| Modified heat source/sink term of well function [L2T−3] | |
| Y | Heat exchange rate (response variable) |
| X1 | Average groundwater flow velocity at 0–100 m depth (explanatory variable) |
| X2 | Average subsurface temperature at 0–100 m depth (explanatory variable) |
| a, b, c | Coefficients |
| Pe | Péclet number [-] |
| ν | Average groundwater flow velocity at 0–100 m depth [LT−1] |
| L | Representative length [L] |
| α | Average thermal diffusivity at 0–100 m depth [L2T−1] |
References
- Fujii, H.; Inatomi, T.; Itoi, R.; Uchida, Y. Development of suitability maps for ground-coupled heat pump systems using groundwater and heat transport models. Geothermics 2007, 36, 459–472. [Google Scholar] [CrossRef]
- Omer, A.M. Ground-source heat pumps systems and applications. Renew. Sustain. Energy Rev. 2008, 12, 344–371. [Google Scholar] [CrossRef]
- Ozgener, O.; Hepbasli, A. Modeling and performance evaluation of ground source (geothermal) heat pump systems. Energy Build. 2007, 39, 66–75. [Google Scholar] [CrossRef]
- Salvalai, G. Implementation and validation of simplified heat pump model in IDA-ICE energy simulation environment. Energy Build. 2012, 49, 132–141. [Google Scholar] [CrossRef]
- Perego, P.; Guandalini, R.; Fumagalli, L.; Aghib, F.S.; De Biase, L.; Bonomi, T. Sustainability evaluation of a medium scale GSHP system in a layered alluvial setting using 3D modeling suite. Geothermics 2016, 59, 14–26. [Google Scholar] [CrossRef]
- Ministry of Environment, Japan. Results of a Survey on the Use of Ground-Source Heat Pump Systems in Fiscal Year 2016; Environmental Management Bureau, Government of Japan: Tokyo, Japan, 2017. Available online: http://www.env.go.jp/press/103827 (accessed on 15 April 2018). (In Japanese)
- Shrestha, G.; Uchida, Y.; Yoshioka, M.; Fujii, H.; Ioka, S. Assessment of development potential of ground-coupled heat pump system in Tsugaru Plain, Japan. Renew. Energy 2015, 76, 249–257. [Google Scholar] [CrossRef]
- Domenico, P.A.; Palciauskas, V.V. Theoretical analysis of forced convective heat transfer in regional ground-water flow. Geol. Soc. Am. Bull. 1973, 84, 3803–3814. [Google Scholar] [CrossRef]
- Smith, L.; Chapman, D.S. On the thermal effects of groundwater flow: 1. Regional scale systems. J. Geophys. Res. 1983, 88, 593–608. [Google Scholar] [CrossRef]
- Woodbury, A.D.; Smith, L. On the thermal effects of three-dimensional groundwater flow. J. Geophys. Res. 1985, 90, 759–767. [Google Scholar] [CrossRef]
- Anderson, M.P. Heat as a ground water tracer. Groundwater 2005, 43, 951–968. [Google Scholar] [CrossRef] [PubMed]
- Gehlin, S.E.A.; Hellstrom, G. Influence on thermal response test by groundwater flow in vertical fractures in hard rock. Renew. Energy 2003, 28, 2221–2238. [Google Scholar] [CrossRef]
- Diersch, H.J.G.; Bauer, D.; Heidemann, W.; Ruhaak, W.; Schatzl, P. Finite element modeling of borehole heat exchanger systems: Part 2. Numerical simulation. Comput. Geosci. 2011, 37, 1136–1147. [Google Scholar] [CrossRef]
- Wang, H.; Yang, B.; Xie, J.; Qi, C. Thermal performance of borehole heat exchangers in different aquifers: A case study from Shouguang. Int. J. Low-Carbon Technol. 2012, 8, 253–259. [Google Scholar] [CrossRef]
- Dehkordi, S.E.; Schincariol, R.A. Effect of thermal-hydrogeological and borehole heat exchanger properties on performance and impact of vertical closed-loop geothermal heat pump system. Hydrogeol. J. 2014, 22, 189–203. [Google Scholar] [CrossRef]
- Fujii, H.; Itoi, R.; Fujii, J.; Uchida, Y. Optimizing the design of largescale ground-coupled heat pump systems using groundwater and heat transport modeling. Geothermics 2005, 34, 347–364. [Google Scholar] [CrossRef]
- Uchida, Y.; Yoda, Y.; Fujii, H.; Miyamoto, S.; Yoshioka, M. Adoption of suitability area for ground-coupled heat pump systems 1st paper, Development of suitability maps for ground-coupled heat pump systems using groundwater flow/heat transport modeling and geographic information system. J. Geotherm. Res. Soc. Jpn. 2010, 32, 229–239, (In Japanese with English abstracts). [Google Scholar]
- Ohtani, T.; Ishikawa, N.; Uchida, Y.; Kojima, S. Estimation of groundwater flow velocity and its application for the installation of the ground-coupled heat pumps in the Nobi Plain, Central Japan. J. Geotherm. Res. Soc. Jpn. 2007, 29, 203–210, (In Japanese with English abstracts). [Google Scholar]
- Shrestha, G.; Uchida, Y.; Ishihara, T.; Kaneko, S.; Kuronuma, S. Assessment of the installation potential of a ground source heat pump system based on the groundwater condition in the Aizu Basin, Japan. Energies 2018, 11, 1178. [Google Scholar] [CrossRef]
- Matsumoto, H. Sea-level changes during the Holocene and geomorphic developments of the Sendai coastal plain, northeast Japan. Geograohical Rev. Jpn. 1981, 54, 72–85, (In Japanese with English abstracts). [Google Scholar] [CrossRef]
- Diersch, H.J.G. FEFLOW Reference Manual; WASY GmbH Institute for Water Resources Planning and Systems Research: Berlin, Germany, 2005. [Google Scholar]
- Bair, E.S.; Lahm, T.D. Practical Problems in Groundwater Hydrology; Prentice Hall: Upper Saddle River, NJ, USA, 2006; ISBN 0-13-145667-9. [Google Scholar]
- Geo-Heat Promotion Association of Japan. Ground-Source Heat Pump System: Manual for Construction and Management, 1st ed.; Ohmsha: Tokyo, Japan, 2014. (In Japanese) [Google Scholar]
- Uchida, Y.; Yasukawa, K.; Tenma, N.; Ohtani, T.; Mori, K. Study on the subsurface thermal structure at the Sendai Plain 1. Construction of 3D regional groundwater flow and heat transport model. J. Geotherm. Res. Soc. Jpn. 2005, 27, 115–130, (In Japanese with English abstracts). [Google Scholar]
- Kaneko, S.; Uchida, Y.; Yoshioka, M.; Shrestha, G.; Ishihara, T.; Arif, W. Comparison of apparent thermal conductivity and thermal conductivity of core samples in the Sendai Plain, Japan. In Proceedings of the Ground Renewable Energy 2018, Kanagawa, Japan, 17–22 June 2018. [Google Scholar]
- Domenico, P.A.; Schwartz, F.W. Physical and Chemical Hydrogeology, 2nd ed.; John Wiley & Sons, Inc.: New York, NY, USA, 1998; ISBN 0-471-59762-7. [Google Scholar]
- Chiasson, A.D.; Rees, S.J.; Spitler, J.D. A preliminary assessment of the effects of groundwater flow on closed-loop ground-source heat pump systems. ASHRAE Trans. 2000, 106, 380–393. [Google Scholar]
- Uchida, Y.; Yasukawa, K.; Tenma, N.; Taguchi, Y.; Ishii, J.; Suwanlert, J.; Lorphensri, S. Subsurface temperature survey in Thailand for geothermal heat pump application. J. Geotherm. Res. Soc. Jpn. 2011, 33, 93–98. [Google Scholar]
- Ishihara, T.; Shrestha, G.; Kaneko, S.; Uchida, Y. Analysis of shallow subsurface geological structures and ground effective thermal conductivity for the evaluation of ground-source heat pump system installation in the Aizu Basin, Northeast Japan. Energies 2018, 11, 2098. [Google Scholar] [CrossRef]


| Layer | Formation (Thickness of the Formation (m)) | Horizontal Hydraulic Conductivity (m/d) | Vertical Hydraulic Conductivity (m/d) | Porosity (-) | Thermal Conductivity (W/m/K) |
|---|---|---|---|---|---|
| 1–2 | Quaternary (<80 m) | 5 | 2.5 | 0.2 | 1.4 |
| 3–9 | Upper Neogene (540–620 m) | 0.4 | 0.2 | 0.1 | 1.5 |
| 10–17 | Lower Neogene (300 m) | 0.08 | 0.04 | 0.1 | 1.8 |
| Item | Sendai Plain | Aizu Basin | ||||
|---|---|---|---|---|---|---|
| Coefficient | t Test | p Value | Coefficient | t Test | p Value | |
| Intercept | −20.33 | −6.85 | 1.34 × 10⁻⁷ | 22.63 | 1.39 | 0.18 |
| X1 | 1069.81 | 14.04 | 1.01 × 10⁻¹⁴ | 201.61 | 6.81 | 3.01 × 10⁻⁶ |
| X2 | 2.46 | 13.57 | 2.41 × 10⁻¹⁴ | 0.41 | 0.38 | 0.71 |
© 2018 by the authors. Licensee MDPI, Basel, Switzerland. This article is an open access article distributed under the terms and conditions of the Creative Commons Attribution (CC BY) license (http://creativecommons.org/licenses/by/4.0/).
Share and Cite
Kaneko, S.; Uchida, Y.; Shrestha, G.; Ishihara, T.; Yoshioka, M. Factors Affecting the Installation Potential of Ground Source Heat Pump Systems: A Comparative Study for the Sendai Plain and Aizu Basin, Japan. Energies 2018, 11, 2860. https://doi.org/10.3390/en11102860
Kaneko S, Uchida Y, Shrestha G, Ishihara T, Yoshioka M. Factors Affecting the Installation Potential of Ground Source Heat Pump Systems: A Comparative Study for the Sendai Plain and Aizu Basin, Japan. Energies. 2018; 11(10):2860. https://doi.org/10.3390/en11102860
Chicago/Turabian StyleKaneko, Shohei, Youhei Uchida, Gaurav Shrestha, Takeshi Ishihara, and Mayumi Yoshioka. 2018. "Factors Affecting the Installation Potential of Ground Source Heat Pump Systems: A Comparative Study for the Sendai Plain and Aizu Basin, Japan" Energies 11, no. 10: 2860. https://doi.org/10.3390/en11102860
APA StyleKaneko, S., Uchida, Y., Shrestha, G., Ishihara, T., & Yoshioka, M. (2018). Factors Affecting the Installation Potential of Ground Source Heat Pump Systems: A Comparative Study for the Sendai Plain and Aizu Basin, Japan. Energies, 11(10), 2860. https://doi.org/10.3390/en11102860