Figure 1.
An example of an oil reservoir with a gas cap.
Figure 1.
An example of an oil reservoir with a gas cap.
Figure 2.
Selected socket geometry and dimensions for the investigated PE pipe [
18]. D: Socket inside diameter; T: Inner length; L: Socket length; H: Socket height.
Figure 2.
Selected socket geometry and dimensions for the investigated PE pipe [
18]. D: Socket inside diameter; T: Inner length; L: Socket length; H: Socket height.
Figure 3.
Typical finite element model of pipe and socket subjected to internal pressure.
Figure 3.
Typical finite element model of pipe and socket subjected to internal pressure.
Figure 4.
Maximum axial and Von Mises stress variations in the wall of buried socket joint (the simultaneous effect of soil load, internal pressure, vehicle wheel load and temperature variations).
Figure 4.
Maximum axial and Von Mises stress variations in the wall of buried socket joint (the simultaneous effect of soil load, internal pressure, vehicle wheel load and temperature variations).
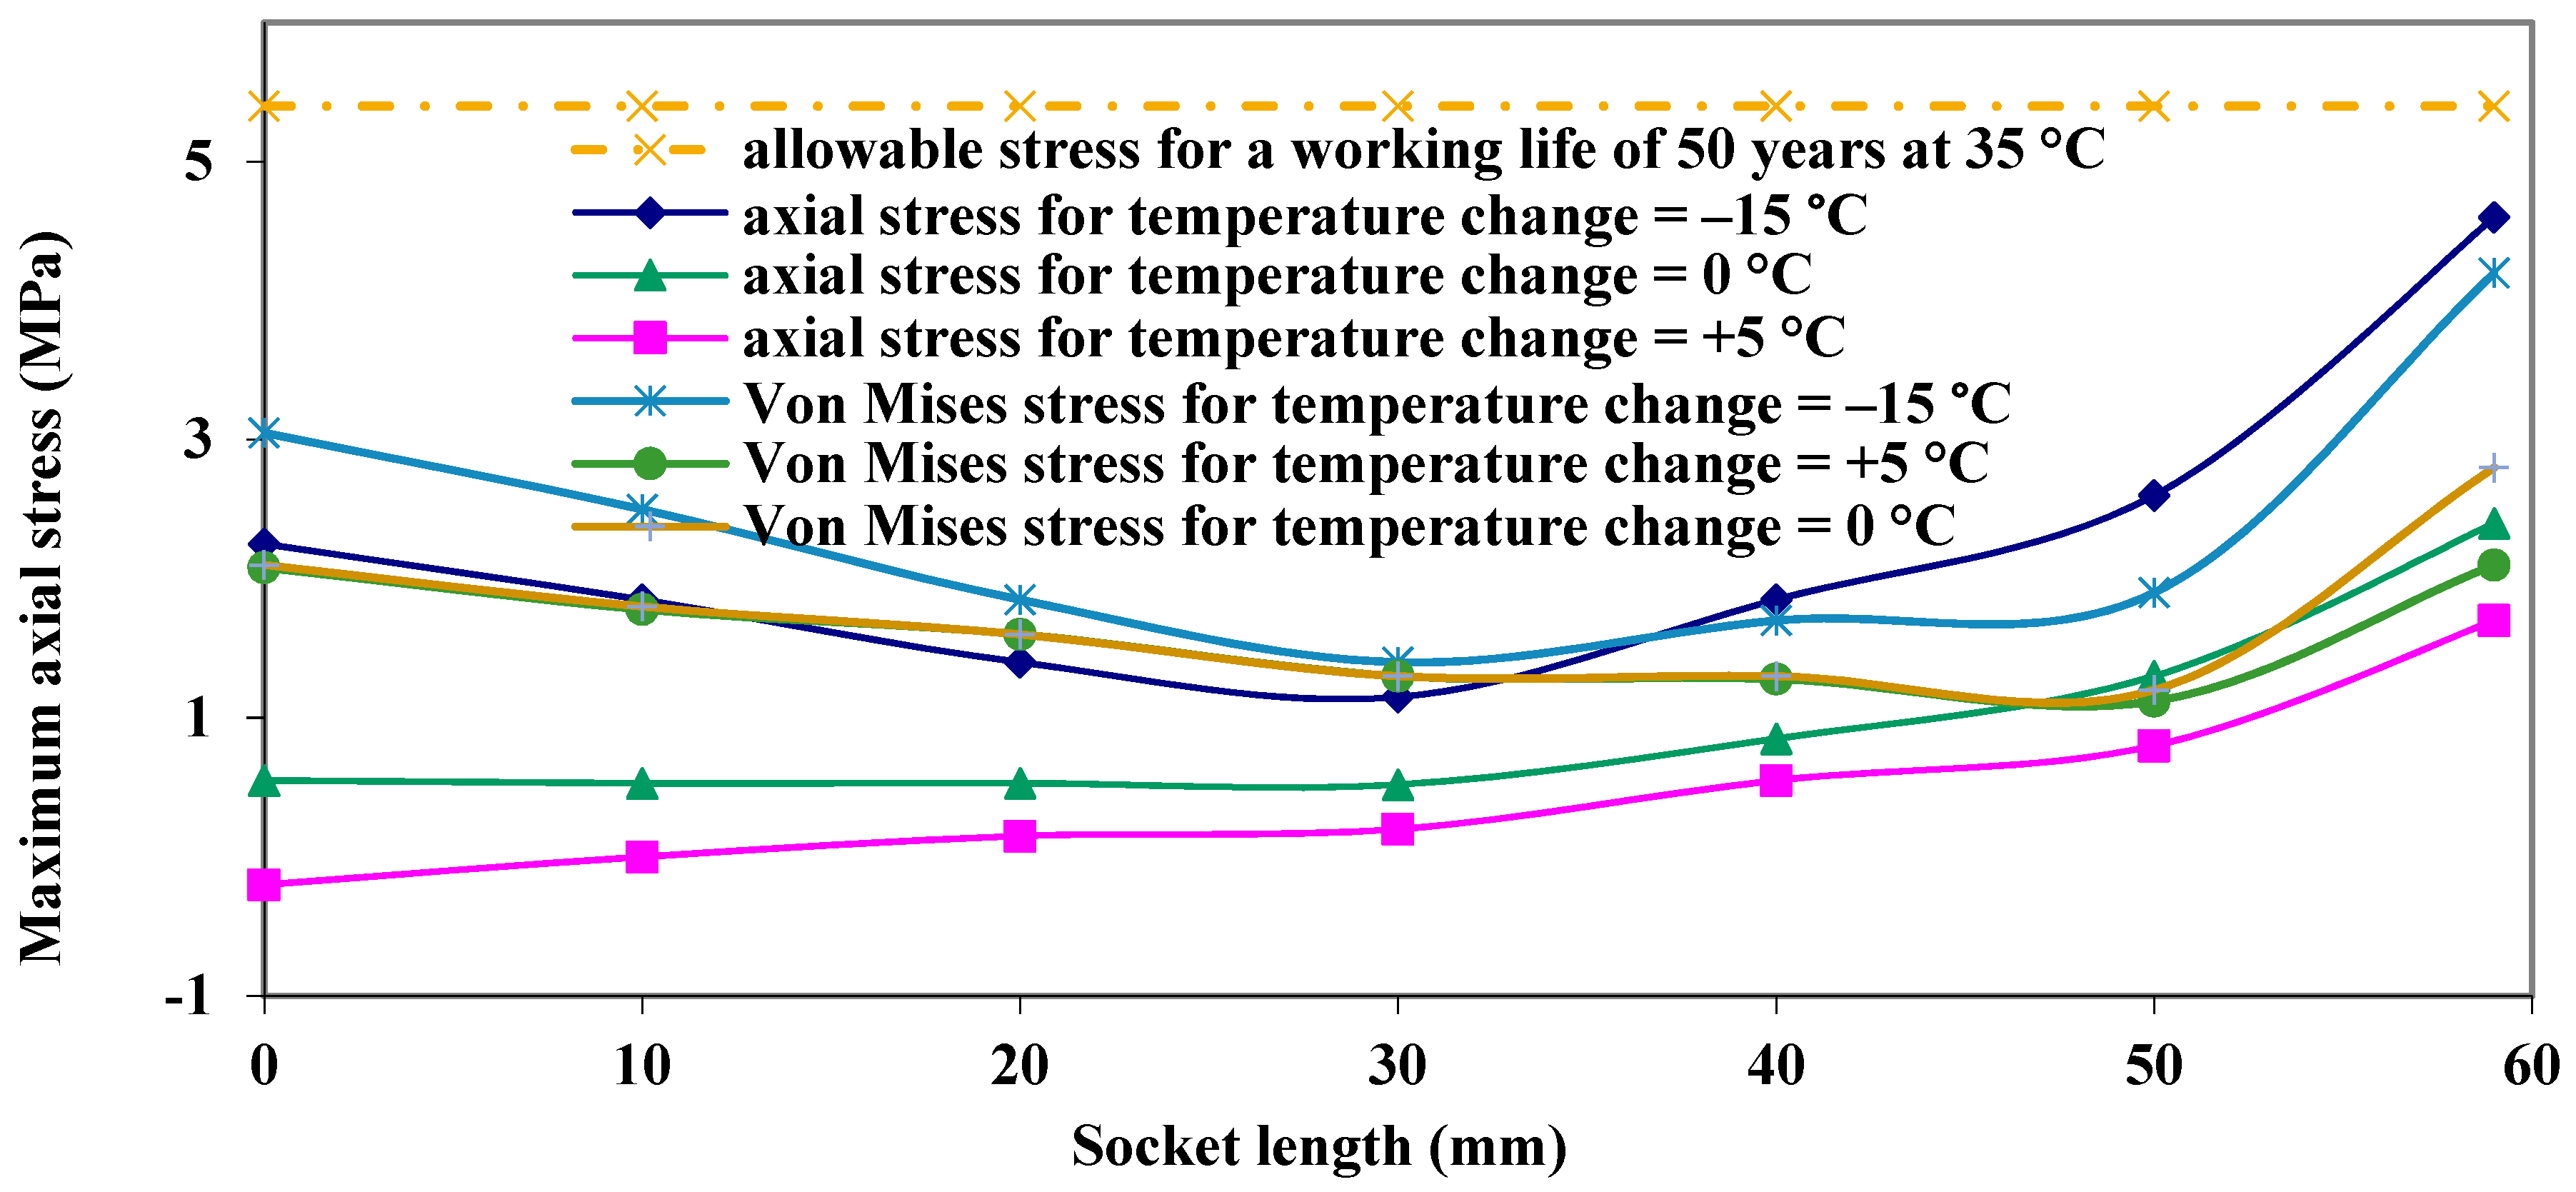
Figure 5.
Maximum axial and Von Mises stress variations along the socket length (the simultaneous effect of soil load, internal pressure, vehicle wheel load and temperature variations).
Figure 5.
Maximum axial and Von Mises stress variations along the socket length (the simultaneous effect of soil load, internal pressure, vehicle wheel load and temperature variations).
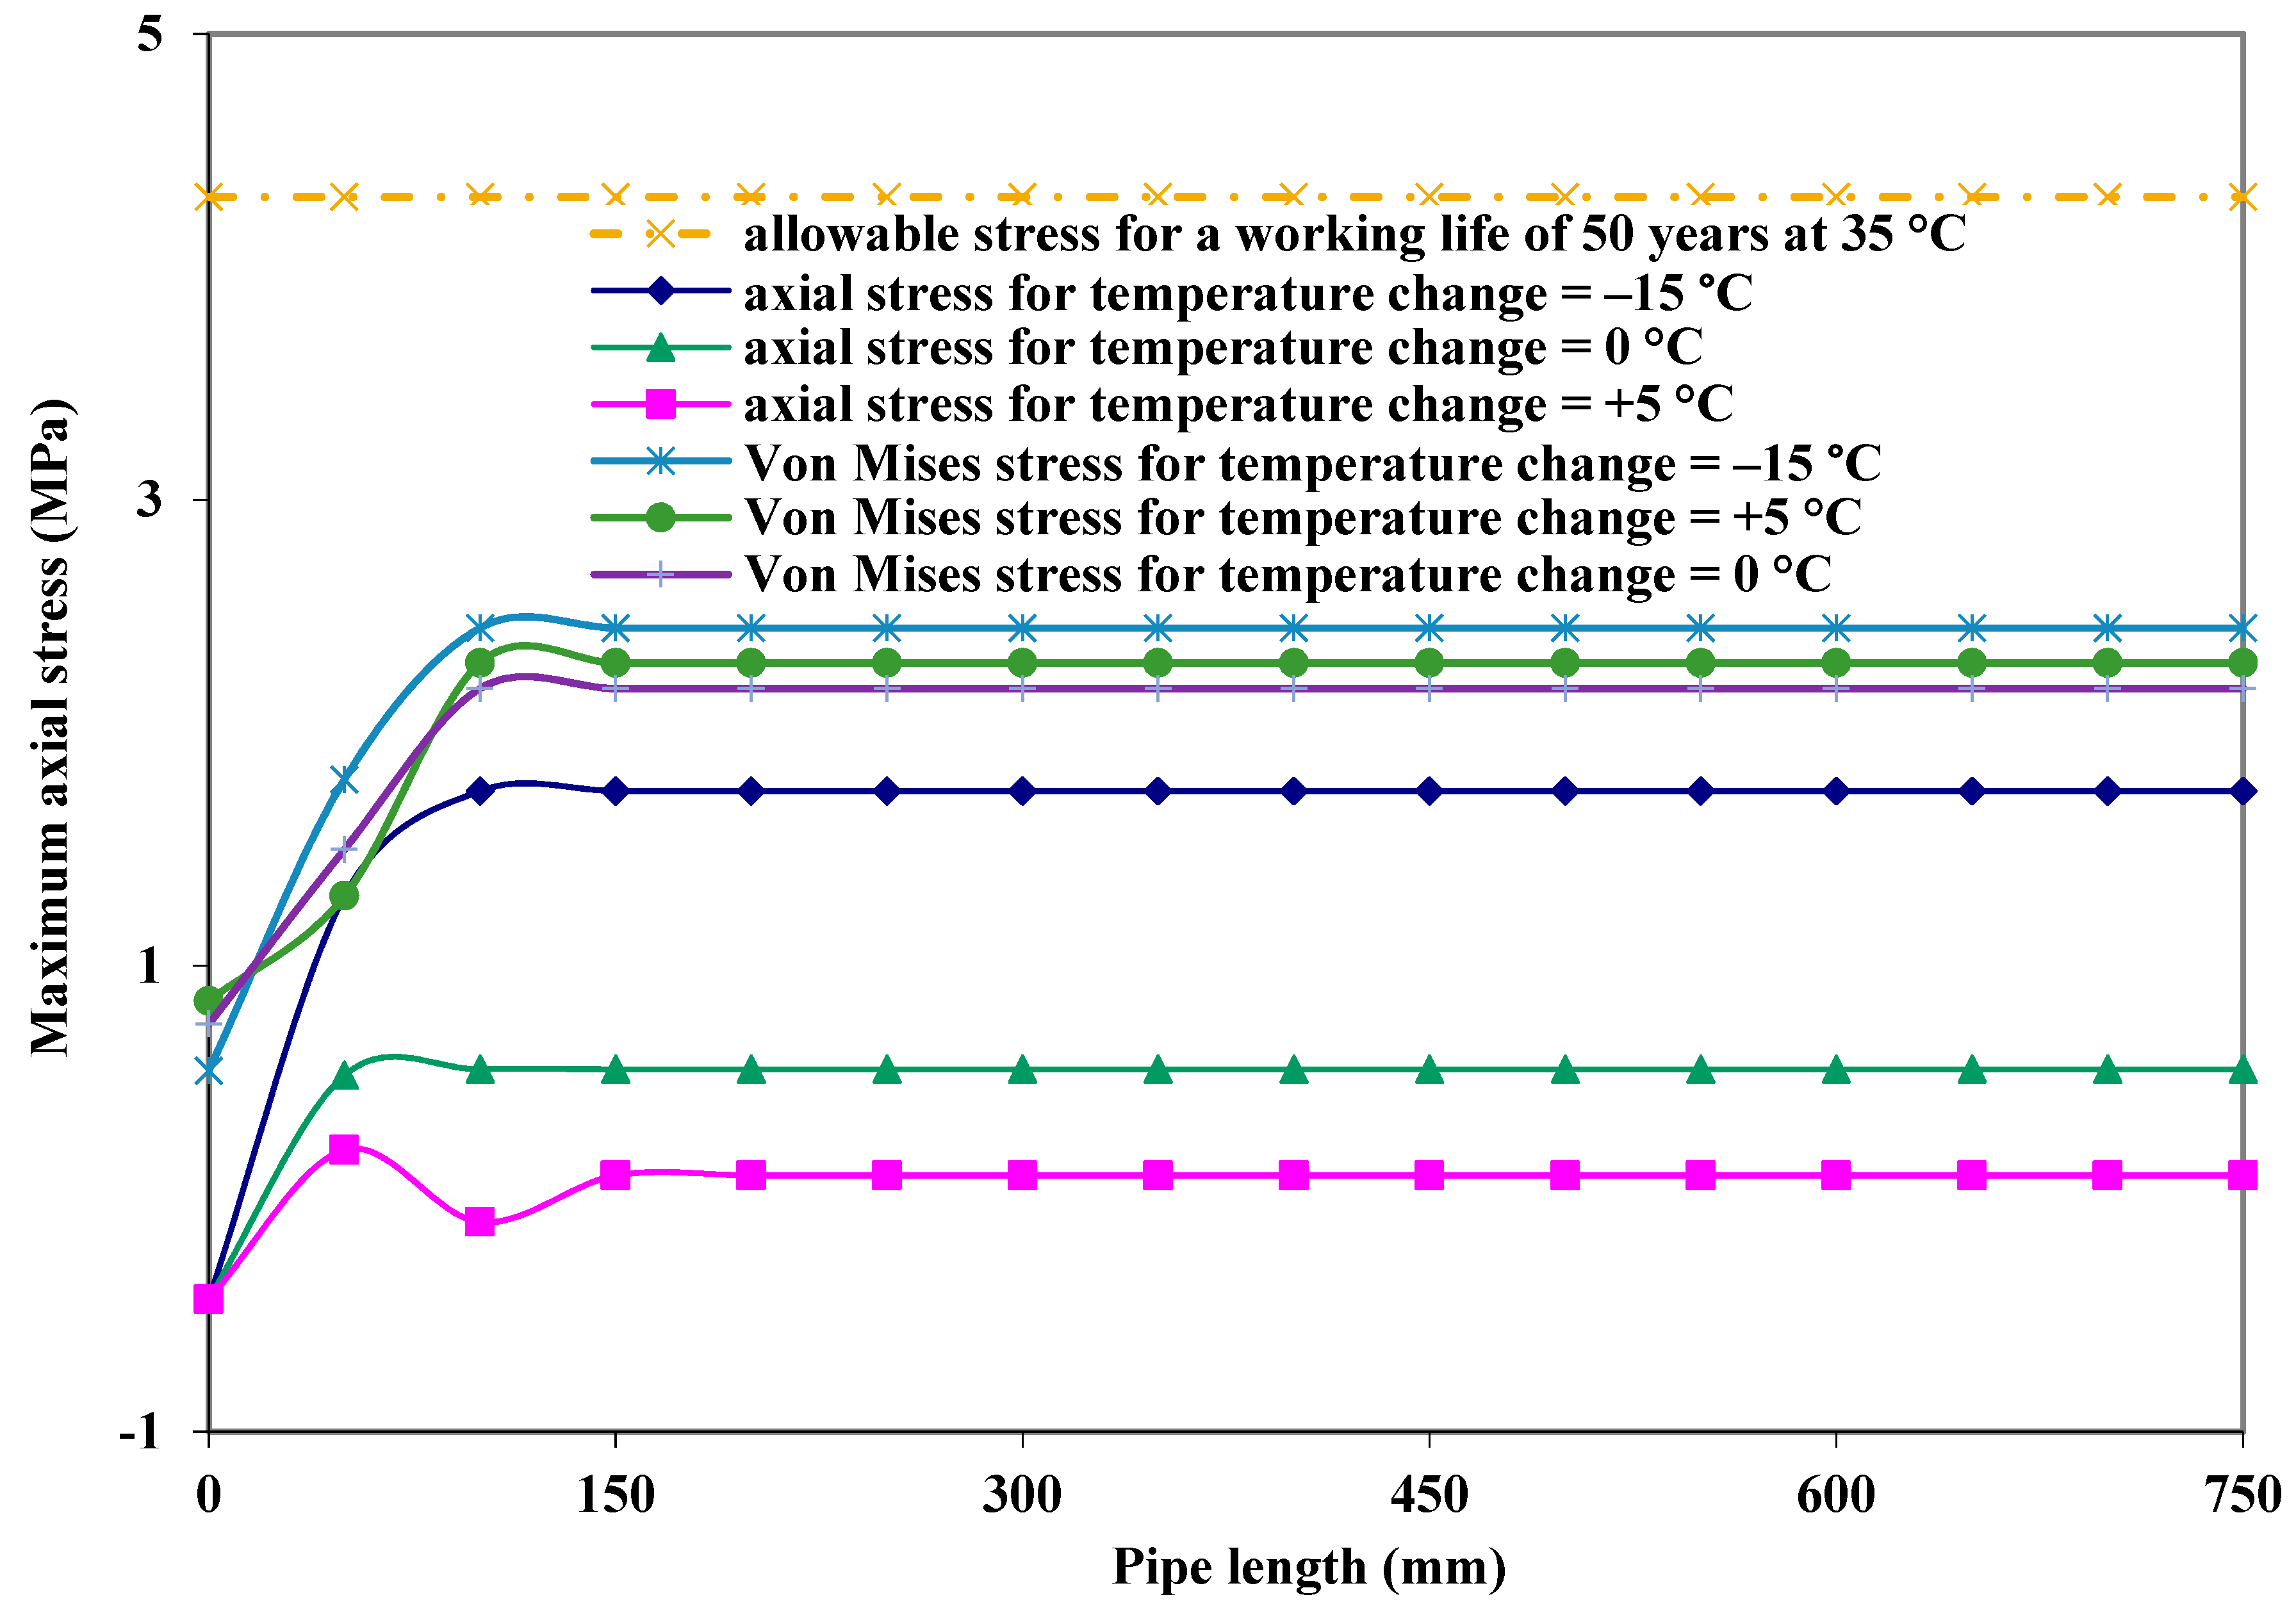
Figure 6.
Maximum axial and Von Mises stress variations along the pipe length (the simultaneous effect of soil load, internal pressure, vehicle wheel load and temperature variations).
Figure 6.
Maximum axial and Von Mises stress variations along the pipe length (the simultaneous effect of soil load, internal pressure, vehicle wheel load and temperature variations).
Figure 7.
Polyethylene pipe and patch arrangement. (
a) Two dimensional view (dimensions in mm) of the cross section of the medium density polyethylene gas pipe. (
b) Three dimensional model of patch repaired pipe showing patch dimensions [
8,
9,
10,
11,
12,
41].
Figure 7.
Polyethylene pipe and patch arrangement. (
a) Two dimensional view (dimensions in mm) of the cross section of the medium density polyethylene gas pipe. (
b) Three dimensional model of patch repaired pipe showing patch dimensions [
8,
9,
10,
11,
12,
41].
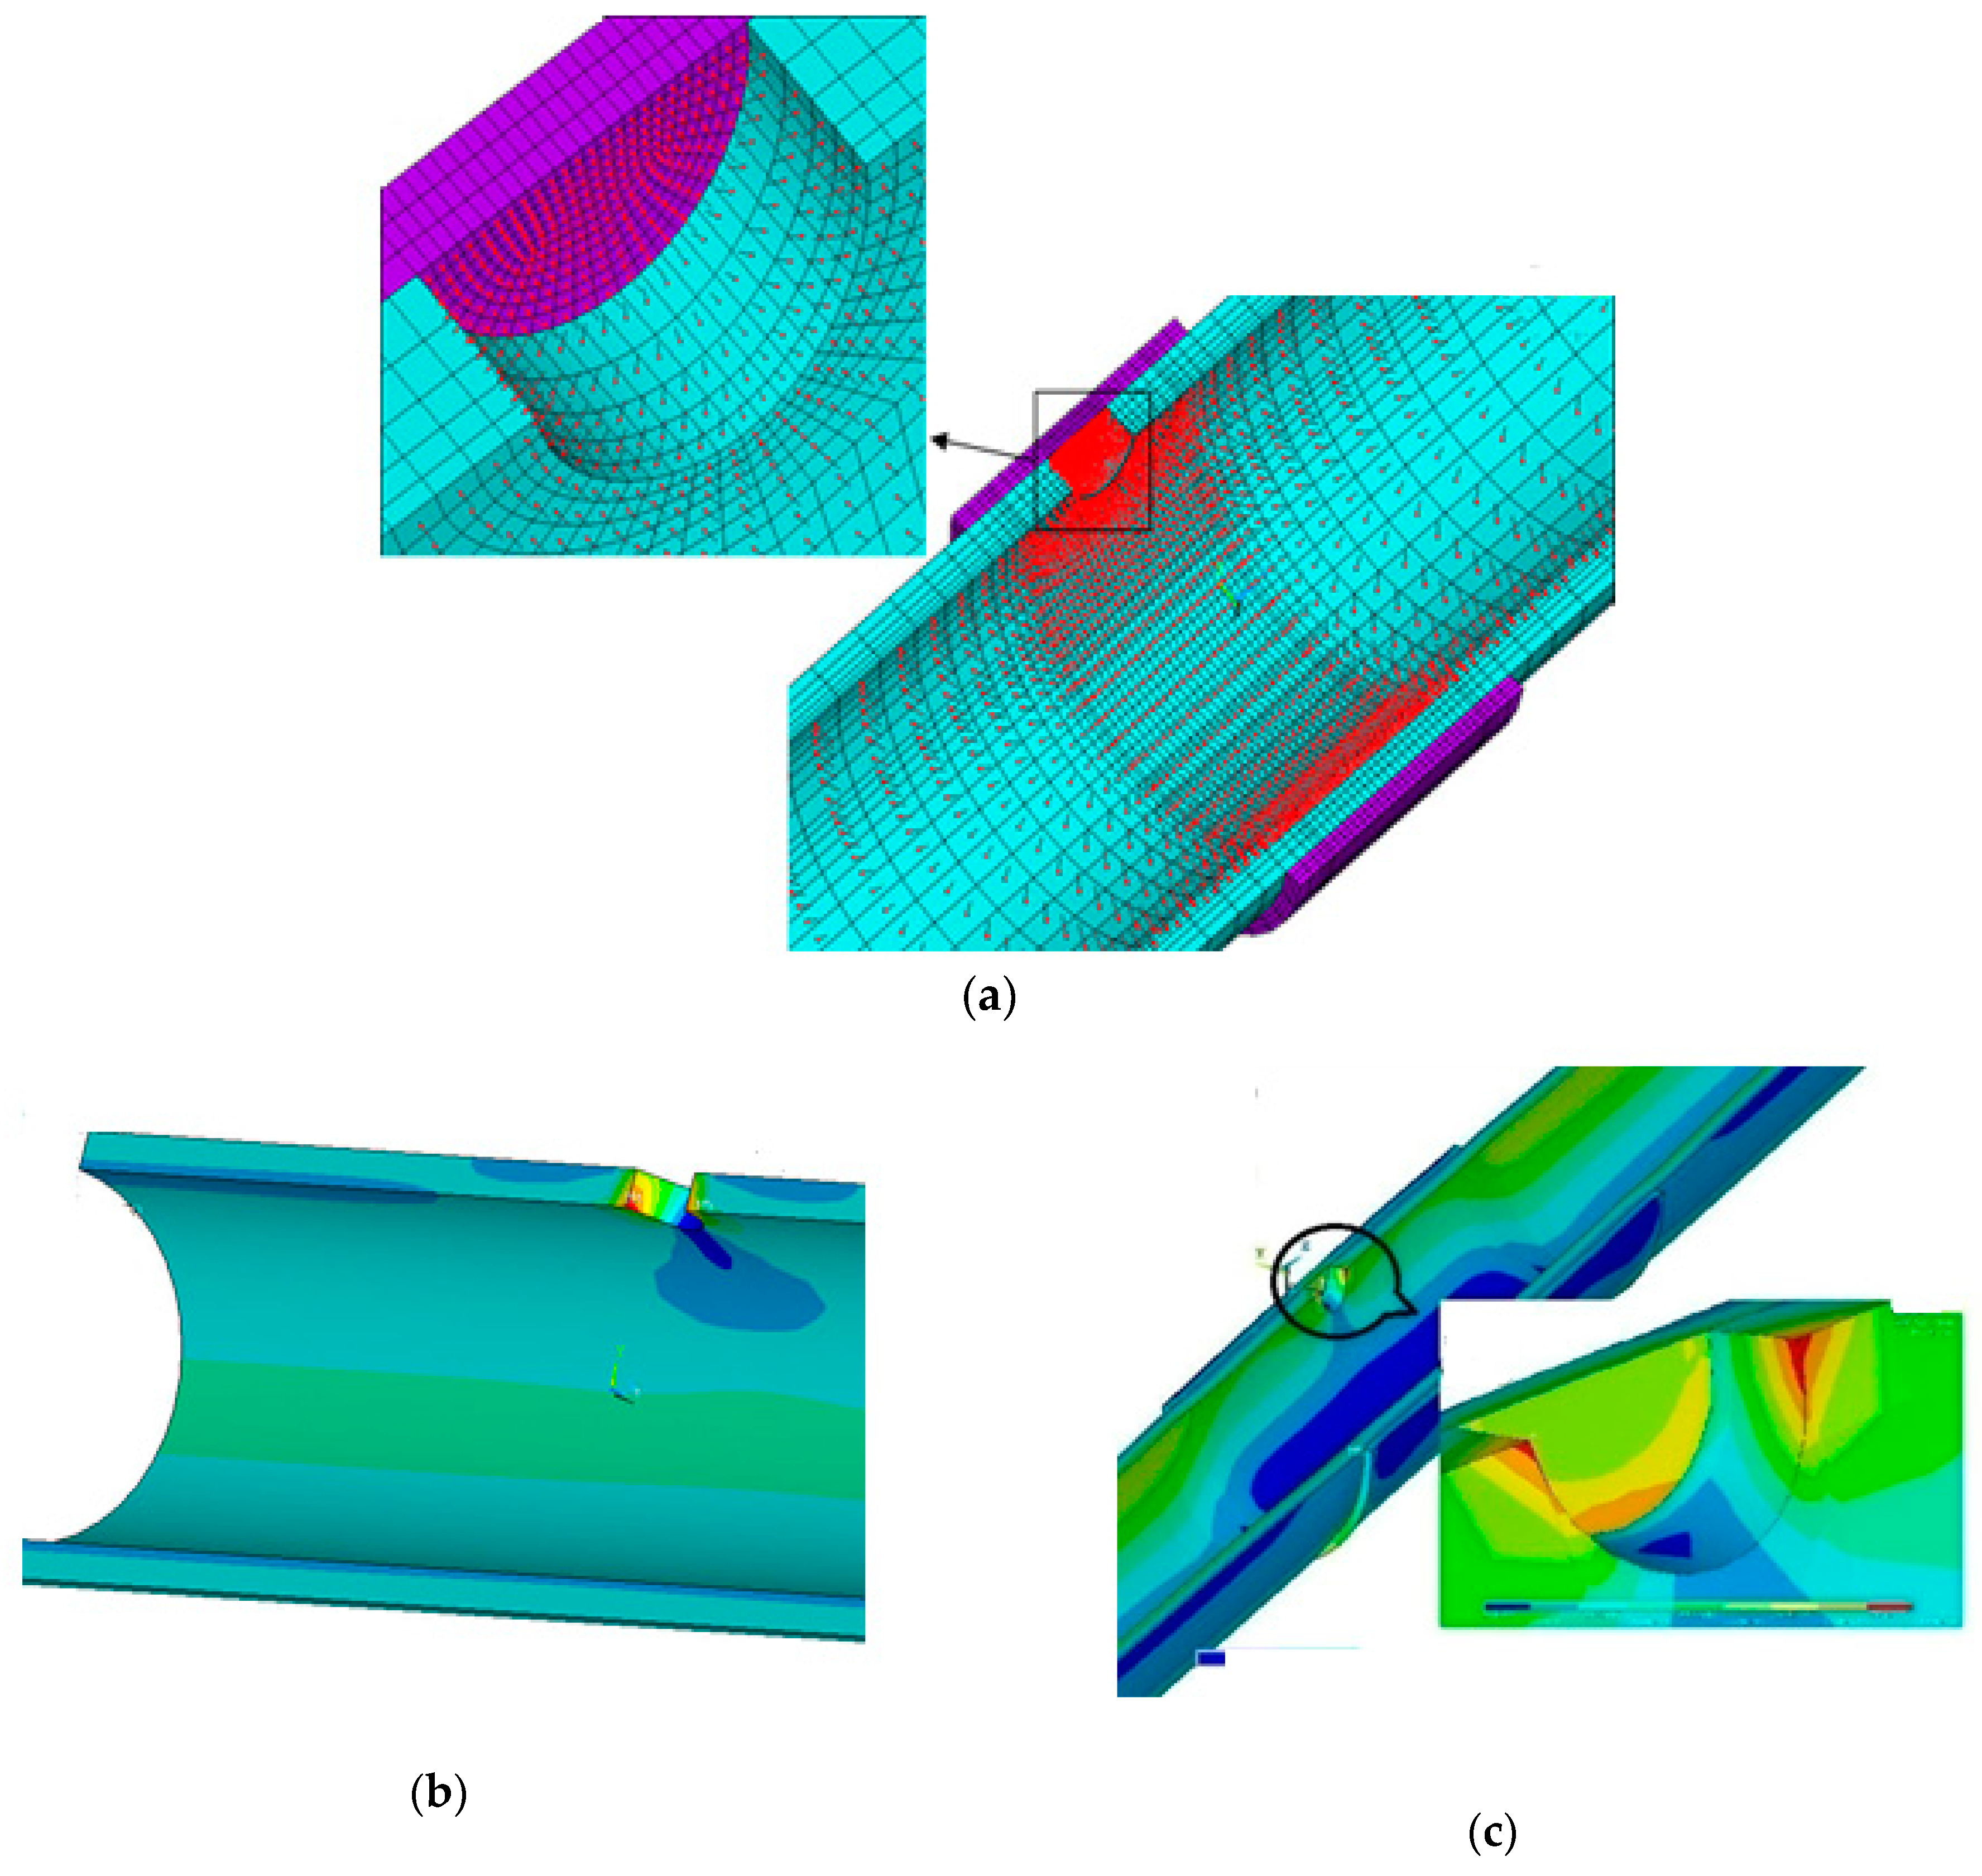
Figure 8.
Finite element modeling of sectioned pipe and socket to show Von Mises stress distribution. (a) Mesh generation and the application of internal pressure. (b) Stress distribution in PE pipe with 1″ diameter circular hole. (c) Stress distribution in PE pipe and patch.
Figure 8.
Finite element modeling of sectioned pipe and socket to show Von Mises stress distribution. (a) Mesh generation and the application of internal pressure. (b) Stress distribution in PE pipe with 1″ diameter circular hole. (c) Stress distribution in PE pipe and patch.
Figure 9.
Curves for maximum Von Mises stresses in various patch arrangements for unburied pipe and patch arrangement.
Figure 9.
Curves for maximum Von Mises stresses in various patch arrangements for unburied pipe and patch arrangement.
Figure 10.
Finite element model of the patched pipe with surrounding soil subjected too internal pressure. GW: Well-graded gravels; SM: Silty sands [
11].
Figure 10.
Finite element model of the patched pipe with surrounding soil subjected too internal pressure. GW: Well-graded gravels; SM: Silty sands [
11].
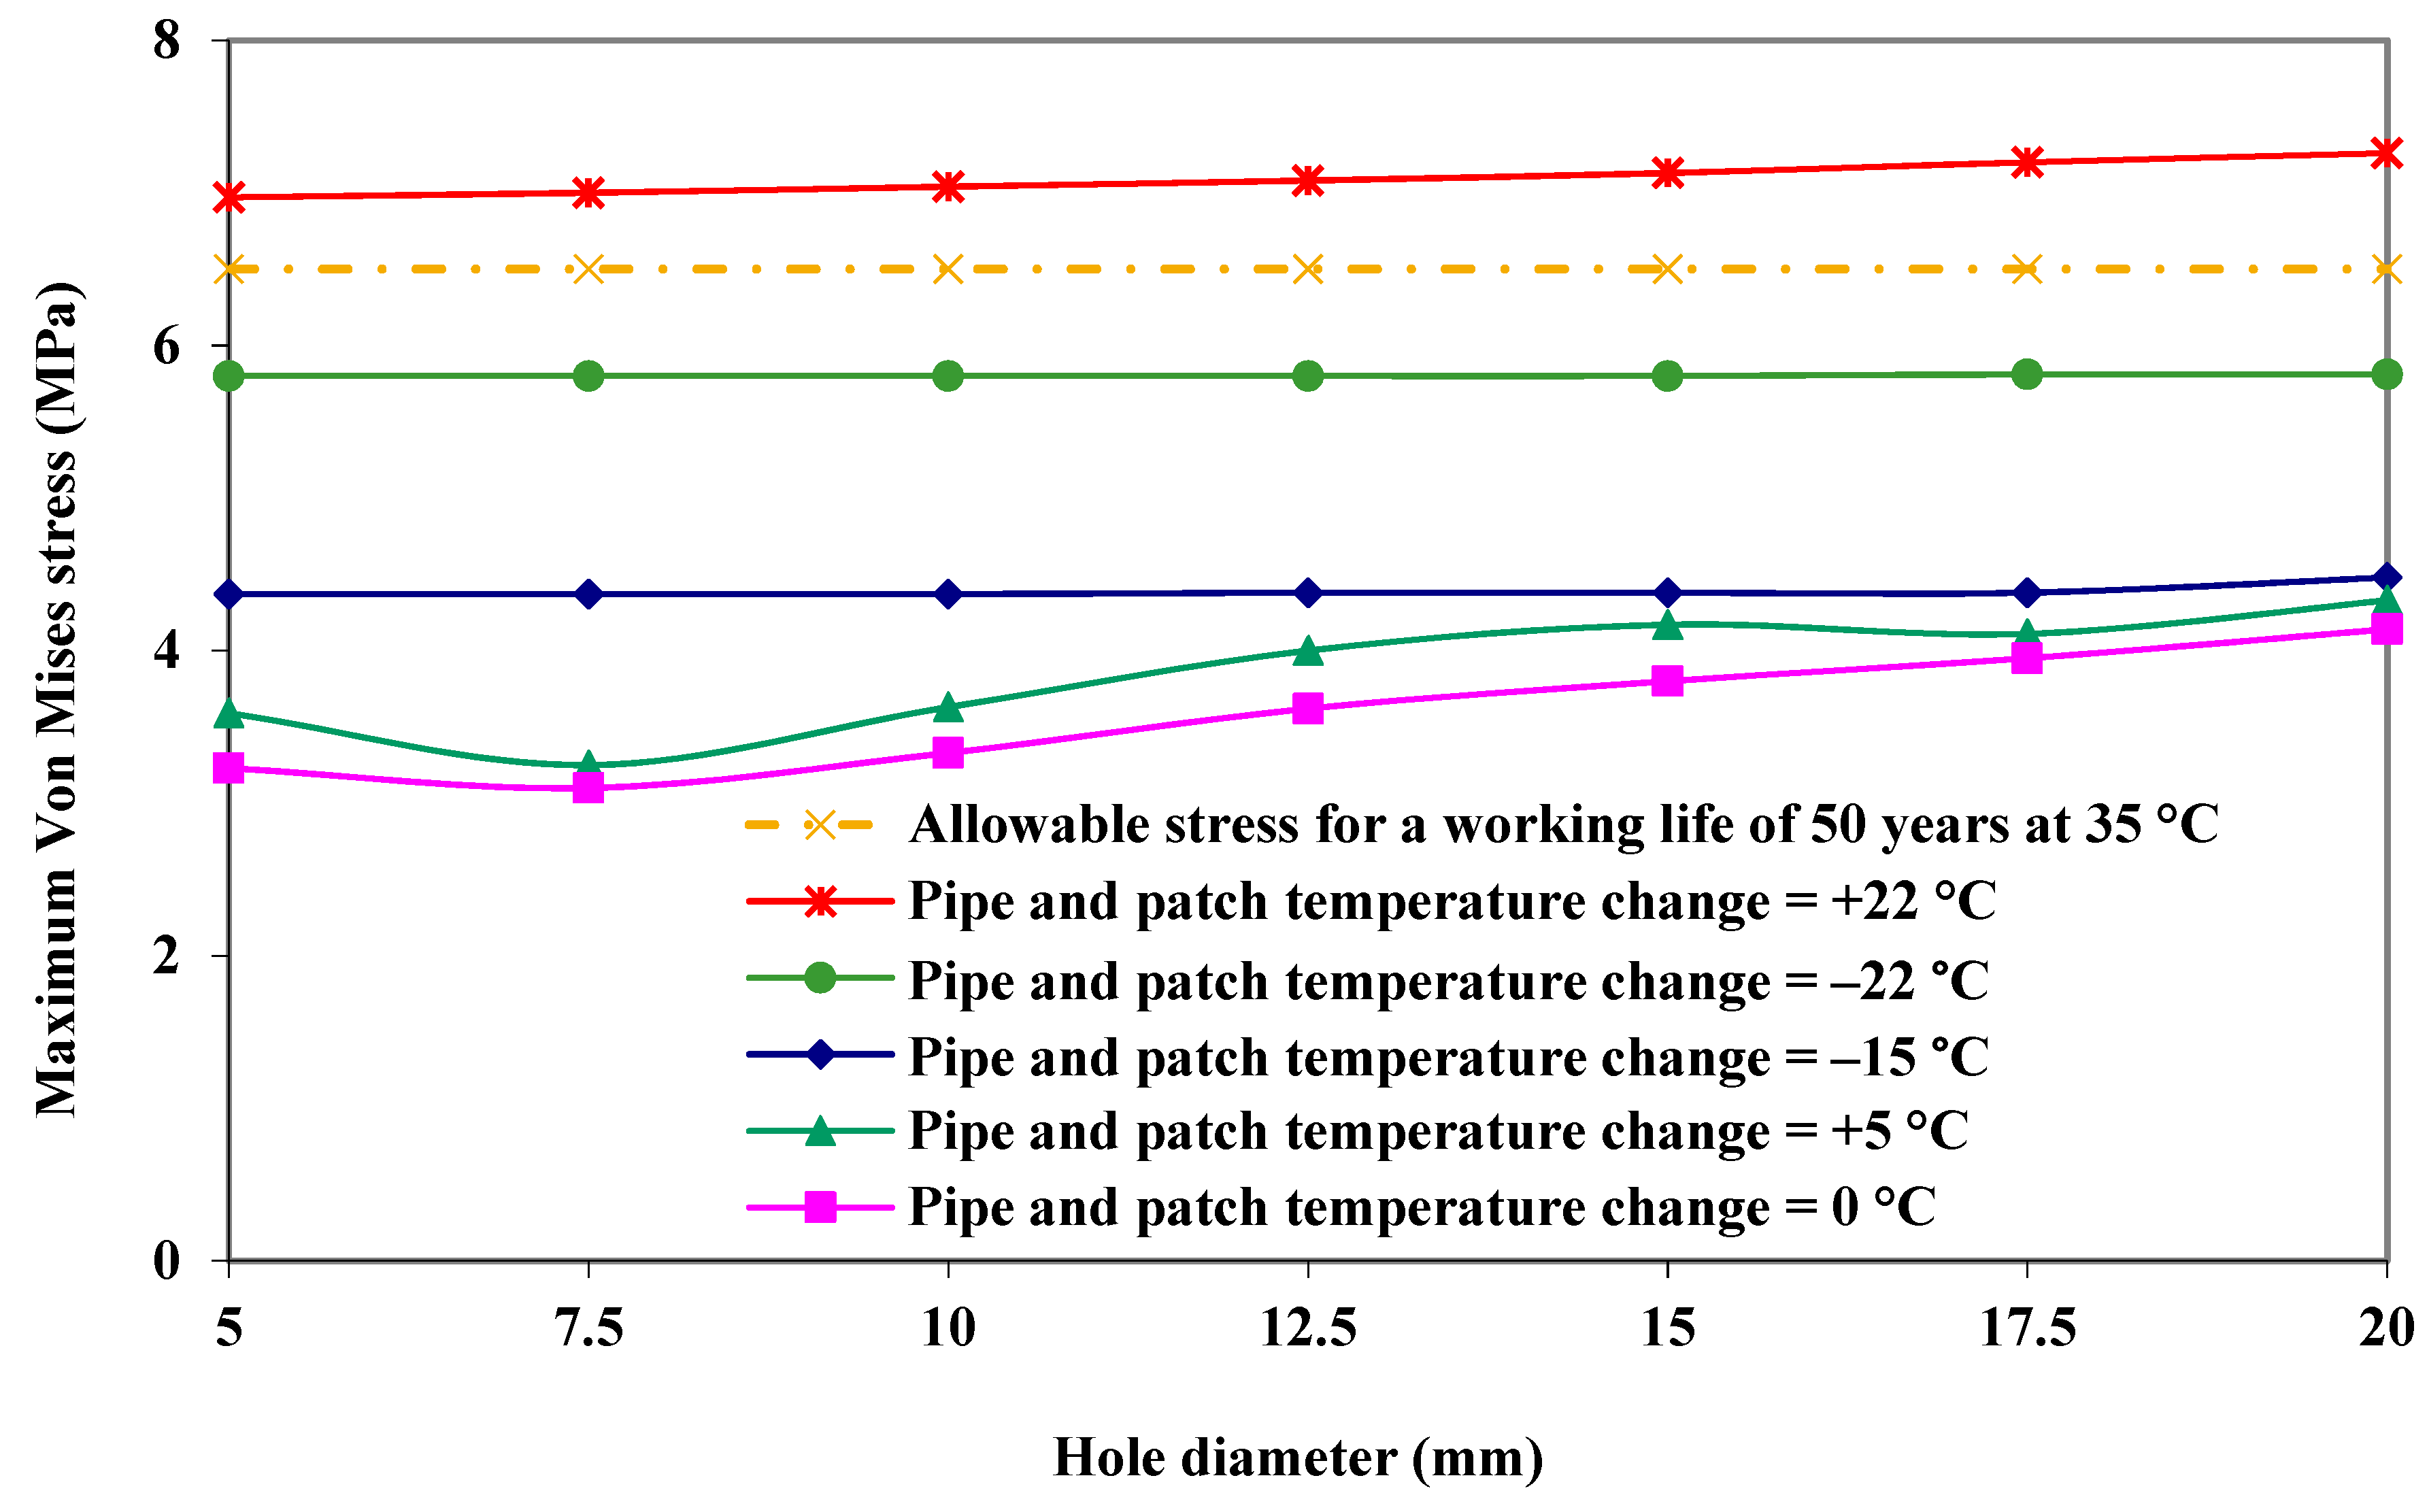
Figure 11.
Maximum Von Mises stress variations in the buried pipe for various size circular hole defects repaired by semi-cylindrical patch (the simultaneous effect of soil load, internal pressure, vehicle wheel load and temperature variations).
Figure 11.
Maximum Von Mises stress variations in the buried pipe for various size circular hole defects repaired by semi-cylindrical patch (the simultaneous effect of soil load, internal pressure, vehicle wheel load and temperature variations).
Figure 12.
Maximum Von Mises stress in the semi-cylindrical patch for various sizes of circular hole defects (the simultaneous effect of mechanical and thermal loads).
Figure 12.
Maximum Von Mises stress in the semi-cylindrical patch for various sizes of circular hole defects (the simultaneous effect of mechanical and thermal loads).
Figure 13.
Maximum Von Mises stress variations in the buried pipe for various size circular hole defects repaired by circular partial patch (the simultaneous effect of soil load, internal pressure, vehicle wheel load and temperature variations).
Figure 13.
Maximum Von Mises stress variations in the buried pipe for various size circular hole defects repaired by circular partial patch (the simultaneous effect of soil load, internal pressure, vehicle wheel load and temperature variations).
Figure 14.
Maximum Von Mises stress in the circular partial patch for various sizes of circular hole defects (the simultaneous effect of mechanical and thermal loads).
Figure 14.
Maximum Von Mises stress in the circular partial patch for various sizes of circular hole defects (the simultaneous effect of mechanical and thermal loads).
Figure 15.
Maximum Von Mises stress variations in the buried pipe for various sizes of circular hole defects repaired by square partial patch (the simultaneous effect of soil load, internal pressure, vehicle wheel load and temperature variations).
Figure 15.
Maximum Von Mises stress variations in the buried pipe for various sizes of circular hole defects repaired by square partial patch (the simultaneous effect of soil load, internal pressure, vehicle wheel load and temperature variations).
Figure 16.
Maximum Von Mises stress in the square partial patch for various sizes of circular hole defects (the simultaneous effect of mechanical and thermal loads).
Figure 16.
Maximum Von Mises stress in the square partial patch for various sizes of circular hole defects (the simultaneous effect of mechanical and thermal loads).
Figure 17.
Maximum Von Mises stress in buried pipe for circular hole defects, saddle fusion patch repaired (simultaneous effects of soil load, internal pressure, vehicle load and temperature variations).
Figure 17.
Maximum Von Mises stress in buried pipe for circular hole defects, saddle fusion patch repaired (simultaneous effects of soil load, internal pressure, vehicle load and temperature variations).
Figure 18.
Maximum Von Mises stress in 3 inch long, saddle fusion patch for various sizes of circular hole defects (the simultaneous effect of mechanical and thermal loads).
Figure 18.
Maximum Von Mises stress in 3 inch long, saddle fusion patch for various sizes of circular hole defects (the simultaneous effect of mechanical and thermal loads).
Table 1.
Geometrical and mechanical properties of PE100 socket.
Table 1.
Geometrical and mechanical properties of PE100 socket.
| Geometrical Properties | Mechanical Properties |
|---|
| SDR | Outer Diameter (mm) | Wall Thickness (mm) | Modulus of Elasticity | Yield Strength (MPa) | Rupture Strength (MPa) | Poisson’s Ratio | Thermal Expansion Coefficient () |
|---|
| 11 | 110 | 10 | 1034 | 24.8 | 35.1 | 0.4 | 0.0002 |
Table 2.
The simultaneous effect of soil column pressure, pipe internal pressure, vehicle wheel load, and temperature variations.
Table 2.
The simultaneous effect of soil column pressure, pipe internal pressure, vehicle wheel load, and temperature variations.
| Item | Maximum Stress (MPa) | ΔT = 0 °C | ΔT = +5 °C | ΔT = −15 °C |
|---|
| Pipe | Axial stress | 0.56 | 0.21 | 1.86 |
| Von Mises stress | 2.19 | 2.30 | 2.45 |
| Socket | Axial stress | 2.52 | 1.74 | 4.14 |
| Von Mises stress | 2.6 | 2.11 | 4.5 |
Table 3.
Mechanical properties of the PE80 pipe and PE100 patch materials [
8,
9,
10,
11,
12,
41].
Table 3.
Mechanical properties of the PE80 pipe and PE100 patch materials [
8,
9,
10,
11,
12,
41].
| Material | Mechanical Properties |
|---|
| Elasticity Module (MPa) | Yield Stress (MPa) | Poisson Ratio | Thermal Expansion Coefficient () |
|---|
| PE80 | 427 | 19.3 | 0.35 | 0.0002 |
| PE100 | 1034 | 24.8 | 0.4 | 0.0002 |
Table 4.
Comparing maximum stress values in pipe and patch under internal pressure, investigating the pipe length size.
Table 4.
Comparing maximum stress values in pipe and patch under internal pressure, investigating the pipe length size.
| Model Dimension | Maximum Stress in Pipe | Maximum Stress in Patch |
|---|
| Hole Diameter (mm) | Pipe Length (m) | Number of Elements | Von Mises Stress (MPa) | Hoop Stress (MPa) | Von Mises Stress (MPa) | Hoop Stress (MPa) |
|---|
| 5 | 0.5 | 17,520 | 2.94 | 2.88 | 3.4 | 3.75 |
| 1.5 | 18,889 | 2.93 | 2.87 | 3.39 | 3.74 |
| 24,732 | 2.92 | 2.86 | 3.4 | 3.73 |
| 7.5 | 0.5 | 20,968 | 3.01 | 2.92 | 3.16 | 3.54 |
| 1.5 | 22,337 | 3 | 2.91 | 3.16 | 3.57 |
| 30,056 | 3.02 | 2.93 | 3.14 | 3.56 |
| 10 | 0.5 | 19,591 | 3.04 | 2.93 | 3.36 | 3.61 |
| 1.5 | 20,960 | 3.03 | 2.92 | 3.36 | 3.61 |
| 24,231 | 3.02 | 2.91 | 3.37 | 3.6 |
| 12.5 | 0.5 | 9,726 | 3 | 2.9 | 3.56 | 3.73 |
| 1.5 | 11,095 | 2.99 | 2.89 | 3.55 | 3.72 |
| 17,928 | 2.98 | 2.88 | 3.56 | 3.71 |
| 15 | 0.5 | 9,726 | 3 | 2.88 | 3.83 | 3.66 |
| 1.5 | 11,095 | 2.99 | 2.87 | 3.82 | 3.65 |
| 22,118 | 2.98 | 2.89 | 3.81 | 3.66 |
| 17.5 | 0.5 | 10,769 | 3.02 | 2.85 | 3.73 | 3.92 |
| 1.5 | 12,138 | 3.01 | 2.84 | 3.73 | 3.92 |
| 18,380 | 3.02 | 2.86 | 3.72 | 3.91 |
| 20.0 | 0.5 | 10,769 | 3.01 | 3.83 | 3.86 | 3.98 |
| 1.5 | 12,138 | 3 | 3.82 | 3.85 | 3.98 |
| 18,380 | 3.02 | 3.82 | 3.84 | 3.99 |
Table 5.
Number of finite elements used to model unburied pipe and its patch for various patch arrangements.
Table 5.
Number of finite elements used to model unburied pipe and its patch for various patch arrangements.
| Hole Diameter (mm) | Number of Finite Elements |
|---|
| Saddle Fusion Patch | Semi-Cylindrical Patch | Circular Partial Patch | Square Partial Patch |
|---|
| 5 | 18,889 | 18,044 | 8,198 | 6,823 |
| 7.5 | 22,.337 | 20,739 | 8,198 | 6,791 |
| 10 | 20,960 | 20,004 | 8,198 | 6,099 |
| 12.5 | 11,095 | 10,619 | 8,198 | 4,933 |
| 15 | 11,095 | 10,619 | 8,198 | 4,933 |
| 17.5 | 12,138 | 10,881 | 8,198 | 5,426 |
| 20 | 12,138 | 10,881 | 8,198 | 5,426 |
Table 6.
Maximum Von Mises stress reduction percentage in the holed pipe for various patch arrangements under internal pressure.
Table 6.
Maximum Von Mises stress reduction percentage in the holed pipe for various patch arrangements under internal pressure.
| Hole Diameter (mm) | Maximum Von Mises Stress Reduction in Pipe (%) |
|---|
| Square Partial Patch | Circular Partial Patch | Saddle Fusion Patch | Semi-Cylindrical Patch |
|---|
| 5 | 12.5 | 7.9 | 48.6 | 46.5 |
| 7.5 | 17 | 15.9 | 50.9 | 48.9 |
| 10 | 20.4 | 20.5 | 53.2 | 51.1 |
| 12.5 | 23.4 | 25.1 | 55.4 | 53.5 |
| 15 | 26.3 | 29.7 | 57.1 | 54.8 |
| 17.5 | 29.9 | 32.3 | 59.2 | 57 |
| 20 | 33.5 | 34.2 | 61.4 | 59.3 |
Table 7.
Simultaneous effect of soil column weight and internal pressure on maximum hoop and Von Mises stresses in defected pipe and patch for various x and z values.
Table 7.
Simultaneous effect of soil column weight and internal pressure on maximum hoop and Von Mises stresses in defected pipe and patch for various x and z values.
| Finite Element Model Specifications | Maximum Stress in Pipe | Maximum Stress in Patch |
|---|
| Hole Diameter (mm) | Model Upper Surface Dimension z × x = A | Number Finite Elements | Von Mises Stress (MPa) | Hoop Stress (MPa) | Von Mises Stress (MPa) | Hoop Stress (MPa) |
|---|
| 5 | 0.50 m × 0.4143 m | 38,986 | 3.99 | 4.09 | 3.39 | 3.77 |
| 0.50 m ×1.00 m | 49,182 | 3.36 | 3.35 | 3.37 | 3.73 |
| 1.50 m × 1.00 m | 57,594 | 3.35 | 3.34 | 3.37 | 3.73 |
| 0.50 m × 1.50 m | 73,537 | 3.25 | 3.22 | 3.36 | 3.71 |
| 1.50 m × 1.50 m | 81,068 | 3.24 | 3.22 | 3.35 | 3.7 |
| 20 | 0.50 m × 0.4143 m | 27,036 | 4.01 | 3.89 | 3.95 | 4.11 |
| 0.50 m × 1.00 m | 46,977 | 3.38 | 3.22 | 3.87 | 3.98 |
| 1.50 m × 1.00 m | 62,011 | 3.37 | 3.22 | 3.86 | 3.98 |
| 0.50 m × 1.50 m | 74,326 | 3.28 | 3.11 | 3.84 | 3.94 |
| 1.50 m × 1.50 m | 82,994 | 3.27 | 3.1 | 3.38 | 3.95 |


