Intelligence-Based Battery Management and Economic Analysis of an Optimized Dual-Vanadium Redox Battery (VRB) for a Wind-PV Hybrid System

 ,
,  and
and
Abstract
1. Introduction
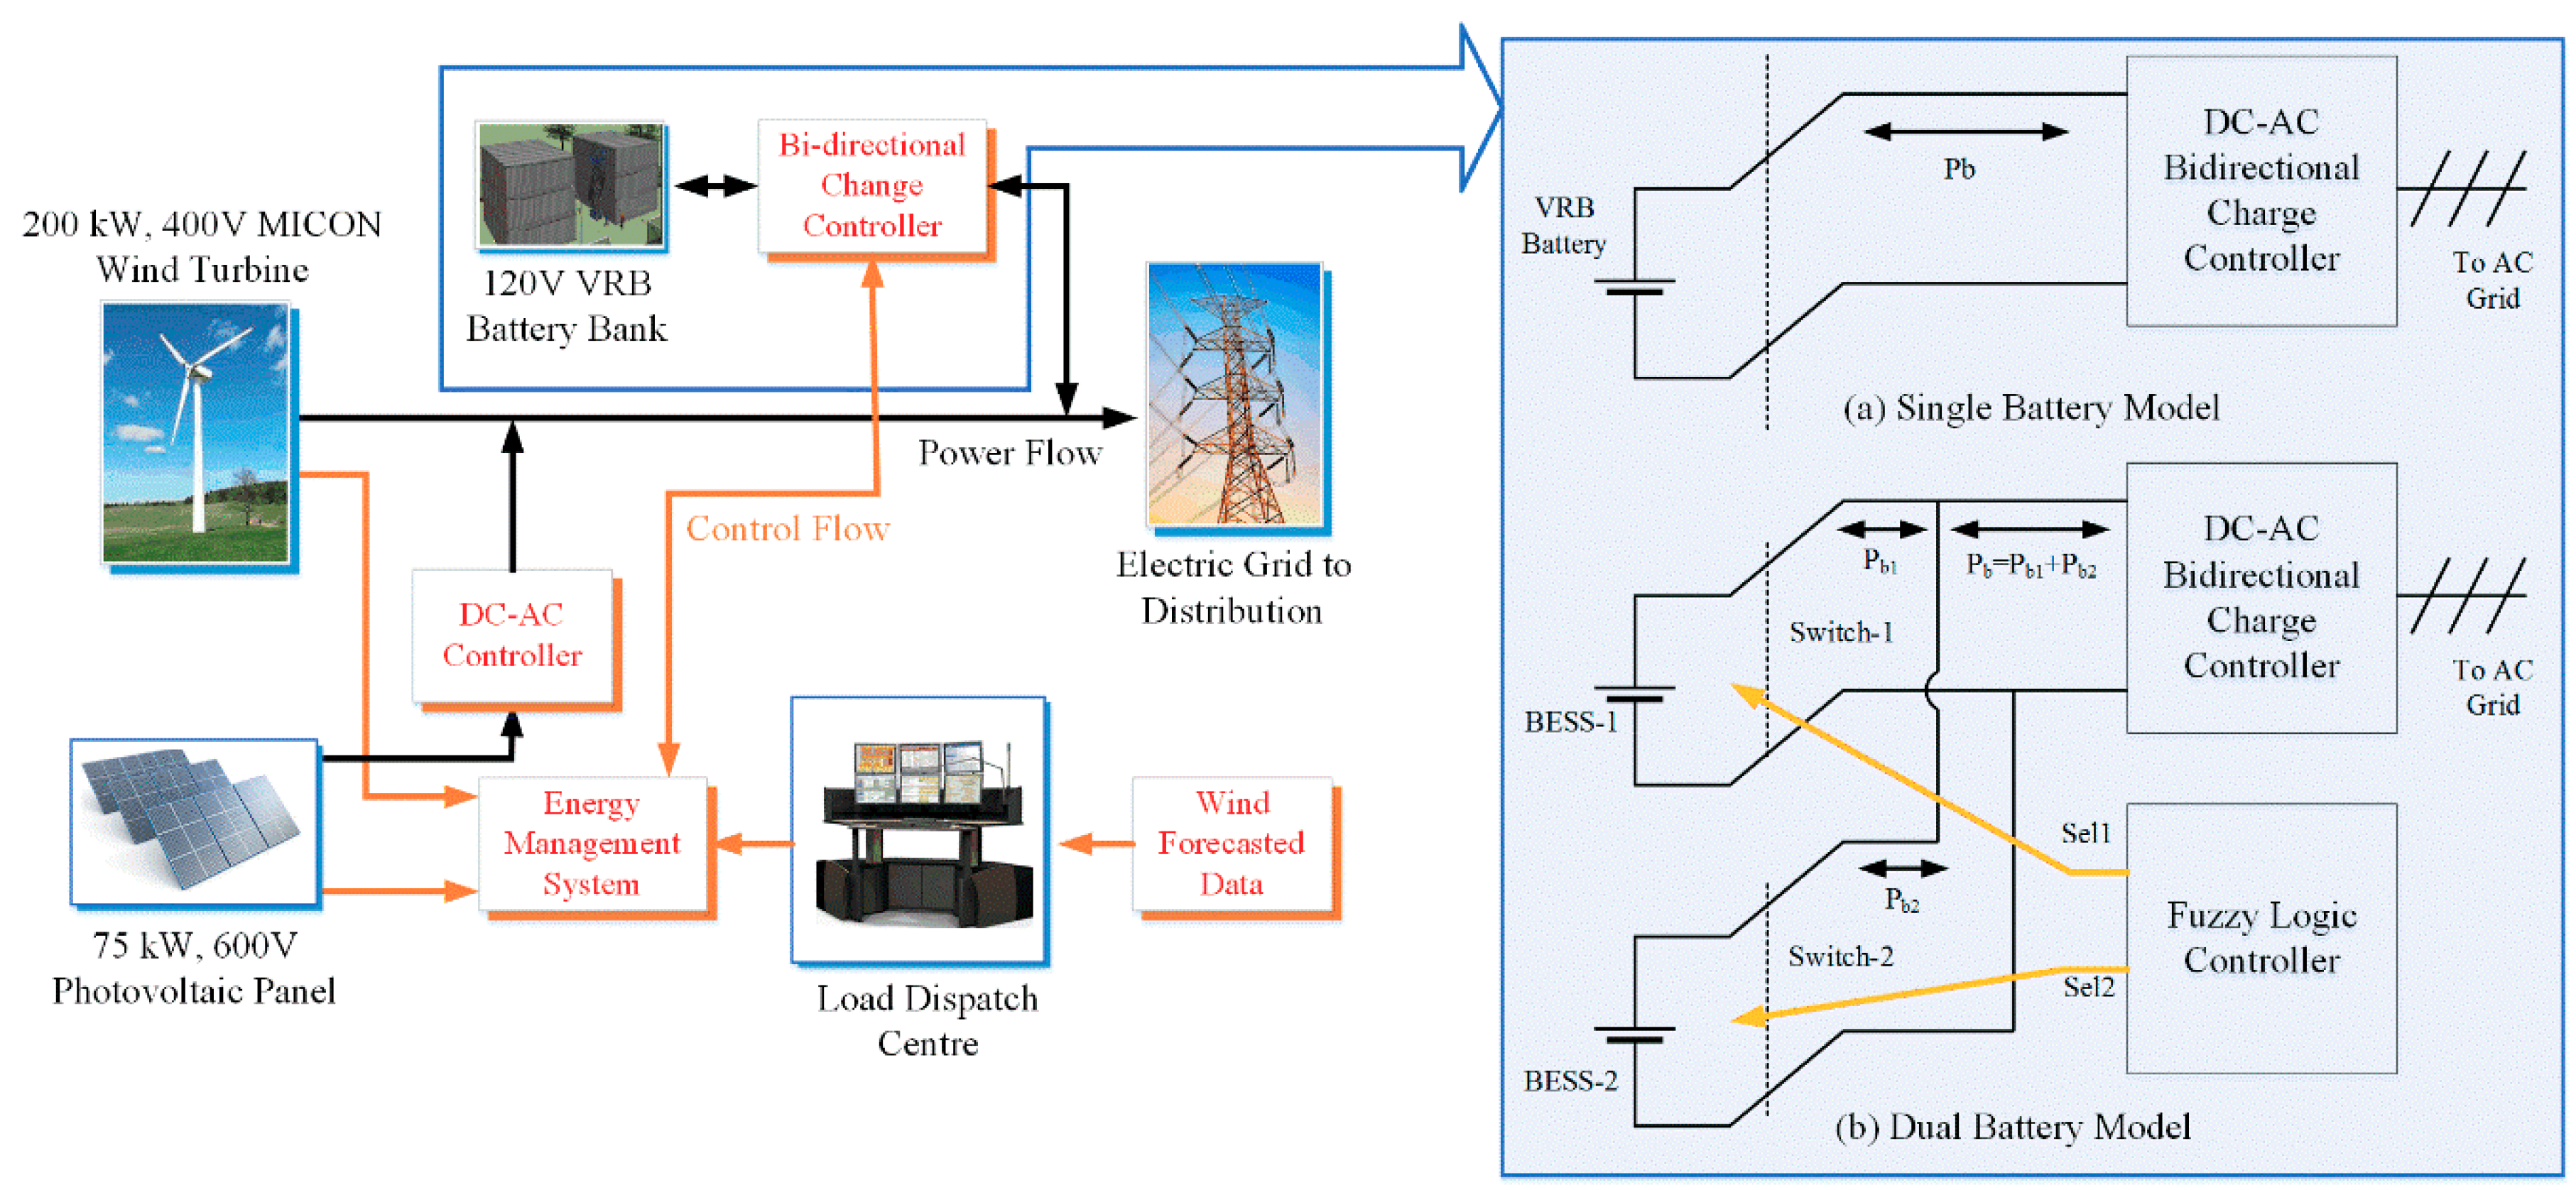
2. System Modeling and Power Dispatch Scheduling
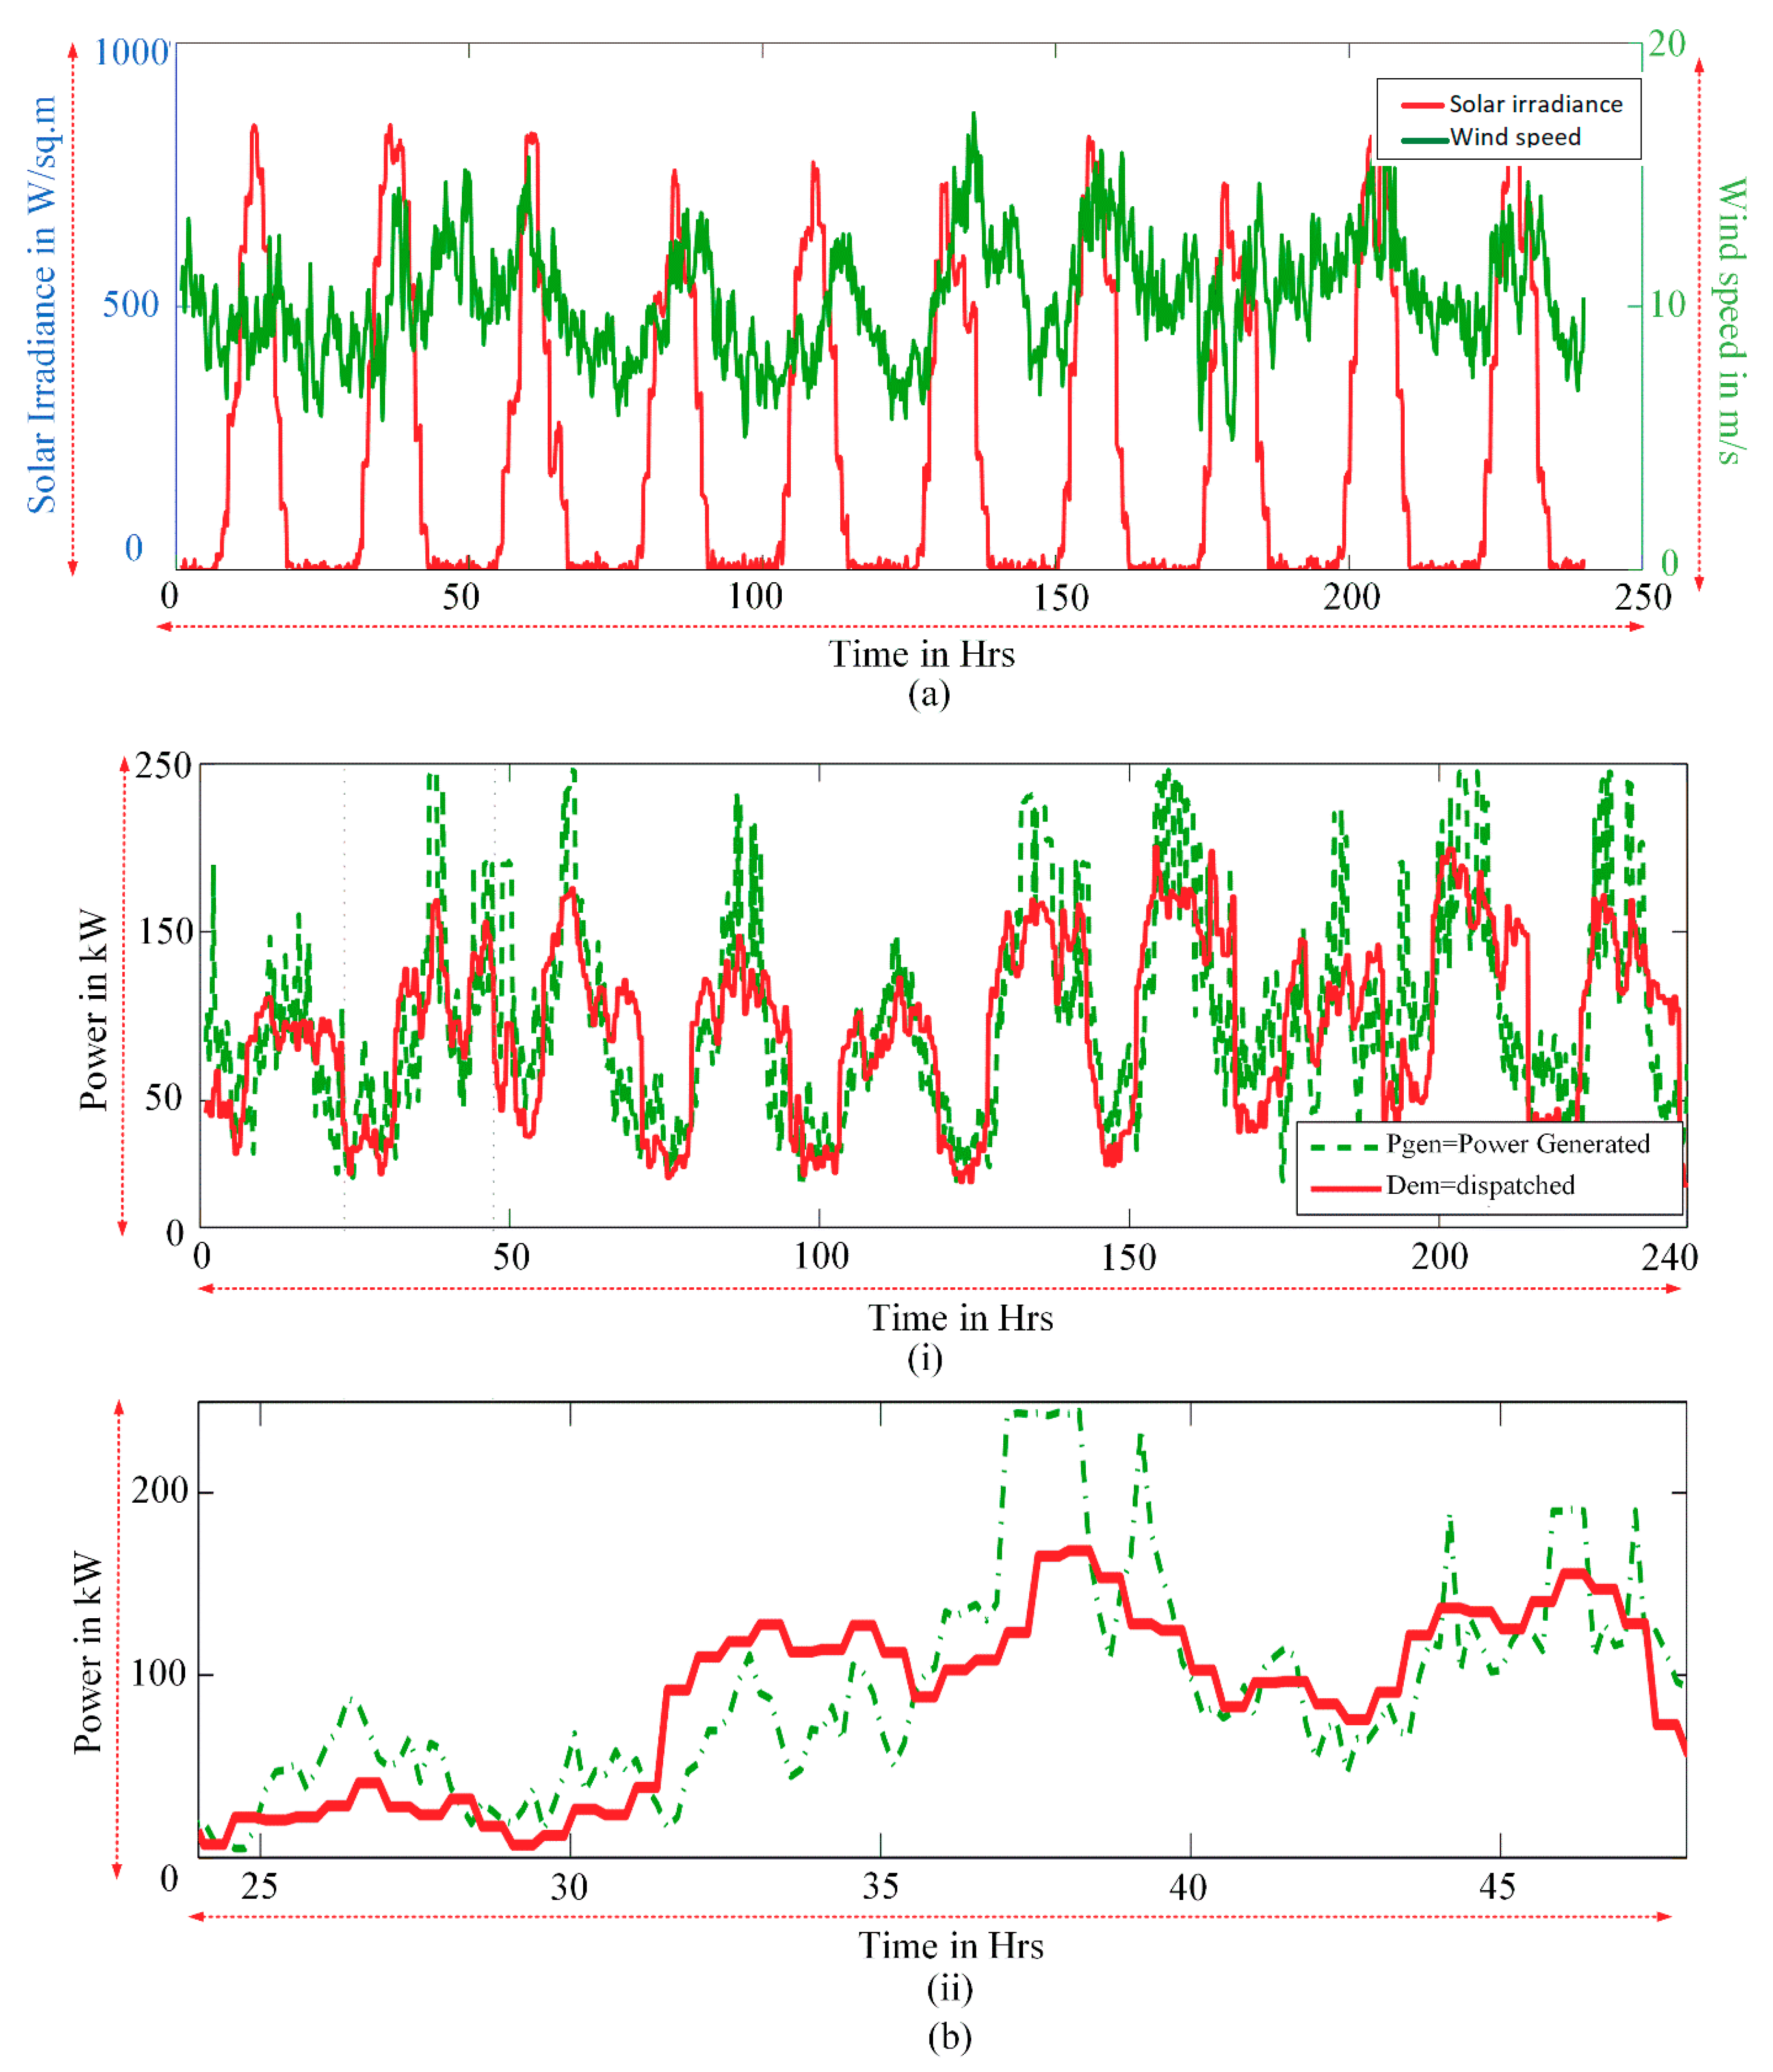
2.1. Wind Turbine Model
2.2. Solar Model
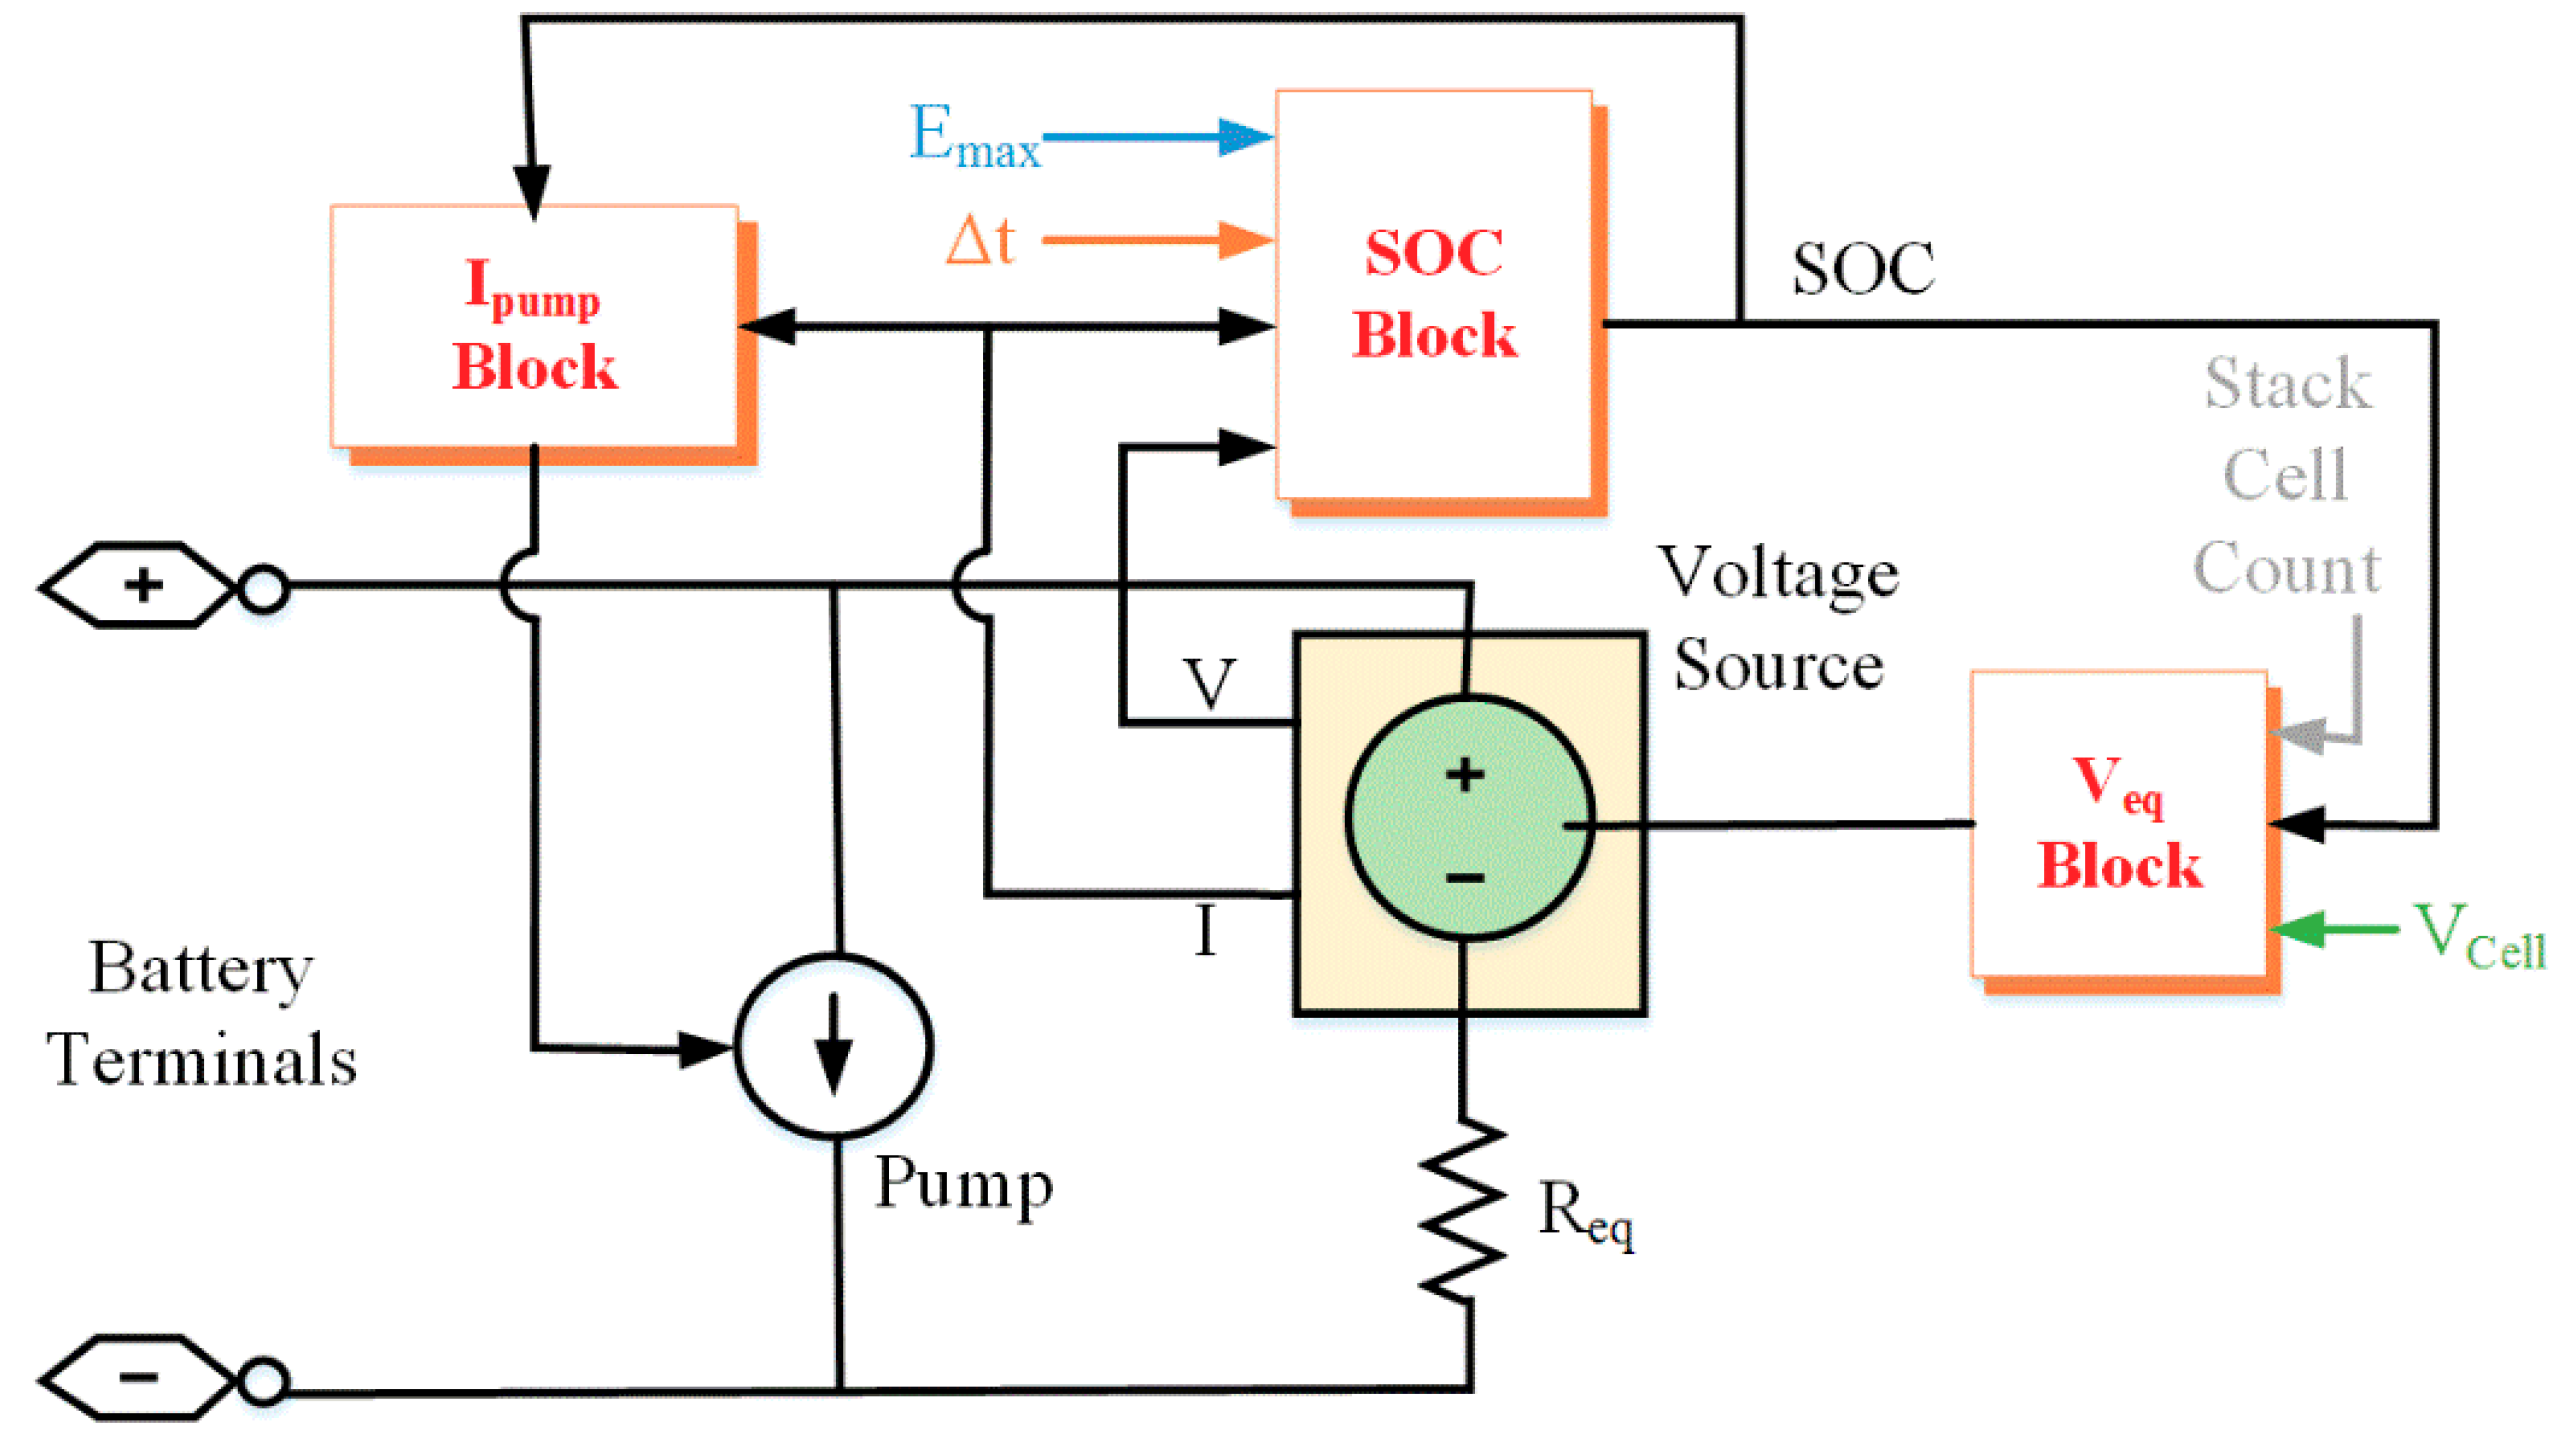
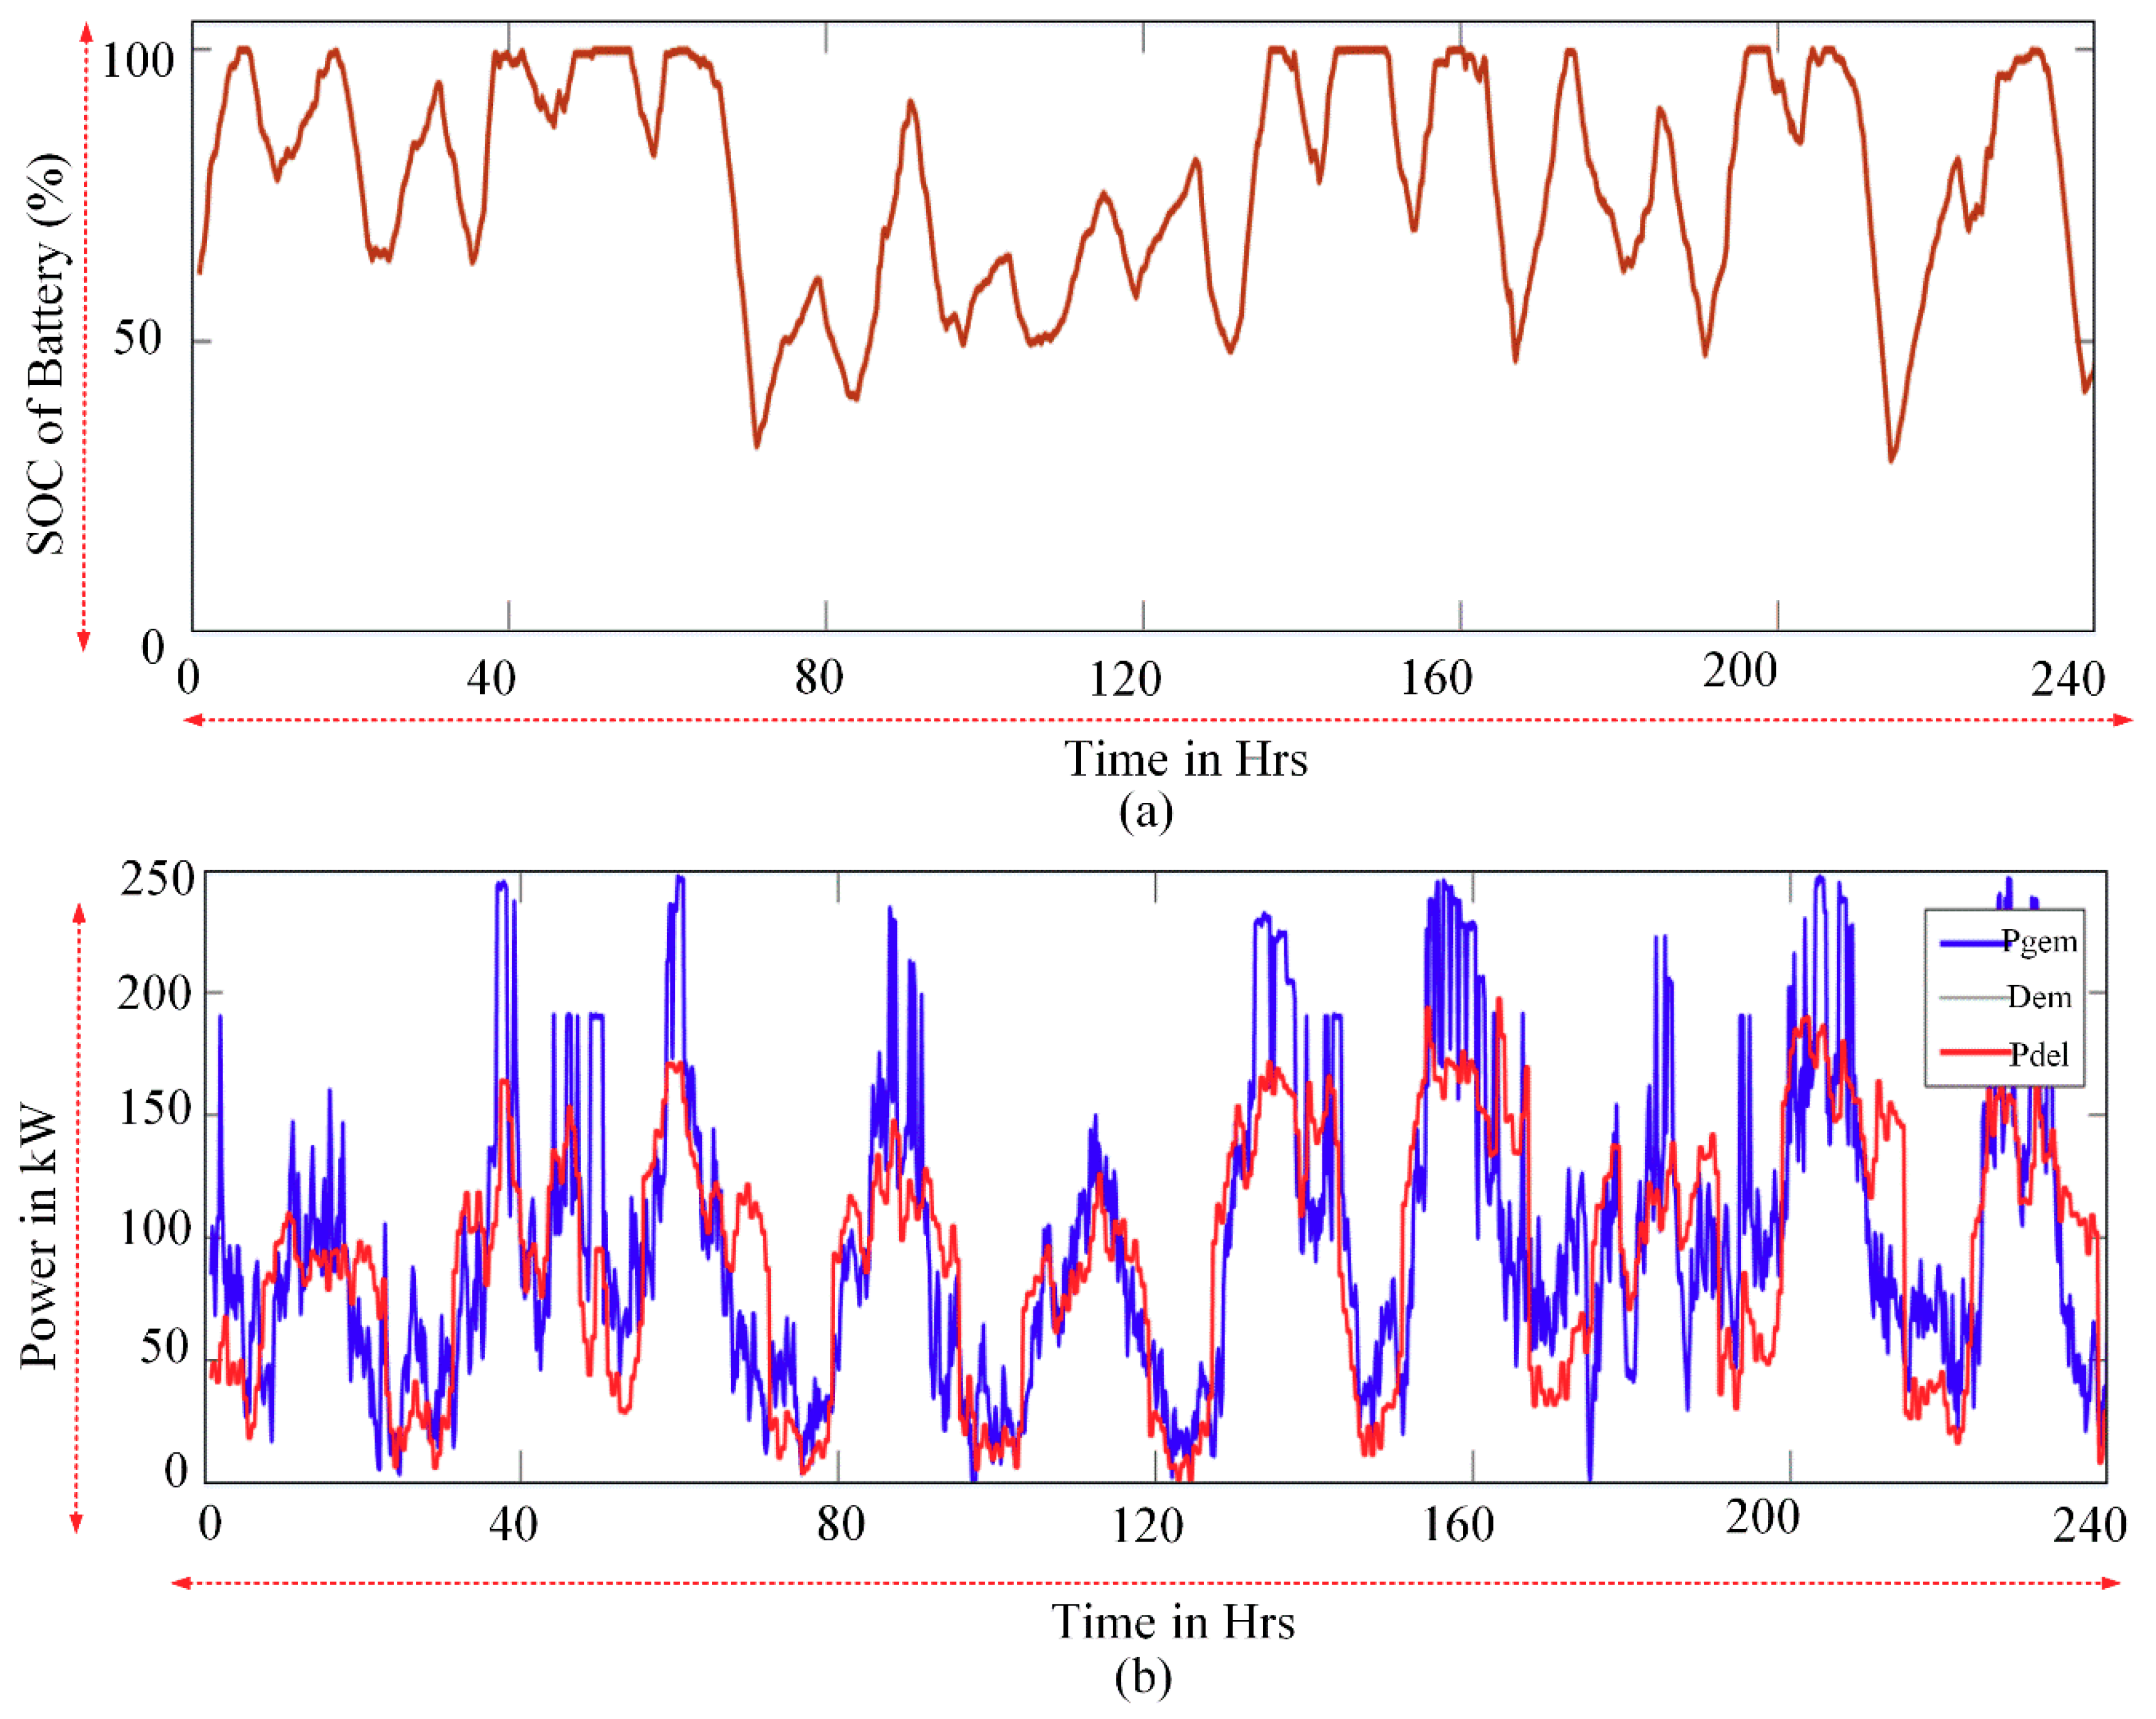
2.3. Battery Model
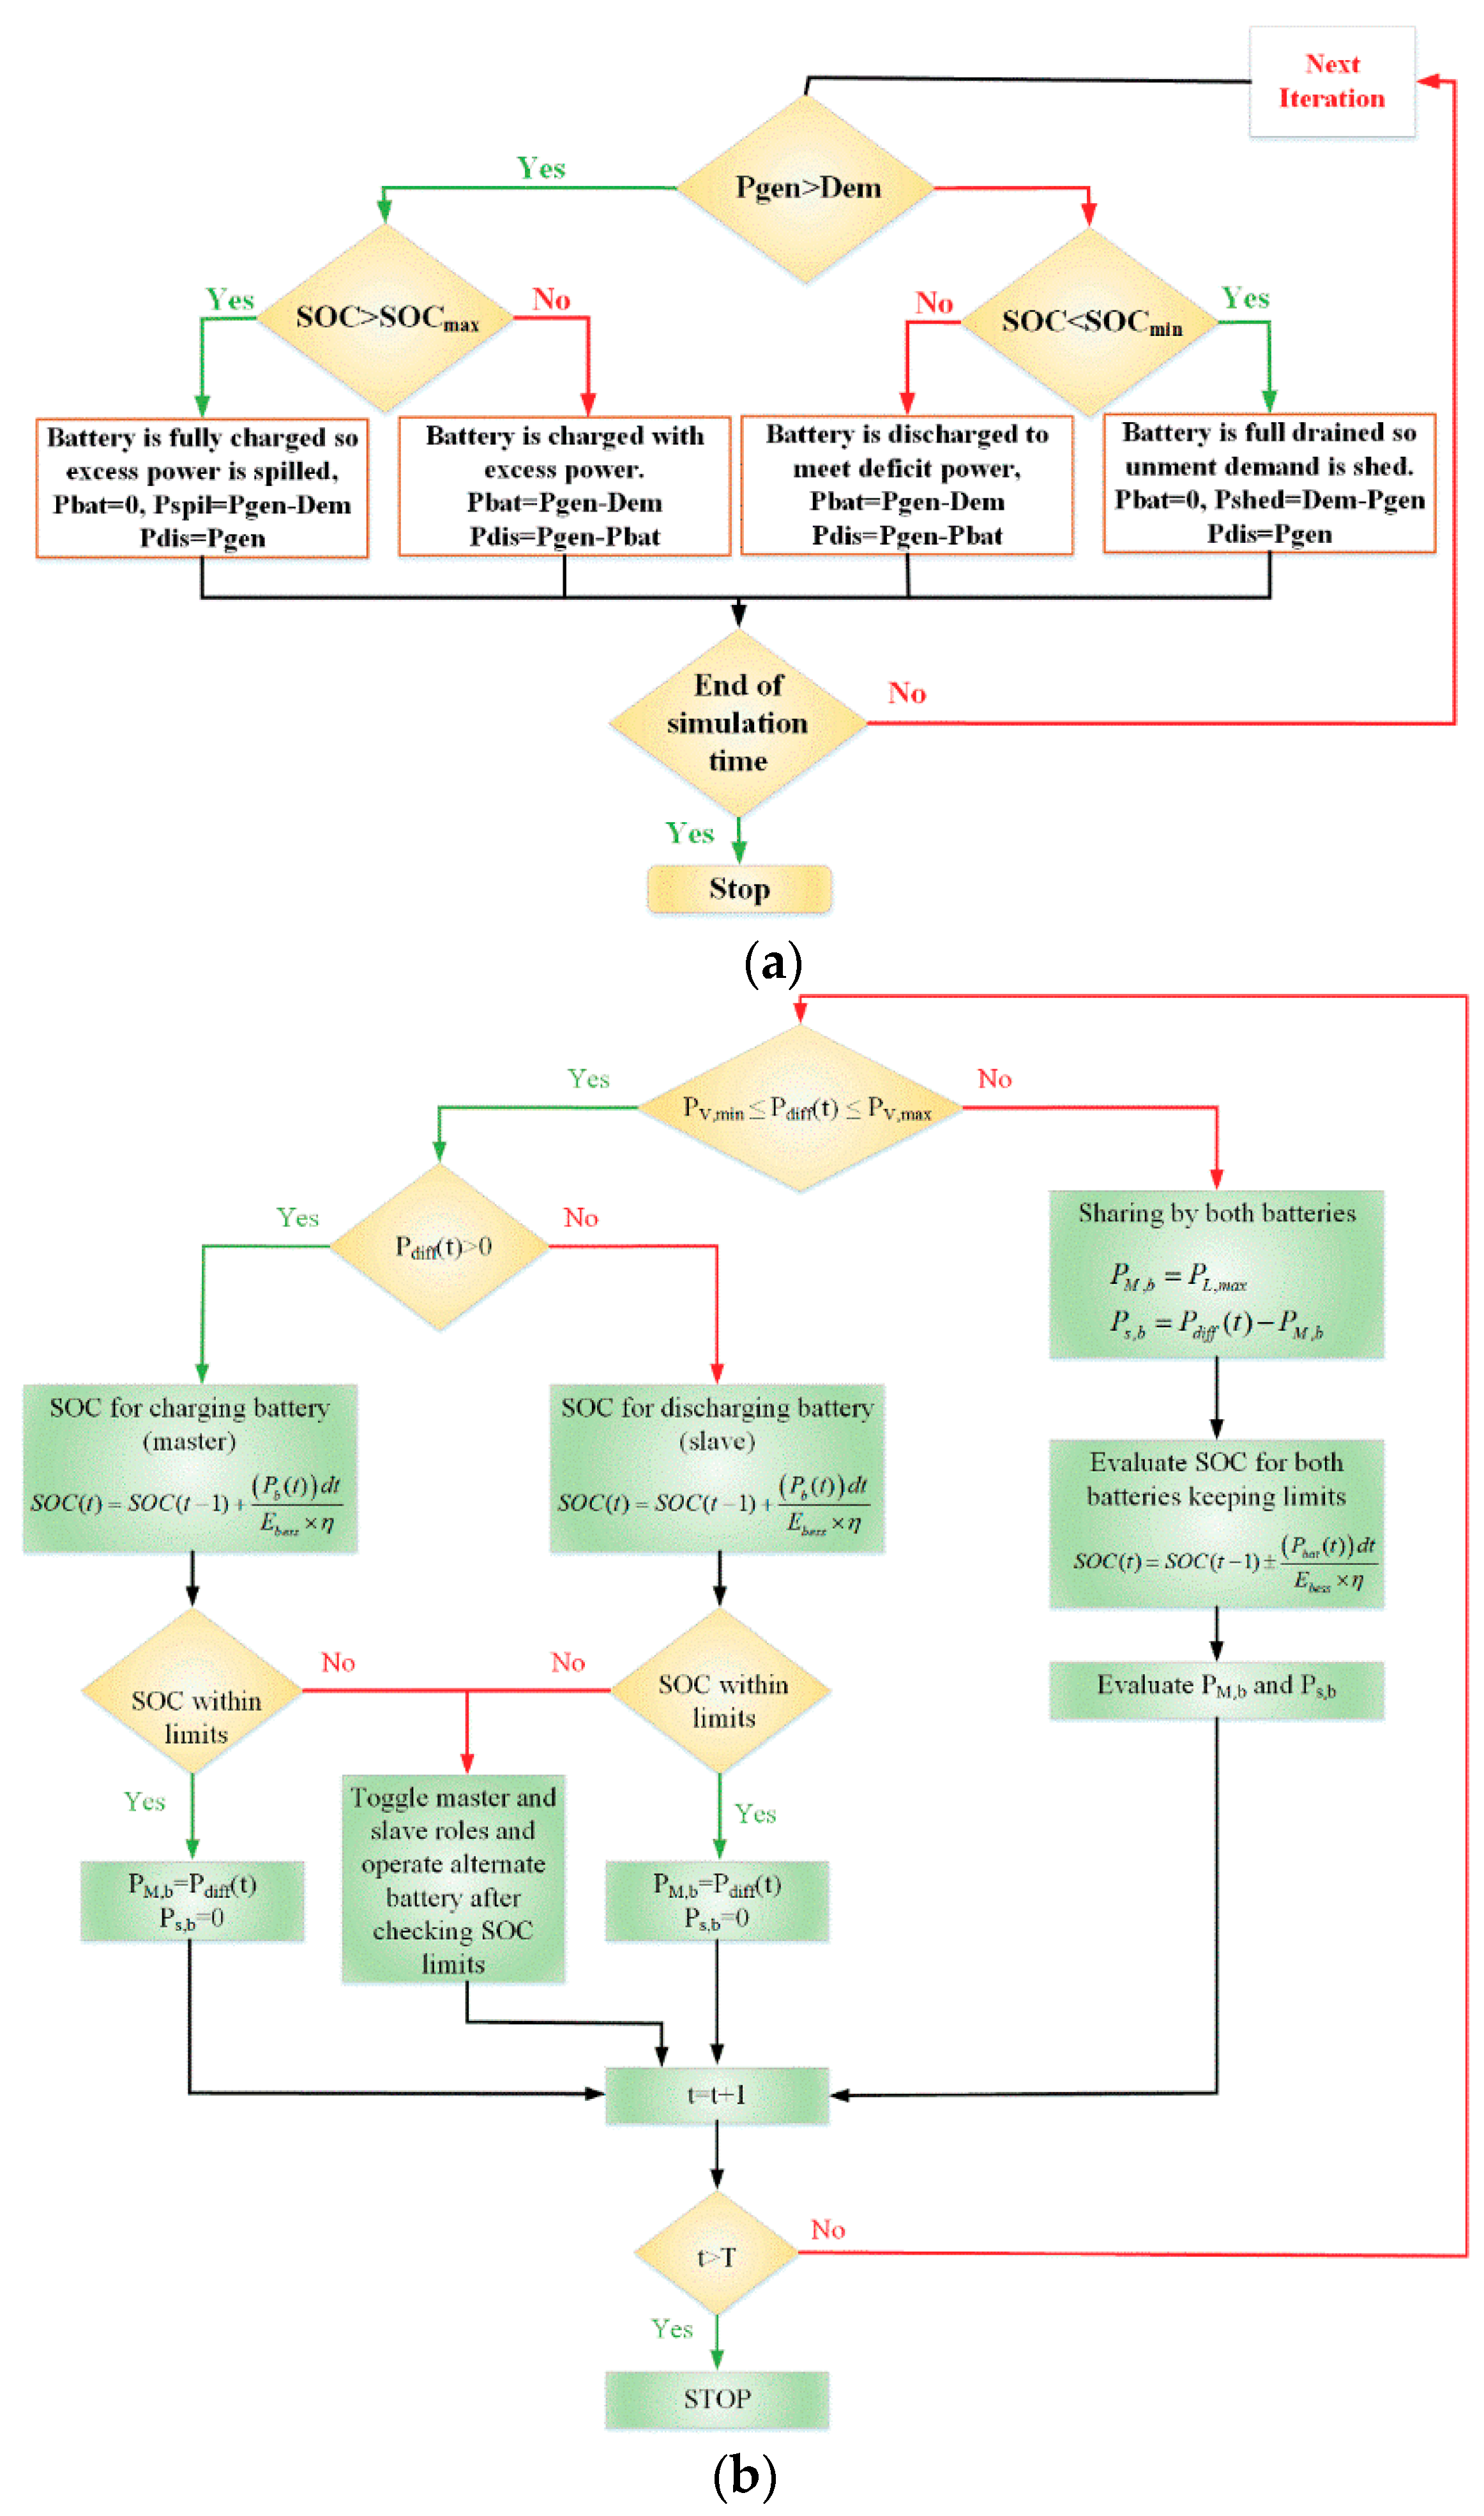
2.4. Forecasting and Scheduling of Power Dispatch
3. Optimized Sizing of the VRB Flow Battery
Sizing Methodology
4. Energy Management of Dual Battery
4.1. Single Battery Model
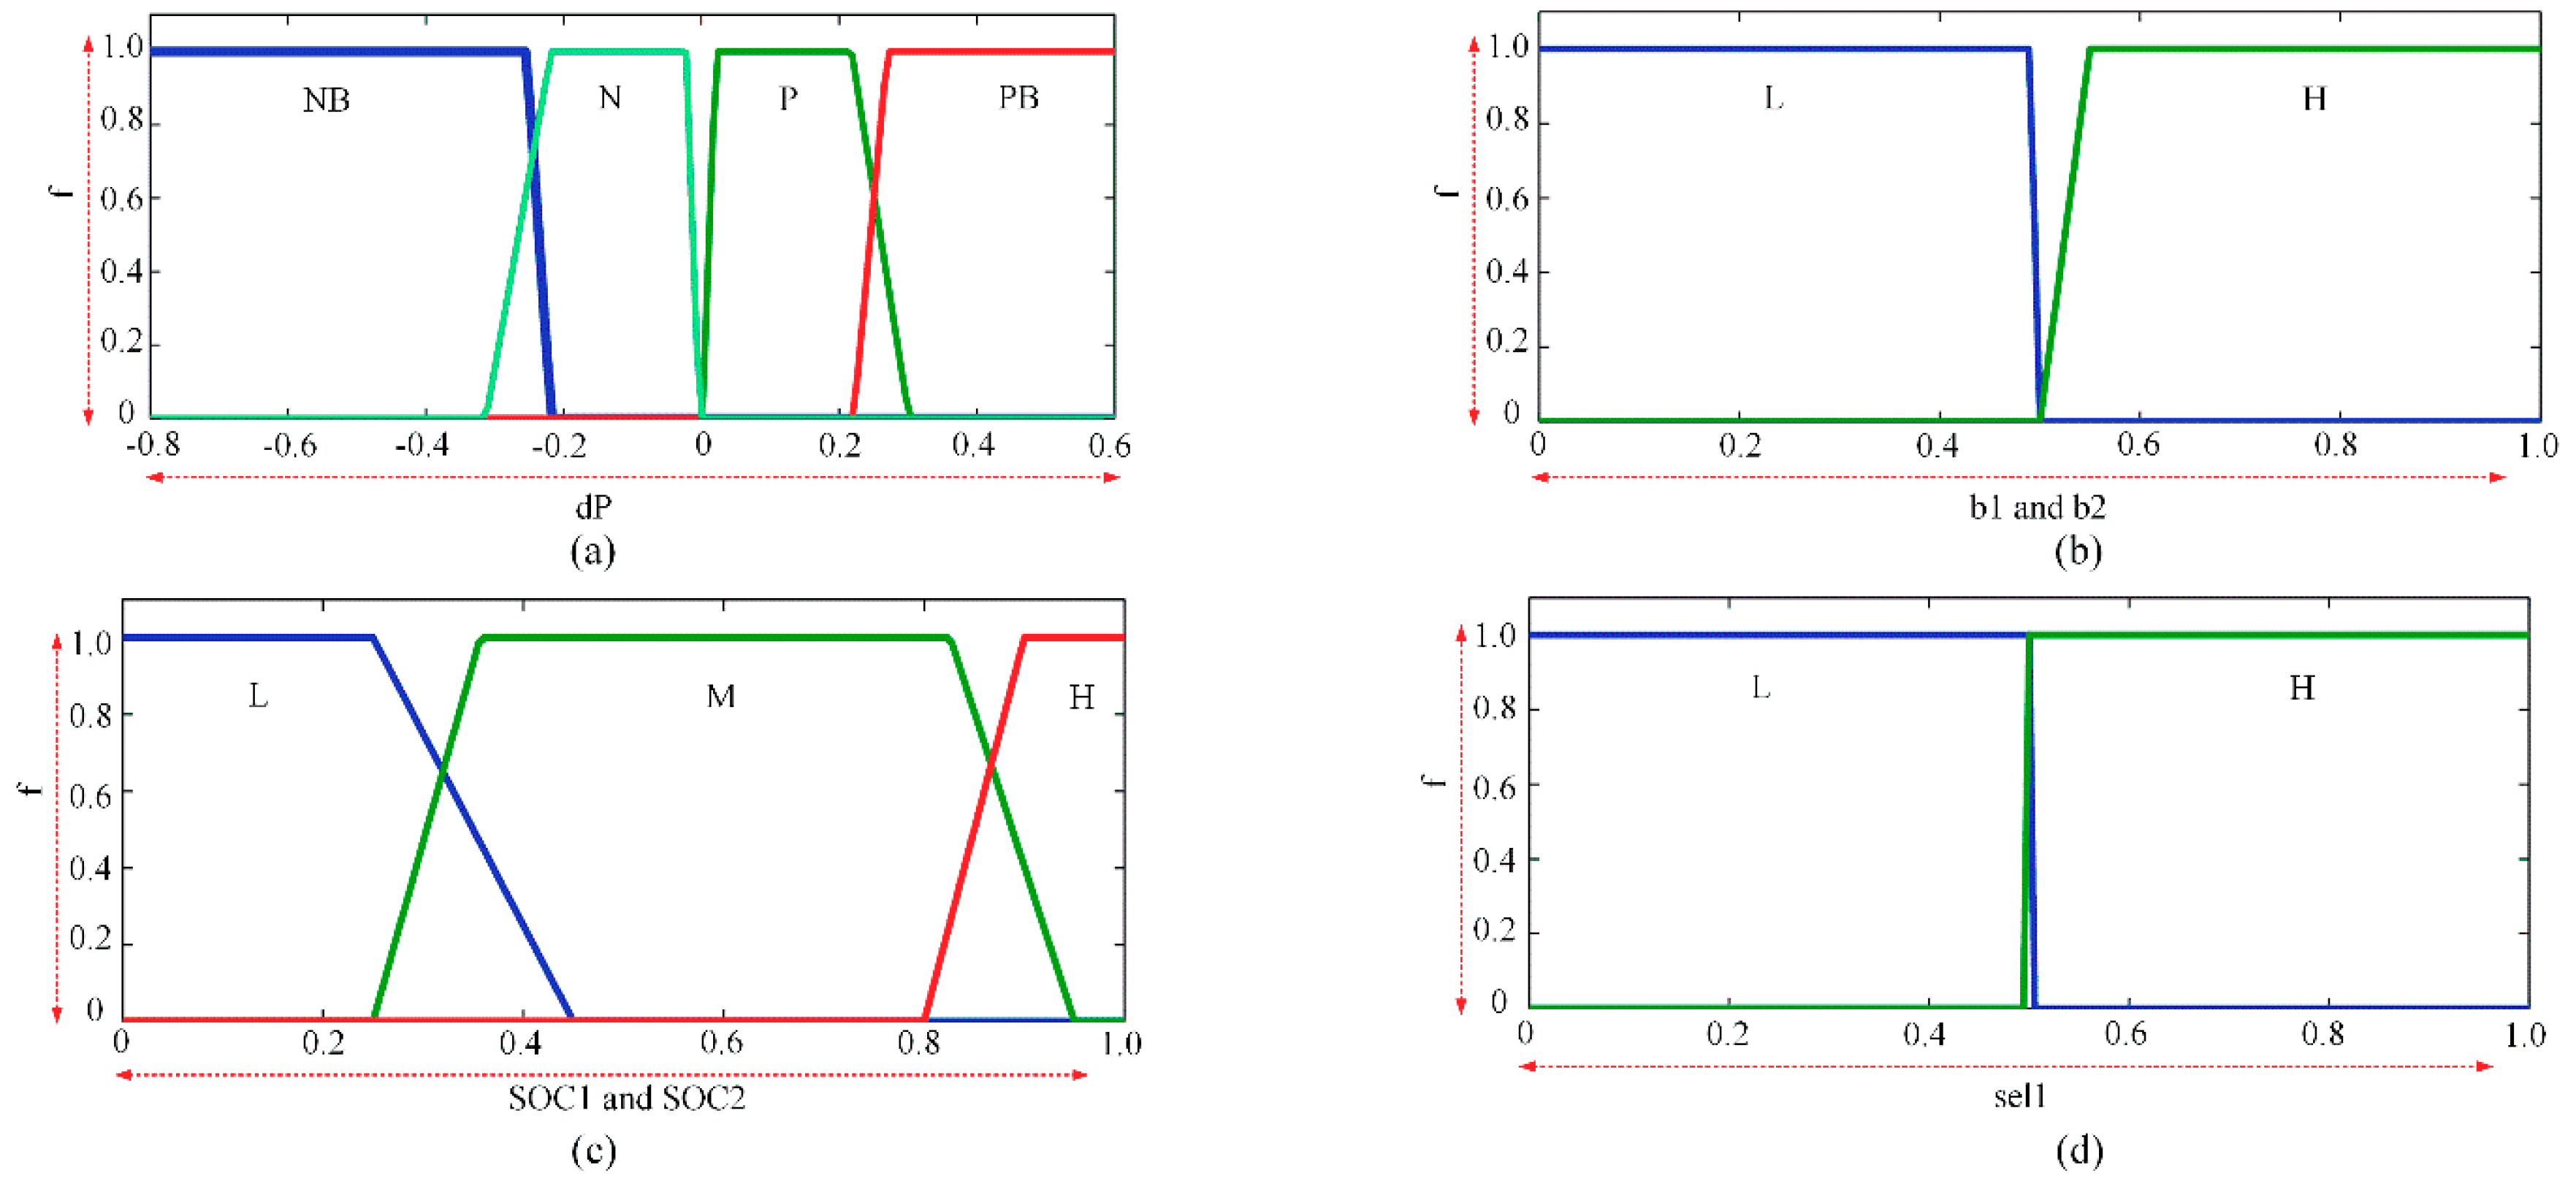
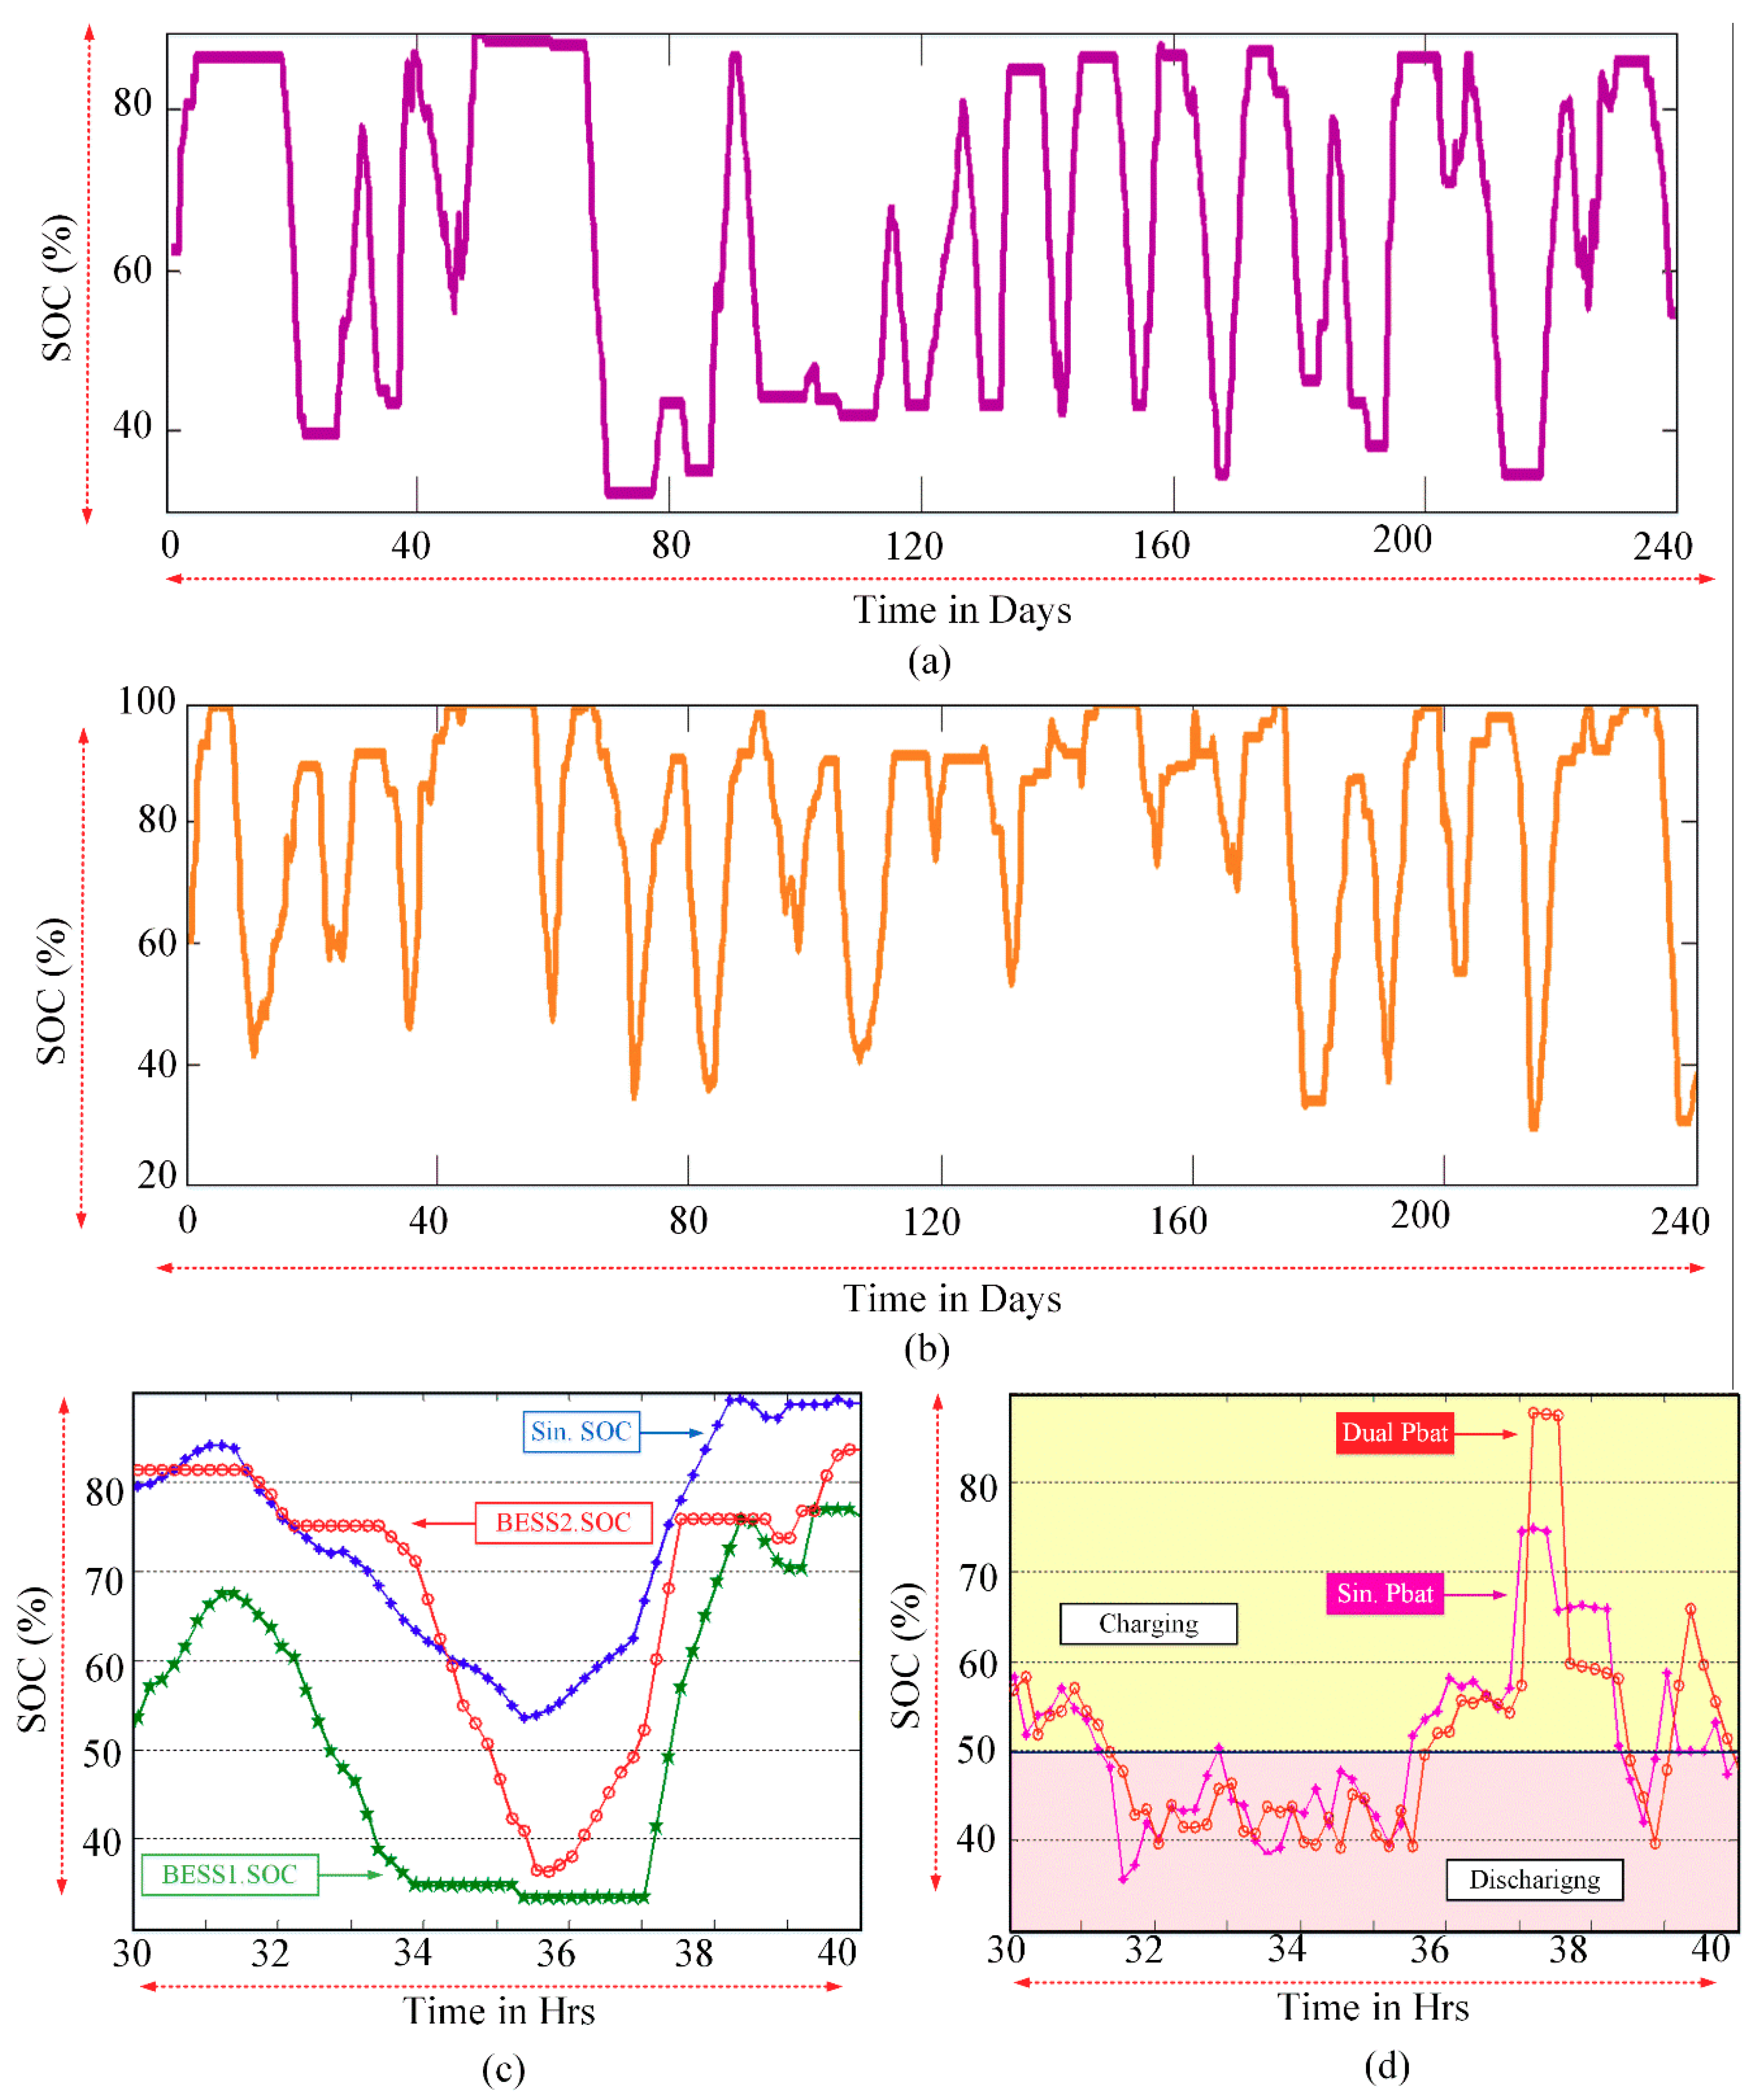
4.2. Dual Battery Model
5. Simulation Results and Discussion
5.1. Forecasting, Dispatch Scheduling and Sizing Result
5.2. Single VRB Model Strategy
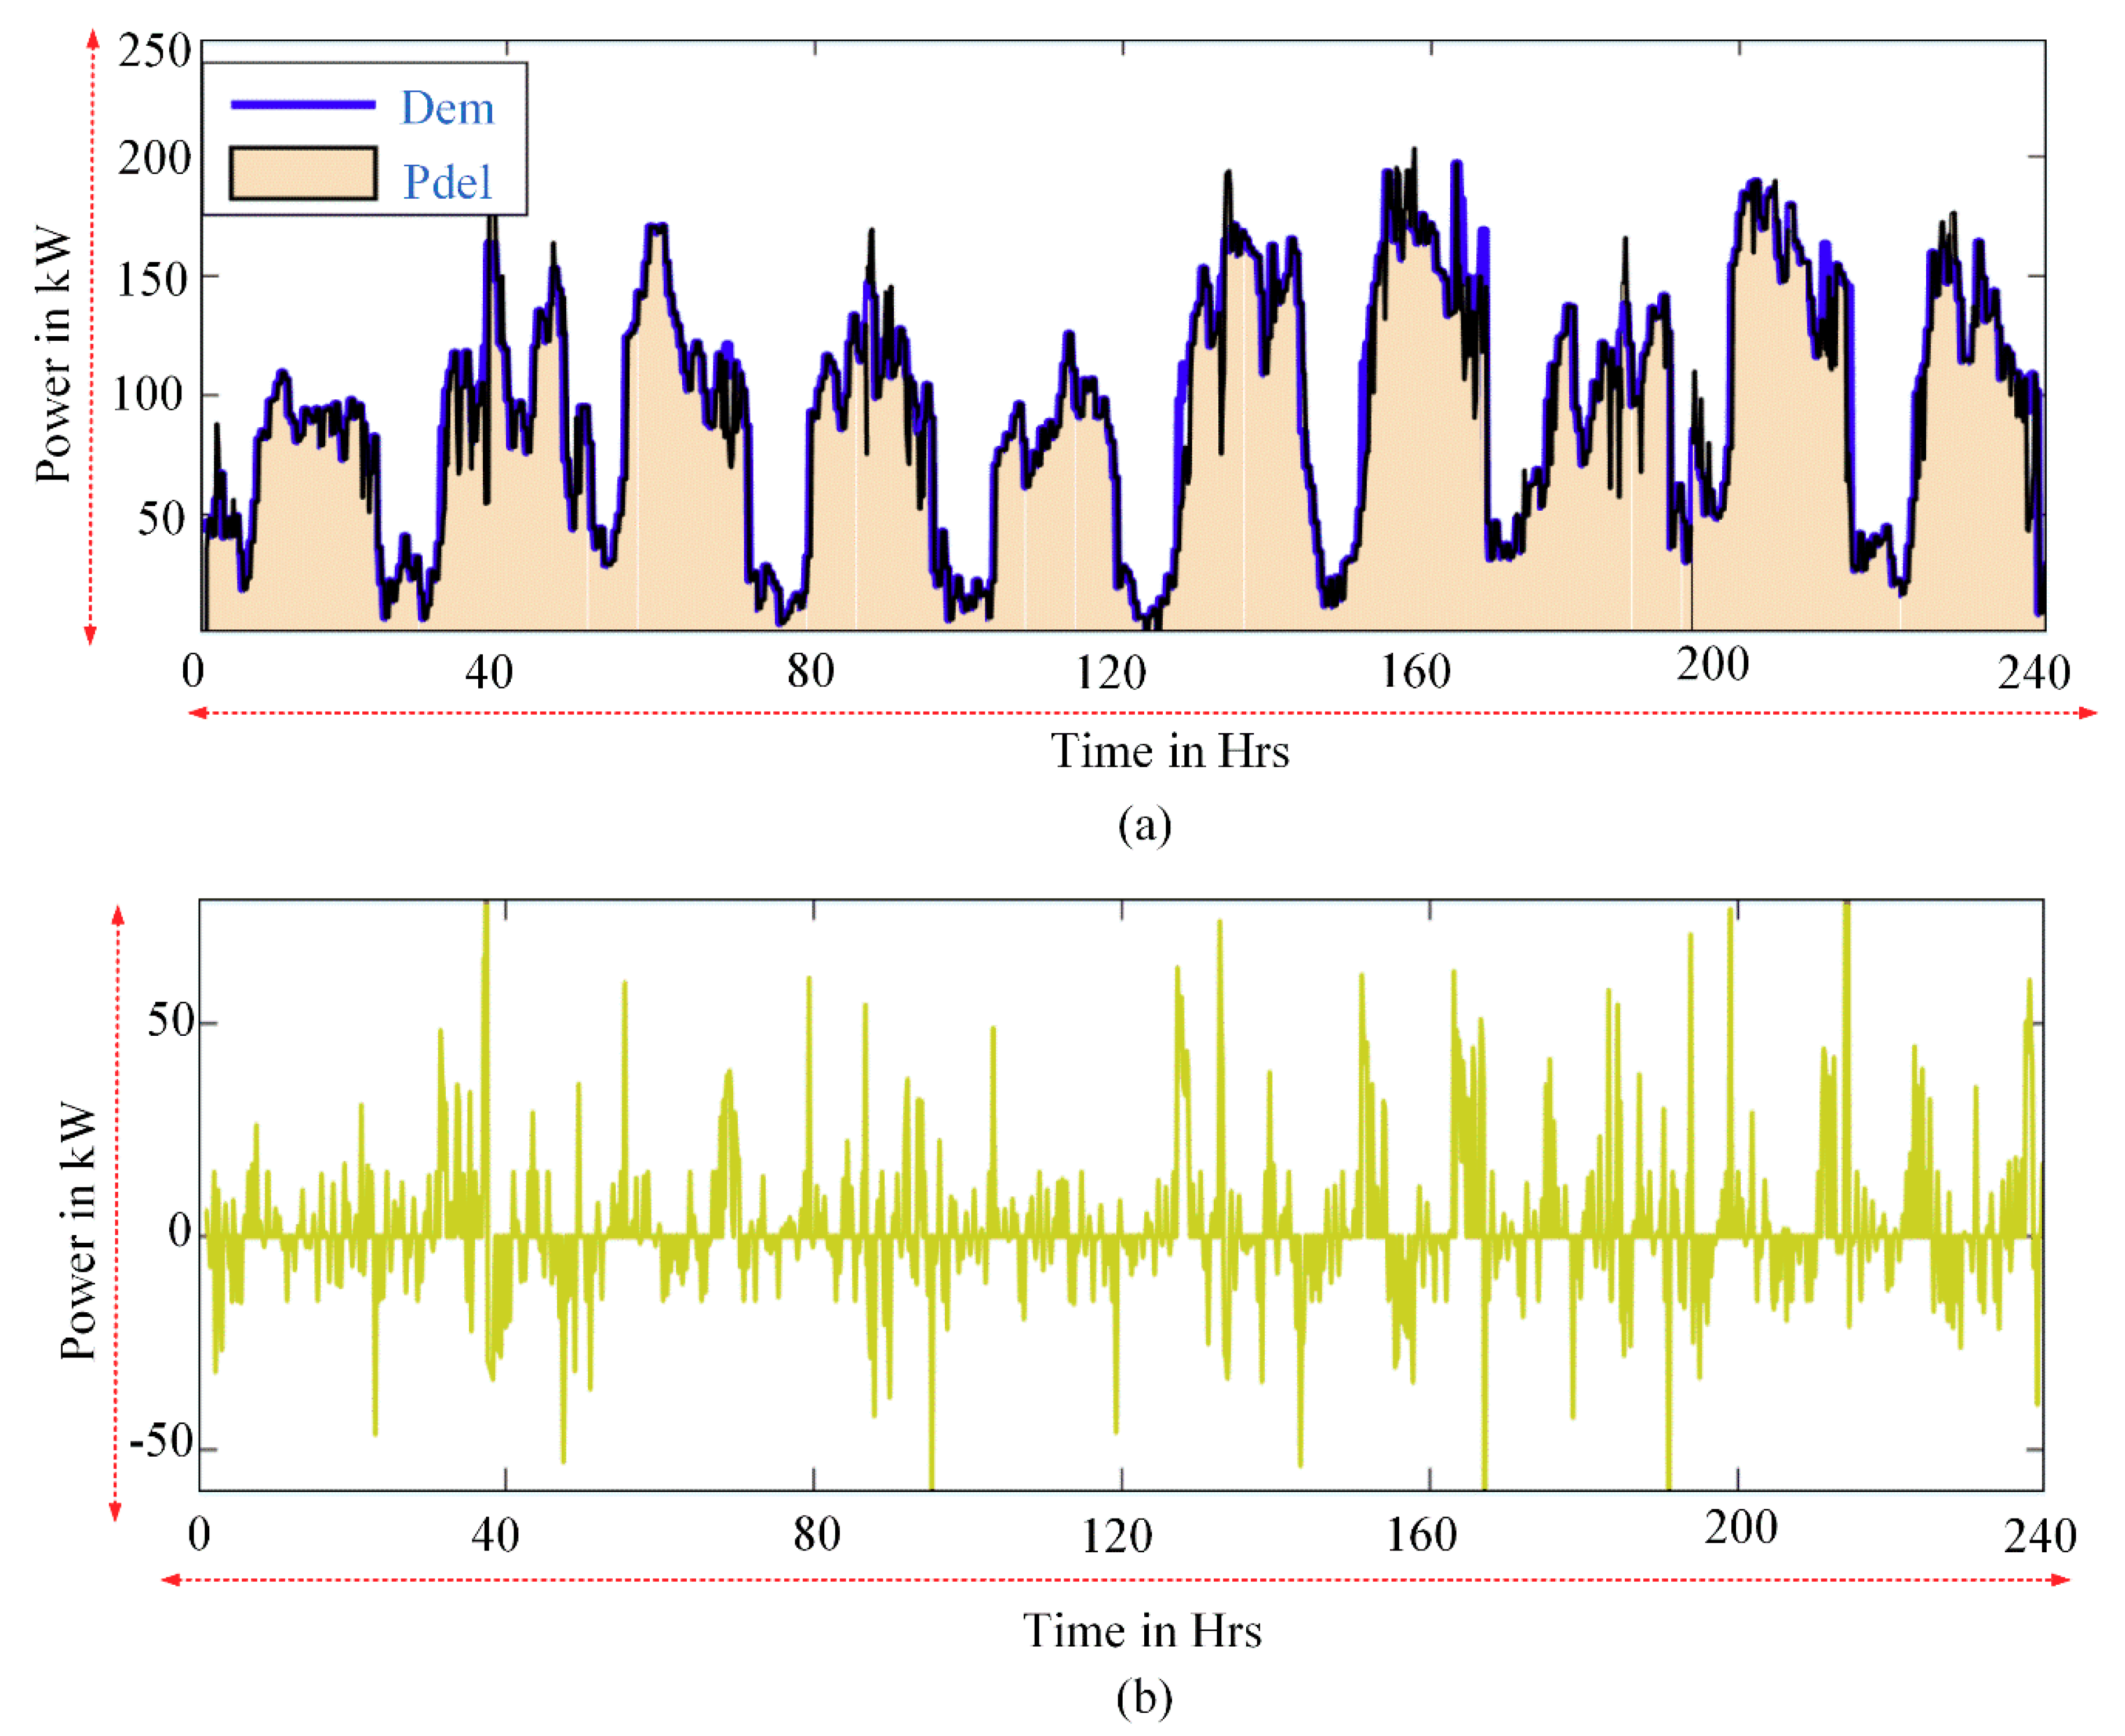
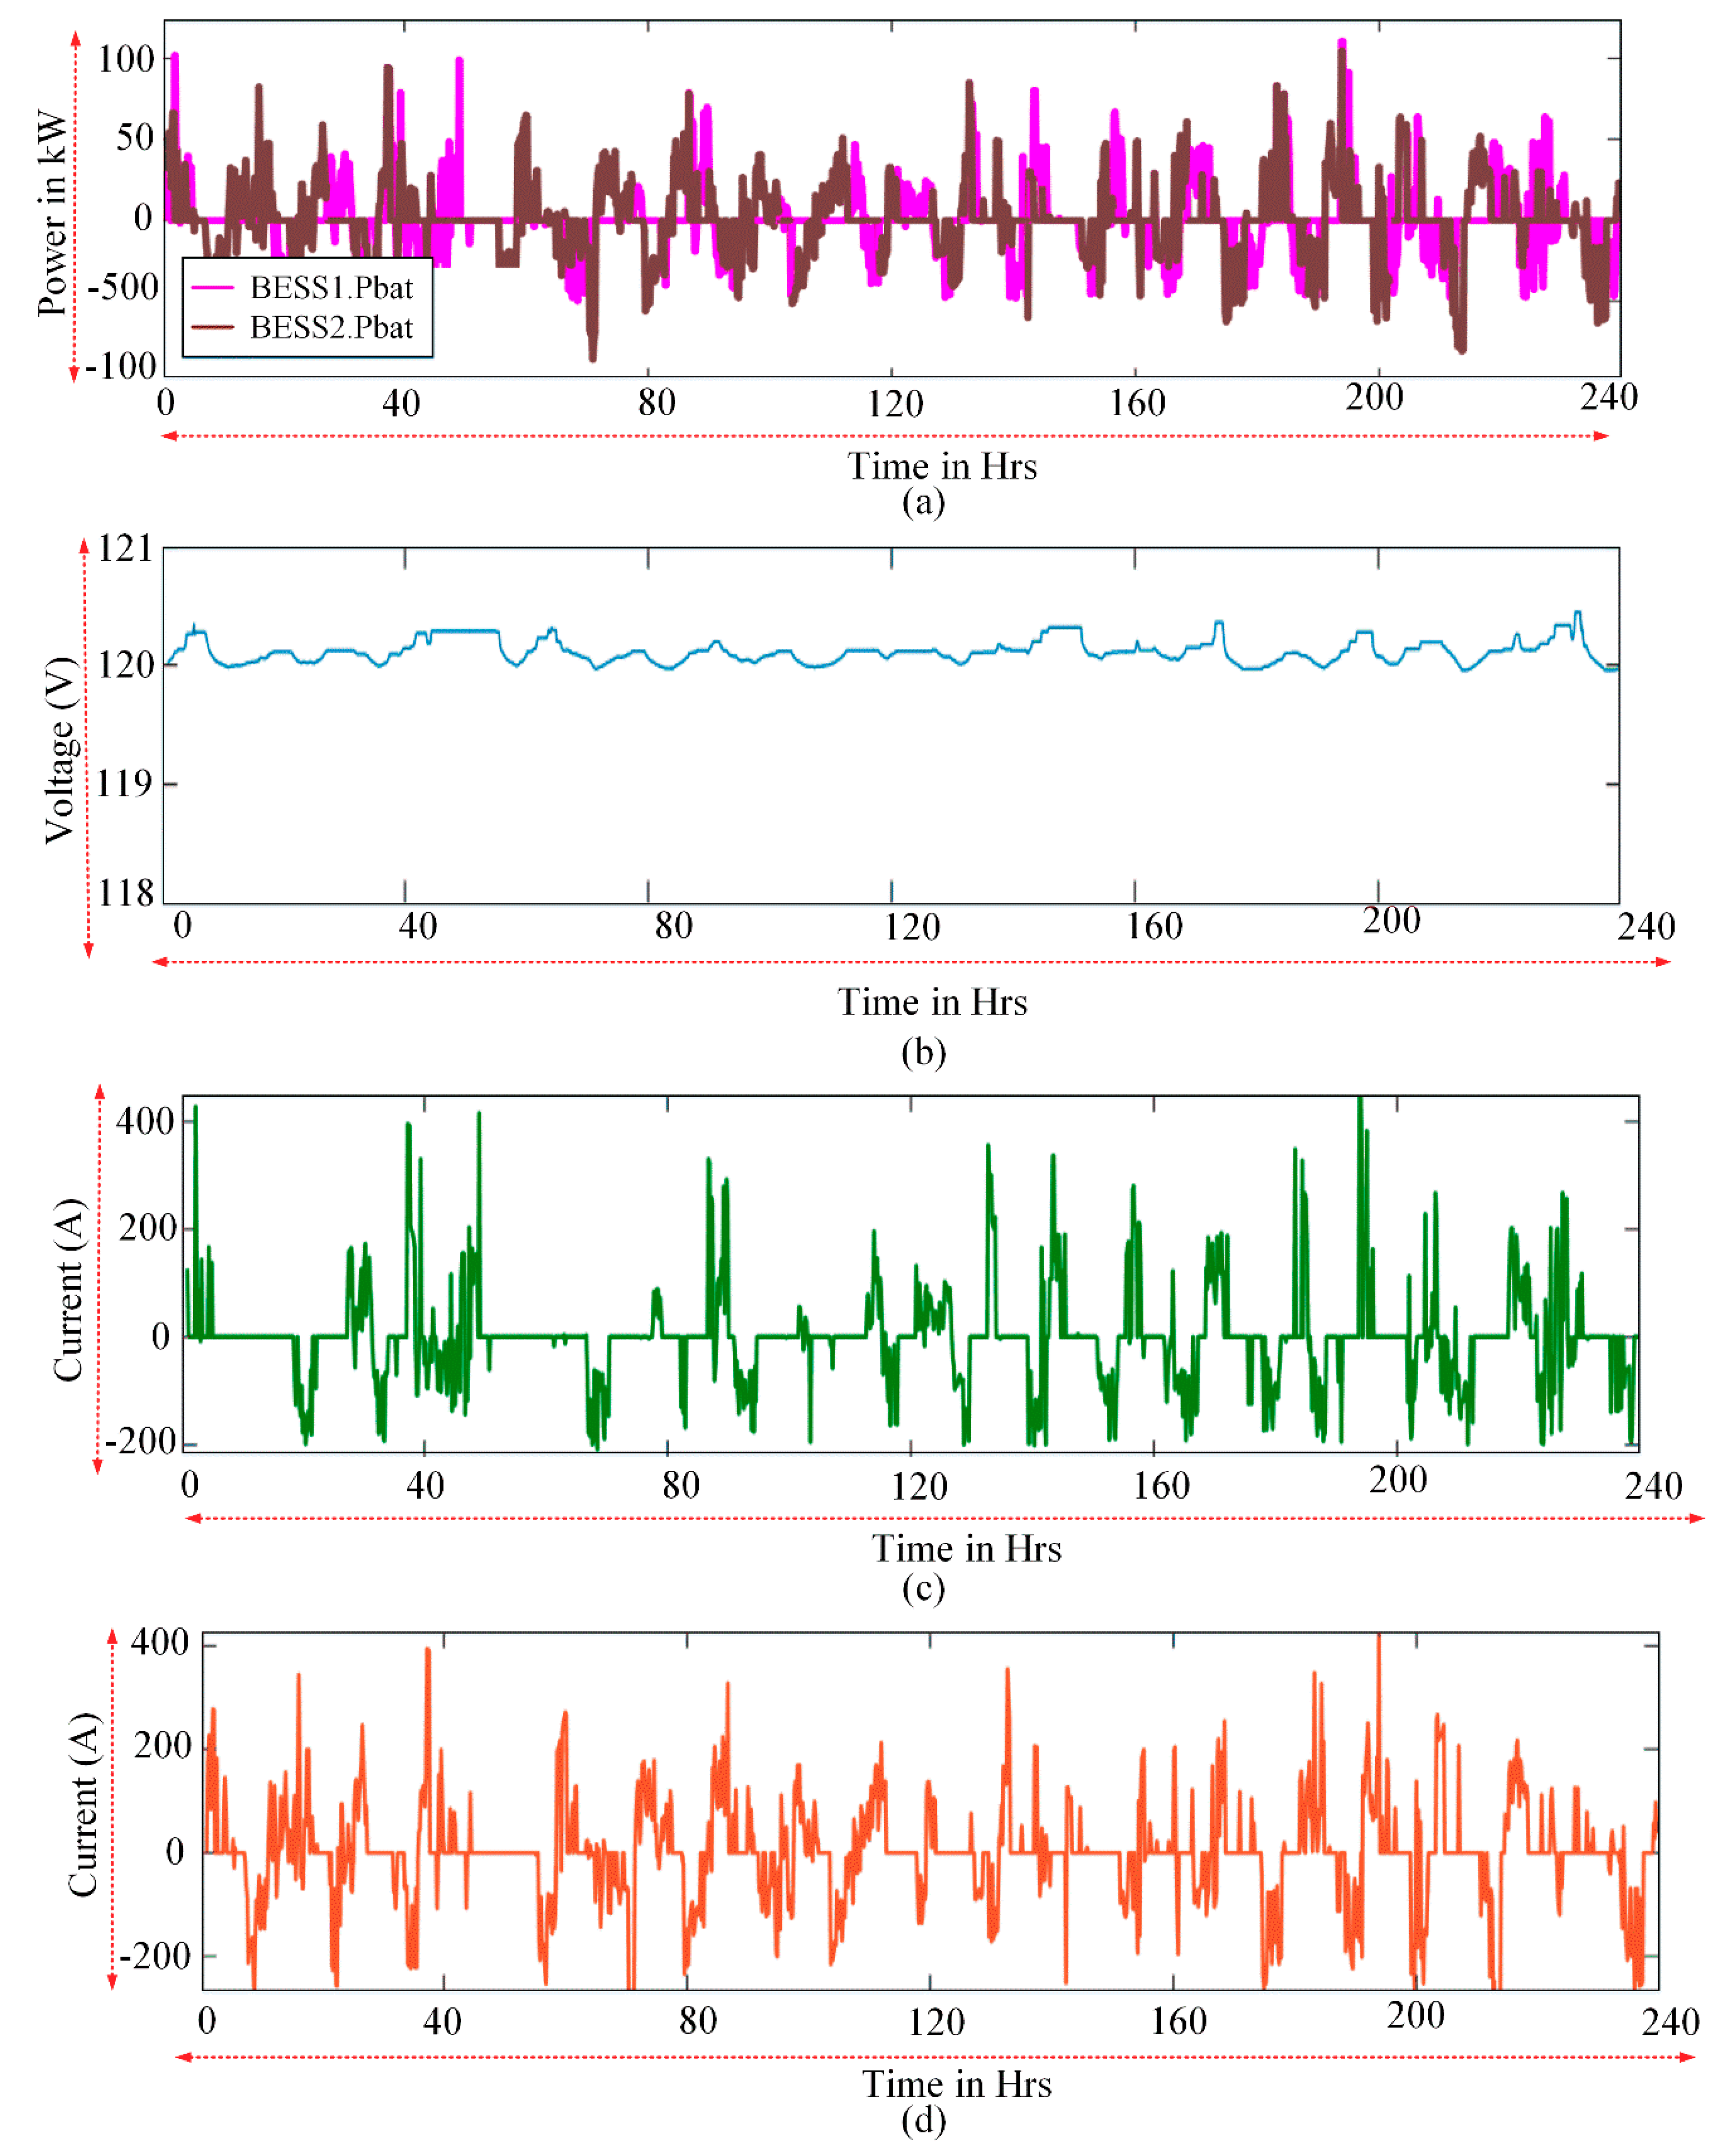
5.3. Dual VRB BESS Module Strategy
5.4.Inference of Results
5.5. Economic Analysis
6. Conclusions
Author Contributions
Funding
Acknowledgments
Conflicts of Interest
Nomenclature
| Temperature coefficient of PV panel | |
| γ | Ratio of battery maintenance cost to the fixed cost |
| ρ | Air density in kg/m3 |
| χ | Energy cost coefficient of the VRB in $/kWh |
| ηwt | Efficiency of the wind turbine |
| ηpv | Efficiency of solar inverter |
| ηch; ηdis | Charging/discharging efficiency of the VRB |
| fpv | Derating factor for PV panel |
| ir | Interest rate %, |
| ifr | Inflation rate % |
| idr | Discount rate |
| n | VRB lifetime in years. |
| A | Swept area in m2 of wind turbine |
| Cvrb | Energy capacity of VRB in kWh |
| (t) | Energy stored in VRB at time t in kWh |
| (t) | VRB Power charged/discharged at t in kW |
| Pdel(t) | Power delivered by the HRES at time t in kW |
| Dem(t) | Power to be dispatched to the load at time t in kW |
| Pgen(t) | Power generated by the wind-PV at time t in kW |
| Ppv(t) | Power generated by the solar panel at time t in kW |
| Pω | Power generated by wind turbine in kW |
| PRd | Diesel power cost in Rs/kWh |
| PRws | Selling price of wind power in Rs/kWh |
| R | Gas Constant |
| T | Temperature in ºC |
| SOC (t) | State of Charge of the VRB at time t |
References
- Indian Wind Turbine Manufacturers Association. Indian Wind Power Magazine—Repowering Issue; Indian Wind Turbine Manufacturers Association: New Delhi, India, 2015. [Google Scholar]
- International Renewable Energy Agency. Battery Storage for Renewables: Market status and Technology Outlook; International Renewable Energy Agency: Abu Dhabi, UAE, 2015. [Google Scholar]
- Mateo, A.R. Assessment of the Contribution of Storage and Demand Side Management to Power System Flexibility. Master’s Thesis, The University of Manchester, Manchester, UK, 2011. [Google Scholar]
- Cervone, A.; Carbone, G.; Santini, E.; Teodori, S. Optimization of the battery size for PV systems under regulatory rules using a Markov-Chains approach. Renew. Energy 2016, 85, 657–665. [Google Scholar] [CrossRef]
- Ganesan, S.; Padmanaban, S.; Varadarajan, R.; Subramaniam, U.; Mihet-Popa, L. Study and analysis of an intelligent microgrid energy management solution with distributed energy sources. Energies 2017, 10, 1419. [Google Scholar] [CrossRef]
- Fathima, A.H.; Palanisamy, K. Battery energy storage applications in wind integrated systems—A review. In Proceedings of the International Conference Smart Electric Grid (ISEG’14), Guntur, India, 19–20 September 2014; pp. 1–8. [Google Scholar]
- Das, V.; Padmanaban, S.; Venkitusamy, P.; Selvamuthukumaran, R.; Blaabjerg, F.; Siano, P. Recent advances and challenges of fuel cell based power system architectures and control—A review. Renew. Sustain. Energy Rev. 2017, 73, 10–18. [Google Scholar] [CrossRef]
- Vavilapalli, S.; Padmanaban, S.; Subramaniam, U.; Mihet-Popa, L. Power balancing control for grid energy storage system in photovoltaic applications—Real time digital simulation implementation. Energies 2017, 10, 928. [Google Scholar] [CrossRef]
- Ranaweera, I.; Midtgård, O. Optimization of operational cost for a grid-supporting PV system with battery storage. Renew. Energy 2016, 88, 262–272. [Google Scholar] [CrossRef]
- Park, A.; Lappas, P. Evaluating demand charge reduction for commercial-scale solar PV coupled with battery storage. Renew. Energy 2016, 108, 523–532. [Google Scholar] [CrossRef]
- Fathima, A.H.; Palanisamy, K. Optimized sizing, selection, and economic analysis of battery energy storage for grid-connected wind-PV hybrid system. Model. Simul. Eng. 2015, 2015, 71353. [Google Scholar] [CrossRef]
- Junyent-Ferré, A.; Gomis-Bellmunt, O.; Sumper, A.; Sala, M.; Mata, M. Modeling and control of the doubly fed induction generator wind turbine. Simul. Model. Pract. Ther. 2010, 18, 1365–1381. [Google Scholar] [CrossRef]
- Koohi-Kamali, S.; Tyagi, V.V.; Rahim, N.A.; Panwar, N.L.; Mokhlis, H. Emergence of energy storage technologies as the solution for reliable operation of smart power systems: A review. Renew. Sustain. Energy Rev. 2013, 25, 135–165. [Google Scholar] [CrossRef]
- Viswanathan, V.; Crawford, A.; Stephenson, D.; Kim, S.; Wang, W.; Li, B.; Coffey, G.; Thomsen, E.; Graff, G.; Balducci, P.; et al. Cost and performance model for redox flow batteries. J. Power Sources 2014, 247, 1040–1051. [Google Scholar] [CrossRef]
- DOE Global Energy Storage Database. Available online: http://www.energystorageexchange.org/ (accessed on 4 September 2018).
- Vieira, F.M.; Moura, P.S.; de Almeida, A.T. Energy storage system for self-consumption of photovoltaic energy in residential zero energy buildings. Renew. Energy 2017, 103, 308–320. [Google Scholar] [CrossRef]
- Padmanaban, S.; Blaabjerg, F.; Wheeler, P.; Ojo, J.O.; Ertas, A.H. High-voltage dc-dc converter topology for pv energy utilization—Investigation and implementation. Electr. Power Compon. Syst. 2017, 45, 221–232. [Google Scholar] [CrossRef]
- Mahajan, S.B.; Padmanaban, S.; Blaabjerg, F. A Multistage DC-DC Step-Up Self-Balanced and Magnetic Component-Free Converter for Photovoltaic Applications: Hardware Implementation. Energies 2017, 10, 719. [Google Scholar]
- Ameen, A.M.; Pasupuleti, J.; Khatib, T. Simplified performance models of photovoltaic/diesel generator/battery system considering typical control strategies. Energy Convers. Manag. 2015, 99, 313–325. [Google Scholar] [CrossRef]
- Yao, D.L.; Choi, S.S.; Tseng, K.J.; Lie, T.T. A statistical approach to the design of a dispatchable wind power-battery energy storage system. IEEE Trans. Energy Convers. 2009, 24, 916–925. [Google Scholar] [CrossRef]
- Yao, D.L.; Choi, S.S.; Tseng, K.J.; Lie, T.T. Determination of short-term power dispatch schedule for a wind farm incorporated with dual-battery energy storage scheme. IEEE Trans. Sustain. Energy 2012, 3, 74–84. [Google Scholar] [CrossRef]
- Abdullah, M.A.; Muttaqi, K.M.; Sutanto, D.; Agalgaonkar, A.P. An effective power dispatch control strategy to improve generation schedulability and supply reliability of a wind farm using a battery energy storage system. IEEE Trans. Sustain. Energy 2015, 6, 1093–1102. [Google Scholar] [CrossRef]
- Cao, J.; Du, W.; Wang, H.; McCulloch, M. Optimal Sizing and Control Strategies for Hybrid Storage System as Limited by Grid Frequency Deviations. IEEE Trans. Power Syst. 2018, 33, 5486–5495. [Google Scholar] [CrossRef]
- Athari, M.H.; Ardehali, M.M. Operational performance of energy storage as function of electricity prices for on-grid hybrid renewable energy system by optimized fuzzy logic controller. Renew. Energy 2016, 85, 890–902. [Google Scholar] [CrossRef]
- Hua, G.; Lia, J.; Zeng, G. Recent development in the treatment of oily sludge from petroleum industry: A review. J. Hazard. Mater. 2013, 261, 470–490. [Google Scholar] [CrossRef] [PubMed]
- Noack, J.; Wietschel, L.; Roznyatovskaya, N.; Pinkwart, K.; Tübke, J. Techno-Economic Modeling and Analysis of Redox Flow Battery Systems. Energies 2016, 9, 627. [Google Scholar] [CrossRef]
- Fathima, A.H.; Palanisamy, K. Modeling and operation of a Vanadium Redox Flow Battery for storage in a stand-alone PV system. Energy Procedia 2017, 117, 607–614. [Google Scholar] [CrossRef]
- GIZ. India Green Energy Corridors IGEN-GEC: Report on Forecasting, Concept of Renewable Energy Management Centres and Grid Balancing; Deutsche Gesellchaft fur Internationale Zusammenarbeit (GIZ): Frankfurt, Germany, May 2015. [Google Scholar]
- Lydia, M.; Kumar, S.; Selvakumar, A.I.; Kumar, G.E.P. A comprehensive review on wind turbine power curve modeling techniques. Renew. Sustain. Energy Rev. 2014, 30, 452–460. [Google Scholar] [CrossRef]
- Lydia, M.; Kumar, S.; Selvakumar, A.I.; Kumar, G.E.P. Advanced Algorithms for Wind Turbine Power Curve Modeling. IEEE Trans. Sustain. Energy 2013, 4, 827–835. [Google Scholar] [CrossRef]
- Liu, M.; Quilumba, G.E.P.; Lee, W. Dispatch scheduling for a wind farm with hybrid energy storage based on wind and LMP forecasting. IEEE Trans. Ind. Appl. 2015, 51, 970–1977. [Google Scholar] [CrossRef]
- Abuella, M.; Chowdhury, B. Solar power probabilistic forecasting by using multiple linear regression analysis. In Proceedings of the International Conference IEEE SoutheEast Conference, Lauderdale, FL, USA, 9–12 April 2015. [Google Scholar]
- Nguyen, C.; Lee, H.; Chun, T. Cost-optimized battery capacity and short-term power dispatch control for wind farm. IEEE Trans. Ind. Appl. 2015, 51, 595–606. [Google Scholar] [CrossRef]
- Ali, A.; Padmanaban, S.; Twala, B.; Marwala, T. Electric Power Grids Distribution Generation System for Optimal Location and Sizing—A Case Study Investigation by Various Optimization Algorithms. Energies 2017, 10, 960. [Google Scholar]
- Yang, X. A new metaheuristic bat-inspired algorithm. In Proceedings of the Nature Inspired Cooperative Strategies for Optimization (NICSO 2010), Granada, Spain, 12–14 May 2010; pp. 65–74. [Google Scholar]
- Khan, K.; Sahai, A. A Comparison of BA, GA, PSO, BP and LM for Training Feed forward Neural Networks in e-Learning Context. Int. J. Intell. Syst. Appl. 2012, 4, 23–29. [Google Scholar] [CrossRef]
- Hegazy, O.; Soliman, O.S.; Salam, M.A. Comparative Study between FPA, BA, MCS, ABC, and PSO Algorithms in Training and Optimizing of LS-SVM for Stock Market Prediction. Int. J Adv. Comput. Res. IJACR 2015, 5, 35–45. [Google Scholar]
- Berrazouane, S.; Mohammedi, K. Parameter optimization via cuckoo optimization algorithm of fuzzy controller for energy management of a hybrid power system. Energy Convers. Manag. 2014, 78, 652–660. [Google Scholar] [CrossRef]
- Available online: http://en.wind-turbine-models.com/turbines/256-micon-m-450 (accessed on 3 October 2018).
- Svoboda, V.; Wenzl, H.; Kaiser, R.; Jossen, A.; Baring-Gould, I.; Manwell, J.; Lundsager, P.; Bindner, H.; Cronin, T.; Nørgård, P.; et al. Operating conditions of batteries in off-grid renewable energy systems. Sol. Energy 2007, 81, 1409–1425. [Google Scholar] [CrossRef]
- Lujano-Rojas, J.M.; Dufo-López, R.; Atencio-Guerra, J.L.; Rodrigues, E.M.; Bernal-Agustín, J.L.; Catalão, J.P. Operating conditions of lead-acid batteries in the optimization of hybrid energy systems and microgrids. Appl. Energy 2016, 179, 590–600. [Google Scholar] [CrossRef]
- Chua, K.H.; Lim, Y.S.; Morris, S. Cost-benefit assessment of energy storage for utility and customers: A case study in Malaysia. Energy Convers. Manag. 2015, 106, 1071–1081. [Google Scholar] [CrossRef]
- Han, X.; Ji, T.; Zhao, Z.; Zhang, H. Economic evaluation of batteries planning in energy storage power stations for load shifting. Renew. Energy 2015, 78, 643–647. [Google Scholar] [CrossRef]
- Tamil Nadu Electricity Regulatory Commission. Determination of Tariff for Generation and Distribution; T.P. No. 1; Tamil Nadu Electricity Regulatory Commission: Tamil Nadu, India, 2013. [Google Scholar]


| Hour of Day | Demand Period | Dispatch (Dem(t)) |
|---|---|---|
| 00:00 to 07:00 | Morning off-peak | Pgen(t)/2 |
| 07:00 to 11:00 | Morning peak | PGav(i) + (Pgen(t)/2) |
| 11:00 to 19:00 | Mid-day off-peak | (Pgen(t) + PGav(i))/2 |
| 19:00 to 23:00 | Evening peak | PGav(i) + (Pgen(t)/2) |
| 23:00 to 0:00 | Evening off-peak | Pgen(t)/2 |
| dP | SOC1 | SOC2 | Sel1 | b1 | b2 |
|---|---|---|---|---|---|
| P | ~H | H | H | L | |
| P | ~H | L | L | H | |
| P | H | ~H | L | H | |
| P | ~H | H | H | L | |
| P | H | H | L | L | |
| N | ~L | H | H | L | |
| N | ~L | L | L | H | |
| N | ~L | L | L | H | |
| N | L | ~L | H | L | |
| N | L | L | H | H | |
| PB | ~H | ~H | H | H | |
| PB | ~H | H | H | L | |
| PB | H | ~H | L | H | |
| PB | H | H | L | L | |
| NB | ~L | ~L | L | L | |
| NB | ~L | L | L | H | |
| NB | L | ~L | H | L | |
| NB | L | L | H | H |
| Specification | Value | Specification | Value |
|---|---|---|---|
| Rated power | 200 kW | Cut-off speed | 25 m/s |
| Rotor diameter | 24 m | Voltage | 400 V |
| Swept area | 452 m2 | Freq | 50 hz |
| Blade length | 12 m | Air Density | 1.2258 kg/m3 |
| Tip-speed ratio | 52.2 m/s | Pitch angle | 10 deg |
| Cut-in speed | 5 m/s | Efficiency | 95% |
| Rated speed | 13 m/s |
| Specification | Value |
|---|---|
| Type | VRB Flow Battery |
| Rating | 200 kWh 120 V |
| Expectancy Life in years | 18 |
| Charging efficiency % | 98 |
| Discharging efficiency % | 85 |
| Depth of Discharge | 75 |
| Cost of Battery | 600 $/kWh |
| Days of Autonomy | 12 Rs |
| Specification * | Without Battery | Single VRB Battery Model (5000 Ah) | Dual VRB Battery Model (1666.67 Ah Each) |
|---|---|---|---|
| Performance Parameters | |||
| Energy Generated (MWh) | 18.88 | 22.47 | 21.78 |
| Charge Factor (CF) | 98.10 | BESS1—98.87%, BESS2—97.50% | |
| Ah Throughput (AHT) | 7.055 | BESS1—6.85, BESS2—8.6 | |
| Time at Low SOC (TLS) | 0.89% | BESS1—7.88%, BESS2—3.04% | |
| Partial Charging Value (PCV) | 44.85% | BESS1—58.03%, BESS2—48.93% | |
| Energy Generated (MWh) | 18.88 | 22.47 | 21.78 |
| Economic Parameters | |||
| Revenue Earned ($) | 865 | 1030.79 | 1000.04 |
| Losses due to Spilling (MWh) | 4.6 | 1.076 | 0.65 |
| Losses Due to Shedding (MWh) | 3.64 | 0.13 | 1.05 |
| Total Losses in $ | 1711.667 | 491 | 78.32 |
| LPSP % | 19 | 3.06 | 4.3 |
| Cost of VRB Storage in $ | 288,000 | 240,000 | |
| Simple Payback Period in years | 4.8 | 4.76 | |
| Discounted Payback period in years | 6.65 | 6.58 | |
| Benefit-to-Cost Ratio | 1.83 | 1.94 | |
| Net Present Value of System in $ | 326,666.67 | 313,394.27 | |
© 2018 by the authors. Licensee MDPI, Basel, Switzerland. This article is an open access article distributed under the terms and conditions of the Creative Commons Attribution (CC BY) license (http://creativecommons.org/licenses/by/4.0/).
Share and Cite
Fathima A, H.; Palanisamy, K.; Padmanaban, S.; Subramaniam, U. Intelligence-Based Battery Management and Economic Analysis of an Optimized Dual-Vanadium Redox Battery (VRB) for a Wind-PV Hybrid System. Energies 2018, 11, 2785. https://doi.org/10.3390/en11102785
Fathima A H, Palanisamy K, Padmanaban S, Subramaniam U. Intelligence-Based Battery Management and Economic Analysis of an Optimized Dual-Vanadium Redox Battery (VRB) for a Wind-PV Hybrid System. Energies. 2018; 11(10):2785. https://doi.org/10.3390/en11102785
Chicago/Turabian StyleFathima A, Hina, Kaliannan Palanisamy, Sanjeevikumar Padmanaban, and Umashankar Subramaniam. 2018. "Intelligence-Based Battery Management and Economic Analysis of an Optimized Dual-Vanadium Redox Battery (VRB) for a Wind-PV Hybrid System" Energies 11, no. 10: 2785. https://doi.org/10.3390/en11102785
APA StyleFathima A, H., Palanisamy, K., Padmanaban, S., & Subramaniam, U. (2018). Intelligence-Based Battery Management and Economic Analysis of an Optimized Dual-Vanadium Redox Battery (VRB) for a Wind-PV Hybrid System. Energies, 11(10), 2785. https://doi.org/10.3390/en11102785