1. Introduction
Smart grids and digital technologies are set to change the global energy system in coming decades, making it more connected, sustainable, and reliable. This will have a significant and enduring effect on both energy demand and supply, according to the 2017 International Energy Agency (IEA) [
1]. In trying to achieve the environmental goals set by the international community [
2], communication and information are having an impact on the energy sector which has never before been observed, on the path to make it smarter. From the distributed ledger protocols to big data analysis, technologies are shaping the dynamics of services that will be offered in the future. The way machines will interact with each other to provide those services will require a multilayer analysis. Assessing interoperability between components and performances is, therefore, a crucial activity for the successful implementation of the smart grid. One of the sectors bound to suffer tremendous change is the transportation sector, particularly on-road light-duty vehicles.
The continuous growth of electric vehicles (EV) presents both a challenge and opportunity for citizens and companies. Road vehicles’ electrification success depends on the charging infrastructure effectiveness to support consumers and mitigate driving-range limitations. Charging at high power means reducing the time it takes to charge the vehicles’ battery. However, using high power non-linear devices in low voltage grids may cause power quality problems, namely harmonic distortions. In Europe, manufacturers are exploring different options of power in fast-charging (higher than 50 kW). This represents new challenges on the grid for infrastructure design, dimensioning, and verifying standard conformance. This is of particular importance when such infrastructures allow multiple chargers to work simultaneously [
3] or to work under adverse conditions.
Most European Member States have an EV charging infrastructure in place mostly still part of pilot projects. The first data, from the interaction between charging points and the consumers, are now known. The main challenges being addressed by the scientific community, industry and policy makers, today, are to assess the optimal ratio of cars per charger, the optimum location of the charging points, grid upgrade needs, consumer preferences, and service optimization through big data treatment.
1.1. Interoperability
As stated by the European Committee for Standardization(CEN), European Committee for Electrotechnical Standardization (CENELEC) and European Telecommunications Standards Institute (ETSI) Smart Grid Coordination Group (SG-CG) [
4], interoperability means: “The ability of two or more networks, systems, devices, applications, or components to interwork, to exchange and use information in order to perform required functions”. In this regards, interoperability within a smart grid must be considered and specified in use-cases, to develop interoperable Smart Grid systems, by design. A use-case definition provides the basis for the specification of functional and non-functional requirements, test cases, and test profiles. Based on the smart grid architecture model (SGAM) [
4] framework there are five different layers of interoperability:
Component layer, which is the hardware to connect systems or devices such as power cables.
Communication layer, which is the communication technology (e.g., PLC or Ethernet) and the communication protocol for data transmission.
Information layer, which is the data model to be used to ensure a common understanding of the data exchanged.
Functional layer, specifying the functions and interactions.
Business Layer.
The SG-CG also presents the methodology to access interoperability [
4] and states that lack of interoperability can arise because manufacturers often choose different or inconsistent options, within the standard, or because the implementations have conflicting understandings of the specification. Hence, ambiguities, errors, unclear requirements, conflicting options or other factors (such as third-party interference) that could lead to non-interoperability should be investigated. Third-party interferences may come from the environment, context or event that the systems may be exposed to. One factor, among many others, is temperature. Many systems interoperate under ambient temperatures but when exposed to extreme conditions, this is not certain.
Even though we analyse the context/conditions where an EV and a fast-charger operate, the aim of the study is to analyse the performance of the process, assuming from the start that they interoperate. Exposing the systems to a third-party interference, such as extreme temperatures may, however, have an impact on this and for this reason, this theme has been addressed, as well.
1.2. EV Fast-Charging Performance and Temperatures
Given the importance of power adequacy of EVs, many studies have investigated their charging processes under various scenarios. Studies focus both on plug-in hybrid [
5] and pure electric vehicles [
6]. Authors in Reference [
7] present a review of the modelling approaches to renewable energy integration. They conclude that EVs can significantly integrate the present excess of renewable energy produced. Studies focusing on the batteries themselves and the impacts of stressful conditions have been carried out, where the authors [
8] observed a significant temperature increase in conditions of repeated acceleration and deceleration. The temperature dependency of charging and power consumption, especially low temperatures effects, have been demonstrated [
9,
10] to affect the performance of EVs in different aspects. Authors in Reference [
11] observe that at negative temperatures, the charging capacity is reduced as the internal resistance of the battery increases, causing the maximum voltage to be reached earlier [
12]. In order to protect the battery, a higher voltage cannot be applied, as it would result in a reduction of the current, which would increase the charging time. The same phenomenon happens if an EV is being driven, the minimum voltage is reached earlier and the current drawn from the battery must be reduced, thus weakening acceleration capabilities. Other impacts may be observed as a reduction of regenerative braking capability, increased heating, ventilation, and air conditioning systems (HVAC) [
8,
11,
12,
13]. At higher temperatures (>+40 °C), no adverse impacts are observed, both for charging and discharging, since the internal resistance decreases further. However, battery degradation and self-discharge may be faster due to higher chemical activity [
14]. Even though the charging efficiency of EVs, when exposed to extreme temperatures, has been a covered subject in the literature, the harmonic distortion during charging and standby power consumption of the chargers themselves, have somehow been overlooked. Despite some impacts of low-temperature on EV performance, regions where winters are particularly severe, have observed a rising adoption of EV’s, such as Norway. With an increasing market share of 22% in 2015 and a foreseen 30% in 2020, the Norwegian EV fleet may reach approximately 250,000 units, by 2020 [
15]. An important factor contributing to this high rate of EV adoption, is the charging infrastructure implementation. The European Clean Power for Transport directive [
16] recommends that there should be one publicly available charging point for every 10 electric cars, by 2020. Fast-chargers are effective solutions, providing, typically, 50 kW of power. Since most manufacturers have chosen to use either CCS or Chademo car adapters, most fast-chargers come with both these solutions incorporated in them. However, Tesla provides a supercharger which is capable of providing 120 kW. An EV with a 60 kWh battery can be fully charged within an hour. This solution, however, is a proprietary one and it targets Tesla users only. There is yet a growing interest in the present development of high power chargers (HPC) which may supply up to 350 kW, opening the market for larger vehicles. The power provided may vary from one EV to another as chargers adjust their power levels, based on the temperature, battery capacity, battery SOC, and other factors, to protect the battery. The main issue remaining to be solved is the interoperability. Vehicle owners must be assured that they can approach any charger and that their vehicle will be charged without communication or compatibility problems.
Topics for the analysis of EV-charging impacts on the distribution networks can be listed as voltage regulation, harmonic distortion levels, unbalances, additional losses, and transformers loss of lifetime. In terms of power quality, a distributed system means a more horizontally structured grid, hence, the impacts of harmonics become relevant to study in Points of Common Coupling (PCC).
Literature reports different findings regarding power quality impact from EVs. Authors modelling low-voltage systems [
17], particularly in urban scenarios [
18], defend that distribution networks can have limitations in EV-charging support, even for relatively low EV penetration levels. Authors in Reference [
19], focusing on the residential harmonic loads and the EV charging, conclude the same by observing a potential harmonic impact, above the standard limits. Other studies suggest that low plug-in electric vehicle (PEV) penetration levels, with normal charging power, will have acceptable low harmonic levels [
20,
21], and voltage fluctuations [
22,
23], however, fast-charging could cause significant voltage harmonics and losses [
24]. Most of studies tend to focus only on current harmonics, addressing the main concern of the residential and normal chargers, as they are expected to have a higher penetration. Authors in Reference [
3] however, address the total harmonic distortion impact of multiple fast-chargers, working at the same time, under a Point of Common Coupling (PCC). Their study calculated the voltage and current total harmonic distortion (THD
V, THD
I) and Total Demand Distortion (TDD), reporting the former at 1.2% and the latter two at 12% impacts, respectively. For the charger considered, the total values measured during the constant cycle stage, complied with the standards limits stated by the Institute of Electrical and Electronics Engineers (IEEE) 519 [
25] and the International Electrotechnical Commission (IEC) 61000-3-12/2-4 [
26,
27]. However, when considered individually, harmonics failed to comply with the limits provided by the same standards, mostly due to the 11th and 13th orders, which are likely to exceed the 5.5% limit in IEEE 519 (5% and 3% respectively in IEC61000-2-4). Furthermore, the 23rd and 25th harmonics, even though less probable, could also be in violation of their own stated limits.
In addition to this, the study also concluded that the main limitation of the number of chargers in a multi-charger station is the harmonic limits and not just the power capacity of the upstream power transformers. When the number of EVs charging simultaneously increases, the total current also increases and causes the standard limits to decrease, reaching a point where harmonic limits have been exceeded. The limitation in installing fast-chargers is, thus, reliant on the robustness of the systems in terms of the short-circuit current and the amount of current drawn by the vehicle cluster. This clearly identifies a limit to the number of chargers to work simultaneously and hence justifies the pertinence of studying power quality impacts, under different conditions, namely temperatures. This is especially important if we consider that the temperatures in the EU may vary from approximately −45 °C to +45 °C [
28]. In this study, we analysed the apparent standby power consumption, the THD
I, and the power factor, and observed the interoperability. Six commercial fast-chargers were studied, when submitted to ambient and extreme temperature conditions, during an EV fast-charging. The temperatures studied were −25 °C, −15 °C, +20 °C, and +40 °C.
2. Harmonics and Standby Power
In perfect conditions, both current and voltage are sinusoidal waves. Harmonic distortions cause a deviation from these perfect shapes, mostly due to non-linear loads, and are commonly referred to as noise or pollution. In the case of nonlinear loads, such as EV charge-controllers, current distortion often occurs, due to the existence of power electronic switches, which convert power from AC to DC. The presence or injection of these currents, in the distribution system, can distort the electricity system operator supply voltage and overload the expensive electrical distribution switchgear. In order to prevent harmonics from degrading the operator supply, standards such as the IEC 61000-3-12/2-4 [
26,
27] have been promoted with the aim of developing recommended practices and requirements for harmonic control, in electrical power systems. These standards have been adopted by the research community and the industry, and they describe the problems that the harmonic current distortion might cause within electrical systems, as well as the limits of such harmonics in a given system. These limits can be seen in
Table 1 as a percentage of the reference current. System operators are required to supply power with certain quality levels whose limits, among others, depend on the level of voltage connection. Consumers, on the other hand, are responsible for not degrading the voltage of the utility by drawing significant nonlinear or distorted currents.
The European Norm EN 50160 [
29] states the main voltage parameters and their tolerated deviation ranges at the customer’s PCC, in both public low-voltage and medium-voltage electricity distribution systems. However, the load current is not relevant to EN 50160. Regarding the actual current harmonic limits, the European standards are akin to IEC, hence, only the latter will be referred to, onwards.
The short circuit current (ISC) over the total line current (IL) ISC/IL ratio shows the relative size of the load, compared to the utility system. Under a linearity hypothesis, in a given point, power systems may be transformed into a Thevenin equivalent with the related impedance. The short-circuit, which may also be expressed in short-circuit power (SCP), at that point “quantifies” the equivalent impedance of the network. If the equivalent impedance is high (i.e., low SCP) the network is considered “weak” and the voltage is affected by the (harmonic) currents; if the network is strong, the voltage is not affected. It is, therefore, necessary to calculate or to measure the short-circuit current (ISC) at the PCC, where the measurements are intended to identify the limits to compare with.
Standby apparent power, on the other hand, refers to the electrical power consumed by a device when not in actual operation, but is only connected to a power source, is ready to be used. In this study, apparent power is presented in VA units, hence, both active and reactive powers are considered. This consumption is given by the continuous operation of the screen, the filters, and the other internal circuits. Some charging units have fans to mitigate the heat and the resistances, to keep a minimum temperature, in the case of low-temperature scenarios. How and when such circuits such as screens, filters, fans, or heaters work may have an impact on the apparent power consumption, in the end, which is to be paid by the final consumer. Investigating the performance of the idle time is important to mitigate the uncertainty, when carrying out similar investments. It is a crucial component for investors to integrate such “losses” and capitalize over the 8760 h per year, during the lifetime of each charger, which are usually always on and ready to operate, since the foreseen maintenance interventions have a very low frequency.
4. Results and Discussion
This section presents the outcomes of the experiments in terms of, the THDI values and the corresponding current behaviour, the apparent power consumption per phase, the apparent power factor, and interoperability, at all temperature levels. Furthermore, a sample of the voltages, currents, and THDI, monitored during a charging process, is presented to show the voltage drop when the connection occurs. In addition to this, the results of unbalances during charging are presented and discussed.
First, in order to identify the limits of distortion, provided by the IEC 61000-3-12 standard [
26], the short-circuit current value was measured at the point of common coupling (PCC), upstream of the 125 A plug used. An impedance meter (Impmeter 2) was used to record the short-circuit current I
SC. The value of 3.86 kA was measured and taken into consideration for the short-circuit ratio (R
SCE) estimation. Given the power of the chargers and considering the most unfavourable (higher) current value of the system, (82) ARMS per phase, a ratio of 47.07 (3860/81.2) was obtained. Such ratio had to be compared to the ones in the first column of
Table 1, which in this case was between 33 and 66 R
SCE. This corresponded to a total current harmonic of 16%.
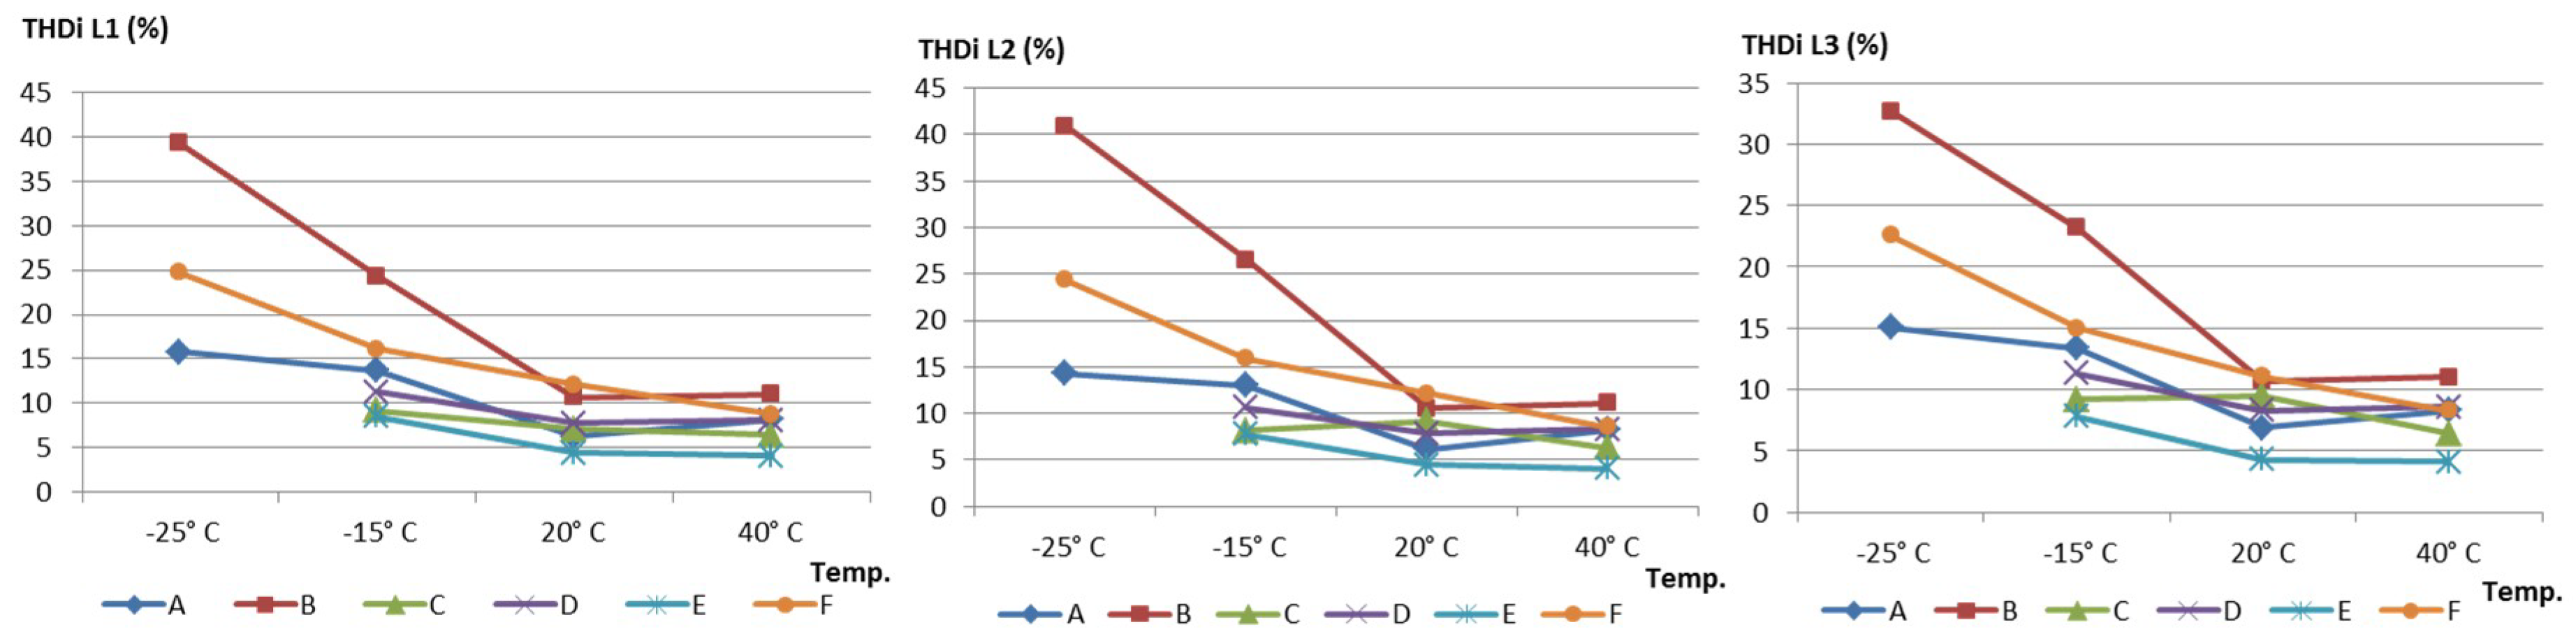
Table 3 summarizes the THD
I and corresponding currents (for the three-phases), measured for all six chargers (A to F), at the four temperature levels. Times recorded ranged from around 1.6 to 3.8 min, which given the SOC targeted (22% to 29%), corresponded to the maximum power stage of the charging curve. This condition was desirable in order to capture the maximum current and the corresponding THD. Otherwise, the results could be misleading, providing higher THD results, due to the low current. The times varied depending on the current that was able to been drawn, at different temperatures.
For the +40 °C and +20 °C scenarios, all the charger’s THD
I values were within standard limits (<16%). However, at −15 °C, charger B and F became in violation of such a limit, with 24% and 16% THD
I, respectively. In addition to this, at −25 °C, all working chargers revealed to be out of the standard limit, and reached a value as high as 39.8% in the case of charger B. Overall, even though three chargers were not able to charge at −25 °C, from
Figure 2 and
Figure 3 it can be observed that there was a tendency to increase in the THD
I, as the temperature decreases. This could be explained by the reduction of current being requested by the vehicle, as the temperature decreased as well (
Figure 3), thus, resulting in a direct reduction in the THD
I impact, as shown in Equation (1).
The highest values of current were measured, at the highest temperature level. On the contrary at the lowest temperature level, the least current was provided to the vehicle. The current at −15 °C and −25 °C, reached a maximum decrease of 68% and 88%, respectively, when compared to the ones at +40 °C.
Figure 3 presents the RMS values of the currents per phase, in which it can be observed as an increasing trend, with the increase in temperature.
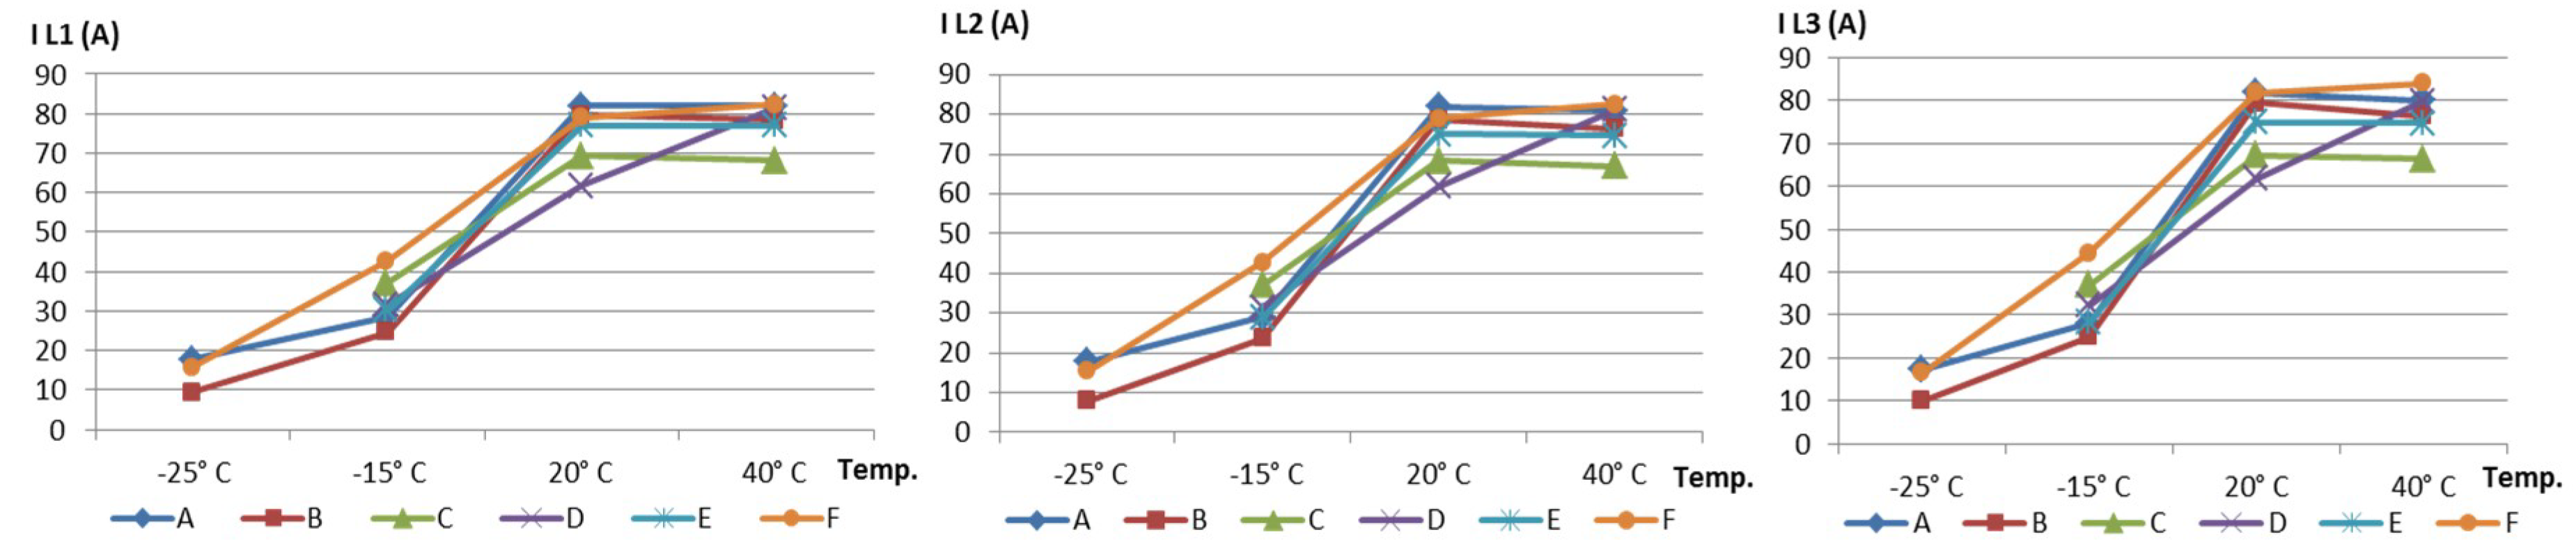
Regarding the standby performance, the power requested might have had an important impact on the investment of the charging facilities. Among others, considering such behaviour might greatly influence the equipment capitalization of losses, cables, and switchgear dimensioning, or contracted power level from the electricity provider. Acknowledging and considering such factors might mitigate investors’ uncertainty regarding the price and the operational costs.
The measurements were done 30 min after each unit was turned on, so as to account for initialization sequences of internal circuits, which could otherwise provide misleading measurements. Apart from charger D, which specified a 1000 W power consumption from its heater, in standby, heater interference of apparent power could not be observed in any other chargers. The reason for this might be because the heating systems were always on, as values from charger F seemed to reveal (specifying a heater consumption to be about 700 W). Only with an increase of temperature to +40 °C would charger F increase its apparent power, which could be from the forced cooling system. On the other hand, charger D only turned on when the temperature sensor requested it, which from the technical specifications occurred below −15 °C.
Figure 4 presents all chargers’ standby apparent power. However, no trend could be observed due to different construction and operational options from the manufacturers. Some chargers had a forced ventilation, permanently connected, others started at a specific temperature and even had more than one ventilation fan. To keep temperatures within a certain level, different heating systems and materials were used which allowed the chargers to work at different temperature levels.
Apparent power should be carefully considered when designing charging installations, especially the system cables. At low values of power factor, more apparent power needs to be transported in order to provide the requested real power. As an example, if 1 kW of real power is required at 0.5 power factor, 2 kVA of apparent power needs to be transferred (1 kW ÷ 0.5 = 2 kVA). This apparent power must be produced and transmitted to the load, and is subject to losses in the production and transmission processes. Cable and electric switchgear (such as power transformers, circuit breakers, and disconnections) should also withstand these rated values of power.
The charging dynamics may be observed in
Figure 5, which refers to charger D, at 40 degrees. The figure shows line to line voltages, phase currents, and neutral and THD
I, per phase in a time step of 0.5 s. The values present a typical charging behaviour, where all phases tend to follow the same behaviour. A voltage drop could be observed upon the charger’s connection, suffering a variation of 2.3%, as compared to its steady state. In this case, the current reached a maximum value of 80–81.5 A, and maintained a constant pattern, during the charging process. Neutral currents, as can be seen in this case, did not go beyond 3%. The THD
I values per phase maintained a constant pattern during the charging process, following the current’s behaviour of 8.1–8.6%
Regarding the unbalance analysis, each of the three-phase voltage or current could be decomposed into three components. These components are known as the positive sequence, negative sequence, and the zero sequence. If the three-phase systems are considered balanced, the positive sequence component would be the normal component present in such systems. The negative sequence component, on the other hand, results from unbalanced phase-to phase currents and voltages. The phenomena of voltage unbalances cause high unbalanced currents, for example in stator windings, resulting in overheating, hence, losses and reduced motor lifetime. The negative voltage component (Vneg.) should not exceed 2% [
29].
Figure 6 shows the voltage negative and the zero sequence unbalances for all charges, in all measured temperatures.
As may be observed from the boxplots, the average values of the negative sequence were always below the zero sequence average. The maximum values never surpassed 2% reaching a maximum of 0.84%, when charger B was measured. From the values recorded, no irregularities were recorded for the voltages or the currents.
Regarding the power factor, in general, all measurements reflected a relatively low power factor in the first and third phases. This was mainly related to the increase of the distortion power (related to harmonic content). Higher harmonic content, however, did not mean a higher reactive power. As can be seen in
Figure 7, there tended to be a concentration around the same values of the Power Factor, in each of the phases. Phase 2 tended to be the one where less distorted power existed (less harmonic content), with values ranging from 0.97–1.00. This might be explained by the fact that manufacturers chose to connect internal components, on this phase, which happened to have a low harmonic content. On the other hand, phase 3 presented the lowest values, ranging from 0.33–0.48. Phase 1 values varied from 0.52–0.63.
Concerning the interoperability, in order for a system to be interoperable, it must be so in several layers, as described in the SGAM [
4]. This architecture helps in mapping the layer where the lack of interoperability is located. From the results, it could be observed that three fast-chargers which were operating at ambient temperatures (that is, a connected communication and exchange of information, to perform a function), failed to perform that function, when exposed to −25 °C. This was not caused by conflicting options within the standards (since they could work when placed in higher temperatures) but because they were exposed to a third party event/interference.
The reasons that caused the inability to charge were not identified during the experiments since the chargers’ internal circuits were not disclosed by the manufacturers. However, possible reasons could be sensor malfunctioning at low temperatures, electronic systems, thermo-inability to heat the internal chamber of the charger to the desired conditions, impact on joints, cables, connectors or general electronic components preventing a secure charging process. However, the layer where the interoperability was affected may be inferred. In two of the three failing chargers (C and D) an error message was displayed showing, “unable to connect to vehicle” whereas, the other recognized the vehicle but displayed a message such as, “unable to initiate charge”. This suggested that, in the first case, the lack of interoperability could refer to the communication layer, whereas, in the second case to the information layer, where the vehicle was recognized but operating conditions were not met to initiate the charge. However there was no error message that corresponded to each SGAM layer, so chargers C and D could both be referring to the information of a lack of interoperability, as well.


