1. Introduction
This paper is an extension and continuation of earlier work presented at the 2018 2nd International Conference on Green Energy and Applications of IEEE (ICGEA) [
1]. The insatiable demand for the energy and the rising greenhouse gas emissions is pushing the energy sector towards renewable energy utilization. Among the various renewable energy sources, wind energy is one popular form of energy due to its reliability and cost competitiveness. The wind industry has seen a tremendous growth in the past decades [
2], leading to the addition of 52.6 GW of power to an existing 539 GW as of 2017. Hence, the wind sector is motivated to explore technologies on the far side of conventional land-based installations to meet the projected energy demand. Due to the consistent and steadier wind, offshore wind turbine is one amongst the known potential solutions for substantial annual energy output.
Offshore wind technologies are continuously improved by myriad experimental, numerical and field studies. Beyond a certain depth, the standard monopile or gravity-based foundations are not economically profitable. Hence floating wind turbines are proposed as an alternative solution in terms of cost and reliability [
3]. Innovative floating wind turbine concepts aiming to curtail the installation and maintenance costs are an active research topic in recent years. Some feasibility studies are in progress with a few floater types at a prototype level to demonstrate the techno-economic viability for deep sea use.
To compete with onshore wind and other conventional power sectors, it is essential for the floating wind sector to explore the ways to reduce the capital and operation and maintenance (O&M) cost. The challenges such as the selection of right floating platforms and access to the assets in the deep sea along with the offshore environment conditions are the main reasons that increase the O&M costs of the floating wind sector. Due to these reasons, the floating wind sector is expected to meet the stringent requirement of reliability criteria against the strong wind loads and environmental conditions. These demand an accurate prediction of various forces with combined environmental loading for the floating offshore wind turbine systems design.
Numerical simulations play an important role in every stage of the wind turbine product life cycle development, from conceptual design to operation, maintenance and decommissioning to optimize CAPEX and OPEX (O&M). In addition to their significant contribution in predicting the wind loads on the turbine, numerical simulations also help to develop radically new designs. During the design review, compliance and certification process, thousands of simulations are normally performed. Hence, the typical engineering analytic code like NREL FAST, is often used to assess the performance behaviors of the turbine. To compute aerodynamics loads, AeroDyn sub module is integrated with FAST modular framework. Blade Element Momentum (BEM) and Generalized Wake Dynamic (GDW) methods are implemented in AeroDyn.
The wind turbine industry has adopted various mathematical models to compute the aerodynamic loads on the onshore turbine rotor. Among the prescribed or free-wake vortex method, acceleration potential method, NREL FAST with AeroDyn sub module, BEM model is preferred for their low computational requirements and well understood [
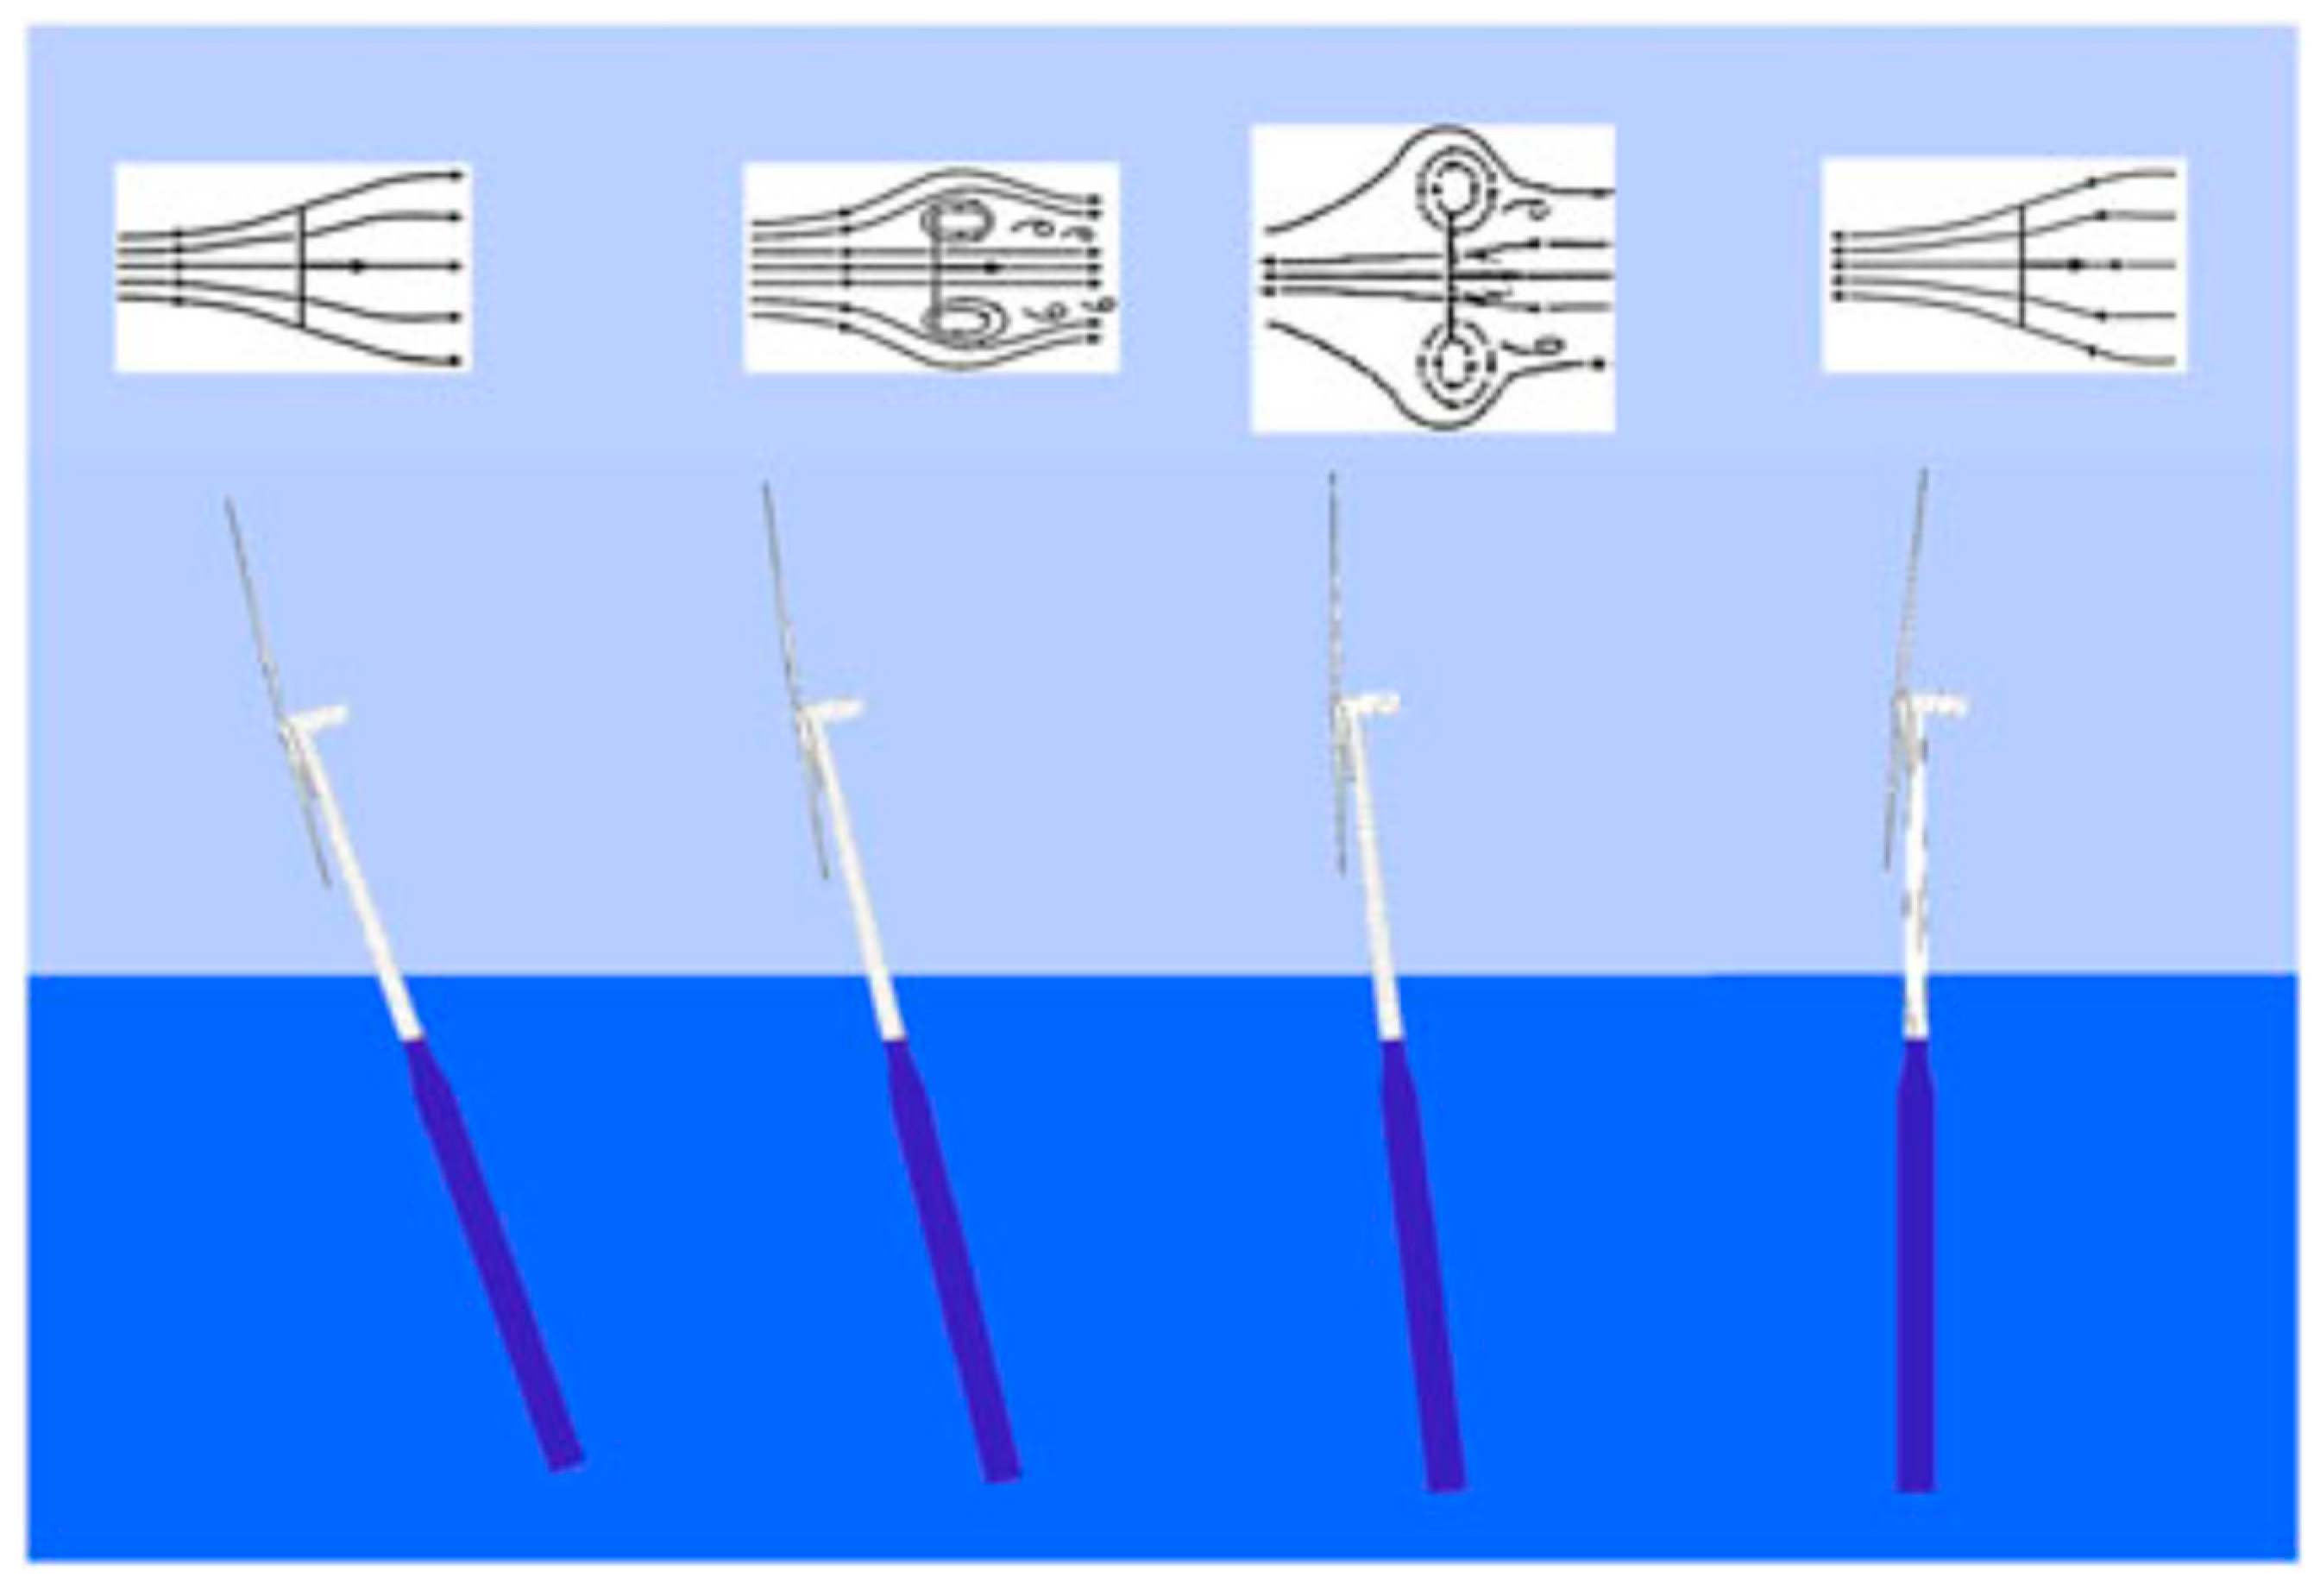
4]. Although the BEM codes include corrections for wake expansion, the pressure due to wake rotation and improved accuracy by accounting for the losses at blade root and tip sections, they are developed for wind turbines with static foundations. Hence the assumptions in BEM are not applicable [
5] for floating offshore turbines where the pitching and surging motions [
6] of the platform leads to the turbine rotor going through different wake states as shown in
Figure 1. Various non-linear effects like rotor-wake interactions, wake-wake interactions, wake meandering etc., are not accounted in BEM theory.
Lloyds Register (LR) has been actively involved in the development of numerical models and experimental modelling. Experiments on scaled rotor provides an insight on the aerodynamic loading of the rotor and to validate the non-linear models. As platform motions of FOWT has greater influence on the unsteady aerodynamic response, a scaled model of the rotor was designed to study the effect [
7]. The platform motions significantly affect the power and thrust characteristics of the rotor almost to the same order as the effect of tip speed ratio (TSR) and the blade angle. A scaled down model of the NREL 5 MW rotor was designed and tested in the wave tank (immersed in the water) to match the Reynolds number Re, as in field operation. The experiments are conducted with the focus on surge motion [
8] and its effects on aerodynamic performances. The BEM-based AeroDyn model was modified (LR AeroDyn) to predict the hydrodynamic load on to the scaled rotor. LR has enhanced the BEM code (LR-uBEM) to simulate the unsteady aerodynamic behavior of the rotors. The LR-uBEM model implements the dynamic inflow model based on the elemental aerodynamic loads prediction of individual blades. To gauge the accuracy of engineering numerical codes LR AeroDyn and LR-uBEM, high fidelity CFD model was developed and validated against the experimental simulation.
2. Scaled Rotor for Unsteady Aerodynamic Experiments
To predict the global loads in well-ordered experimental conditions by scaling down the wind turbine rotor is challenging. This can be attributed to the complexities involved in accomplishing the three scaling laws, which has to be followed to design a scaled rotor that matches the performance of full scale reference rotor [
9,
10,
11,
12]. It is highly challenging to match the performance of the scaled rotor for the coefficients such as coefficient of power (
Cp), coefficient of torque (
Cq), and the coefficient of thrust (
Ct), to a full scale reference rotor due to the incompatibility of the three primary scaling criteria, the maintenance of geometric, kinematic, and dynamic similarity between model and full scale. Geometric and kinematic similarity are readily achieved by the application of constant geometric scale factor and the maintenance of the tip speed ratio, respectively. However, in doing so the dynamic similarity criteria, defined principally as the maintenance of the Reynolds number for the flow over the blade at model and full scale, is typically not met. In order to address this, a number of researchers have proposed a global performance matching approach for the design of model scale wind turbine rotors where the primarily objective was not the study of the rotor in normal operating conditions [
9,
10,
11,
12]. Examples of such are the MARIN Stock Wind Turbine for the evaluation of the performance of floating wind turbine foundations scaled down under wind and wave action and the evaluation of advanced control strategies under unsteady operating conditions. In both cases, the design objective was to match the coefficients of the model scale to their respective full scales for a range of operating tip speed ratios. This is achieved by changing the aerofoil profile in the scaled down model along the length of the blade so as to increase the lift coefficient, increasing the chord distribution along the length of the blade by a constant factor, and altering the twist distribution to maximize the lift to drag ratio for the tip speed ratios of primary interest. The criteria for geometric similarity is abandoned, kinematic similarity is maintained, the deficit in the dynamic similitude is corrected for.
As is the case for the two rotor designs discussed, the objective of the experiments in this case was the evaluation of the rotor performance subjected to external influence relative to the normal operating state. Specifically, the quantification of the time varying coefficient of thrust resulting from the periodic motion of a rotor at a number of frequencies and amplitudes typical of floating wind turbine system. As such a similar approach to the scaling criteria has been taken. However, in this case, in addition to the global performance matching model scale rotor design objective, additional objectives have been defined in attempt to maintain the critical local performance measures. The model scale rotor requirements are defined as follows:
The coefficient of thrust of the model rotor must be similar to the full scale reference for a range of tip speed ratios,
The chord must be scaled by the same geometric scale factor as the diameter of the rotor,
The twist distribution along the non-dimensional length of the model blade must be same as full scale reference,
The axial induction factor along the non-dimensional length of the model blade must be same as the full scale reference for a range of tip speed ratios.
The full scale reference rotor used for this study is the NREL 5 MW Reference wind turbine [
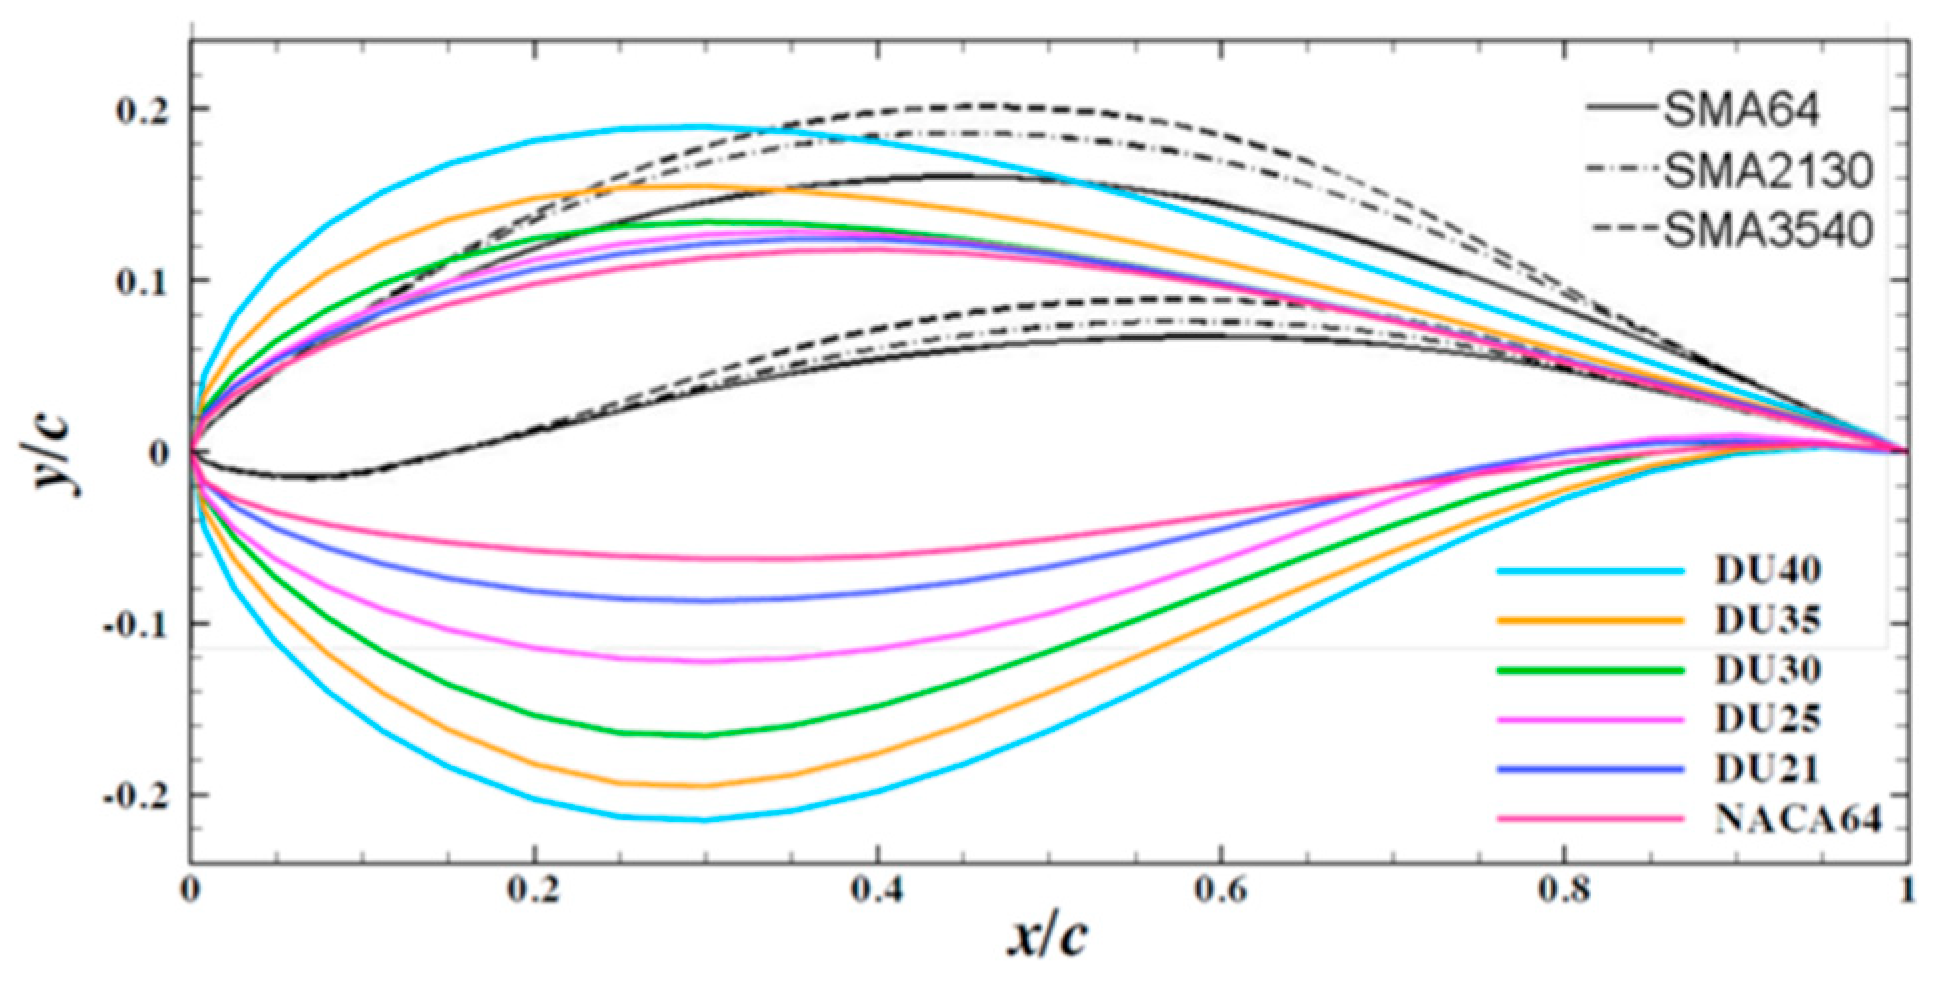
13], this has been studied extensively and has been extensively reported in literature. This was also the basis for the design of the MARIN Stock Wind Turbine. The diameter of the scaled model of the rotor has been chosen to be 1.0 m in order to minimize experimental blockage effects resulting in a geometric scale factor of 126.0. As aerodynamic coefficients largely influence the rotor performance, a new methodology has been adopted to match the scaled airfoil Re to the full-scale airfoil Re. Significant effort has been dedicated to optimize the airfoil profile in order to match the lift curves even in low Re [
7], by retaining the twist of 5 MW NREL rotor blade. As the lift coefficient heavily influences the non-dimensional rotor thrust and the axial induction factor, the primary objective is to achieve the required lift coefficients of airfoil sections and in turn complying the design requirements 1 and 4. Considering the blade length of the scaled rotor, three significant airfoil profiles are employed in comparison to the six profiles in full scale model. The following
Table 1 indicates the full-scale rotor airfoils and the corresponding airfoils of the scaled rotor. The shape of SMA (Strathclyde Model rotor Airfoil) series airfoils are shown in comparison to the full-scale model airfoils in
Figure 2. The methodology followed to accomplish the airfoil profiles and further analysis on the scaled rotor model performances are described in more detail in [
7,
14]. Scaled rotor parameters are shown in
Table 1. The designed scaled rotor blades are similar to full scale rotor following the procedure of Froude scaling. A comparison of the scaled rotor model and full scale airfoil geometry is shown in
Figure 2.
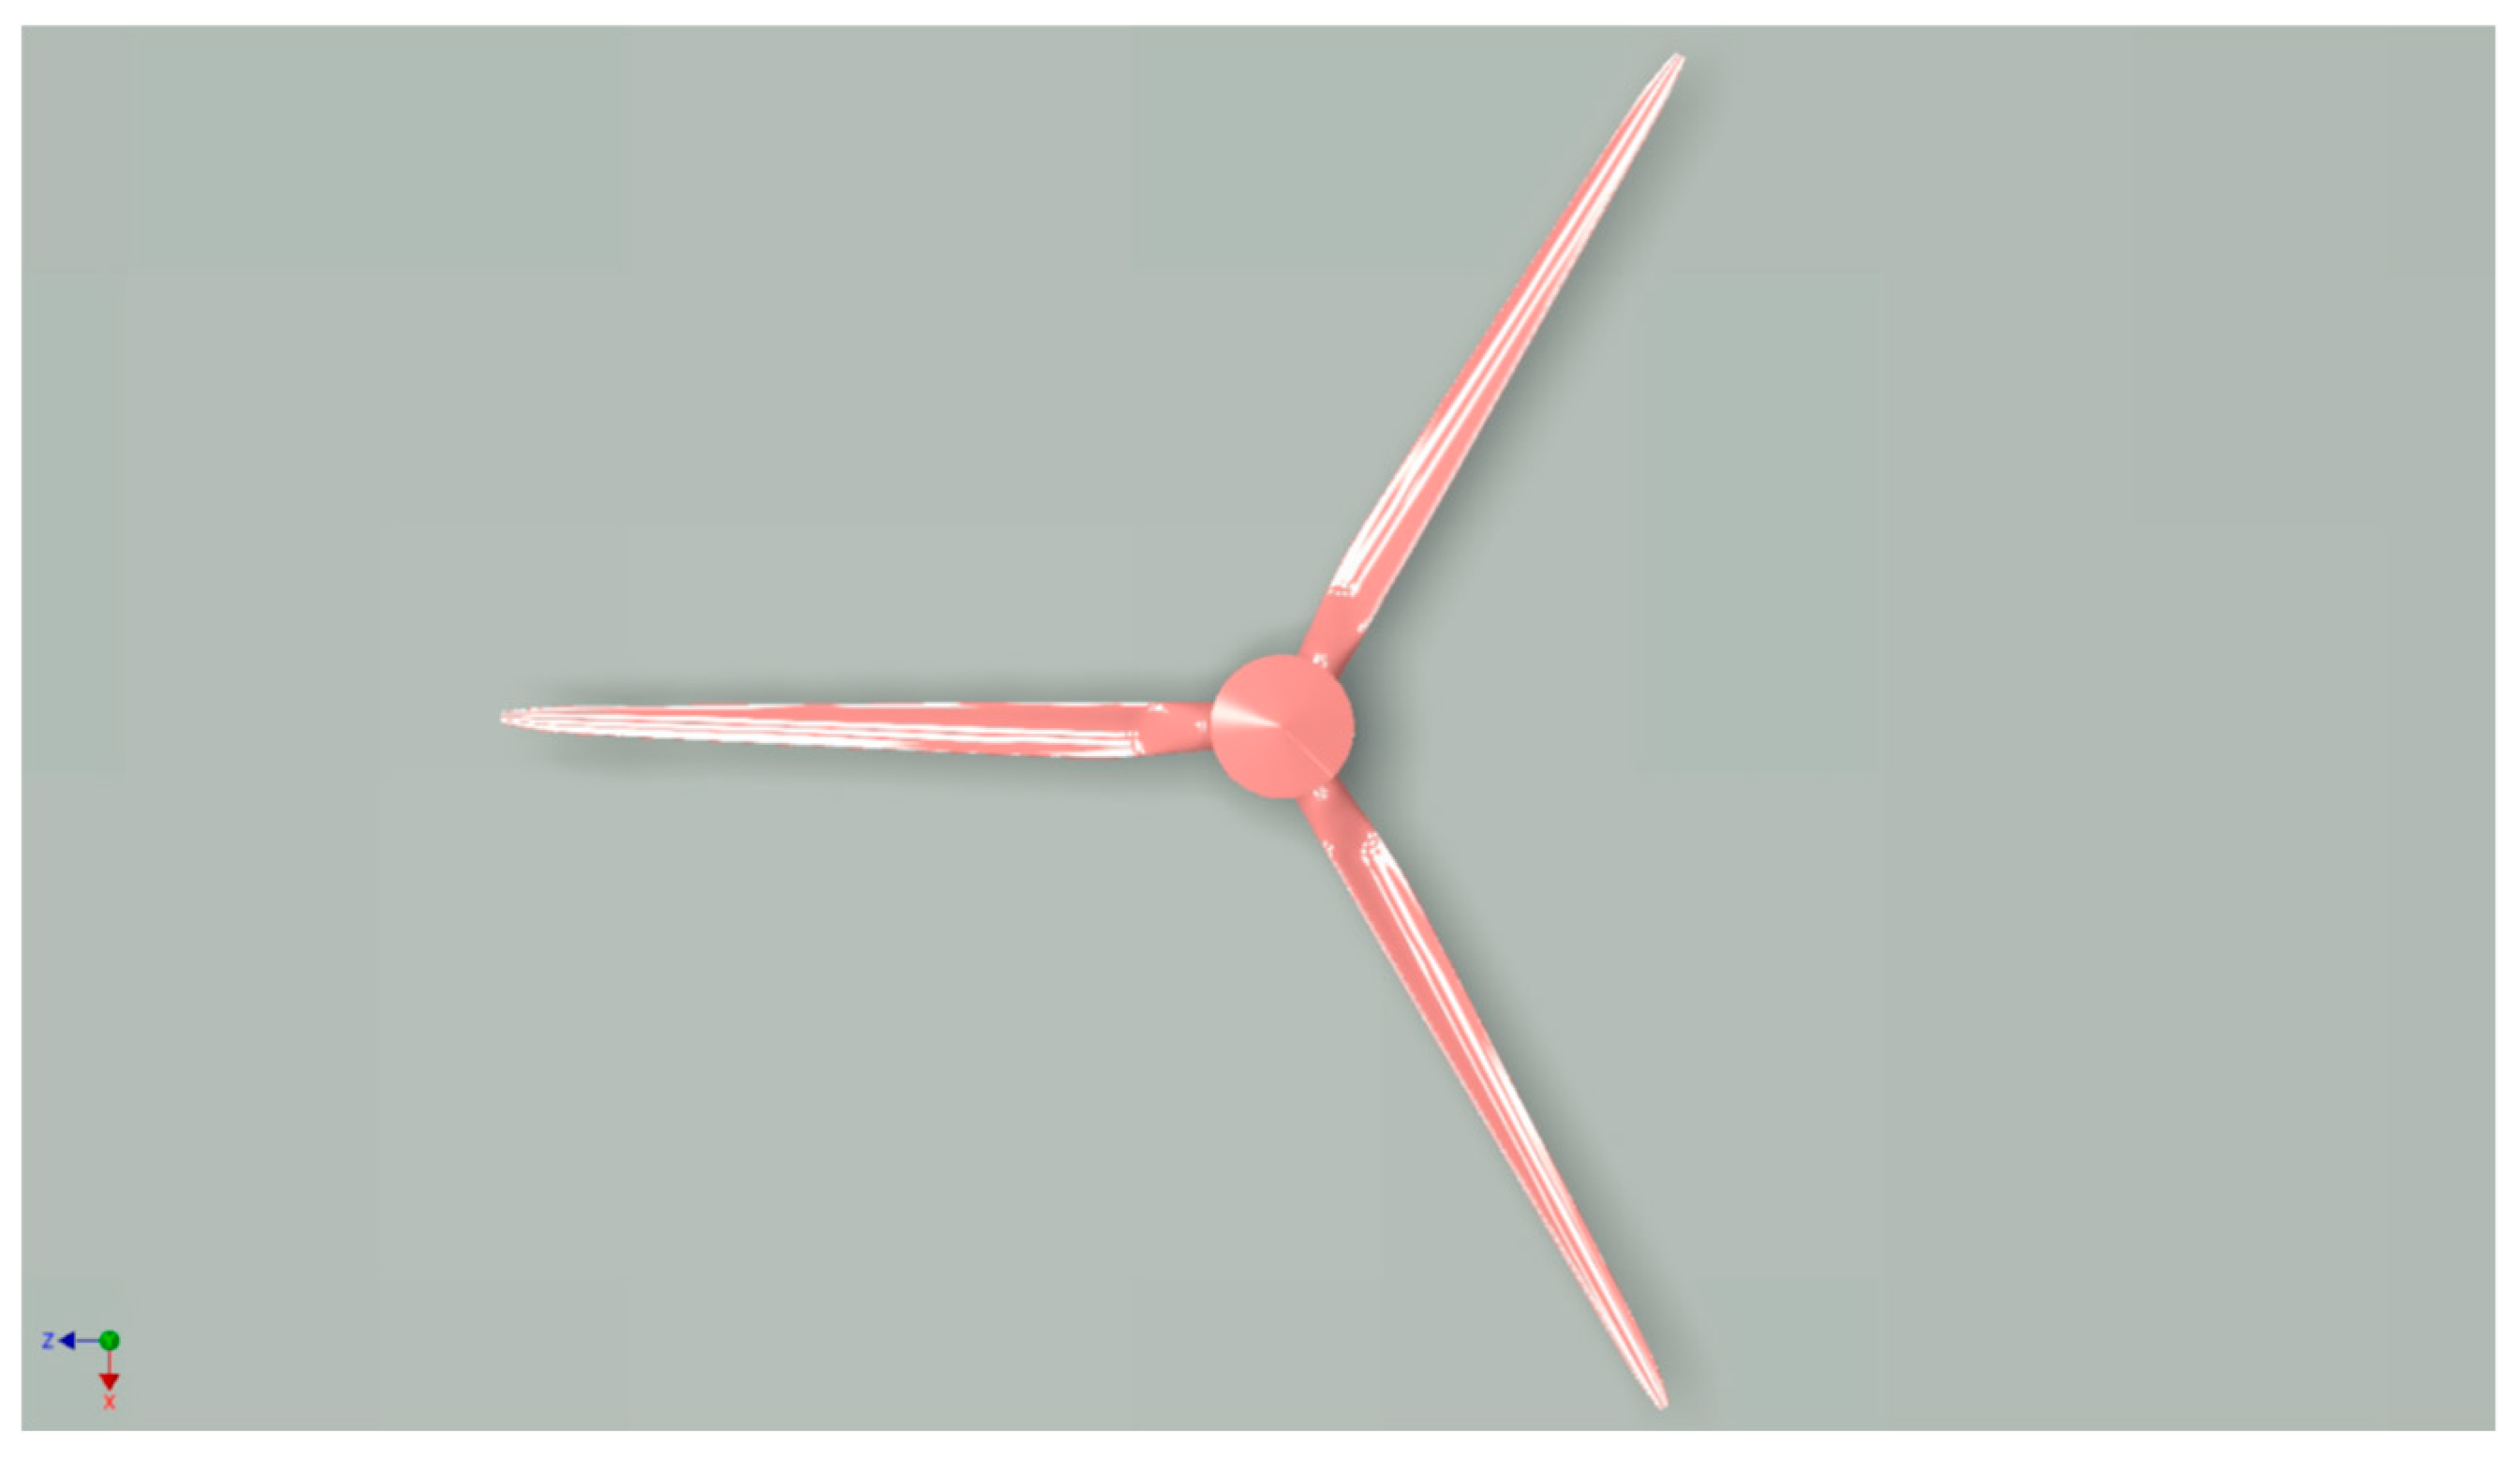
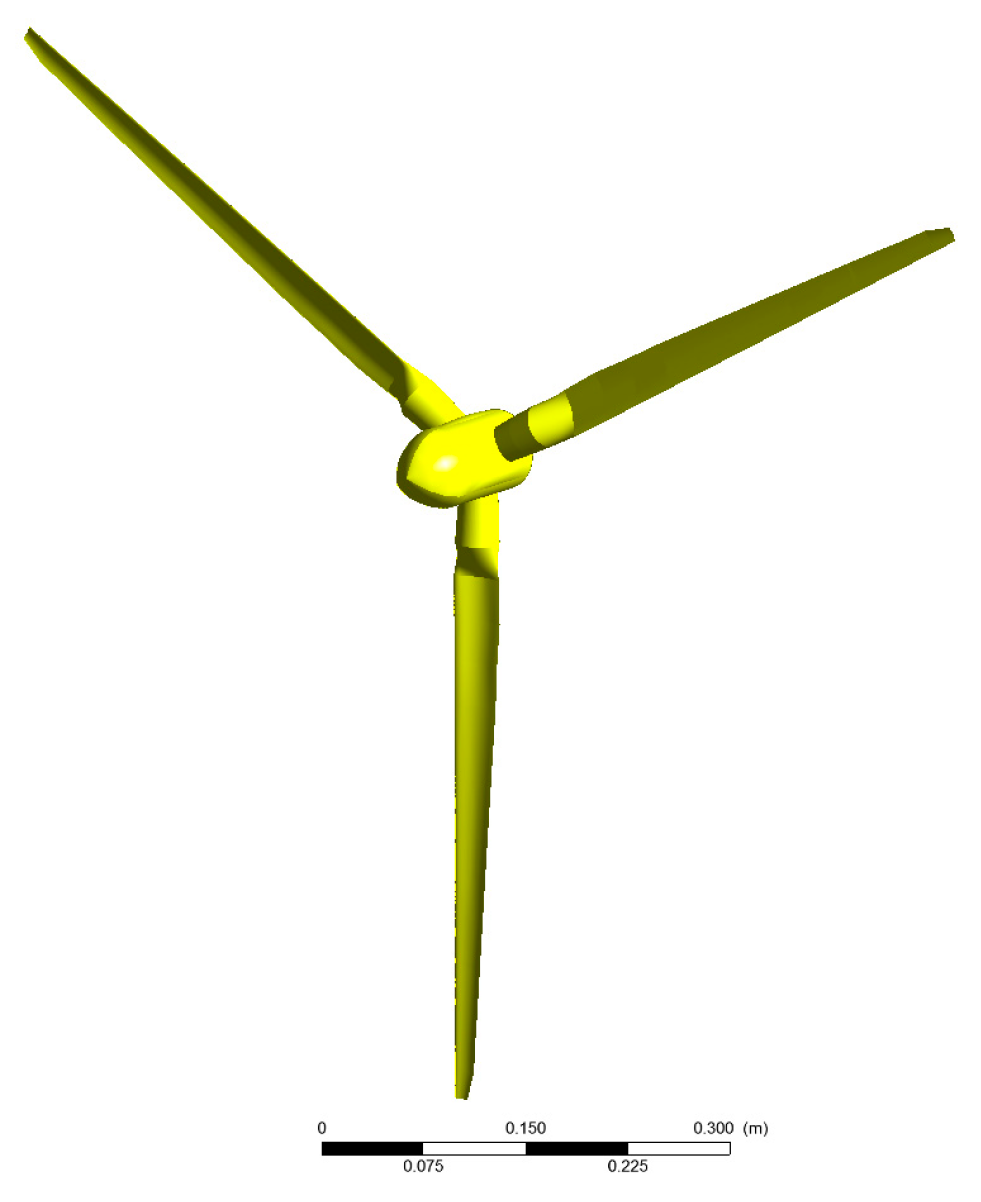
Lift coefficient for the SMA airfoils are computed using Xfoil for the model Re, while for the full-scale airfoils, the generated lift coefficients from Xfoil are verified through wind tunnel tests. The Xfoil result compare well with the experimental curves at lower AoA, but at higher AoA Xfoil overpredicts the coefficients. This can be attributed to the earlier onset of flow separation in the experimentation. A 3D rendering of the fully assembled rotor is shown in
Figure 3. The blades are fixed to the hub at a fixed pitch angle of 0° using a flange machined in the root end of the blades; as a result the accuracy of the pitch angle is defined by the machining tolerance of the stainless steel components and not that of the measurement of the pitch angle itself as would be the case if a locking bearing type fixture was used. Using this approach requires that the model scale hub is non-dimensionally larger than the full scale reference to allow for the sufficient space to make the connection from the blade to hub and hub to shaft. However, the increased diameter of the hub does not require that the blade geometry is altered in any section other than that defined with a cylindrical section detailed in
Table 1 and as such will have no impact on the aerodynamic performance of the blades.
During the design stage, the global model rotor performance was compared to the full scale reference for non-dimensional thrust and torque. The thrust force on the rotor is primarily influenced by the aerofoil lift and as such the match between the model and reference for this property is favorable. The increased aerofoil drag at the experimental Reynolds number results in a reduced torque as compared to the full scale rotor. This was an expected result of implementing this scaling methodology.
The local blade performance was assessed for the model scale rotor by comparing the axial and tangential Induction factors and the angle of attack along the non-dimensional length of the blade for different tip speed ratios (TSR) by the authors [
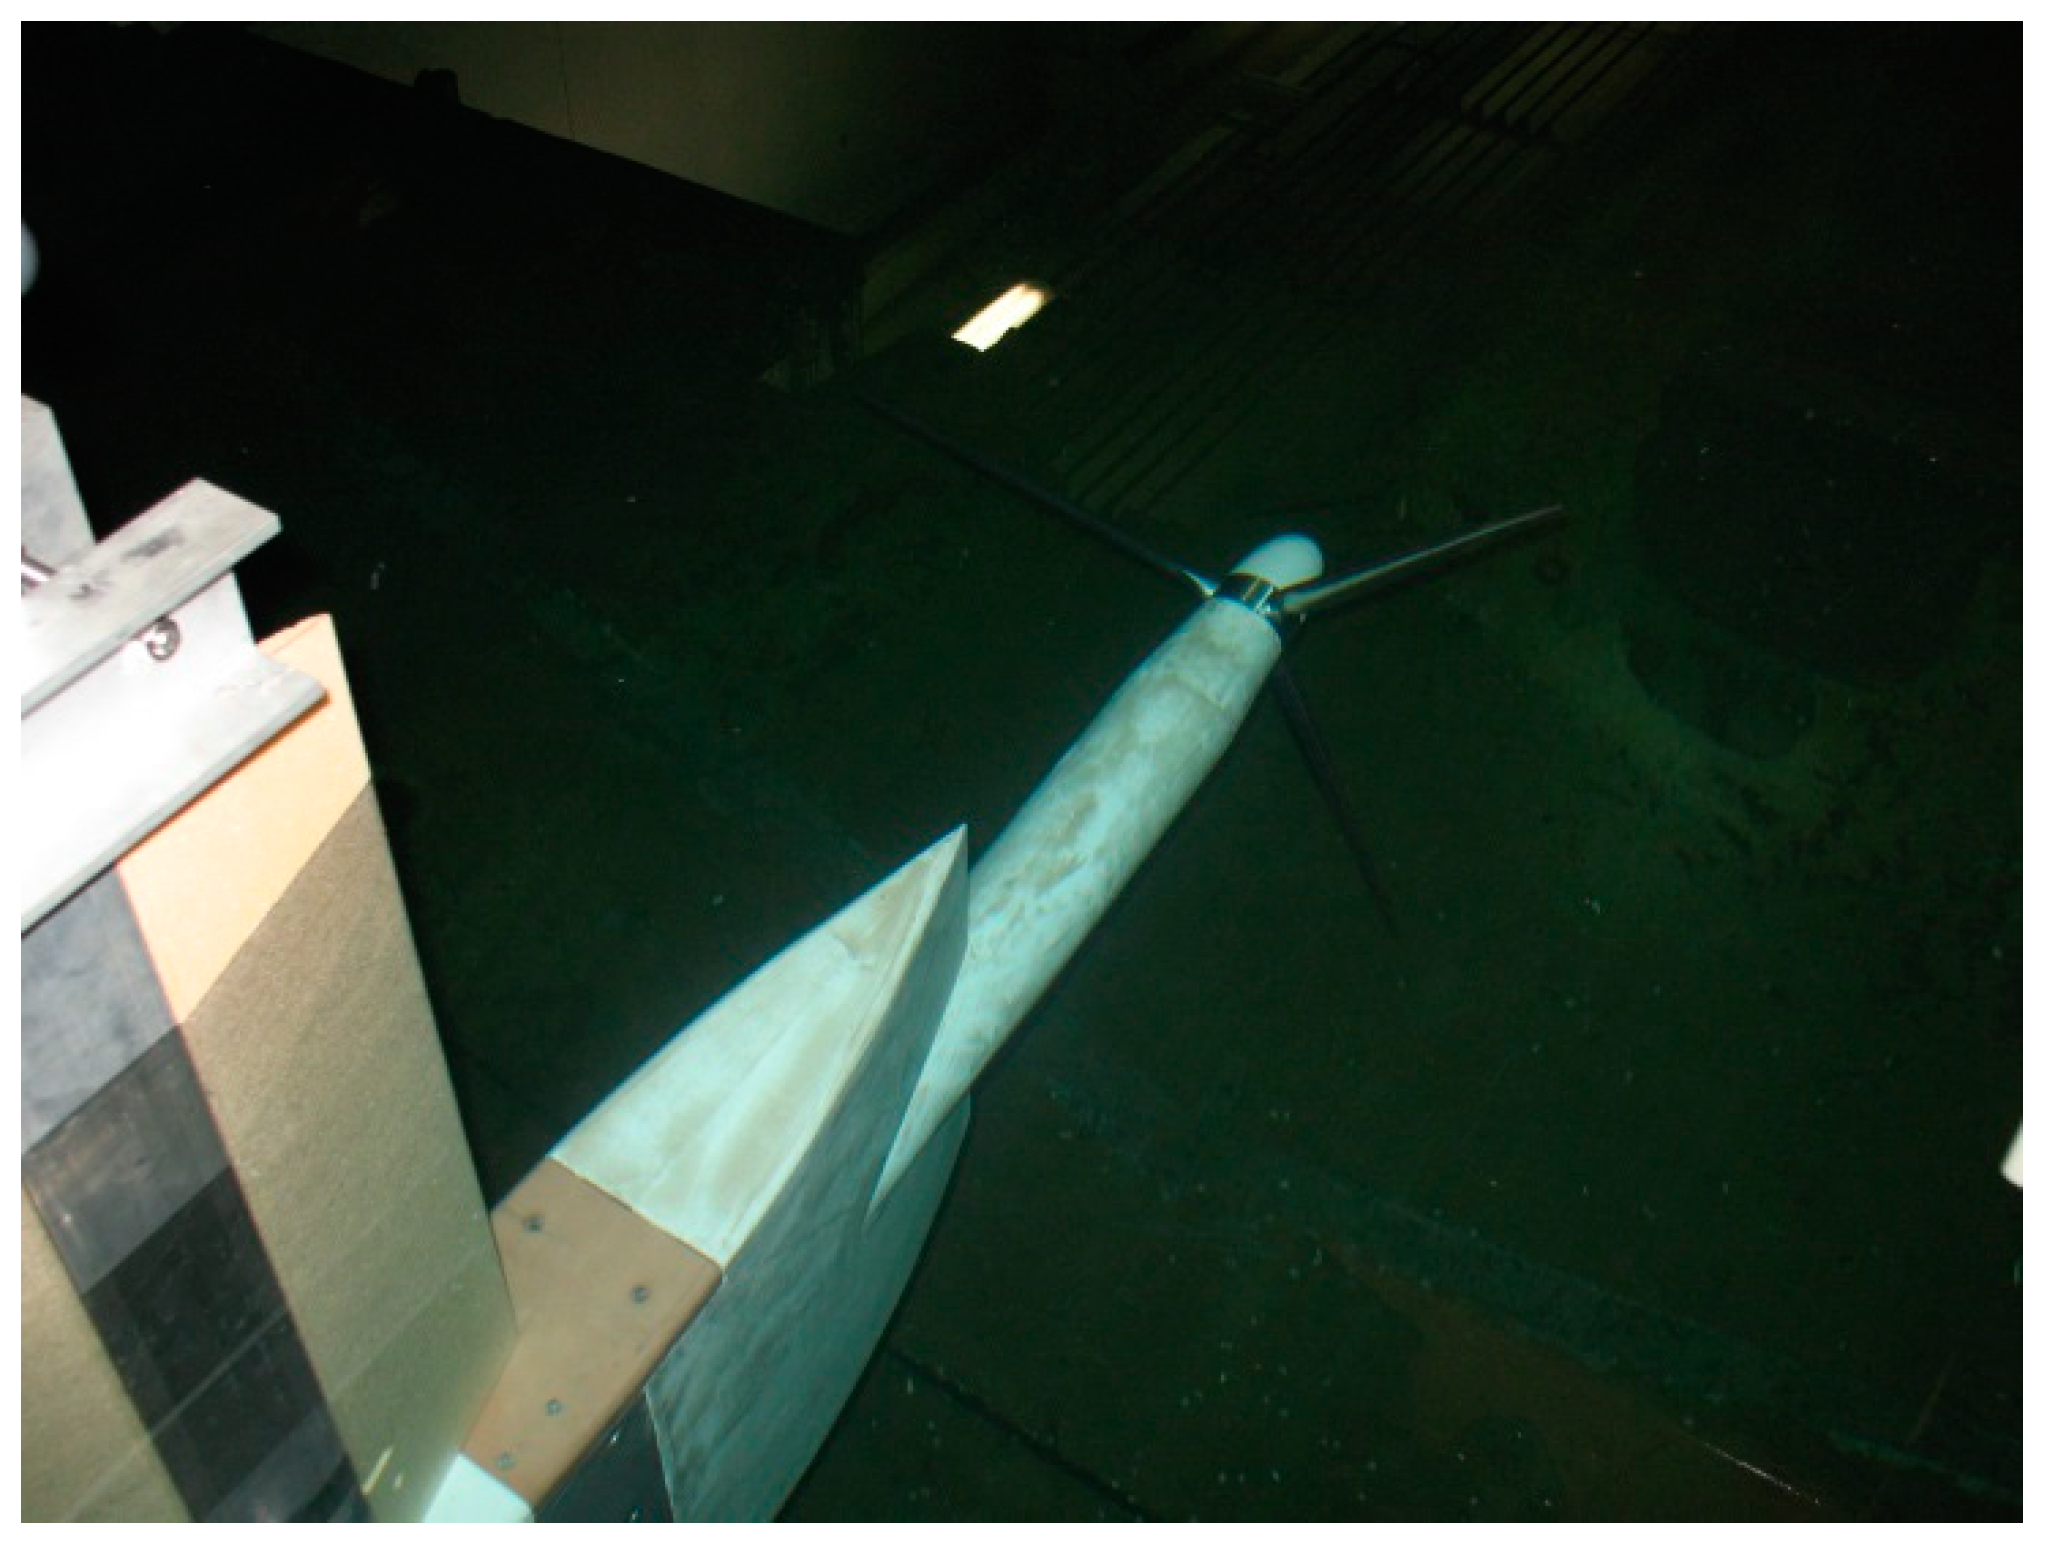
7]. The scaled rotor with its surge motion dual carriage is as shown in
Figure 4.
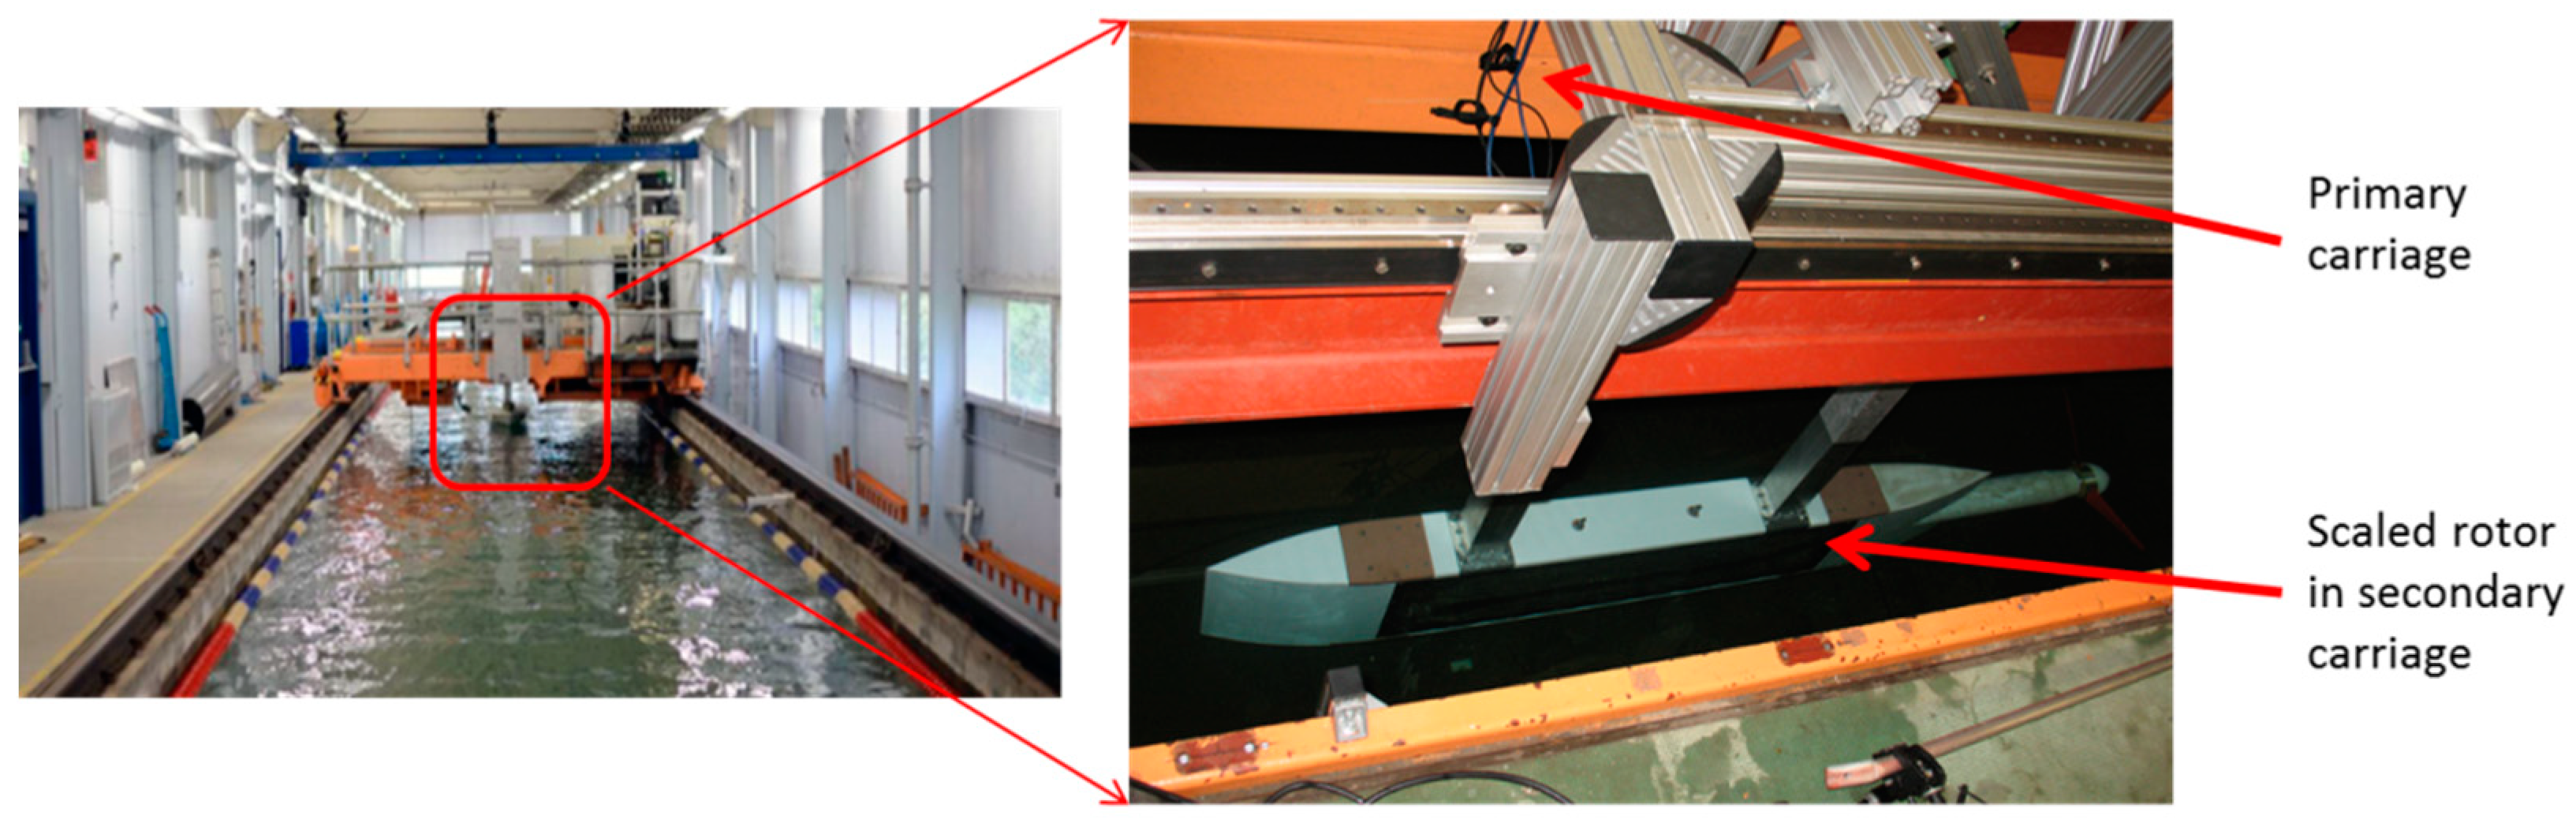
In order to achieve Reynold number similarity the model was tested under water at the University of Strathclyde’s Kelvin Hydrodynamics Laboratory towing tank (76 m length, 2.5 m depth and 4.6 m in width). When compared to the scaled rotor, the cross-sectional area of the tow tank was adequately large for least blockage. The prescribed steady and periodic flow speeds were imparted into the rotor by pulling the rotor through the stationary water using a dual carriage system (primary carriage was for constant motion and secondary carriage for surge cyclic motion) as in
Figure 5. The rotor speed was controlled using a DC motor and PID controller directly coupled to the rotor through a shaft fixed to a stiff bedplate using three low-friction bearings. The torque and thrust forces are measured in-line with the shaft using a bi-directional force transducer at a frequency of 137 Hz.
Experimental Design of Surge Motion
The surge motion of the rotor does not represent a specific floating wind turbine system, but rather a generalized matrix of operating points, from which conclusions can be drawn regarding the rotor thrust loading. The three variables under investigation were the rotor tip speed ratio, the surge amplitude, and the surge frequency. Similar to the static analysis of the rotor, the tow speed was constant and the rotor speed was varied to alter the tip speed ratio. The operating range of values for these parameters were specified such that they mimic the full-scale rotor operating conditions limited to the experimental setup and surge carrier motion.
Three prior studies have been conducted with the objective of studying the aerodynamic performance with the surge motion. The initial values for the parameters were set according to these studies for the current unsteady experimentation of the model scale rotor. Liu et al. [
8] studied the NREL 5 MW baseline wind turbine at three different wind speeds, surge velocities, and surge frequencies numerically using a BEM based aerodynamic model with a dynamic inflow correction. DeVaal et al. [
15] compared the aerodynamic performance of the NREL 5 MW turbine subjected to the a surging motion using four different numerical approaches; a quasi-static BEM model, a BEM model with an integrated Pit-Peters dynamic inflow correction, a BEM model with an integrated Stig Oye dynamic inflow correction, and a CFD based actuator disc model. Similarly, Micallef and Sant [
16] studied the NREL 5 MW rotor in surge using a quasi-static BEM model, a generalised dynamic wake model, and a CFD based actuator disk model. The valuable conclusion that has been arrived from these studies is that the wake induced effects of the rotor thrust as a result of the rotor surging into the flow depends upon the tip speed ratio, surge frequency, and surge displacement amplitude.
The experimental surge operational points considered are drawn primarily from the work of Liu et al. [
8] and deVaal et al. [
15], the surge frequency considered by Micallef and Sant [
16], although representative of a full scale operational condition which would be experienced by a floating wind turbine system, is out with the operational envelope of the experimental apparatus when scaled to the model scale. The surge frequencies studied by Liu at al and deVaal et al. were 0.1, 0.2, and 0.3 rad/s, and between 0.127 and 1.0 rad/s, respectively; the corresponding surge displacement amplitudes were, 3.0, 6.0, and 9.0 m, and between 2.0 and 16.0 m. deVaal considers only the rotor operating at its rated wind speed (
V = 11.2 m/s), Liu et al. and Micallef and Sant both consider this same rotor operation in addition to off design points.
The investigated rotor operational states, defined by Liu et al. and Micallef and Sant in terms of inflow wind speed and tip speed ratio, respectively, were 8.0, 11.2 and 16.0 m/s and 4.0, 7.0, and 11.0. The tip speed ratio of the NREL 5 MW Baseline Wind Turbine at its rated wind speed of 11.2 m/s, as defined by Jonkman et al. [
13], is 7.0.
The model scale surge motion displacement and frequency were derived from the studies discussed by Liu et al. [
8] and deVaal et al. [
15] by applying a suitable scaling methodology. This was achieved by following the scaling relationships defined by Jain et al. [
17] for the experimental analysis of the combined effect of aerodynamic and hydrodynamic force components on a model floating wind turbine rotor and foundation in a wind and wave basin. The model scale surge frequency and displacement were scaled following the relationships defined in Equations (1) and (2), respectively:
where
A is amplitude,
ω is the angular frequency and
λ is the geometric scaling factor, 126.0 for the present set of experiments.
A comprehensive static and unsteady test matrix was performed. The dimensionless parameters
Ct and
Cq that determine the amount of momentum and energy extracted from the water was computed for static cases. The coefficient of thrust is defined by Equation (3):
where
T is the rotor thrust force,
is the fluid density,
is the rotor plane area and
is the fluid velocity. The coefficient of torque is defined by Equation (4):
where
Q is the torque and
R is rotor radius. The torque is measured when the scaled rotor is at constant rotational speed, constant tow speed of primary carriage for the static test as in
Table 2. Time history of thrust and torque are captured in unsteady surge motion test scenario cases (as in
Table 3). During the unsteady test scenario, secondary carriage oscillates while primary carriage is at constant speed.
3. Numerical Methodology
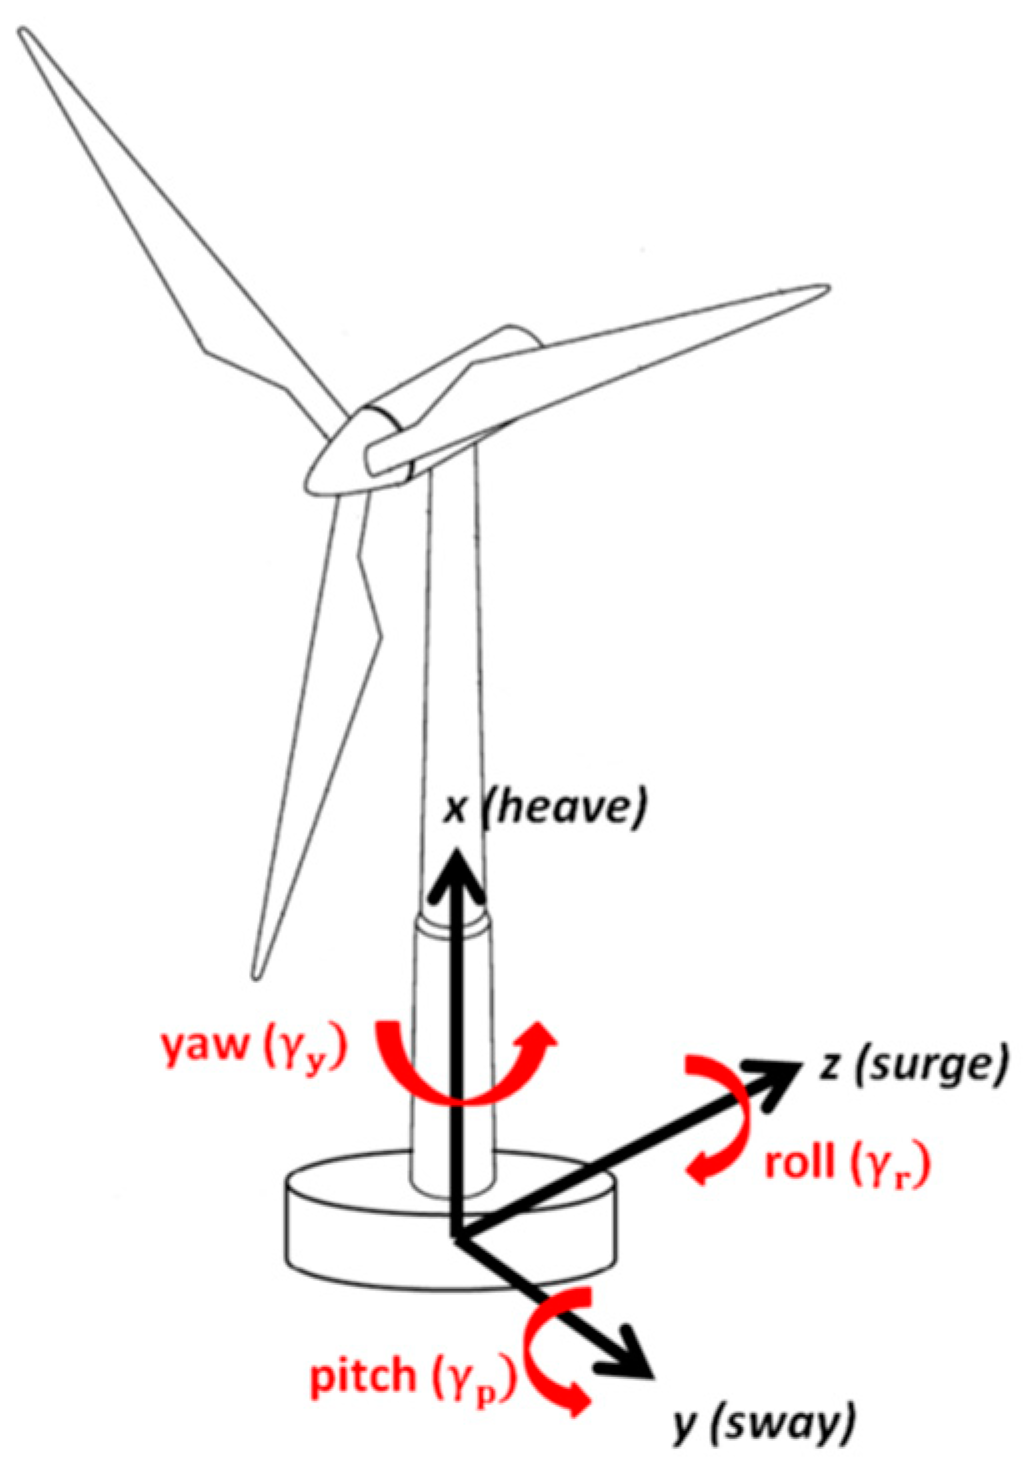
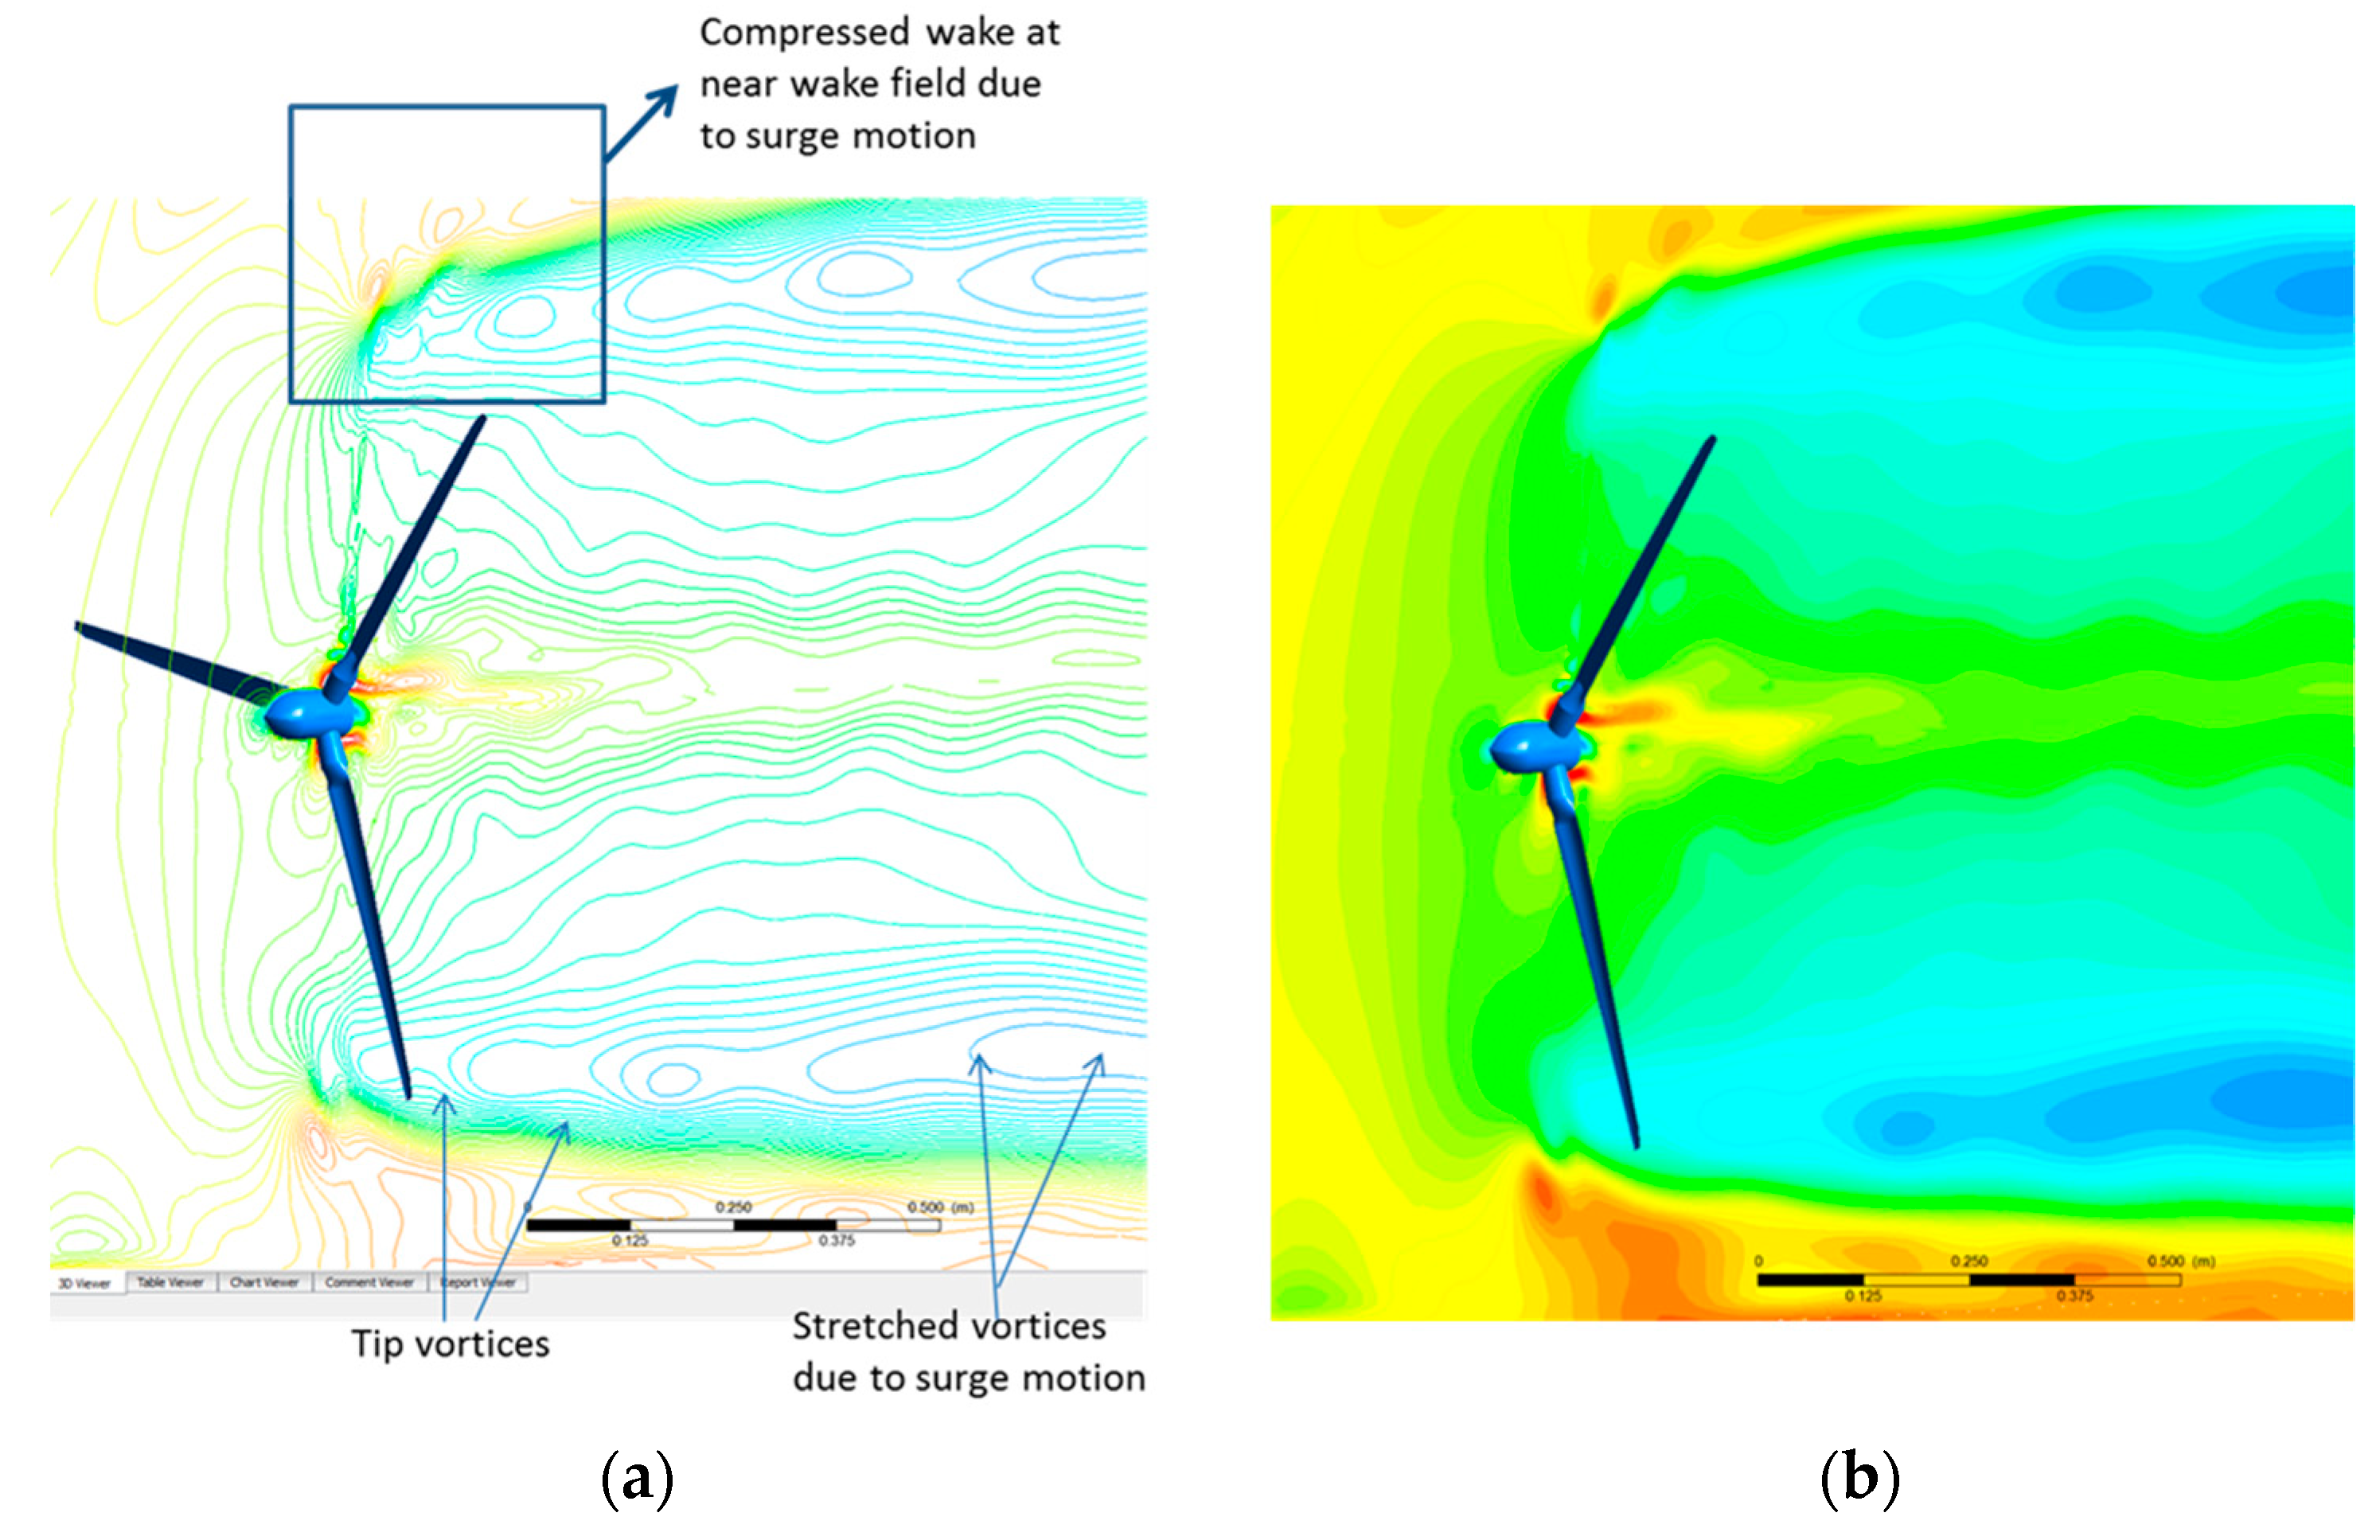
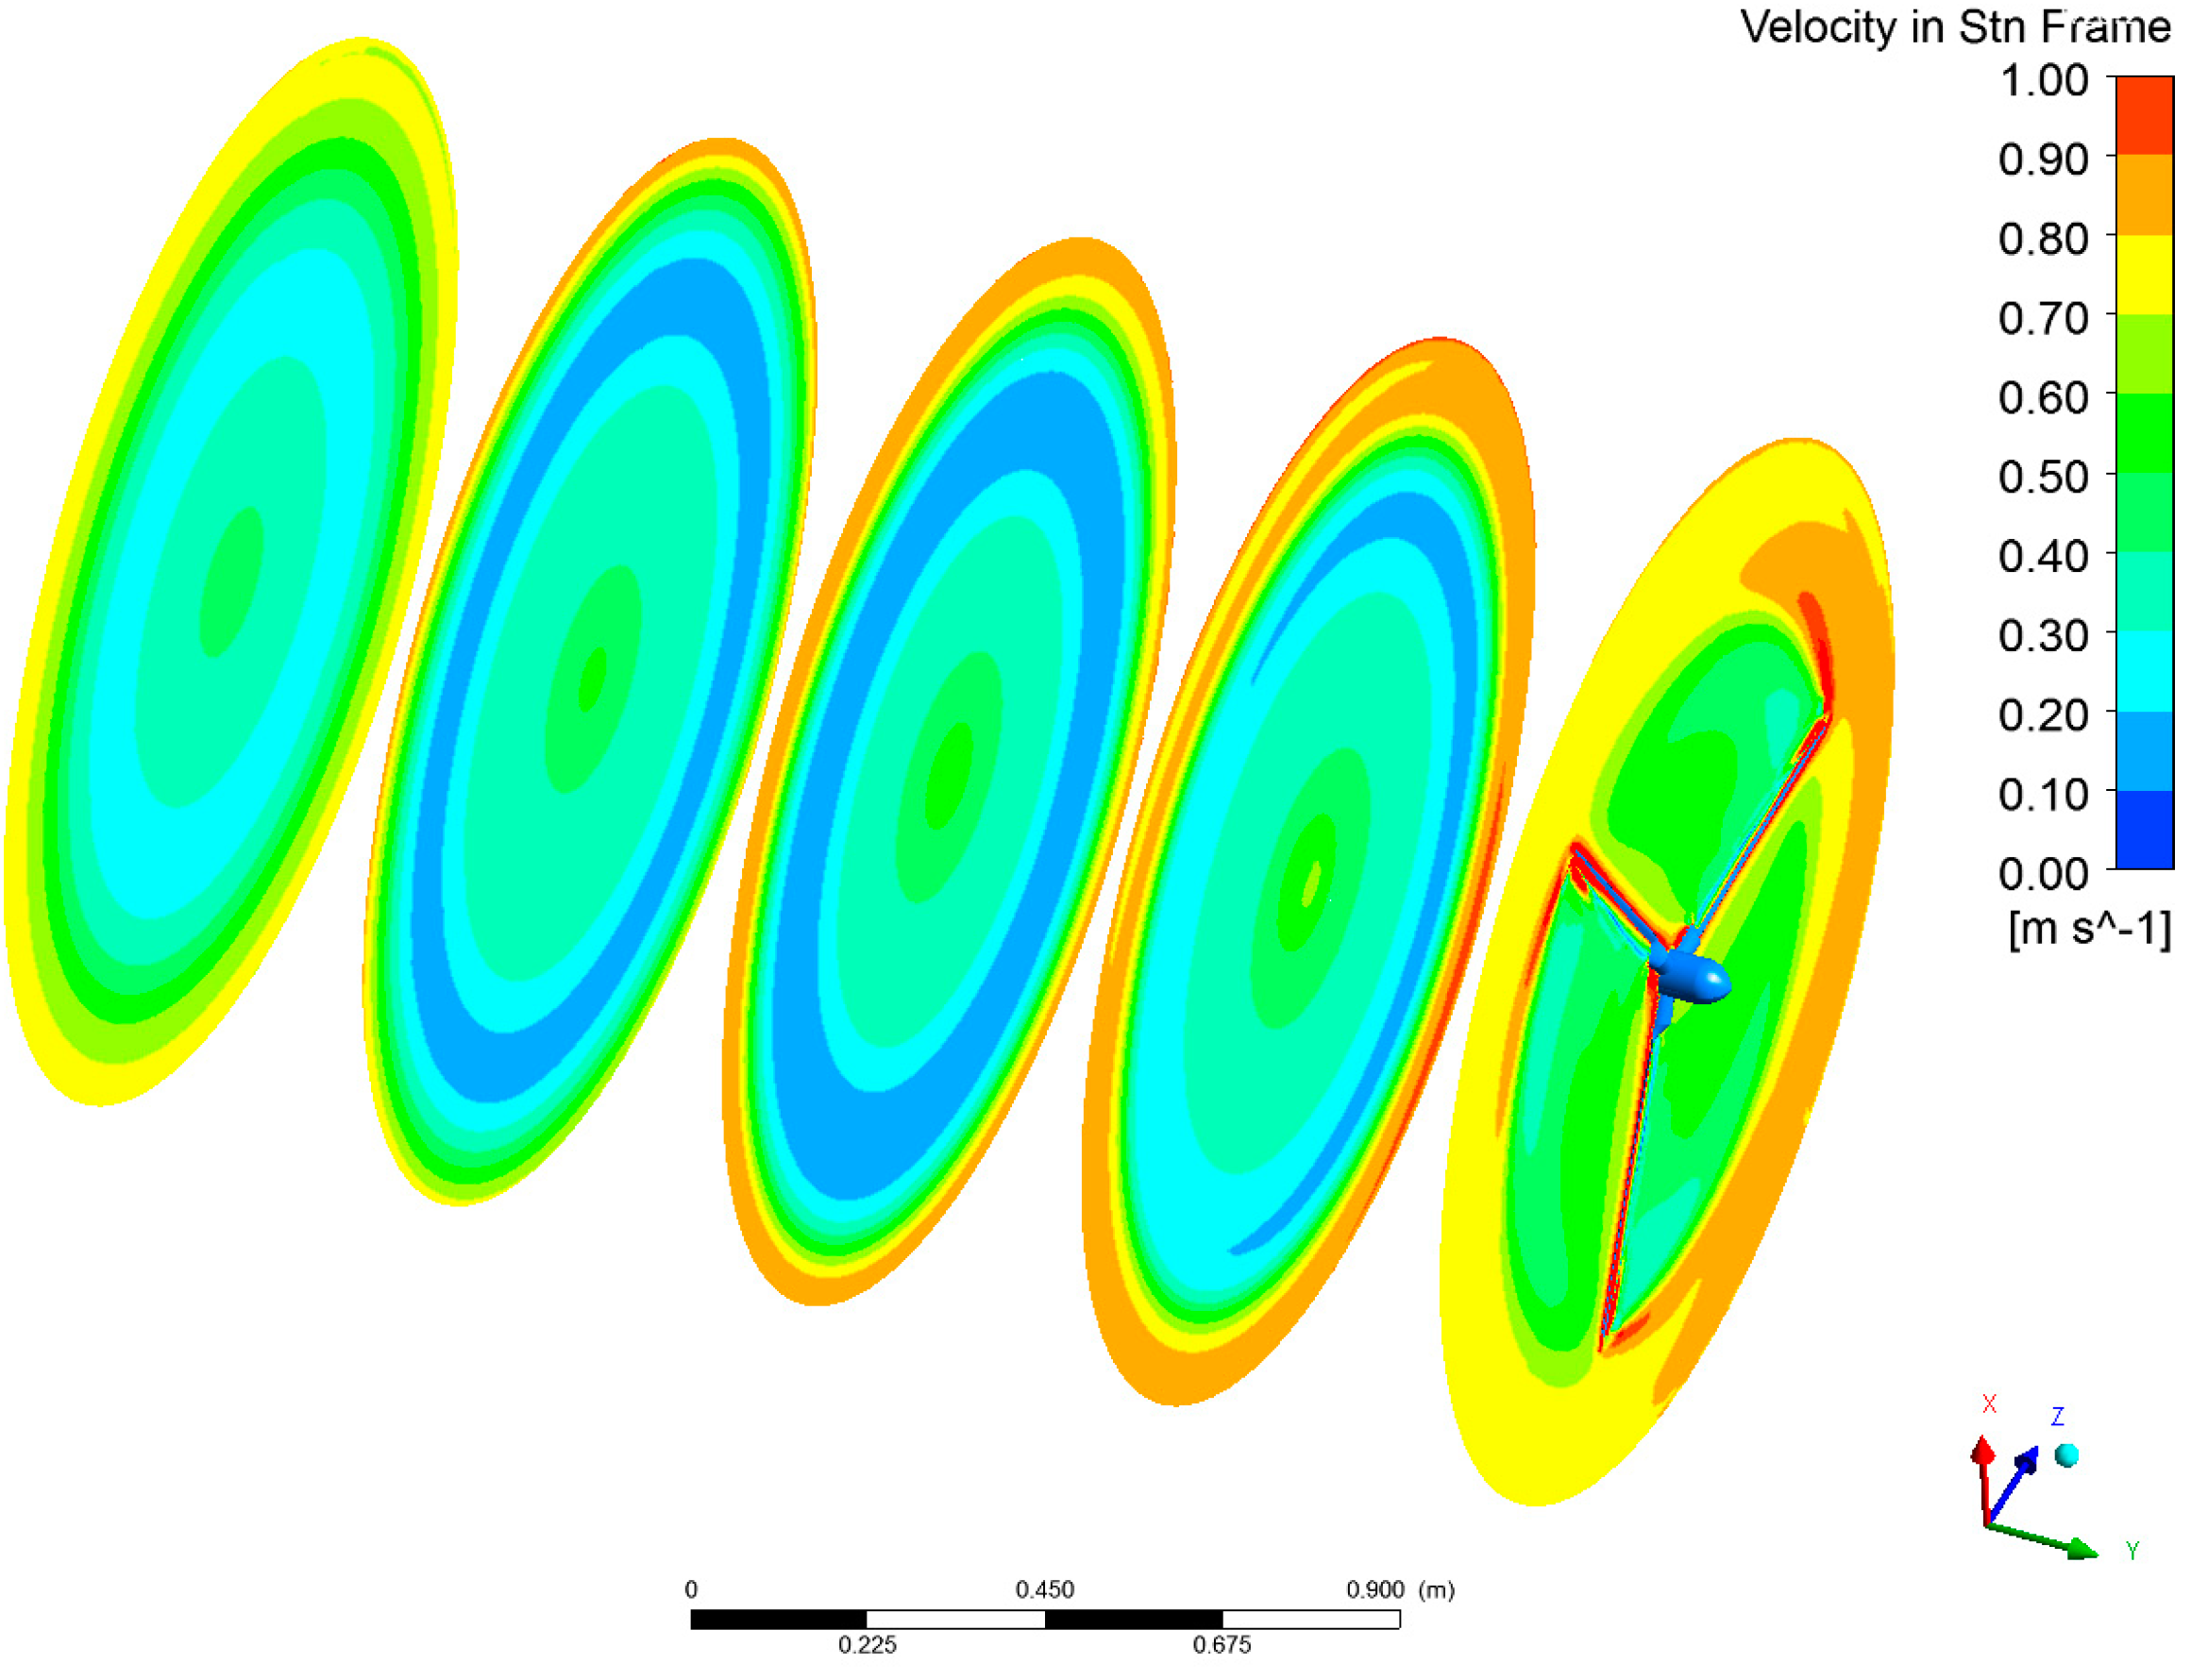
Due to wind shear between the ground or sea level to the tip of the rotor blade, gust, turbulence, flow field around the rotor and near wake regions are highly complex, even in land-based installations. In FOWT, the complexity is further compounded by the additional motions at the rotor plane induced by the floating platform subjected to the three translational (heave, sway, and surge) and three rotational (yaw, pitch, and roll) motions as shown in the
Figure 6. Among these six motions, surge motion and pitch motion are responsible for pushing the rotor to interact with its own wake. This interaction significantly modifies the wind turbine’s operating state and in turn varying the axial induction velocity field and unsteadiness. As the BEM theory is constructed based on the axial induction factor range, it has to be validated to gain sufficient confidence before applying to FOWT. In the current study, scaled rotor surge motion experimental results were exploited for validating the numerical codes.
CFD, LR-AeroDyn and LR-uBEM has been chosen for the validation study. CFD simulations are carried out with reasonable accuracy to gain insight on surge motion’s flow field and wake interactions. As AeroDyn is widely employed in industry for its accuracy, Marine and Hydrokinetic code is modified to incorporate the surge motion scenarios (LR-AeroDyn). LR’s research on unsteady aerodynamics of FOWT resulted in the development of LR-uBEM code accounting dynamic in flow model with other unique features. The following sections discuss in detail on these methodologies.
3.1. CFD Model
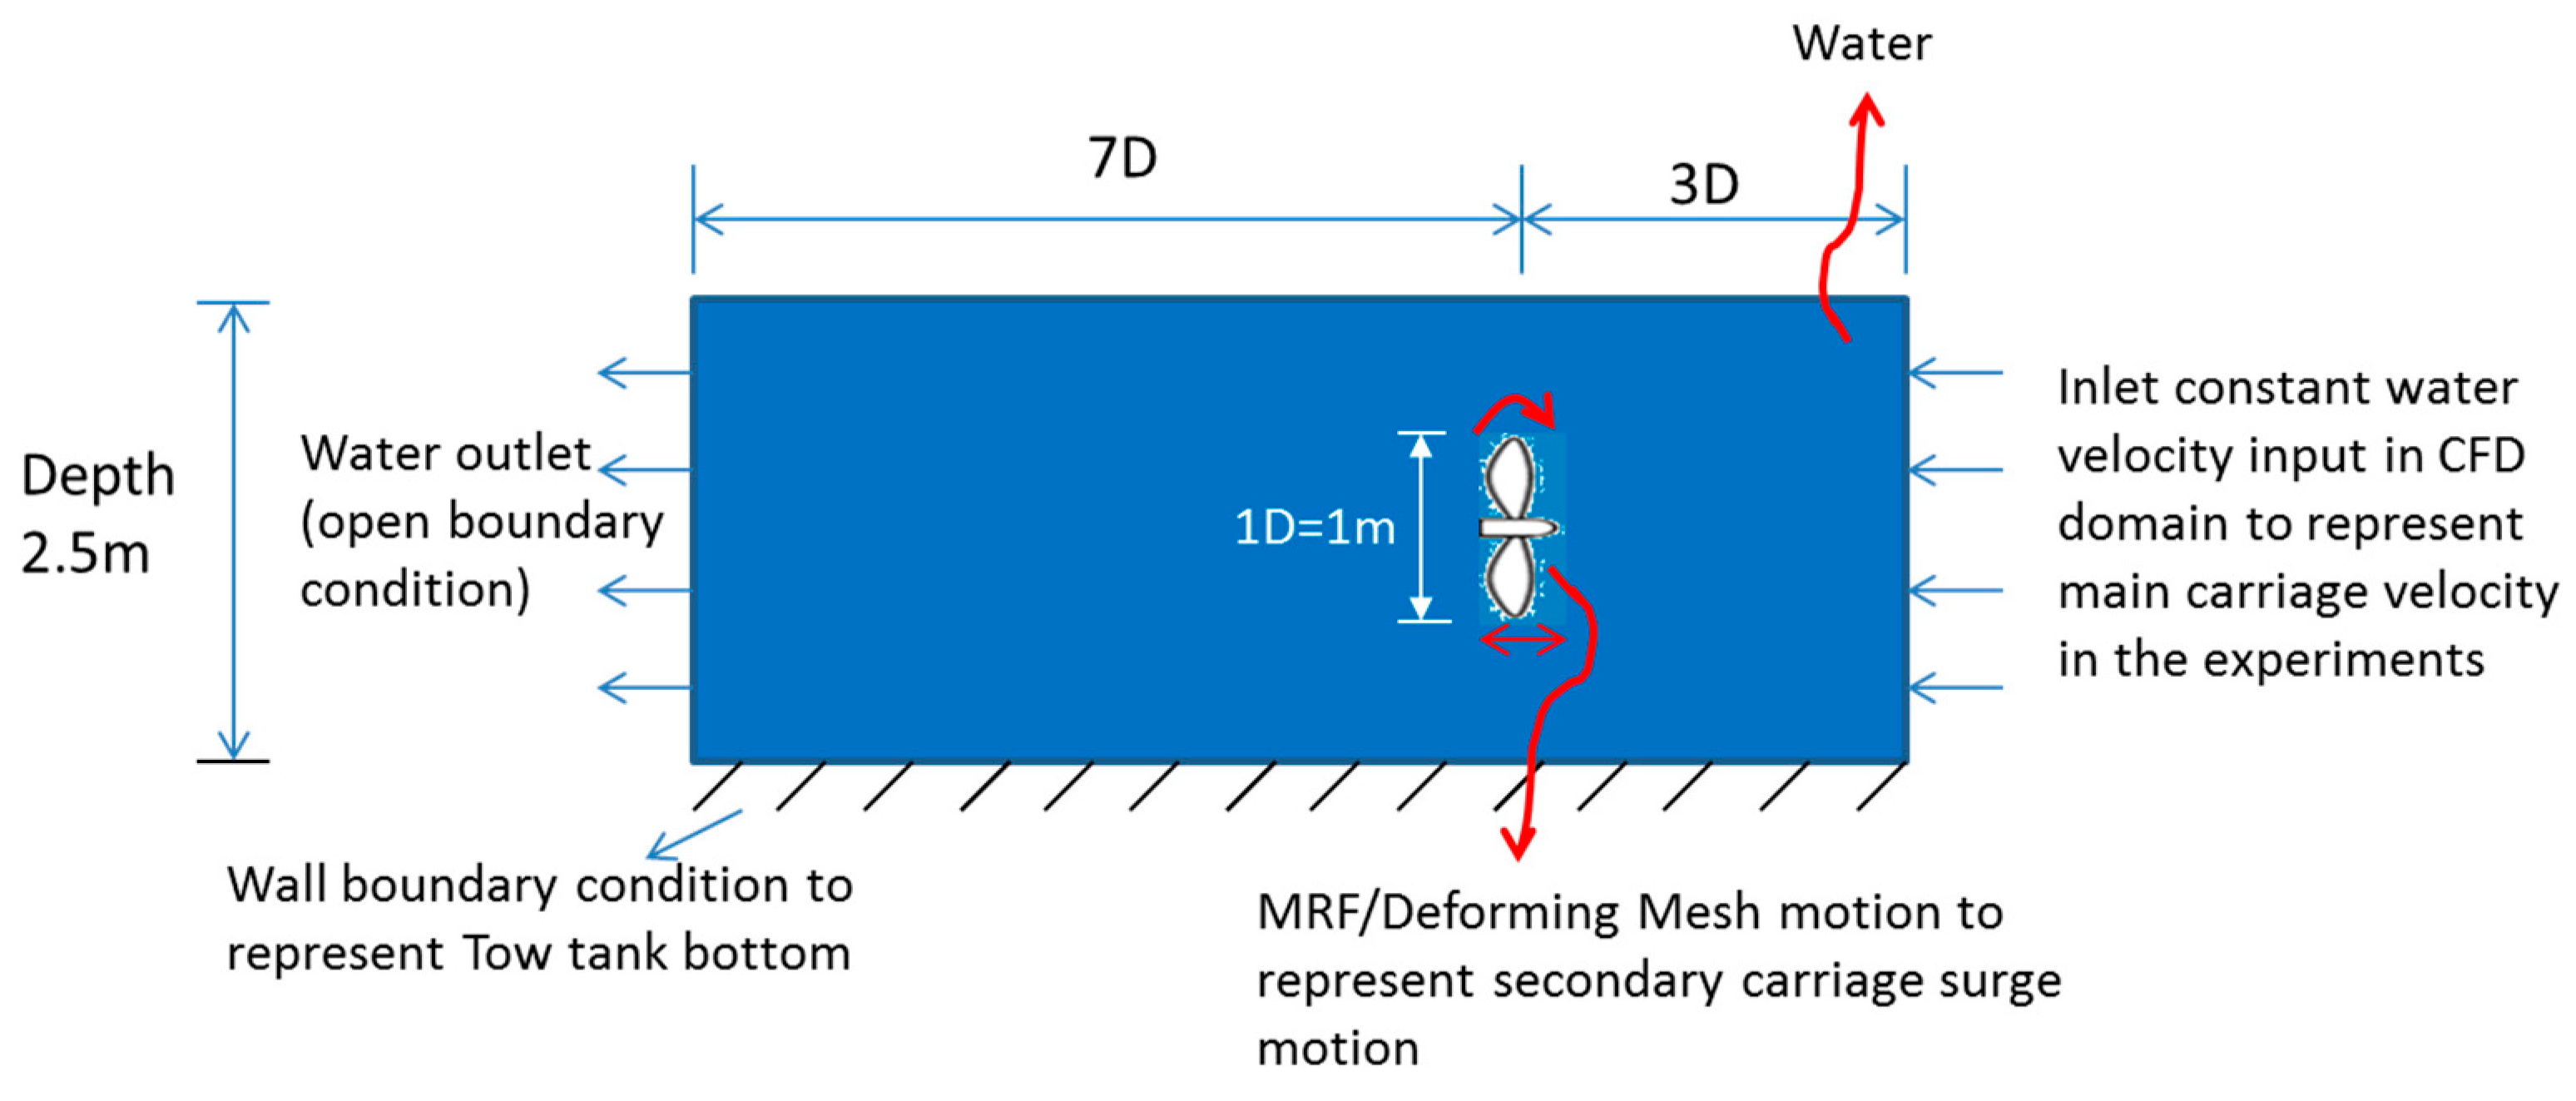
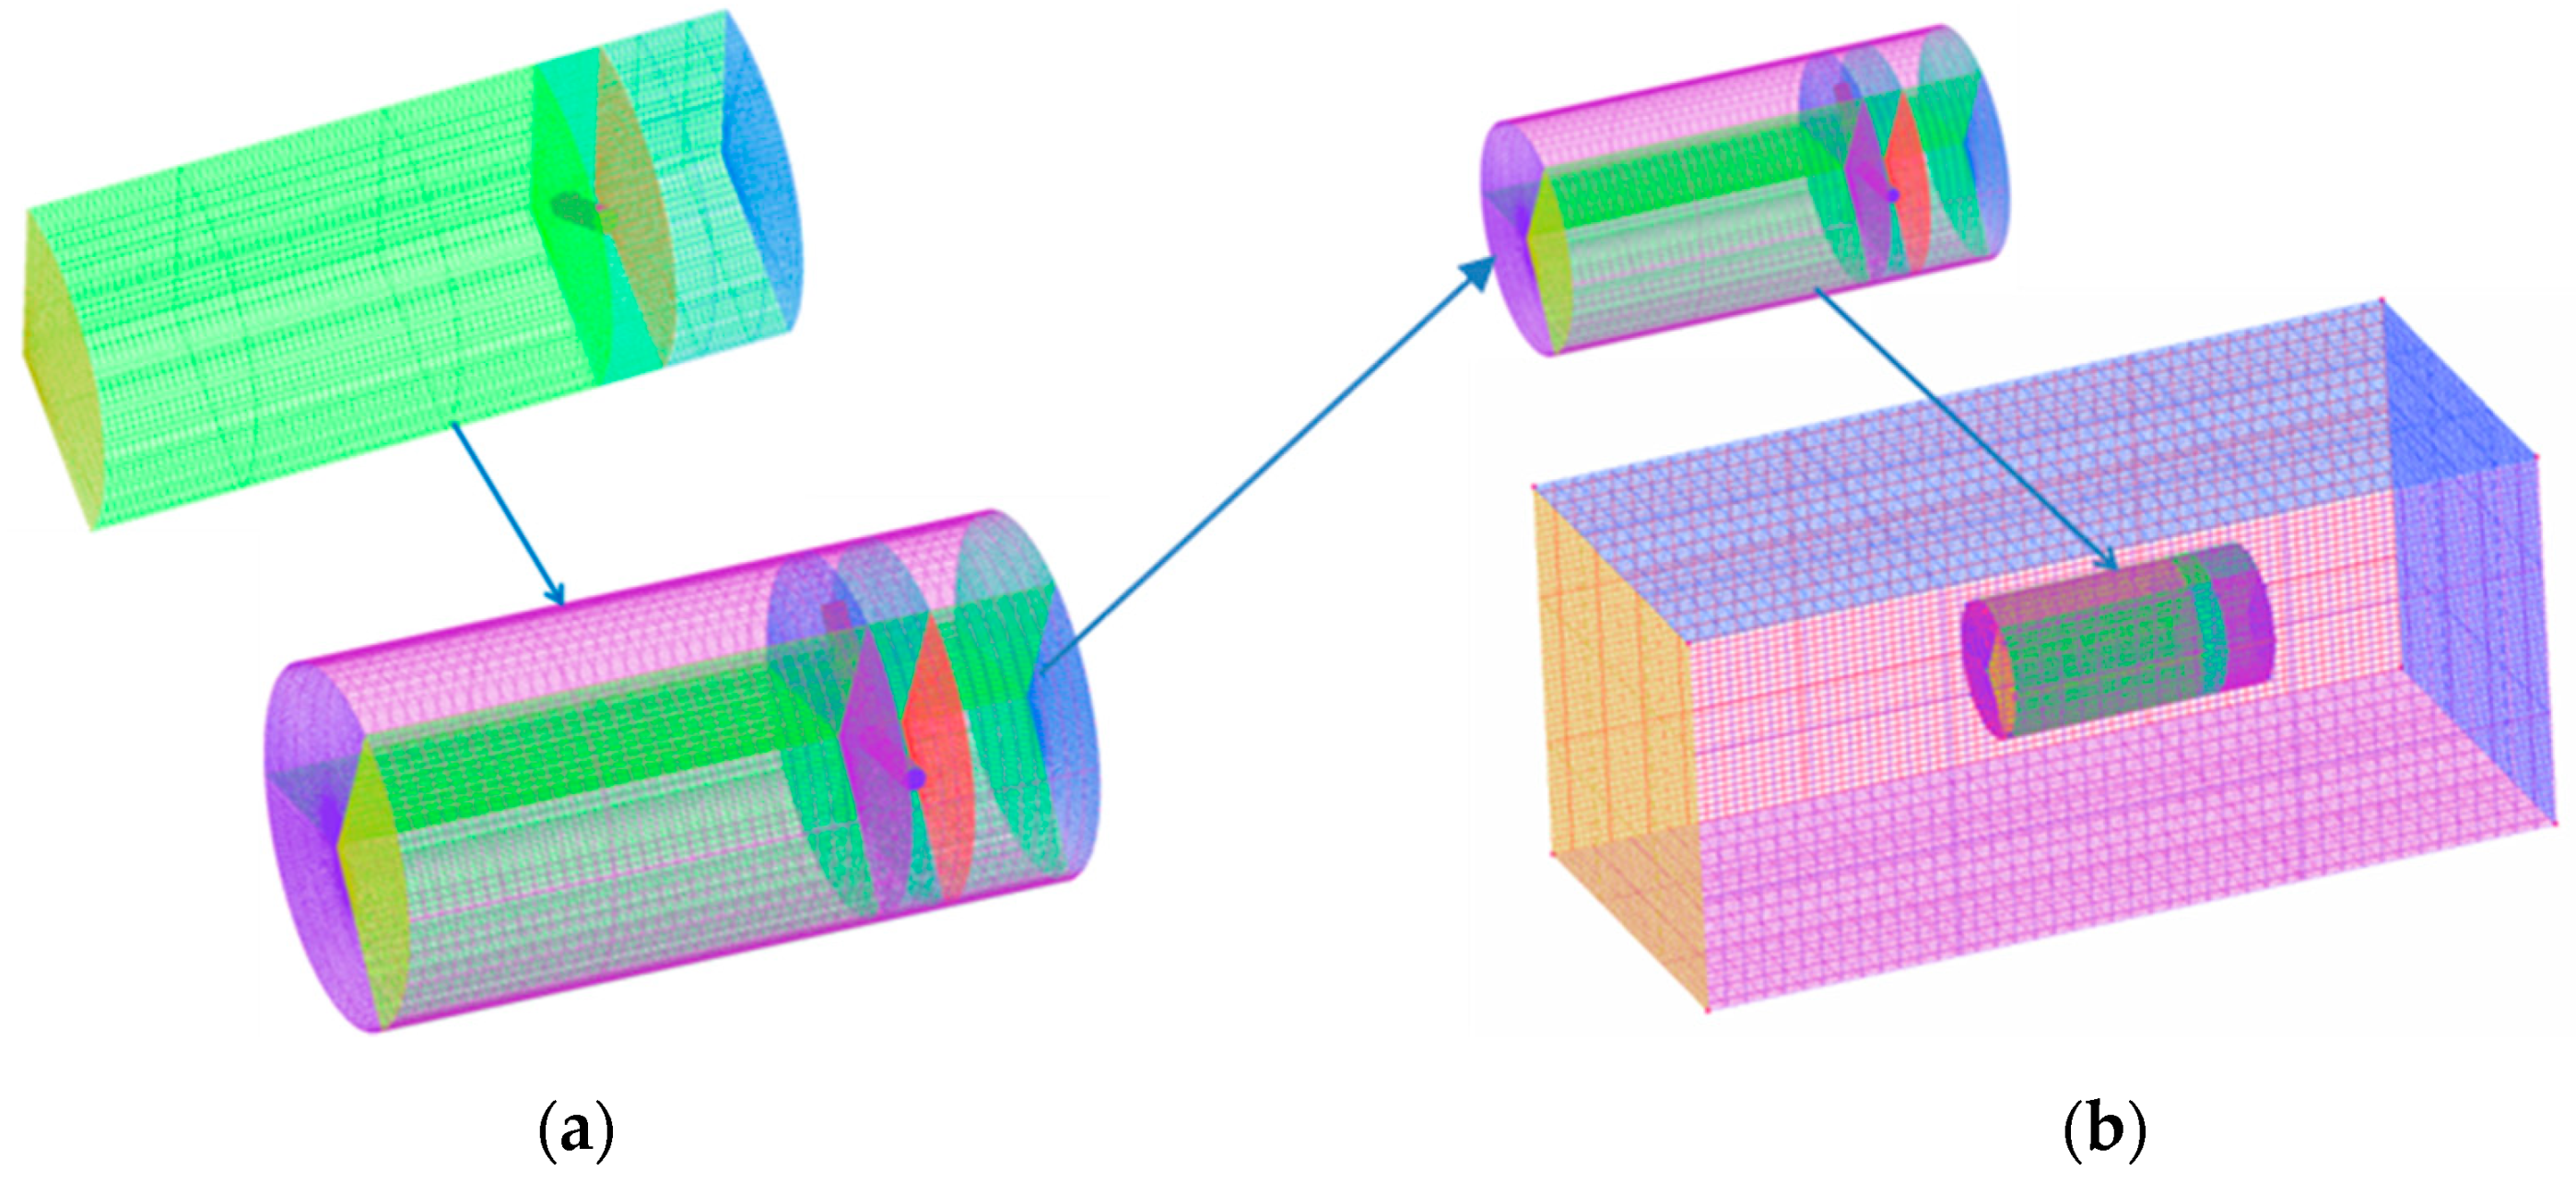
The tow tank is defined in the CFD numerical environment as in
Figure 7 to solve the unsteadiness on the rotor due to surge motion. The primary or main carriage motion (constant) of the rotor is represented as uniform inlet water boundary condition and the secondary carriage surge motion is represented as multiple reference frame (MRF) and sliding mesh motion on the rotor domain.
3.1.1. CFD Mesh Model
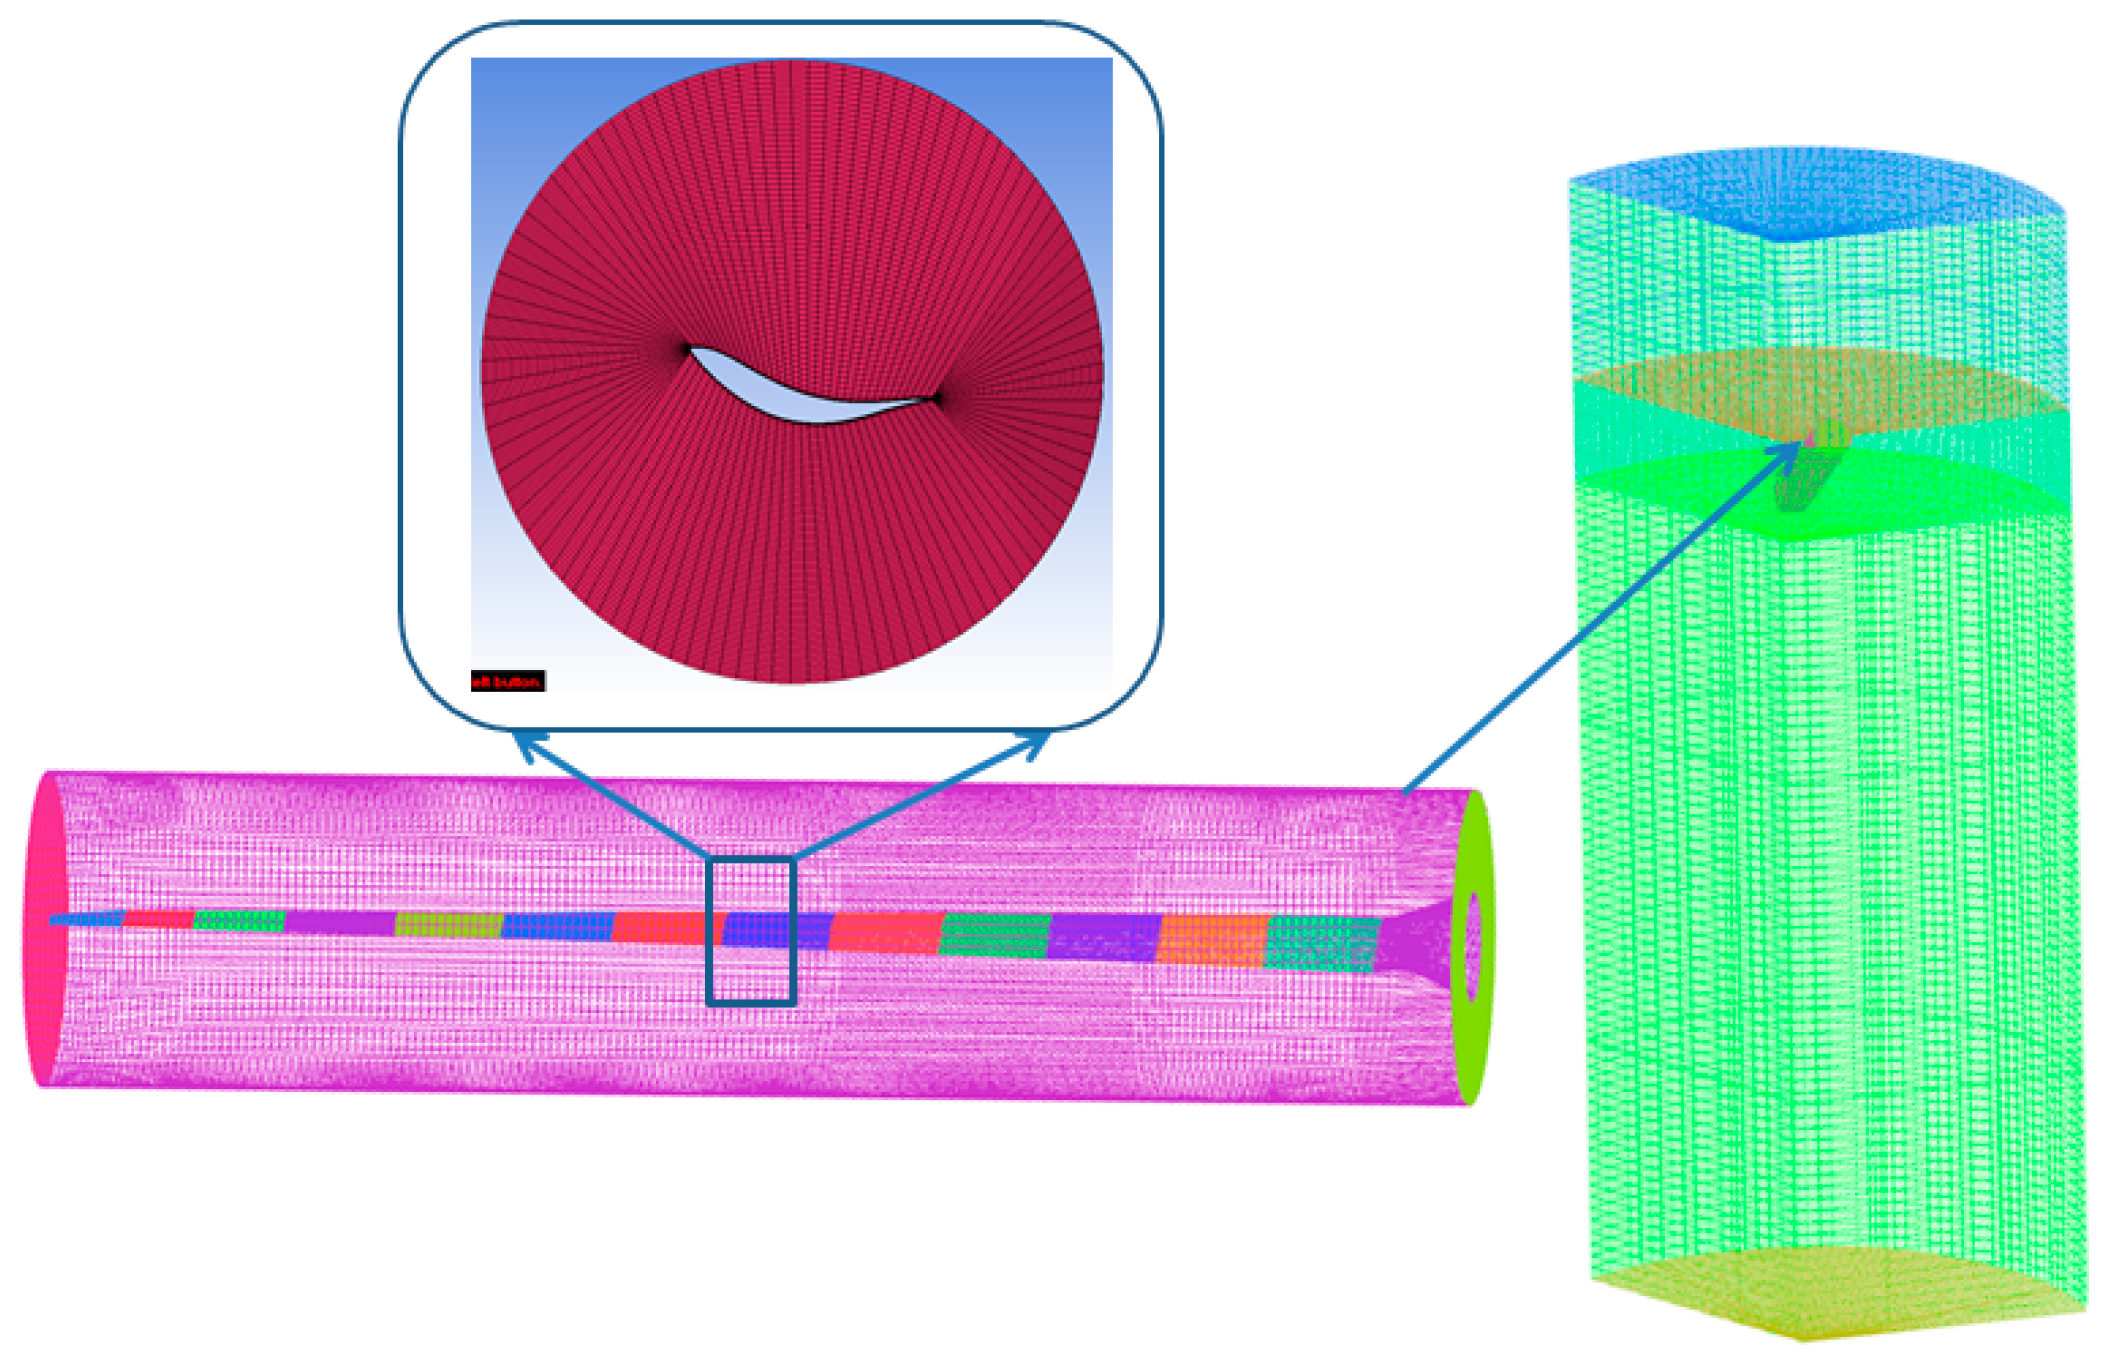
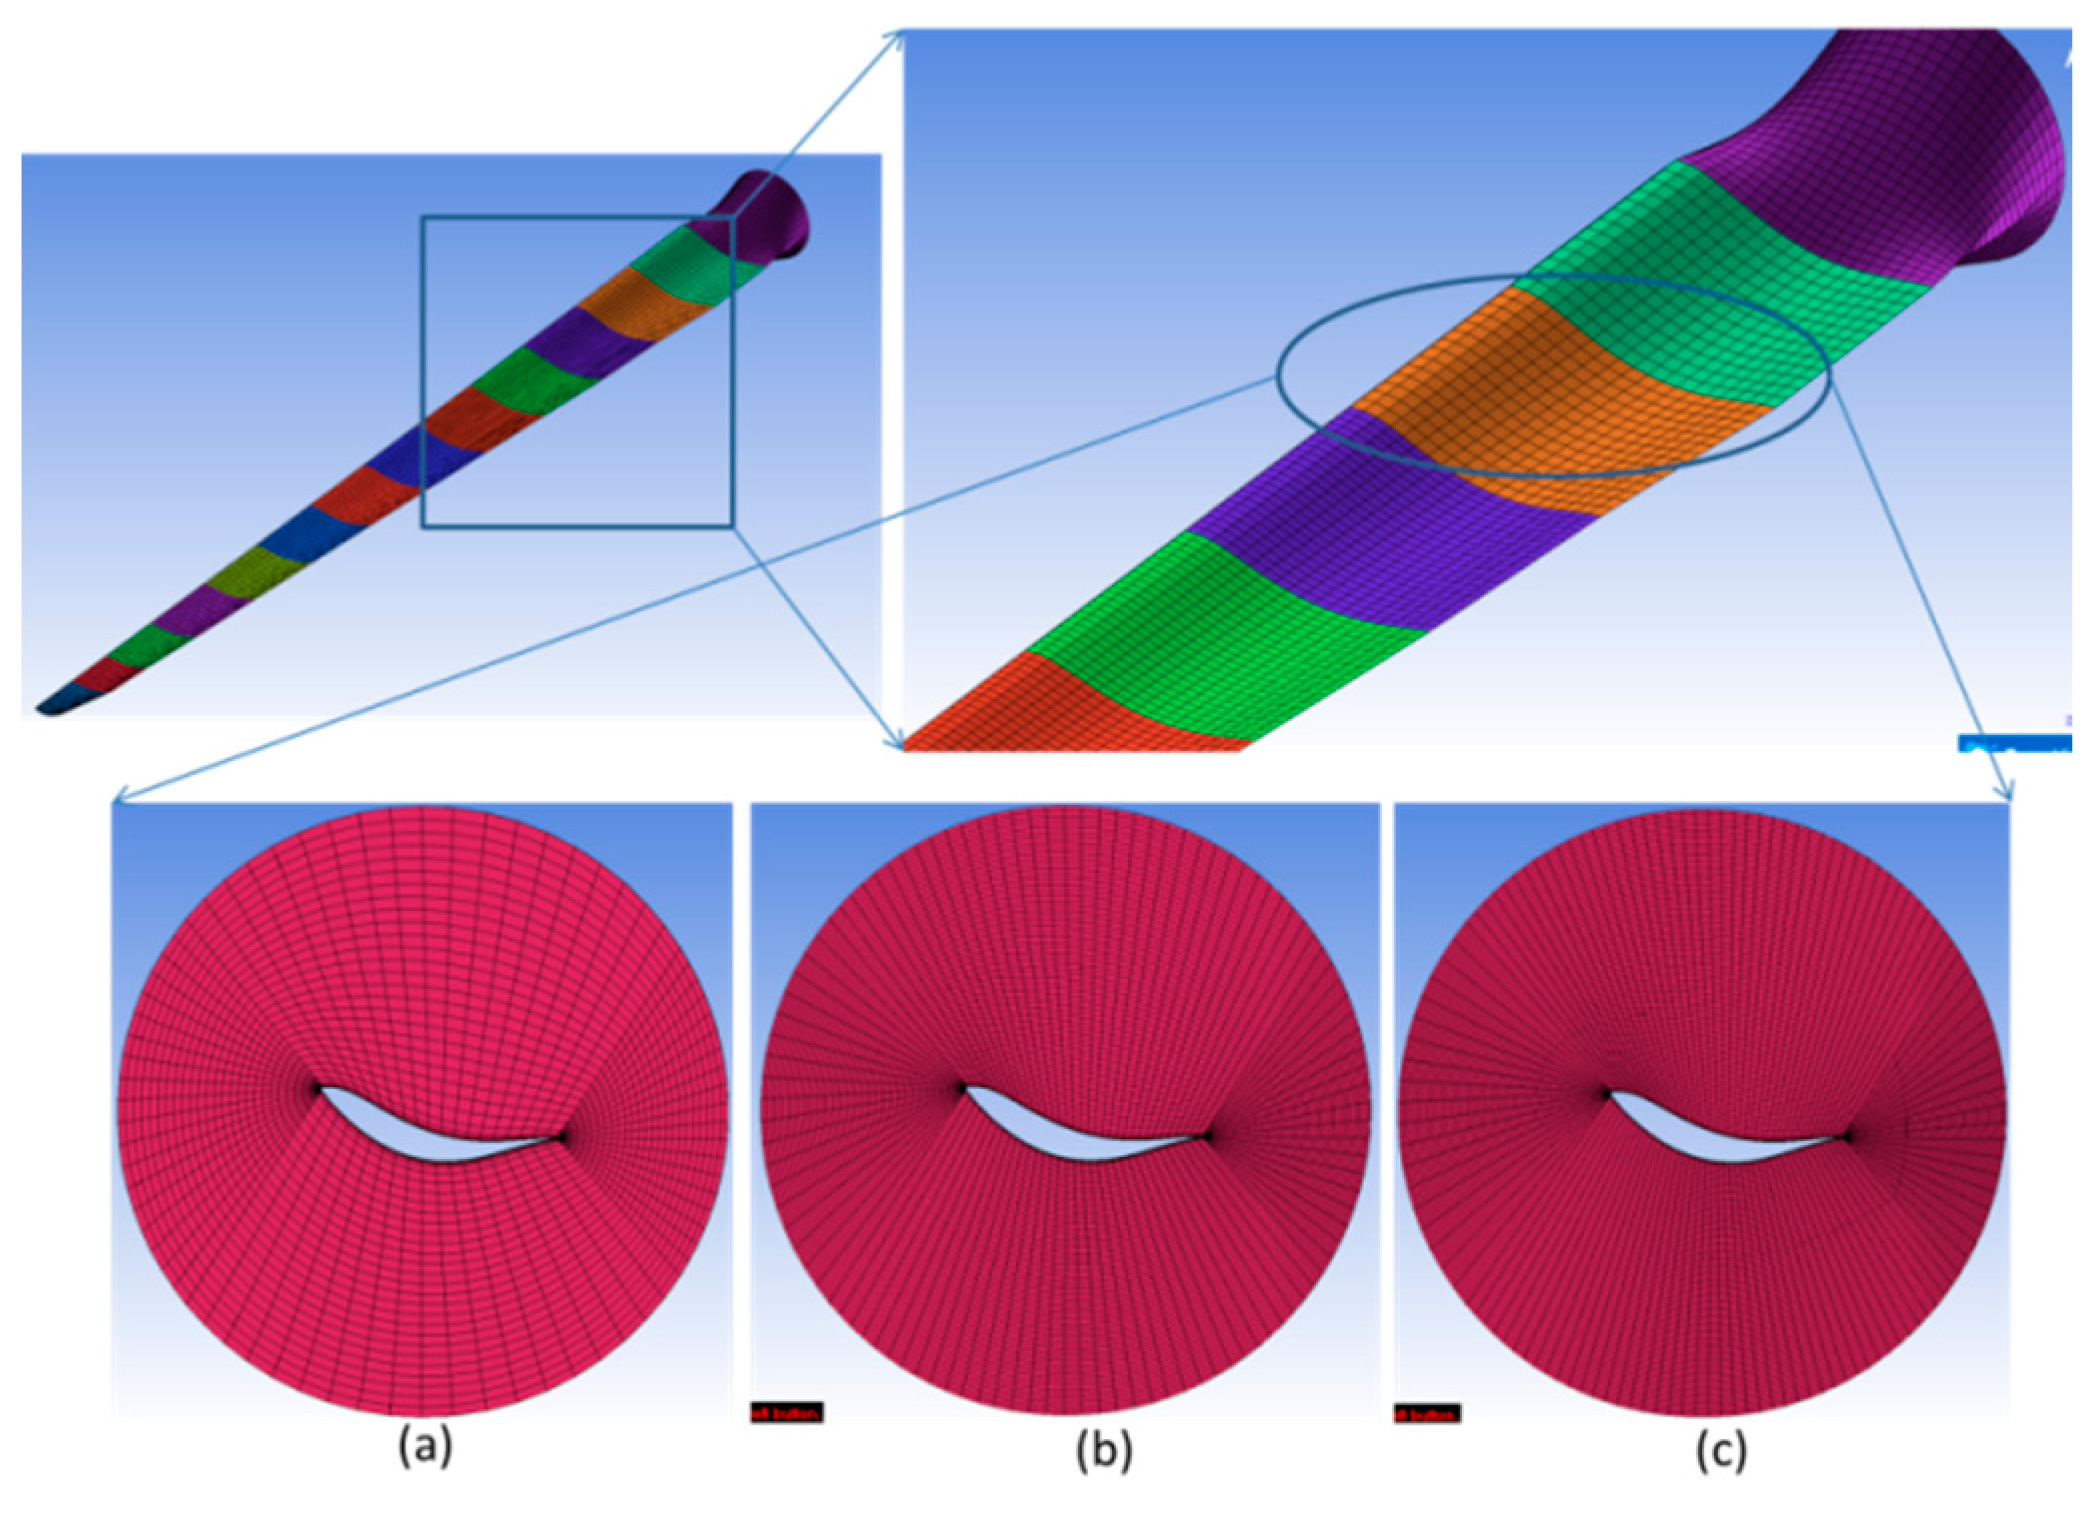
As shown in
Figure 8, the scaled rigid 3D rotor blade geometry was generated through commercial meshing software Ansys ICEM CFD (Version 16.2) by sweeping through all the 17 aero profiles of the scaled model. The hub is modelled to the dimensions used in the tow tank to eliminate any inaccuracies introduced due to the flow variation near the blade root.
The outer domain was with hexahedral mesh created by multi-block meshing strategy. The blade domain is meshed with ‘O-grid’ topology. One rotor blade of the scaled rotor is meshed with hexahedral structured mesh around it and the surrounding water of turbine rotor blade was generated. Periodicity option was used for other blades mesh to make the rotor plane mesh region. As shown in
Figure 9 and
Figure 10, the3D model of the scaled rotor model and three kinds of mesh clustering methods (log scale change in near wall and linear towards perpendicular direction) around the rotor were used in the mesh sensitivity study as the thrust force is more sensitive to method of mesh clustering.
The entire computational domain is shown in
Figure 11. The mesh was sufficiently discretized to capture the near wake and far wake field reasonably. The scaled rotor was refined to yield an y+ of ~1 near the tip and less than 2 for the rest of the domain as shown in
Figure 12.
3.1.2. CFD Numerical Solver
The mesh mathematical model is imported in to Ansys CFX CFD solver (Version 16.2) to simulate experimental scenario cases of the rigid 3D scaled rotor. The k-ω Shear Stress Transport (SST) turbulence scheme was employed without transition modeling. A high order advection scheme and first order numerical method were chosen for turbulence modelling. The k-ω based SST model employs the k-ω model for the near surface treatment and the k-ε model in the free-shear layers. In this methodology a blending function is adopted to bridge these two models. The SST k-ω model accounts the transportation of the turbulent shear stress and capable of accurately predicting the onset and the magnitude of flow separation under adverse pressure gradients in the rotor blade, near wake and far wake regions.
For the aforementioned reasons, the two-equation SST k-ω model is widely exploited in wind industry for their accurate predictions of flow over blunt body.
The k-
ω SST model has a similar form to the standard k-
ω model:
and:
in the Equations (5) and (6) represents the generation of turbulence kinetic energy due to mean velocity gradients. represents the generation of ω. and represents the effective diffusivity of κ and ω respectively. and represent the dissipation of κ and ω due to turbulence. represents the cross-diffusion term. and are user-defined source terms.
3.1.3. Mesh Sensitivity Study, Static Case Simulation and Validation
The CFD simulations were performed with constant water velocity at the inlet boundary for the static scenarios (without surge cyclic motion) as shown in
Table 2 before carrying out the unsteady test case simulations. Being aimed at mesh independent results, the
Ct of the scaled rotor was compared against the selected scenario at primary carriage speed of 1 m/s (with 14 rad/s rotor rotational speed for 7 TSR), which is 1 m/s constant water inlet velocity BC in CFD simulations. The results were published by the authors [
1] already. For the validation with reasonable accuracy, medium size mesh model was used in CFD model for static and unsteady experimental scenario. As the thrust force used for scaled airfoil optimization function [
7], it is primarily considered for the comparison and validation with numerical scaled rotor simulations. The medium size mesh CFD model domain was with 7.32 million cells. This mesh model is considered to be acceptable aerodynamically as y+ value is below 1 close to critical area of the rotor and below 2 in the rest of the scaled rotor area. To validate thrust force and torque predictions, the CFD scaled rotor model was employed with sliding mesh with MRF (Multiple Reference Frame) methodologies for computations. The CFD model predictions were validated against the tow tank experimental values for the specified cases in
Table 2.
The CFD model was simulated for the static test scenario to obtain the
Ct and
Cq for different TSR. The results were bench marked. By the combination of tow speed (primary carriage speed) and scaled rotor rotational speed (rad/s), it was possible to operate the rotor at different TSR. Even though it was meant for static scaling at constant TSR, the TSR was varied in the range of 3 to 9.5 in the experiments and CFD simulations. The rotational speed of full-scale reference NREL 5 MW rated RPM is 12.10 which is 14 rad/s for the scaled model. All other full-scale 5 MW rotor RPM is in linear relationship with scaled rotor. Therefore, a simple correlation between the scaled model rotational speed of
Ωm in rad/s and the full-scale NREL 5 MW reference rotor rotational speed
Ωf in rpm, is derived by Equation (7):
The full-scale NREL 5 MW wind speed (
Vf) can be derived from the
TSR of the scaled rotor experiment:
as the full-scale reference rotor diameter is 126 m. The primary carriage tow speed of 1 m/s (for the full-scale reference rated wind speed of 11.4 m/s) and scaled rotor rotational speed of 14.0 rad/s (for full-scale reference rotor rotational speed of 12.1 RPM) were modeled in CFD environment to validate the static experimental conditions. Henceforth, the
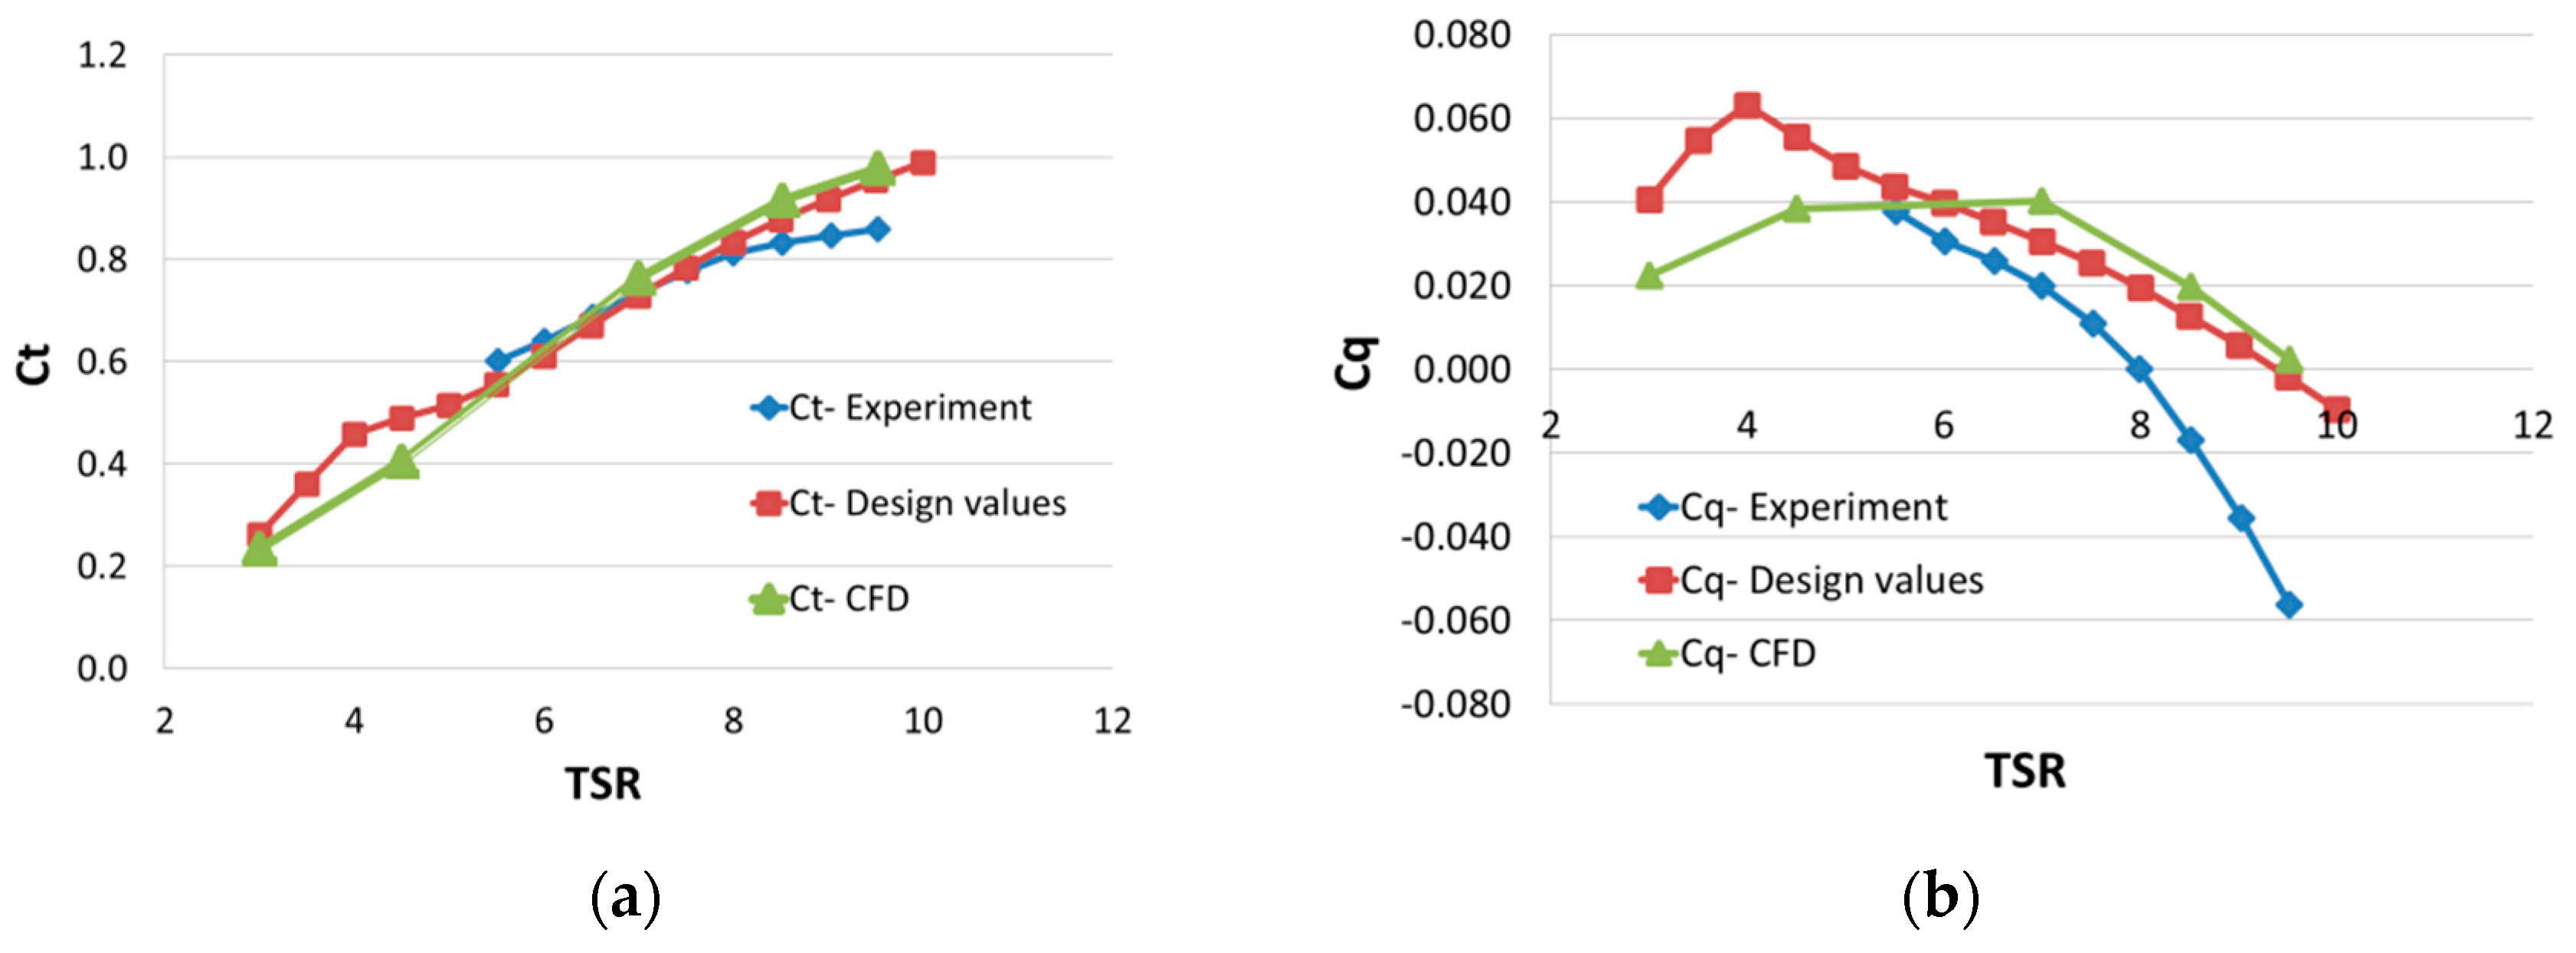
Ct and the
Cq were predicted analytically (designed values) initially and then experimental and numerical simulations were performed. Plotted results are depicted in the
Figure 13.
The thrust coefficients from all the three methods were comparable and difference was within 10%, while the Ct exhibits a prominent variation with analytical prediction (design values) from the well-correlated CFD and experimental predictions. It was expected that the significant contribution of deviation could come from Xfoil calculations of Cl (lift coefficient) and Cd (drag coefficient) due to the fact that Xfoil over predicts the drag for the low Re ranges and the same was experimentally confirmed. This is mainly due to the inability of the panel method to account the effect of non-linear flow on the drag force prediction. As the first set of Cl and Cd were derived for low angle of attack, extrapolation of values for higher angle of attack make the situation for the model to over predict the Cl and Cd values. A possible solution to reduce the error from the above problem is to obtain the Cl and Cd experimentally (by wind tunnel) for first set of Cl and Cd and thereafter it was suggested to use Viterna or Montgomerie method for extrapolation. To predict the drag force very accurately by resolving the boundary layer flow properly, a great effort has been made in fine-tuning the CFD mesh all around the wall boundary to get very good near wall treatment in the calculation. The error due to low Re effects were inevitable as the scaled rotor airfoil optimization was not under the operating Re and the early flow separation due to smaller chord length.
3.1.4. CFD Model for Unsteady Experimental Scenarios
The surge cyclic motion method was implemented in Ansys-CFX (Version 16.2) software environment. Medium size with 7.32 million node mesh model was used for the unsteady simulations. The unsteady runs include sinusoidal surging motions of the rotor from low to extreme frequencies (3–low, medium, and high) and amplitudes (2–lower and higher), to demonstrate the effect on the rotor unsteady aerodynamics as experimentally simulated. Simulations were carried out with MRF and deforming mesh setup in the CFD environment, constant water velocity from the inlet (with a turbulence intensity of 5%) of the computational domain represented constant primary carriage motion. The deforming mesh was setup up such that the mesh in the blade and near-wake regions was given a high rigidity, so that deformation is limited to the outer region with bigger cells, so negative volumes would not occur. A high resolution scheme was used for advection and turbulence numerics, a second order backward Euler scheme was used for time stepping. Pressure-velocity coupling was solved using a fourth order Rhie-Chow interpolation. The surge motion is defined by the Equation (9):
where A is the amplitude of motion and f is the frequency.
The entire blade and near-wake regions were set to oscillate as defined by Equation (9). The equation assumes that the mesh starts at the forward-most position, since there are more cells downstream of the rotor, thus it would facilitate smoother deformation. As per the
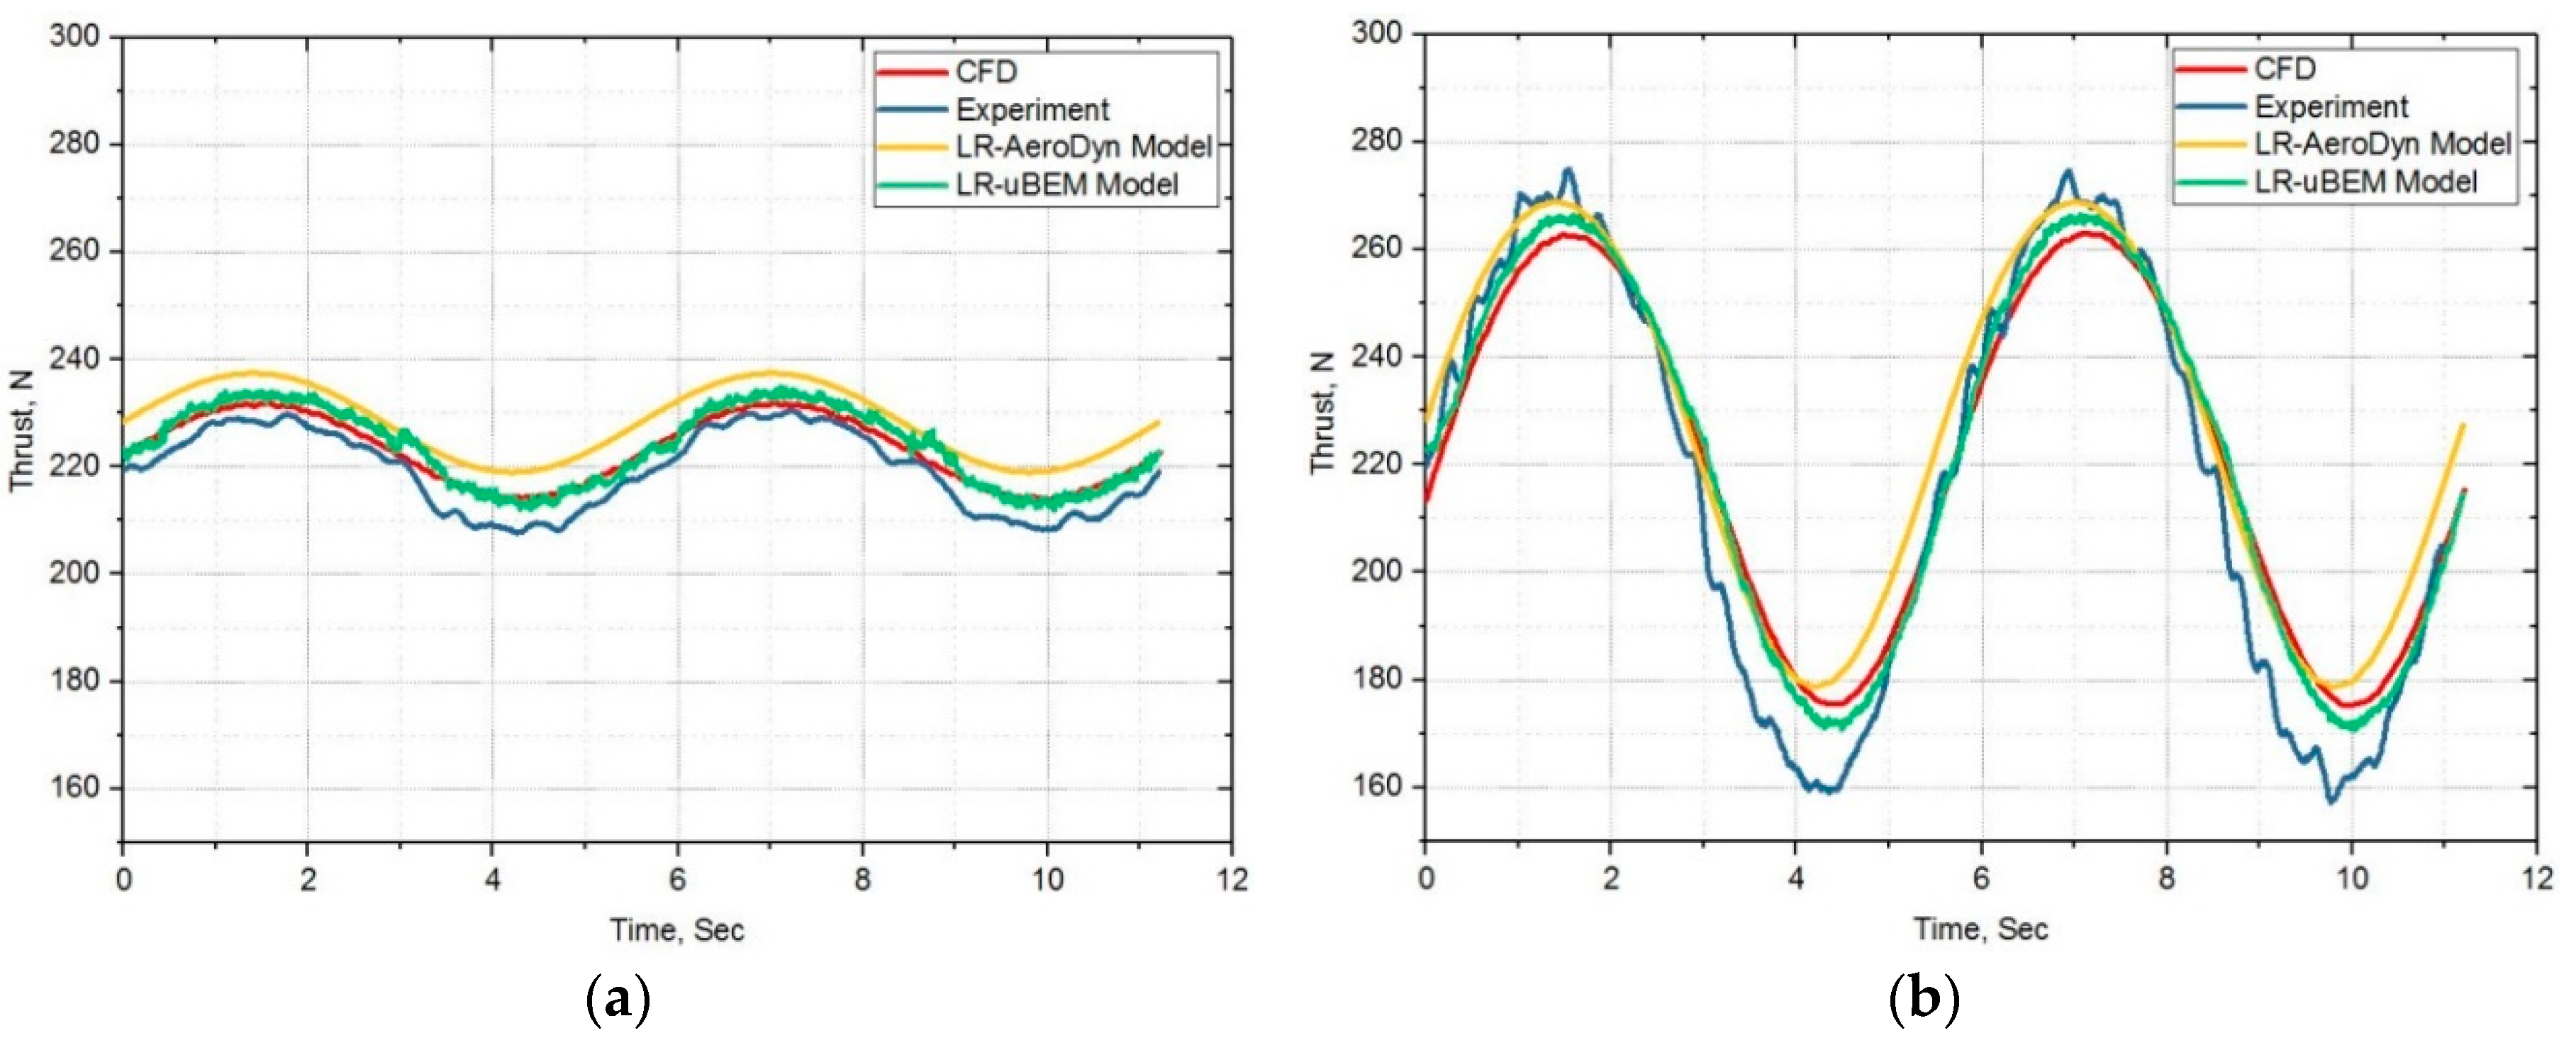
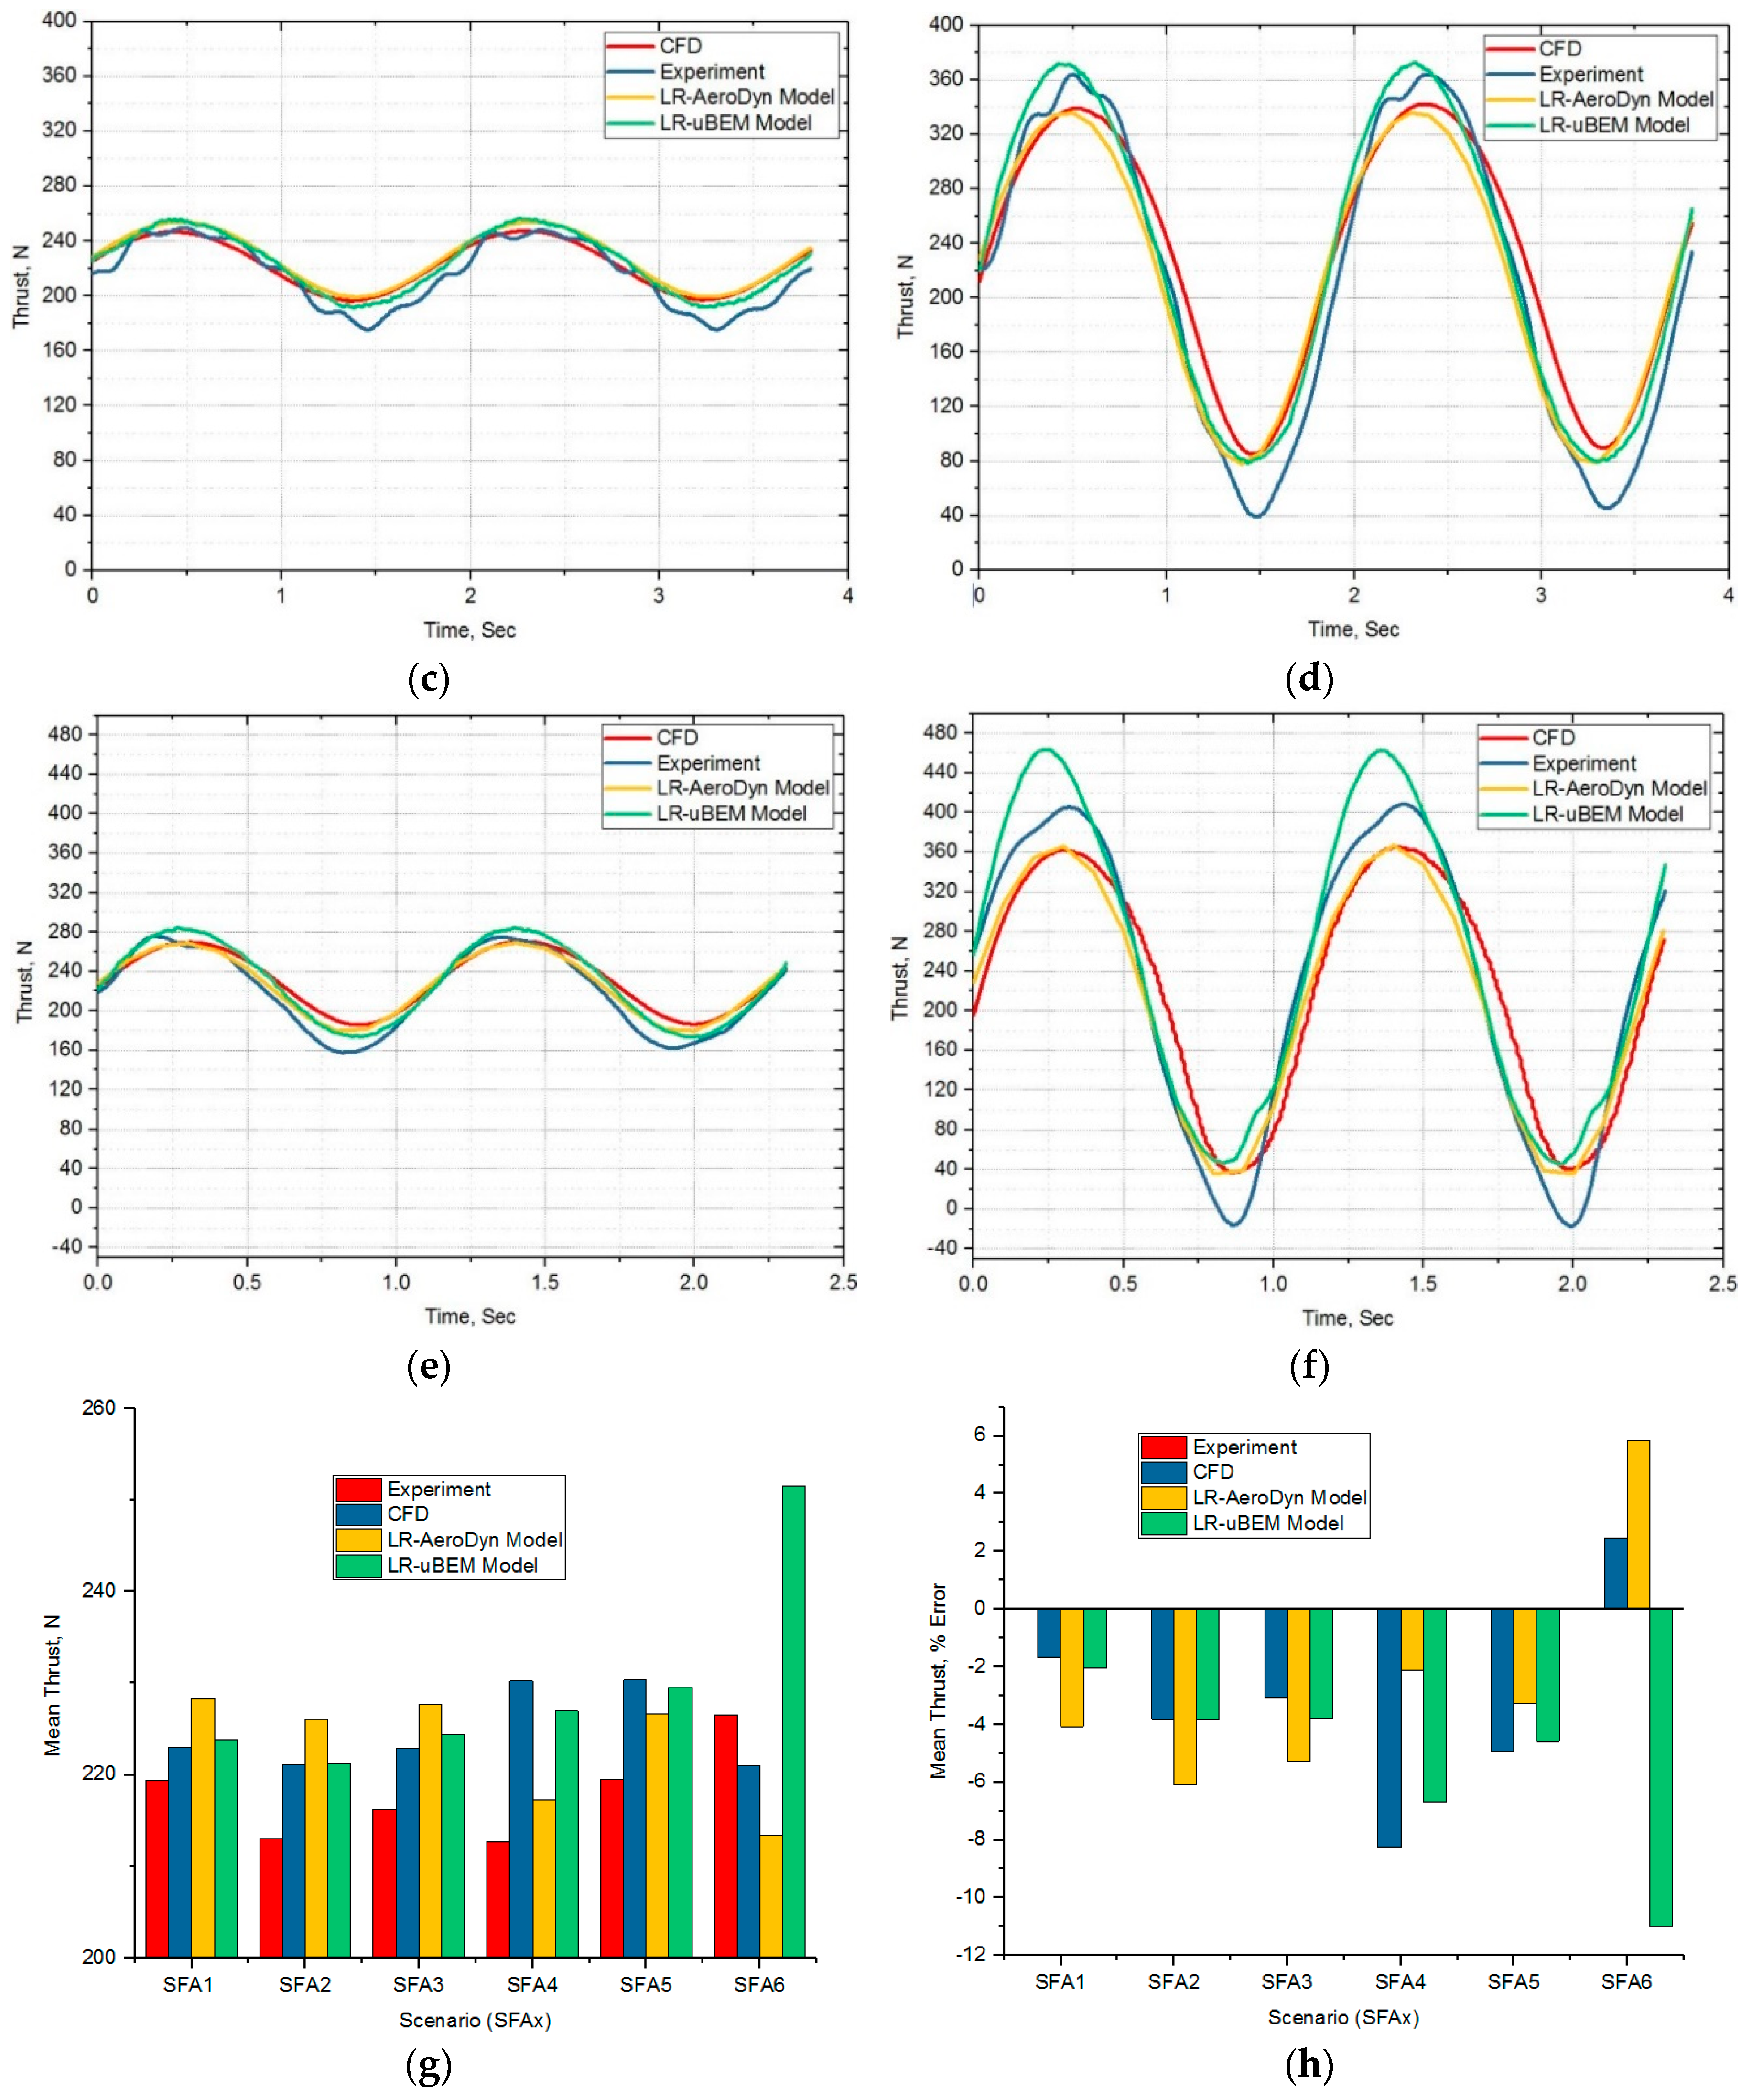
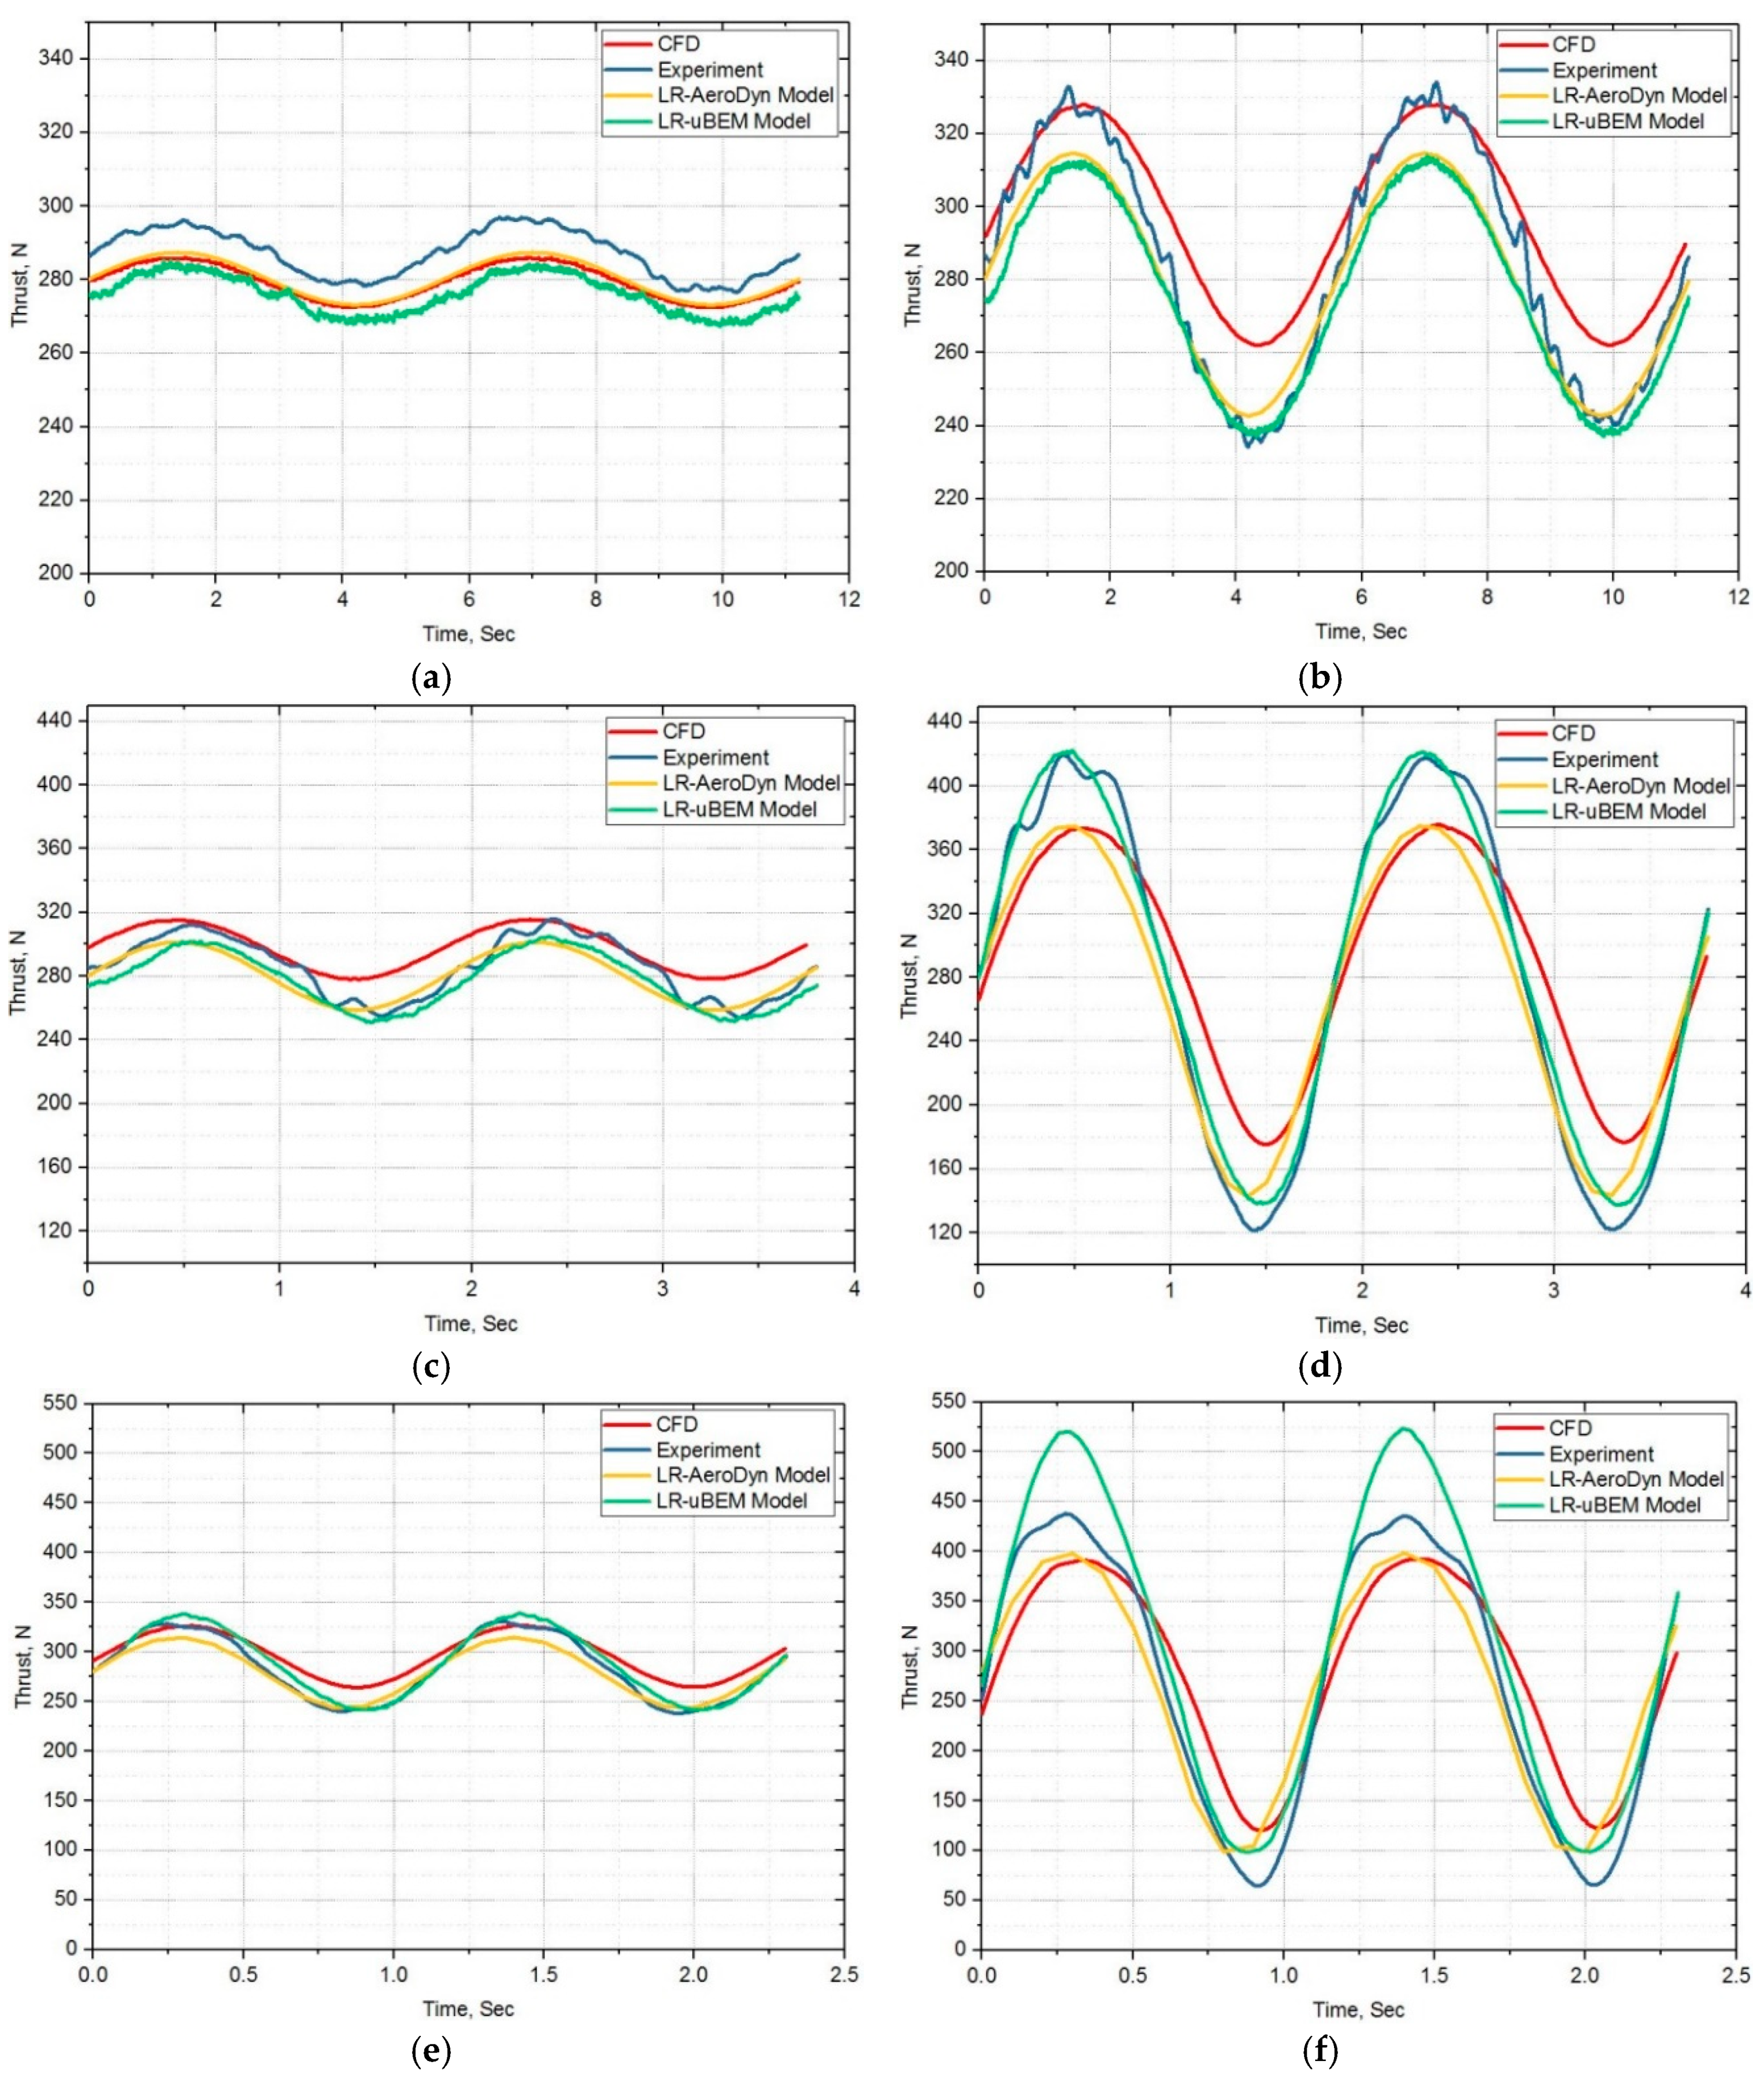
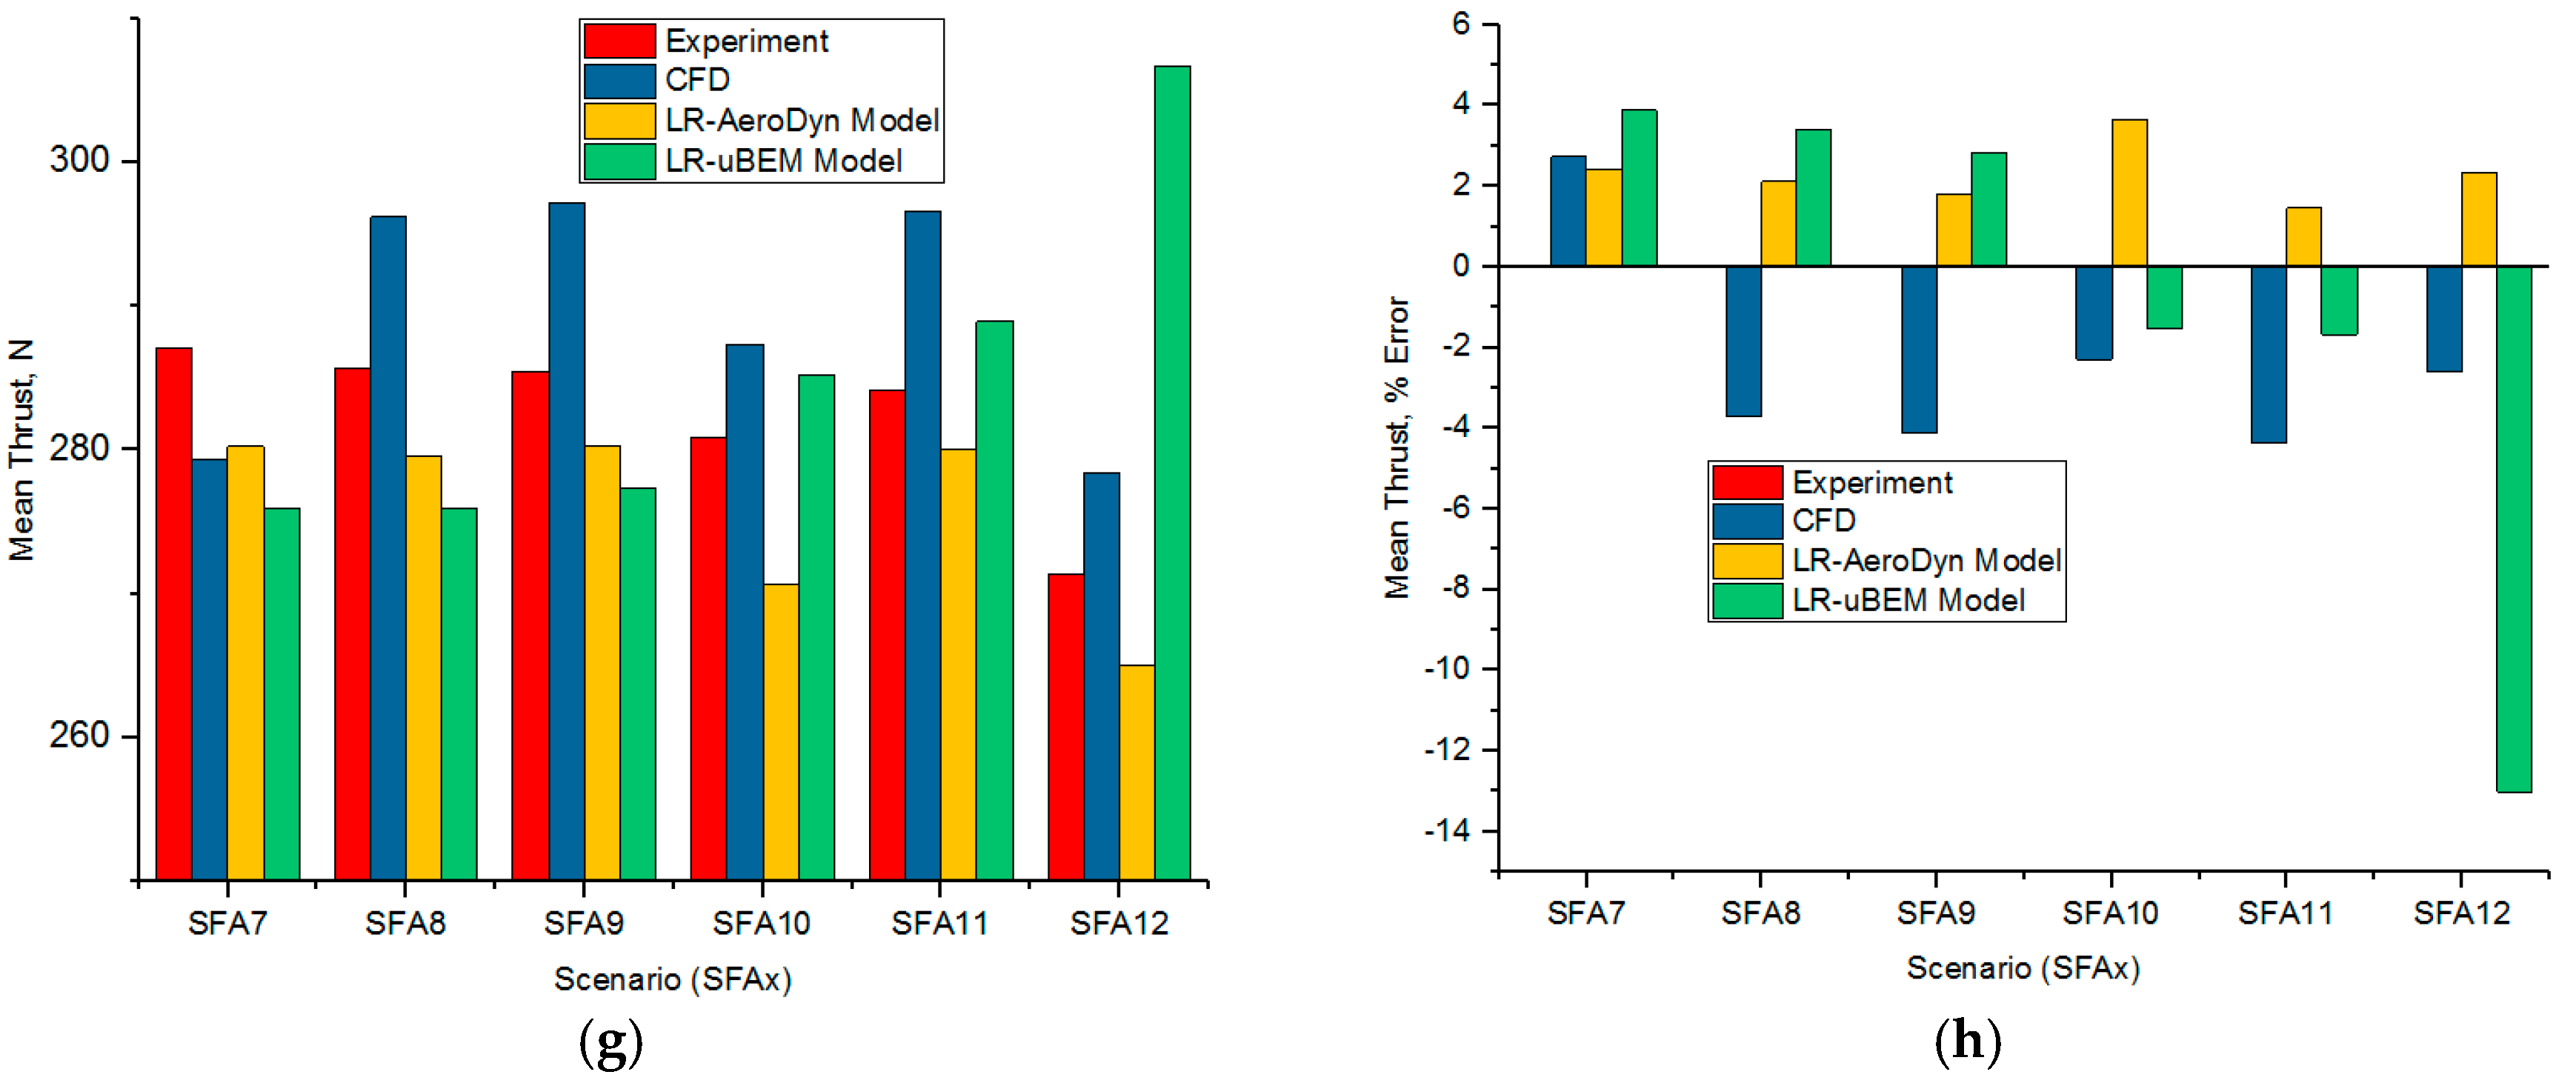
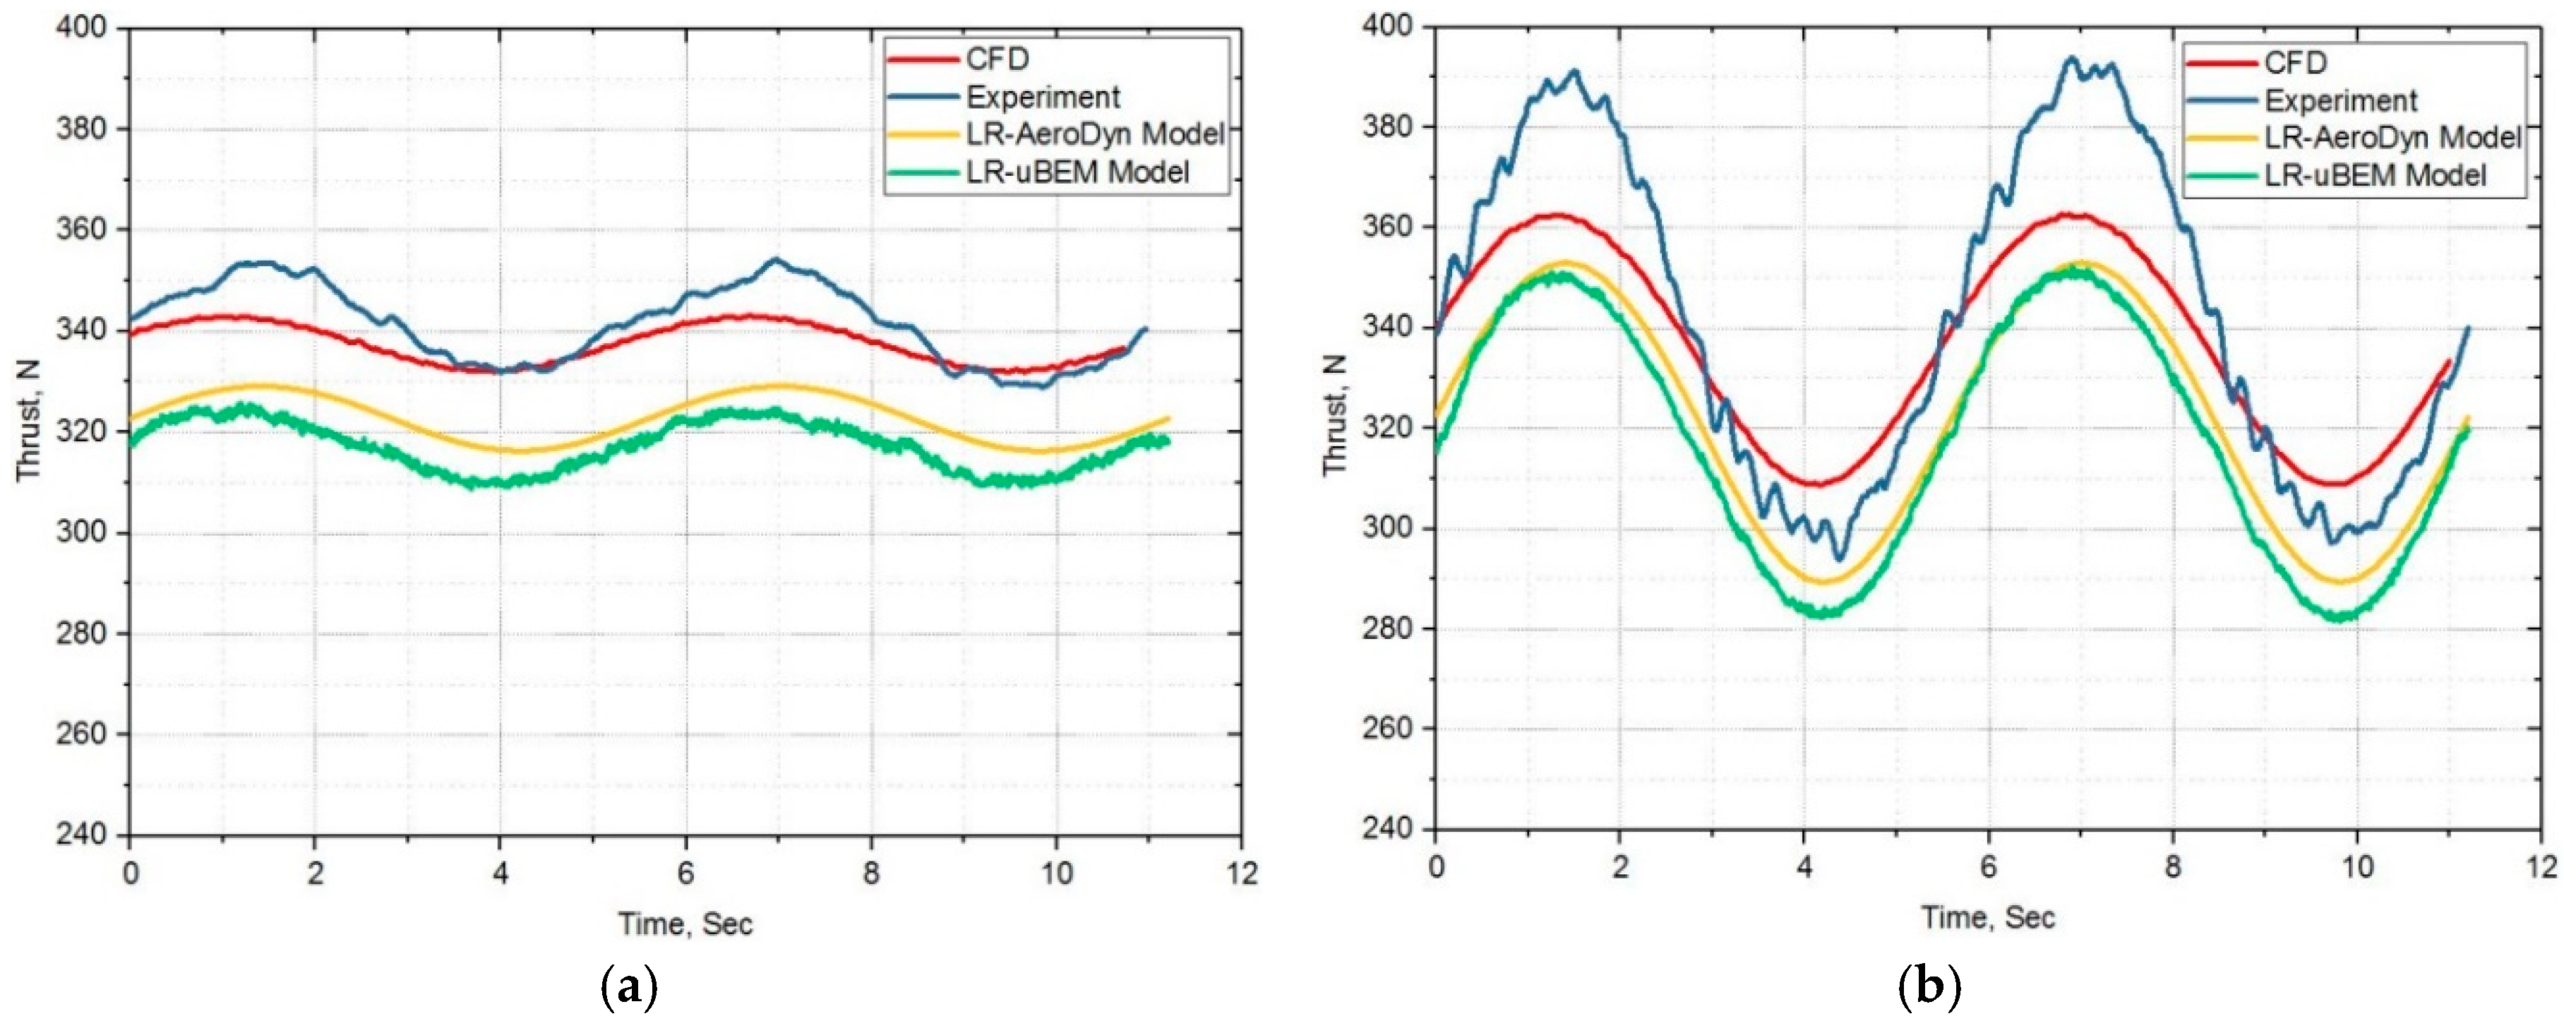
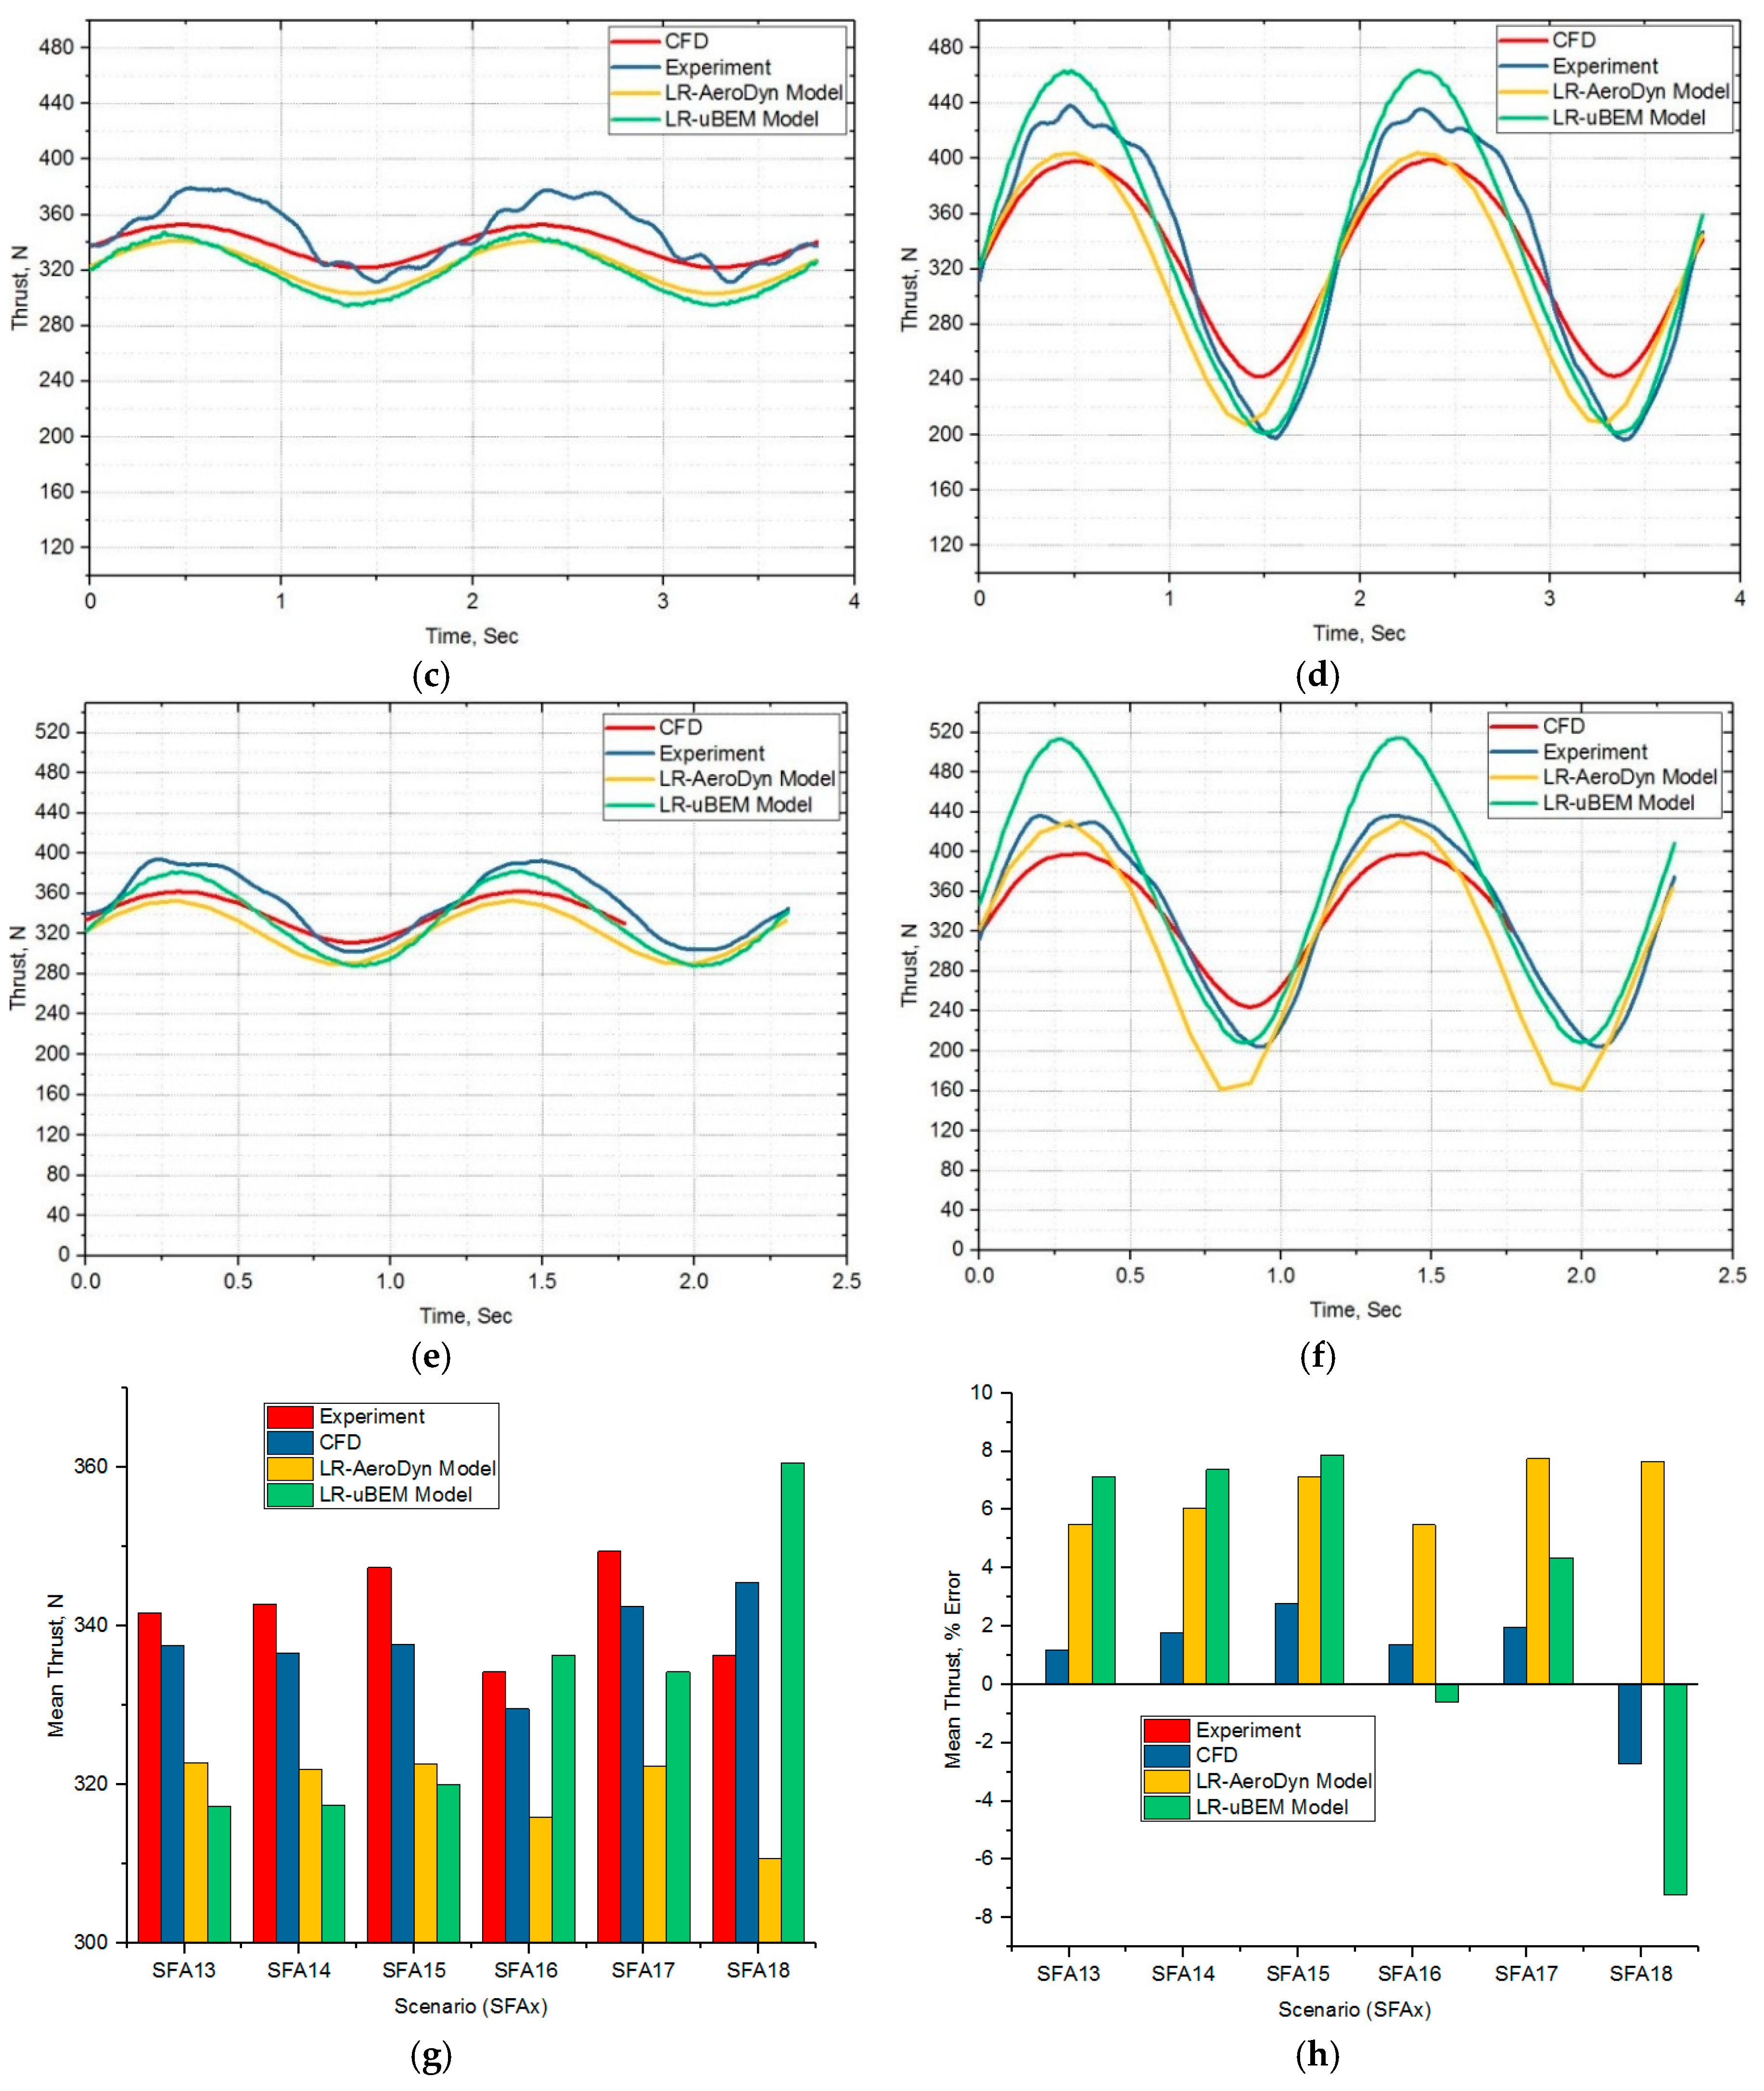
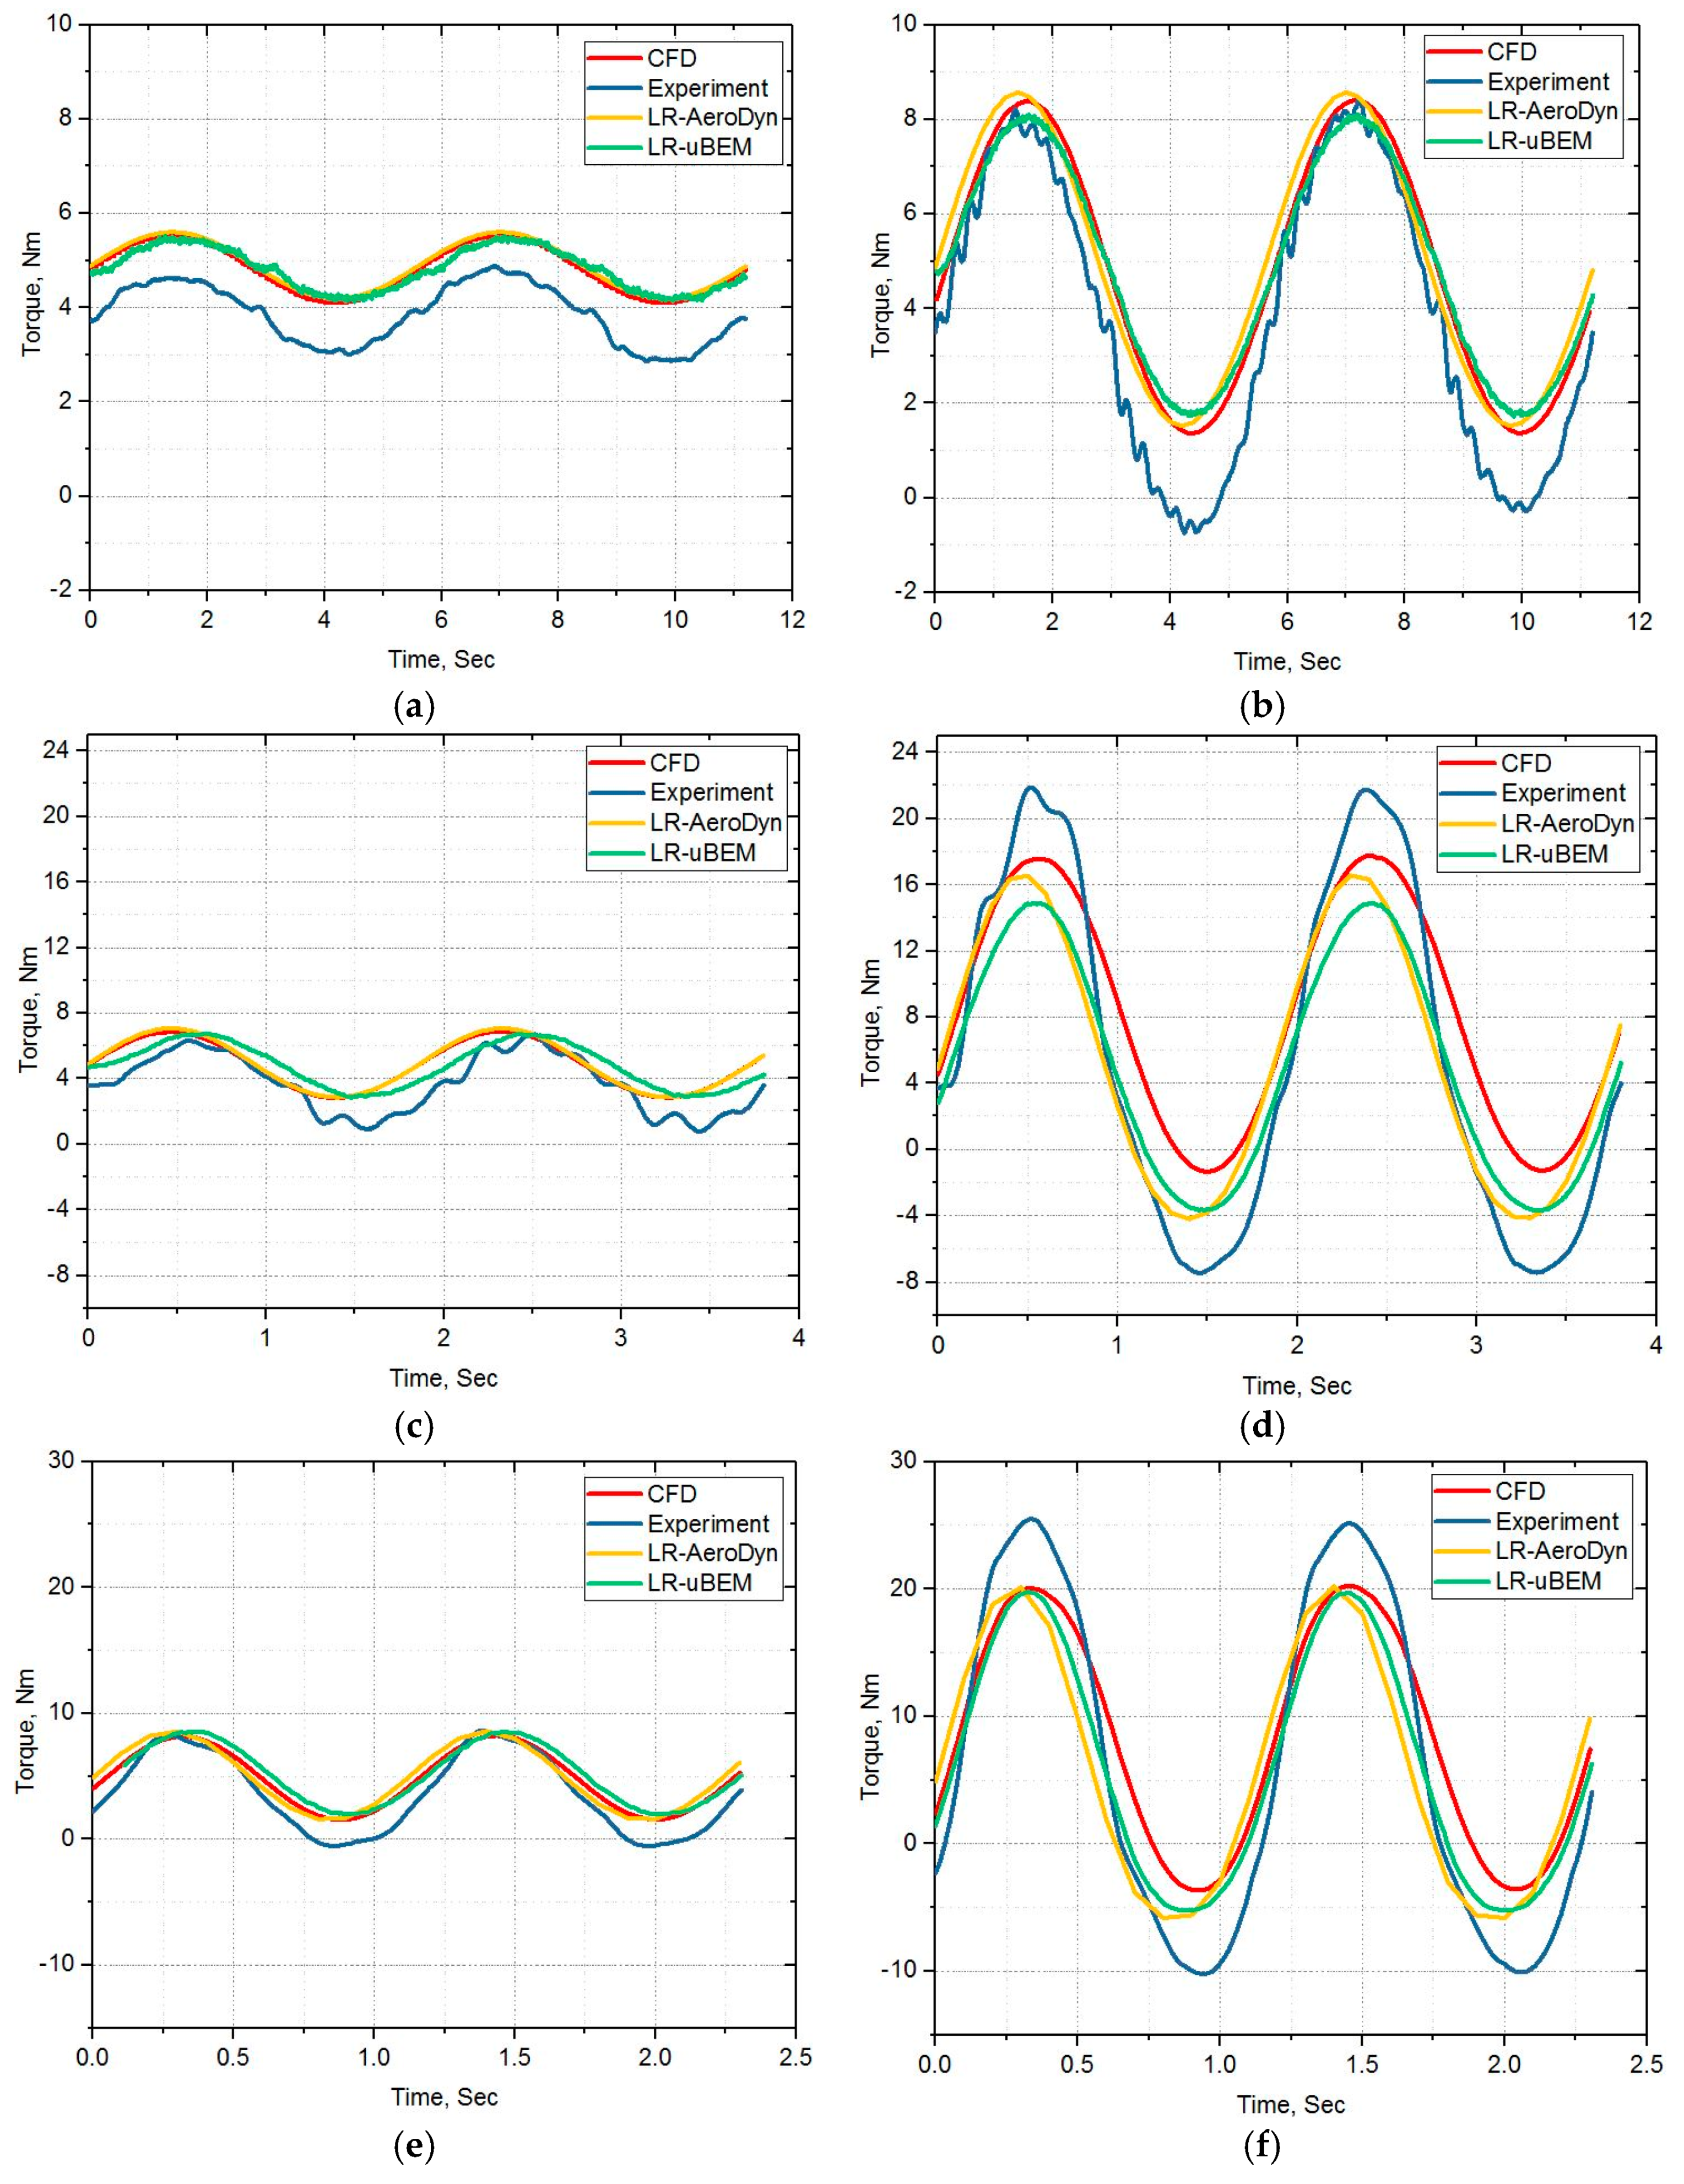
Table 3, simulations are carried out to compare against the experimental values.
The sinusoidal surge cyclic motions for the scaled rotor were designed based on the work by [
15,
16] for the unsteady test scenario. As in [
17], one of the predominant motions is surge motion, a detailed surge motion experiments were designed to carry out for the scaled rotor. The scenarios were chosen carefully to validate the effects of unsteadiness by the various numerical simulations. Mean thrust and torque values were considered for validation purposes initially. For each of the three different TSRs, three different surge frequencies and two amplitudes (minimum and maximum) were chosen to capture the unsteady behavior. The steady state MRF simulations were first performed with the rotational speed of the rotor and primary carriage speed as water inlet velocity boundary condition in CFD simulations for the designed scenarios as given in the
Table 2. For unsteady transient surge motion study, the static or steady state simulation results were used to initialize the solutions of all the designed unsteady scenario cases. The CFD computational domains were well organized in such a way that both the blade rotations and rotor surging motions could be handled smoothly by the solver. The rotor domain had a sliding mesh interface for blade rotations and the mesh motion (deforming mesh) applied for surging motion had an extremely high stiffness in this domain which was relaxed gradually towards the outer domain to preserve the fine boundary layer mesh. This high stiffness ensured that the mesh in the rotor domain had almost no relative nodal displacement, as the mesh on the blade had the first node on the order of microns to yield a y+ ~1.
3.2. LR–AeroDyn Model for Unsteady Experimental Scenario
AeroDyn (V15.04) is an open source (NREL) time-domain wind turbine aerodynamics module [
18] that has been tailored for marine hydrokinetic turbines (MHTs). MHT AeroDyn module is customized for scaled rotor performance prediction of unsteady experimental test case runs as shown in
Table 3 as the model was refined to cover the whole scenario.
FAST model settings:
AeroDyn calculates aerodynamic loads on both the blades and tower. The AeroDyn’s aerodynamic computations are based on actuator lines methodology. In this methodology, two-dimensional (2D) flows at 17 cross section (node) are used to approximate the three-dimensional (3D) flow around a body. The lift forces, drag forces and pitching moments are lumped at the nodes which enables the algorithm to approximate the distributed pressure and shear stresses. Analysis of 17 nodes are distributed along the length of each blade, the 2D forces and moment at each node are computed as distributed loads per unit length, and the total 3D aerodynamic loads are found by integrating the 2D distributed loads along the length.
The MHK-based model is customized for the scaled rotor to compute the effect of wake based on the derivation of induction factors by quasi-steady BEM theory. An iterative Brent’s methodology is employed for nonlinear equations. Reaction to the immediate load changes on the induction is captured by quasi-steady or equilibrium wake (EQUIL) model. The induction calculation, and resulting inflow velocities and angles, are based on flow local to each analysis node of each blade, based on the relative velocity between the fluid and structure (including the effects of local inflow skew, shear, and turbulence). The time lag is not implemented in this method which means no dynamic inflow. For high induction factors of linear momentum theory, the Glauert’s empirical correction with Buhl’s modification is normally used. In the BEM methodology, Prandtl hub-loss and Prandtl tip-loss models are implemented.
Angle-of-attack calculations in AeroDyn assume that the axial induction factor (
a) only applies to the free-stream wind velocity (
Vα). To calculate the total relative wind speed (
Vrel) normal to the rotor disc, each blade element’s structural velocity is added to the free-stream wind velocity at the rotor disc, as shown below:
Vrotor, is the structural velocity of the blade element normal to the disc (measured positive when pointing upwind).
The assumption in AeroDyn is that the structural velocities are the product of structural vibrations at high frequencies, which would results in relatively small induced velocities. However, when considering floating offshore wind turbines (FOWT), low-frequency motions, particularly, in surge, pitch and yaw degrees of freedom, which induce change in the free-stream velocity, could lead to high induced velocities. In low-frequency motion, a better way of expressing the relative wind speed normal to the rotor disc would be:
3.3. LR–u BEM Model for Unsteady Experimental Scenario
The LR uBEM code was developed to address the issue of uncertainty in predicting the aerodynamics of floating offshore wind turbines. The development of the uBEM code included several features vital to an accurate assessment of floating offshore wind turbine aerodynamics. These include:
An improved tip-loss model which accounts for changes in tip speed ratio and changes in loss distributions in different wake states.
An unsteady airfoil model including a modified Beddoes-Leishman model which models the unsteady circulation using the suction surface shape-dependent time constants
A combined unsteady airfoil and stall delay model, accounting for changes in stall delay due to changes in wind and rotational velocities in real-time.
An extension of the Gluaert correction by Buhl to the propeller and propeller-brake wake states.
A dynamic wake model to account for the time-lag between aerodynamic forces on the rotor and wake velocities.
In addition, uBEM predicts the forces on each blade section separately, taking into account local velocity changes at any position on each blade. The development of the code was based on CFD simulations of the NREL 5 MW virtual wind turbine, used for code comparison studies in OC3, OC4, and OC5. The CFD simulations were carried out for a static wind turbine and for a surging wind turbine under various surge conditions, with a fixed rotor RPM. The code was developed completely in MATLAB, and is modularized to allow for changes to the various corrective models implemented.
The unsteady blade element momentum method (uBEM) used in the present study, is based on the method presented in [
19]. The relative velocity vector is given by:
where
V0 is the blade-specific wind speed at the blade element including relative speed due to rotor motion,
is the rotor rotational speed in rad/s,
r is the local blade segment radius. The flow angle,
, is the angle between the relative velocity and the normal of the rotor plane:
The normal (
z) and tangential (
y) induced velocities are then given by:
where
B is the number of blades,
F is the tip-loss factor,
fg is the Glauert correction for high axial induction factors and
Cl is the coefficient of lift computed using the Du&Selig stall-delay model [
20] and the shape-specific modified Beddoes-Leishman model with the angle of attack equal to the flow angle less the blade twist [
21].
Wx is set to 0. At every time step, for each blade element in each blade, Equations (1) and (2) are iterated until there is no change in the induced velocity vector. When the steady-state induced velocity vector is computed, it is corrected for the dynamic wake effect using the dynamic wake model [
22]. The force coefficients are then recomputed to determine the unsteady forces at each blade element. The LR-uBEM model is customized and simulated for scaled rotor model unsteady simulations as per the experimental scenarios.


