Hourly Solar Radiation Forecasting Using a Volterra-Least Squares Support Vector Machine Model Combined with Signal Decomposition


Abstract
1. Introduction
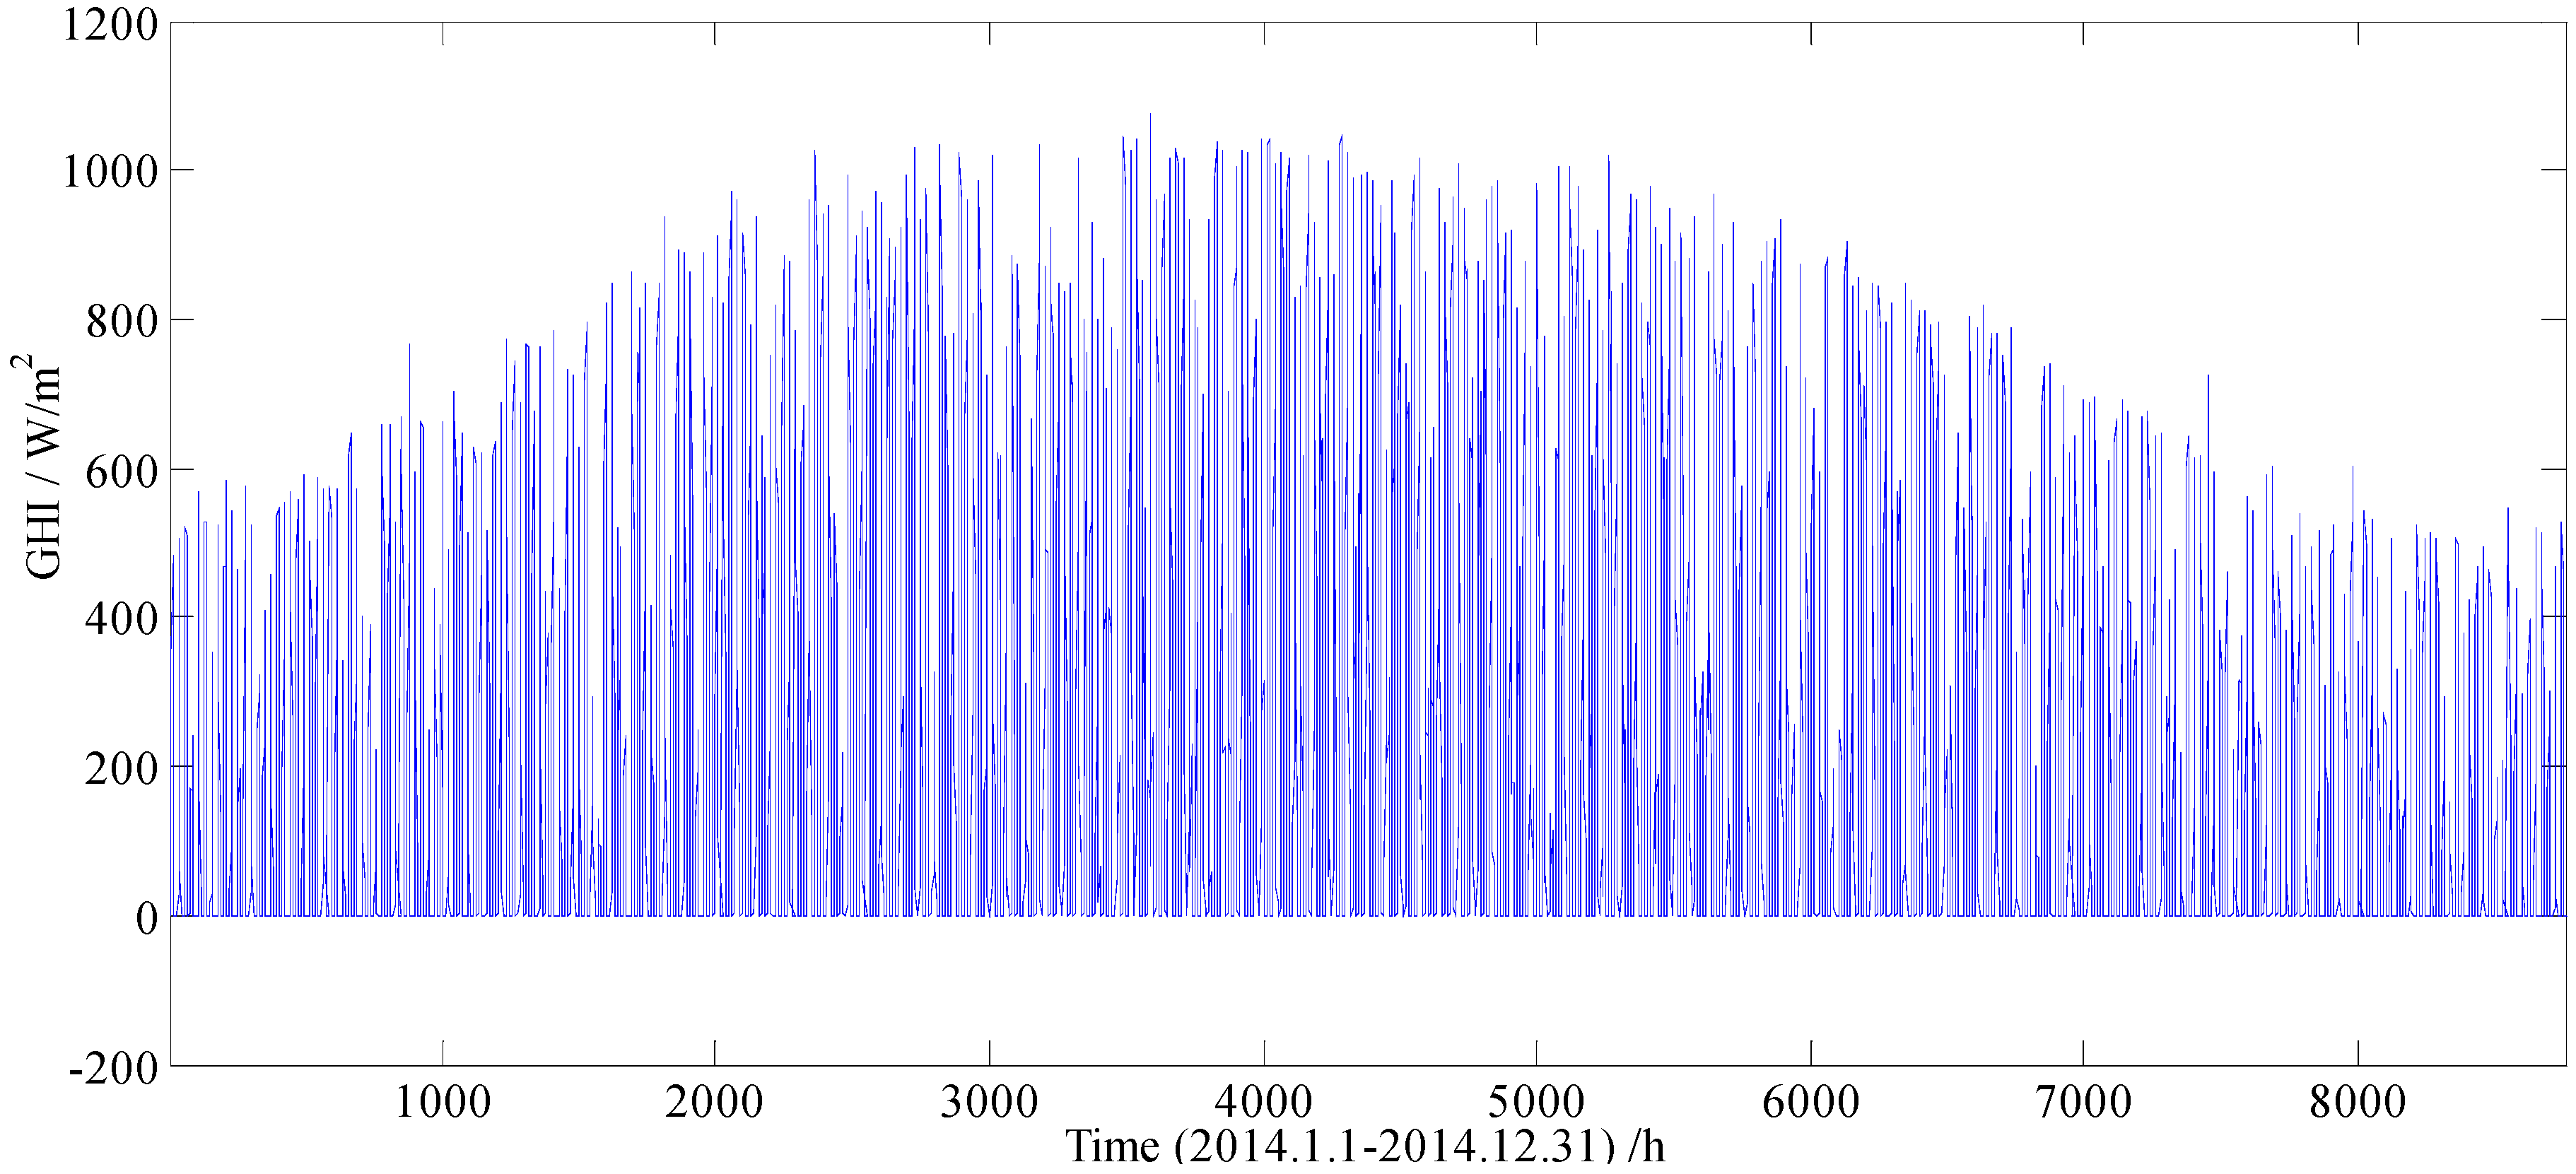
2. Data Description
3. Methodology
3.1. Signal Decomposition
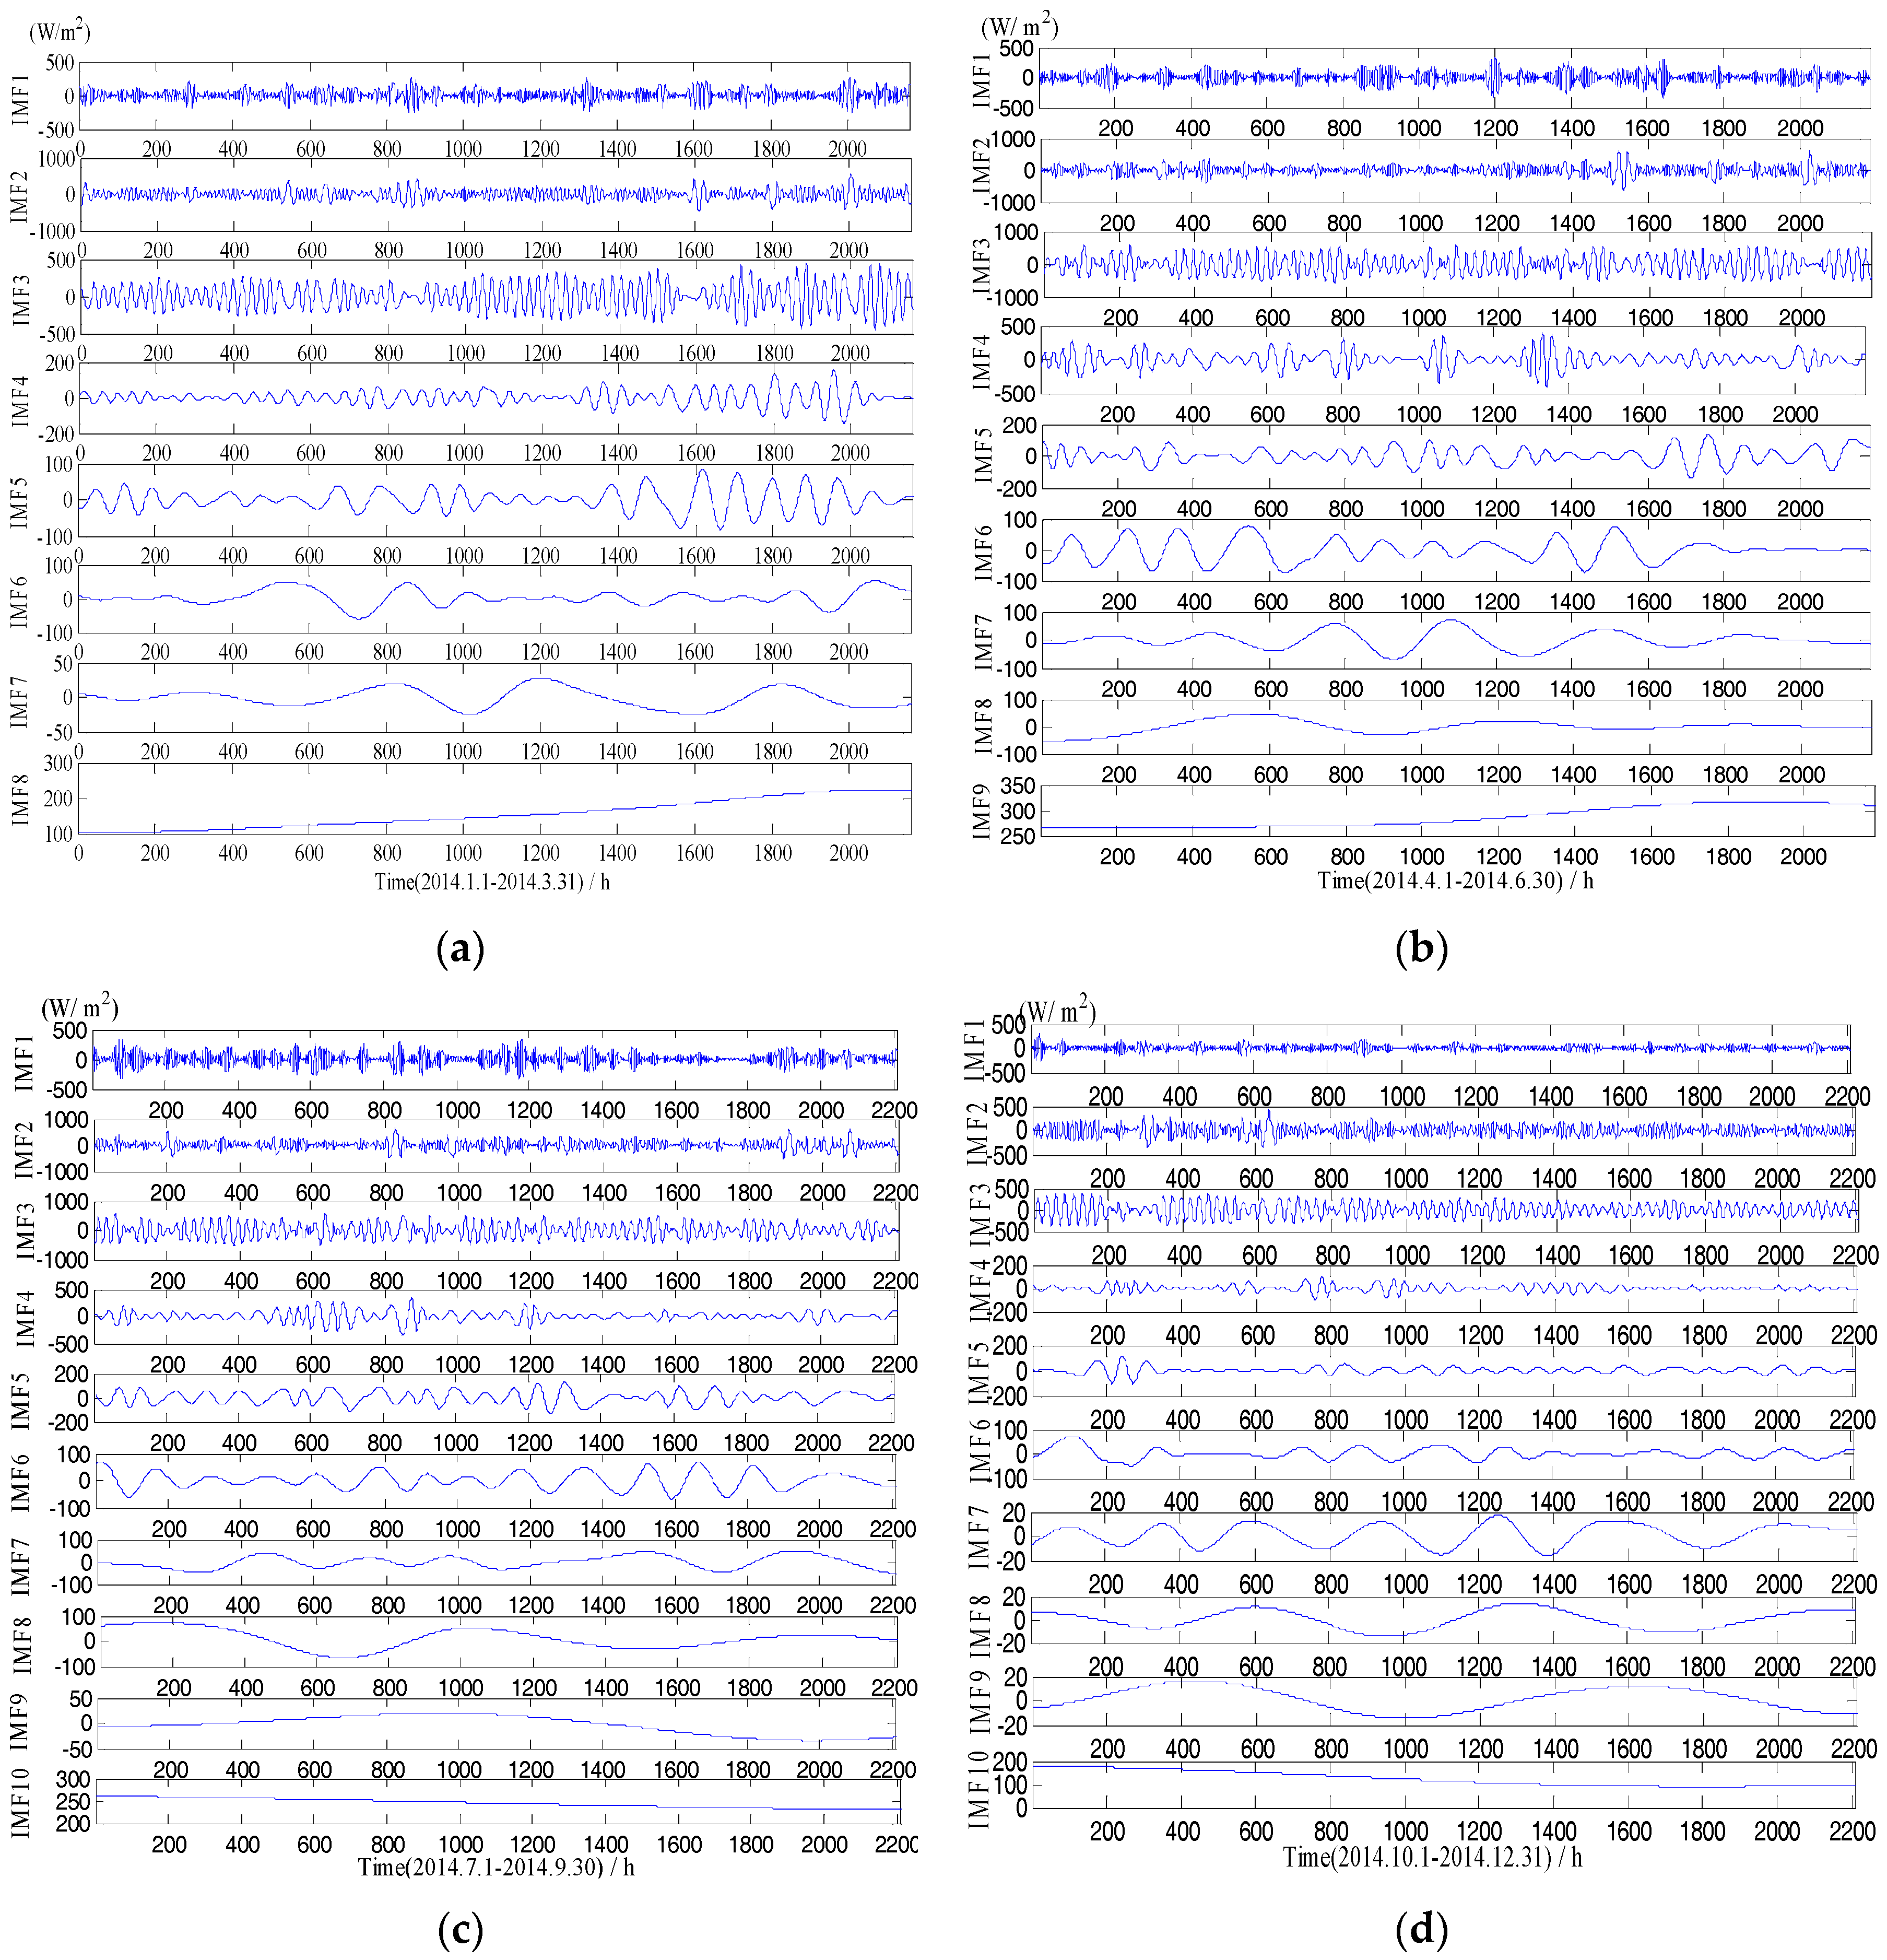
3.1.1. Empirical Mode Decomposition
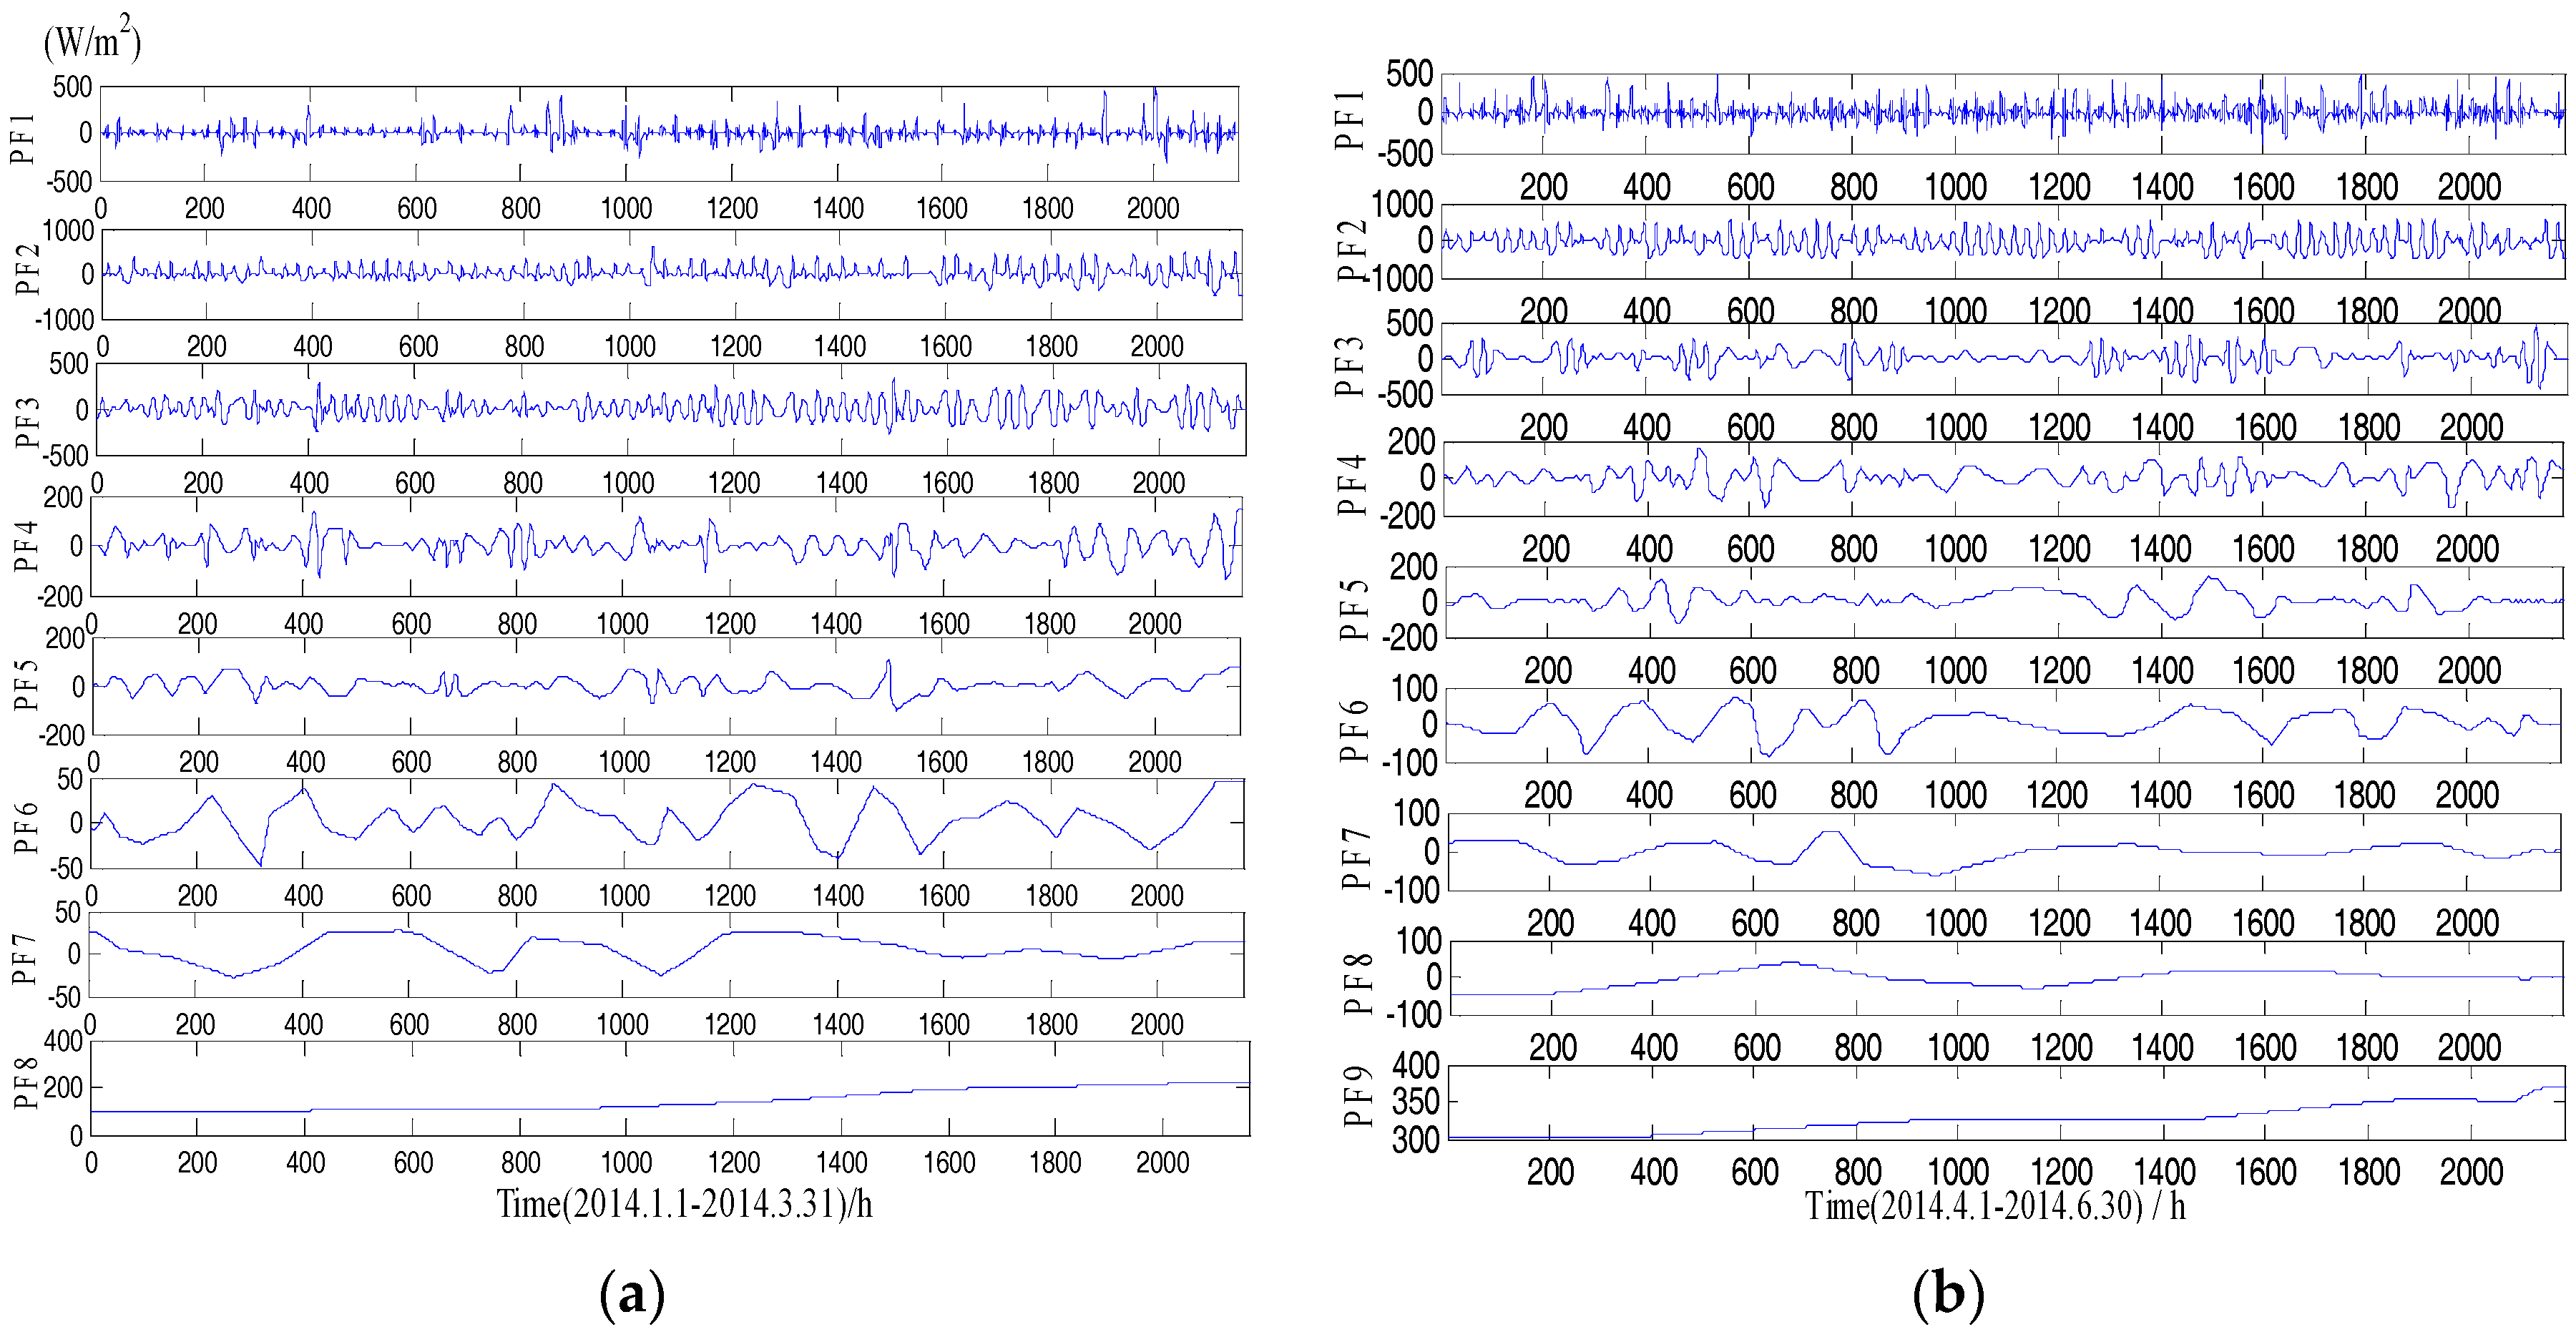
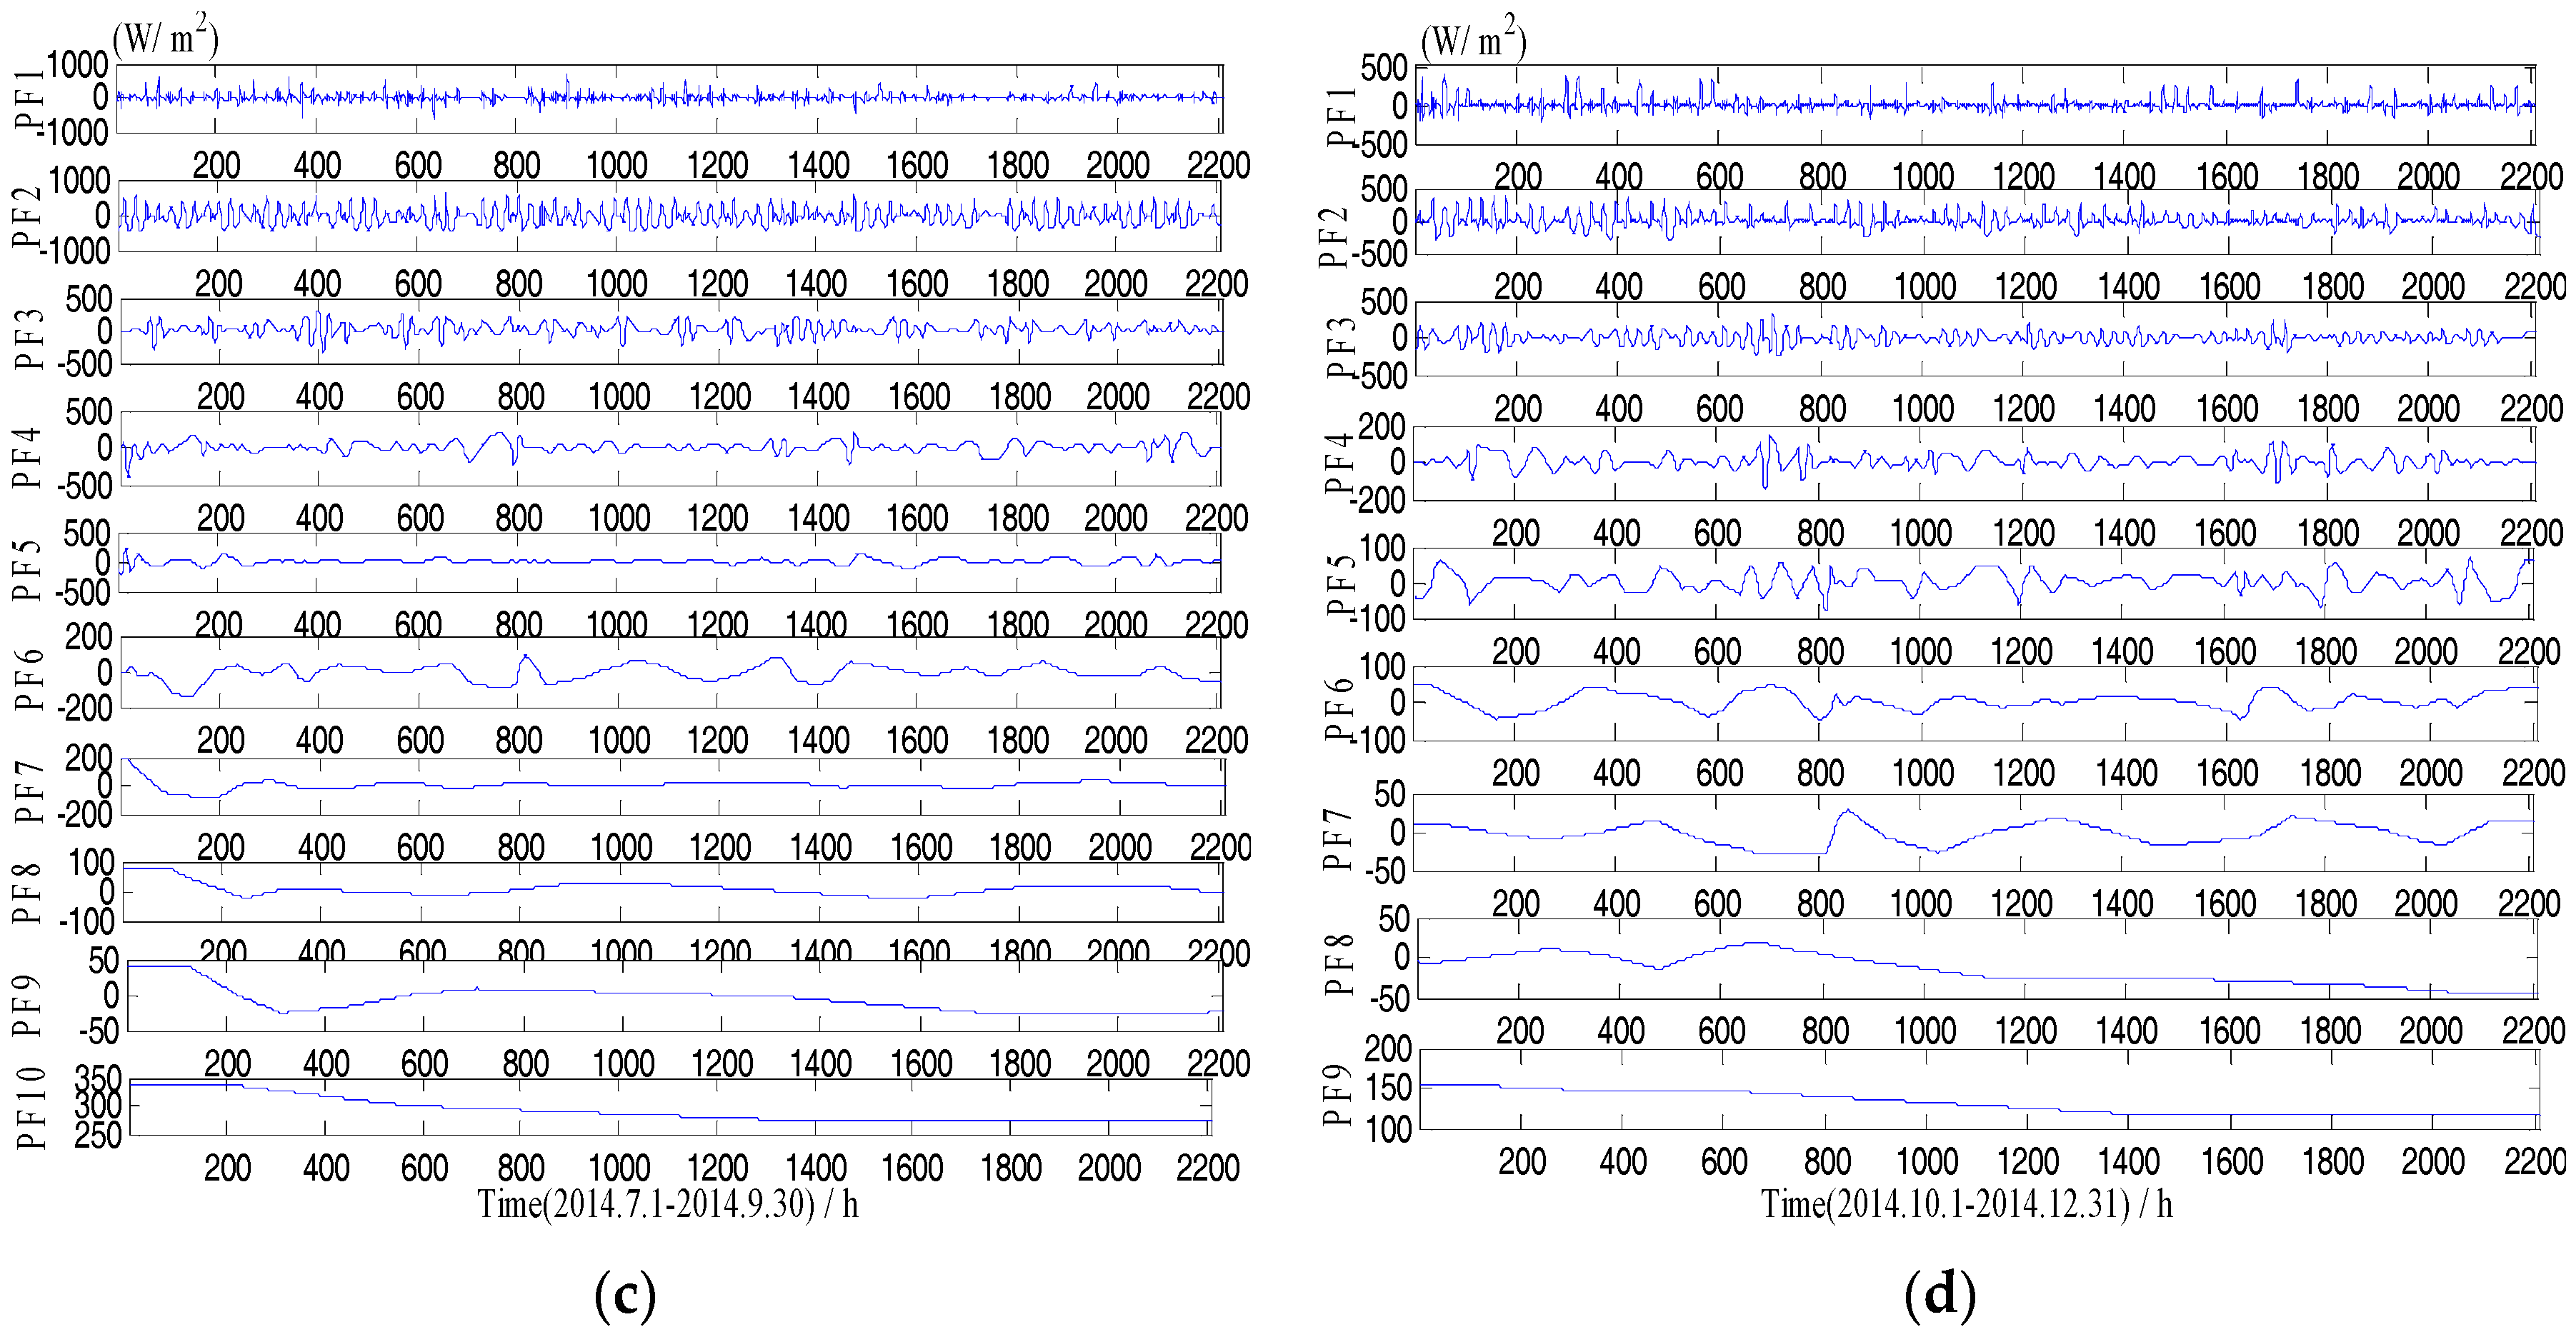
3.1.2. Local Mean Decomposition
3.2. False Nearest Neighbor (FNN) Algorithm
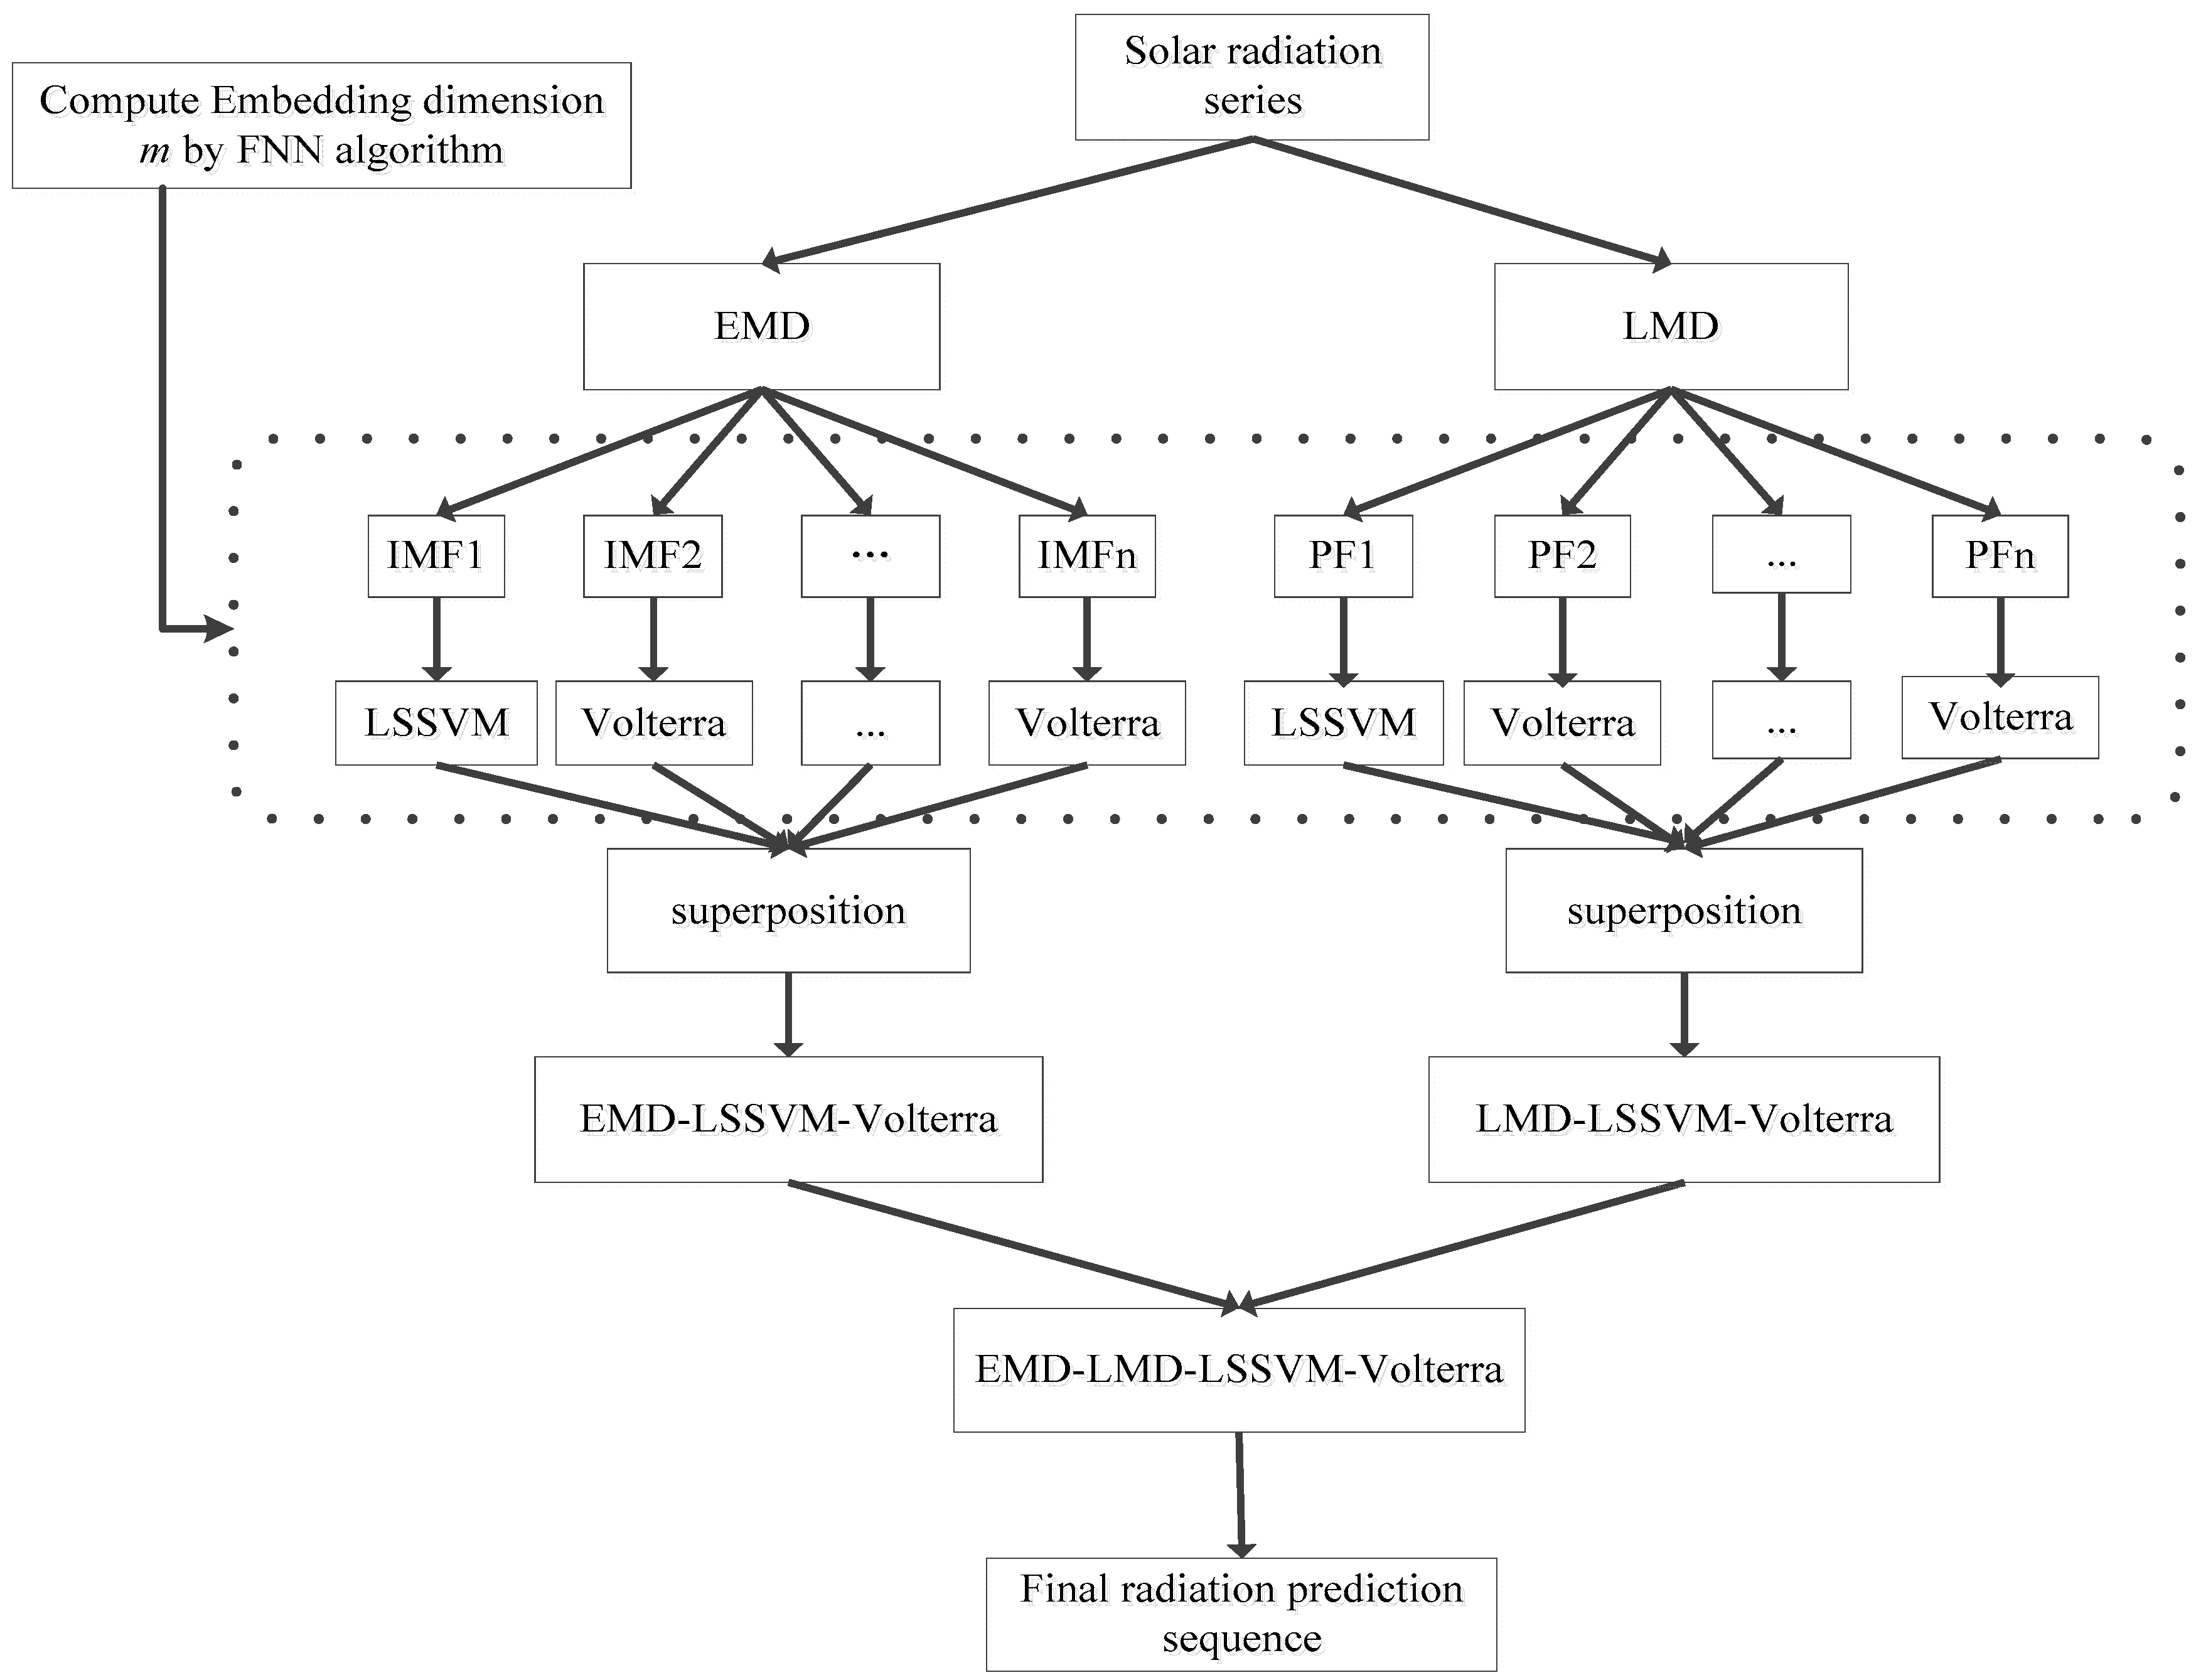
3.3. Prediction Model
3.3.1. Least Squares Support Vector Machine
3.3.2. Volterra Model
4. Model Evaluation
4.1. Root Mean Square Error
4.2. Mean Absolute Error
4.3. Correlation Coefficient
4.4. Forecast Skill
5. Establishment and Comparison of Models
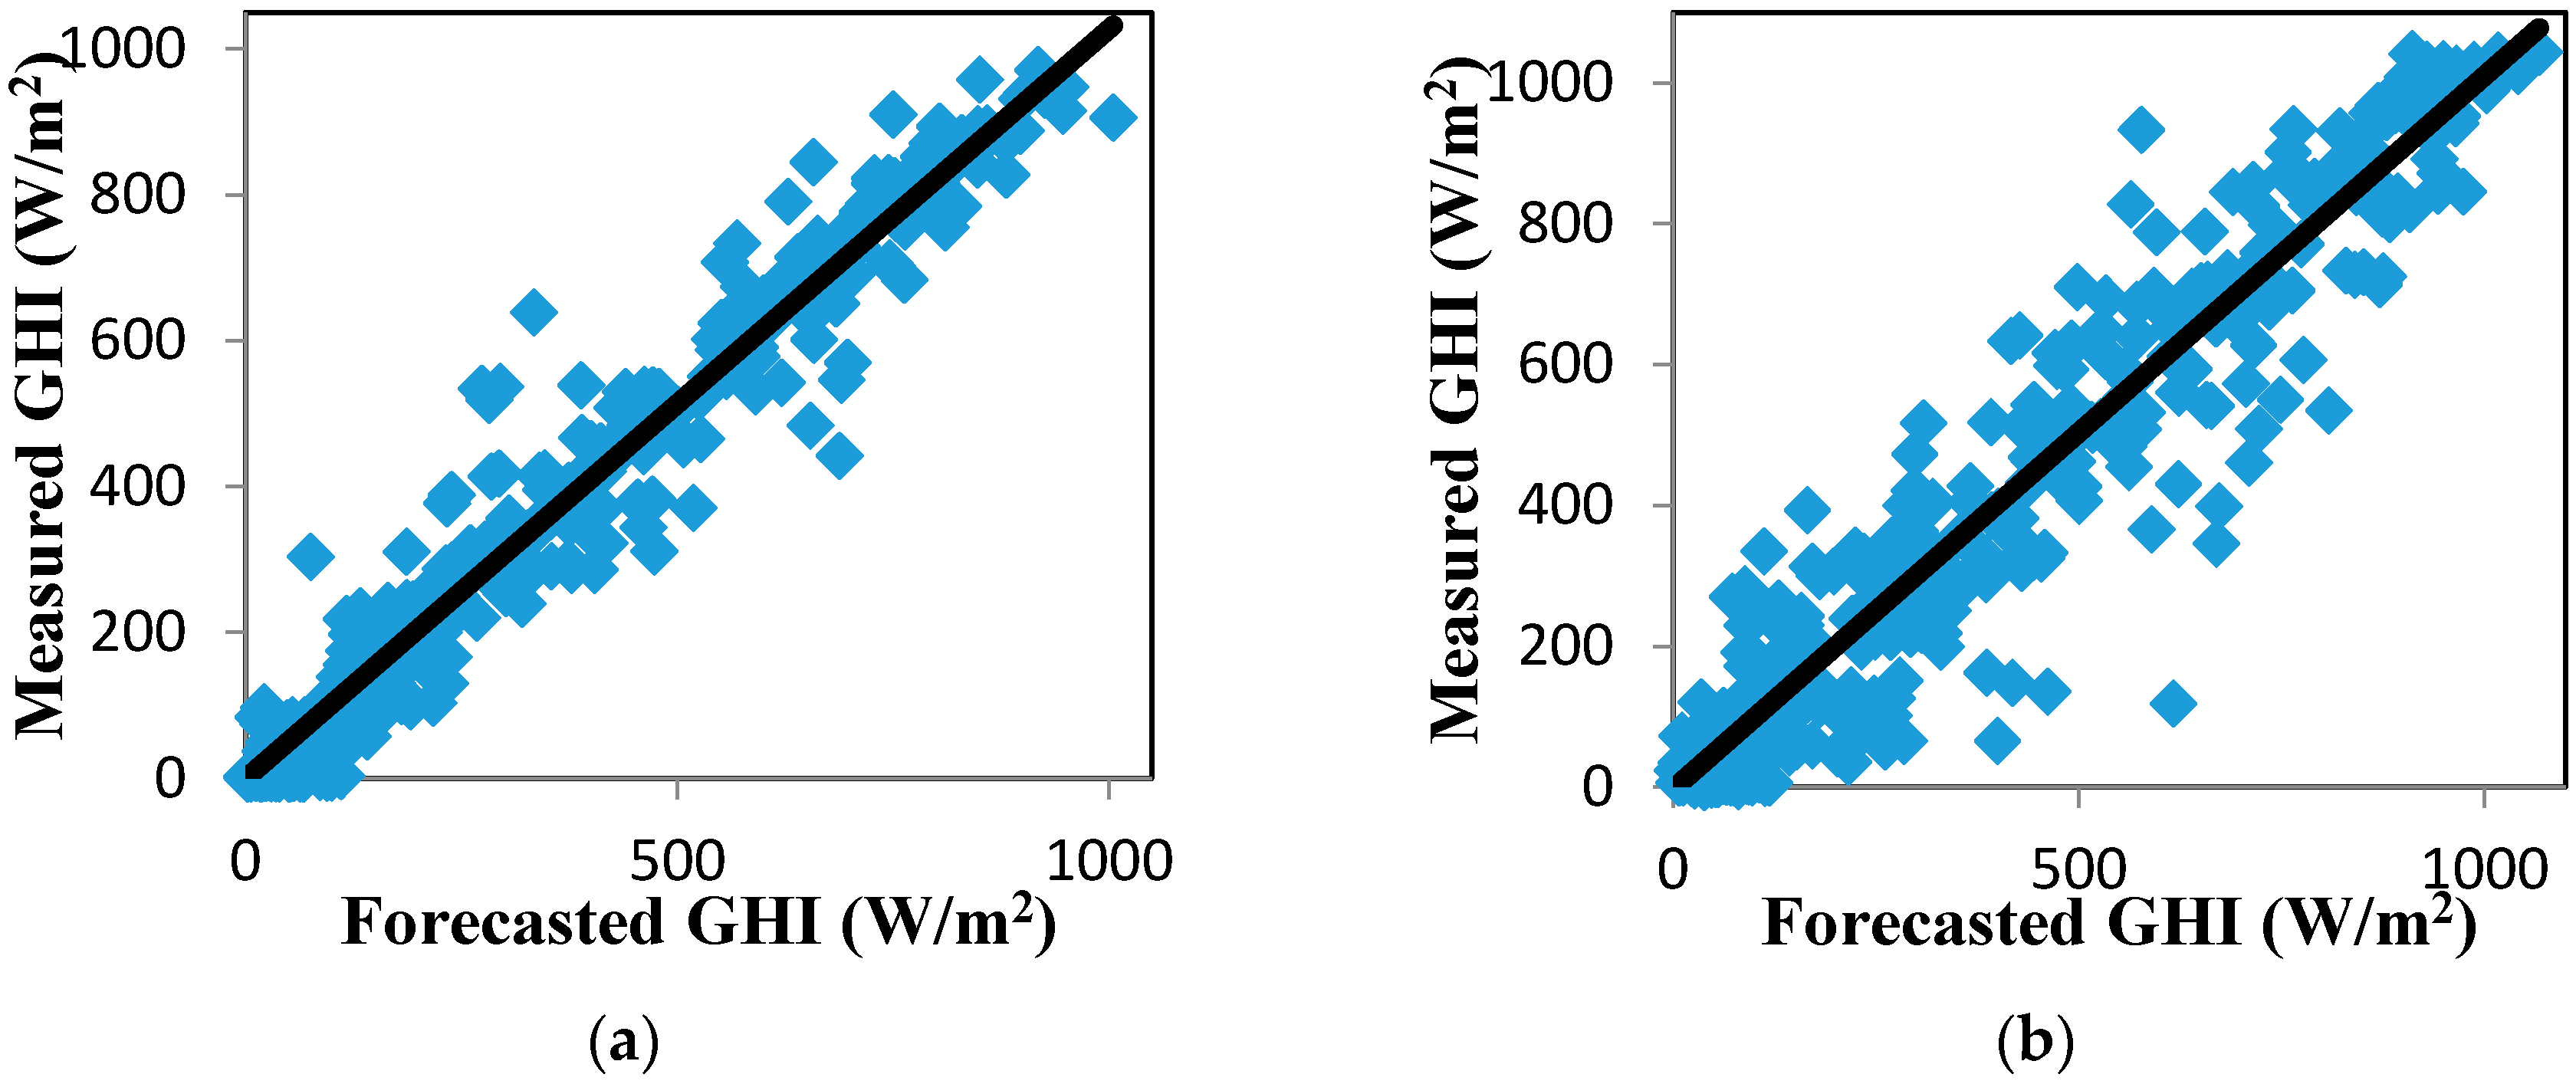
5.1. The Forecasting Results for Hourly GHI Using the LSSVM and the Volterra Models
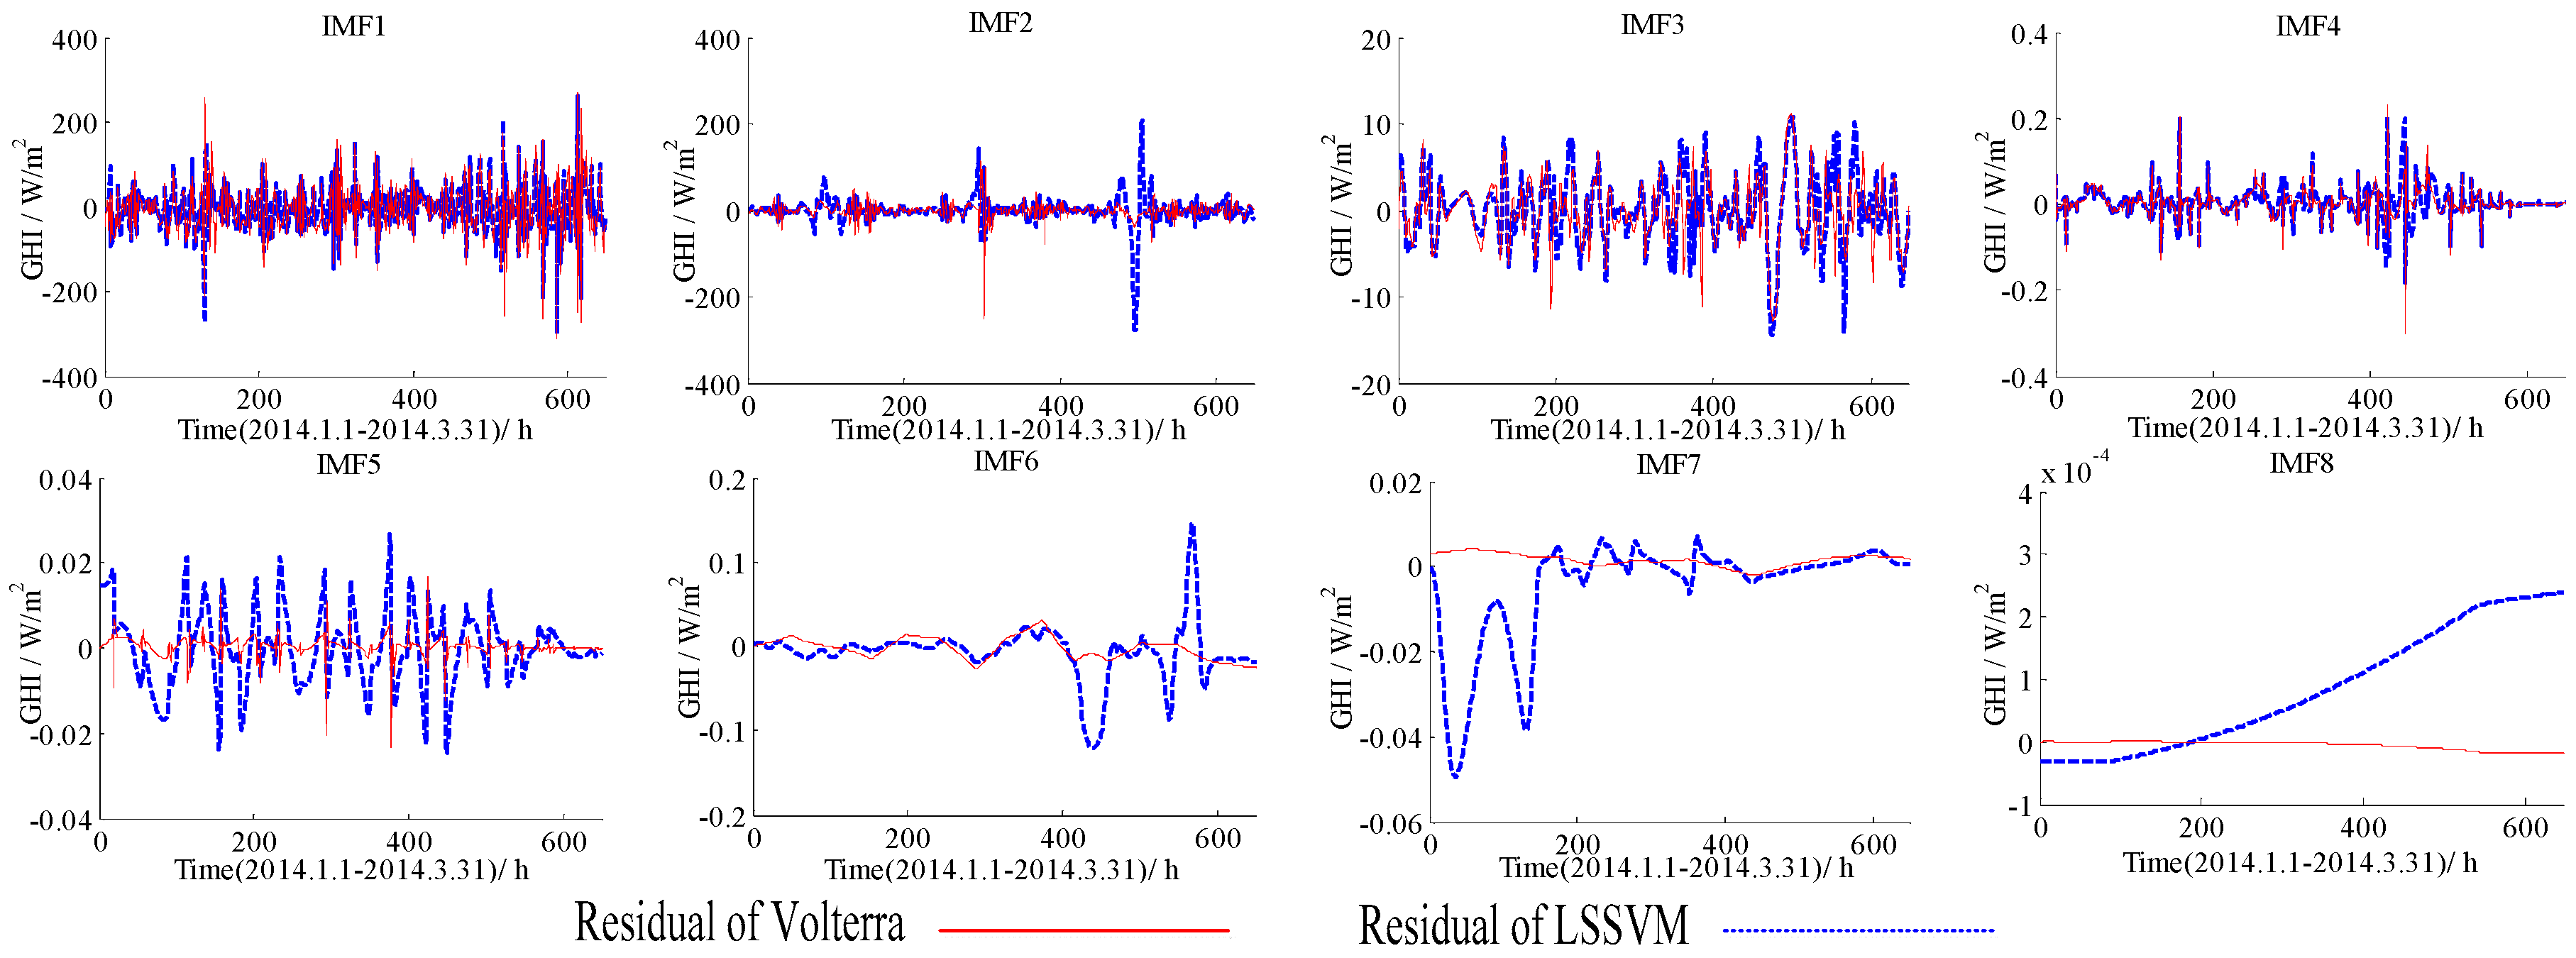
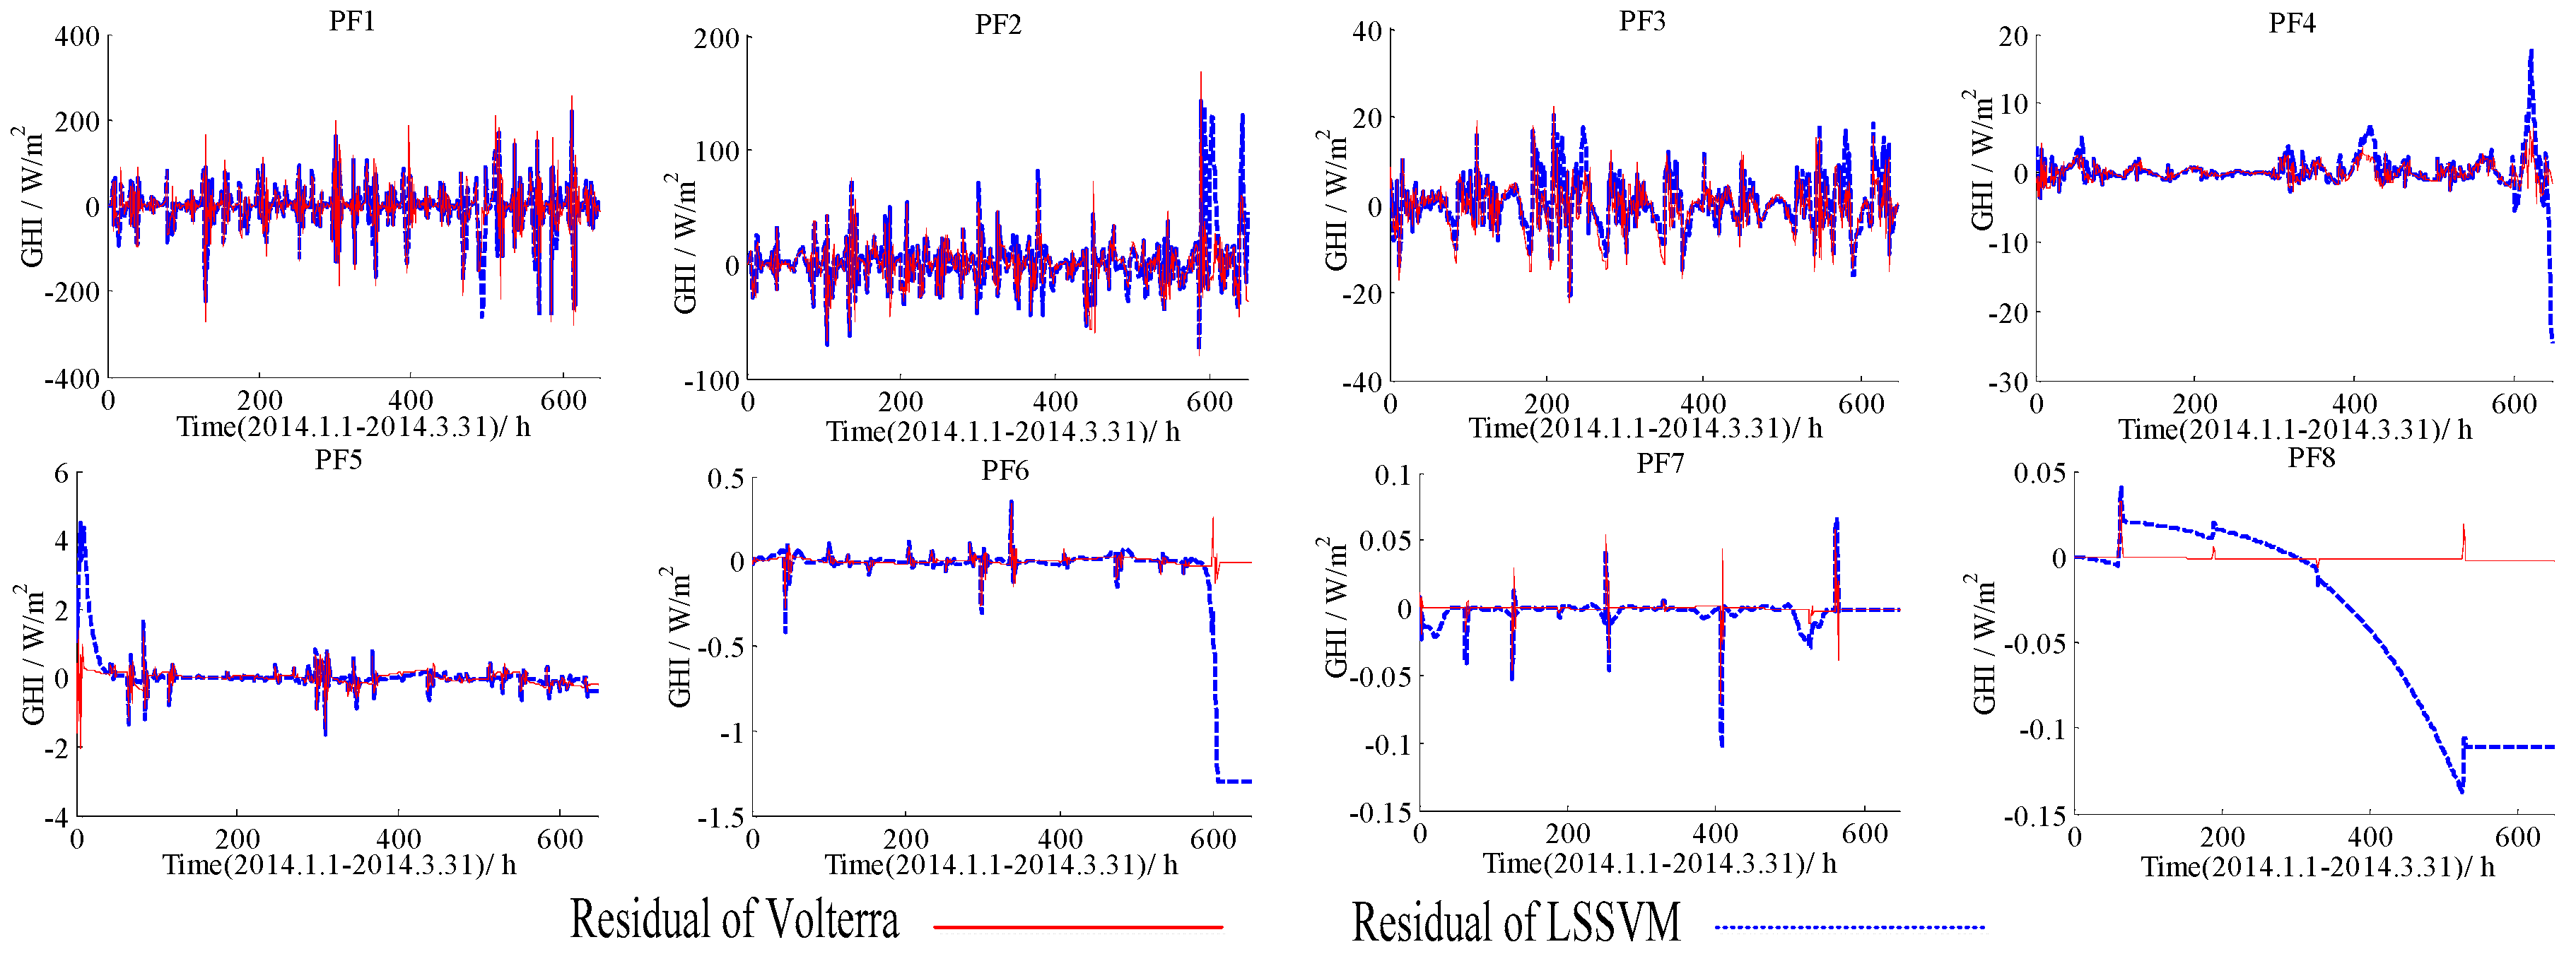
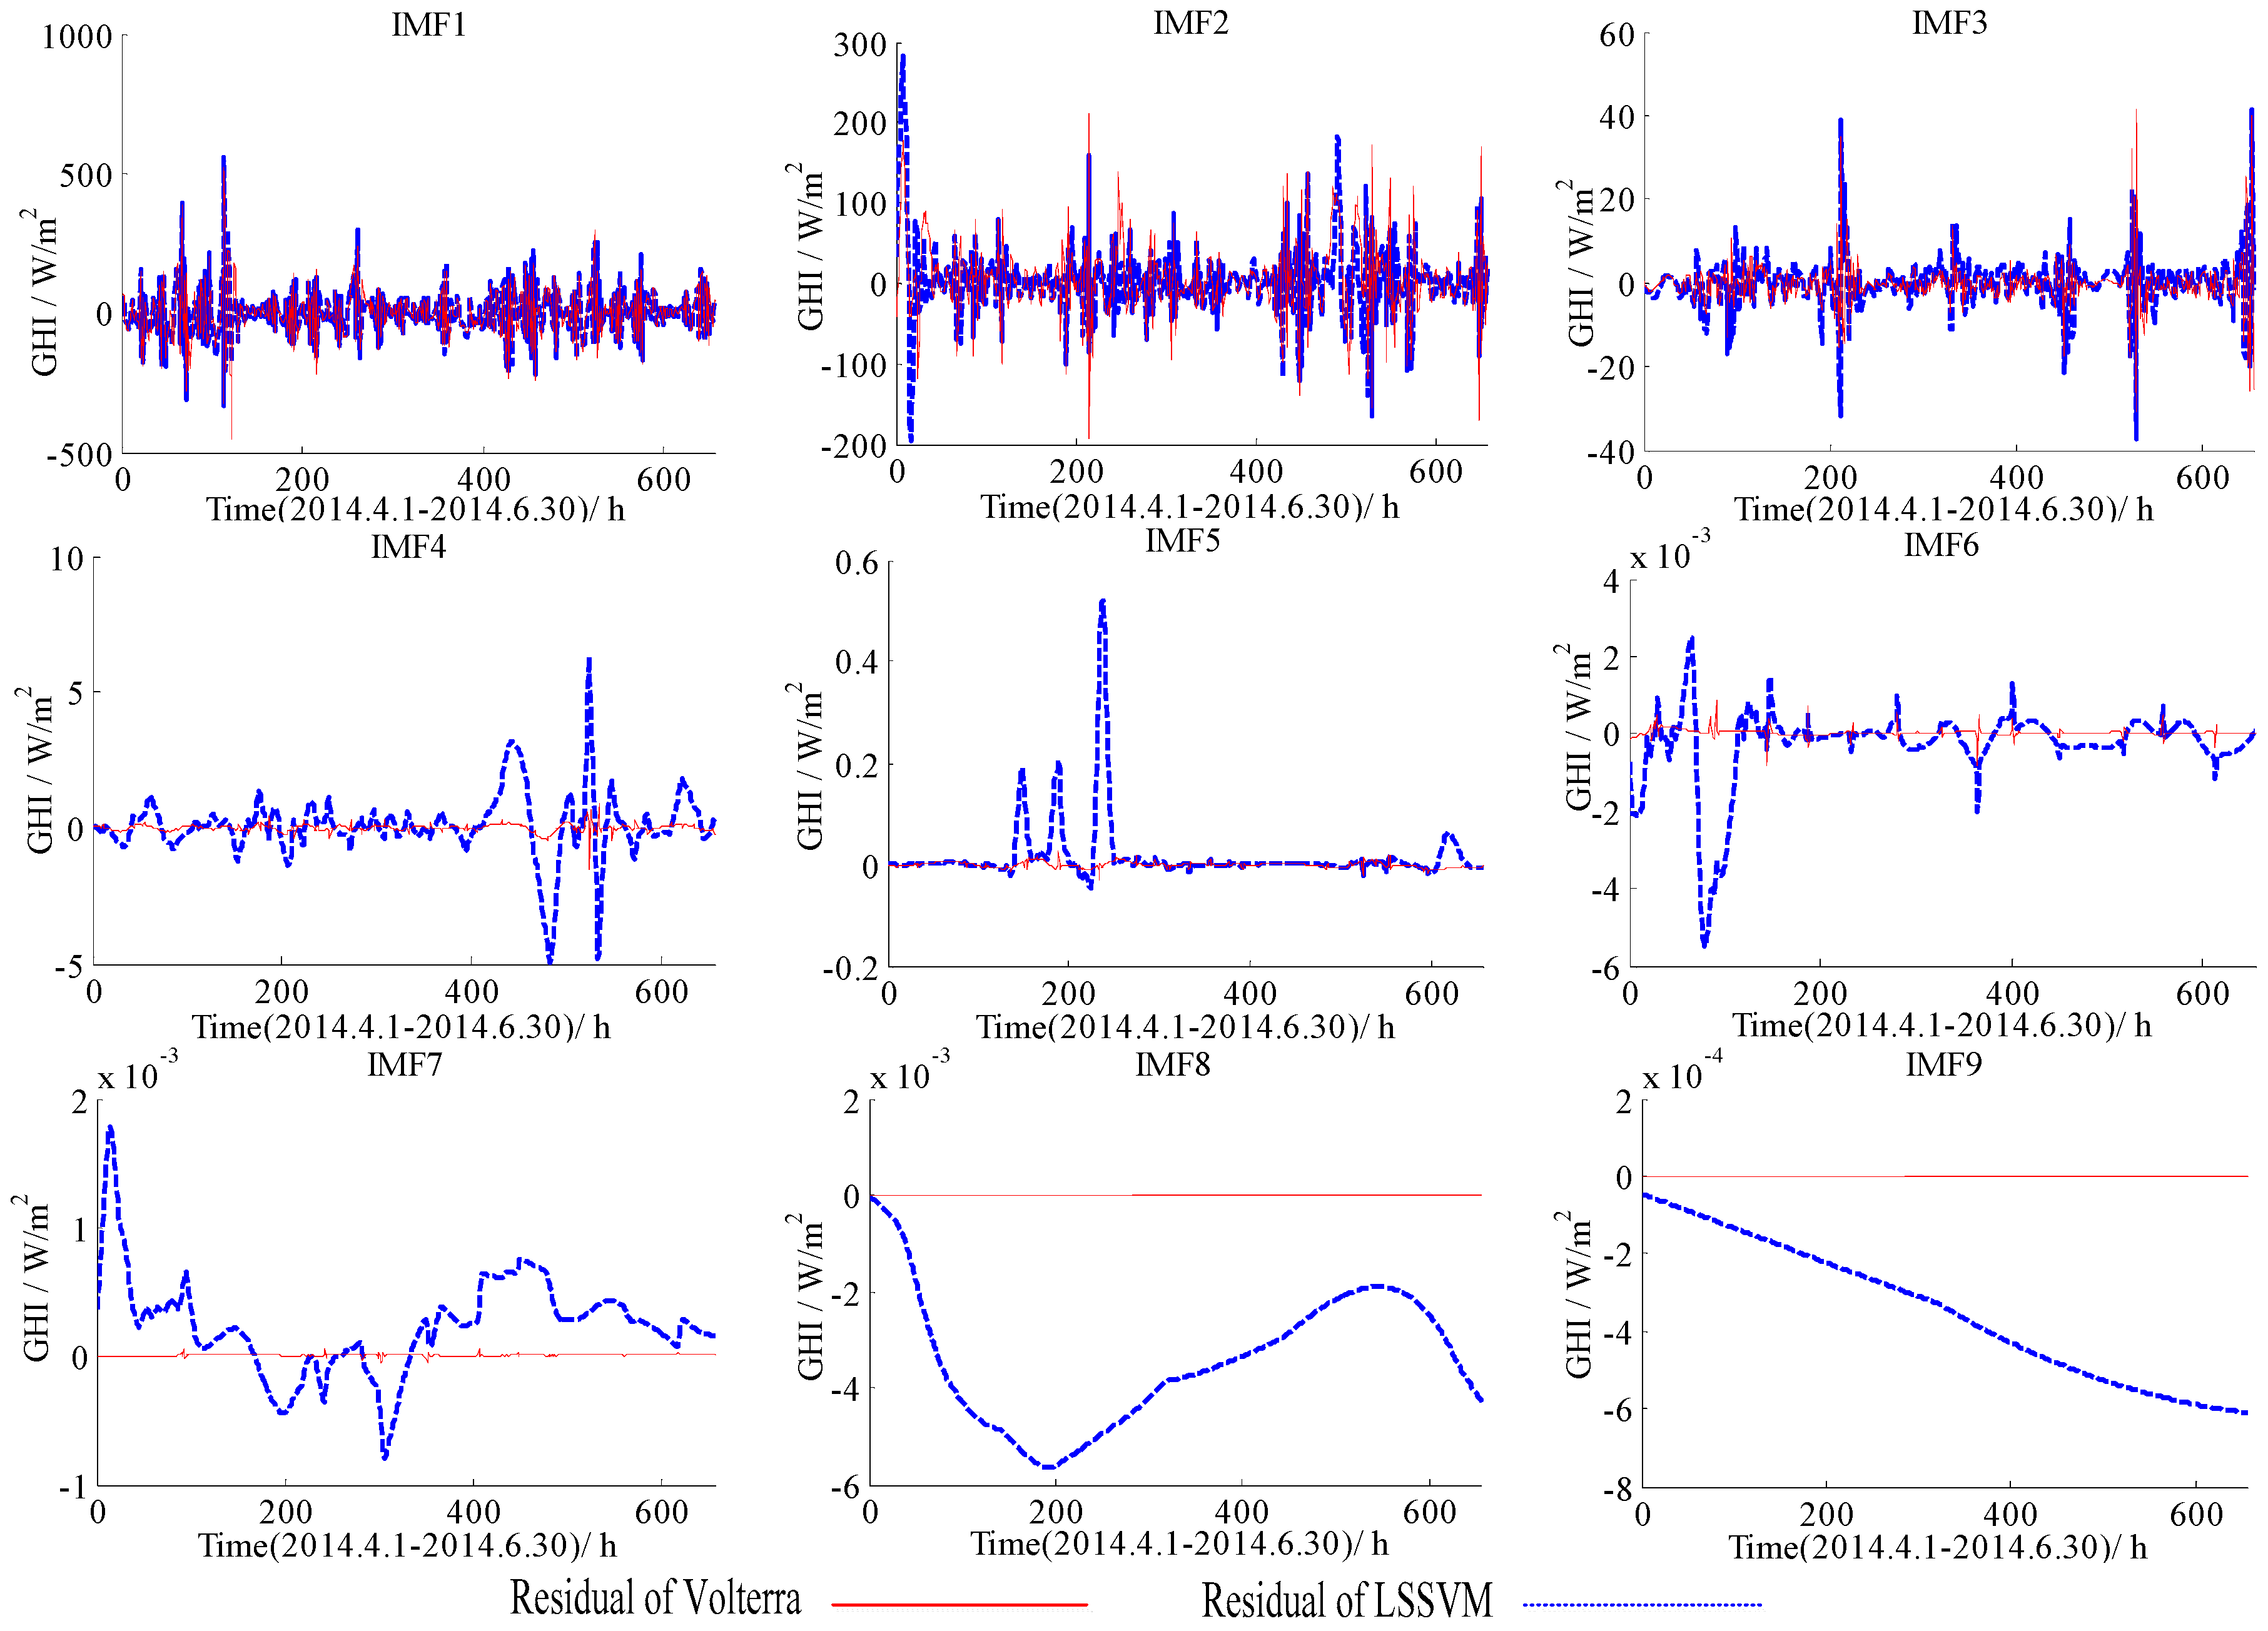
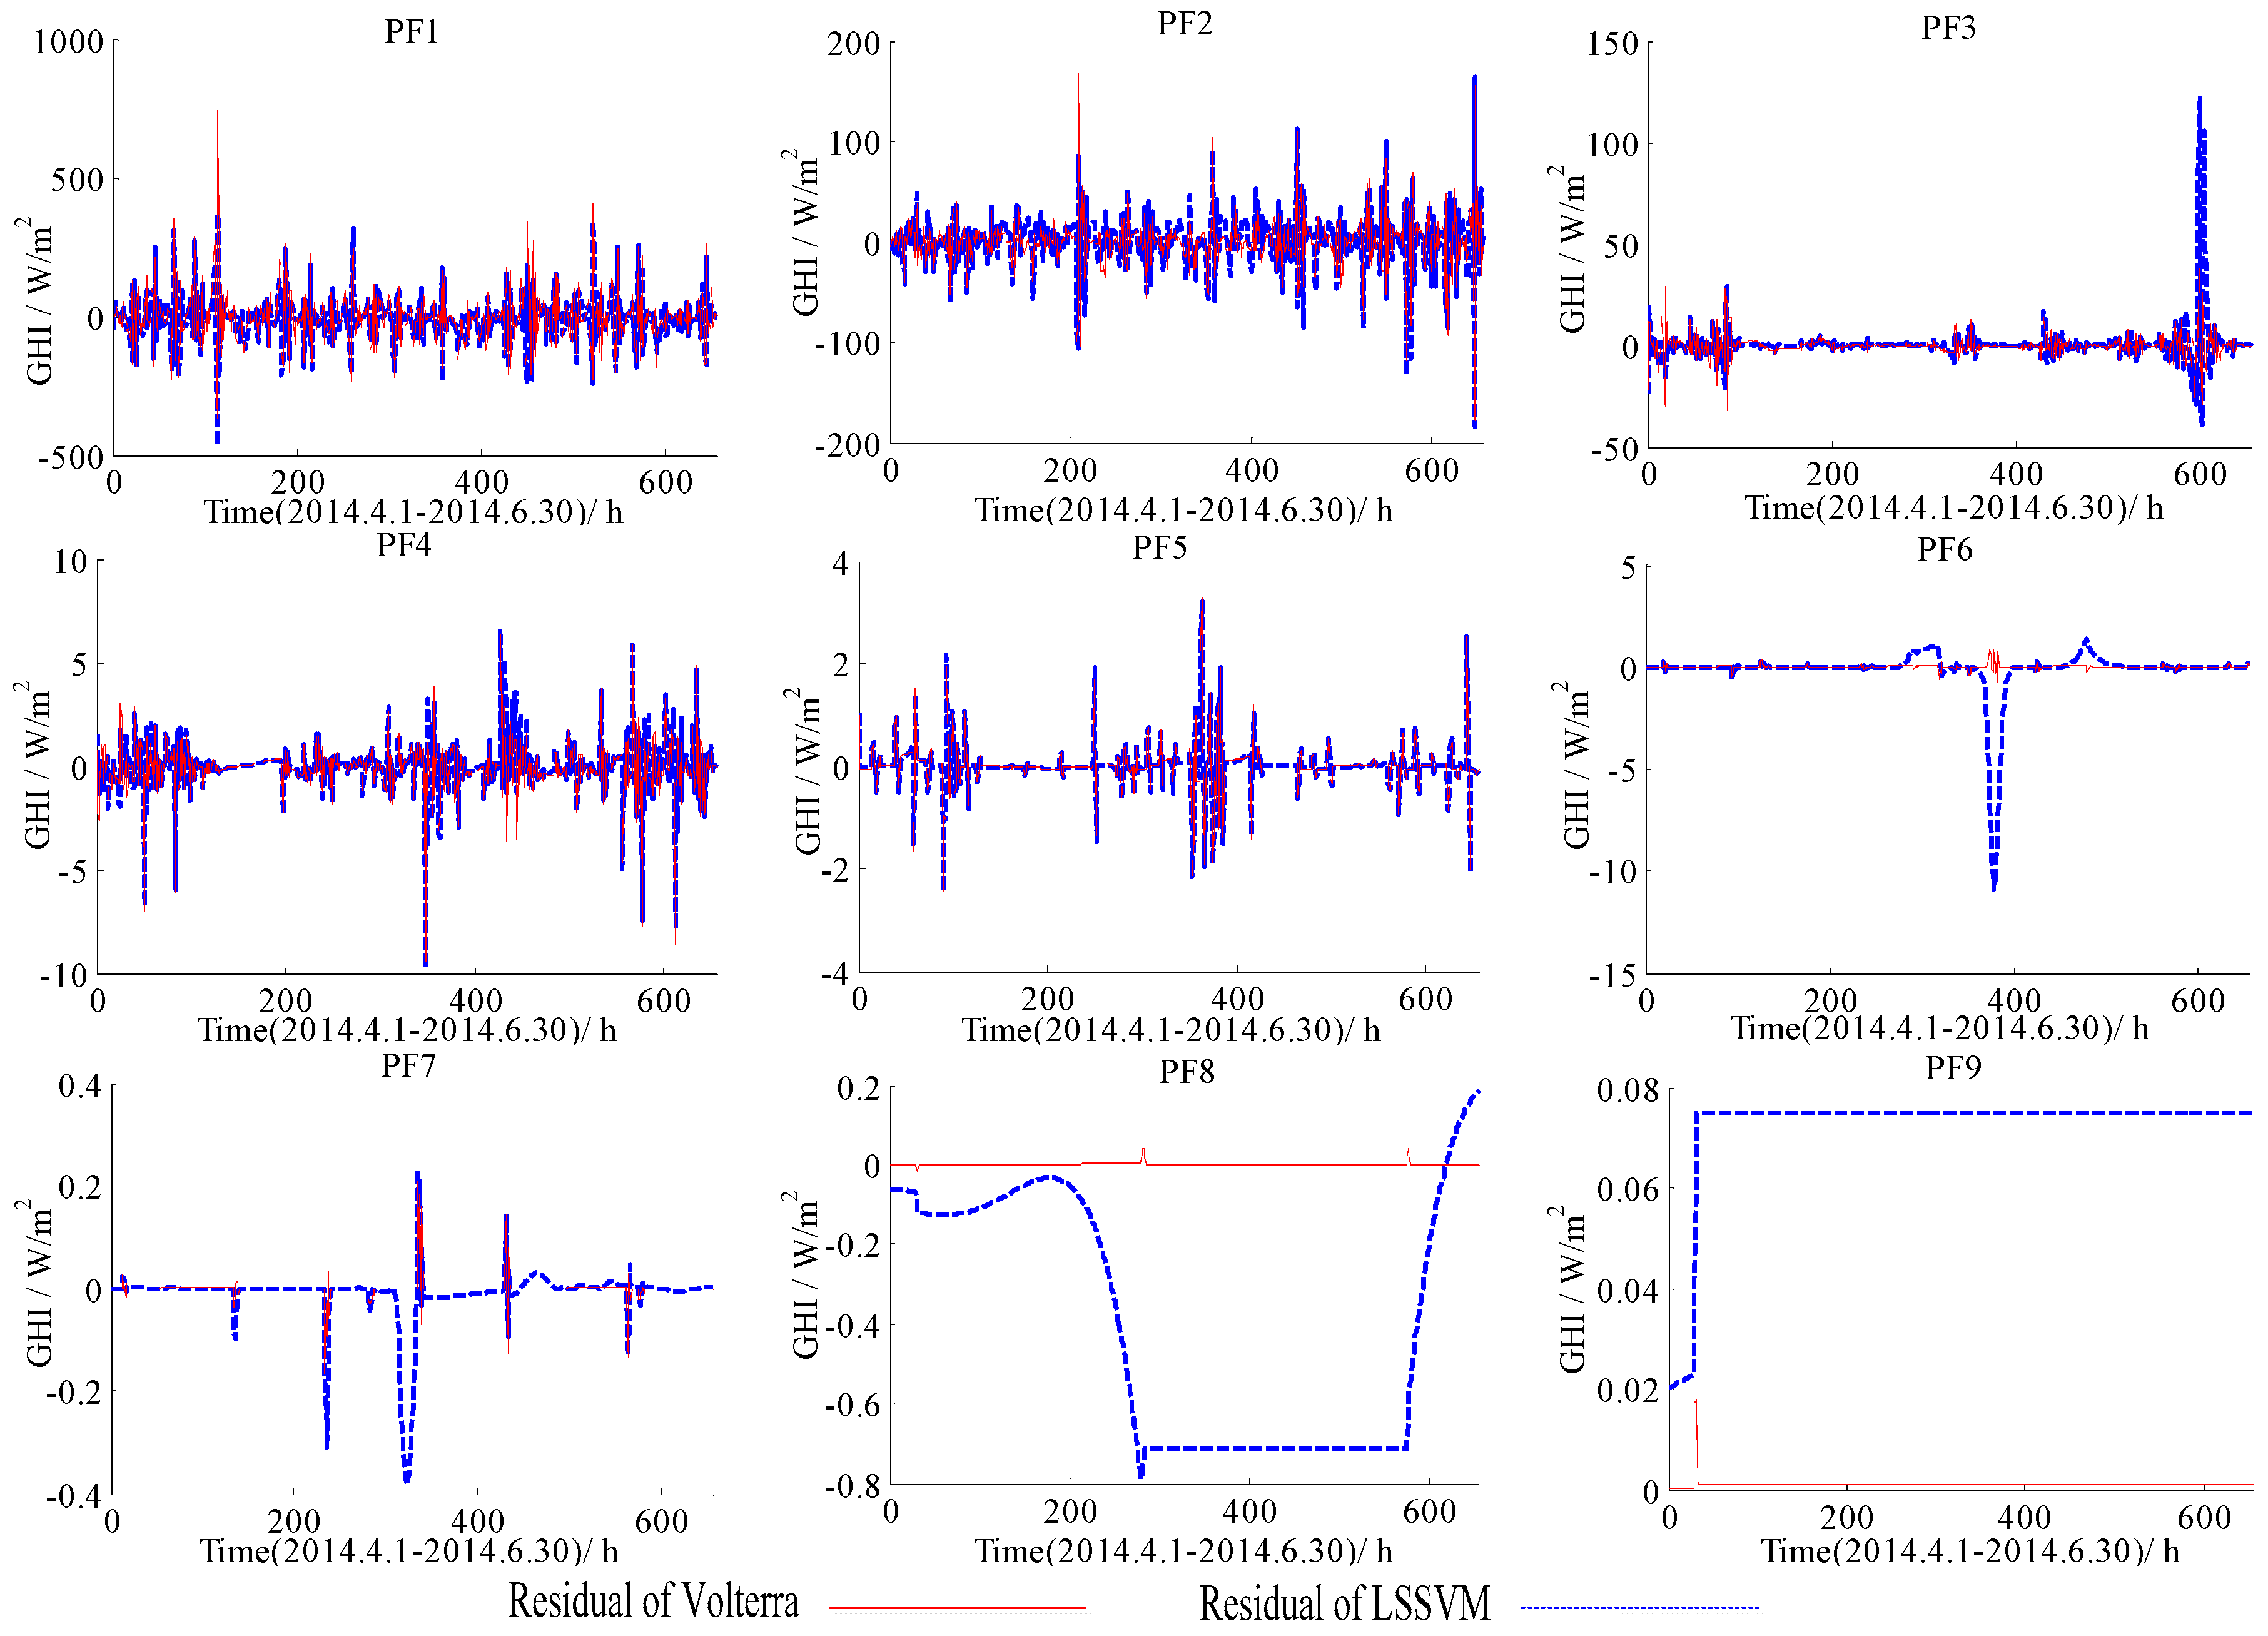
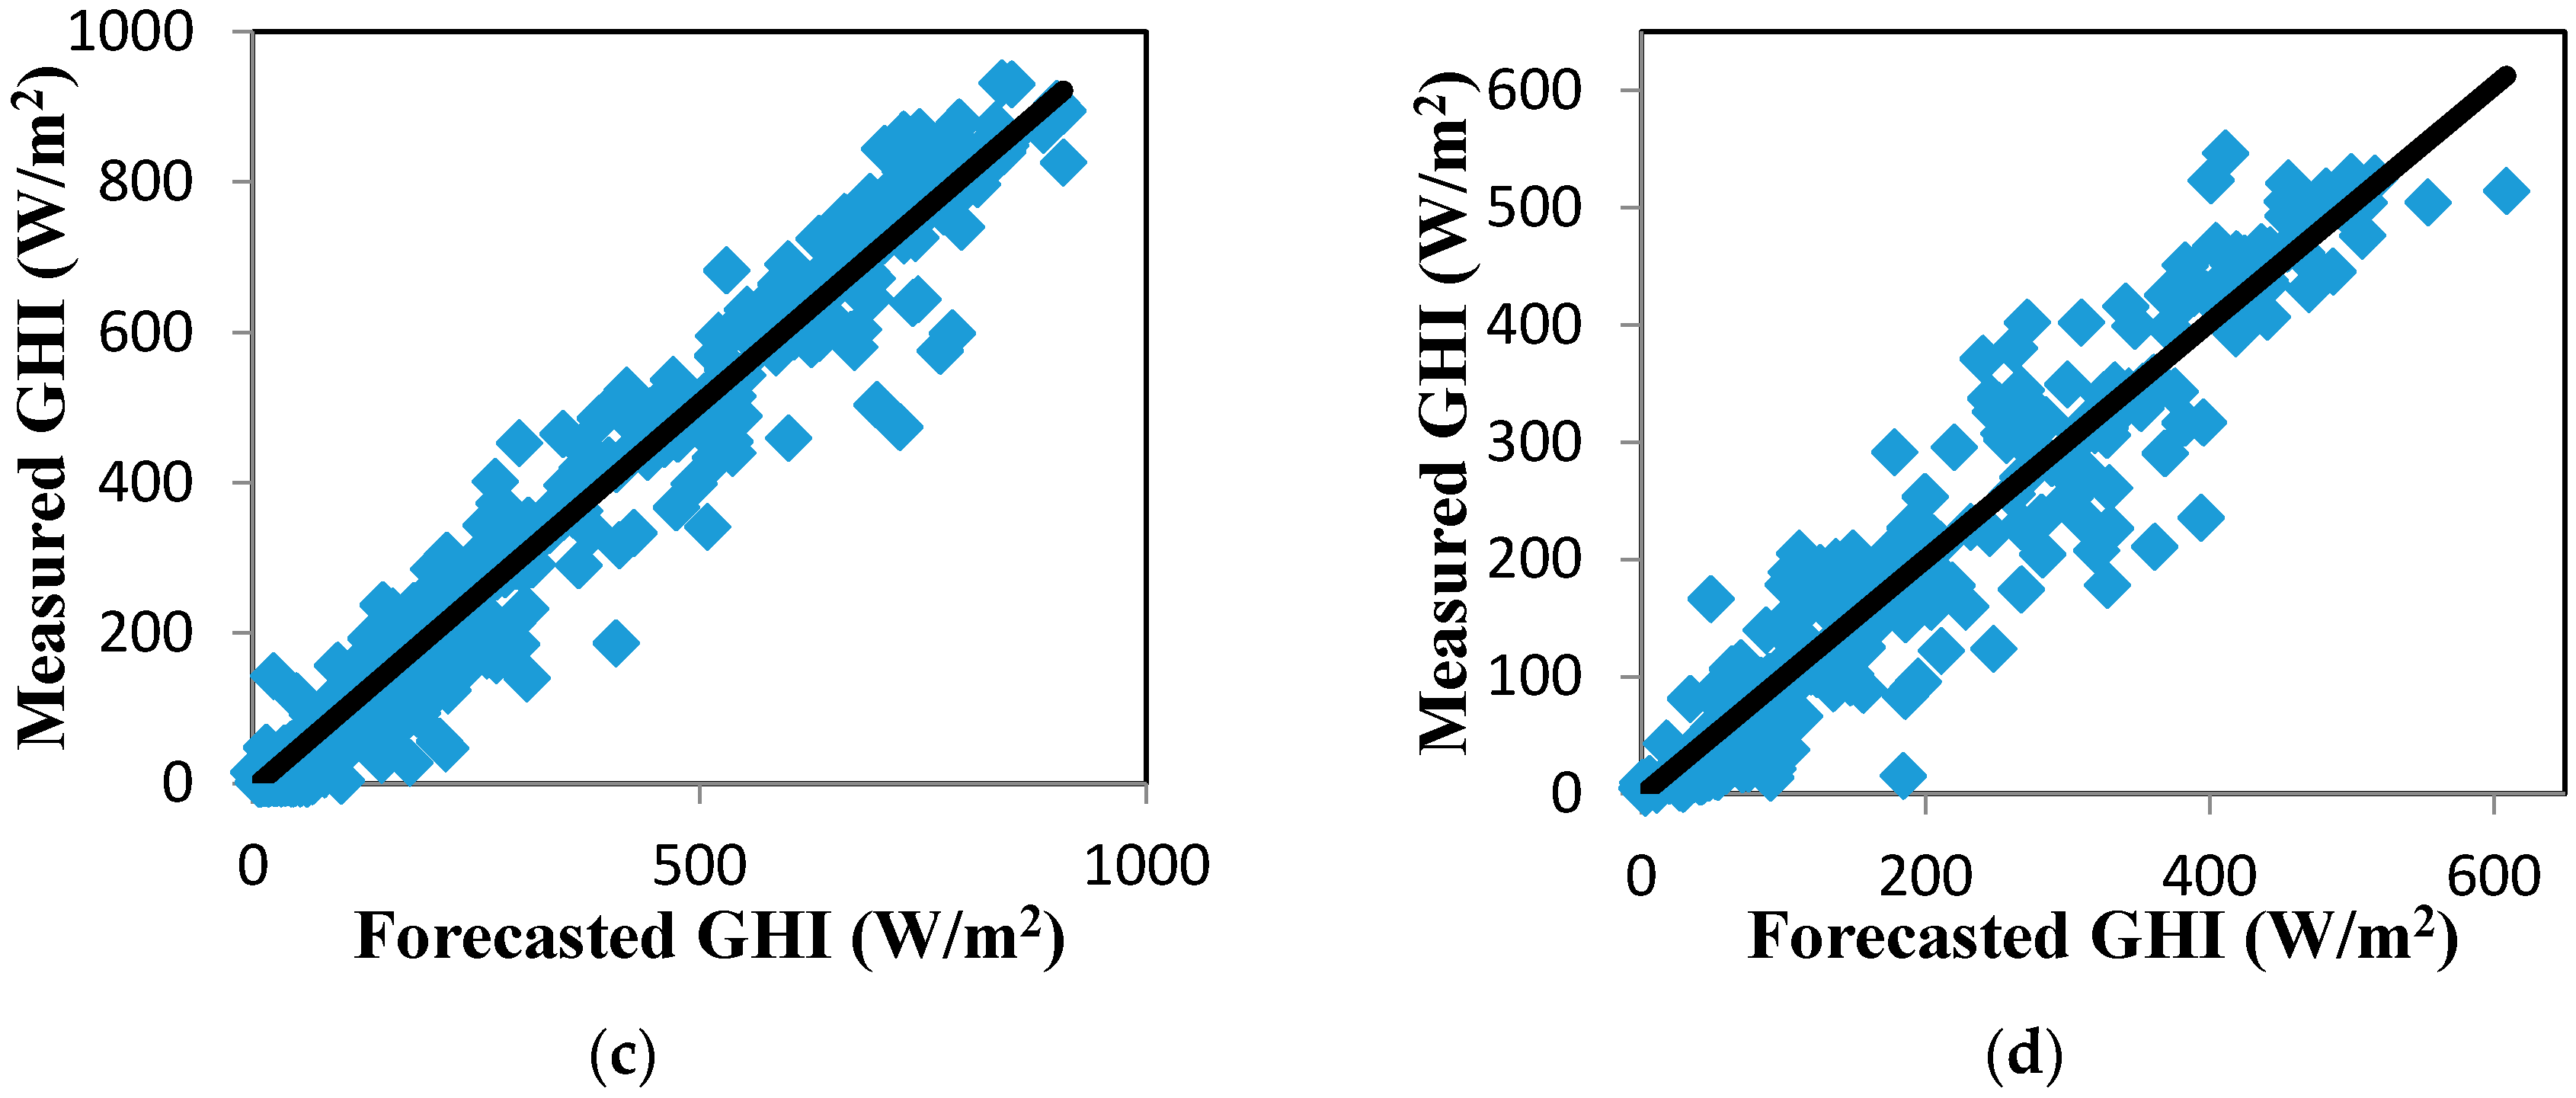
5.2. The Forecasting Results for GHI Series Using the EMD-LSSVM, the EMD-Volterra, the LMD-LSSVM, and the LMD-Volterra Models
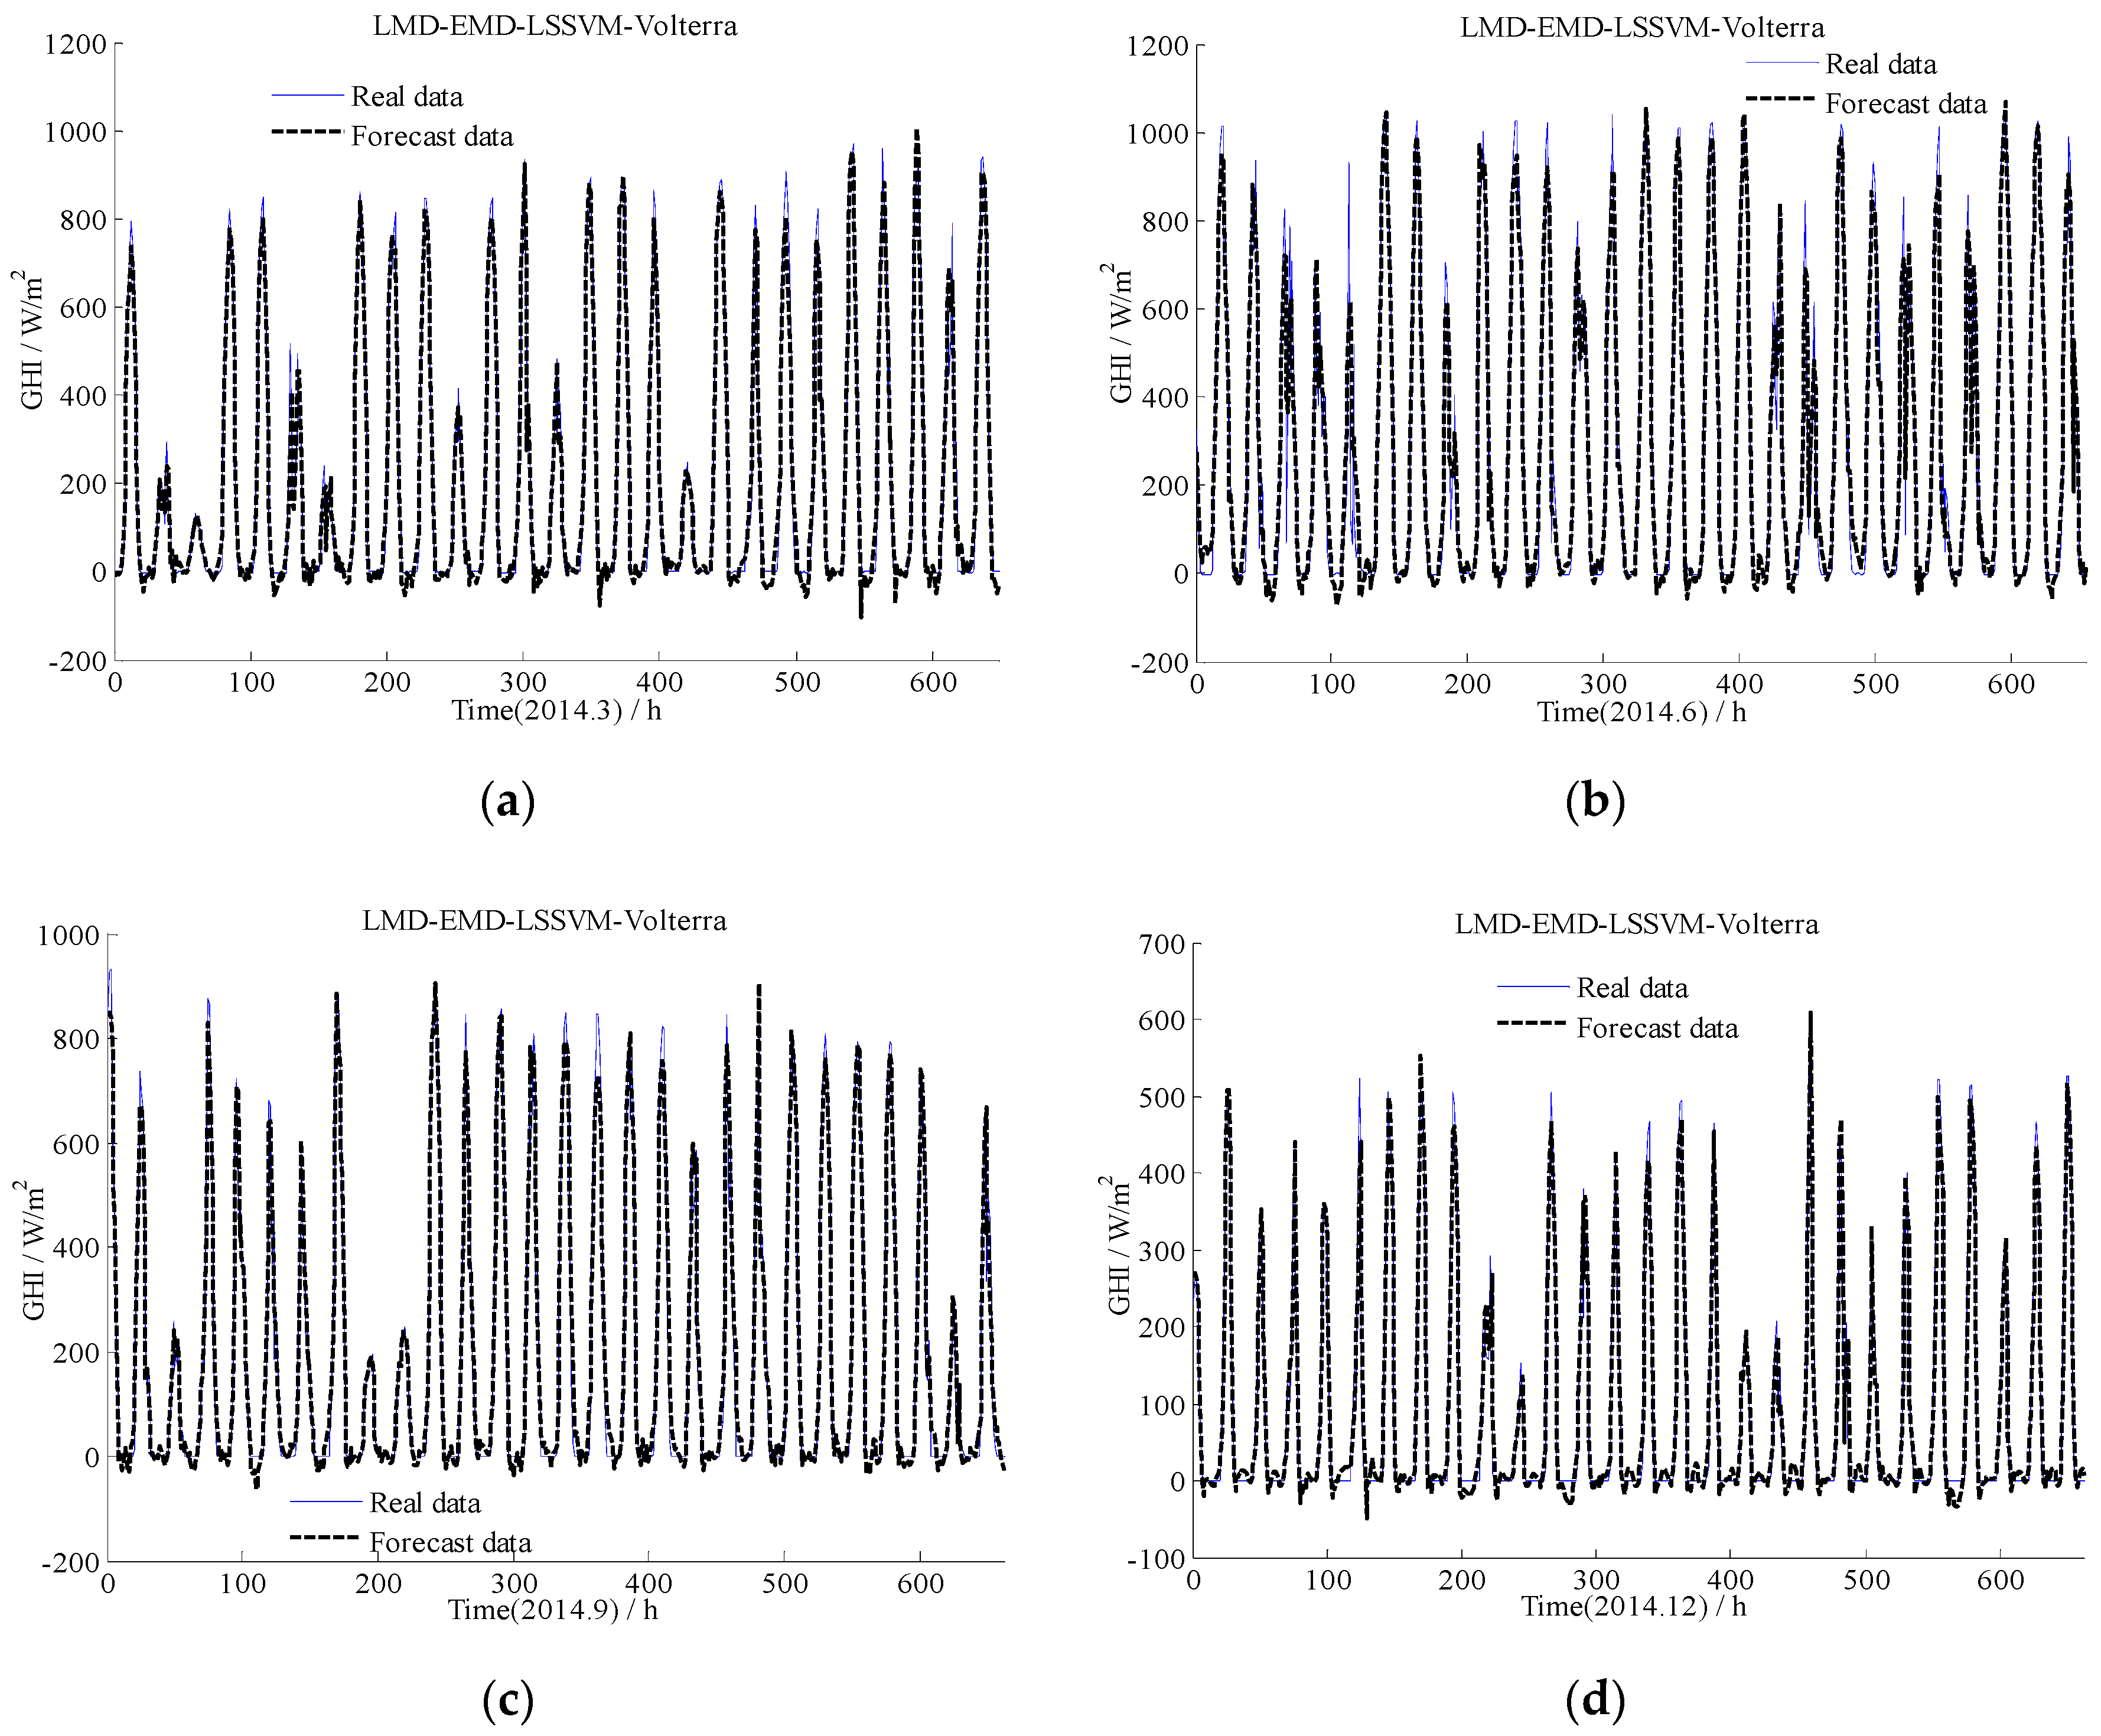
5.3. The Forecasting Results for GHI Series Using the EMD-LSSVM-Volterra, the LMD-LSSVM-Volterra, and the EMD-LMD-LSSVM-Volterra Models
5.4. The Forecasting Results for GHI Series Using the Persistence Model with Clear-Sky Index Forecasting under the ARIMA, the LSSVM, the Volterra, and the EMD-LMD-LSSVM-Volterra Models
6. Conclusions
Acknowledgments
Author Contributions
Conflicts of Interest
Nomenclature
| ANN | Artificial Neural Network |
| ARIMA | Autoregressive Integrated Moving Average |
| ARMA | Autoregressive Moving Average |
| EMD | Empirical Mode Decomposition |
| FNN | False Nearest Neighbor |
| GHI | Global Horizontal Irradiance |
| IMF | Intrinsic Mode Function |
| LMD | Local Mean Decomposition |
| LSSVM | Least Squares Support Vector Machine |
| SVM | Support Vector Machine |
| PF | Product Function |
| RH | Relative Humidity |
| R | Correlation Coefficient |
| RMSE | Root Mean Square Error |
| MAE | Mean Absolute Error |
References
- Lave, M.; Kleissl, J. Solar variability of four sites across the state of Colorado. Renew. Energy 2010, 35, 2867–2873. [Google Scholar] [CrossRef]
- Chi, W.C.; Urquhart, B.; Lave, M.; Dominguez, A.; Kleissl, J.; Shields, J.; Washom, B. Intra–hour forecasting with a total sky imager at the UC San Diego solar energy testbed. Sol. Energy 2011, 85, 2881–2893. [Google Scholar] [CrossRef]
- Perez, R.; Kivalov, S.; Schlemmer, J.; Hemker, K.; Renné, D.; Hoff, T.E. Validation of short and medium term operational solar radiation forecasts in the US. Sol. Energy 2010, 84, 2161–2172. [Google Scholar] [CrossRef]
- Wei, C. Predictions of surface solar radiation on tilted solar panels using machine learning models: A case study of Taiwan City, Taiwan. Energies 2017, 10, 1660. [Google Scholar] [CrossRef]
- Langella, R.; Proto, D.; Testa, A. Solar radiation forecasting, accounting for daily variability. Energies 2016, 9, 200. [Google Scholar] [CrossRef]
- Bracale, A.; Caramia, P.; Carpinelli, G.; Fazio, A.R.D.; Ferruzi, G. A Bayesian method for short-term probabilistic forecasting of photovoltaic Generation in Smart Grid Operation and Control. Energies 2013, 6, 733–747. [Google Scholar] [CrossRef]
- Voyant, C.; Muselli, M.; Paoli, C.; Nivet, M. Numerical weather prediction (NWP) and hybrid ARMA/ANN model to predict global radiation. Energy 2012, 39, 341–355. [Google Scholar] [CrossRef]
- Akarslan, E.; Hocaoğlu, F.O.; Edizkan, R. A novel M–D (multi–dimensional) linear prediction filter approach for hourly solar radiation forecasting. Energy 2014, 73, 978–986. [Google Scholar] [CrossRef]
- Yang, D.; Ye, Z.; Lim, L.H.I.; Dong, Z. Very short-term irradiance forecasting using the lasso. Sol. Energy 2015, 114, 314–326. [Google Scholar] [CrossRef]
- Notton, G.; Paoli, C.; Ivanova, L.; Vasileva, S.; Nivet, M.L. Neural network approach to estimate 10-min solar global irradiation values on tilted planes. Renew. Energy 2013, 50, 576–584. [Google Scholar] [CrossRef]
- Moghaddamnia, A.; Remesan, R.; Kashani, M.H.; Mohammadi, M.; Han, D.; Piri, J. Comparison of LLR, MLP, Elman, NNARX and ANFIS Models with a case study in solar radiation estimation. J. Atmos. Sol.-Terr. Phys. 2009, 71, 975–982. [Google Scholar] [CrossRef]
- Hocaoğlu, F.O. Stochastic approach for daily solar radiation modeling. Sol. Energy 2011, 85, 278–287. [Google Scholar] [CrossRef]
- Boata, R.S.; Gravila, P. Functional fuzzy approach for forecasting daily global solar irradiation. Atmos. Res. 2012, 112, 79–88. [Google Scholar] [CrossRef]
- Mecibah, M.S.; Boukelia, T.E.; Tahtah, R.; Gairaa, K. Introducing the best model for estimation the monthly mean daily global solar radiation on a horizontal surface (Case study: Algeria). Renew. Sustain. Energy Rev. 2014, 36, 194–202. [Google Scholar] [CrossRef]
- Wu, J.; Chan, C.K. Prediction of hourly solar radiation using a novel hybrid model of ARMA and TDNN. Sol. Energy 2011, 85, 808–817. [Google Scholar] [CrossRef]
- Alvanitopoulos, P.F.; Andreadis, I.; Georgoulas, N.; Zervakis, M.; Nikolaidis, N. Solar radiation prediction model based on Empirical Mode Decomposition. In Proceedings of the 2014 IEEE International Conference on Imaging Systems and Techniques (IST), Santorini, Greece, 14–17 October 2014; pp. 14–17. [Google Scholar] [CrossRef]
- Monjoly, S.; André, M.; Calif, R.; Soubdhan, T. Hourly forecasting of global solar radiation based on multiscale decomposition methods: A hybrid approach. Energy 2017, 119, 288–298. [Google Scholar] [CrossRef]
- Chicco, G.; Cocina, V.; Leo, P.D.; Spertino, F.; Pavan, A.M. Error Assessment of Solar Irradiance Forecasts and AC Power from Energy Conversion Model in Grid-Connected Photovoltaic Systems. Energies 2016, 9, 8. [Google Scholar] [CrossRef]
- Marquez, R.; Pedro, H.T.C.; Coimbra, C.F.M. Hybrid solar forecasting method uses satellite imaging and ground telemetry as inputs to ANNs. Sol. Energy 2013, 92, 176–188. [Google Scholar] [CrossRef]
- Brabec, M.; Paulescu, M.; Badescu, V. Tailored vs black-box models for forecasting hourly average solar irradiance. Sol. Energy 2015, 111, 320–331. [Google Scholar] [CrossRef]
- Paulescu, M.; Brabec, M.; Boata, R.; Badescu, V. Structured, physically inspired (gray box) models versus black box modeling for forecasting the output power of photovoltaic plants. Energy 2017, 121, 792–802. [Google Scholar] [CrossRef]
- Ghelardoni, L.; Ghio, A.; Anguita, D. Energy load forecasting using empirical mode decomposition and support vector regression. IEEE Trans. Smart Grid 2013, 4, 549–556. [Google Scholar] [CrossRef]
- Ren, Y.; Suganthan, P.N.; Srikanth, N. A comparative study of empirical mode decomposition–based short–term wind speed forecasting methods. IEEE Trans. Sustain. Energy 2015, 6, 236–244. [Google Scholar] [CrossRef]
- Park, C.; Looney, D.; Hulle, M.M.V.; Mandic, D.P. The complex local mean decomposition. Neurocomputing 2011, 74, 867–875. [Google Scholar] [CrossRef]
- Huang, N.E.; Shen, Z.; Long, S.R.; Wu, M.C.; Shih, H.H.; Zheng, Q.; Yen, N.C.; Tung, C.C.; Liu, H.H. The empirical mode decomposition and the hilbert spectrum for nonlinear and non–stationary time series analysis. Proc. Math. Phys. Eng. Sci. 1998, 454, 903–995. [Google Scholar] [CrossRef]
- Mookiah, M.R.K.; Achary, U.R.; Fujit, H.; Koh, J.E.W.; Tan, J.H.; Chu, C.K.; Bhandary, S.V.; Noronha, K.; Laude, A.; Tong, L. Automated detection of age-related macular degeneration using empirical mode decomposition. Knowl.-Based Syst. 2015, 89, 654–668. [Google Scholar] [CrossRef]
- Smith, J.S. The local mean decomposition and its application to EEG perception data. J. R. Soc. Interface 2005, 2, 443–454. [Google Scholar] [CrossRef] [PubMed]
- Kennel, M.B.; Brown, R.; Abarbanel, H.D.I. Determining embedding dimension for phase space reconstruction using a geometrical construction. Phys. Rev. A 1992, 45, 3403–3411. [Google Scholar] [CrossRef] [PubMed]
- Maheswaran, R.; Khosa, R. Wavelet Volterra Coupled Models for forecasting of nonlinear and non-stationary time series. Neurocomputing 2013, 149, 1074–1084. [Google Scholar] [CrossRef]
- Zhao, B.; Yong, L.; Xia, S.W. Support vector machine and its application in handwritten numeral recognition. Pattern Recognit. 2000, 2, 720–723. [Google Scholar] [CrossRef]
- Gharagheizi, F.; Ilani–Kashkouli, P.; Sattari, M.; Mohammadi, A.H.; Ramjugernath, D.; Richon, D. Development of a LSSVM–GC model for estimating the electrical conductivity of ionic liquids. Chem. Eng. Res. Des. 2014, 92, 66–79. [Google Scholar] [CrossRef]
- Gestel, T.V.; Suykens, J.A.K.; Baestaens, D.-E.; Lambrechts, A.; Lanckriet, G.; Vandaele, B.; Moor, B.D.; Vandewalle, J. Financial time series prediction using least squares support vector machines within the evidence framework. IEEE Trans. Neural Netw. 2001, 12, 809–821. [Google Scholar] [CrossRef] [PubMed]
- Suykens, J.A.K.; Vandewalle, J. Least squares support vector machine classifiers. Neural Process. Lett. 1999, 9, 293–300. [Google Scholar] [CrossRef]
- Ismail, S.; Shabri, A.; Samsudin, R. A hybrid model of self–organizing maps (SOM) and least square support vector machine (LSSVM) for time–series forecasting. Expert Syst. Appl. 2011, 38, 10574–10578. [Google Scholar] [CrossRef]
- Nowak, R.D.; Van, V.B.D. Random and pseudorandom inputs for Volterra filter identification. IEEE Trans. Signal Process. 1994, 42, 2124–2135. [Google Scholar] [CrossRef]
- Volterra, V. Theory of Functionals and of Integral and Integro–Differential Equations; Dover Publications: Mineola, NY, USA, 1959. [Google Scholar]
- Billings, S.A. Book review: The Volterra and Wiener theories of nonlinear systems. Int. J. Electr. Eng. Educ. 1980, 18, 187. [Google Scholar] [CrossRef]
- Pandey, C.K.; Katiyar, A.K. A note on diffuse solar radiation on a tilted surface. Energy 2009, 34, 1764–1769. [Google Scholar] [CrossRef]
- Zhao, N.; Zeng, X.; Han, S. Solar radiation estimation using sunshine hour and air pollution index in china. Energy Convers. Manag. 2013, 76, 846–851. [Google Scholar] [CrossRef]
- Elagib, N.A.; Alvi, S.H.; Mansell, M.G. Correlation ships between clearness index and relative sunshine duration for Sudan. Renew. Energy 1999, 17, 473–498. [Google Scholar] [CrossRef]
- Coimbra, C.F.M.; Kleissl, J.; Marquez, R. Overview of solar forecasting methods and a metric for accuracy evaluation. In Solar Energy Forecasting and Resource Assessment, 1st ed.; Kleissl, J., Ed.; Elsevier Academic Press: Boston, MA, USA, 2013; Chapter 8; pp. 171–194. ISBN 9780123971777. [Google Scholar]
- Marquez, R.; Coimbra, C.F.M. Proposed metric for evaluation of solar forecasting models. J. Sol. Energy Eng. 2011, 135, 011016. [Google Scholar] [CrossRef]
- Bird, R.E.; Hulstrom, R.L. A Simplified Clear Sky Model for Direct and Diffuse Insolation on Horizontal Surfaces; Technical Report; Solar Energy Research Institution: Golden, CO, USA, 1981. [Google Scholar]
- Dodd, T.J.; Wan, Y.; Drezet, P.; Harrison, R.F. Practical estimation of Volterra filters of arbitrary degree. Int. J. Control 2007, 80, 908–918. [Google Scholar] [CrossRef]
- Hwang, S.H.; Ham, D.H.; Kim, J.H. Forecasting performance of LS–SVM for nonlinear hydrological time series. KSCE J. Civ. Eng. 2012, 5, 870–882. [Google Scholar] [CrossRef]
- Zhu, A.; Pedro, J.C.; Brazil, T.J. Dynamic deviation reduction based Volterra behavioral modeling of RF power amplifiers. IEEE Trans. Microw. Theory Tech. 2006, 54, 4323–4332. [Google Scholar] [CrossRef]
- Chen, C.; Duan, S.; Cai, T.; Liu, B. Online 24-h solar power forecasting based on weather type classification using artificial neural network. Sol. Energy 2011, 85, 2856–2870. [Google Scholar] [CrossRef]


| Month | Avg Temp (°C) | Max Temp (°C) | Min Temp (°C) | Avg RH (%) | Max RH (%) | Min RH (%) |
|---|---|---|---|---|---|---|
| Jan. | 2.06 | 16.8 | −18.0 | 44.7 | 103 | 3.40 |
| Feb. | −0.61 | 17.9 | −25.1 | 57.5 | 105 | 5.60 |
| Mar. | 5.16 | 21.9 | −15.6 | 43.6 | 107 | 6.20 |
| Apr. | 9.29 | 15.9 | 2.76 | 42.9 | 70.6 | 21.6 |
| May | 13.4 | 19.9 | 7.51 | 53.7 | 79.0 | 31.7 |
| Jun. | 19.1 | 26.6 | 12.1 | 44.5 | 75.0 | 21.5 |
| Jul. | 22.3 | 29.1 | 16.7 | 48.3 | 75.0 | 28.2 |
| Aug. | 20.6 | 27.3 | 15.3 | 46.5 | 70.4 | 26.0 |
| Sept. | 17.8 | 24.48 | 11.98 | 51.58 | 76.18 | 29.6 |
| Oct. | 13.5 | 20.1 | 7.29 | 39.9 | 63.6 | 22.5 |
| Nov. | 3.56 | 10.6 | −3.00 | 45.0 | 69.8 | 25.9 |
| Dec. | 1.39 | 7.57 | −3.82 | 47.5 | 67.5 | 25.9 |
| Lat | Long | TZ | Pressure mB | Ozone cm | H2O cm | AOD@ 500 nm | AOD@ 380 nm | Taua | Ba | Albedo |
|---|---|---|---|---|---|---|---|---|---|---|
| 40 | −105 | −7 | 840 | 0.3 | 1.5 | 0.1 | 0.15 | 0.08 | 0.85 | 0.2 |
| Period | Models | RMSE (W/m2) | MAE (W/m2) | R | Forecast Skill |
|---|---|---|---|---|---|
| Jan. to Mar. | Persistence | 120 | 36.8 | 0.923 | 0.00 |
| LSSVM | 74.0 | 46.6 | 0.975 | 38.3% | |
| Volterra | 88.1 | 56.0 | 0.963 | 26.6% | |
| Apr. to Jun. | Persistence | 121 | 55.4 | 0.941 | 0.00 |
| LSSVM | 110 | 62.1 | 0.948 | 9.09% | |
| Volterra | 118 | 73.2 | 0.939 | 2.48% | |
| Jul. to Sept. | Persistence | 68.7 | 30.1 | 0.970 | 0.00 |
| LSSVM | 76.9 | 50.8 | 0.962 | −11.9% | |
| Volterra | 75.7 | 49.4 | 0.962 | −10.2% | |
| Oct. to Dec. | Persistence | 74.3 | 24.5 | 0.890 | 0.00 |
| LSSVM | 46.0 | 25.6 | 0.957 | 38.1% | |
| Volterra | 44.5 | 25.8 | 0.954 | 40.1% |
| Components | m | LSSVM | Volterra | ||||
|---|---|---|---|---|---|---|---|
| RMSE (W/m2) | MAE (W/m2) | R | RMSE (W/m2) | MAE (W/m2) | R | ||
| IMF1 | 17 | 52.8 | 37.98 | 0.778 | 60.4 | 43.8 | 0.709 |
| IMF2 | 13 | 36.2 | 17.1 | 0.977 | 19.5 | 11.1 | 0.993 |
| IMF3 | 6 | 1.93 | 1.20 | 1.00 | 1.05 | 0.730 | 1.00 |
| IMF4 | 6 | 3.45 × 10⁻² | 2.06 × 10⁻² | 1.00 | 3.20 × 10⁻² | 1.86 × 10⁻² | 1.00 |
| IMF5 | 6 | 8.57 × 10⁻³ | 6.56 × 10⁻³ | 1.00 | 2.45 × 10⁻³ | 1.38 × 10⁻³ | 1.00 |
| IMF6 | 2 | 3.34 × 10⁻² | 1.80 × 10⁻² | 1.00 | 1.26 × 10⁻² | 1.03 × 10⁻² | 1.00 |
| IMF7 | 2 | 1.35 × 10⁻² | 7.00 × 10⁻³ | 1.00 | 2.11 × 10⁻³ | 1.81 × 10⁻³ | 1.00 |
| IMF8 | 3 | 1.27 × 10⁻⁴ | 9.66 × 10⁻⁵ | 1.00 | 8.64 × 10⁻⁶ | 5.46 × 10⁻⁶ | 1.00 |
| PF1 | 10 | 52.7 | 32.0 | 0.716 | 55.7 | 33.8 | 0.675 |
| PF2 | 7 | 24.4 | 14.7 | 0.993 | 20.4 | 12.9 | 0.995 |
| PF3 | 6 | 5.90 | 4.38 | 1.00 | 5.73 | 4.17 | 1.00 |
| PF4 | 7 | 2.62 | 1.32 | 0.999 | 1.28 | 0.922 | 1.00 |
| PF5 | 6 | 0.576 | 0.207 | 1.00 | 0.255 | 0.157 | 1.00 |
| PF6 | 7 | 0.347 | 0.116 | 1.00 | 3.54 × 10⁻² | 1.74 × 10⁻² | 1.00 |
| PF7 | 4 | 1.07 × 10⁻² | 4.45 × 10⁻³ | 1.00 | 6.15 × 10⁻³ | 1.70 × 10⁻³ | 1.00 |
| PF8 | 2 | 6.38 × 10⁻² | 4.59 × 10⁻² | 1.00 | 2.66 × 10⁻³ | 1.38 × 10⁻³ | 1.00 |
| Components | m | LSSVM | Volterra | ||||
|---|---|---|---|---|---|---|---|
| RMSE (W/m2) | MAE (W/m2) | R | RMSE (W/m2) | MAE (W/m2) | R | ||
| IMF1 | 17 | 81.1 | 57.2 | 0.449 | 87.8 | 63.3 | 0.387 |
| IMF2 | 10 | 47.0 | 27.9 | 0.969 | 46.2 | 31.3 | 0.970 |
| IMF3 | 10 | 5.90 | 3.63 | 1.00 | 5.23 | 2.79 | 1.00 |
| IMF4 | 5 | 1.17 | 0.690 | 1.00 | 0.139 | 9.01 × 10⁻² | 1.00 |
| IMF5 | 5 | 6.74 × 10⁻² | 2.13 × 10⁻² | 1.00 | 5.69 × 10⁻³ | 5.69 × 10⁻³ | 1.00 |
| IMF6 | 5 | 1.07 × 10⁻³ | 5.49 × 10⁻⁴ | 1.00 | 1.08 × 10⁻⁴ | 5.77 × 10⁻⁵ | 1.00 |
| IMF7 | 6 | 4.44 × 10⁻⁴ | 3.45 × 10⁻⁴ | 1.00 | 6.67 × 10⁻⁶ | 2.95 × 10⁻⁶ | 1.00 |
| IMF8 | 4 | 3.69 × 10⁻³ | 3.42 × 10⁻³ | 1.00 | 2.17 × 10⁻⁷ | 1.33 × 10⁻⁷ | 1.00 |
| IMF9 | 4 | 3.90 × 10⁻⁴ | 3.47 × 10⁻⁴ | 1.00 | 4.65 × 10⁻⁷ | 3.71 × 10⁻⁷ | 1.00 |
| PF1 | 16 | 79.8 | 52.8 | 0.623 | 92.6 | 61.9 | 0.469 |
| PF2 | 6 | 25.9 | 17.1 | 0.995 | 24.6 | 14.9 | 0.996 |
| PF3 | 7 | 9.19 | 3.06 | 0.997 | 5.22 | 2.73 | 1.00 |
| PF4 | 7 | 1.25 | 0.717 | 1.00 | 1.23 | 0.717 | 1.00 |
| PF5 | 3 | 0.420 | 0.181 | 1.00 | 0.420 | 0.193 | 1.00 |
| PF6 | 4 | 1.28 | 0.320 | 1.00 | 0.103 | 4.11 × 10⁻² | 1.00 |
| PF7 | 4 | 5.60 × 10⁻² | 1.71 × 10⁻² | 1.00 | 1.92 × 10⁻² | 3.86 × 10⁻³ | 1.00 |
| PF8 | 2 | 0.508 | 0.409 | 1.00 | 4.04 × 10⁻³ | 1.43 × 10⁻³ | 1.00 |
| PF9 | 2 | 7.31 × 10⁻² | 7.22 × 10⁻² | 1.00 | 1.44 × 10⁻³ | 8.76 × 10⁻⁴ | 1.00 |
| Period | Models | RMSE (W/m2) | MAE (W/m2) | R | Forecast Skill |
|---|---|---|---|---|---|
| Jan. to Mar. | EMD-LSSVM | 62.6 | 42.8 | 0.977 | 47.8% |
| EMD-Volterra | 64.8 | 45.9 | 0.976 | 46.0% | |
| LMD-LSSVM | 58.4 | 37.4 | 0.981 | 51.3% | |
| LMD-Volterra | 60.0 | 37.8 | 0.979 | 50.0% | |
| Apr. to Jun. | EMD-LSSVM | 89.9 | 62.8 | 0.965 | 25.7% |
| EMD-Volterra | 90.3 | 63.6 | 0.965 | 25.4% | |
| LMD-LSSVM | 85.8 | 58.3 | 0.968 | 29.1% | |
| LMD-Volterra | 98.0 | 66.3 | 0.958 | 19.0% | |
| Jul. to Sept. | EMD-LSSVM | 51.6 | 35.6 | 0.982 | 24.9% |
| EMD-Volterra | 60.7 | 45.2 | 0.975 | 11.6% | |
| LMD-LSSVM | 58.8 | 39.9 | 0.977 | 14.4% | |
| LMD-Volterra | 66.4 | 42.6 | 0.971 | 3.35% | |
| Oct. to Dec. | EMD-LSSVM | 37.8 | 26.4 | 0.968 | 49.1% |
| EMD-Volterra | 38.0 | 28.3 | 0.967 | 48.9% | |
| LMD-LSSVM | 36.9 | 21.7 | 0.969 | 50.3% | |
| LMD-Volterra | 41.6 | 25.0 | 0.960 | 44.0% |
| Period | Models | RMSE (W/m2) | MAE (W/m2) | R | Forecast Skill |
|---|---|---|---|---|---|
| Jan. to Mar. | ARIMA | 70.8 | 45.8 | 0.970 | 41.0% |
| EMD-LSSVM-Volterra | 57.7 | 40.6 | 0.981 | 51.9% | |
| LMD-LSSVM-Volterra | 57.5 | 36.3 | 0.981 | 52.1% | |
| EMD-LMD-LSSVM-Volterra | 50.7 | 33.8 | 0.985 | 57.8% | |
| Apr. to Jun. | ARIMA | 116 | 67.8 | 0.941 | 4.13% |
| EMD-LSSVM-Volterra | 87.8 | 61.4 | 0.967 | 27.4% | |
| LMD-LSSVM-Volterra | 85.3 | 57.6 | 0.969 | 29.5% | |
| EMD-LMD-LSSVM-Volterra | 77.1 | 52.2 | 0.974 | 36.3% | |
| Jul. to Sept. | ARIMA | 77.0 | 47.4 | 0.959 | −12.1% |
| EMD-LSSVM-Volterra | 49.0 | 33.7 | 0.984 | 28.7% | |
| LMD-LSSVM-Volterra | 58.2 | 38.7 | 0.977 | 15.3% | |
| EMD-LMD-LSSVM-Volterra | 46.1 | 29.9 | 0.986 | 32.9% | |
| Oct. to Dec. | ARIMA | 46.2 | 31.5 | 0.950 | 37.8% |
| EMD-LSSVM-Volterra | 37.6 | 26.3 | 0.968 | 49.4% | |
| LMD-LSSVM-Volterra | 36.7 | 21.5 | 0.969 | 50.6% | |
| EMD-LMD-LSSVM-Volterra | 32.4 | 20.2 | 0.976 | 56.4% |
| Period | Models | RMSE (W/m2) | MAE (W/m2) | R | Forecast Skill |
|---|---|---|---|---|---|
| Jan. to Mar. | ARIMA | 81.8 | 46.1 | 0.961 | 31.8% |
| LSSVM | 90.5 | 46.5 | 0.954 | 24.6% | |
| Volterra | 88.4 | 46.8 | 0.956 | 26.3% | |
| EMD-LMD-LSSVM-Volterra | 54.3 | 26.5 | 0.984 | 54.8% | |
| Apr. to Jun. | ARIMA | 124 | 66.6 | 0.936 | −2.48% |
| LSSVM | 115 | 62.3 | 0.943 | 4.96% | |
| Volterra | 116 | 64.6 | 0.942 | 4.13% | |
| EMD-LMD-LSSVM-Volterra | 67.0 | 36.1 | 0.981 | 44.6% | |
| Jul. to Sept. | ARIMA | 83.4 | 44.1 | 0.952 | −21.4% |
| LSSVM | 72.0 | 38.3 | 0.967 | −4.80% | |
| Volterra | 73.1 | 40.6 | 0.969 | −6.40% | |
| EMD-LMD-LSSVM-Volterra | 52.8 | 28.5 | 0.982 | 23.1% | |
| Oct. to Dec. | ARIMA | 46.4 | 22.9 | 0.957 | 37.6% |
| LSSVM | 45.7 | 20.8 | 0.953 | 38.5% | |
| Volterra | 46.0 | 21.6 | 0.952 | 38.1% | |
| EMD-LMD-LSSVM-Volterra | 26.3 | 12.3 | 0.984 | 64.6% |
© 2018 by the authors. Licensee MDPI, Basel, Switzerland. This article is an open access article distributed under the terms and conditions of the Creative Commons Attribution (CC BY) license (http://creativecommons.org/licenses/by/4.0/).
Share and Cite
Wang, Z.; Tian, C.; Zhu, Q.; Huang, M. Hourly Solar Radiation Forecasting Using a Volterra-Least Squares Support Vector Machine Model Combined with Signal Decomposition. Energies 2018, 11, 68. https://doi.org/10.3390/en11010068
Wang Z, Tian C, Zhu Q, Huang M. Hourly Solar Radiation Forecasting Using a Volterra-Least Squares Support Vector Machine Model Combined with Signal Decomposition. Energies. 2018; 11(1):68. https://doi.org/10.3390/en11010068
Chicago/Turabian StyleWang, Zhenyu, Cuixia Tian, Qibing Zhu, and Min Huang. 2018. "Hourly Solar Radiation Forecasting Using a Volterra-Least Squares Support Vector Machine Model Combined with Signal Decomposition" Energies 11, no. 1: 68. https://doi.org/10.3390/en11010068
APA StyleWang, Z., Tian, C., Zhu, Q., & Huang, M. (2018). Hourly Solar Radiation Forecasting Using a Volterra-Least Squares Support Vector Machine Model Combined with Signal Decomposition. Energies, 11(1), 68. https://doi.org/10.3390/en11010068