Abstract
Establishing the schemes of accurate and computationally efficient performance estimation and fault diagnosis for turbofan engines has become a new research focus and challenges. It is able to increase reliability and stability of turbofan engine and reduce the life cycle costs. Accurate estimation of turbofan engine performance counts on thoroughly understanding the components’ performance, which is described by component characteristic maps and the fault of each component can be regarded as the change of characteristic maps. In this paper, a novel method based on a Levenberg–Marquardt (LM) algorithm is proposed to enhance the fidelity of the performance estimation and the credibility of the fault diagnosis for the turbofan engine. The presented method utilizes the LM algorithm to figure out the operating point in the characteristic maps, preparing for performance estimation and fault diagnosis. The accuracy of the proposed method is evaluated for estimating performance parameters in the transient case with Rayleigh process noise and Gaussian measurement noise. The comparison among the extended Kalman filter (EKF) method, the particle filter (PF) method and the proposed method is implemented in the abrupt fault case and the gradual degeneration case and it has been shown that the proposed method has the capability to lead to more accurate result for performance estimation and fault diagnosis of turbofan engine than current popular EKF and PF diagnosis methods.
1. Introduction
The operation condition of aircraft turbofan engine is tough due to the extreme temperature, strong vibration environment, broad load range and so on and the reliability of aircraft turbofan engine must be ensured over the lifetime [1]. Much research has been conducted in prognostics and health management (PHM), an emerging field in mechanical engineering that is gaining interest from both academia and industry [2]. Condition-monitoring plays an increasingly important role for technical processes in order to improve reliability, availability, maintenance and lifetime of equipment [3]. The detection of engine performance and gas path performance analysis are considered to be effective approaches to enhance the reliability and safety of the turbofan engine [4,5]. Additionally, the detection systems can also be used for the scheme of on-condition maintenance for the purpose of decreasing the maintenance costs [6].
Performance of aircraft turbofan engine deteriorates gradually over engine lifetime, mainly caused by compressor fouling, blade tip clearance increase, and unavoidable wear and erosion. In regard to fatigue life prediction of aircraft gas turbine, Zhu proposed a generalized energy-based fatigue-creep damage parameter [7], and developed some probabilistic prediction frameworks [8,9]. In addition, foreign object damage (FOD) will lead to a sharp shift of engine performance, which is called abrupt failure [10]. These physical failures in each gas path component would result in degradation of the thermodynamic efficiency and the flow capacity, which are called health parameters. The degradation of health parameters leads to the variation of measurements, including the spool speeds, temperatures and pressures [11]. Accurate estimation of the performance parameters of engine components over engine lifetime and reliably detecting the gradual degeneration and abrupt fault are expected to play a critical role in effective engine diagnostics and maintenance [12,13].
Several technologies have been applied in the performance parameters estimation and the fault diagnosis of aircraft turbofan engine, including data driven approaches and model based approaches. The feature extraction and pattern classification based on data driven methodology are applied in fault detection for aircraft turbofan engine by Sarkar [14]. Rasaienia suggested using multi-layer perceptron (MLP) and learning vector quantization (LVQ) networks to classify the fault pattern [15]. An integrated solution to the problem of both sensor and component fault detection and isolation consisting of a bank of auto associative neural networks (AANNs) is provided by Sadough-Vanini [16]. Meanwhile, the application of data driven approaches to turbofan engine diagnosis is constricted by the facts that unknown and untrained fault patterns are impossible to be detected and the diagnostics accuracy will not be high enough if the size of fault samples is not large enough.
Along with the improvement of the component level model precision and the increase of the hardware calculation speed, the use of an engine model for the performance estimation and fault diagnosis has been a key concept in the engine health management [17,18,19]. Due to utilizing all model information available, the model-based approaches are more accurate and can be used to deal with faults that may be unknown. A linear point design methodology for minimizing the error in an online Kalman filter-based aircraft engine performance estimation applications is presented by Simon [20]. An approach based on the constant gain extended Kalman filter (CGEKF) technique for the in-flight estimation of non-measurable performance parameters of aircraft engines is investigated by Kobayashi [21]. Nevertheless, the KF method and the improved methods based on it, such as extended Kalman filter (EKF) and unscented Kalman filter (UKF), are not suitable while the system is non-Gaussian. Bongjun applied a nonlinear, non-Gaussian Particle filter (PF) for engine health parameter estimation [22]. However, the estimation accuracy is limited by the low searching efficiency of PF methods in high-dimensional space, and the fact that the health parameters of the turbofan engine is bound to have a high-dimensional feature on account of the complexity of multiple component systems.
For the reasons mentioned above, a novel method for the performance estimation and fault diagnosis that is based on Levenberg–Marquardt(LM) algorithm is proposed. The real efficiency and flow rate of individual component are estimated via an LM algorithm, with the residual error between measurements from the sensors and predicted measurements from the diagnosis engine model being the objective function. The health parameters are calculated according to the estimated operating point and the clean characteristics map and can be used to classify various fault patterns in the abrupt fault case. The estimation of the thrust and surge margin of fan and compressor can be obtained form the diagnosis model, and it is expected to offer fundamental knowledge to performance recovery and fault-tolerant control scheme. Without generating the linearization error and decreasing the optimization efficiency seriously in high-dimensional space, the performance estimation is expected to be accurate. The innovations of this paper include that (1) an optimization based diagnosis structure is presented; (2) the actual value of the flow capacity and the efficiency that are unmeasurable can be estimated and monitored by the presented diagnosis method; (3) there is no need for the Gaussian hypothesis in the presented diagnosis structure and it can deal with the non-Gaussian system having Rayleigh process noise and Gaussian measurement noise.
This paper is organized as follows: Section 2 presents a brief review of the LM algorithm and introduces the involved turbofan engine; the application of LM algorithm in turbofan engine performance estimation and fault diagnosis is given in Section 3; the accuracy of the proposed method in the transient case is evaluated through a simulation in Section 4, and then the performance comparisons among the proposed method, EKF method and PF method in the abrupt fault case and the gradual degeneration case are implemented and discussed later; and Section 5 concludes this paper.
2. Preliminaries
In this section, in order to offer preliminaries pertinent to the presented novel Levenberg–Marquardt (LM) algorithm based performance estimation and fault diagnosis method for turbofan engine, the LM algorithm is reviewed briefly and the involved turbofan engine model is introduced.
2.1. Levenberg–Marquardt Algorithm
The Levenberg–Marquardt (LM) algorithm is an iterative technique that locates the minimum of a function that is expressed as the sum of squares of nonlinear functions. It has become a standard technique for nonlinear least-squares problems and can be thought of as a combination of steepest descent and the Gauss–Newton method [23]. Considering the least squares problem (1),
where is the error function and is the loss function. According to the Gauss–Newton algorithm, the iteration solution of the problem (1) can be obtained as follows:
where is the Jacobi matrix of at point . It can be easily verified that is the optimal solution of the following convex quadratic programming problem,
That is to say, the is obtained by minimizing the first-order approximation of the vector function at point . The approximation will be acceptable only if the magnitude of is small enough. For this purpose, the Levenberg–Marquardt algorithm adds a regular item to the objective function and the following optimal problem is obtained:
where is the regularization factor. According to the optimality condition, the optimal solution of the optimal problem (4) can be obtained as follows:
Thus, according to Levenberg–Marquardt algorithm, the iteration solution of the problem (1) can be described as follows:
2.2. Turbofan Engine Model
Turbofan engine, a reaction engine that utilizes high-speed gas flow for generating thrust according to Newton’s laws of motion is widely used in aerospace applications. On the basis of Zhou’s [24] contribution to the aircraft turbofan engine modelling, a model for twin-shaft turbofan engine is developed. The mechanical, aerodynamic and thermodynamic relationships among the components of the system are used to construct the simulation model. Data generated under different degradation degrees is used for evaluating the prediction capability of the proposed performance estimation and fault diagnosis method. The gas path and components of a twin-shaft turbofan engine are shown in Figure 1. The turbofan engine comprises nine main components: inlet, fan, bypass, compressor, combustor, high pressure turbine, low pressure turbine, mixer and nozzle. The inlet provides the fan with airflow. Some of the airflow leaving the fan passes through the engine core, and the other passes through the annular bypass duct. The fan is driven by low pressure turbine through low pressure spool. Airflow passing through the engine core moves through high pressure compressor, which is driven by high pressure turbine through high pressure spool. Fuel injected into a combustor is burned to provide hot gas for driving turbines. Gas leaving low pressure turbine is mixed with the air from the bypass duct. Then, the mixed gas passes through the nozzle, which has a variable cross section area. For each component, a separate model is constructed and the adjacent components experience the same cycle parameters at their interface, e.g., the cycle parameters at the outlet of combustor are equal to the parameters at the inlet of high pressure turbine.
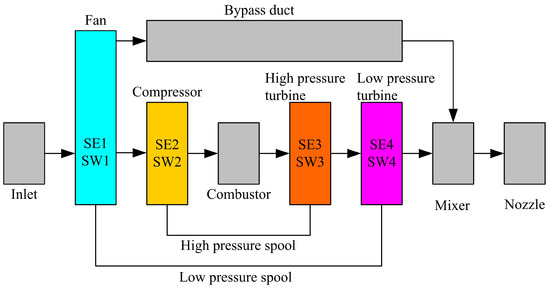
Figure 1.
Components of turbofan engine.
Because of the deteriorations of each gas path component, the turbofan engine performance would degrade during its operation. Compressor fouling, foreign object damage (FOD), blade erosion and corrosion, worn seals, blade tip clearance increase due to wearing, etc. are among the most common causes of degradations in an engine. Then, the thermodynamic performance of the turbofan engine can be changed by these degradations [25]. The four rotating components: the fan, the compressor, the high pressure turbine, and the low pressure turbine are the main fault components [26]. As a consequence, the other components painted in gray in Figure 1 are assumed to be trouble-free. If the four rotating components are clean, the performance of each rotating component is expressed by the characteristic maps. The efficiency and the flow capacity can be interpolated according to the relative spool speed and the pressure ratio. Furthermore, if failure occurs on the rotating components, the relation among the relative rotator speed, the pressure ratio, the efficiency, and the flow capacity disobeys the characteristic maps. In the existing literature, the component relative efficiency and relative flow capacity that are usually called health parameters are mostly used to represent the state or the condition of each component [27]. In this paper, the efficiency health parameter and the flow capacity health parameter are introduced to reflect the degeneration of the rotating components performance, which are defined as follows:
where the subscript denotes the fan, the compressor, the high pressure turbo and the low pressure turbo, respectively. is the actual efficiency and flow capacity of the ith component, and is the ideal efficiency and flow capacity of the ith component. The health parameters are marked in a corresponding component in Figure 1.
These unmeasurable health parameters are thermodynamically correlated with the measurable parameters including the spool speeds, outlet temperatures, outlet pressures, fuel flows [28]. These observable engine measurements can be used to find the changes of these unmeasurable parameters from their healthy state. Noise is added to the model output to ensure the model being as approximate as possible to the actual engine. The list of the selected measurable cycle parameters and the single-noise ratio of the sensors are given in Table 1.

Table 1.
Turbofan engine measurements, nominal value and single-noise ratio.
3. Proposed Fault Diagnosis Structure
The block diagram of the diagnosis method based on LM optimizer is depicted in Figure 2, where is the control vector from the controller, is the measurements from the sensors, is the predicted measurements from the diagnosis engine model, a component-level-model introduced in Section 2.2, , the estimation of , are optimal solution from the LM optimizer. The controller, the actuator and the sensors are assumed to be trouble-free and research about the the actuator health health management problem can be found in Khelassi’s work [29]. The measurement noise is considered in the sensors, and the fault is injected into the reference engine model, which is constructed for the simulation and represents the actual turbofan engine. The reference engine model is also a component-level-model, but the computing method of it differs from that of the diagnosis model. The difference between the reference engine model and the diagnosis engine model represents the model error. The steady model error and the dynamic model error are given in Table 2. When the relative low pressure spool speed accelerates from 0.8 to 0.95, the dynamic model errors of the low pressure spool speed and the high pressure spool speed are given in Figure 3. It is clear that the steady model error is less than 0.5% and the dynamic model error is less than 5%. It should be noticed that each rotating component’s efficiency and flow capacity of the diagnosis engine model are obtained from the LM optimizer rather than interpolated from the characteristic maps.
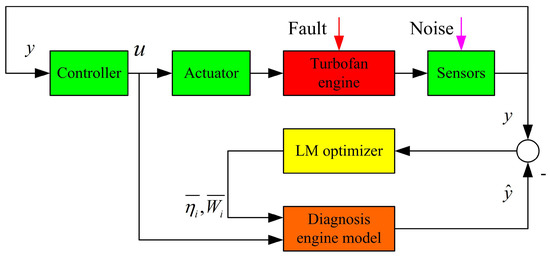
Figure 2.
The block diagram of the diagnosis method based on an Levenberg–Marquardt (LM) optimizer.
Table 2.
The steady model error and the dynamic model error between the reference engine model and the diagnosis engine model (%).
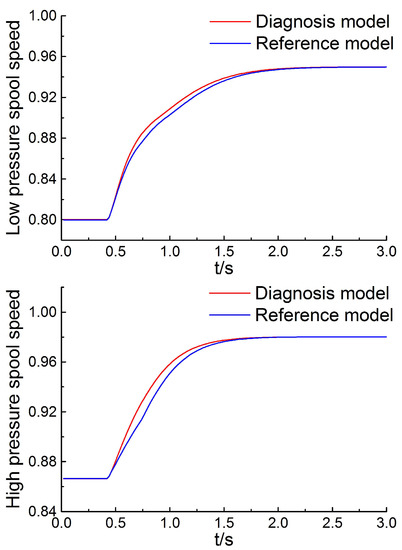
Figure 3.
Dynamic model error of low pressure spool speed and high pressure spool speed.
According to the estimated efficiency and flow capacity obtained from the LM optimizer, the ideal efficiency and flow capacity are figured out by utilizing the clean characteristic maps. Then, the health parameters can be calculated by definition (9). For example, the health parameters of fan, are obtained as follows. The relative low pressure spool speed is assumed to be 0.95. The clean characteristic line and fault characteristic line corresponding to the 0.95 relative low pressure spool speed are given in Figure 4, and the operating point is obtained from the LM optimizer. The ideal operating point can be solved through the auxiliary line shown in Figure 4. Then, , and .
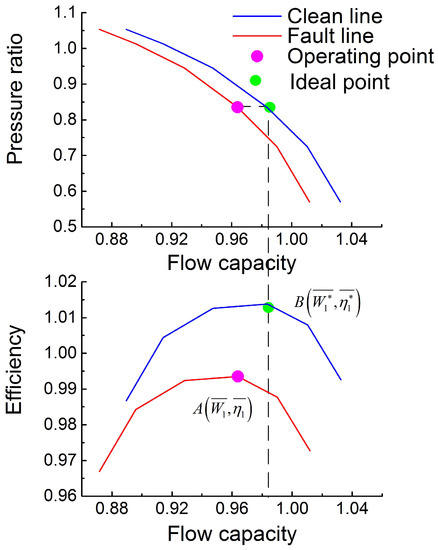
Figure 4.
Clean line, fault line, estimated point, and ideal point of fan characteristic maps.
Figure 5 depicts the flow chart of the proposed diagnosis method based on the LM algorithm. The estimated operating point in a component characteristic map is used to calculate the health parameters and estimate the thrust and surge margin of fan and compressor. In the abrupt fault case, the Euclidean distance between the calculated health parameters and the health parameters corresponding to various abrupt fault patterns can be used to classify the abrupt fault pattern. The classification criteria is given as follows:
where is health parameter corresponding to the abrupt fault pattern, is the calculated health parameter according to the estimated operating point, is the number of the abrupt fault patterns. The classification is determined by the Euclidean distance between and . If is closest to , it implies that the ith abrupt fault pattern occurs.
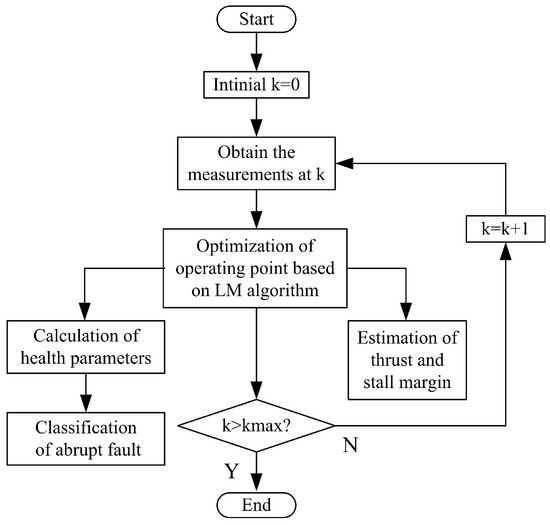
Figure 5.
The flow chart of the proposed diagnosis method based on the LM algorithm.
4. Simulation
In this section, the accuracy of the proposed method in the transient case is validated and the performance comparisons among the proposed method, EKF method and PF method in the abrupt fault case and the gradual degeneration case are implemented later. Both the process noise and measurement noise are considered to ensure that the reference model is as approximate as possible to the actual turbofan engine. The process noise is considered to be Rayleigh noise, a kind of non-Gaussian noise, and the probability distribution function (PDF) of Rayleigh distribution can be described as follows:
The mean and covariance of Rayleigh distribution are separately. The PDF of Rayleigh noise in this paper is moved left with to avoid the process noise being non-zero mean noise and is set to be 0.001. In addition, Gaussian noise is added to the clean simulated measurements from the reference engine model to make them be representative of real data obtained from sensors. The PDF of Gaussian distribution is described as follows:
The mean and covariance of Gaussian distribution are separately. In this paper, is set to be 0, and is decided by the single-noise ratio (SNR) in Table 1 as .
The software environment for all experiments is MATLAB 7.11 (MathWorks, Natick, MA, USA) and the hardware environment is an ordinary PC with an Intel Core i3-2100 processor (Intel, Santa Clara, CA, USA). In order to compare the performance, the definition of the rooted mean squared error is given as follows:
where is the actual value at the k step, is the estimation value of , and K is the number of simulation steps. Fifty trials are carried out for each case to obtain reliable statistical results.
4.1. Transient Case
The objective of the first case study is to test the accuracy of the proposed method under transient conditions. In this subsection, the dynamic state of the turbofan engine is simulated to evaluate the estimation accuracy under the transient case. The normalization fuel flow for the transient case is designed as Figure 6. During the interval 10–20 s, the fuel increases from 0.2 to 1, reflecting the acceleration of the engine, and, during the interval 30–40 s, the fuel decreases from 1 to 0.2, reflecting the deceleration of the engine. When the fuel is 0.2 and 1, the steady normalized low pressure spool speed is 0.63 and 1, respectively.
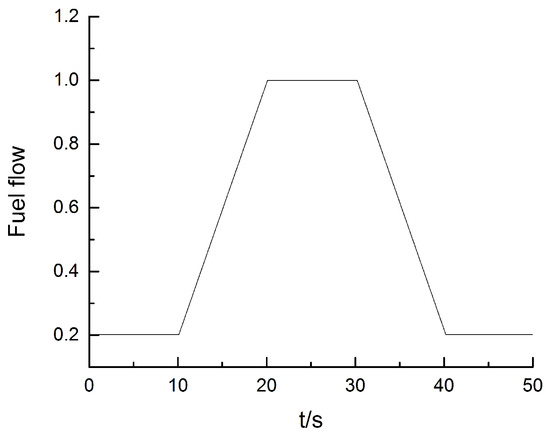
Figure 6.
The fuel flow schedule during the transient response.
From the tracks of the acceleration process and the deceleration process shown in Figure 7, it can be easily found that the proposed method has the ability to effectively estimate the actual value of efficiency and flow capacity in a wide operation range of the turbofan engine. Figure 8 depicts the fact that the RMSE is less than 0.3% for all measurements. The performance estimation results of the transient case are depicted in Figure 9, Figure 10 and Figure 11, and it is clear that the estimated performance parameters obtained from the diagnosis engine model are matched well with the actual reference performance parameters of the reference engine model. The RMSE of the thrust, the surge margin of fan, and the surge margin of compressor are 0.31%, 0.44%, 0.55%, respectively.
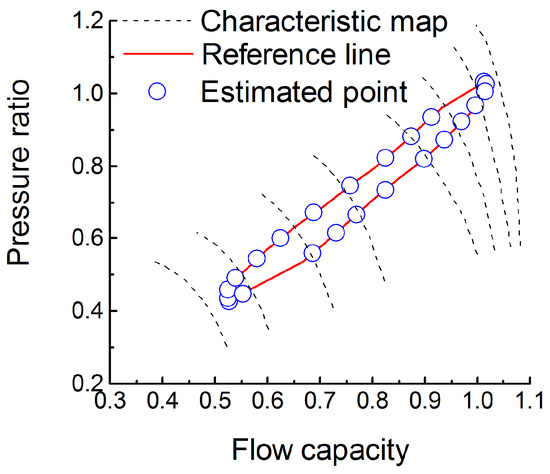
Figure 7.
The fan map trajectories during the transient response for the reference engine model and the diagnosis engine model.
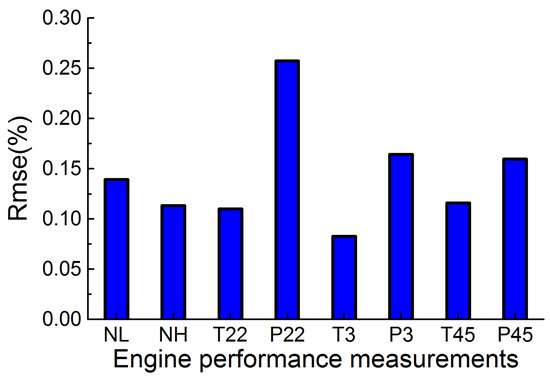
Figure 8.
RMSE of measurement parameters in the transient case.
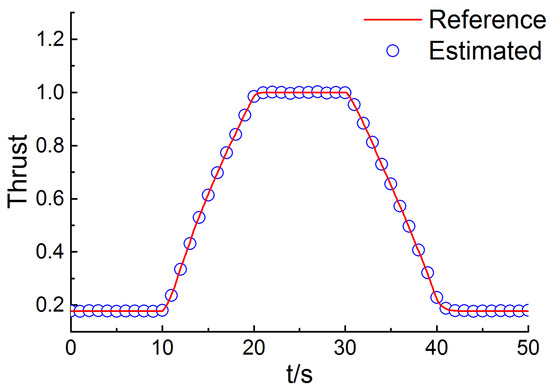
Figure 9.
Reference and estimated thrust in the transient case.
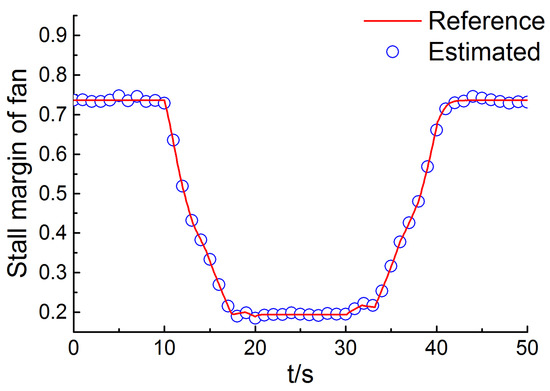
Figure 10.
Reference and estimated surge margin of fan in the transient case.
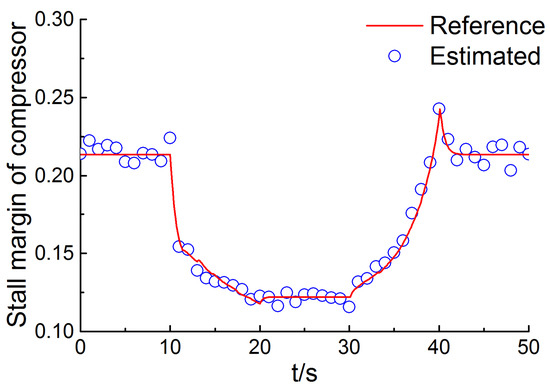
Figure 11.
Reference and estimated surge margin of compressor in the transient case.
The approach to carry out the optimization according to the measurements from the reference engine is described here. The simulation step size for the cases studied in this paper is set to 0.02 s, and this results in 2500 data samples for the 50 s simulation duration. The proposed estimation method is carried out for 500 operating points, that is to say for every five samples. The data resolution is selected in terms of the transient behavior of the turbofan engine. If the data resolution is reduced, the computational effort would be reduced. However, if the change rate of the engine state is higher than the sampling rate of the estimation, the accuracy of the proposed method will be affected.
The high estimation accuracy in the transient case motivates us to apply the proposed method in the abrupt fault case and the gradual degeneration case, which is described in Section 4.2 and Section 4.3.
4.2. Abrupt Fault Case
Considering foreign-object damage and domestic-object damage to the turbofan engine, 11 abrupt fault patterns are chosen [30] for testing the proposed method, and are given in Table 3. The EKF method and PF method are utilized for the performance estimation and diagnosis fault, and compared with the proposed method. The particle number of PF method in this paper is 50, and the process noise and measurement noise of three methods are set as described before.
Table 3.
Changes of the gas path health parameters of a certain type of engine under different gas path components’ faults.
Figure 12, Figure 13 and Figure 14 depict the performance estimation obtained through the proposed method, PF method, and EKF method, respectively. The serial number of the abrupt pattern injected at 10 s is b. As can be evidently seen in Figure 12 and Figure 13, the thrust and the surge margin of fan change suddenly at 10 s, and it is detected by the three methods. However, the magnitude of the surge margin of compressor change is too small to be detected. The accuracy of performance estimation through the three methods is given in Figure 15. The mean RMSE through the proposed method, PF method, and EKF method is 0.20%, 0.33%, 0.52%, respectively. The computation time corresponding to 50 s simulation duration is 33.4 s through the proposed method, while 19.2 s through the EKF method, and 31.4 s through the PF method. The computation load of the proposed approach is close to the PF method and can satisfy the real-time requirements in the abrupt fault case.
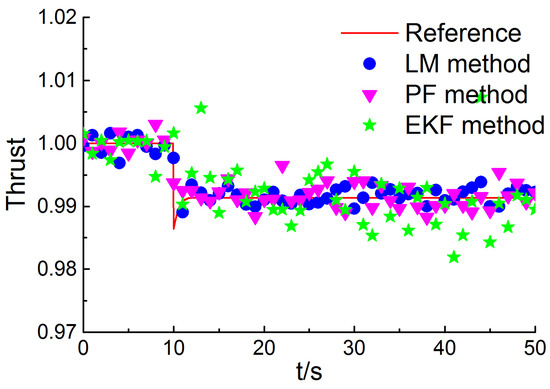
Figure 12.
Reference and estimated thrust in the abrupt fault case.
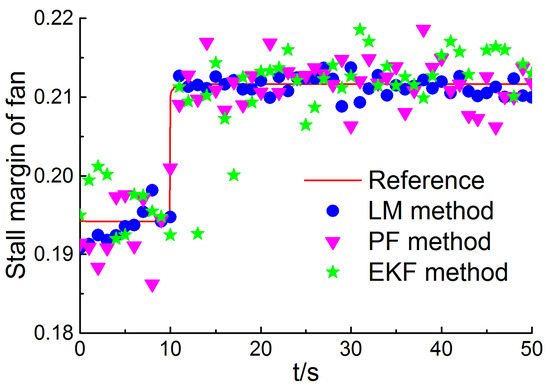
Figure 13.
Reference and estimated surge margin of fan in the abrupt fault case.
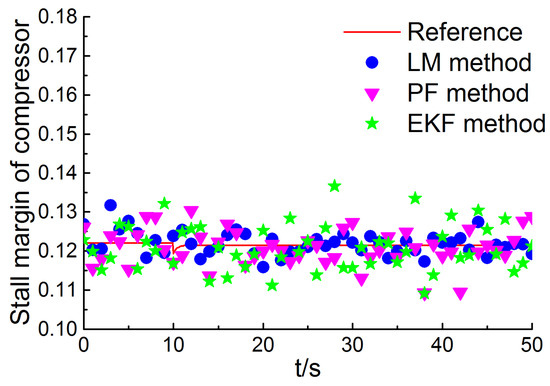
Figure 14.
Reference and estimated surge margin of compressor in the abrupt fault case.
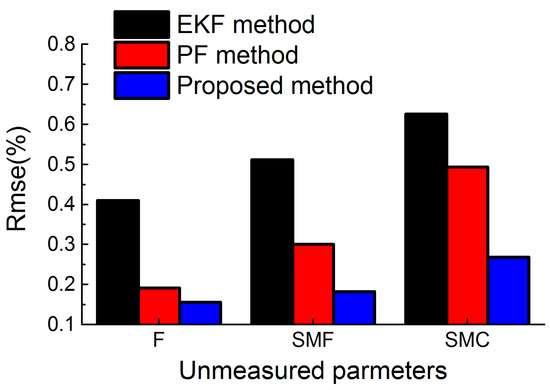
Figure 15.
RMSE of estimated performance parameters in the abrupt fault case.
Figure 16 depicts the classification correct rate of 11 fault patterns. The average correct rate of 11 fault patterns through three methods is 83.82%, 85.07%, 93.19%, respectively. The misdiagnosis rate of the proposed method decreases 57.91% compared with the EKF method, and decreases 54.39% compared with the PF method.
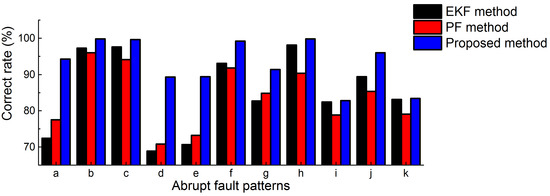
Figure 16.
The classification correct rate of 11 fault patterns.
4.3. Gradual Degeneration Case
In the full lifetime of the turbofan engine, the health parameters degenerate gradually since some reasons such as erosion and wear. Table 4 has shown the statistical date of the degeneration of health parameters in different flight cycle number, obtained by NASA in the Modular Aero Propulsion System Simulation (MAPSS) simulation platform [31]. Figure 17 depicts the health parameters estimation in the degeneration case obtained through the proposed method, PF method, and EKF method. The injected health parameters in Figure 17a–c is obtained through linear interpolation of the data in Table 4. It is clear that the proposed method performs better in the estimation of health parameters than the PF method and the EKF method. The accuracy of health parameters estimation through the three methods is given in Figure 18. The mean RMSE through the proposed method, PF method, and EKF method is 0.08%, 0.43%, 0.98%, respectively.
Table 4.
The statistical date of the degeneration (%) of health parameters in different flight cycle number, obtained by NASA in MAPSS simulation platform.
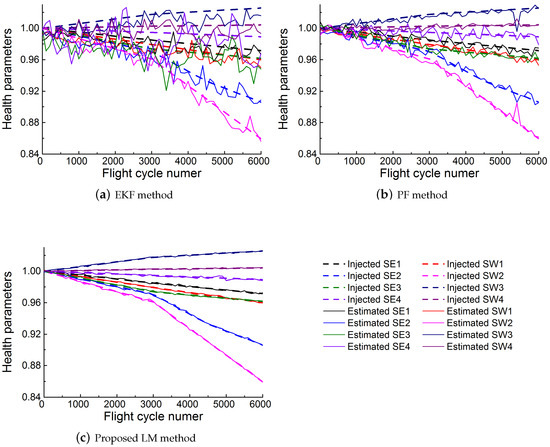
Figure 17.
Diagnosis results of (a) EKF method, (b) PF method, and (c) the proposed LM method.
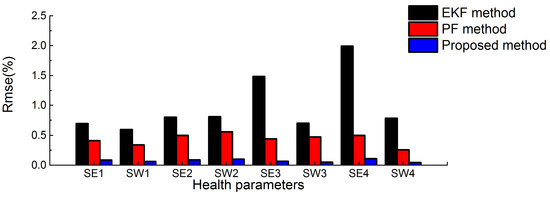
Figure 18.
The accuracy of health parameters estimation through the three methods.
Figure 19, Figure 20 and Figure 21 depict the performance estimation in the gradual degeneration case obtained through the proposed method, PF method, and EKF method. As can be found in Figure 19 and Figure 20, the thrust and the surge margin of fan decrease along with the gradual degeneration, which implies that the degenerated engine may not be able to provide sufficient thrust and work reliably. The accuracy of performance estimation through the three methods is given in Figure 22. The mean RMSE through the proposed method, PF method, and EKF method is 0.0686%, 0.5396%, 0.7368%, respectively.
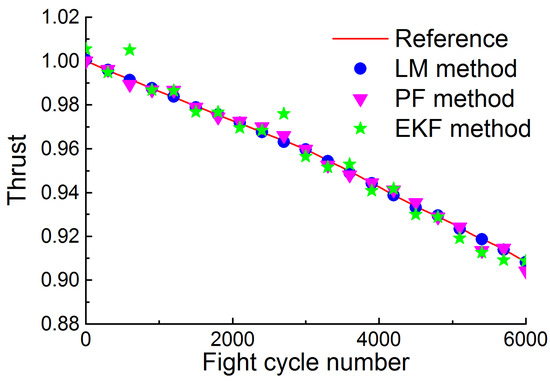
Figure 19.
Reference and estimated thrust in the gradual degeneration case.
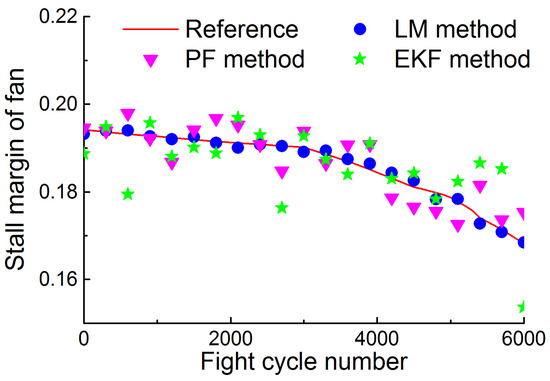
Figure 20.
Reference and estimated surge margin of a fan in the gradual degeneration case.
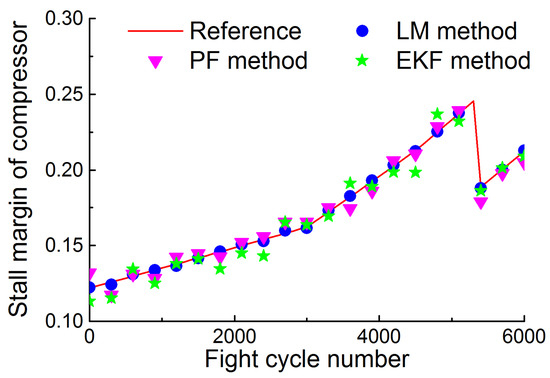
Figure 21.
Reference and estimated surge margin of a compressor in the gradual degeneration case.
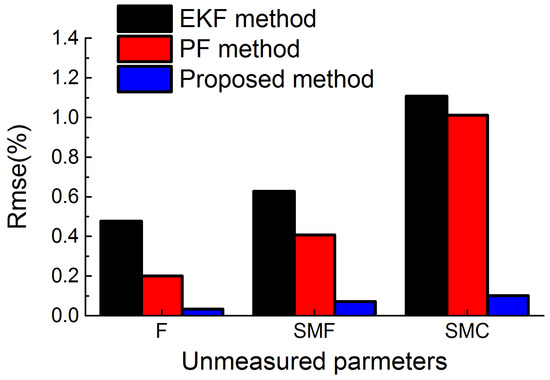
Figure 22.
RMSE of estimated performance parameters in the gradual degeneration case.
5. Conclusions
A diagnosis method based on the LM algorithm is proposed in this paper. The LM algorithm is utilized to estimate the operating point in the characteristic maps of each component. Then, the fault diagnosis and the performance estimation are implemented according to the estimated operating point. The steady and dynamic model error is considered in this paper and represented by the difference between two component-level-model with distinct computing methods. The process noise and measurement noise are represented by Rayleigh noise and Gaussian noise, respectively.
The accuracy of the presented method under the transient case is tested in the acceleration and deceleration of the turbofan engine. Then, the comparison among the EKF method, the PF method and the proposed method is implemented in the abrupt fault case and the gradual degeneration case. Compared to the EKF method, the PF method and the proposed method can perform with higher accuracy since they have more adaptability to the non-Gaussian system in terms of theory. According to the simulations on the fault diagnosis and the performance estimation, we can also see evidently that the result of the proposed method is much better than that of the PF method. It is due to the fact that the efficiency of the PF method is not as high as that of the proposed method in high-dimensional space and the turbofan engine described in this paper has eight health parameters that imply that the dimension is quite high.
In summary, the proposed method is effective to estimate the performance parameters of the turbofan engine and diagnose the fault in both the abrupt fault case and the gradual degeneration case. The non-Gaussian system is defined as a system with the non-normal process noise, the non-normal measurement noise, or both of them. In this paper, the non-Gaussian system has Rayleigh process noise and Gaussian measurement noise, and it would be interesting to discuss the proposed method of this paper in the non-Gaussian system with the other forms.
Acknowledgments
This research was founded by the National Natural Science Foundation of China (under Grant 51276087), Postgraduate Research & Practice Innovation Program of Jiangsu Province (under Grant KYCX17_0281) and Funding for Outstanding Doctoral Dissertation in Nanjing University of Aeronautics and Astronautics (NUAA) (under Grant BCXJ17_02).
Author Contributions
Jinquan Huang and and Feng Lu conceived the main idea, Jinquan Huang and Junjie Lu designed the diagnosis structure, Junjie Lu carried out the experiments, Feng Lu and Junjie Lu analyzed the data, and Feng Lu and Junjie Lu wrote the paper.
Conflicts of Interest
The authors declare no conflict of interest.
References
- Aretakis, N.; Roumeliotis, I.; Alexiou, A.; Romesis, C.; Mathioudakis, K. Turbofan engine health assessment from flight data. J. Eng. Gas Turbines Power 2015, 137, 1–8. [Google Scholar]
- Lee, J.; Wu, F.J.; Zhao, W.Y.; Ghaffari, M.; Liao, L.X.; Siegel, D. Prognostics and health management design for rotary machinery systems-Reviews, methodology and applications. Mech. Syst. Signal Process. 2014, 42, 314–334. [Google Scholar] [CrossRef]
- Stetter, R.; Witczak, M. Degradation Modelling for Health Monitoring Systems. In Proceedings of the Conference of Advanced Control and Diagnosis, Berlin, Germany, 13–14 November 2014. [Google Scholar]
- Larsson, E.; Aslund, J.; Frisk, E.; Eriksson, L. Gas turbine modeling for diagnosis and control. J. Eng. Gas Turbines Power 2014, 136, 1–17. [Google Scholar] [CrossRef]
- Simon, D.L.; Armstrong, J.B.; Garg, S. Application of an Optimal Tuner Selection Approach for on-Board Self-Tuning Engine Models. In Proceedings of the ASME Turbo Expo 2011: Power for Land, Sea and Air, Vancouver, BC, Canada, 6–10 June 2011. [Google Scholar]
- Shanmuganathan, V.K.; Haran, A.P.; Gayathri, N. Condition monitoring maintenance of aero-engines through LUMS-A method for the implementation of lean tools. Measurement 2015, 73, 226–230. [Google Scholar] [CrossRef]
- Zhu, S.P.; Huang, H.Z.; He, L.P.; Liu, Y.; Wang, Z.L. A generalized energy-based fatigue-creep damage parameter for life prediction of turbine disk alloys. Eng. Fract. Mech. 2012, 90, 89–100. [Google Scholar] [CrossRef]
- Zhu, S.P.; Huang, H.Z.; Peng, W.W.; Wang, H.K.; Mahadevan, S. Probabilistic physics of failure-based framework for fatigue life prediction of aircraft gas turbine discs under uncertainty. Reliab. Eng. Syst. Saf. 2016, 146, 1–12. [Google Scholar] [CrossRef]
- Zhu, S.P.; Huang, H.Z.; Smith, R.; Ontiveros, V.; He, L.P.; Modarres, M. Bayesian framework for probabilistic low cycle fatigue life prediction and uncertainty modeling of aircraft turbine disk alloys. Probab. Eng. Mech. 2013, 34, 114–122. [Google Scholar] [CrossRef]
- May, R.D.; Simon, D.L.; Tenhuei, G. Detection of the Impact of Ice Crystal Accretion in an Aircraft Engine Compression System During Dynamic Operation. In Proceedings of the AIAA Guidance, Navigation and Control Conference, Harbor, MD, USA, 13–17 January 2014. [Google Scholar]
- Li, Y. Aero Gas Turbine flight performance estimation using engine gas path measurements. J. Propul. Power 2015, 31, 851–860. [Google Scholar] [CrossRef]
- Doel, D.L. An Assessment of Weighted-Least-Squares Based Gas Path Analysis. In Proceedings of the International Gas Turbine and Aeroengine Congress and Exposition, Cincinnati, OH, USA, 24–27 May 1993. [Google Scholar]
- Xiao, H.; Xu, Z.Z.; Kim, L.S.; Li, D.Y.; Lyu, S.K. Optimization scheme of genetic algorithm and its application on aeroengine fault diagnosis. Int. J. Precis. Eng. Man. 2015, 16, 735–741. [Google Scholar] [CrossRef]
- Sarkar, S.; Jin, X.; Ray, A. Data-Driven Fault Detection in Aircraft Engines with Noisy Sensor Measurements. J. Eng. Gas Turbines Power 2011, 133, 1–10. [Google Scholar] [CrossRef]
- Rasaienia, A.; Moshiri, B.; Moezzi, M. Feature-based fault detection of industrial gas turbines using neural networks. Turk. J. Electr. Eng. Comput. Sci. 2013, 21, 1340–1350. [Google Scholar] [CrossRef]
- Sadough-Vanini, Z.N.; Meskin, N.; Khorasani, K. Multiple-Model Sensor and Components Fault Diagnosis in Gas Turbine Engines Using Autoassociative Neural Networks. J. Eng. Gas Turbines Power 2014, 136, 1–16. [Google Scholar] [CrossRef]
- Panov, V. Auto-tuning of real-time dynamic gas turbine models. In Proceedings of the ASME Turbo Expo 2014: Turbine Technical Conference and Exposition, Dusseldorf, Germany, 16–20 June 2014. [Google Scholar]
- Abbasfard, Z.; Baniamerian, A.; Khorasani, K. Fault Diagnosis of Gas Turbine Engines: A Symbolic Multiple Model Approach. In Proceedings of the 2014 European Control Conference, Strasbourg, France, 24–27 June 2014. [Google Scholar]
- Hanachi, H.; Jie, L.; Banerjee, A.; Ying, C. A framework with nonlinear system model and nonparametric noise for gas turbine degradation state estimation. Meas. Sci. Technol. 2015, 26, 1–12. [Google Scholar] [CrossRef]
- Simon, D.L.; Garg, S. Optimal Tuner Selection for Kalman Filter-Based Aircraft Engine Performance Estimation. In Proceedings of the ASME Turbo Expo 2009: Power for Land, Sea and Air, Orlando, FL, USA, 8–12 June 2009. [Google Scholar]
- Kobayashi, T.; Simon, D.L.; Litt, J.S. Application of a Consiant Gain Extended Kalman Filter for In-Flight Estimation of Aircraft Engine Performance Parameters. In Proceedings of the ASME Turbo Expo 2005: Power for Land, Sea and Air, Reno-Tahoe, NV, USA, 6–9 June 2005. [Google Scholar]
- Bongjun, Y.; Sengupta, P.; Menon, P.K. Turbine Engine Performance Estimation Using Particle Filters. In Proceedings of the 53rd AIAA Aerospace Sciences Meeting, Kissimmee, FL, USA, 5–9 January 2015. [Google Scholar]
- Aytek, A. Co-active neurofuzzy inference system for evapotranspiration modeling. Soft Cpmput. 2015, 13, 691–700. [Google Scholar] [CrossRef]
- Zhou, W.; Huang, J.; Dou, J.; Shen, F. Object oriented simulation platform for turbofan engine and its control system. J. Aerosp. Power 2007, 22, 119–125. [Google Scholar]
- Kiakojoori, S.; Khorasani, K. Dynamic neural networks for gas turbine engien degradation prediction, health monitoring and prognosis. Neural Comput. Appl. 2016, 27, 2157–2192. [Google Scholar] [CrossRef]
- Tsoutsanis, E.; Meskin, N.; Benammar, M.; Khorasani, K. Transient Gas Turbine Performance Diagnostics through Nonlinear Adaptation of Compressor and Turbine Maps. J. Eng. Gas Turbines Power 2015, 137, 1–12. [Google Scholar] [CrossRef]
- Hanachi, H.; Liu, J.; Banerjee, A.; Chen, Y.; Koul, A. A Physics-Based Modeling Approach for Performance Monitoring in Gas Turbine Engines. IEEE Trans. Reliab. 2015, 64, 197–205. [Google Scholar] [CrossRef]
- Simon, D.L. Sensor Selection for Aircraft Engine Performance Estimation and Gas Path Fault diagnostics. In Proceedings of the ASME Turbo Expo 2015: Turbine Technical Conference and Exposition, Montreal, QC, Canada, 15–19 June 2015. [Google Scholar]
- Khelassi, A.; Theilliol, D.; Weber, P.; Ponsart, J.C. Fault-tolerant control design with respect to actuator health degradation: An LMI approach. In Proceedings of the 2011 IEEE International Conference on Control Applications, Denver, CO, USA, 28–30 September 2011. [Google Scholar]
- Borguet, S.; Leonard, O. Comparison of adaptive filters for gas turbine performance monitoring. J. Comput. Appl. Math. 2010, 234, 2202–2212. [Google Scholar] [CrossRef]
- Decastro, J.A.; Litt, J.S.; Frederick, D.K. A Modular Aero-Propulsion System Simulation of a Large Commercial Aircraft Engine. In Proceedings of the 44th AIAA/ASME/SAE/ASEE Joint Propulsion Conference & Exhibit, Hartford, CT, USA, 21–23 July 2008. [Google Scholar]
© 2018 by the authors. Licensee MDPI, Basel, Switzerland. This article is an open access article distributed under the terms and conditions of the Creative Commons Attribution (CC BY) license (http://creativecommons.org/licenses/by/4.0/).