Article

Esterification Optimization of Crude African Palm Olein Using Response Surface Methodology and Heterogeneous Acid Catalysis

by
Francisco Anguebes-Franseschi
1,
Mohamed Abatal
2,
Ali Bassam
3,*,
Mauricio A. Escalante Soberanis
3,
Oscar May Tzuc
3,
Lauro Bucio-Galindo
4,
Atl Victor Cordova Quiroz
1,
Claudia Alejandra Aguilar Ucan
1 and
Miguel Angel Ramirez-Elias
1
1
Facultad de Química, Universidad Autónoma del Carmen, Calle 56 No. 4 Esq. Av. Concordia, Col. Benito Juárez, Ciudad del Carmen 24180, Campeche, Mexico
2
Facultad de Ingeniería, Universidad Autónoma del Carmen, Campus III, Avenida Central S/N, Esq. con Fracc. Mundo Maya, Ciudad del Carmen 24115, Campeche, Mexico
3
Facultad de Ingeniería, Universidad Autónoma de Yucatán, Av. Industrias no Contaminantes por Periférico Norte, Apdo, Postal 150 Cordemex, Merida 97000, Yucatan, Mexico
4
Instituto de Física, Universidad Nacional Autónoma de México, Circuito de la Investigación Científica Ciudad Universitaria, Mexico D.F. 04510, Mexico
*
Author to whom correspondence should be addressed.
Energies 2018, 11(1), 157; https://doi.org/10.3390/en11010157
Submission received: 7 October 2017 / Revised: 4 November 2017 / Accepted: 8 December 2017 / Published: 9 January 2018
(This article belongs to the Collection Bioenergy and Biofuel)

Abstract

:
In this work, the effect of zeolite montmorillonite KSF in the esterification of free fatty acids (FFAs) of crude African palm olein (Eleaias guinnesis Jacq) was studied. To optimize the esterification of FFAs of the crude African palm olein (CAPO), the response surface methodology (RSM) that was based on a central composite rotatable design (CCRD) was used. The effects of three parameters were investigated: (a) catalyst loading (2.6–9.4 wt %), (b) reaction temperature (133.2–166.2 °C), and (c) reaction time (0.32–3.68 h). The Analysis of variance (ANOVA) indicated that linear terms of catalyst loading (X1), reaction temperature (X2), the quadratic term of catalyst loading ( X 1 2 ), temperature reaction ( X 2 2 ), reaction time ( X 3 2 ), the interaction catalyst loading with reaction time ( X 1 * X3), and the interaction reaction temperature with reaction time ( X 2 * X3) have a significant effect (p < 0.05 with a 95% confidence level) on Fatty Methyl Ester (FAME) yield. The result indicated that the optimum reaction conditions to esterification of FFAs were: catalyst loading 9.4 wt %, reaction temperature 155.5 °C, and 3.3 h for reaction time, respectively. Under these conditions, the numerical estimation of FAME yield was 91.81 wt %. This result was experimentally validated obtaining a difference of 1.7% FAME yield, with respect to simulated values.

1. Introduction

Fossil fuels such as oil, coal, and gas represent the main energy source worldwide. However, these turn out to be limited resources and contribute to environmental pollution and global warming.This scenario demands policies that stimulate the use of renewable and sustainable energy sources in order to mitigate these effects [1,2]. In this context, biodiesel has been glimpsed as a viable replace respect to engine conventional fuels. Among the several biodiesel alternatives, the use of Fatty Methyl Ester (FAME) in combustion engines can be found [3]. Biodiesel has advantages over conventional diesel fuel, such as it can be obtained from oils and animal fats; also, it is biodegradable, non-toxic, and environmentally sustainable, avoiding incorporate new CO2 to the carbon cycle [4,5].
Currently, the biggest obstacle to the substitution of conventional diesel by the biodiesel is its high costs, where the feedstock represents 75% of its manufacturing cost [6]. Therefore, it is necessary to use lower-cost feedstocks in its manufacture. Among the alternatives for producing biodiesel at a reasonable cost, are the cooking vegetable oil, agricultural waste, animal fats, and unrefined vegetable oils [7,8]. For example, the cost of biodiesel made from used cooking oil and animal fats waste is estimated between $0.09–$0.20 USD per pound [9]. The cost of biodiesel from crude African palm oil has been estimated between $0.49 and $0.53 USD per liter [10]. Unfortunately, those feedstocks have a high content of free fatty acids (FFAs) which present soap formation during the process of conventional direct base-catalyzed transesterification, making their use not viable [11]. As an alternative, the use of a multistep process allows employing feedstocks with high FFAs concentrations by first carrying out the acid-catalyzed pre-esterification of the FFAs prior to the base-catalyzed triglycerides transesterification [12].
The usual esterification procedure implies the use of p-toluene sulphonic acid, sulfuric, hydrochloric, and phosphoric acids as a catalyst. However, the use of these catalysts has several disadvantages: (a) during the esterification reaction water is generated, favoring the reversibility of the reaction, which lowers the yield of methyl esters; (b) these acids are highly corrosive, which reduces the lifetime of the equipment used in the process; (c) toxic wastes that are harmful to the environment are generated; and, (d) costs of purification of biodiesel are high increasing the biodiesel cost [13]. Another method that can be used for esterification of FFAs is the supercritical process. Its main advantages consist of reduce mass-transfer limitations and improve the phase solubility. Furthermore, the reaction rate is augmented, completing it in shorter periods and simpler separations and purification of FAME [14]. Nevertheless, to present satisfactory FAME yield the supercritical method needs high molarity of alcohol to oil and high pressure and temperature conditions for the reaction. This implies high processing costs and causes the degradation of the fatty acids esters formed [15].
A very attractive alternative to carry out the esterification of FFAs is the use of heterogeneous catalyst systems, which include cationic-exchanged resins. Examples of these resins are Amberlyst-15, metal oxides, heteropolyacids supported on silica and carbon, aluminophosphates, and silicoalumino-phosphate molecular sieves and clays [16]. The clays have presented a substantial interest in several organic syntheses as catalysts [17]. Among these, the montmorillonite possesses both Lewis and Brönsted acidities sites. Due to these properties, there is particular interest in using montmorillonite as catalysts in the biodiesel manufacture, as they have several advantages: (a) availability and low cost; (b) environmental compatible; (c) easy recovered by filtration and reusable; (d) high selectivity and thermal stability; and, (e) allow the development of continuous processes to increase the production volume of biodiesel, which reduces manufacturing costs. In particular, the montmorillonite KSF (commercial name for clays activated with acid treatment) presents high concentrations of Lewis and Brönsted acid sites, thus oil esterification can be employed with high FFAs concentrations [18].
The esterification reaction of FFAs is represented by the following reversible chemical equation
CnHmCOOH   +   CH 3 OH   C a t a l y s t   CnHmCOOOCH 3   +   H 2 O
This reaction is affected by temperature changes, reaction time, and the change of catalyst and alcohol concentrations. These variations can enhance or reduce the FFAs to FAME conversion. For this reason, it is important to evaluate the effect of the process variables to determine the optimal reaction conditions of FFAs to FAME conversion and to maximize the yield and reduce costs in the manufacture of biodiesel. It is also necessary to develop the experimental design Response Surface Methodology (RSM) and a quadratic model to calculate the best fit. The RSM is a group of mathematical and statistical tools of important use in the modeling, analysis and optimization problems. The response of interest is influenced by various factors in RMS [11]. In this methodology, a suitable experiment can significantly reduce the number of tests, and provide the information needful for process optimization. The RSM uses polynomial models to characterize the response of the surface [19].
The RSM has been widely reported as a suitable tool for the modeling and optimization of biodiesel yield, for example: Jahirul et al. [11] used RSM based in a Box-Behnken design to determine a method to optimize the biodiesel production process from beauty-leaf oil. The authors considered catalyst concentration, methanol to oil molar ratio and reaction temperature as the main factors in the conversion process. FFAs and FAME concentration prediction and reaction conditions optimization were achieved through linear and full quadratic regression models. Ali et al. [20] investigated on fuel properties and engine performance of blended palm biodiesel-diesel using diethyl ether as an additive. The independent variables considered were the engine revolution per minute and the diethyl ether blend. A design of experiment based on RSM was employed to optimize the fuel properties viscosity, density, acid value, heating value, pour point, and cloud point. Corral Bobadilla et al. [21] used RSM to improve the production of biodiesel by finding the best combination of input variables used in the transesterification reactions. Various biodiesel optimization scenarios were proposed based on the objective to improve the biodiesel production and higher heating value, and decrease the viscosity, density, and turbidity. Omar et al. [22] used the RSM to study the relationship of different variables in the waste palm cooking oil heterogeneous transesterification to biodiesel by Sr/ZrO2 catalyst.
According to Ramos et al. [23], soybean, canola, sunflower, and African palm (Elaeis guinnensis Jacq) oils are the most widely used for the production of biodiesel in the world. The African palm is an oil-producing species, its expansion around the world is due to its easy adaptation to tropical environments. The high oil content that has its fruit allows for yields of 5.5 ton ha−1, generating the decrease of production costs. This makes the crude African palm oil (CAPO) a viable option for its use as raw material in the manufacture of low-cost biodiesel [24]. The main producing CAPO countries in the world are Malaysia, Indonesia, Thailand, Nigeria, and Colombia, among others. In Mexico, the African palm cultivation takes place in the states of Chiapas, Campeche, Tabasco, and Veracruz with 54,434.00 ha planted in 2010 [24]. There is a significant possibility to project 2.5 million ha of African palm plantation in these areas. Based on these conditions, the African palm may be considered as a potential alternative to increasing the manufacture of biodiesel in Mexico [25].
The objective of this study is to evaluate the efficiency of the montmorillonite KSF for the esterification of the FFAs present in the CAPO. Furthermore, the determination the optimal reaction conditions that yield the optimization of FFAs to FAME conversion at a laboratory level, through the application of a central composite rotatable design (CCRD) and RSM techniques.

2. Materials and Methods

2.1. Materials

The materials that were used in this study are methanol, anhydrous ethanol (Fermont 99.9%), potassium hydroxide (Fermont 98.4%), phenolphthalein (Mallinckrodt, Dublin, Ireland), and montmorillonite KSF (Sigma-Aldrich, St. Louis, MO, USA). CAPO was provided by the company AGROIPSA (Palenque, Chiapas, Mexico). The chemical analysis indicated that the CAPO presented a concentration of 9.87 wt % of FFAs.
The esterification reaction was carried out by using a batch-type tube reactor (200 mL and external diameter = 38.1 mm) made of glass (Vineland). The esterification reaction used a molar ratio methanol/oil 12:1 and a palm oil quantity of 20 g for each experiment. Initially, oil, methanol, and montmorillonite KSF were charged into the tube reactor. The tube reactor was immersed in an oil bath. Previously, the bath oil was preheated to the reaction temperature of each experiment. A mercury thermometer was used to measure the temperature of the oil bath. The stirring and heating of the mixture of reactants and heating oil bath were performed using a magnetic hot plate stirrer with a digital temperature controller (Thermoscientific, Waltham, MA USA). After a fixed reaction period, the tube reactor will be transferred into another oil bath (30 °C), in order to quench the reaction immediately (5 min) due to the short extern diameter of the reactor. The mixture reaction products containing clay, methanol, water, FAME, and unreacted triglycerides. The mixture was filtered through Whatman filter paper #40 to recover the clay. To remove methanol and water from the mixture obtained by filtration, this was subjected to vacuum evaporation using a Yamato rotary evaporator Re-801, under the following operating conditions: Rotation speed of 220 rpm, a vacuum pressure of 480 mm Hg and temperature of 80 °C in water bath. Finally, the mixture that was obtained from the evaporation contains FAME and unreacted triglyceride was transferred into test tubes to determine acid. The experimental conversion (yield) of FFAs to FAME Yexp can be calculated by Equation (1):
Y exp = ( 1 V 1 V 0 ) × 100 %
where V0 and V1 are the acid values of feed and products, respectively. The acid value was determined by the method developed by Aricetti et al. [26]. This novel method presents the main advantages of being less expensive and nontoxic since it uses ethanol and water as solvents. Besides, the evaluation of this method exhibited a similar accuracy and it is comparable to the official method AOCS Cd 3d-63 [27], since there is no statistically significant difference between both.

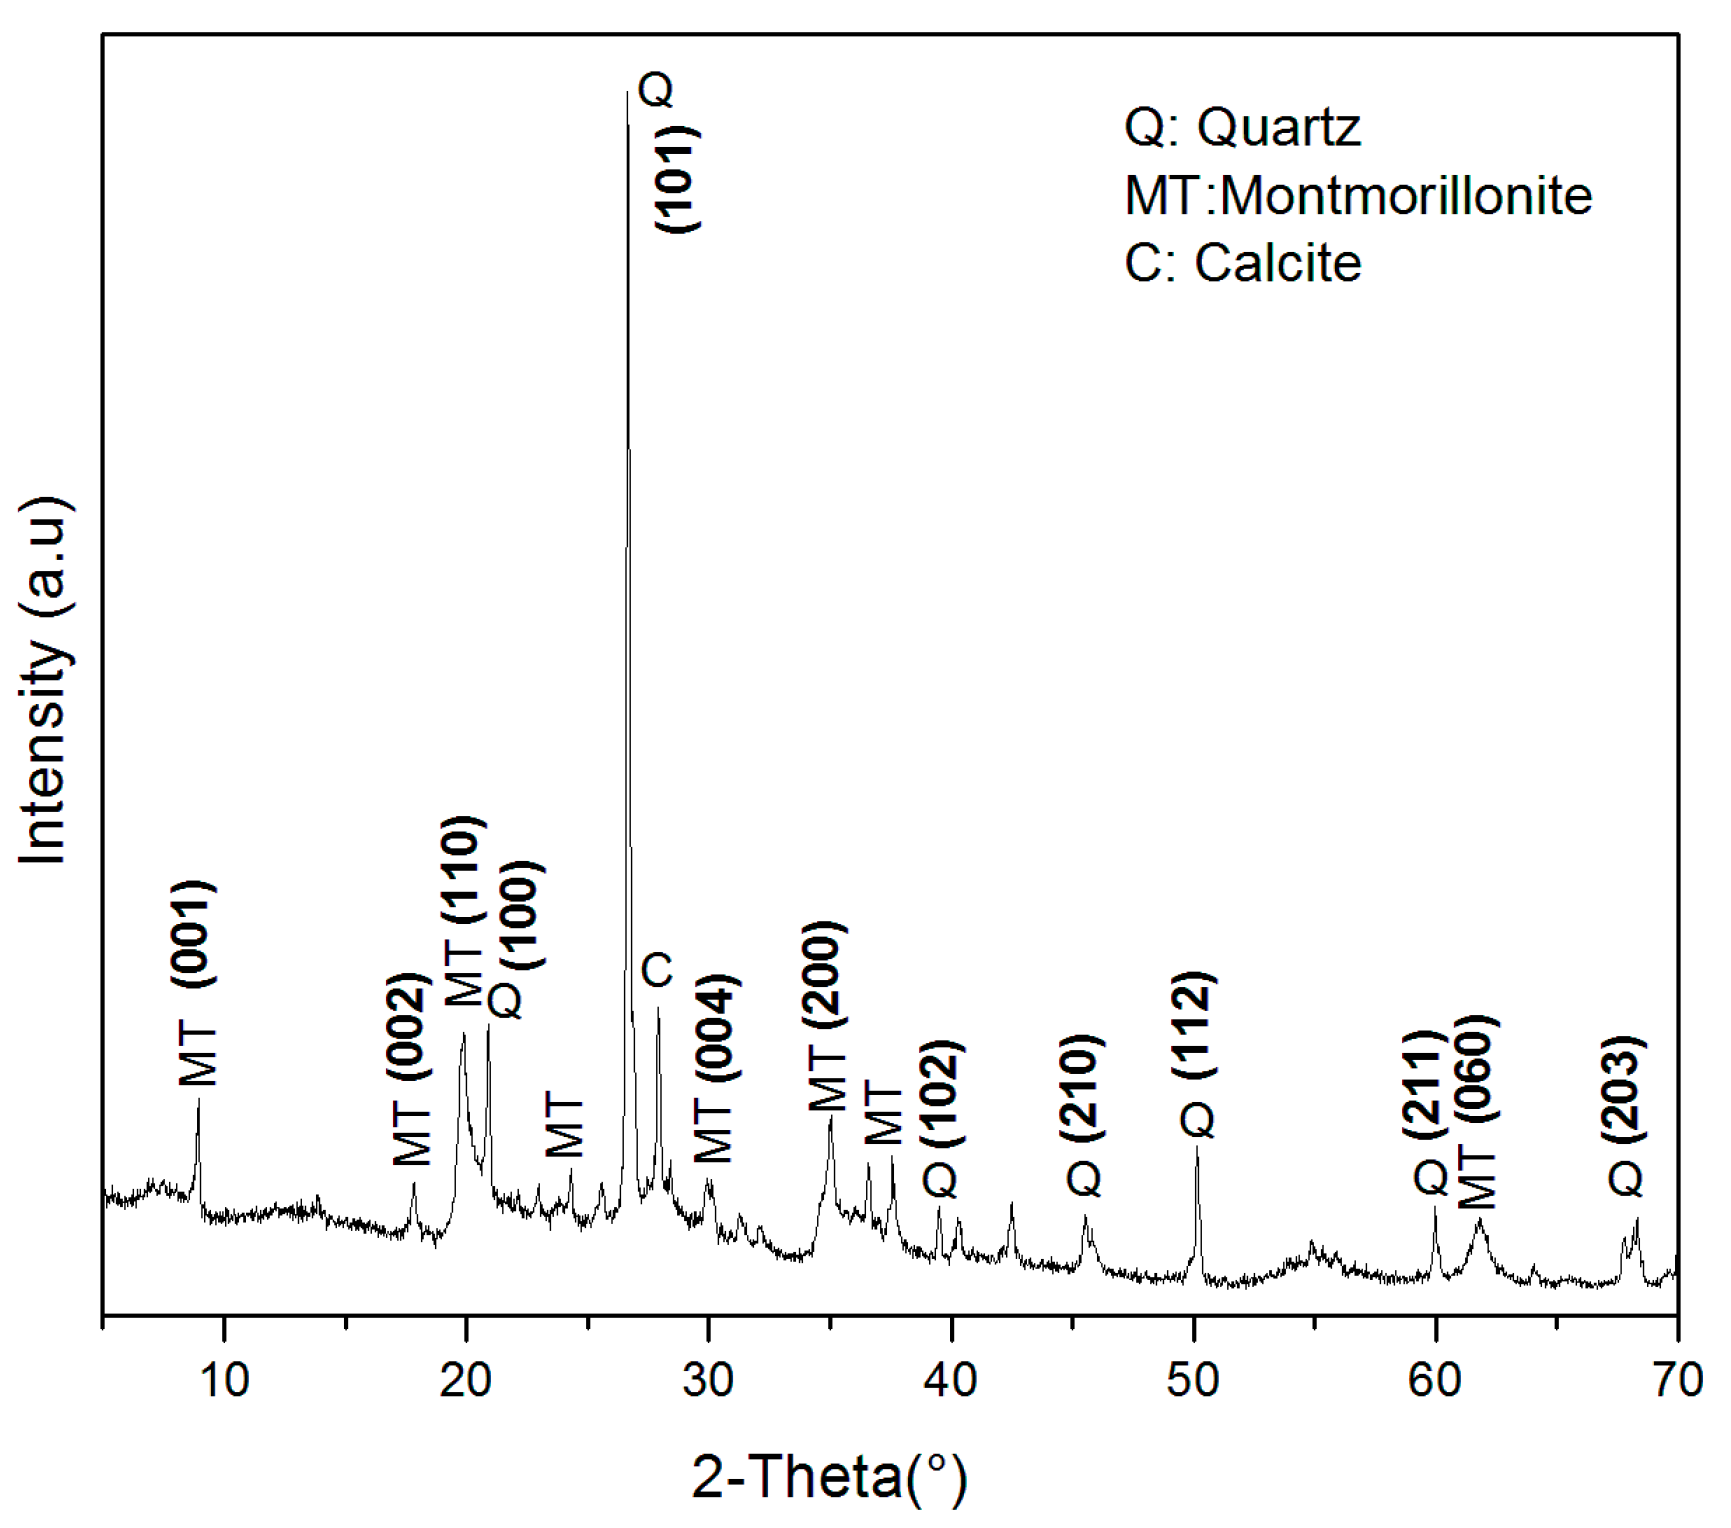
2.2. Characterization of MT-KSF Catalyst

X-ray diffraction analysis (XRD) is a widely used method to characterize catalyst in different materials. XRD analysis was performed in the laboratory using an APD 2000 PRO X-Ray diffractometer with CuKα radiation (λ = 1.5405 Å). The patterns for of Montmorillonite-KSF (MT-KSF) sample was recorded in the 2θ range of 5° to 75° with a scanning speed of 0.025 deg s−1 and time steps of 10 s. The obtained crystalline phases of the sample were identified by comparison with Joint Committee of the Power Diffraction Standards (JCPDS) cards.
Scanning electron microscopy analysis (SEM) is used to study the morphological features and surface characteristics of MT-KSF sample. Chemical composition was determined by energy-dispersive X-ray spectroscopy at different points on the surface of the samples. SEM-EDS analysis was performed using HITACHI S-3400N Microscope instrument. The working conditions of SEM-EDS were 10 kV for the energy dispersive analysis, with a current intensity of 30 pA, and a work distance of 10.6 mm. The infrared spectroscopy analysis of the MT-KSF sample was conducted using an Agilent Cary 660 infrared spectrometer with ATR imaging with diamond crystal design (Gladi Pike). The equipment was operated within a range from 4000 to 400 cm−1, with a resolution of 4 cm−1 in a KBr wafer.
X-ray diffraction: XRD pattern of the MT-KSF sample is illustrated in Figure 1. It can be observed the natural clay presence of the main reflections at 2θ = 8.90°, 17.71°, 19.85°, 27.95°, 37.60°, and 61.88°, which correspond to the crystalline structure of the MT-KSF reported in the JCPDS standards (00-025-1349 card). Minor amounts of quartz at 2θ = 20.91°, 26.56°, 39.43°, 45.58°, 50.05°, 59.89°, 68.24° (JCPDS 01-085-0504) and Calcite at 2θ = 28.04° were also found.
Scanning Electron Microscopy and Energy Dispersive X-ray Spectroscopy (SEM/EDS): SEM image of MT-KSF sample is given in Figure 2. It can be observed that the surface morphology demonstrates a layered surface with some flakes, which is the typical structure of montmorillonite. Moreover, the surface of the clay does not have homogeneous dispersion and the most crystals display characteristic monoclinic symmetry, where many of them are fluffy-shaped. This confirms the results obtained by XRD analysis.
The Chemical composition of the MT-KSF sample was determined by the EDS. The results of the punctual analysis at different zones Figure 2a,b are showed in Table 1. The total weight percentage indicates that the chemical elements constituting the montmorillonite KSF are: oxygen, magnesium, aluminum, silicon, sulfur, potassium, calcium, and iron. On the other hand, it was found that oxygen, silicon, aluminum, and sulfur are the most abundant elements in the clay, with 72.49%, 12.12%, 5.77%, and 5.32% weight, respectively. In addition, the average elemental composition of clay (Table 2) tested that the ratio Si/Al is about 2.62 characteristic to MT-KSF.
The EDS analysis indicates that the MT-KSF presents high percentages of oxygen, silicon, aluminum, and sulfur in the clay, contributing to the formation of Al–O–Si, Al–O–H, and S–OH, Si–O–H chemical bonds that constitute the skeleton of the clays [28,29,30]. The presence of these chemical bonds was confirmed by infrared spectroscopy analysis. These chemical bonds forming Lewis and Brönsted acid sites, the molar ratio of Si/Al relate the amount of acid sites present in the clay. Low values of this ratio (Si/Al) indicate that the MT-KSF has high catalytic activity [28,29,30,31,32].

2.3. Response Surface Methodology (RSM)

RSM is a technique based on the design of experiments (DOE) that is used to establish the relationship between independent variables and one or more dependent variables [33]. It is useful for modeling, analysis, and optimization industrial process and products [34,35]. RMS consist of statistical methods that use a polynomial model that relies on a low degree polynomial function Equation (2):
Y mod = f ( X 1 , X 2 , X 3 , ..... , X k ) + ε
where Ymod represents the relationship of the response variables, f is a function of cross-products of the polynomial’s terms, X1, X2, X3 …. Xk are the independent variables, and ε is the noise or error. The quadratic model is a polynomial function for predicting the optimal points is expressed as follows:
Y mod = β 0 + i = 1 k β i X i + i = 1 k β i i X i 2 + j = 2 k i = 1 k β i j X i X j + ε
where Ymod represents the value of the predicted response, β0, βi, βii, and βij are the regression coefficient (β0 is the intercept coefficient (offset), βi is the linear effect term, βii is the pure quadratic terms, and βij is the interaction effect term), Xi, Xj, and X i 2 are the independent variables, and k is the total number of independent variables, ε is a random error. The second order model equation, RSM and contour plots were used to predict the optimum value and to analyze the interaction between response (Y) and the variables of the process. The second order model equation is recommended since the reaction rate of esterification of FFAs is governed by the second order reversible reaction [36,37].
The value of p (p-value) is a statistical parameter, which indicates the significant effect of an independent variable on the dependent variable [5]. If p-value < 0.05, then the variable is significant in the process. The p-value (or Prob > F), computed by an analysis of variance (ANOVA), is used to determine the probability of generating a result equal or greater than the observed. If it exceeds the model’s F and the model has no terms that exceed the significance level (e.g., p = 0.05) it will suffice with a confidential interval of 1–p [21].
In order to generalize the capacity prediction of the model the Mean Absolute Percentage Error (MAPE, which is the computed average of errors (%) by estimating the predictions of a variable), Root Mean Square Error (RMSE, used to compute the differences between estimated and observed values), and the adjusted determination coefficient (Radj2, a statistical measure that indicates the proportion of variation explained by the estimated regression line and that determine the predictive capacity of the model rigorously between 0 and 1) are calculated [38]:
M A P E = i = 1 m | Y mod Y exp Y exp | m × 100
R M S E = i = 1 m ( Y mod Y exp ) 2 m
R a d j 2 = 1 ( i = 1 m ( Y exp Y mod ) i = 1 m ( Y exp Y exp ) ) [ m 1 m ( k + 1 ) ]
in this case, Yexp represents the experimental response, Ymod is the model output, Y exp is the average experimental value, m represents the experiments produced, and k the number of independent variables.

2.4. Experimental Design

In this work, a central composite rotatable design (CCRD) [33] was used to study the effect of three factors on the FAME yield: the catalyst loading (X1), reaction temperature (X2), and reaction time (X3). The study was carried out in a total of 20 experiments with triple repetition, previously randomized. The experimental design considers eight factorial points (23), six axial points, and six central points, according to the established by Montgomery [32]. As is enlisted in Table 3, the experimental results of the esterification process reported a FAME yield range (Yexp) from 34.98 to 88.91 wt %, depending on the conditions of experiments.
The DOE consisted of eight factorials (23), six central, and six axial points, respectively. The distance of star points from the center point is provided by α = (2n)1/4, where the number of independent factors is given by n [32], of three factors α = 1.68. The range and coded levels of the esterification process variables studied are listed in Table 4. The yield of FAME was the response of the experimental design.

3. Results

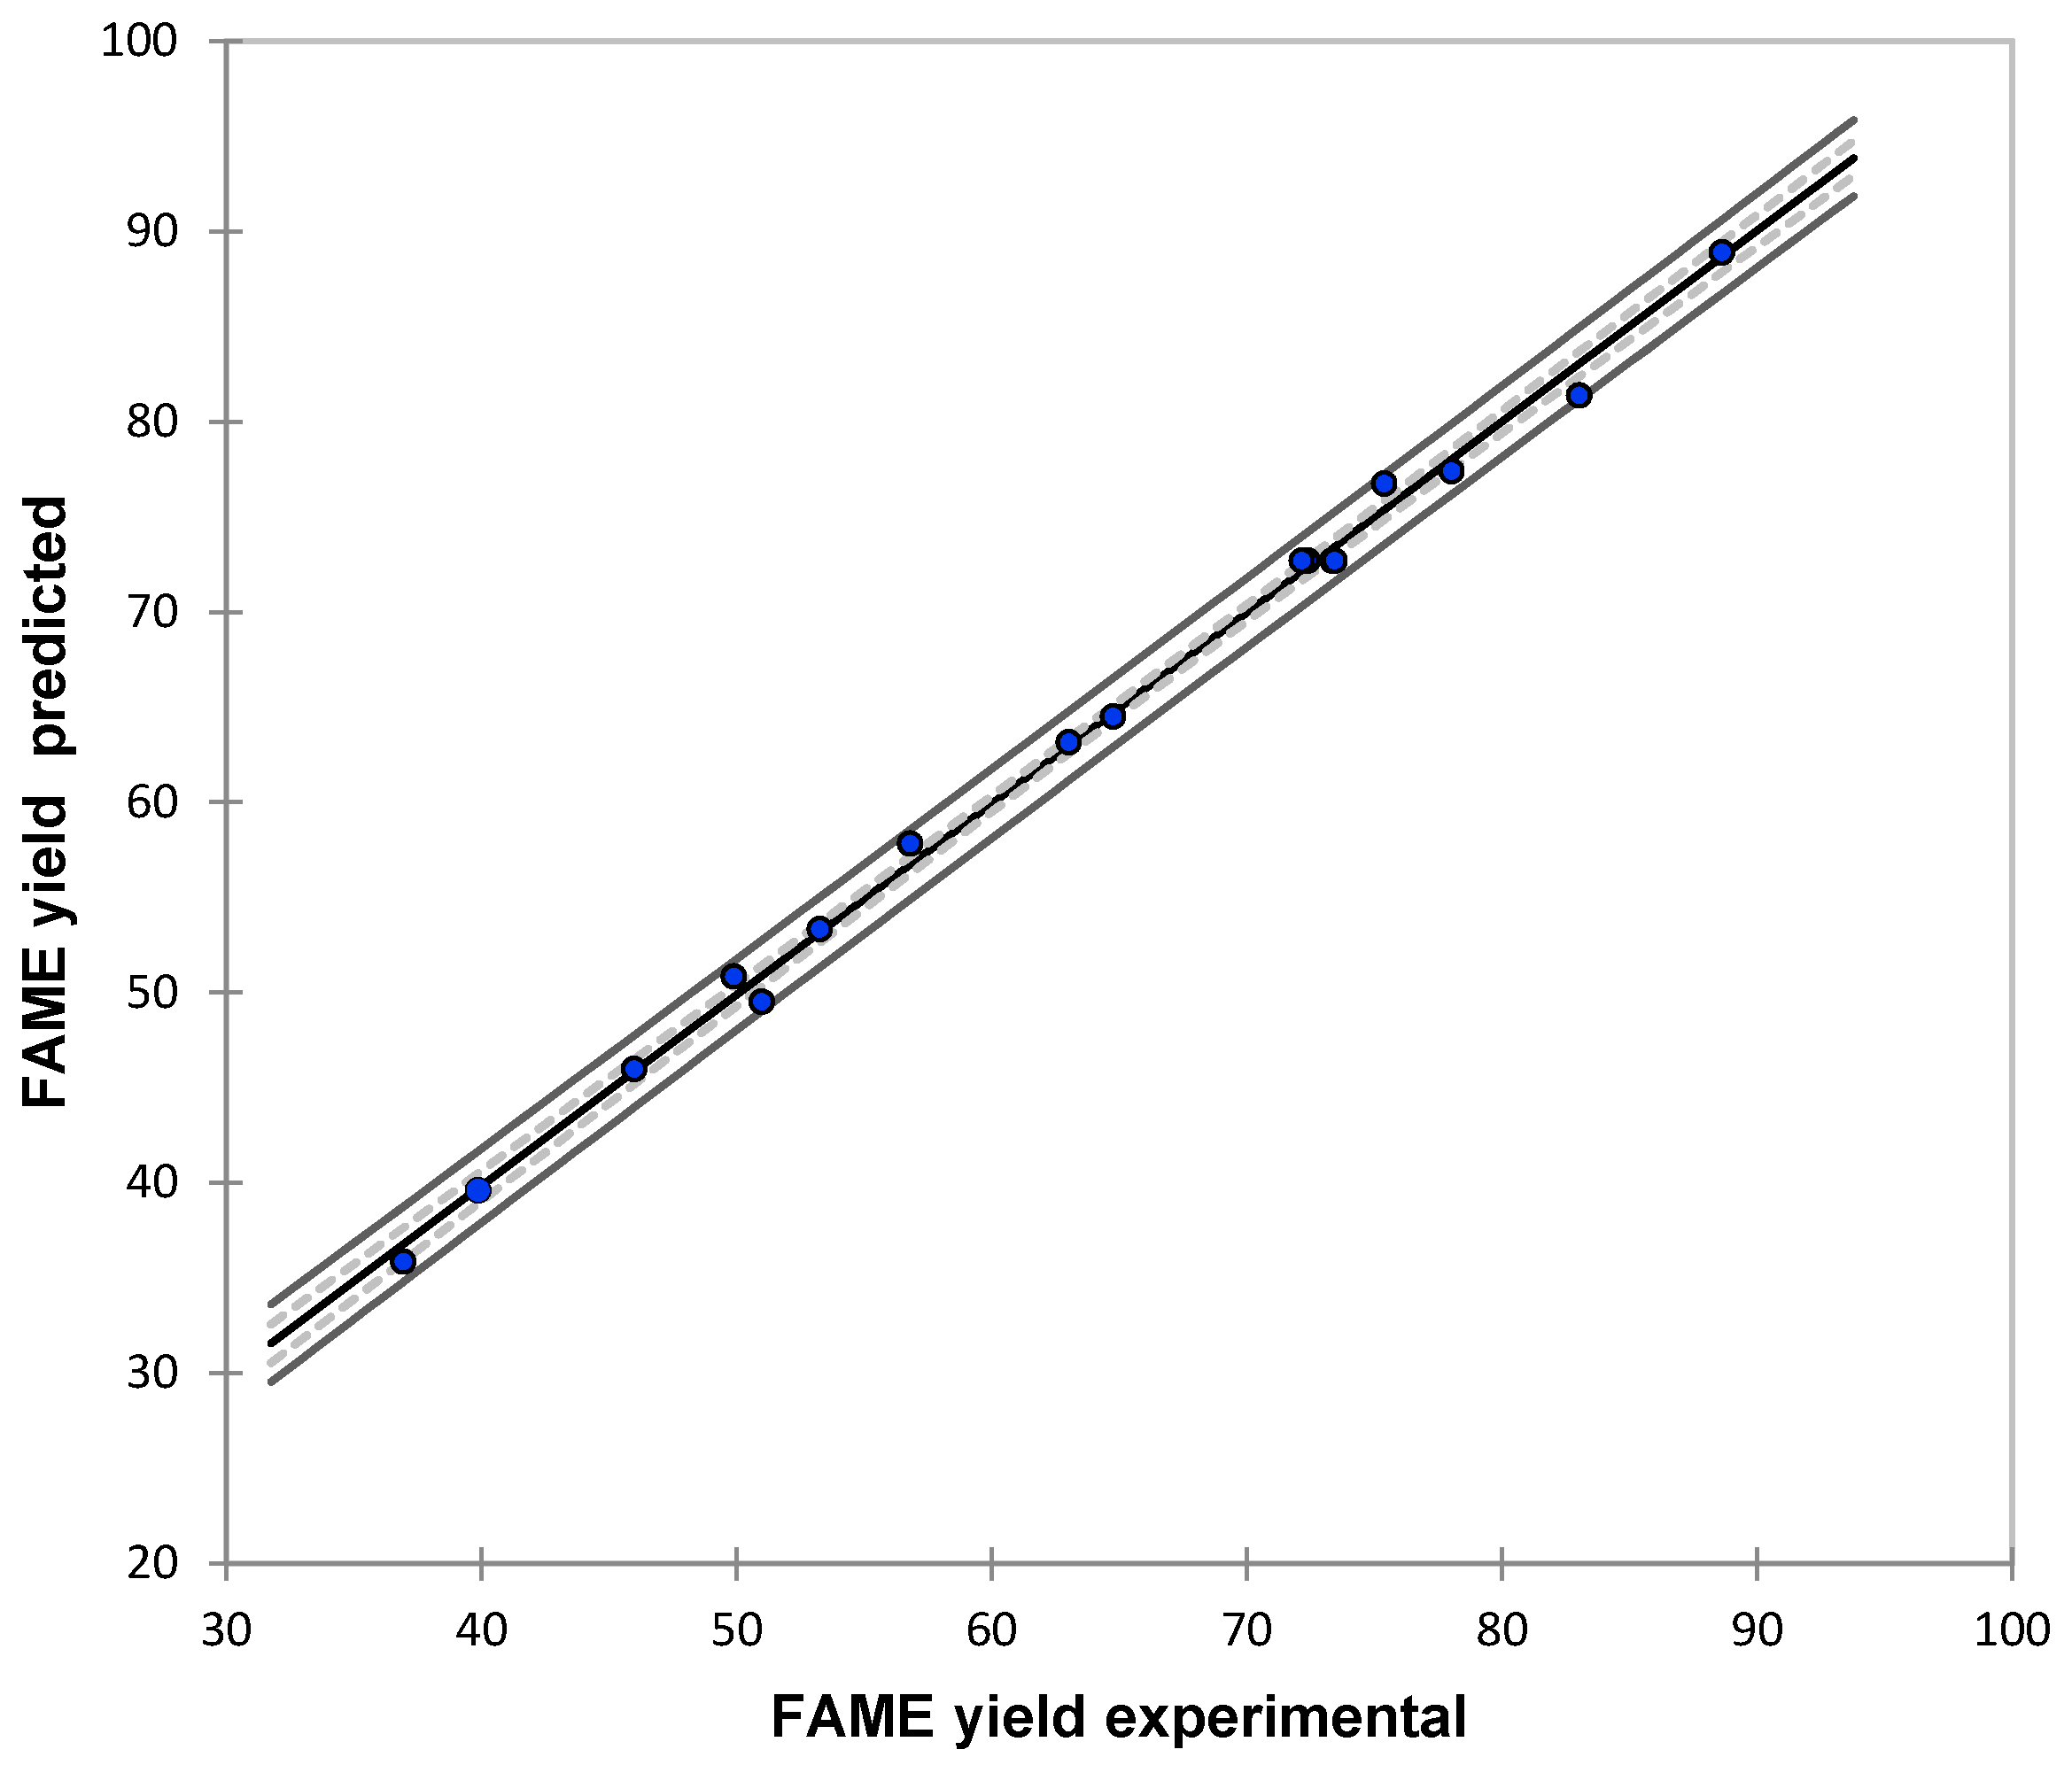
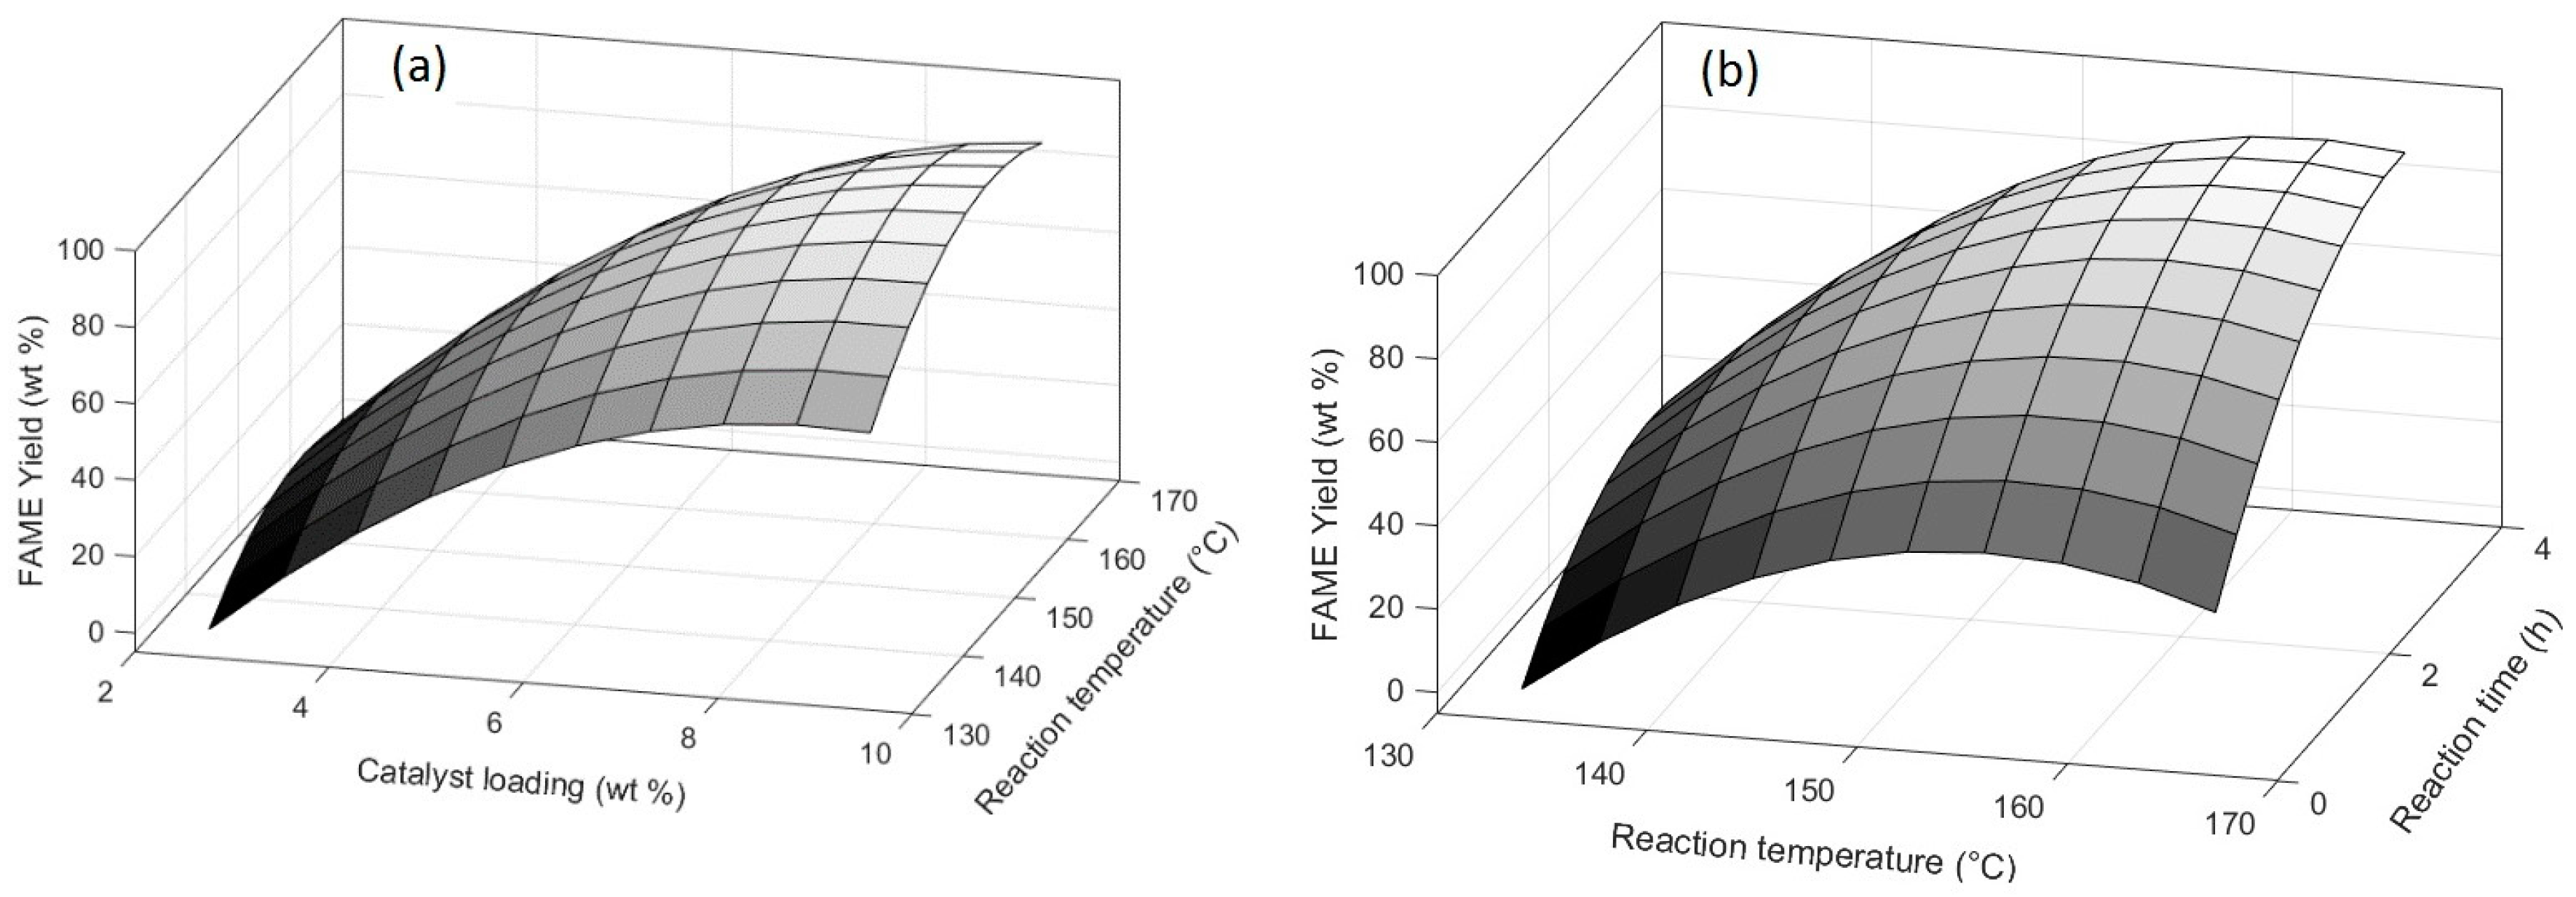
3.1. Modeling Results

To model the FAME yield, The Equation (3) was fitted using the data presented in Table 3. The experimental data were analyzed using the statistical package STATISTICA V.7 to construct the second-order polynomial model. The Levenberg-Marquardt algorithm was used to compute the parameters of the second-order model for nonlinear multiple regression [39]. This analysis includes all of the independent variables and their binary interactions, indicating the real influence of each variable in Equation (7):
Y mod = 0.893 X 1 + 9.064 X 2 + 0.537 X 3 1.017 X 1 2 9.066 X 2 2 1.254 X 3 2 + 0.475 X 1 X 2 + 0.371 X 1 X 3 + 1.046 X 2 X 3
We have considered 95% of confidence to evaluate the capacity of predict model. The remaining terms (the variables with a p-value > 0.05 had no significant effect on the response variable) despite not being significant, were included in the final model due they manifest as significant factors. A positive sign in the terms X1, X2, X3, X1X2, X1X3, and X2X3 indicates that an increase in the variables, generates an linear increase the FAME yield (synergistic effect). On the other hand, a negative sign in the coefficient of the quadratic terms X 1 2 , X 2 2 , and X 3 2 indicate an antagonist effect. The reaction temperature (X2) has the strongest effect on the response (FAME yield) since the coefficient of X2 and X 2 2 (9.064, −9.066), whereas the others factors have a moderate effect due to low coefficient when compared with X2. This may be due to cumulative effects of reaction parameters, similar observations were reported by Boey et al. [40] and Charoenchaitrakool et al. [41] in previous works.
Table 5 enlists a statistical comparison between the measurement FAME yields (Yexp) and the model output values (Ymod). The absolute percentage error, for the 20 model runs, was calculated by the Equation (8):
| E r r o r | = | Y mod Y exp Y exp | × 100
According to Table 5, the results of the mathematical model indicate that approximations have very small error margins. The absolute values computed do not exceed 3% of error, being in a range between 0.1–2.8%. This is an indicator that the model results meet the criterion of being within the 95% confidence interval.
The statistical analysis indicates that the second-order FAME yield model presents an acceptable estimation capacity according to the experimental data (MAPE = 2.13, RMSE = 1.43). On the other hand, the predicted FAME yield was plotted against the experimental values, as is illustrated in Figure 3, where the regression line and confidence intervals (at 95%) are shown. As it can be observed, all of the data are within the confidence limits, indicating that the model has an adequate adjust respect to the experimental data. The result of the determination coefficient adjusted (Radj2 = 0.9723) determines that the sample variation of 97.23% for FAME yield is related to the independent variables, where only 2.77% of the total variations are not explained by the mathematic model. In general, the statistical results validate the accuracy and prediction capacity of the second-order model, guaranteeing the reliability of the model.
Figure 4 presents the standardized residual values with zero mean and unit variance, of the regression model (Figure 3). As it can be appreciated, all of the residual values are included in the ±3 interval, determining the absence of outlier points. Therefore, the model predicts with certainty the experimental data, agreement with Montgomery [29].

3.2. Analysis of Variance (ANOVA)
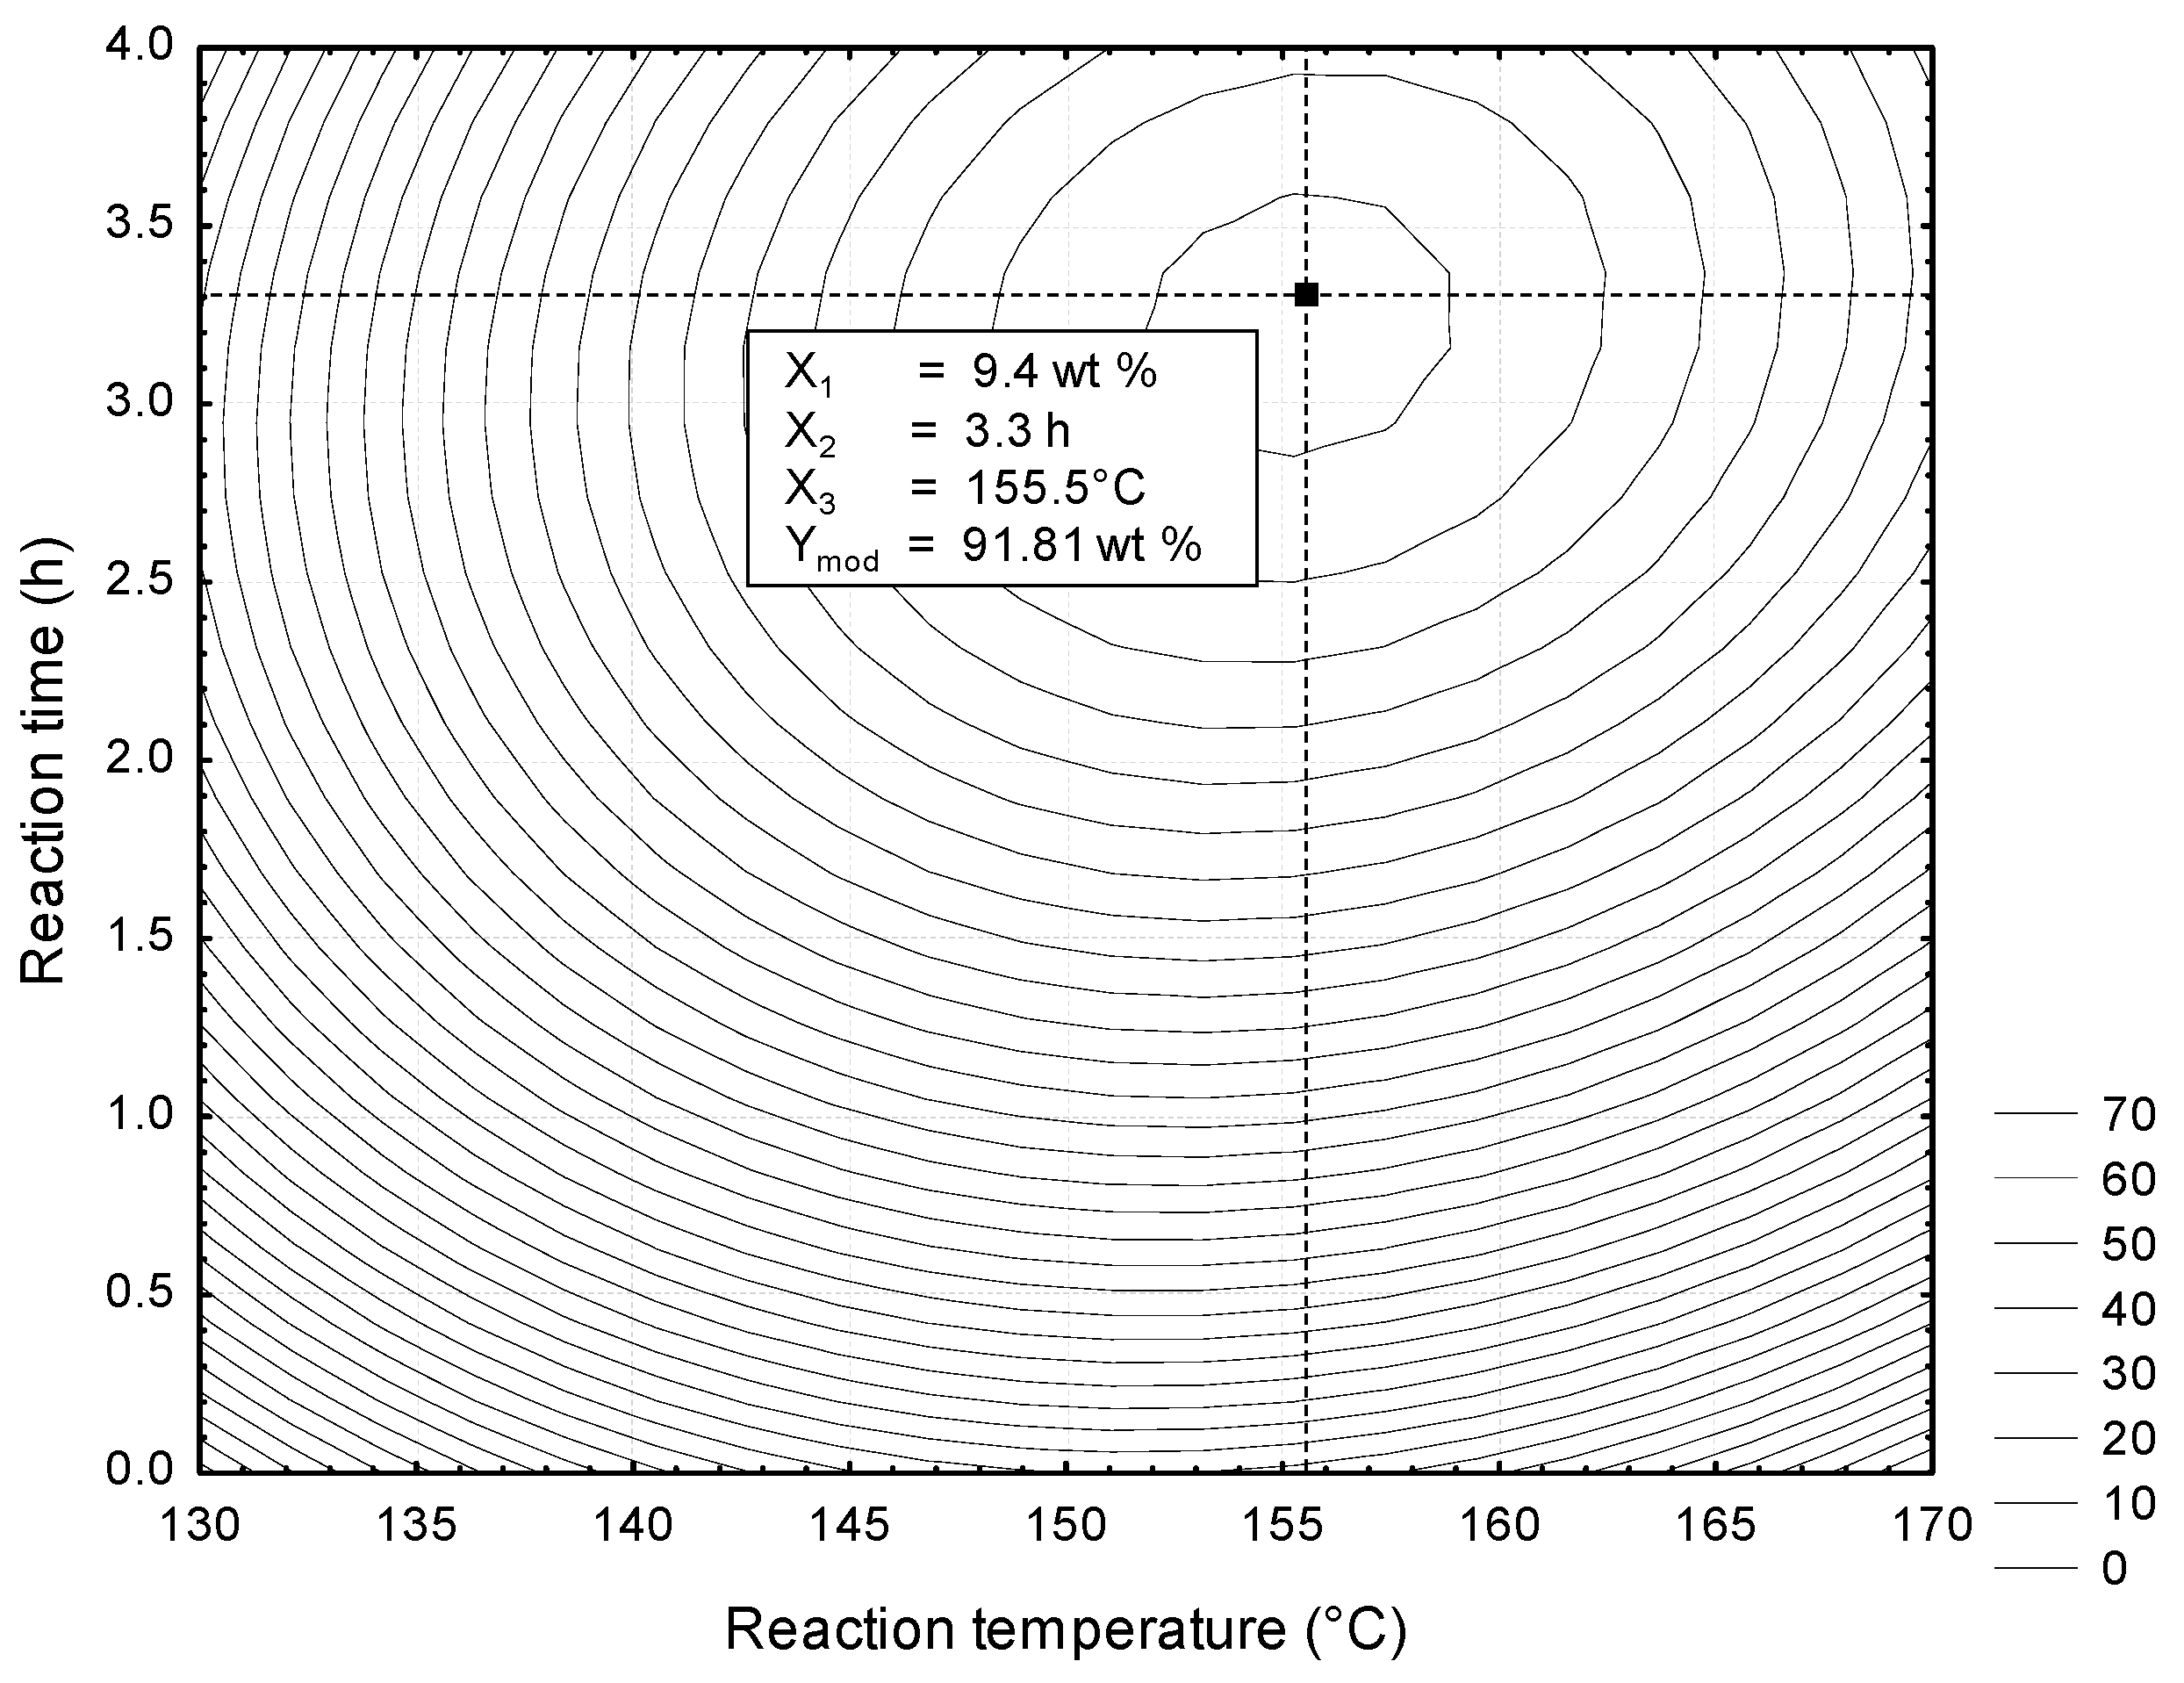
The ANOVA was used to evaluate the statistical significance model p-value by regression and Mean Square of Residual Error values. Table 6 contains the results of this analysis.
According to Table 6, the ANOVA results also determine that the most significant linear terms on FAME yield (with p-values < 0.05) are the reaction temperature (X2), the quadratic term of reaction time ( X 3 2 ), and the quadratic reaction temperature ( X 2 2 ). Likewise, catalyst concentration (X1), the quadratic term of reaction time ( X 1 2 ), the interaction catalyst loading*reaction time ( X 1 * X3), and the interaction reaction temperature*reaction time ( X 2 * X3) were also significant on FAME yield. Finally, the interactions catalyst loading*reaction temperature ( X 1 * X2) and the linear term of reaction time (X3) had no significant effect on the FAME yield (p-value > 0.05). As it can be seen, although X3 does not present significance on its own, its importance when interacting with the two other variables determines that it is a required element for the model result. Therefore, according to the ANOVA, the three input variables have a relevance importance on the model response.

3.3. Optimization

Optimization seeks to find the desired catalyst concentration, reaction temperature, and reaction time to obtain a required FAME yield. The second-order model (Equation (7)) illustrated the relationship between the response and experimental levels of each factor. This equation can be implemented to deduce the optimum conditions by response surface and the contour plots. To compute the optimum FAME yield, the empirical model was plotted in a three-dimensional surface that represent the FAME yield response as a function of two variables within the experimental range considered (Figure 5). Figure 5a illustrates the interaction of catalyst loading (2.6–9.4 wt %) and reaction temperature (133.2–166.2 °C) on FAME yield, respectively. It can be observed that catalyst concentrations that are lower than 6 wt % and reaction temperatures lower than 150 °C, yield to FAME concentrations of 72 wt % or smaller. On the contrary, when catalyst concentration increases higher than 8 wt % and reaction temperatures are higher than 150 °C, FAME concentration increases significantly. This increase may be caused by an increment in the catalyst concentration, which also increases the number of activation sites. Since, the results of the EDX analysis show that montmorillonite KSF contains 5.75% and 12.12% by weight of aluminum and silicon, respectively. The presence of aluminum and silicon will generate Brönsted acid sites in the crystal structure of the clay. On the other hand, the presence of Fe, Mg, K, Ca, and S atoms in the montmorillonite structure will form bonds with oxygen to generate Lewis acid sites. These acid sites decrease the activation energy, which accelerates the rate of esterification reaction favoring the synthesis of FAME. According to Arrhenius’ law, when the reaction temperature increases, the velocity of reactants reaction increases, and improve the FAME yield [42]. For catalysis, concentrations higher than 8 wt % and reaction temperatures higher than 160 °C, FAME concentration of 88.91% was reached. These results are consistent to those that were reported in previous studies by Boffito et al. for the esterification of FFAs of waste cooking oil (WCO) using ionic resins as catalytic agents. For reaction times of 8 h, the reaction temperature of 63 °C, and a relation methanol WCO (16:100 wt %), FAME conversions of 90 wt % were achieved [43].
Temperature is one the most important variable affecting the conversion of FFAs. The FAME yield, along with the reaction time and different reaction temperatures, is illustrated in Figure 6b. In to optimize the FAME yield, the effects of different reaction temperatures (133.2–166.2 °C) and reaction times (0.32–3.68 h) on the FAME yield was investigated. As is illustrated in Figure 6b, with increasing reaction temperature, the FAME yield increased quickly since the temperature increase caused higher molecule motion speed and mass transfer rate. For elemental reactions at reaction temperature increments of 10 °C, the reaction rate is doubled [40], which enhances FAME concentration. For reaction times of 3 h or longer, and temperatures of 160 °C, FAME yield of 90 wt % were achieved. Nandiwale et al. studied the esterification of levulininc acid to obtain ethyl levulitate, using an acid silicate (H-ZSM-5) compound as a catalytic agent. For a reaction time of 7 h and a reaction temperature of 130 °C, FAME concentration of 95 wt % was achieved [44].
The response surface and the two dimensions contour plots are generally used to find the optimal values of the variables process. This technique allows for inferring the optimum FAME yield, and its respective operational parameters, from the FAME curve gradient. The contour plots are illustrated in Figure 6. Each contour curve represents an infinite number of two test variable combination (reaction temperature (X2) and reaction time (X3)) with the other one maintained at their respective zero level (catalyst loading (X1)). The contour plots in Figure 6 indicate that there is a significant mutual interaction between reaction temperature and reaction time. Figure 6 predicts that the optimal values of the test are reaction temperature 155.5 °C, reaction time 3.3 h, and catalyst concentration 9.4 wt %. The mathematical model predicts that under optimal conditions obtained 91.81 wt % FAME yield. Further increase in the reaction temperature or reaction time would not have positive effects on the FAME yield.
In order to validate the optimal experimental condition that was generated by the mathematical model, an experiment was conducted in the laboratory considering the following conditions: reaction temperature 155 °C, reaction time 3 h 20 min (equivalent to 3.3 h) and catalyst concentration 9.5 wt %. The experimental evaluation generated a 90.1% FAME yield, with a difference of 1.71% between the modeled output and experimental result. This shows, the efficiency of the computational methodology to estimate the reaction optimum conditions.

4. Conclusions

This study is focused in optimize the Fatty Methyl Ester yield of the effect of montmorillonite KSF in the esterification of FFAs of CAPO. The operation parameters catalyst loading, reaction time, and reaction temperature were optimized using a response surface methodology that was based on a central composite rotatable design to achieve the maximum Fatty Methyl Ester yield. According to the statistical results, the second-order model generated is a feasible tool for estimation of Fatty Methyl Ester yield with minimums error levels (MAPE = 2.13, RMSE = 1.43, and R2 = 97.23%). Additionally, ANOVA results demonstrate that the three operation parameters present relative importance for the model output.
According to the experimental results, the montmorillonite KSF could be used as an effective heterogeneous catalyst for the conversion of FFAs of CAPO to biodiesel. The optimum reaction conditions were a catalyst loading 9.4 wt %, reaction temperature 155.5 °C and reaction time, 3.3 h. Under these conditions, was possible to obtain 91.81 wt % Fatty Methyl Ester yield. After the esterification steps, the FFAs to less than 1.1 wt %, this allows for the use of alkaline catalysis. This would allow for developing a two-step process for the synthesis of biodiesel, with high efficiency and low energy cost.

Acknowledgments

The authors thank PROMEP for providing financial resources for the development of this research; we also thank the Institute of Physical, UNAM and the Laboratory of Advanced Materials of the Engineering Faculty of the Autonomous University of Carmen, Campeche by performing the analysis for the characterization of the catalyst. Finally, we thank to the Autonomous University of Carmen, Campeche for the financial institutional support provided to Miguel Angel Ramirez-Elias for the publication of the present manuscript.

Author Contributions

All authors contributed equally to the design and performance of the experiments, the analysis of the data and the writing and revision of the manuscript.

Conflicts of Interest

The authors declare no conflict of interest.

References

  1. Guerrero, P.A.; Anguebes, F.F.; Castelán, E.M.; Ramos, V.M.; Zarracino, R.G.; Loría, J.C.Z.; Quiroz, A.V.C. Fourier transform infrared-attenuated total reflectance (FTIR-ATR) spectroscopy and chemometric techniques for the determination of adulteration in petrodiesel/biodiesel blends. Química Nova 2014, 37, 392–397. [Google Scholar]
  2. Seyboth, K.; Sverrisson, F.; Appavou, F.; Brown, A.; Epp, B.; Leidreiter, A.; Lins, C.; Musolino, E.; Murdock, H.E.; Petrichenko, K.; et al. Renewables 2016 Global Status Report; REN21: Paris, France, 2016. [Google Scholar]
  3. Abdul Kapor, N.Z.; Maniam, G.P.; Rahim, M.H.A.; Yusoff, M.M. Palm fatty acid distillate as a potential source for biodiesel production—A review. J. Clean. Prod. 2017, 143, 1–9. [Google Scholar] [CrossRef]
  4. Sato, R.T.; Stroppa, P.H.F.; Da Silva, A.D.; De Oliveira, M.A.L. Fast GC-FID method for monitoring acidic and basic catalytic transesterification reactions in vegetable oils to methyl ester biodiesel preparation. Química Nova 2016, 39, 352–355. [Google Scholar] [CrossRef]
  5. Sebayang, A.H.; Hassan, M.H.; Ong, H.C.; Dharma, S.; Silitonga, A.S.; Kusumo, F.; Mahlia, T.M.I.; Bahar, A.H. Optimization of reducing sugar production from Manihot glaziovii starch using response surface methodology. Energies 2017, 10, 35. [Google Scholar] [CrossRef]
  6. Santos, F.D.; da Conceição, L.R.V.; Ceron, A.; de Castro, H.F. Chamotte clay as potential low cost adsorbent to be used in the palm kernel biodiesel purification. Appl. Clay Sci. 2017, 149, 41–50. [Google Scholar] [CrossRef]
  7. Lin, C.Y.; Lin, Y.W. Fuel characteristics of biodiesel produced from a high-acid oil from soybean soapstock by supercritical-methanol transesterification. Energies 2012, 5, 2370–2380. [Google Scholar] [CrossRef]
  8. Uribarrí, A.; Zabala, A.; Sáchez, J.; Arenas, E.; Chandler, C.; Rincón, M.; González, E.; Aiello Mazzarri, C. Evaluación del potencial de la borra de café como materia prima para la producción de biodiesel. Multiciencias 2014, 14, 129–139. [Google Scholar]
  9. Lotero, E.; Liu, Y.; Lopez, D.E.; Suwannakarn, K.; Bruce, D.A.; Goodwin, J.G. Synthesis of biodiesel via acid catalysis. Ind. Eng. Chem. Res. 2005, 44, 5353–5363. [Google Scholar] [CrossRef]
  10. Johnston, M.; Holloway, T. A global comparison of national biodiesel production potentials. Environ. Sci. Technol. 2007, 41, 7967–7973. [Google Scholar] [CrossRef] [PubMed]
  11. Jahirul, M.I.; Koh, W.; Brown, R.J.; Senadeera, W.; O’Hara, I.; Moghaddam, L. Biodiesel production from non-edible beauty leaf (Calophyllum inophyllum) oil: Process optimization using response surface methodology (RSM). Energies 2014, 7, 5317–5331. [Google Scholar] [CrossRef]
  12. Farobie, O.; Matsumura, Y. State of the art of biodiesel production under supercritical conditions. Prog. Energy Combust. Sci. 2017, 63, 173–203. [Google Scholar] [CrossRef]
  13. Özbay, N.; Oktar, N.; Tapan, N.A. Esterification of free fatty acids in waste cooking oils (WCO): Role of ion-exchange resins. Fuel 2008, 87, 1789–1798. [Google Scholar] [CrossRef]
  14. Silva, C.D.; Oliveira, J.V. Biodiesel production through non-catalytic supercritical transesterification: Current state and perspectives. Braz. J. Chem. Eng. 2014, 31, 271–285. [Google Scholar] [CrossRef]
  15. Trentin, C.M.; Lima, A.P.; Alkimim, I.P.; Da Silva, C.; De Castilhos, F.; Mazutti, M.A.; Oliveira, J.V. Continuous production of soybean biodiesel with compressed ethanol in a microtube reactor using carbon dioxide as co-solvent. Fuel Process. Technol. 2011, 92, 952–958. [Google Scholar] [CrossRef]
  16. Reddy, C.R.; Iyengar, P.; Nagendrappa, G.; Prakash, B.S.J. Esterification of dicarboxylic acids to diesters over Mn+-montmorillonite clay catalysts. Catal. Lett. 2005, 101, 87–91. [Google Scholar] [CrossRef]
  17. Liu, Z.; Shi, C.; Wu, D.; He, S.; Ren, B. A Simple Method of Preparation of High Silica Zeolite y and Its Performance in the Catalytic Cracking of Cumene. J. Nanotechnol. 2016, 2016, 1486107. [Google Scholar] [CrossRef]
  18. Son, S.M.; Kimura, H.; Kusakabe, K. Esterification of oleic acid in a three-phase, fixed-bed reactor packed with a cation exchange resin catalyst. Bioresour. Technol. 2011, 102, 2130–2132. [Google Scholar] [CrossRef] [PubMed]
  19. Ferella, F.; Di Celso, G.M.; De Michelis, I.; Stanisci, V.; Vegliò, F. Optimization of the transesterification reaction in biodiesel production. Fuel 2010, 89, 36–42. [Google Scholar] [CrossRef]
  20. Ali, O.M.; Mamat, R.; Najafi, G.; Yusaf, T.; Ardebili, S.M.S. Optimization of biodiesel-diesel blended fuel properties and engine performance with ether additive using statistical analysis and response surface methods. Energies 2015, 8, 14136–14150. [Google Scholar] [CrossRef]
  21. Corral Bobadilla, M.; Lostado Lorza, R.; Escribano García, R.; Somovilla Gómez, F.; Vergara González, E. An Improvement in Biodiesel Production from Waste Cooking Oil by Applying Thought Multi-Response Surface Methodology Using Desirability Functions. Energies 2017, 10, 130. [Google Scholar] [CrossRef]
  22. Wan Omar, W.N.N.; Saidina Amin, N.A. Optimization of heterogeneous biodiesel production from waste cooking palm oil via response surface methodology. Biomass Bioenergy 2011, 35, 1329–1338. [Google Scholar] [CrossRef]
  23. Ramos, M.J.; Fernández, C.M.; Casas, A.; Rodríguez, L.; Pérez, Á. Influence of fatty acid composition of raw materials on biodiesel properties. Bioresour. Technol. 2009, 100, 261–268. [Google Scholar] [CrossRef] [PubMed]
  24. Guerrero-Peña, A.; Anguebes-Franseschi, F.; Castelán-Estrada, M.; Morales-Ramos, V.; Córdova-Quiroz, A.V.; Zavala-Loría, J.C.; Bolaños-Reinoso, E. Optimization of the biodiesel synthesis using crude African palm oil (Elaeis guineensis Jacq). Agrociencia 2013, 47, 649–659. [Google Scholar]
  25. Lozada, I.; Islas, J.; Grande, G. Environmental and economic feasibility of palm oil biodiesel in the Mexican transportation sector. Renew. Sustain. Energy Rev. 2010, 14, 486–492. [Google Scholar] [CrossRef]
  26. Aricetti, J.A.; Tubino, M. A green and simple visual method for the determination of the acid-number of biodiesel. Fuel 2012, 95, 659–661. [Google Scholar] [CrossRef]
  27. Knothe, G. Analyzing biodiesel: Standards and other methods. J. Am. Oil Chem. Soc. 2006, 83, 823–833. [Google Scholar] [CrossRef]
  28. Gao, L.; Teng, G.; Xiao, G.; Wei, R. Biodiesel from palm oil via loading KF/Ca-Al hydrotalcite catalyst. Biomass Bioenergy 2010, 34, 1283–1288. [Google Scholar] [CrossRef]
  29. Di Serio, M.; Tesser, R.; Pengmei, L.; Santacesaria, E. Heterogeneous Catalysts for Biodiesel Production. Energy Fuels 2008, 22, 207–217. [Google Scholar] [CrossRef]
  30. Ma, H.; Li, S.; Wang, B.; Wang, R.; Tian, S. Transesterification of Rapeseed Oil for Synthesizing Biodiesel by K/KOH/γ-Al2O3 as Heterogeneous Base Catalyst. J. Am. Oil Chem. Soc. 2008, 85, 263–270. [Google Scholar] [CrossRef]
  31. Pires, J.; Brasil, B.; Araújo, M.E.M. Reduction of free fatty acids in acidic nonedible oils by modified K10 clay. J. Am. Oil Chem. Soc. 2013, 90, 555–561. [Google Scholar] [CrossRef]
  32. Montgomery, D.C. Design and Analysis of Experiments; John Wiley & Sons: Hoboken, NJ, USA, 2012; Volume 2. [Google Scholar]
  33. Box, G.E.P.; Wilson, K.B. On the experimental attainment of optimum conditions. J. R. Stat. Soc. 1951, 13, 1–45. [Google Scholar]
  34. Le Van, S.; Chon, B.H. Chemical flooding in heavy-oil reservoirs: From technical investigation to optimization using response surface methodology. Energies 2016, 9, 711. [Google Scholar] [CrossRef]
  35. Brassard, P.; Godbout, S.; Raghavan, V.; Palacios, J.H.; Grenier, M.; Zegan, D. The production of engineered biochars in a vertical auger pyrolysis reactor for carbon sequestration. Energies 2017, 10, 388. [Google Scholar] [CrossRef]
  36. Su, C.-H. Kinetic study of free fatty acid esterification reaction catalyzed by recoverable and reusable hydrochloric acid. Bioresour. Technol. 2013, 130, 522–528. [Google Scholar] [CrossRef] [PubMed]
  37. Tesser, R.; Di Serio, M.; Guida, M.; Nastasi, M.; Santacesaria, E. Kinetics of oleic acid esterification with methanol in the presence of triglycerides. Ind. Eng. Chem. Res. 2005, 44, 7978–7982. [Google Scholar] [CrossRef]
  38. Espinosa Guzmán, A.; May Tzuc, O.; Balam Pantí, I.; Reyes Trujeque, J.; Pérez Quintana, I.; Bassam, A. Modelado de partículas PM10 y PM2.5 Mediante Redes Neuronales Artificiales sobre clima tropical de San Francisco de Campeche, México. Química Nova 2017, 40, 1025–1034. [Google Scholar]
  39. Melero, J.A.; Bautista, L.F.; Morales, G.; Iglesias, J.; Briones, D. Biodiesel production with heterogeneous sulfonic acid-functionalized mesostructured catalysts. Energy Fuels 2009, 23, 539–547. [Google Scholar] [CrossRef]
  40. Boey, P.L.; Ganesan, S.; Maniam, G.P.; Khairuddean, M.; Efendi, J. A new heterogeneous acid catalyst for esterification: Optimization using response surface methodology. Energy Convers. Manag. 2013, 65, 392–396. [Google Scholar] [CrossRef]
  41. Charoenchaitrakool, M.; Thienmethangkoon, J. Statistical optimization for biodiesel production from waste frying oil through two-step catalyzed process. Fuel Process. Technol. 2011, 92, 112–118. [Google Scholar] [CrossRef]
  42. Wiley, J.; Hepburn, K.; Levenspiel, O. Chemical Reaction Engineering. In Proceedings of the 3rd European Symposium on Chemical Reaction Engineering, Amsterdam, The Netherlands, 15–17 September 1964; Volume 19. [Google Scholar]
  43. Boffito, D.C.; Pirola, C.; Galli, F.; Di Michele, A.; Bianchi, C.L. Free fatty acids esterification of waste cooking oil and its mixtures with rapeseed oil and diesel. Fuel 2013, 108, 612–619. [Google Scholar] [CrossRef]
  44. Nandiwale, K.Y.; Niphadkar, P.S.; Deshpande, S.S.; Bokade, V.V. Esterification of renewable levulinic acid to ethyl levulinate biodiesel catalyzed by highly active and reusable desilicated H-ZSM-5. J. Chem. Technol. Biotechnol. 2014, 89, 1507–1515. [Google Scholar] [CrossRef]
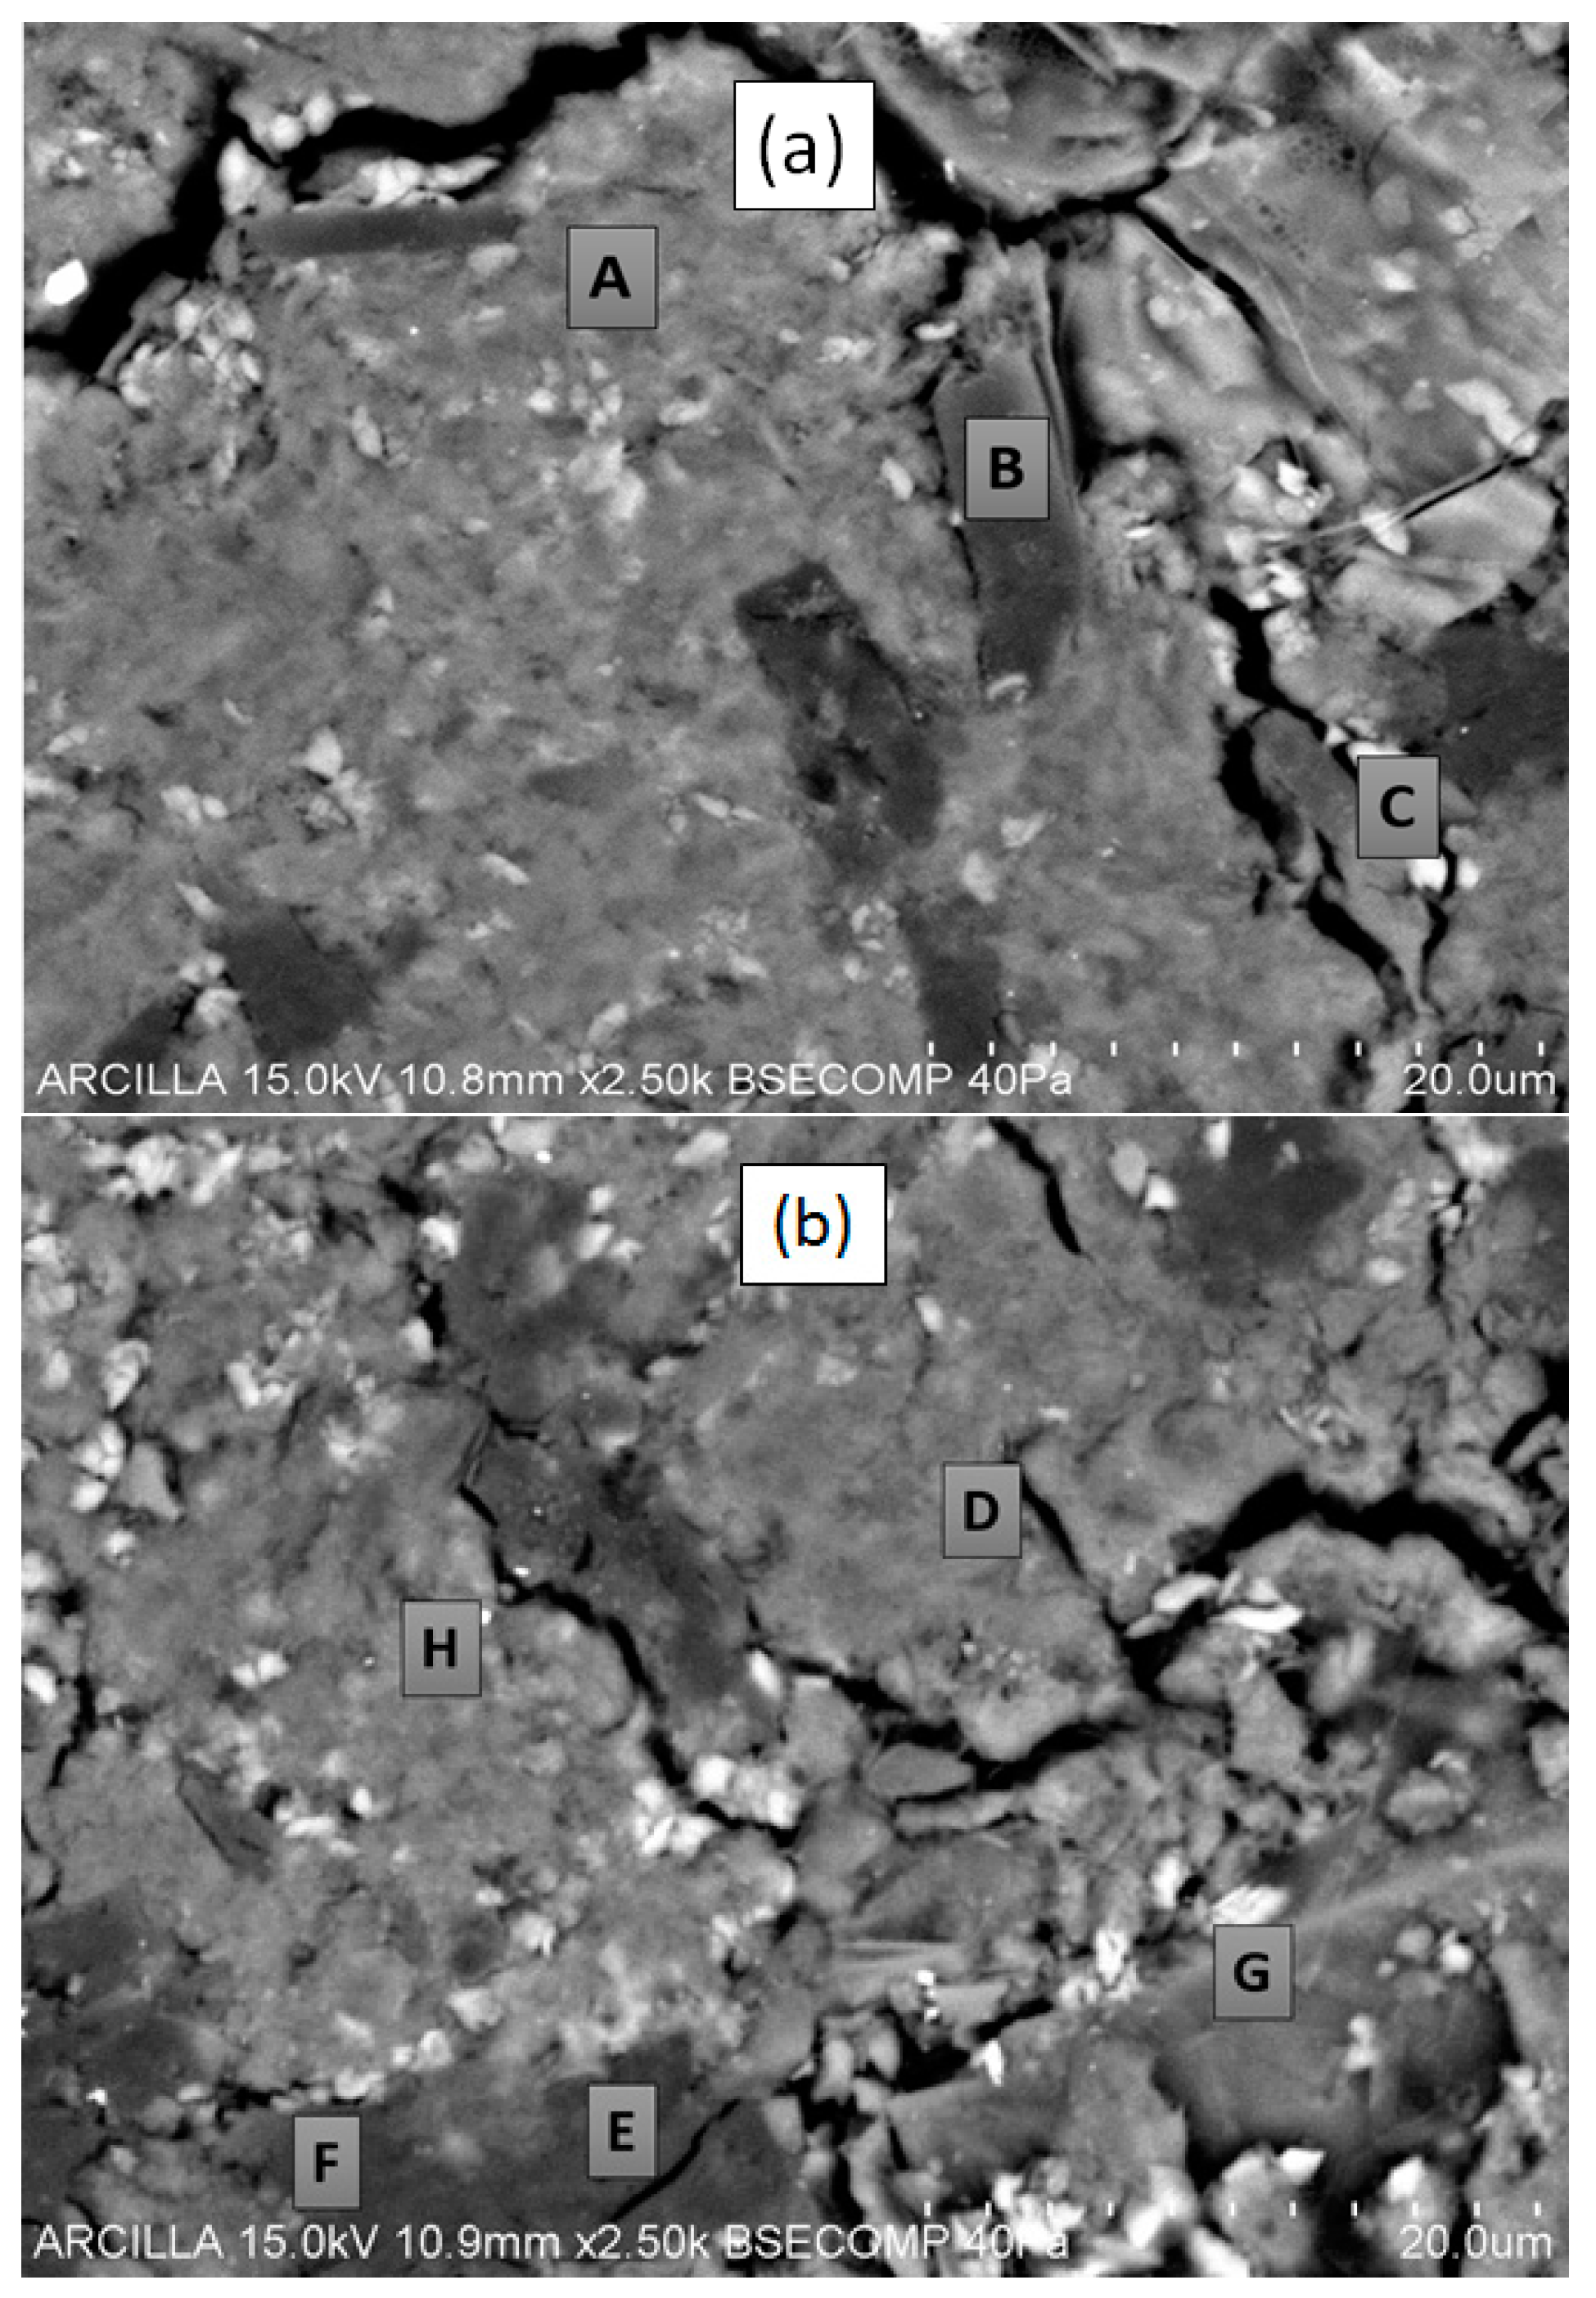
Figure 1. X-ray diffraction analysis (XRD) pattern of Montmorillonite-KSF (MT-KSF) clay.
Energies 11 00157 g001
Figure 2. Images of electronic scanning microscopy of montmorillonite KSF: (a) Zone 1; (b) Zone 2.
Energies 11 00157 g002
Figure 3. Scatter diagram of experimental FAME yield and predicted FAME yield.
Energies 11 00157 g003
Figure 4. Diagram of standardized residuals of predicted FAME yield.
Energies 11 00157 g004
Figure 5. FAME yield response surface of the free fatty acids (FFAs) esterification as a function: (a) The catalyst loading and temperature reaction; and (b) reaction temperature and reaction time.
Energies 11 00157 g005
Figure 6. Graph of contour illustrating the optimum reaction temperature and reaction time for the esterification FFAs of CAPO.
Energies 11 00157 g006
Table 1. Energy Dispersive X-ray Spectroscopy (EDS) results in wt % MT-KSF sample.
Punctual AnalysisO Mg Al Si S K Ca Fe Total (%)
Zone 1 (Figure 2a)A67.571.767.3717.322.530.660.522.26100
B77.531.816.025.877.490.4400.84100
Zone 2 (Figure 2b)C70.461.245.549.896.611.350.284.63100
D69.151.557.5617.282.10.230.381.73100
E77.951.976.054.528.6000.91100
F78.011.965.795.347.620.230.170.87100
G69.840.533.0515.895.081.020.813.78100
H69.420.824.8120.832.50.260.380.98100
Table 2. Average chemical composition of MT-KSF sample by EDS analysis.
StatisticsOMgAlSiSKCaFeSi/AlCa/AlMg/AlCa/Mg
Max.78.011.977.5620.838.61.350.814.632.750.1070.2610.411
Min.67.570.533.054.522.10.230.170.841.480.0560.1050.321
Average72.491.465.7712.125.320.790.4922.10.0850.2530.336
SD *1.80.20.68.41.090.180.30.630.210.0090.030.014
* SD = standard deviation.
Table 3. Experimental design matrix.
RunX1X2X3Yexp
(wt %)(°C)(h)(wt %)
14(−1)140(−1)1(−1)34.13
28(+1)140(−1)1(−1)49.89
34(−1)160(+1)1(−1)39.87
48(+1)160(+1)1(−1)56.79
54(−1)140(−1)3(+1)53.26
68(+1)140(−1)3(+1)75.38
74(−1)160(+1)3(+1)63.02
88(+1)160(+1)3(+1)88.61
92.6(−2)150(0)2(0)45.98
109.4(+2)150(0)2(0)83.02
116(0)133.2(−2)2(0)50.98
126(0)166.2(+2)2(0)64.75
136(0)150(0)0.32(−2)36.92
146(0)150(0)3.68(+2)78.01
156(0)150(0)2(0)72.31
166(0)150(0)2(0)72.37
176(0)150(0)2(0)73.35
186(0)150(0)2(0)72.34
196(0)150(0)2(0)73.44
206(0)150(0)2(0)72.15
Table 4. Experimental range and levels coded of independent variables.
Variable Range and Levels
Code−1.68 (−α)−101+1.68 (+α)
Concentration of catalyst (wt %)X12.64689.4
Reaction temperature (°C)X2133.2140150160166.2
Reaction time (h)X30.321233.68
Table 5. Comparison between experimental and modeled Fatty Methyl Ester (FAME) yield.
YexpYmod|Error|
(wt %)(wt %)(%)
34.1334.982.5
49.8950.872.0
39.8739.630.6
56.7957.841.8
53.2653.350.2
75.3876.761.8
63.0263.180.3
88.6188.910.3
45.9846.010.1
83.0281.382.0
50.9849.542.8
64.7564.530.3
36.9235.882.8
78.0177.410.8
72.3172.710.6
72.3772.710.5
73.3572.710.9
72.3472.710.5
73.4472.711.0
72.1572.710.8
Table 6. ANOVA for the model regression.
EffectDegrees of FreedomRMSEF-Valuep-Value
Model184764.346717.710
Intercept1413.25323.480
X118.926.980.02465
X 1 2 1144.93113.460.00014
X21431.23337.560.00001
X 2 2 1441.99345.980.00001
X313.332.610.13736
X 3 2 1465.14364.110.00001
X 1 * X212.682.090.17815
X 1 * X3128.2422.100.00084
X 2 * X3113.3910.480.00891
Error101.28--

