1. Introduction
Vehicle emission regulations have been forcing the automotive industry worldwide to reduce its carbon footprint [
1]. Environmentally friendly, full electric and plug-in hybrid vehicles are gaining popularity and their sales numbers increase each year but due to limited sales volumes, their effect on fleet emission reduction is limited. The trend in the mass market is also progressing in the same direction and as a result, fuel efficient micro-hybrid vehicle sales are also gaining popularity. According to market research, total micro-hybrid vehicle sales will increase from 8.8 million in 2013 to 55.3 million in 2022 [
2]. Lead-acid batteries are still unrivaled for micro-hybrid vehicles as well as conventional vehicles due to their robust and safe design, low cost raw materials, mature and cost optimized manufacturing process, and already established efficient recycling processes [
3,
4]. A lead acid car battery designed for a micro-hybrid vehicle should have additional duties over a standard battery designed only for starting, lighting, and ignition (SLI) applications. A micro-hybrid vehicle battery should be able to supply energy during idle engine stop periods. It can be charged at high current rates during regenerative braking or even it may help the engine to boost acceleration via alternator/generator. To achieve these new duties, some breakthrough improvements have been adapted to lead acid batteries. Newly developed carbon additives have been applied to negative electrodes to increase the cyclic ability and dynamic charge acceptance [
5,
6]. Electrode grids have been designed with computer aided optimization techniques to minimize voltage loss at high current rates without increasing the grid weight [
7]. High porous and low tortuous separators with low electric resistances are now commercially available and they have been utilized in lead acid batteries to improve their electrical performance such as increased cyclic endurance and higher dynamic charge acceptance. These new type lead acid batteries are called enhanced flooded batteries (EFB) [
8,
9,
10]. EFB can last much longer than that of regular flooded lead acid batteries under high electrical stress of micro-hybrid vehicles. Unlike conventional vehicles, micro-hybrid vehicles utilize lead-acid batteries in a partial state of charge (SOC) to capture energy during the regenerative braking. The electronic control unit of the micro hybrid vehicle should know the battery SOC to decide to stop the engine or not and to decide the charging current during deceleration. Therefore, in recent studies rival lead acid battery technologies have been focusing to understand the SOC of the battery inside the micro hybrid vehicles [
11]. In the lifetime of a lead acid battery, various electrochemical degradation processes like sulphation, acid stratification, grid corrosion, etc. could occur. These degradation processes can result in changes in the crystallographic structure of battery materials, influencing electrode potentials. Thus, it usually misleads the end user or car electronic control unit to get an idea about exact SOC and SOH from open circuit voltages. In literature, there are numerous studies that explain electrochemical degradation processes of a lead acid battery [
12] and for other chemistries [
13,
14,
15] to understand their SOC and SOH levels. Most of these works are based on highly non-linear and complex equations based on the underlying physics of an electrochemical cell. Usually these models need more time to simulate. If there is a need of SOC or SOH information in a real time simulation faster methods become a necessity.
Electrochemical impedance spectroscopy (EIS) is a faster technique that has a potential to identify the SOC and SOH of a lead acid battery if data sets have been interpreted with a convenient electric equivalent circuit (EEC) model. Besides SOC and SOH predictions, another reason to use an EEC for energy storage unit of an automobile has emerged in recent years. Batteries are increasingly incorporated into the complex electronic system of a car as hybrid powertrain systems are getting more complicated. The resulting electronic and electrochemical combined systems need to be analyzed as a whole. EEC is an easier and efficient way of representing a battery which is in interaction with other electronic components of a hybrid powertrain in a simulation environment [
16]. In this paper, the precisions of previously proposed and commonly used EEC models of lead acid batteries are experimentally investigated for modern enhanced flooded batteries, which are widely using in today’s conventional vehicles.
In their early work, Gopikanth and Sathyanamara [
17] examined the dependency of the impedance data with respect to SOC for a lead acid battery in a relatively narrow frequency spectrum range. They observed that above 200 Hz, the inductive behavior becomes prominent and decided to concentrate on the range between 100 Hz to 15 Hz. In this range, change in the quantities of electrical elements have been observed with respect to SOC. Due to the parabolic behavior of elements, using these parameters for SOC predictions are found as a limited indicator. Mauracher and Karden [
18] have completed a series of EIS tests on lead acid batteries to identify parameters of their EEC battery model based on Randles theory. Their proposed model can give battery terminal voltage as a function of current without taking into account of temperature, SOC and SOH with 0.2% voltage tolerance on their simulations. Blanke and co-workers [
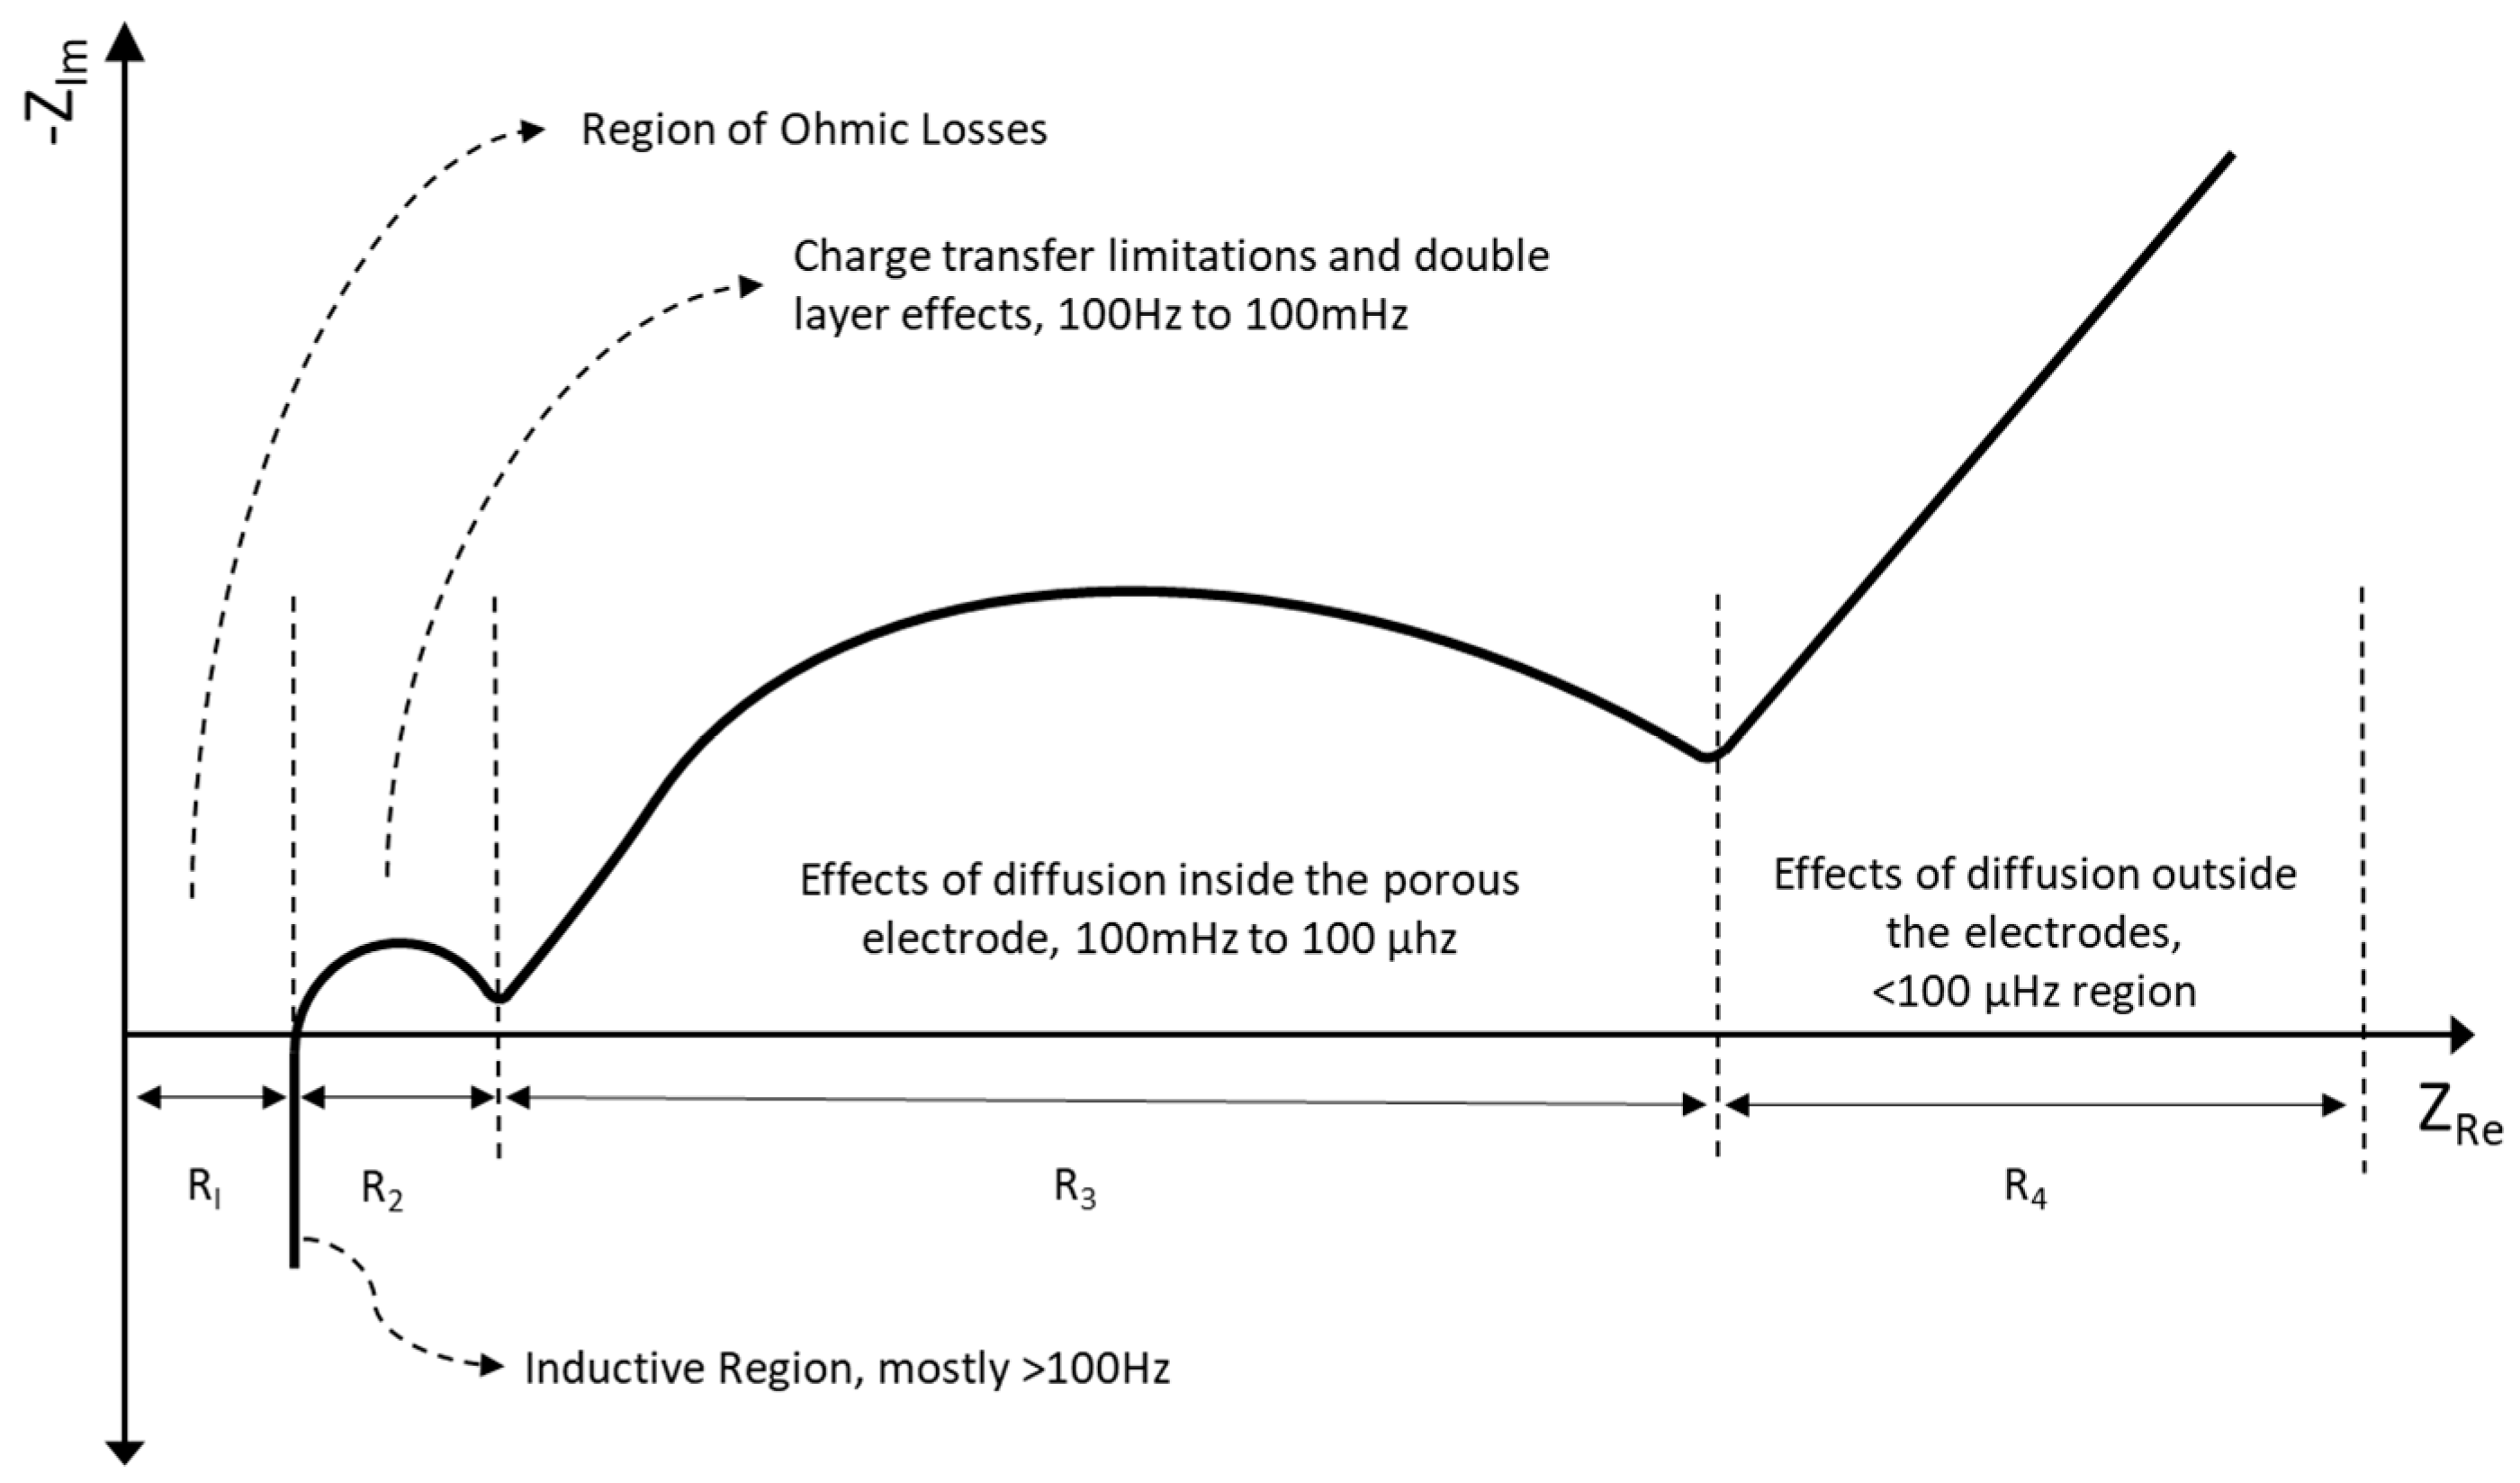
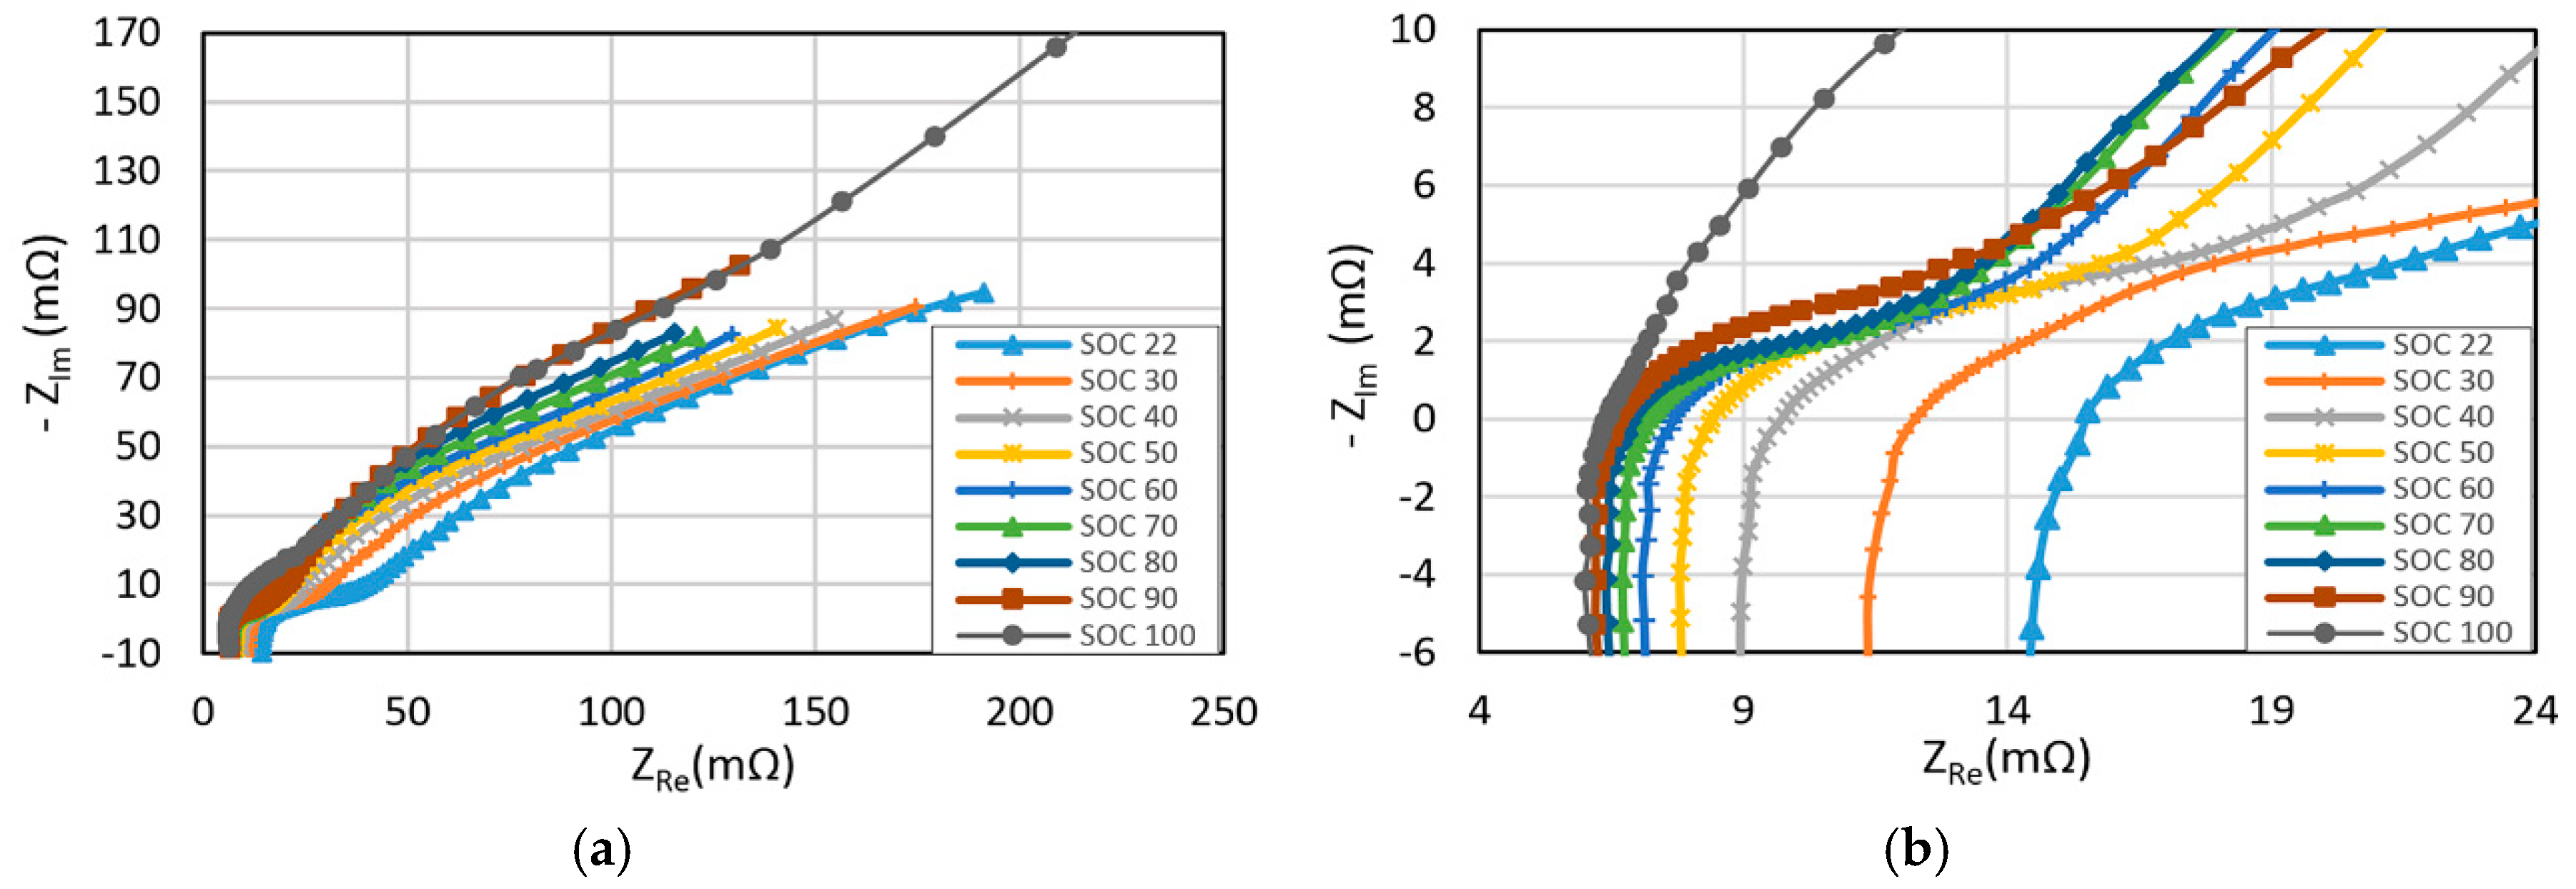
19] showed that higher frequency region could also give valuable information on SOC. For a certain frequency, the mixed inductive and capacitive behaviors of a lead acid battery cancel each other and the imaginary part of impedance becomes zero for a given SOC value. This frequency is named as transition frequency (F
Tr). They observed that this parameter is highly dependent on SOC and the temperature of the battery. Impedance data are shown in Bode or in Nyquist diagrams. In former one, modulus of real and imaginary parts and phase angle are given with respect to frequency in log scale. In the latter case, the negative values of imaginary impedance are shown with respect to real impedances to have capacitive loops in the upper part of the graph. An idealized shape of a Nyquist diagram for a lead acid battery is given in
Figure 1 below.
In this work, impedance spectrum analyses on an EFB are performed for a wide SOC and SOH ranges. To interpret impedance data, widely used double ZARC element model is modified by adding transmission line elements to each ZARC for an EFB for the first time. This new model is also compared with three existing models from literature.
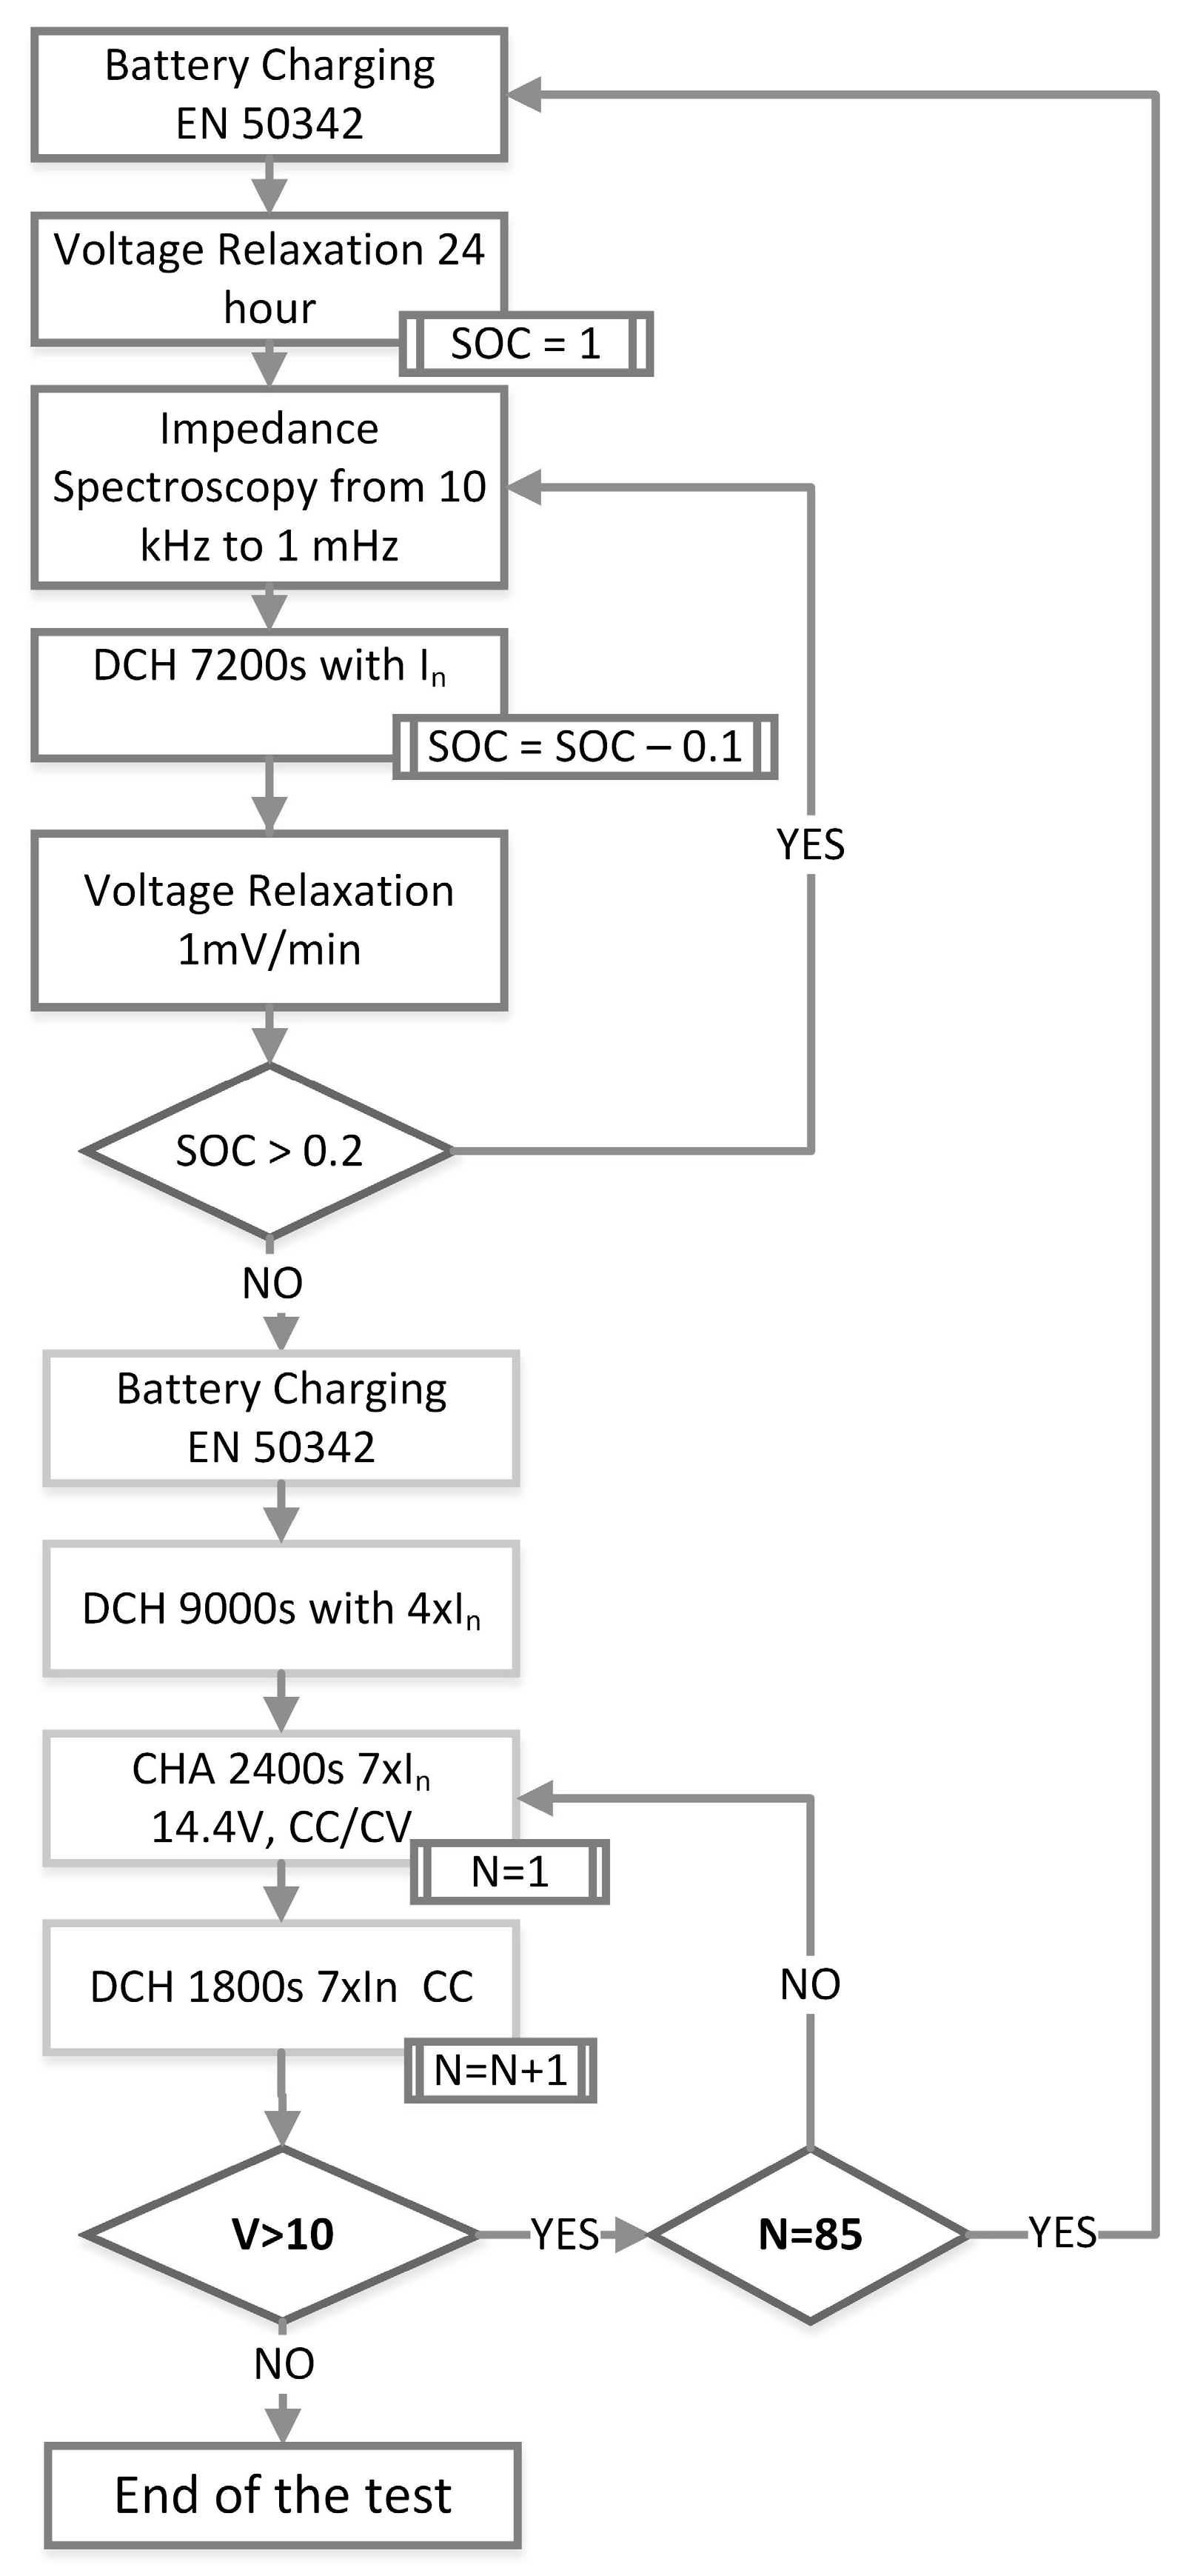
Experiments are conducted under zero DC without discharging or charging to avoid SOC changes during the EIS measurement. Charge, discharge, and cycling procedures of European Committee for Electrochemical Standardization (CENELEC) [
20,
21] are applied to the battery to change its SOC and SOH. Rather than charging and discharging with a big depth of discharge to aging the battery, these standards designed for micro hybrid vehicle batteries can imitate the real-life working conditions. An equivalent circuit with only simple electrical elements [
22,
23], a typical Randles circuit with an addition of inductance [
24], a model with two constant phase elements (CPE) in parallel with resistances [
19,
25], and finally a circuit with addition of two transmission line elements representing for both anode and cathode porous electrode surfaces are considered to investigate their consistency with experimental data.
Before investigating a relationship between data and introduced models, a data quality analysis method called Kramers-Kronig (KK) is used to be sure that data are linear, causal and stable thus self-consistent [
26]. KK relation dictates that real and imaginary parts of any immittance function are interdependent based on following equations:
Following the KK data validation, a software based on simplex algorithm is used to change model parameters to minimize the chi-square () value of the model with data. Model accuracies with respect to data are analyzed based on MAPE method for different SOC and SOH conditions. It is shown that a circuit with additional transmission line elements has the minimum error in comparison with measurements for the full range of SOC and SOH. Also, it is seen that the precisions of the models can be different for real and imaginary parts of impedance as well as the phase shift.
3. Model Accordance Comparisons of EEC Models with Data for Different SOC and SOH Conditions
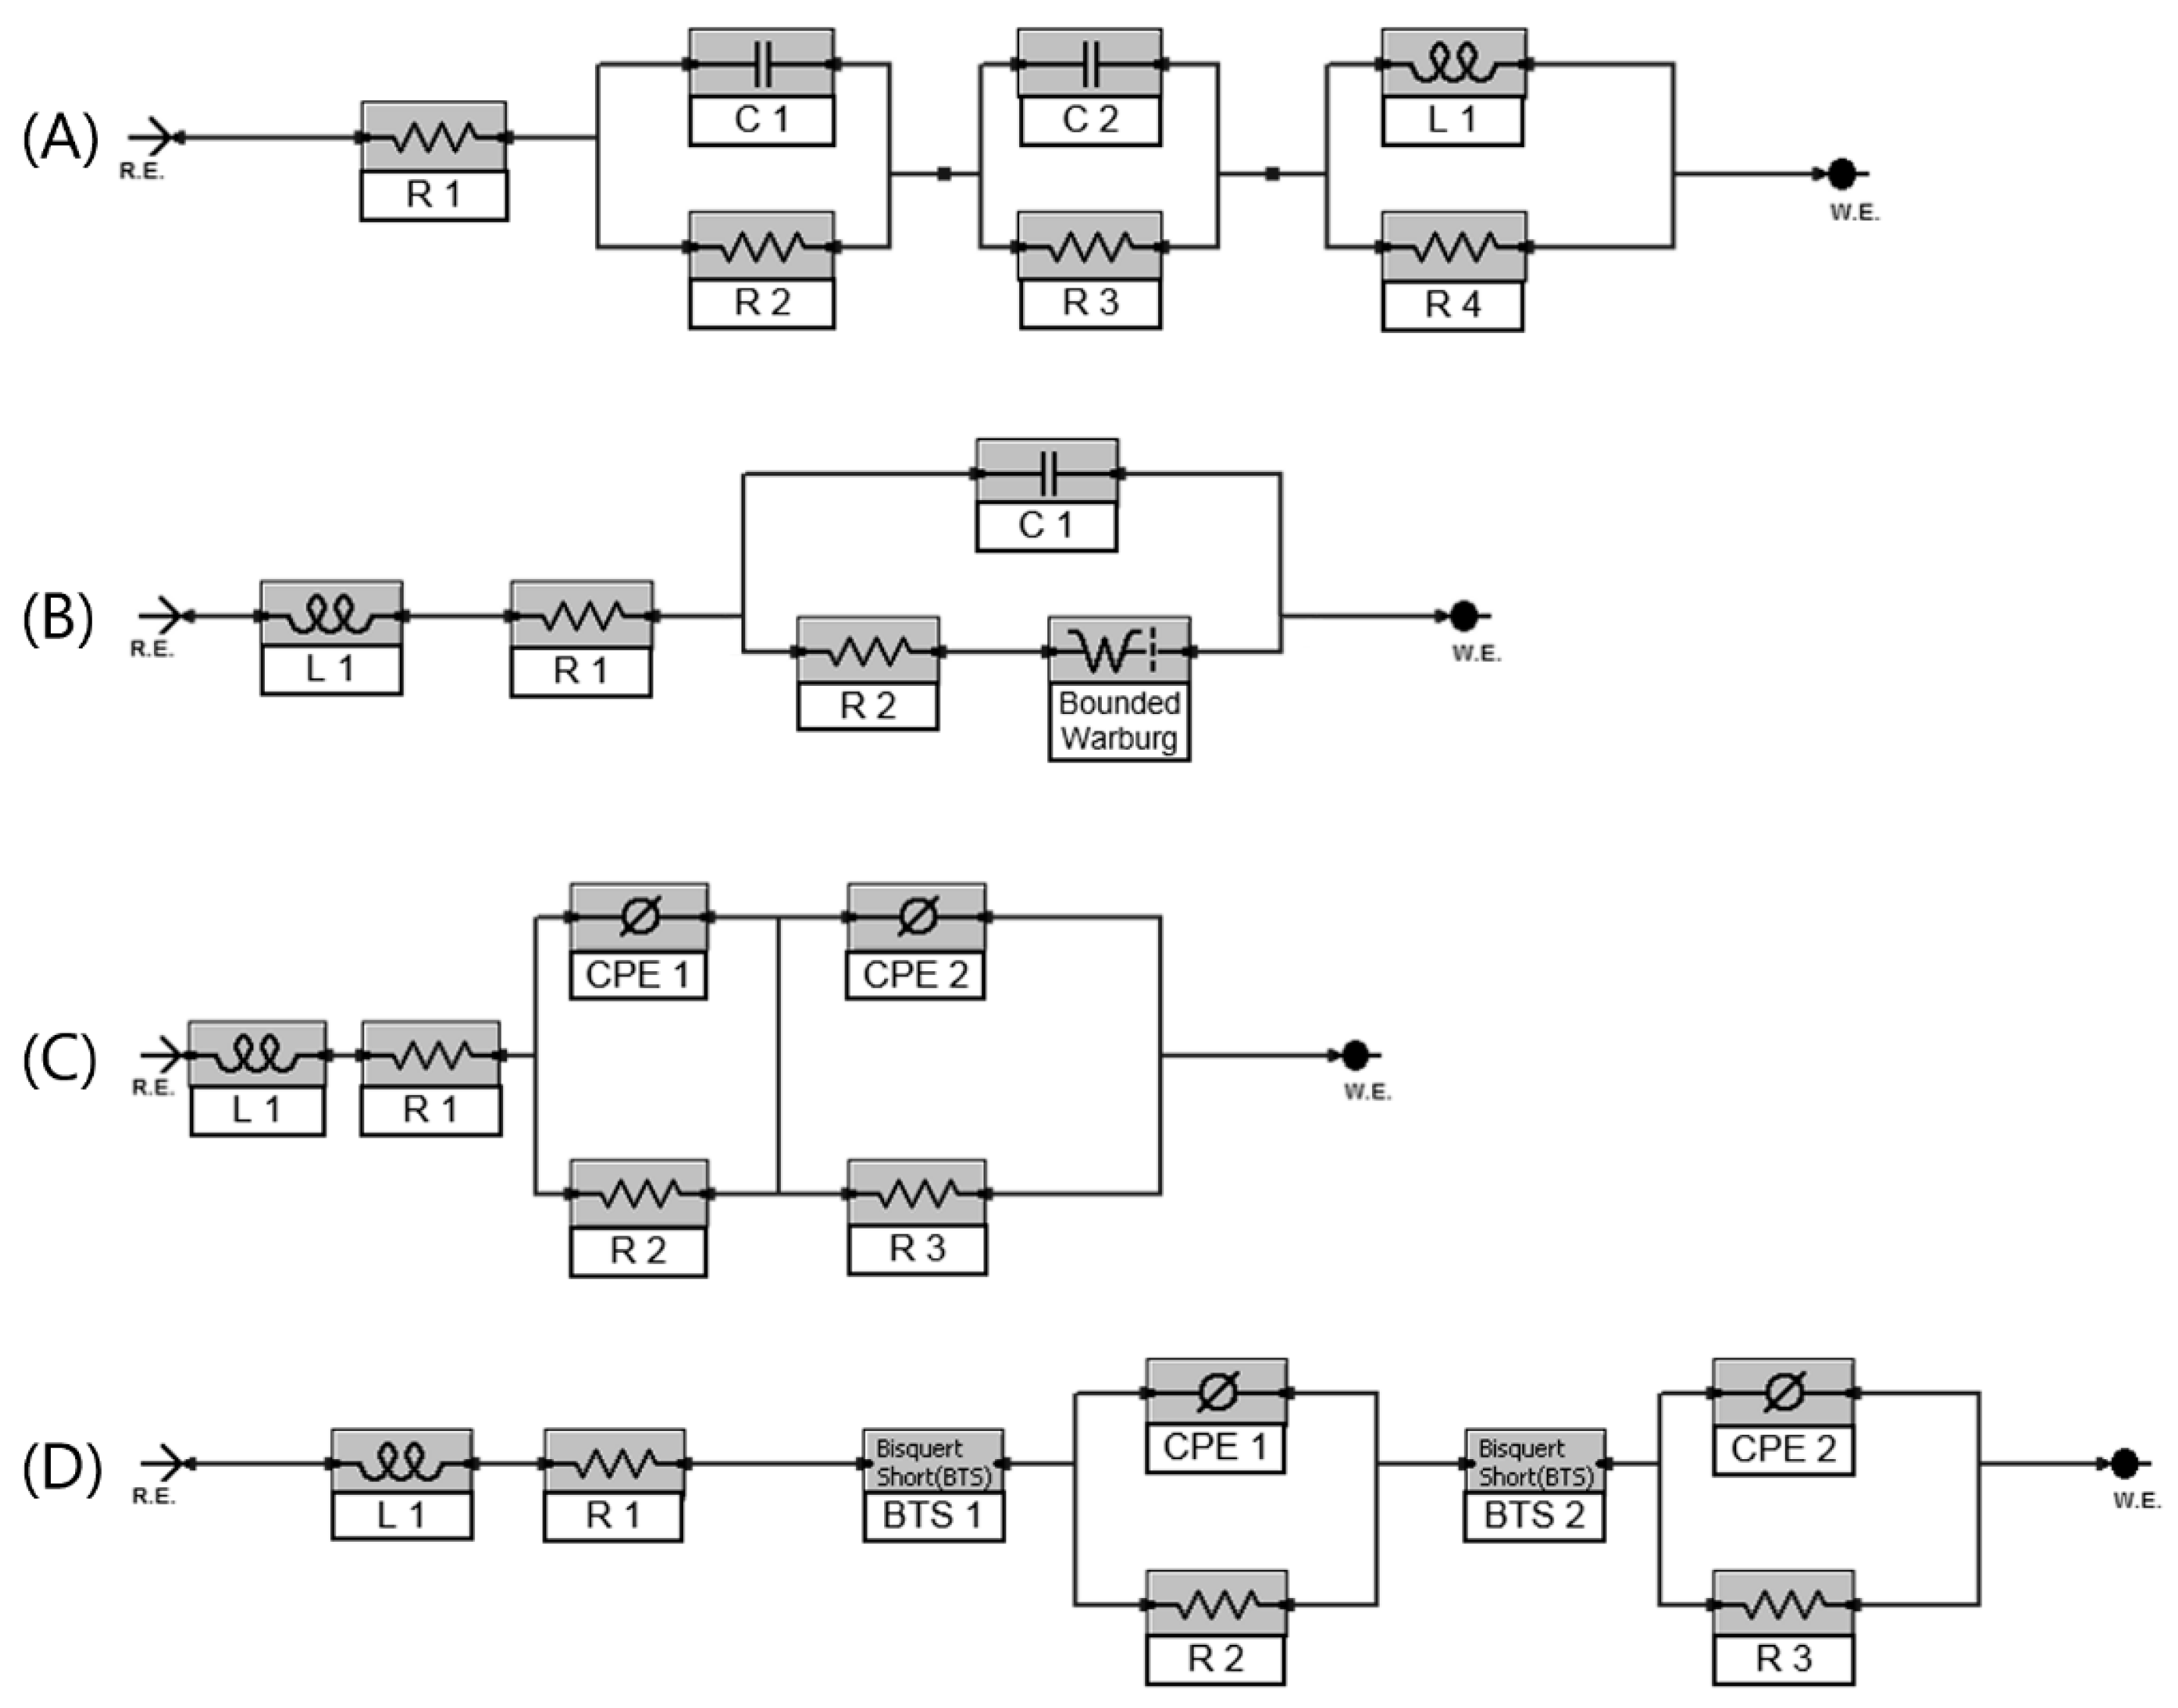
EIS graphs gives a lot of information and clues about the electrochemical processes in a battery if interpreted with an EEC where the elements have physical meaning and have a good match with data. To extract the useful information and make predictions for SOC and SOH from these data, an electric circuit model, which mimics the essential dynamics of a battery, is needed. Four different models are applied for gathered EIS data to analyze their consistency through a broad spectrum range for an EFB.
EEC models consist only from simple electric elements have been considered in the literature both for lead acid batteries [
22,
23] and for other chemistries [
13,
27,
28,
29] as well. In addition to SOC and SOH estimations there are applications of these models as a thermal model for batteries [
30]. On the bright side, these models require less computational power, thus less time to give a prediction and have a good consistency with data on the higher frequency range if they have a serial inductance. They can be used to mimic the voltage response of batteries for a given load using parallel with a coulomb counting based SOC calculator. On the other hand, their impedance response consistency with respect to data are lower than those of other models because of difficulties in describing the electric characteristics of diffusion mechanisms by conventional elements. Thus, as the excitation signal frequency decreases model consistency with the data decreases. Further studies such as neural network training [
23] or variances of Kalman filtering [
11] for that type of EEC’s have been developed to decrease the model error margin. A simple element model is seen in
Figure 6a.
A Randles cell, shown in
Figure 7B, also finds approval to interpret lead acid batteries [
24]. Elements of the circuit cover the essential dynamics of a lead acid battery. A serial resistance for the frequency independent parts like separator and electrolyte resistances, an inductance for all the high frequency metallic components, a parallel capacitor for the electrochemical double layer effect, a parallel resistance for the faradaic reactions that occur on the electrode’s surface and a Warburg element for the diffusion related mass transport limitation processes of the battery.
The non-ideal capacitive behavior of an electrode appears with suppressed semi-circles on the Nyquist plot of EFB. It is hard to imitate this behavior with parallel RC circuit. Model A has been modified by using a constant phase element (CPE), which is a capacitor with a leakage parameter of α. Impedance expression of CPE is given as:
if
α = 1 then CPE element becomes a pure capacitor. When
α goes to 0, it behaves like a resistor [
31]. This EEC has been used in several works [
19,
25] to get a more accurate electrode behavior of lead acid batteries compared to first two models.
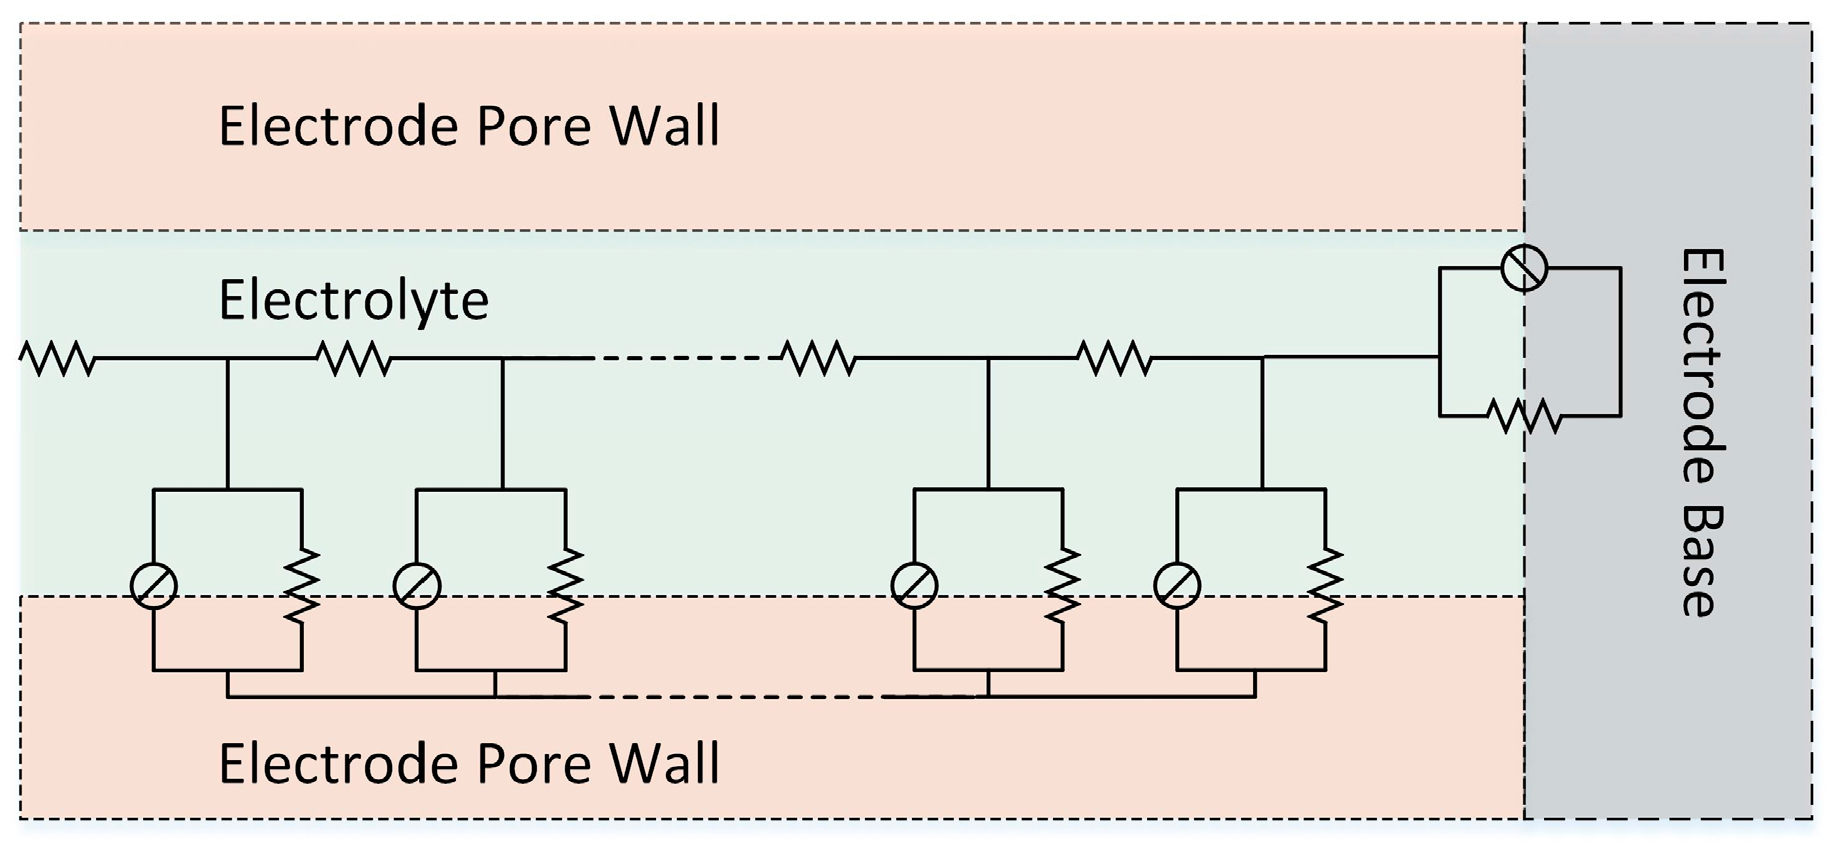
High electrode surface area is a key parameter to get a high power and dynamic charge acceptance as well as low internal resistance. New and highly porous active materials have been developed in lead acid market and applied on EFB as well as other electrochemical power sources. EEC models, which consider the electrode-electrolyte interface as a planar surface, are based on an assumption that the reaction occurs directly on the surface of the electrode. For a porous electrode surface, however, ion diffusion parameters depend on electrolyte concentration and it changes as ion penetrates into the deeper part of pores. Due to continuous parameter changes through the pore, ion diffusion and charge transfer parameters are modelled with infinite number of elements. An illustration of a transmission line element for ion flux inside a pore is given in
Figure 8.
The impedance of such a transmission line element for porous electrodes on different media has been calculated in the literature before [
32]. Theory explained in that work has been applied from super capacitors to dye-sensitized solar cells and many other applications where diffusion and recombination processes occur.
Due to the nature of lead acid battery chemistry the substrate surface is not isolated and interacts with the electrolyte. Thus, a transmission element, which also includes interactions on the pore bottom, is considered here. The widely used EEC in
Figure 7C is modified by adding a transmission line element and the model given in
Figure 7D is proposed for an EFB for the first time. The results and accuracy of the proposed model with those of other EEC models are compared by following the Kramer-Kronig validation of each data set.
EEC models are applied to experimental data by a commercial software based on simplex algorithm which tries to minimize the
value between data and model prediction.
is defined as:
where number of data is 71 and
wi is:
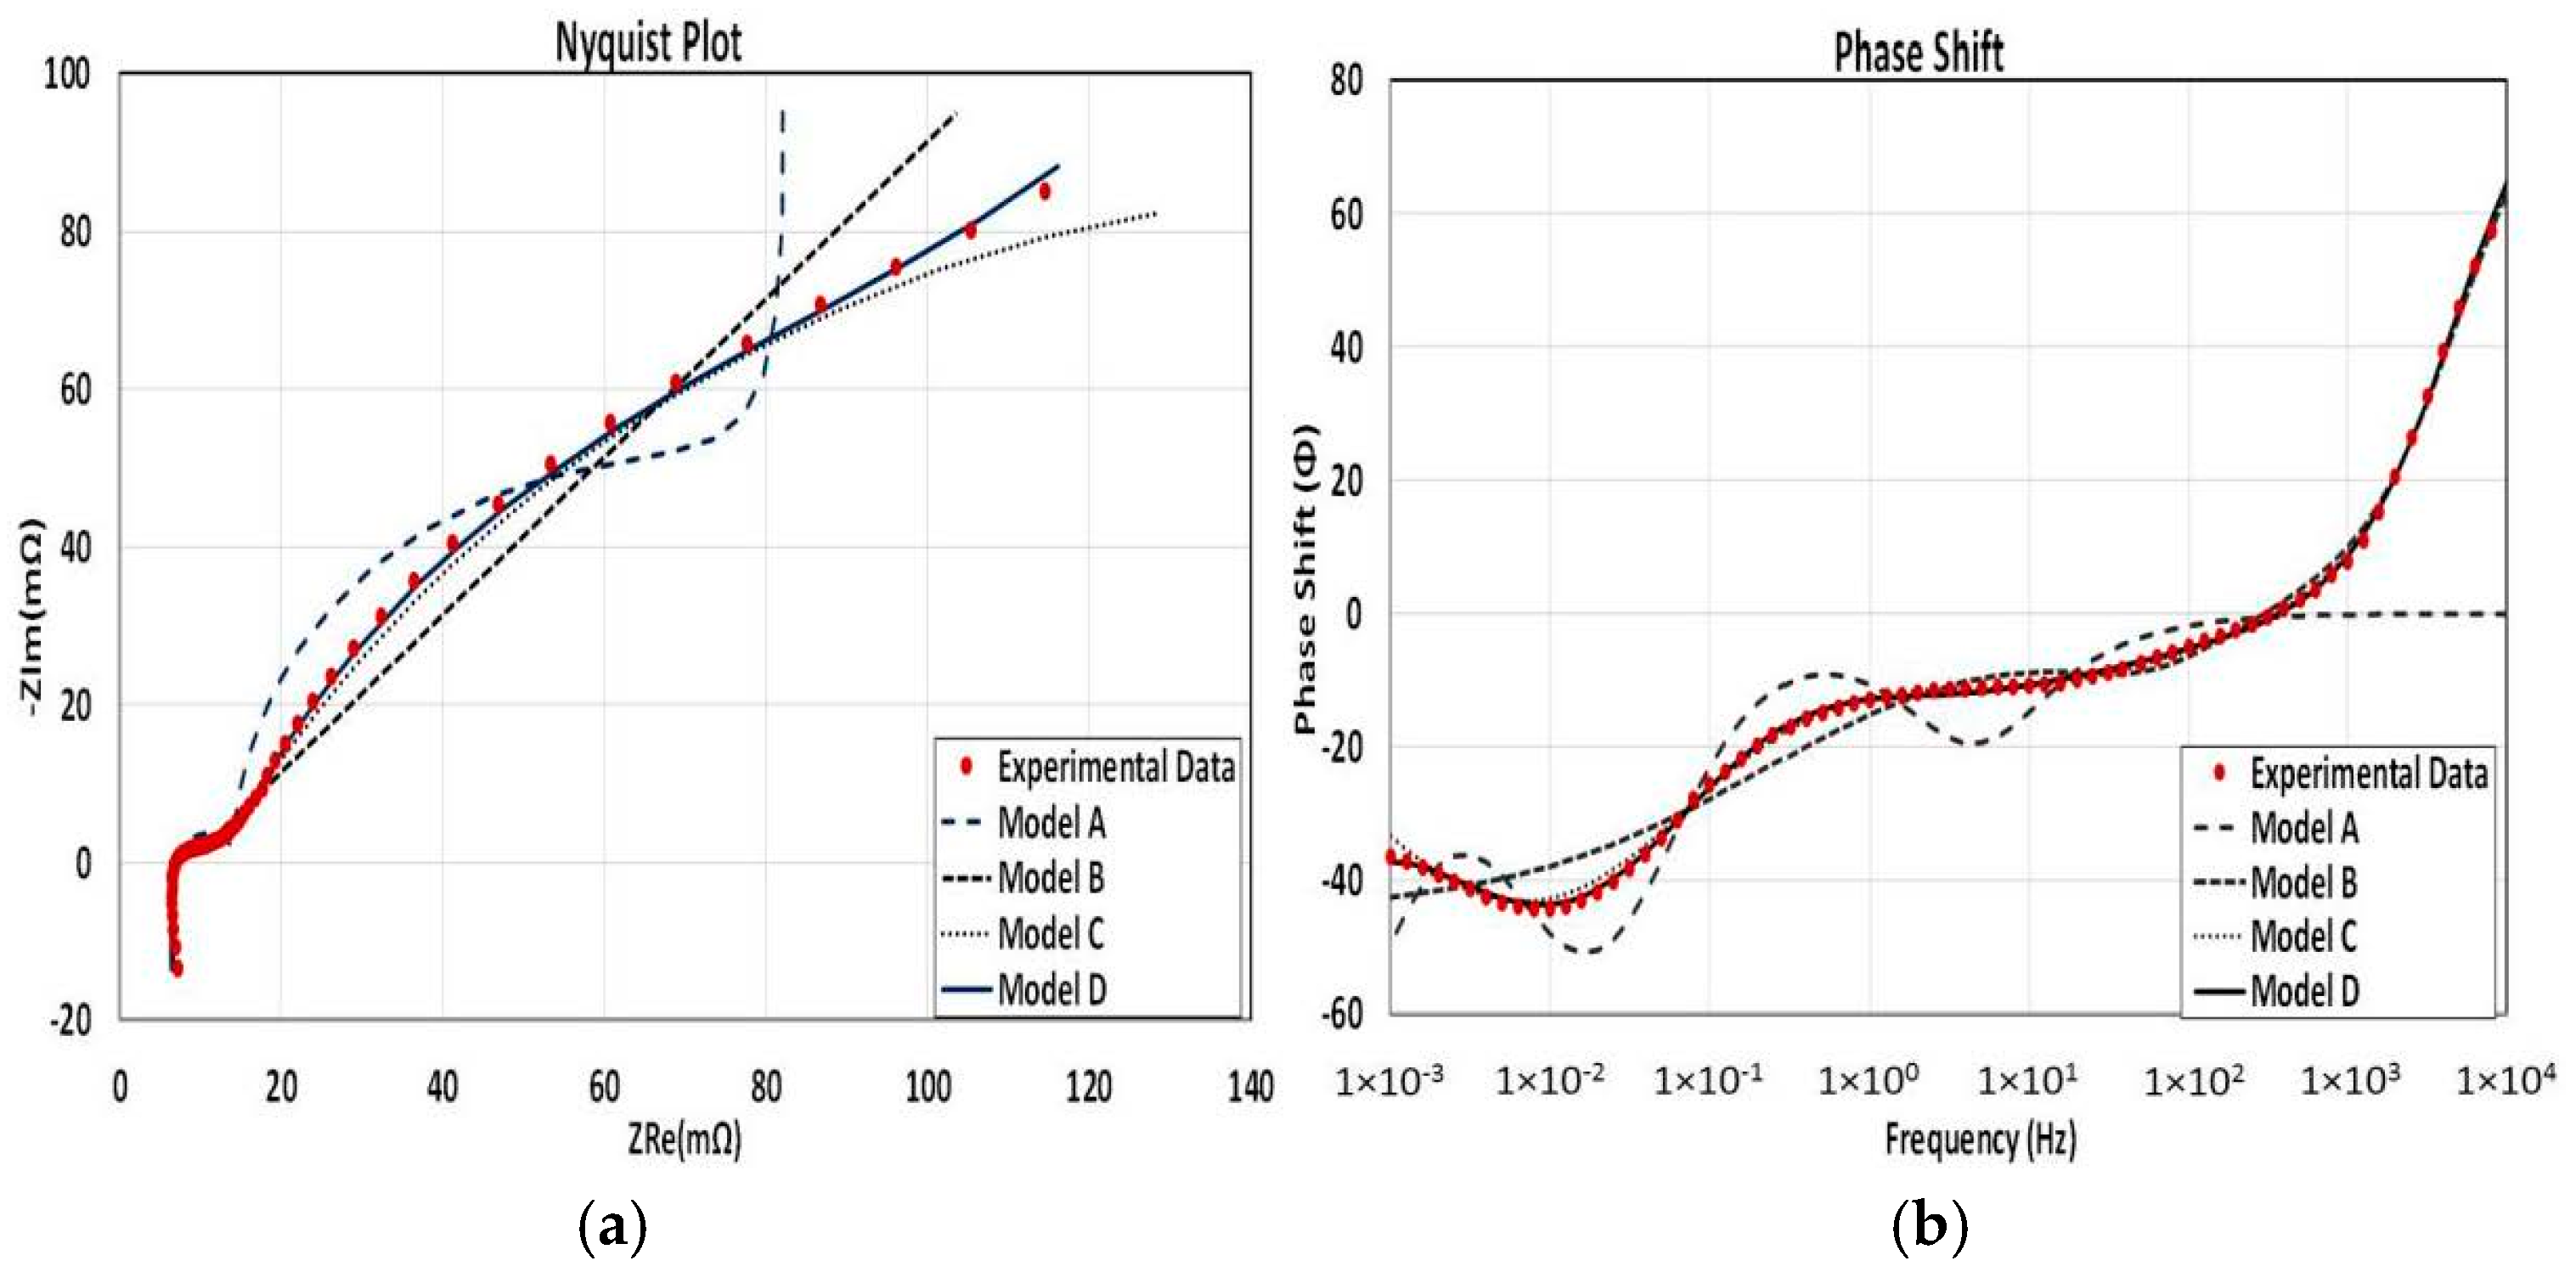
Nyquist and bode diagrams shown in
Figure 9a,b are given to demonstrate the accuracy of data fitting of various EEC models. The graph belongs to the battery almost at the end of its life (20% SOH) and 80% SOC level. It is seen that without applying a further improvement technique, a simple circuit model (Model A) is not able to express the electrochemical phenomena on an EFB especially for the lower frequencies. A Randles circuit with a CPE (Model B) has a good agreement with data at the higher frequency region though its accuracy decreases sharply below 1 Hz. The third EEC model, which has a serial resistance and an inductance connected to two parallel R—CPE elements (model C) to represent both electrodes, has much better compliance with the experimental results in comparison with model A and model B for the whole frequency range from 10 kHz to 1 mHz. In the fourth and final EEC model, transmission line inclusion to both electrodes (model D) decreases the discrepancy between the data and the model further.
To make a quantitative comparison on the accuracies of the models, all three measured parameters
ZRe,
ZIm, and the phase angle
Φ are compared with those of each model based on mean absolute percentage error (MAPE) method. MAPE calculations of
ZRe,
ZIm, and
Φ are given in Equations (6)–(8), respectively.
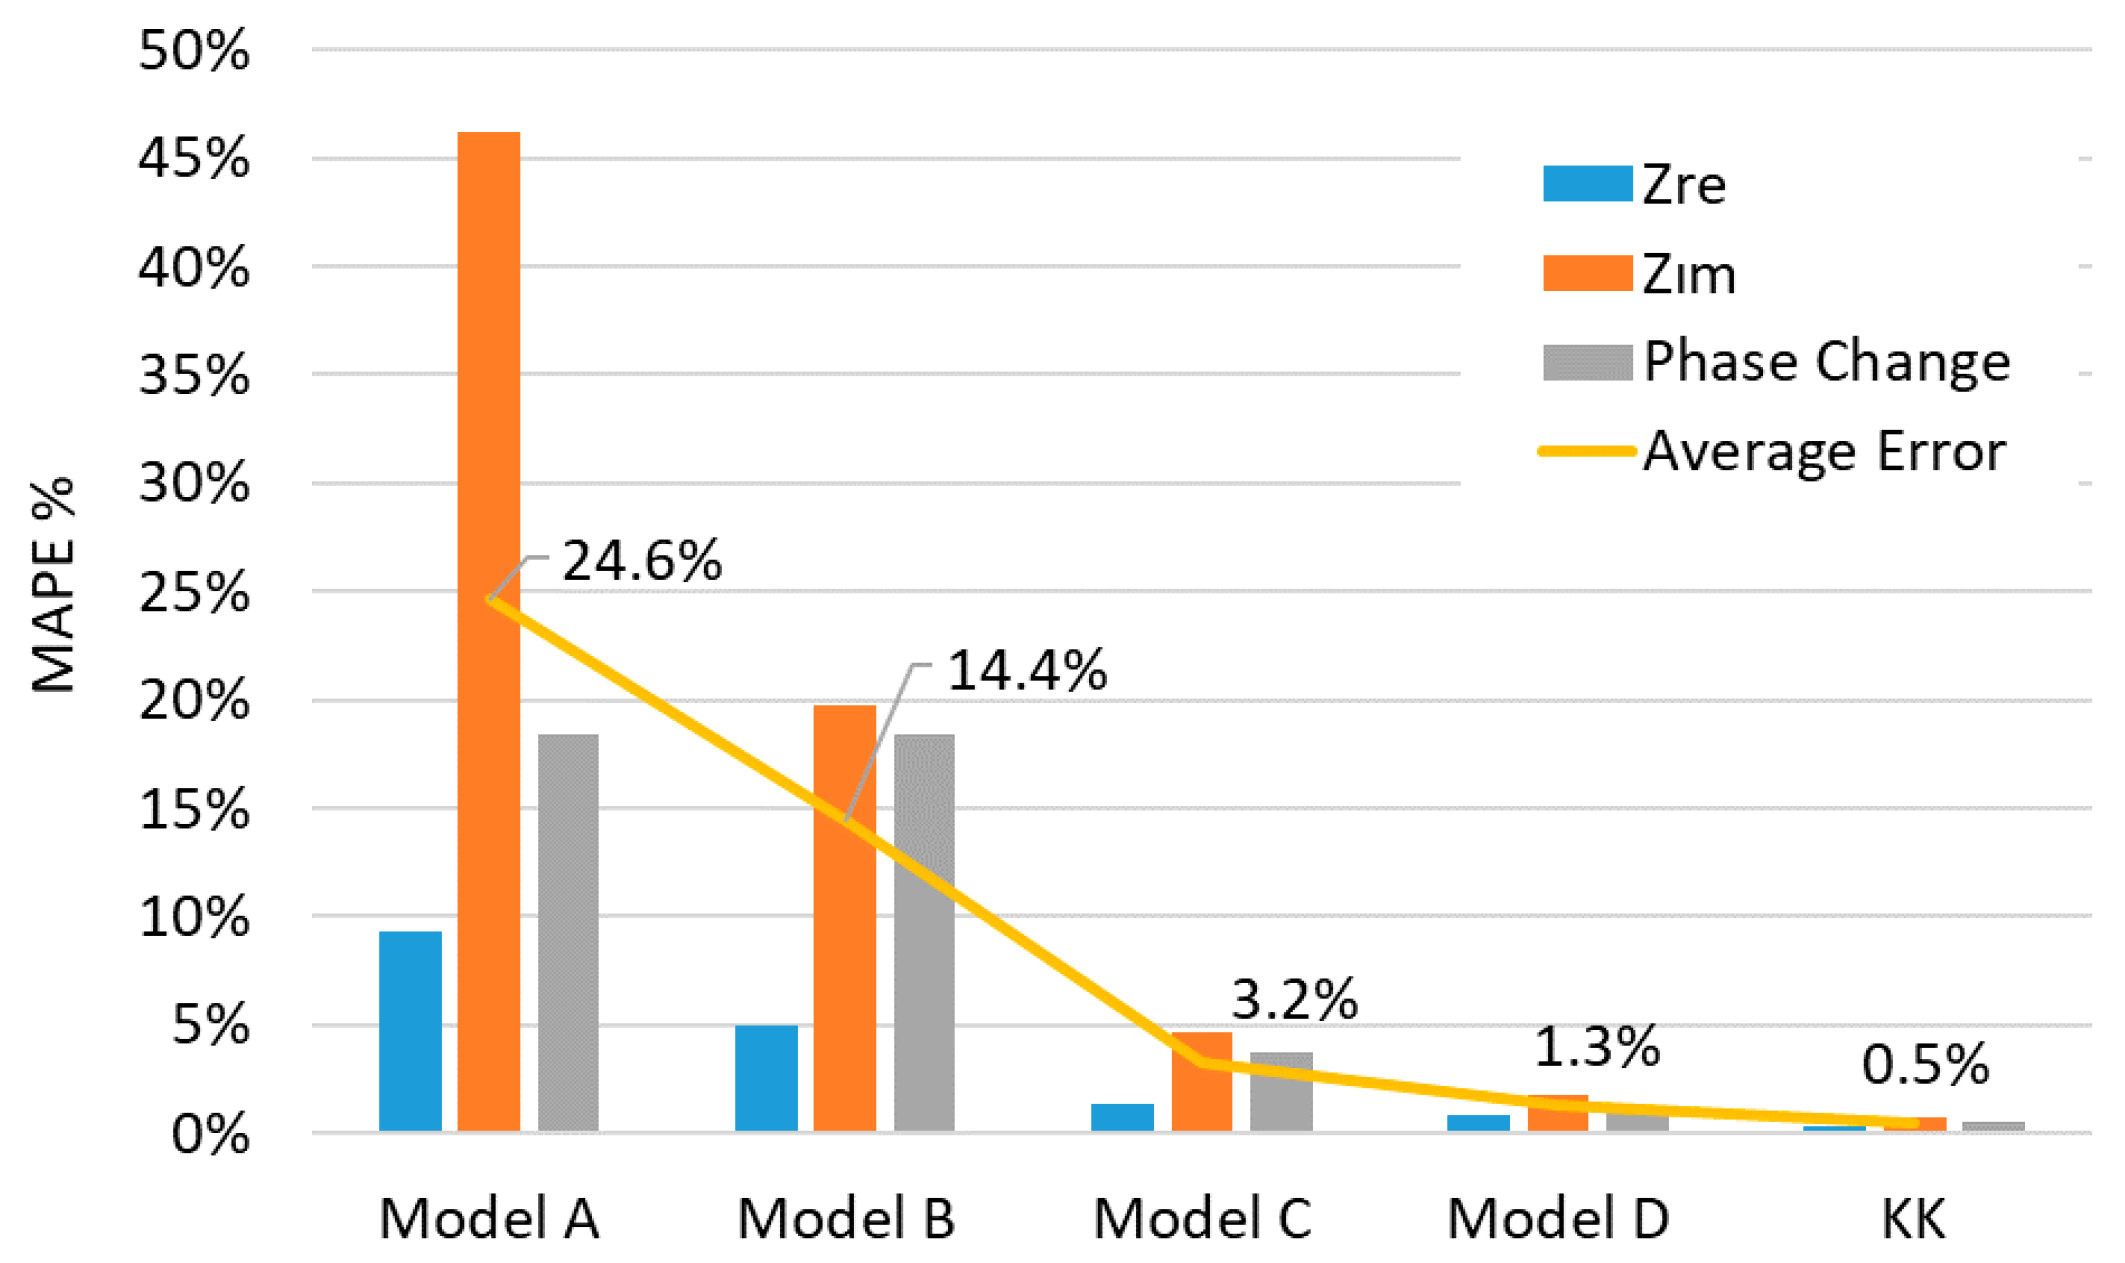
MAPE values of
ZRe,
ZIm, and
Φ are given in
Figure 10, for all four models.
Model A has a compatibility with the data only for a limited range. Although it can start with a matching real resistance, lacking a serial inductance prevents it to handle the positive imaginary part of the data for the high frequency part. Parallel R-C and R-L parts are trying to form two semi-circles and a sharp diffusion behavior which could not cover the data well enough in most circumstances. Similar model-data mismatch continues for the phase shift at the high frequency range and resulting a bigger average MAPE value than other models which is 24.6% as can be seen in
Figure 8. Model B can cover the data with a good match for the high frequency region with a resistance inductance couple in series but highly linear response of the second part decreases the model compatibility as the frequency decreases. Model C, which is extensively used in literature, can cover the data with 3.2% average value of MAPE and has a good adaptation to the data through the whole frequency spectrum. Similar to the previous model, its serial resistance and inductance elements can handle the high frequency spectrum while two ZARCs in series are matching well enough to model the data on lower frequency range. Adding transmission line elements prior to each ZARC element on Model C decreases the error margin even further down to 1.3%, which is shown in Model D.
Data fitting procedure is applied to 11 different SOH level for nine different SOC conditions as explained in
Figure 1. Prior to each fitting trial, Kramers-Kronig (KK) test is applied to the gathered data. Except the fully charged states, KK can track data with a goodness of fit value of less than 8 × 10
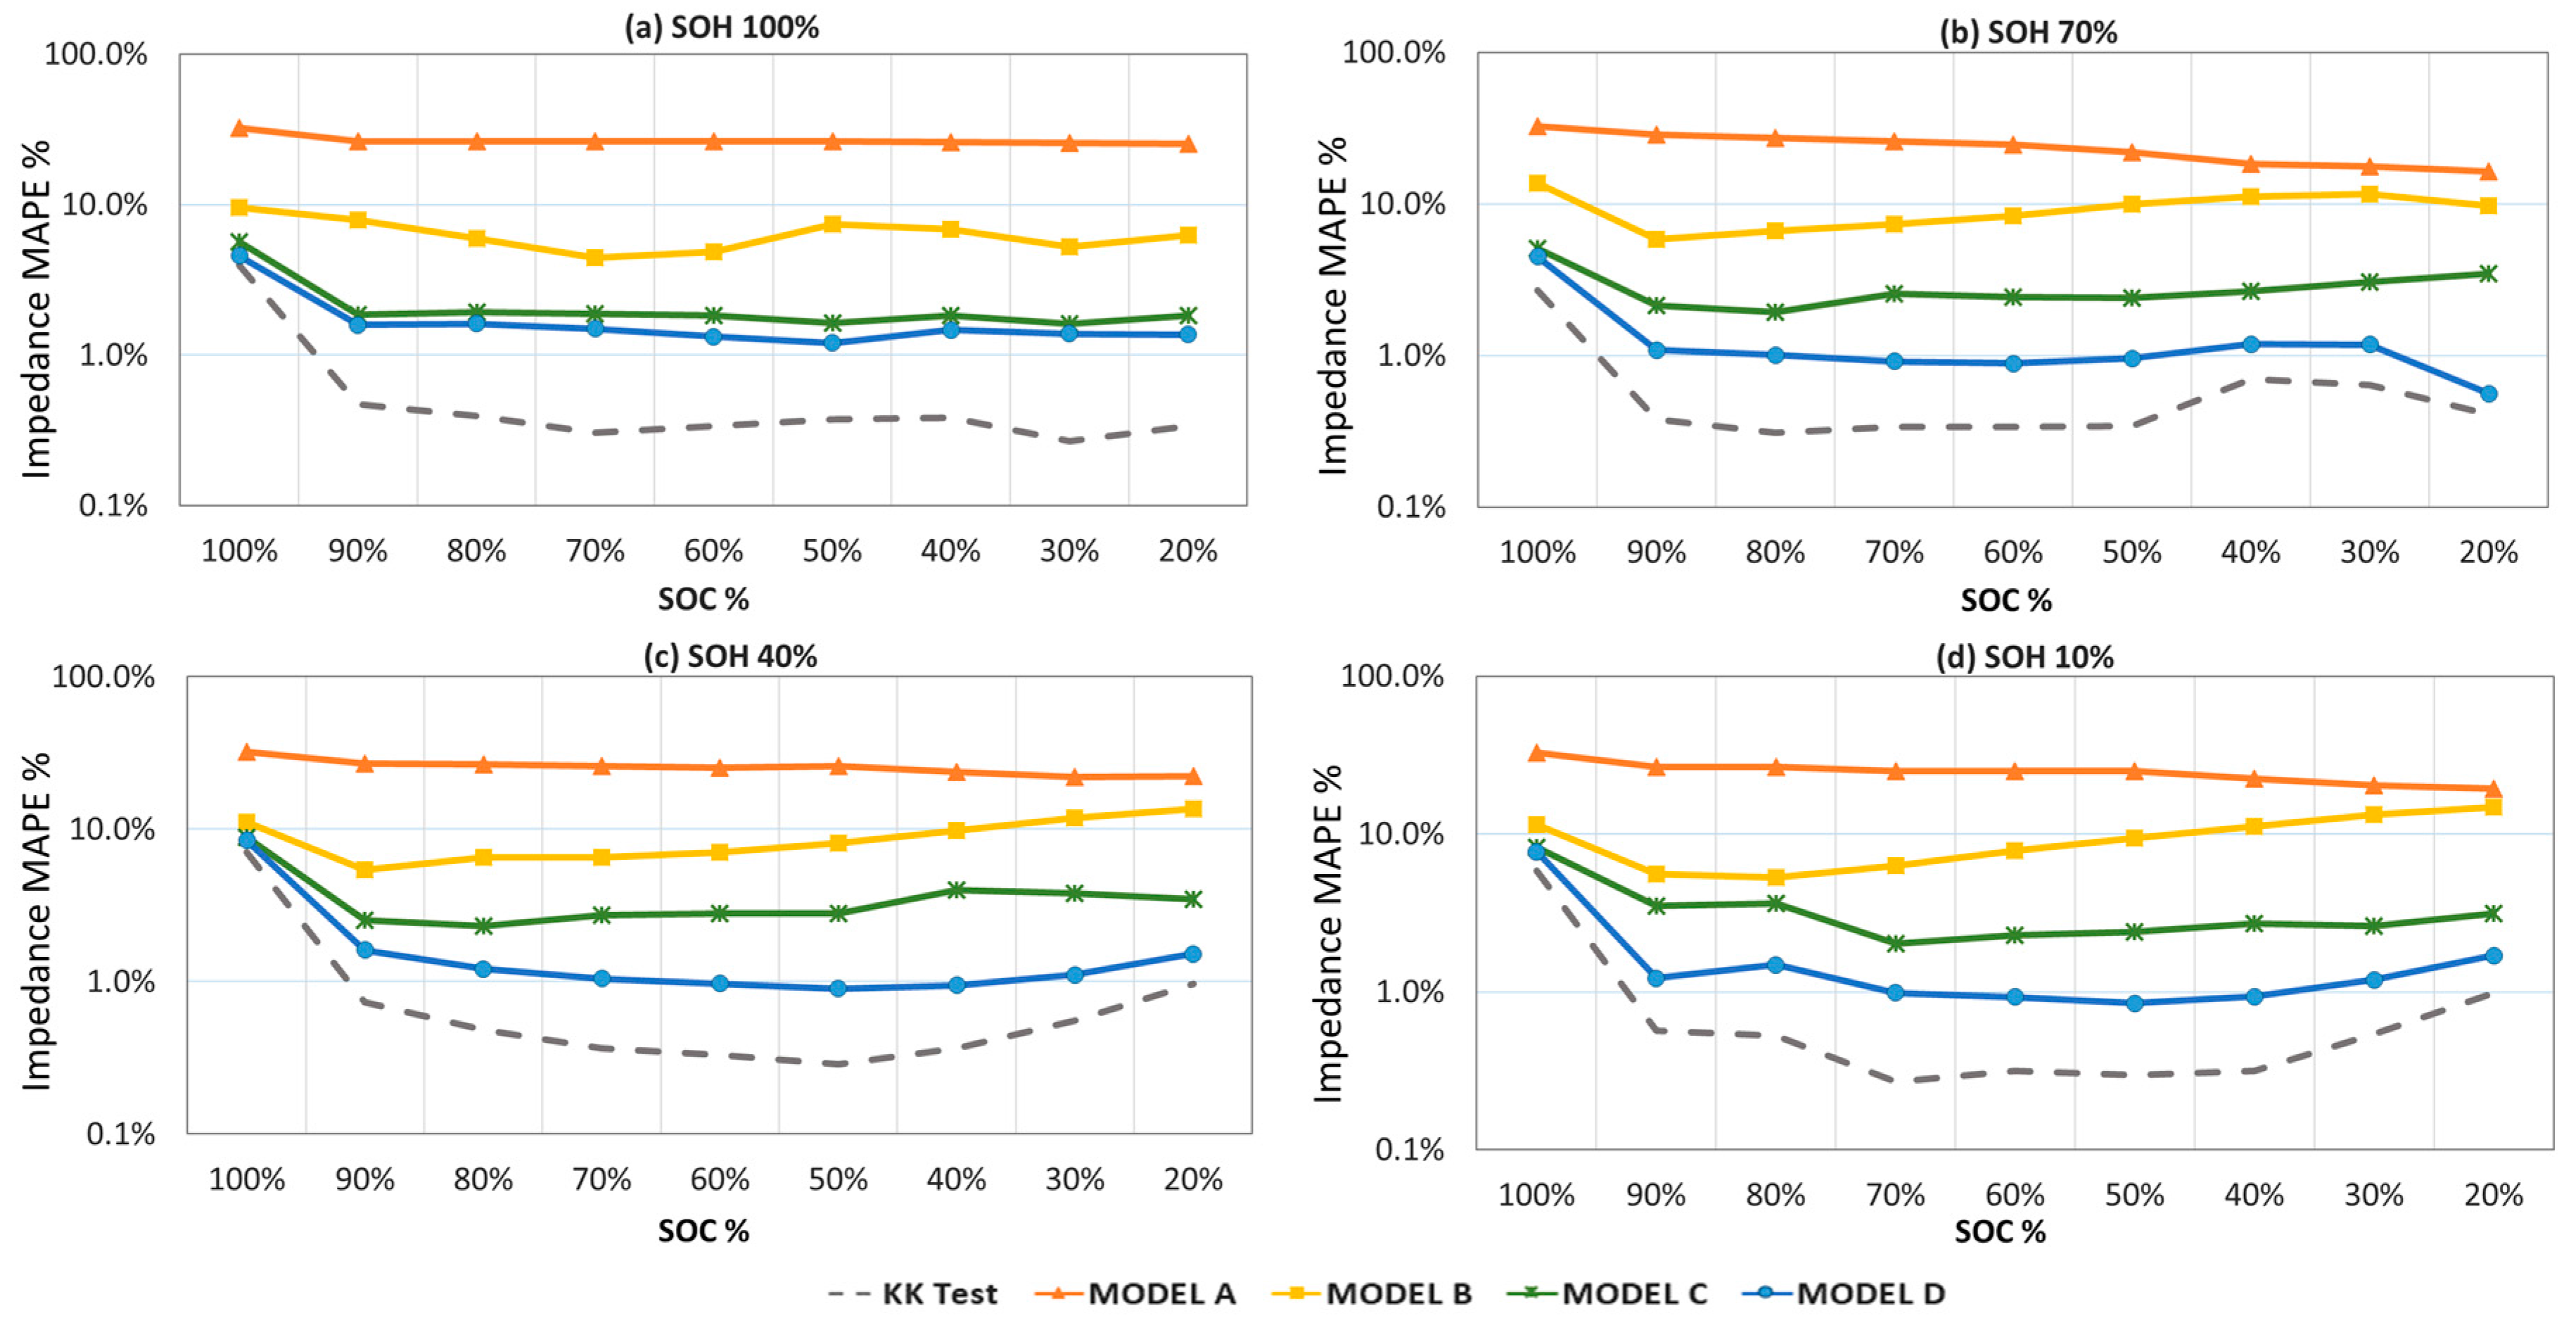
−6 which indicates the reliability of data sets. At 100% SOC levels data solidity decreases because of the overcharging behavior of the lower frequency signal deteriorates the Lissajous curves. Beside that state of charge, KK values are always lower than 1% error range for all three measured parameters. Variations of MAPE values for all four models throughout the whole SOC range as the SOH decreases are given in
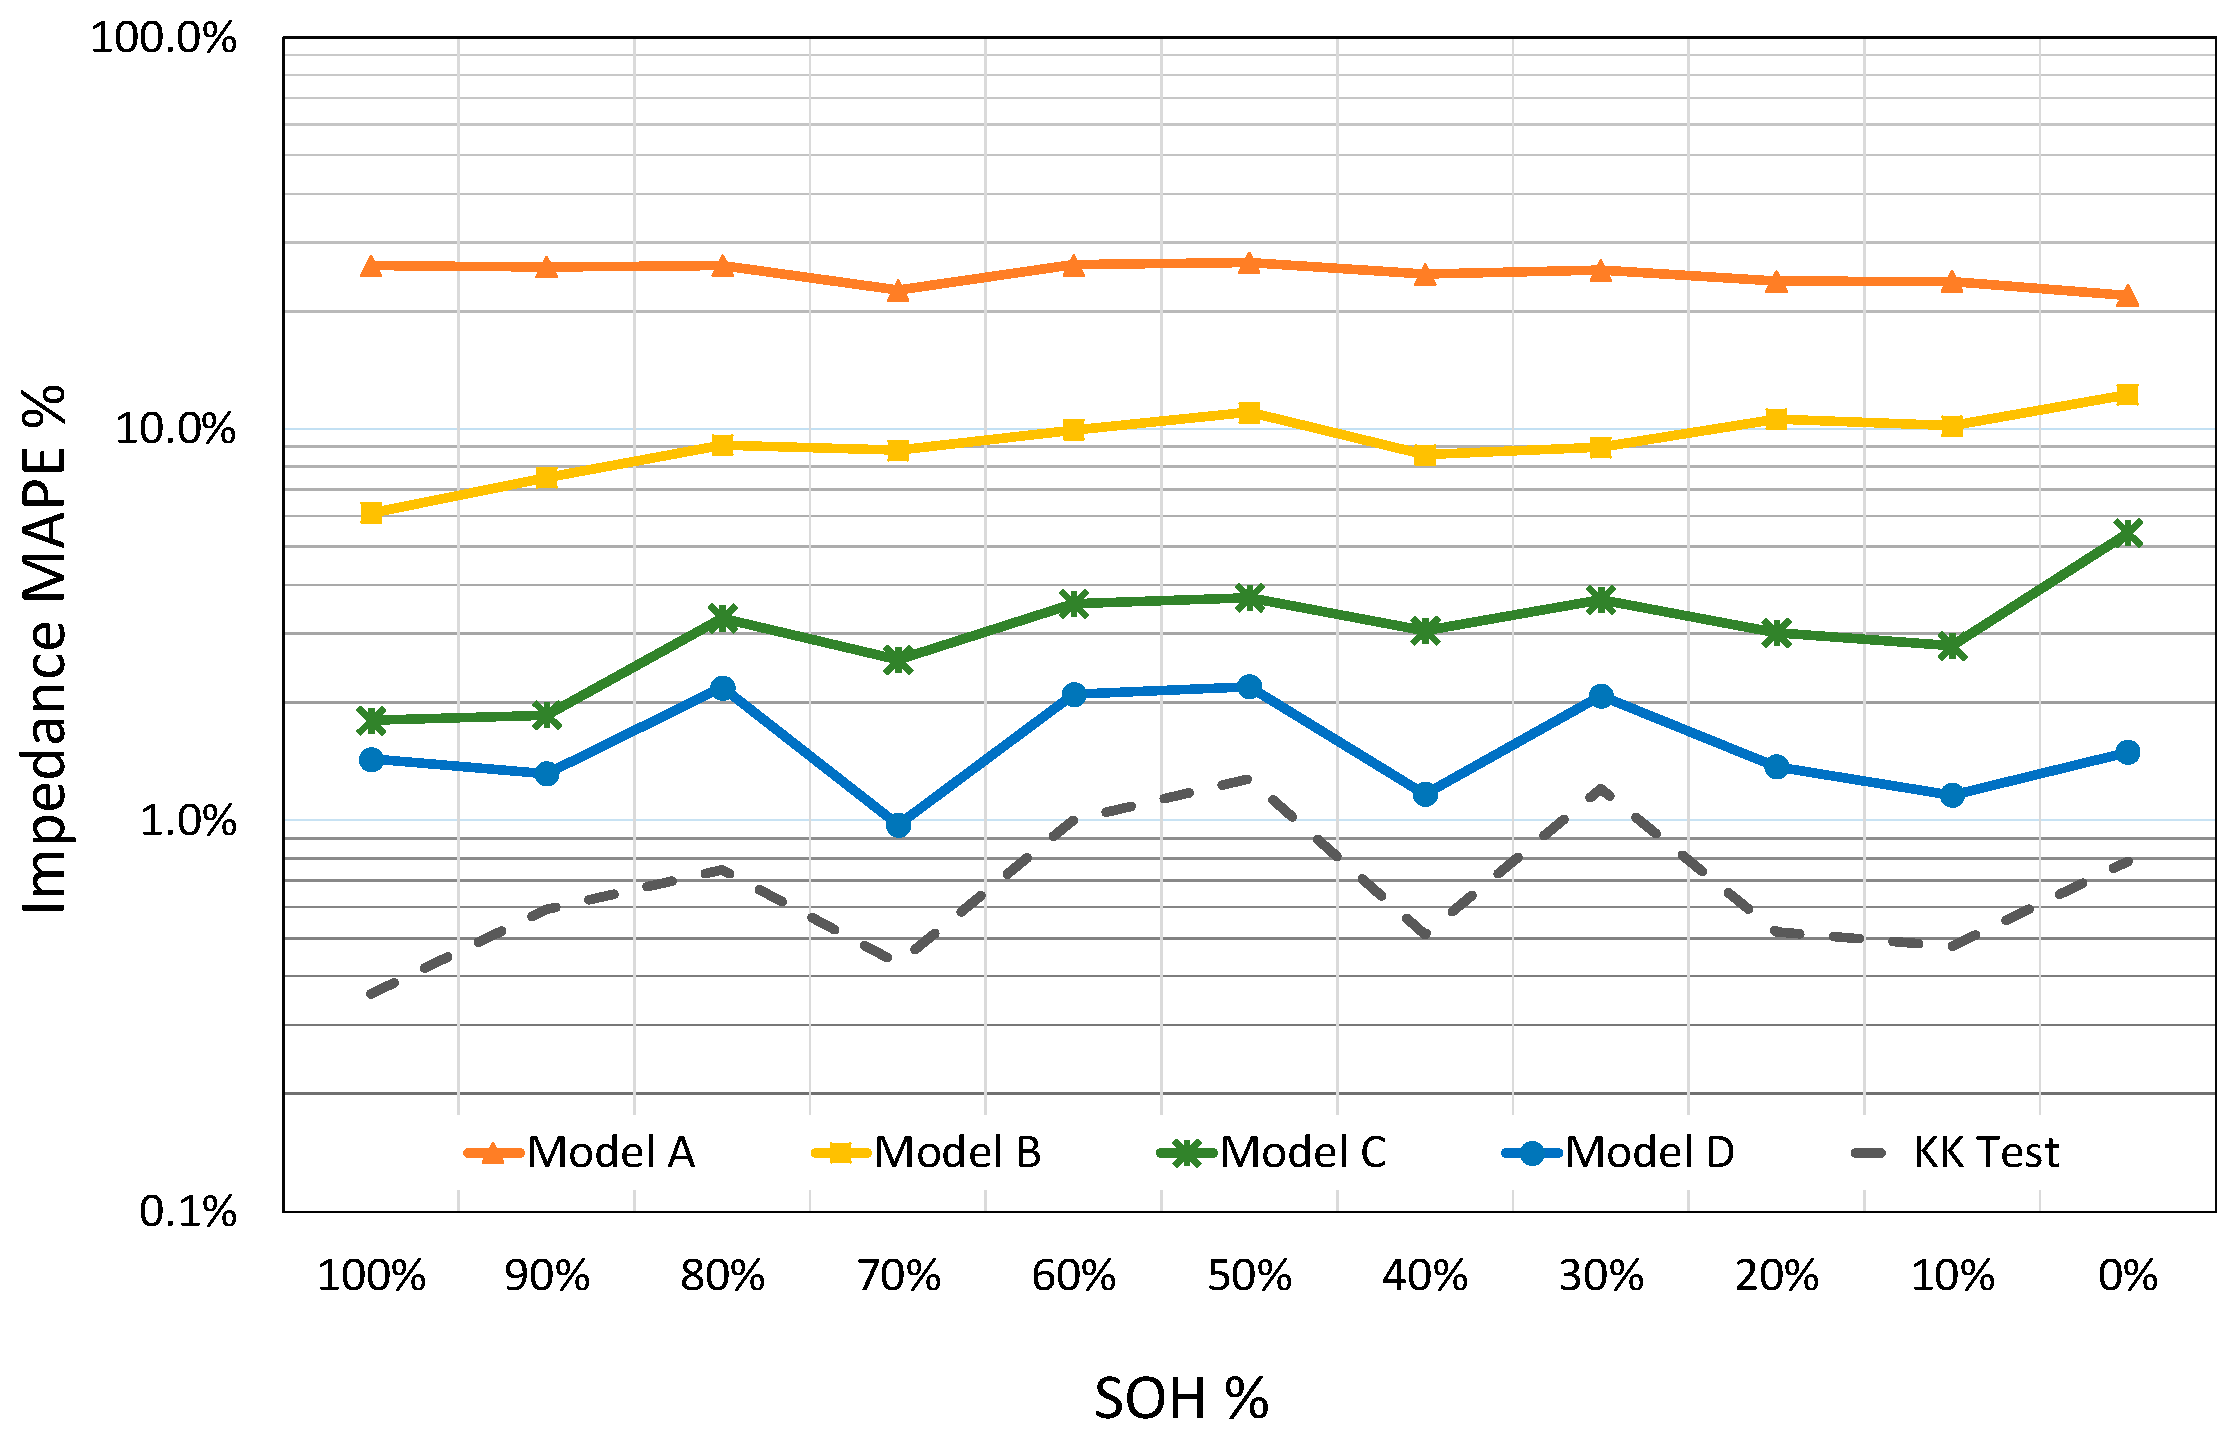
Figure 11. It is seen that Model D, with transmission line elements, preserves its lower error margin and the accuracy is always higher than those of other models.
Based on the averaged MAPE value of all SOC values for a certain SOH, four models and KK values are compared with respect to each other in
Figure 12. Depending on data quality based on KK results, the averaged MAPE values of Model D over SOC vary from 1.0% to 3.4% for different SOH values and gives 1.6% double averaged result over SOH while the double averaged value of KK is about 0.8%. On the other hand, the Model C can represent the impedance data with 3.2% double averaged MAPE over whole SOC and SOH ranges. The same quantity is 24.7% and 8.9% for Model A and Model B, respectively.
4. Conclusions
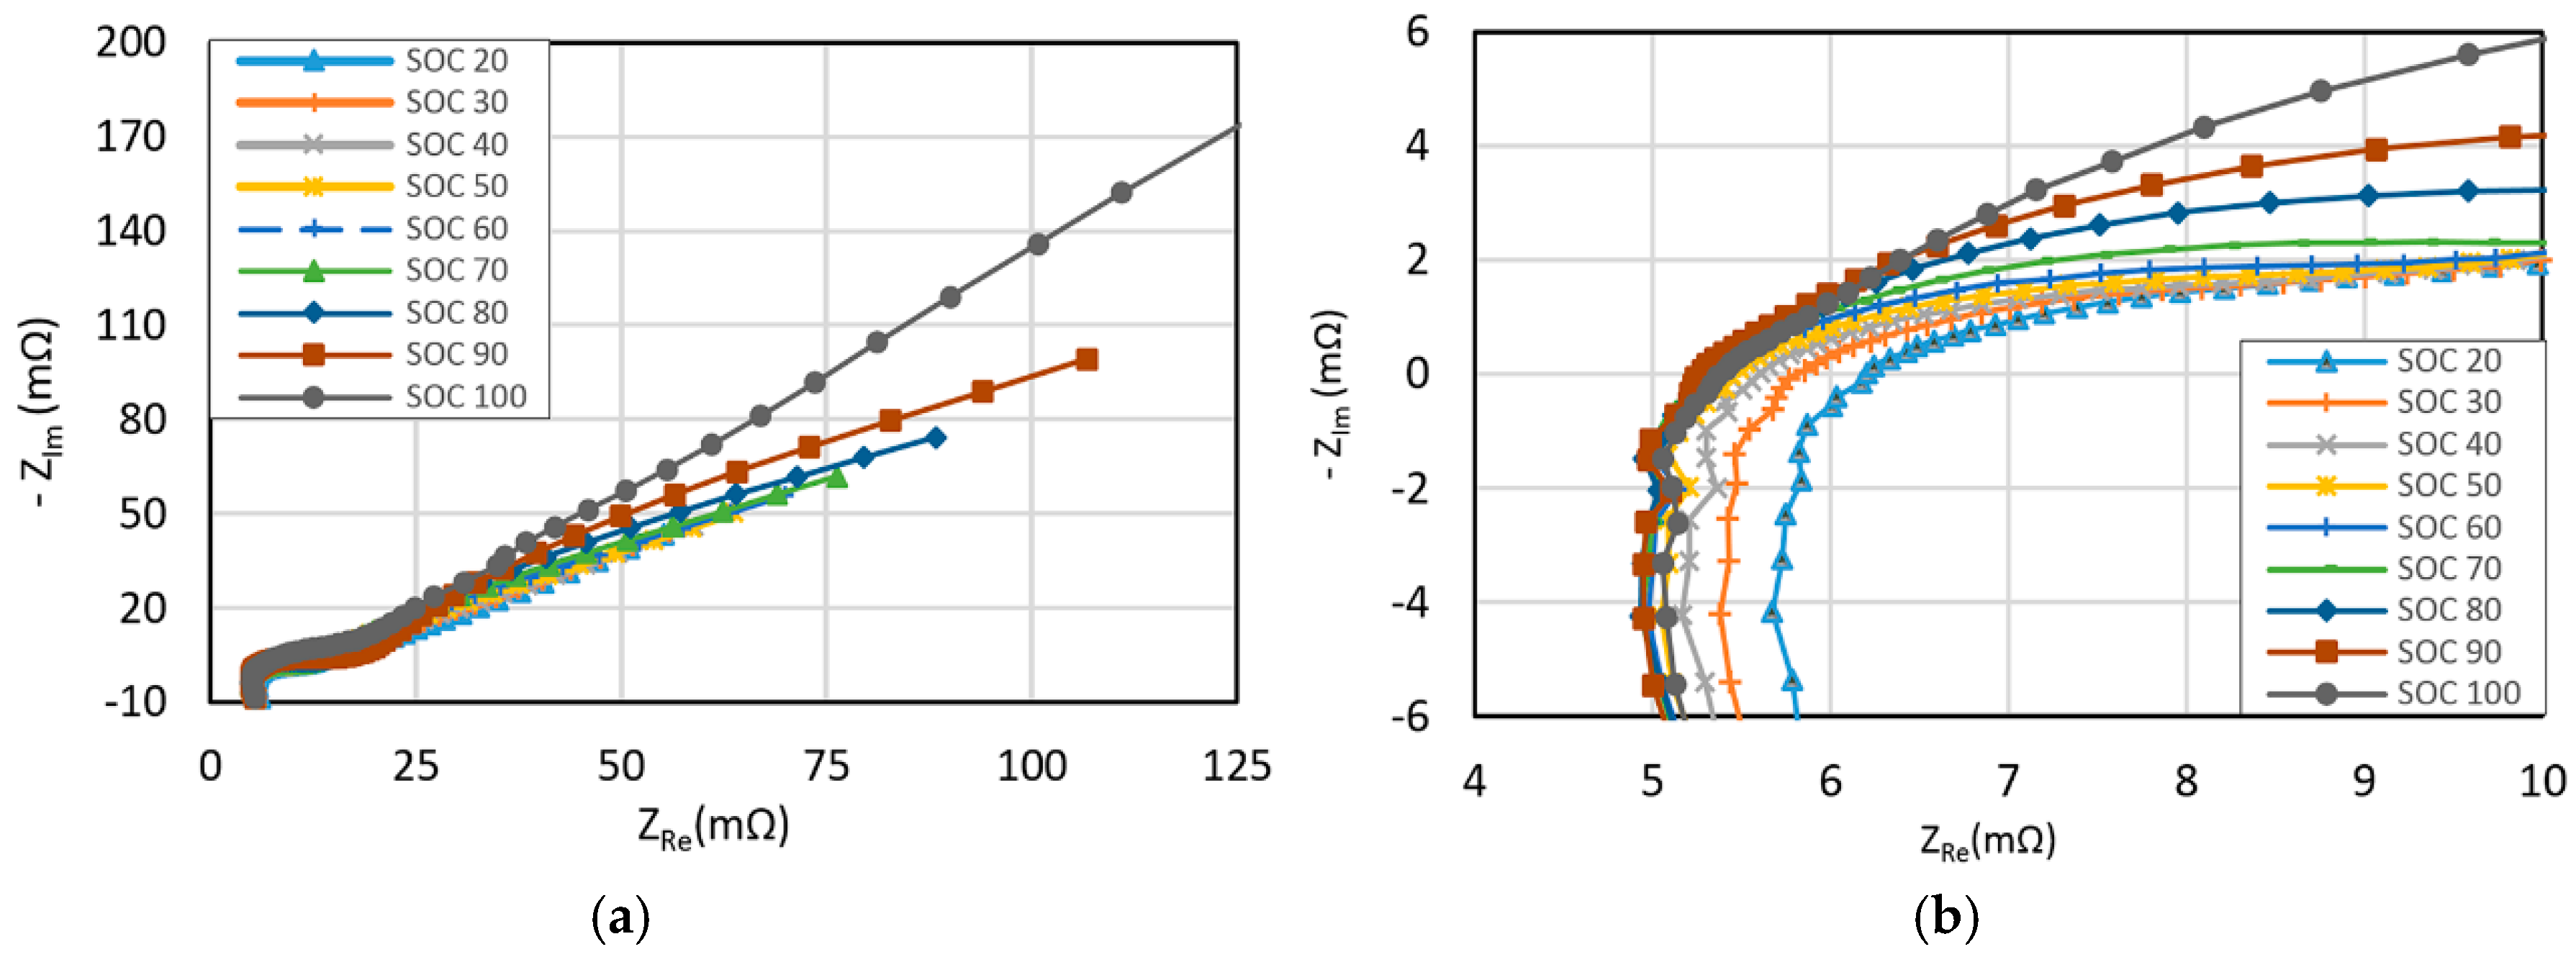
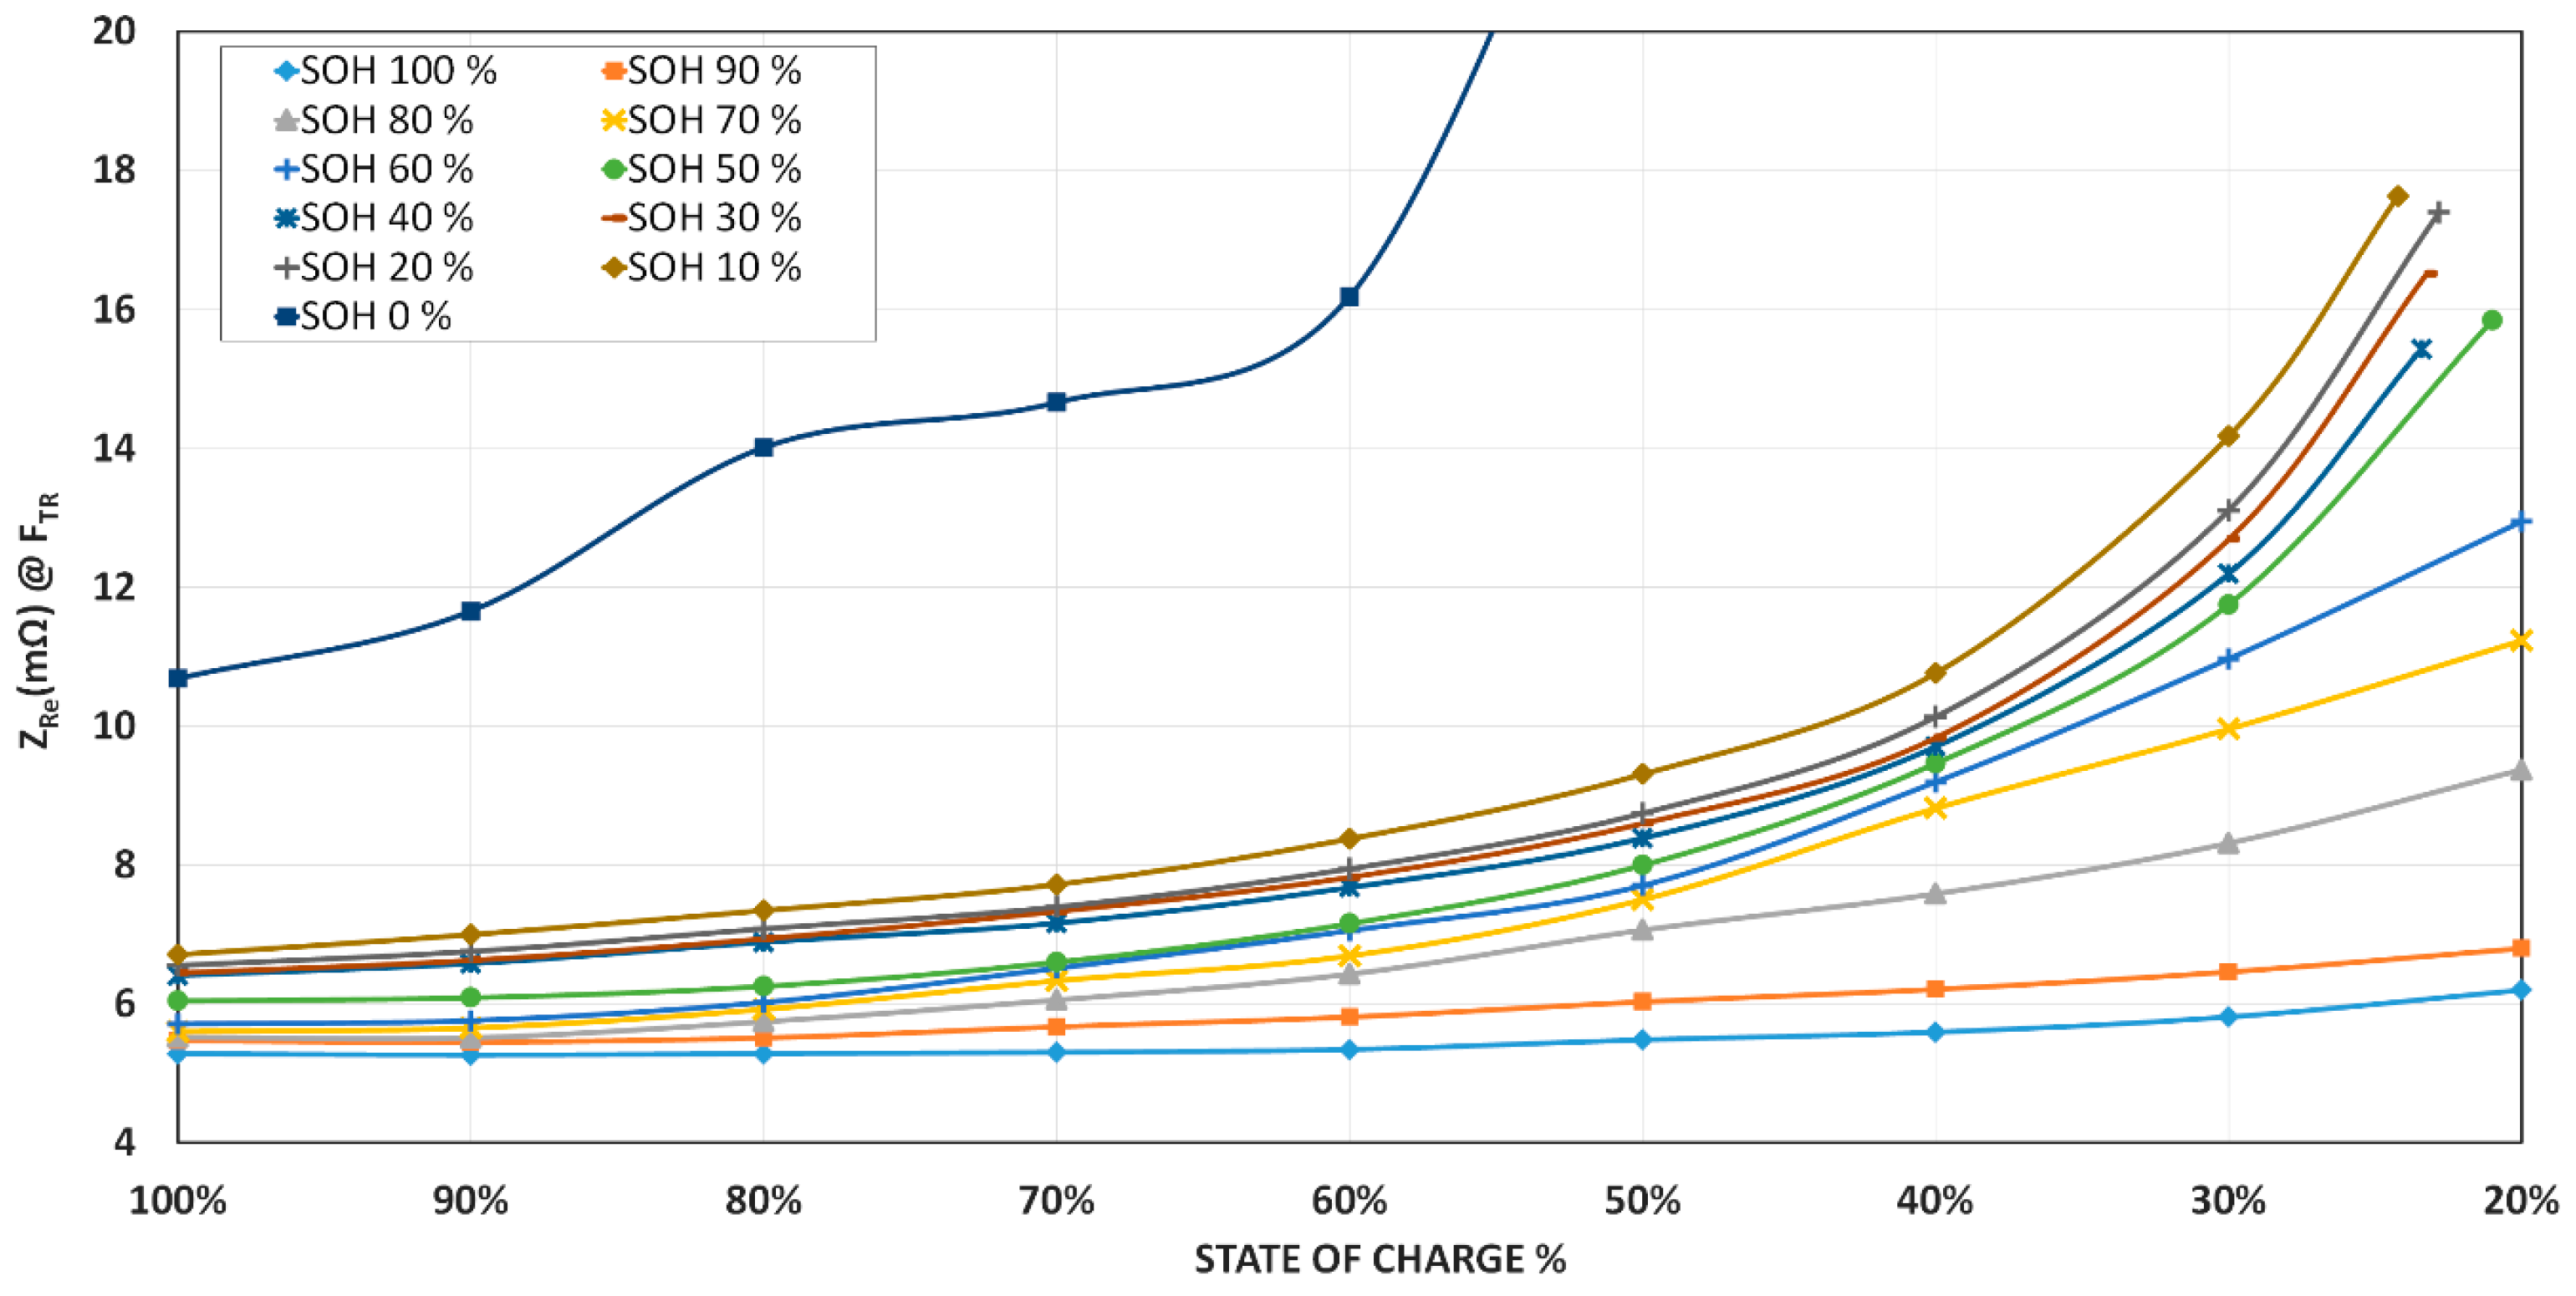
An enhanced lead-acid battery with increased cold cranking performance and cycle life is examined by EIS for a wide range of SOH and SOC conditions. Charge, discharge, and aging procedures defined for micro hybrid vehicle batteries are applied to the battery. Changes of resistance are also recorded for these various SOC and SOH steps through the lifetime of the battery. It is observed that increment of resistance between fully charged and empty states is limited by 7.9% for a new battery. This increment boosts to 162% when the battery reaches to the end of its life. Although there is a correlation between resistance and SOC, this correlation can only be used for SOC estimation if there is a certain knowledge about the SOH of the battery.
Four EEC models are applied to the impedance data gathered. Consistencies of models with data are examined for a broad SOH and SOC range. It is shown that the proposed model with transition line elements has better accuracy in comparison with those of other models. Although degree of freedom and computing time increase due to additional elements in the model, this problem is trivial for today’s modern computers. The marginal benefit of the model with transmission line element becomes evident as the battery’s SOH decreases. The double averaged MAPE value is only 1.6% for Model D while the Model C has 3.2%. As a result of this work, it is seen that enhanced flooded lead acid batteries with higher porosity electrodes can be simulated better through the frequency spectrum from 10 kHz to 1 mHz with transmission line element included EEC models. These models have a potential for a better SOC and SOH predictions and they may represent more realistic battery behaviors in complex simulation environments.
For future works, an EFB battery at different health and charge states will be tested on a test bench which can simulate high charge and discharge currents of an alternator under real driving conditions of a micro hybrid vehicle. The time domain results of the proposed model with transmission line element will be compared with those results.
